the oecd’s business statistics database and · pdf filethe oecd’s business...
TRANSCRIPT

THE OECD’S BUSINESS STATISTICS DATABASE AND PUBLICATION
OECD Structural Business Statistics Experts Meeting
OECD Headquarters, Paris, May 10-11, 2007
Nadim Ahmad, OECD
Introduction
1. This paper, which is largely for information, provides an overview of:
(i) The OECD’s business statistics database and plans for its continued expansion; and
(ii) The OECD’s plans for a new publication reflecting the content of the database and the role it can play in shaping entrepreneurship policy.
Background
2. At the last meeting of Structural Business Statistics Experts in November 2005 the OECD described its plans for a new publication on business statistics that tried to fulfil a number of roles. The main role of course was to provide a vehicle that reflected the wealth of statistics available on the OECD’s structural business statistics database. But the plans for the publication were to go further in new directions. One important area was to provide a description of how the statistics could be used, especially when compared to national accounts estimates, and to list the care needed in their interpretation, in particular the fact that the statistics reflected snap-shots of businesses at particular points in time and so were limited in a longitudinal sense. An extract from the publication describing these specific issues is included below for convenience. Delegates are asked whether they find this presentation useful and if improvements could be made for the forthcoming publication, in particular when considering the caveats that users should be alerted to with respect to longitudinal analyses.
Extract from “Structural and Demographic Business Statistics, 2006”
I.1. READER’S GUIDE - OVERVIEW
Three datasets combine to form the Structural and Demographic Business Statistics Database. The first provides information on a number of economic variables broken down by 4-digit International Standard of Industrial Classification Revision 3 (ISIC Rev. 3) industries and is referred to as the Structural Statistics on Industry and Services database (SSIS). The second provides the same industry level of information as the SSIS database but this is also broken down by size classes of businesses, and is referred to as the Business Statistics by Size Class database (BSC) database. In theory these two datasets are consistent and complementary. In practice however the datasets are considered separately because: the time series for SSIS data is typically longer; the coverage of variables in the SSIS database is more comprehensive than the BSC database; and, for some countries, the two datasets are not entirely
1

consistent, reflecting partly different information sources and allocation methods and partly the different times when the datasets were compiled. Moreover, as described in the country notes and in the examples that follow, for some countries it has been possible to make adjustments to the SSIS dataset to improve its internal consistency that cannot be replicated in the BSC database.
The third dataset within the SDBS database contains information of business birth, death and survival rates for many OECD countries and is referred to as the Business Demography database. This dataset is at its early stages of development and has not been compiled using the conventional system of questionnaires, such as those used in collecting SSIS and BSC information, and, so, considerable incomparability problems currently exist in this dataset. The dataset has however been included in the SDBS dataset at this early stage a) because there is considerable policy interest in this type of information and b) because it signals the intention of the OECD Statistics Directorate to collect information in this important policy area using more conventional methods with harmonised definitions for variables. As such the discussion that follows concentrates primarily on the use of the SSIS and BSC databases. A discussion of the BD database is provided as a separate section towards the end of this publication.
The SSIS and BSC databases provide, uniquely, comparable information on the following economic variables broken down by 4-digit ISIC Rev. 3 (where the coverage varies by country and database) and employment size classes in the case of the BSC database (1-9, 10-19, 20-49, 50-249, and 250+), for all OECD countries:
TUTT o Turnover or gross premiums written PROD o Production at producers’ prices and/or factor costs VALU/VAF o Value added at basic prices and/or factor costs GOPS o Gross operating surplus INGS o Total purchases of goods and services CSGS o Change in stocks of goods and services INEN o Purchases of energy products GITG o Gross investment in tangible goods GFLA o Gross investment in land GFBS o Gross investment in existing buildings and structures GFEQ o Gross investment in machinery and equipment SFCF o Sales of tangible investment goods EMPN/EMP o Employment, number of persons engaged and number of employees EMPF o Employment, number of females employees FTEE o Employment, number of employees in full time equivalent units EHOU o Hours worked by employees REMN/REM o Compensation of labour, all persons engaged and employees WASN/WAS o Wages and salaries, all persons engaged and employees ESUP o Other employers’ social contributions, employees ENTR/ESTB o Number of enterprises and/or establishments
As such, the primary advantage of these databases compared to other datasets is that they provide detailed
information on a wide range of economic variables at a very detailed industry level. The database therefore provides an ideal tool for users interested in (OECD country) international comparisons of the economic performance of industries at this detailed level. This is especially true where comparisons of business size classes are needed. For example the database provides the ability to compare the average size of enterprises and the distribution of activity by size class across countries. Other examples include: allowing users to test the extent of homogeneity of 4-digit industries within their 2-digit parents, an assumption often used in economic analyses that use higher level aggregations of industries, such as 2-digit groups; and providing the tool to accurately compare groupings of industries, such as the Information and Communications Technology (ICT) sector, whose internationally recognised definition1 includes parts (4-digit industries) of 2-digit industries.
1 The OECD definition of the ICT sector can be found at http://www.oecd.org/dataoecd/34/37/2771153.pdf. It includes a number of distinct 4-
digit industries and includes: 3130: Insulated wire cable; 3312: Instruments and appliances for measuring, checking, testing, navigating and other purposes except industrial process equipment; 3313: Industrial process equipment; 5150: Wholesale of machinery, equipment and
2

However, users should also be aware of some of the phenomena that need to be fully understood when using these datasets. Key amongst these concerns comparisons over time. The scope and coverage of source information used in the SSIS and BSC databases can vary over time, meaning that breaks in series often occur. Moreover, enterprises and establishments may change their industrial classification over time. Sometimes this will reflect the fact that the enterprise or establishment has changed activity completely but it may also reflect small year-on-year changes. To illustrate, an enterprise classified to ISIC 2811 in 2002 because 51% of it production was related to ISIC 2811 and only 49% to ISIC 2812 might find itself classified to ISIC 2812 in 2003 if the relative proportions of production shifted from 51:49 to 49:51. That is not to say that the classification change is incorrect, far from it, the change reflects the new economic reality. The point however is that these changes can occur and users need to recognise these possibilities in their analyses.
This primary aim of this section therefore is to provide a description of some of the issues that can affect analytical applications of the database, such as comparability and changes in concepts. Detailed descriptions of the sources and methods used in each country are provided at the end of the tables shown for each country in Part III. Detailed definitions of variable concepts are provided in Annex A.
Comparability of concepts and coverage across countries
Of particular importance in the context of analytical applications is international comparability. Every effort has been made to ensure that the variables presented are comparable across countries but on occasions this is not possible. Three areas, worthy of particular mention, where some issues of incomparability arise are:
• Value-added: The definition of value-added used in this publication is consistent with that used in the 1993 System of National Accounts (for a given price basis, factor costs or basic prices). However not all countries are able to provide estimates on this basis. Typically, for these countries, the estimates are based on production minus the intermediate consumption of goods and industrial services only. This differs from the SNA definition which excludes the intermediate consumption of all services.
• The coverage of businesses: For most countries the main sources of information used in the compilation of structural business statistics are economic censuses, business surveys and business registers. These typically cover establishments and/or enterprises above a certain size limit (usually based on employees or turnover above a certain level) but these thresholds vary across countries. This is of particular relevance in the context of business statistics by size class.
• The statistical unit used for businesses: Many measures are available for the statistical unit used to define businesses and these vary across countries. Two key measures prevail in this publication. The first is based on the enterprise and the second the establishment.
Comparability over time
Comparability of country data over time is also an important issue. For some countries the source data used to estimate the variables in this publication are not consistent over time and neither are the concepts nor the coverage of businesses.
For example, data may be based on survey information in one year and exhaustive census information in another, or the coverage of the same data source itself may change over time, for example a census or survey may include all establishments with more than 20 employees in one year and then all employing establishments thereafter. Where breaks in series do occur they are highlighted using a horizontal line and supplementary notes. One notable example of such a break concerns the data for ISIC sectors 60 to 74 in Germany for data from 2000 onwards. The data provided by Germany for 2000 and onwards is based on businesses with turnover above a certain level and is not consistent with the data in earlier years or with other industrial sectors, where all registered enterprises are covered. In earlier years the data on monetary variables, such as production and value added, is based on national accounts
supplies (part only, where possible); 6420: Telecommunications; 7123: Renting of office machinery and equipment; as well as the following 2-digit industries: 30: Office, accounting and computing machinery; 32 Manufacture of radio, television and communication equipment and apparatus; and 72: Computer and related activities.
3

sources and so include all registered and estimates of unregistered (those operating in the underground economy) enterprises. These estimates include imputations made by national accountants such as those for dwelling services provided to owner occupiers. The county notes for Germany provide more detailed information on these issues.
Changes in concepts can also complicate the comparability of data over time. It is not always obvious however where concepts change but, on occasions, especially for sectors, such as the distribution sector (wholesale and retail) where turnover and production can be especially affected by valuation changes in estimates of changes in stocks, for example, it is possible to identify possible these occurrences; especially when relationships with other variables are used as diagnostics. Wherever possible the OECD has tried to correct for inconsistencies related to changes in concepts using supplementary information but this is not always possible. In all cases the OECD estimates are highlighted in italics in this publication and the database.
For illustration, one such example is given below reflecting the ‘before’ and ‘after’ estimates of production and turnover for the sale, maintenance and repair of motor vehicles, retail sales of fuel and wholesale sectors (ISIC Rev 3, 50 and 51) in Denmark. The original estimates of production and turnover showed considerable volatility, not consistent with movements in other variables such as value-added, purchases of goods and services or employment variables. The relationship between turnover and value added plus purchases of goods and services is key in this respect. A priori one would expect these aggregates to be closely related in this industry, as is the case in other countries, where typically the ratio of turnover to value-added plus purchases of goods and services is close to 1. This was the case for Denmark in 1999 and 2001 but in other years the ratio moved significantly away from unity, as can be deduced from the chart below. This might occur if turnover estimates in these years inadvertently included VAT for example. The estimates in the OECD’s database correct for this movement by applying the average ratio observed in 1999 and 2001 at the 4-digit level to other years ; based on the observation that in other 4-digit sectors in Denmark and other countries the ratios are generally stable and nearly always close to 1. Production estimates have been similarly adjusted using relationships between turnover and production. These changes produce estimates that are much more consistent over time and closer to those observed in the national accounts, as shown later in this publication, which is consistent with the position seen for other variables such as employment and value-added.
ISIC Rev. 3, Sectors 50+51: Production and Turnover in Denmark 1999-2003
150000
350000
550000
750000
950000
1999
2000
2001
2002
2003
Mill
ions
of D
KK
Production_original Turnover_ originalTurnover_revised Production_revisedValue-added + purchases of goods and services
However it is not always possible to correct for inconsistent time series, whether the changes reflect changes in
coverage or concept, and, so, in some cases, to avoid confusion and to improve coherence, it has been decided to suppress the original country data, in affected years. For example estimates of value-added, purchases of goods and services and gross operating surplus in 2001 for Poland have all been suppressed because the estimates of value-added and gross operating surplus were significantly higher and purchases of goods and services significantly lower, in nearly all sectors, than in 2000 and 2002, and because in all years, except 2001, estimates of value-added were very close to their national accounts based equivalents at the industry sector level; as shown later in this publication. Other examples were data has been suppressed by the OECD are described in the country notes shown in Part III.
4

Users should also note that changes may occur for specific sectors only, reflecting the different data sources often used by statistical offices to measure activity in sectors as diverse as manufacturing, services and construction for example. This means that in some cases breaks in series occur in certain sectors only.
Time series analyses – Classification changes and consolidation
The points raised above also relate to time series applications but, fundamentally, users need to be aware that the database provides snapshots of enterprises or establishments at points in time. Both enterprises and establishments can change their industrial classification over time. For example, if enterprises in two different industrial sectors merge, the new entity may reappear in one single industrial sector only, even if the overall activities of the new entity are unchanged. Similar issues arise if establishments in different sectors merge or when other demographic events occur such as take-overs or break-ups for example.
Another related issue concerns intra-industry demographic events. Gross measures of activity such as turnover, production and intermediate consumption of goods and services within an enterprise may be recorded net of the enterprise’s intra-transactions or gross; depending on the country or enterprise’s practice or available accounting information. If, therefore, an enterprise breaks-up into two new enterprises but both new entities remain in the same industrial sector, gross production, turnover and intermediate consumption may rise, although, all other things equal, no changes will be seen in net measures such as value-added, operating surplus or labour and investment related variables. The same can occur where industries such as transport, telecommunications, electricity and gas distribution for example, become deregulated, particularly when an incumbent monopoly provider is compelled to allow other providers to use its infrastructure network to deliver services.
Analyses of time-series data related to business size classes are also of considerable policy interest and similar issues of time series consistency can arise when businesses move from one size class to another as they grow or contract.
Confidentialised data
Sometimes data is ‘confidentialised’ by statistical offices at a relatively aggregated (ISIC Rev 3, 2-digit) level. This can occur, for example, because a statistical office might desire to show all but one of the 4-digit groups within a 2-digit sector leading to the secondary suppression of the 2-digit figure to preserve anonymity in the confidentialised 4-digit entry (otherwise the confidentialised 4 digit cell can be determined). Additionally, because statistical offices will typically confidentialise industries according to the classification systems used in their countries and then use this information as the building blocks to arrive at ISIC estimates, it is often the case that the numbers of industries that are confidentialised are proportionally higher when shown in ISIC than when shown on a national basis. This reflects cautionary prudence on the parts of statistical institutions. The process of ensuring that data is not disclosive when shown in a national classification system can be burdensome, particularly when legal penalties arise for accidental disclosure; as is the case in some countries. Repeating the same process for ISIC based classifications does not merely double the burden however, since a comparison needs to be made between national classification systems and ISIC to ensure that disclosure cannot be obtained by unpicking the relationships between the two classification systems.
This is a non-trivial point but can be simplified by way of example. In country A’s classification system, the 2-digit industry A54 contains three 4-digit sub sectors: A5410, A5420 and A5430. Only one business exists in A5430 and, so, a decision is made to additionally suppress A5420 so that the two digit total for A54 can be shown. In ISIC, industry A5430 exists in sector ISIC 32, together with industries A5310, A5320 and A5330; none of which require suppression when presented in the national classification system. But, to preserve confidentiality of A5430, when presented in ISIC, one of A5310, A5320 and A5330 will need to be suppressed within the data presented using the national classification system or, more typically, the 2-digit ISIC sector is suppressed.
Users have however expressed some unhappiness about the unavailability of 2-digit information; particularly, where, as is often the case, the confidentialised entry is generally thought to amount to an insignificant proportion (often less than 1%) of the 2-digit total. In recognition of this, the OECD Statistics Directorate has attempted to estimate ‘confidentialised’ data at the 2-digit level, wherever possible, using supplementary information such as national accounts indicators and information on other related variables within the structural business database. The main reason for doing this is to improve the functionality of the database, providing users with the means to use 2-
5

digit data that can be added to totals. However, although every effort has been made to estimate these missing data, they, and the previously confidentialised 3 or 4-digit estimates, should be used cautiously. On many occasions, for example, data is confidentialised precisely because enterprises switch sectors and, so, where this occurs, volatility should be reflected but national accounts data based on establishments for example, and often used to estimate confidentialised cells, will not usually reflect this volatility.
A good example of the attempt to estimate data confidentialised at the 2-digit level concerns the size class data for the United States. Data for 2002 provided by the US Census Bureau contained a number of cells that were confidentialised at the ISIC 2-digit industry level. However, using detailed information (based on the North American Industrial Classification system) on industries made publicly available on the Census Bureau’s website, it could be established that the possible ranges for most ISIC 2-digit industries (broken down by size class) were not significant, since, often, the cause of confidentialisation was a 6-digit NAICS industry. As such these (small) 6 industries have been estimated by the OECD using statistical optimisation techniques subject to the constraints of 5, or often 4, digit NAICS parent industries. However, to avoid imbuing equal reliability on these estimates of 6-digit activity as to disclosive estimates, most 4 or 3-digit ISIC information based on them is not shown and remain confidentialised; if they were also confidentialised in the original data provided to the OECD. Indeed, for 2-digit industries, only those where a significant degree of confidence could be established are shown.
Coherence of Sources
Statistical offices use a variety of sources to produce business statistics data and this variety can often cause comparability problems. In many countries, for example, different sources of information are used to estimate activity in different sectors. For example, manufacturing may be based on a survey of businesses with one or more employees whereas service sectors may be based on administrative data for businesses above some turnover threshold say. But the different sources can also relate to variables. Investment information for example may be sourced from dedicated investment surveys that may not have the same coverage, sample size or stratification as used for other variables. Another important example relates to information on employment, which, for some countries is based on labour force and not business surveys, which can compromise labour productivity calculations. Differences in sources are highlighted in the country notes.
Comparisons of Business Statistics by Size Class and Structural Statistics for Industry and Services
The data requested for the BSC and SSIS databases are the same but differences exist in the coverage of variables and years. Typically, less information is available on the BSC database reflecting the greater data requirements involved in providing information at this level. Other differences exist however. For some countries the estimates of 4-digit totals for the same variable differ, reflecting the often different data sources used in the compilation of the BSC and SSIS datasets and also the coverage of these data sources. Timing is also a factor. For some countries, the returns were provided at different times and so more up-to-date estimates may be reflected in one dataset than another.
Comparisons with other data sets
As described in the introduction to this publication, the OECD produces many other statistics related to businesses and their activities. This information can be used to supplement the SDBS database but some care is needed in bringing these different datasets together. Although every effort is made using international standards, such as the International Standard Industrial Classification (ISIC Rev. 3), to harmonise the various datasets, users should note that some differences will arise. On occasions this will be because different concordance relationships are, necessarily, used for different indicators to bridge the gap between national classification systems and ISIC Rev. 3. Sometimes it may reflect differences in the way business units are defined or sampled and on others it may reflect differences in the way similar concepts are measured. One important dataset in the context of business statistics is national accounts data, where significant differences in concepts can occur as described more fully in the following section.
6

I.2. READER’S GUIDE - SDBS AND NATIONAL ACCOUNTS DATA
Economic Indicators provided by the structural and demographic business statistics database typically provide, more detailed information on industrial sectors than those provided by national accounts based statistics. This occurs because adjustments are made for the national accounts which, typically, can only be made at the more aggregated industry level. Four types of adjustments are commonly made.
• The first is driven by the need to achieve ‘exhaustiveness’ in the coverage of economic activity such that estimates of gross domestic product (GDP) cover all market and non-market activity. Examples of this activity are: imputed-rent for owner-occupied dwellings and the production of agricultural products used and consumed by households.
• The second reflects the coverage of structural business statistics. Typically these are sourced from census data, surveys or business registers. But the sources are not always exhaustive in their coverage of businesses, as they often only collect information on businesses above a certain size threshold (which are often based on turnover or employment criteria), and, so, micro and small enterprises or establishments are not always covered in structural business statistics. Additionally, structural business statistics generally only provide information that is based on business returns. In countries with large informal economies, businesses often under-declare their real turnover, profits and employment say, or may evade registration on administrative sources altogether. National accounts estimates try to adjust for this. Finally, some countries do not include all state owned, public corporations or non profit institutions, in their structural business statistics data.
• The third reflects conceptual adjustments made by national accountants, for example ‘tips’ paid to waitresses and waiters in a restaurant say are recorded as income received by the employing enterprise in the national accounts. Larger adjustments are made to correct estimates that do not conform to SNA definitions. For example, some countries do not include intermediate expenditures on services in their structural business statistics estimates of total intermediate consumption of goods and services which are, in these cases, instead included in value-added. Another source of difference in industry estimates of value-added reflects adjustments made for financial intermediation services indirectly measured (FISIM).2
• The fourth reflects more general adjustments that embody, in practice, all of the three above and are driven by the need to achieve coherence between business statistics and other sources of information that can be used in the compilation of GDP, such as household budget and labour force surveys.
National Accounts based estimates, therefore, provide for more comprehensive coverage of economic activities and should be used where the focus is on total GDP say, or the contribution of aggregated industries to economic activity, irrespective of the size of any particular establishment or enterprise. The SSIS and BSC databases should be used where the focus is on: a specific industrial sector or sectors; information on the sizes of businesses is important; and/or where the focus is on market activities.
These are not the only areas where differences between SDBS and national accounts based statistics occur however. Another important difference arises when the business units used to measure activity differ. Typically, in most OECD countries, estimates of activity by industry sector are based on the most homogeneous production unit available. The unit used varies across countries depending on the available data sources but most countries will try to measure activity for the national accounts using a local kind of activity unit, (used in many European countries), or the closely related establishment unit. Enterprise data, which is how most European countries present SDBS data, reflect a combination of one or more sub-enterprise units such as establishments or local kind of activity units, and, so, data presented by industries on this basis may be different (higher or lower) than comparable national accounts data because different groupings of sub-enterprise units will be used across industries. Indeed, even if the same groupings of sub-enterprise units exist in a given sector, differences can arise in gross measures, such as production and intermediate consumption, reflecting the differing degrees of consolidation that exist within these sub-enterprise groups. 2 FISIM reflects the value of services provided by financial intermediaries for which no explicit charges are made. For example, interest is
payable by borrowers and by lenders to financial intermediaries, and so, put simply, FISIM captures the value of the property income receivable by financial intermediaries less the interest payable by them.
7

The remainder of this section provides examples of significant differences between national accounts variables, sourced from the Structural Analysis (STAN) database and SDBS data. Annex C provides a comprehensive comparison of value-added, employment and production, for all countries, broken down by main industrial sector headings. Some further care is needed in interpretation however because: i) for EU countries, SDBS statistics use value-added at factor costs, whereas STAN data is based on value-added at basic prices, although, for most industries, this is not expected to make a significant difference; ii) the concordance relationships used to transform national industrial classification systems into ISIC Rev 3 for SDBS and national accounts statistics may differ for some countries; although at the aggregated industrial sector levels presented here these differences are reduced; and (iii) the statistical unit used for businesses is often different, for example manufacturing enterprises might include service sector subsidiaries. That all said, the differences between the two data sets mainly provide an indication of the overall impact of the first four points raised above: exhaustiveness, coverage, concepts and coherence in each of the industrial sectors presented.
One good example of this concerns the comparison of variables in the totality of sectors 60 to 74 (excluding 65-67). These typically show similar estimates of employment in the SDBS database and the national accounts but lower SDBS estimates of production and value-added than national accounts data. This, in large, part reflects imputed rent, (owner occupied dwellings services), which typically lies between 5 and 10% of total gross value-added in most OECD economies.
The main purpose of these comparisons therefore is to present not only an indication of the comparability of SDBS statistics with national accounts concepts and data but also the consistency of SDBS statistics over time. But, as always, some care is needed in interpretation. For example, SDBS statistics on employees that converge upwards to national accounts totals may imply that the coverage of SDBS business units has increased but it may also indicate, for example, an increase in registered employees consistent with corresponding decreases in the numbers of unregistered workers and businesses over time. Finally, users should note, that for some industries, SDBS information was not provided by countries even though equivalent information is available in their national accounts based statistics. In some cases therefore SDBS estimates have been based on their national accounts counterparts, which means that the two datasets will, by design, be comparable. Unless otherwise stated all SDBS statistics described in the charts below reflect the data as available on the SDBS database.
8

Examples of differences:
Differences in concepts 40%50%60%70%80%90%100%110%120%130%140%150%
Value-added Employment Production The chart on the right compares SDBS and STAN estimates of value-added, employment and production for manufacturing in the United States, showing, in each case, the former (SDBS) as a percentage of the latter (STAN). It shows that the estimates of SDBS employment and production are close to but always lower than the STAN estimates largely reflecting the fact that the source data for SDBS statistics is a survey/census of businesses with employees only, whereas the national accounts includes estimates of activity by business without employees. The key point however concerns the comparisons of value-added. The SDBS estimates of value-added for the United States include purchases of non industrial services, whereas the national accounts based estimates remove these items of expenditure from value-added. Other countries, such as Canada, are similarly affected. Readers should also note that, for EU countries, value-added is presented at factor costs in the most recent years whereas STAN data is presented, typically, at basic prices.
Sector 15-37
60
70
80
90
100
110
120
130
140
1997
1998
1999
2000
2001
2002
2003
%
Changes in concepts (over time) 40%50%60%70%80%90%100%110%120%130%140%150%
Value-added Employment Production The chart on the right compares SDBS and STAN estimates of value-added, employment and production in the wholesale and retail trade, repair of motor vehicles, motorcycles and personal and household goods sector (ISIC 50-52) in Belgium. SDBS estimates of employment, value-added and production are close to STAN from 1999 onwards but, in earlier years, estimates of production are considerably higher. This does not appear to reflect subsequent consolidation of industry sales. The nominal SDBS statistics for production show a significant fall in production that is not mirrored by a fall in turnover. In fact the data indicates that a change in valuation concept has occurred, with production estimates for years before 1999 using a valuation concept closer to turnover and for 1999 onwards a measure closer to the national accounts concept (which is the same as the measure recommended for SDBS statistics).
Sector 50-52
60
110
160
210
260
310
360
410
1996
1997
1998
1999
2000
2001
%
9

Differences in coverage and concepts 40%50%60%70%80%90%100%110%120%130%140%150%
Value-added Employment Production The first chart on the right compares SDBS and STAN estimates of value-added, employment and production in business services sectors 60-74, excluding 65-67 for France; although any country, except Germany, could have been chosen to illustrate this example of national accounts and SDBS differences. It shows that the estimates of SDBS employment are close to the STAN estimates but lower; again reflecting the coverage of businesses and, possibly adjustments for informal non-registered businesses. However, large differences arise where production and value-added are concerned. This largely reflects the imputation for services of owner occupied dwellings (imputed rent). In nearly all countries the relative ratios of SDBS to STAN are higher for production than for value-added because the ratio of value-added to production for imputed rent is typically much higher than in most other industries. Germany however is an exception. As described earlier in this publication the original data for 1999 was based on national accounts estimates, which included an imputation for owner occupied dwelling services. This is reflected in the chart on the right which shows that estimates of value-added and production are almost identical to national accounts estimates in 1999, but significantly less in more recent years, reflecting the fact that the data excludes exhaustiveness adjustments made for the national accounts and the size thresholds used by Germany in 2000 onwards that exclude businesses below a certain turnover (see country notes Part III). Indeed the effect of these thresholds can be seen in the German data for the number of enterprises in Part III which shows roughly half as many enterprises in 2000 compared to 1999 and by comparing the German ratios on the right with those in other countries (Annex C), since this comparison shows that Germany is at the lower end of the scale for OECD countries..
France
Sector 60-74 (excl. 65-67)
4050
607080
90100110
120130
199
519
9619
9719
9819
9920
0020
0120
0220
03
%
Germany
Sector 60-74 (excl. 65-67)
40
50
60
70
80
90
100
110
120
1999
2000
2001
2002
2003
%
10

Differences in consolidation 40%50%60%70%80%90%100%110%120%130%140%150%
Value-added Employment Production The chart on the right compares SDBS and STAN estimates of value-added, employment and production in the electricity gas and water supply sector (ISIC 40-41) in Belgium and provides an interesting example of how differences in consolidation between SDBS and STAN statistics affect comparability. In this case estimates of SDBS employment and value-added are almost identical to the STAN estimates but estimates of production are consistently higher. This is likely to reflect the netting out of intra-industry or intra enterprise flows for national accounts purposes.
Sector 40-41
50
100
150
200
250
300
350
199
519
9619
9719
9819
9920
0020
01
%
Differences through deregulation 40%50%60%70%80%90%100%110%120%130%140%150%
Value-added Employment Production The chart on the right compares SDBS and STAN estimates of value-added, employment and production in the electricity gas and water supply sector (ISIC 40-41) in Austria. It shows that the estimates of SDBS employment and value-added are close to the STAN estimates in all years but estimates of production show a spike in 2003. On first sight this might look implausible, however, this is a good example of the ‘gross’ nature of production. The peak, in fact, coincides with the time of deregulation in the Austrian electricity sector which opened up the market to third party providers. Third party suppliers often purchase their supplies from other generators before selling them on to final consumers; meaning that total industry gross turnover and production can rise significantly, although employment and value-added are only marginally affected.
Sector 40-41
40
60
80
100
120
140
160
199
519
9619
9719
9819
9920
0020
0120
0220
03
%
The STAN data, on the other hand, appear to remove these intra-industry sales; which, it should be said, is not a pre-requisite for the national accounts, as the measure of production used in the national accounts is also gross
11

Changes in the coverage of SDBS statistics over time 40%50%60%70%80%90%100%110%120%130%140%150%
Value-added Employment Production The chart on the right compares SDBS and STAN estimates of value-added, employment and production in the construction sector (ISIC 45) for Hungary; although any sector could have been taken to illustrate the point that follows. In this case estimates of SDBS employment, production and value-added are consistently lower but jump significantly in 2001. This jump reflects a change in the coverage of enterprises used for SDBS statistics. Prior to 2001 only enterprises with 5 or more persons employed are included in Hungarian statistics. From 2001 onwards all enterprises, irrespective of size, are included. Given the comprehensive coverage from 2001 onwards the continuing difference between SDBS and STAN statistics may reflect, at least partially, informal (underground) production and enterprises.
Sector 45
30
40
50
60
70
80
90
100
110
120
1998
1999
2000
2001
2002
2003
%
Internal coherence of variables 40%50%60%70%80%90%100%110%120%130%140%150%
Value-added Employment Production
Sector 60-74 (excl. 65-67)
60
70
80
90
100
110
120
130
140
199
519
9619
9719
9819
9920
0020
0120
0220
03
%
The chart on the right compares SDBS and STAN estimates of value-added, employment and production in business services sectors 60-74, excluding 65-67 in Spain. It shows significantly lower estimates of value-added and production as one would expect given the inclusion of imputed rent in STAN based data. However it also shows significantly higher estimates of employment. On its own this is not completely implausible, since such differences can be explained via differences in measures based on enterprises (SDBS) and establishments (STAN). For example, the enterprises in this sector might also include many subsidiary establishments in other sectors. This line of reasoning would suggest that the SDBS estimates of employment in other sectors would be correspondingly lower than those shown in STAN. It is difficult to be categorical about this because the SDBS database does not include data for all sectors of the economy. But, it is revealing that SDBS employment in 2003 is about 1.4 million higher than the corresponding STAN data for sectors 10-64 and 70-74; which reflects about 10% of total employment. Because the structural business statistics data compiled by Spain are based on unified surveys that collect information on all variables it is likely that the differences between STAN and SDBS data
reflect different sources for employment and monetary variables in the STAN database; which is not unusual as many countries source employment data from labour force surveys that target households rather than businesses - whereas SDBS data is usually sourced from businesses, via surveys, censuses and business registers, meaning that the internal consistency of variables is likely to be higher. Obviously this can present some problems where productivity analysis is concerned for example. This is not a new phenomenon however, see for example: Nadim Ahmad, François Lequiller, Pascal Marianna, Dirk Pilat, Paul Schreyer & Anita Wölfl, 2003, “Comparing Labour Productivity Growth in the OECD”
12

Business Demography Statistics
3. Another important objective of the 2006 publication was to announce the OECD’s expansion of its business statistics database into the longitudinal domain and the creation of its business demography database, a statistical area where cross-country comparability, particularly outside the EU, was an issue, and where the OECD had developed a framework describing how comparability could be improved (see Ahmad, 2006)
4. Since the publication the OECD has begun to collect business demography data on a more formal, yet voluntary, basis from Member countries. It’s still early days in this collection process but the signs are encouraging. It is important to note too that as part of this process the OECD took a long look at its on-going data collections in the field of structural business statistics and identified a number of variables that could be removed in order to minimise the increased burden the business demography questionnaire placed on NSOs. The table below describes the variables dropped by the OECD in its last data collection in the Structural Statistics on Industry and Services Questionnaire and its Business Statistics by Size Class Questionnaire
Table 1: Variables dropped in last data collection Variable
code Variable description Dropped from
BSC Dropped from
SSIS
VABP Value added at basic prices (except if value added at factor cost is unavailable)
Yes Yes
CSGS Change in stocks of goods and services Yes INEN Purchases of energy products (in value) Yes GFLA Investment in land Yes GFBS Investment in existing buildings and structures Yes GFEQ Investment in machinery and equipment Yes SFCF Sales of tangible investment goods Yes NITG Net investment in tangible goods (GITG minus SFCF) Yes
EMPU Employment, number of unpaid persons employed (i) Yes EMPF Employment, number of females employees Yes EHOU Hours worked by employees Yes ESUP Other employers' social contributions, employees Yes
(i) Not previously collected
5. Perhaps the biggest reduction in burden however concerns the metadata questionnaires that accompany the data questionnaires. These questionnaires which are available on request have been radically streamlined resulting in a significant decrease in response burdens.
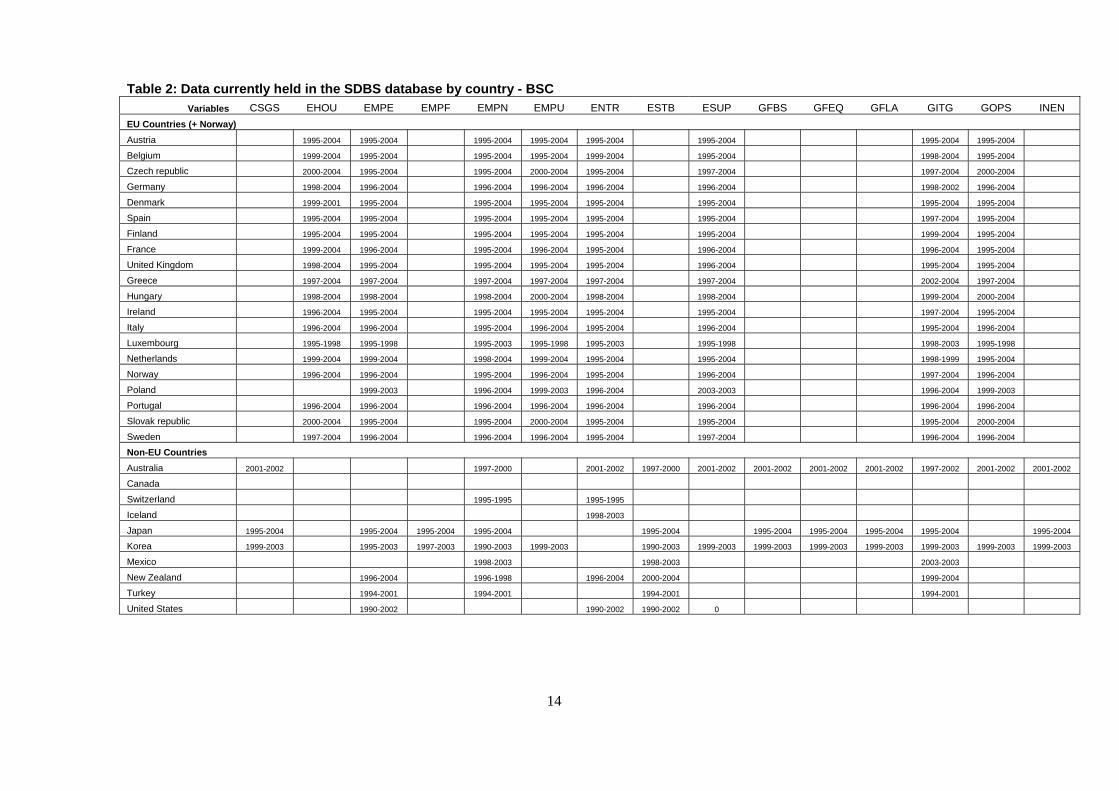
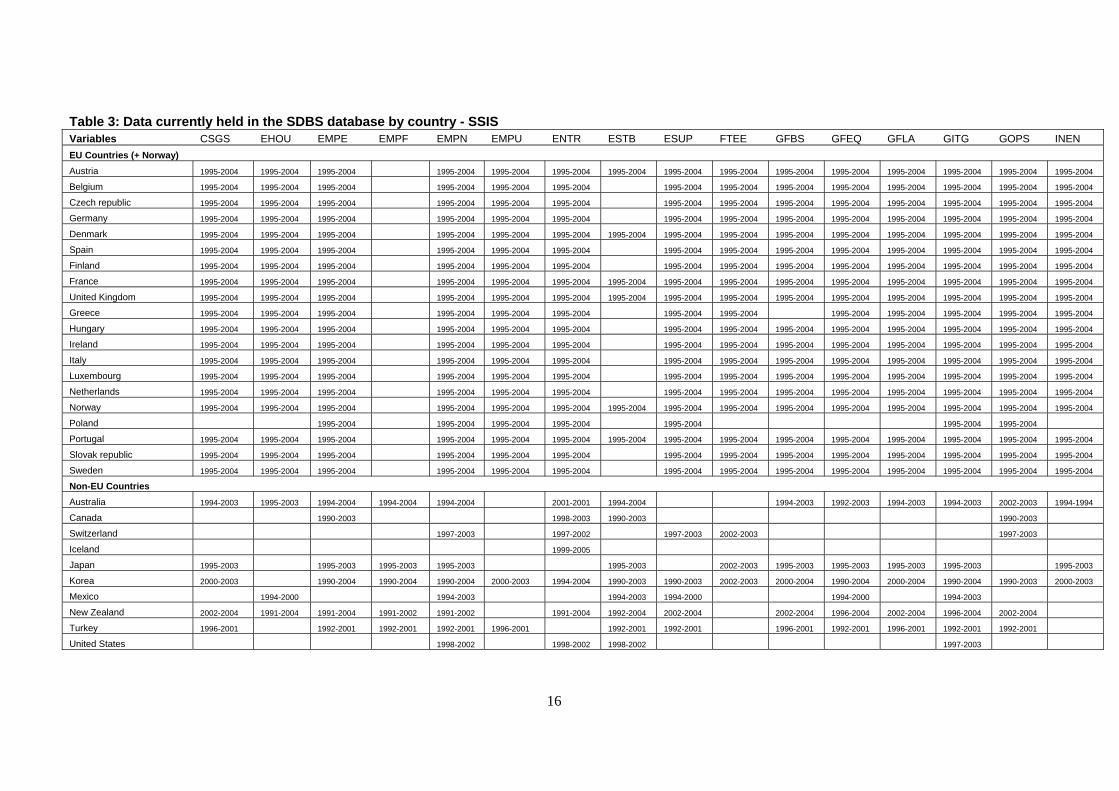
6. Tables 2, 3 and 4 below provide an overview of the data currently held on the OECD’s business statistics database by country and variable (for the Business Statistics by Size Class, BSC, Structural Statistic for Industry and Services, SSIS, and Business Demography database, BD)
13
14
Table 2: Data currently held in the SDBS database by country - BSC Variables CSGS EHOU EMPE EMPF EMPN EMPU ENTR ESTB ESUP GFBS GFEQ GFLA GITG GOPS INEN
EU Countries (+ Norway) Austria 1995-2004 1995-2004 1995-2004 1995-2004 1995-2004 1995-2004 1995-2004 1995-2004
Belgium 1999-2004 1995-2004 1995-2004 1995-2004 1999-2004 1995-2004 1998-2004 1995-2004
Czech republic 2000-2004 1995-2004 1995-2004 2000-2004 1995-2004 1997-2004 1997-2004 2000-2004
Germany 1998-2004 1996-2004 1996-2004 1996-2004 1996-2004 1996-2004 1998-2002 1996-2004
Denmark 1999-2001 1995-2004 1995-2004 1995-2004 1995-2004 1995-2004 1995-2004 1995-2004
Spain 1995-2004 1995-2004 1995-2004 1995-2004 1995-2004 1995-2004 1997-2004 1995-2004
Finland 1995-2004 1995-2004 1995-2004 1995-2004 1995-2004 1995-2004 1999-2004 1995-2004
France 1999-2004 1996-2004 1995-2004 1996-2004 1995-2004 1996-2004 1996-2004 1995-2004
United Kingdom 1998-2004 1995-2004 1995-2004 1995-2004 1995-2004 1996-2004 1995-2004 1995-2004
Greece 1997-2004 1997-2004 1997-2004 1997-2004 1997-2004 1997-2004 2002-2004 1997-2004
Hungary 1998-2004 1998-2004 1998-2004 2000-2004 1998-2004 1998-2004 1999-2004 2000-2004
Ireland 1996-2004 1995-2004 1995-2004 1995-2004 1995-2004 1995-2004 1997-2004 1995-2004
Italy 1996-2004 1996-2004 1995-2004 1996-2004 1995-2004 1996-2004 1995-2004 1996-2004
Luxembourg 1995-1998 1995-1998 1995-2003 1995-1998 1995-2003 1995-1998 1998-2003 1995-1998
Netherlands 1999-2004 1999-2004 1998-2004 1999-2004 1995-2004 1995-2004 1998-1999 1995-2004
Norway 1996-2004 1996-2004 1995-2004 1996-2004 1995-2004 1996-2004 1997-2004 1996-2004
Poland 1999-2003 1996-2004 1999-2003 1996-2004 2003-2003 1996-2004 1999-2003
Portugal 1996-2004 1996-2004 1996-2004 1996-2004 1996-2004 1996-2004 1996-2004 1996-2004
Slovak republic 2000-2004 1995-2004 1995-2004 2000-2004 1995-2004 1995-2004 1995-2004 2000-2004
Sweden 1997-2004 1996-2004 1996-2004 1996-2004 1995-2004 1997-2004 1996-2004 1996-2004
Non-EU Countries
Australia 2001-2002 1997-2000 2001-2002 1997-2000 2001-2002 2001-2002 2001-2002 2001-2002 1997-2002 2001-2002 2001-2002
Canada
Switzerland 1995-1995 1995-1995
Iceland 1998 -2003
Japan 1995-2004 1995-2004 1995-2004 1995-2004 1995-2004 1995-2004 1995-2004 1995-2004 1995-2004 1995-2004
Korea 1999-2003 1995-2003 1997-2003 1990-2003 1999-2003 1990-2003 1999-2003 1999-2003 1999-2003 1999-2003 1999-2003 1999-2003 1999-2003
Mexico 1998-2003 1998-2003 2003-2003
New Zealand 1996-2004 1996-1998 1996-2004 2000-2004 1999-2004
Turkey 1994-2001 1994-2001 1994-2001 1994-2001
United States 1990-2002 1990-2002 1990-2002 0

15
Table 2: Data currently held in the SDBS database by country – BSC (Continued) Variables INGS NITG PROD RDEM RDVA REME REMN SFCF TUTT VAFC VALU WASE WASN
EU Countries (+ Norway) Austria 1995-2004 1995-2004 1995-2004 1995-2004 1995-2004 1995-2004 1995-2004 1995-1999 1995-2004
Belgium 1995-2004 1995-2004 1995-2001 1995-2001 1995-2004 1995-2004 1995-2004 1999-2000 1995-2004
Czech republic 1997-2004 1997-2004 2000-2004 2000-2004 2000-2004 1995-2004 2000-2004 1995-2000 1995-2004
Germany 1996-2004 1996-2004 1999-2004 1999-2004 1996-2004 1996-2004 1996-2004 2002-2002 1996-2004
Denmark 1995-2004 1995-2004 1999-1999 1999-1999 1995-2004 1995-2004 1995-2004 1998-2001 1995-2004
Spain 1995-2004 1995-2004 1998-2001 1998-2001 1995-2004 1995-2004 1995-2004 1998-2001 1995-2004
Finland 1995-2004 1995-2004 1995-2004 1995-2004 1995-2004 1995-2004 1995-2004 2000-2003 1995-2004
France 1996-2004 1996-2004 1997-2004 1997-2004 1995-2004 1995-2004 1995-2004 2001-2002 1996-2004
United Kingdom 1996-2004 1996-2004 1996-2003 1996-2003 1995-2004 1996-2004 1995-2004 1996-2003 1996-2004
Greece 1997-2004 1997-2004 1997-2000 1997-2000 1997-2004 1997-2004 1997-2004 1999-1999 1997-2004
Hungary 1998-2004 1998-2004 1998-2004 1998-2004 2000-2004 1998-2004 1998-2004 1998-2004
Ireland 1995-2004 1995-2004 1995-2004 1995-2004 1995-2004 1995-2004
Italy 1996-2004 1996-2004 1997-1999 1997-1999 1996-2004 1995-2004 1995-2004 1996-2004
Luxembourg 1995-1998 1995-1998 1998-1998 1998-1998 1995-1998 1995-2003 1995-2003 1998-1998 1995-1998
Netherlands 1995-2004 1995-2004 1995-2004 1995-2004 1995-2004 1995-1999 1995-2004
Norway 1996-2004 1996-2004 2002-2004 2002-2004 1996-2004 1995-2004 1995-2004 1997-2004 1996-2004
Poland 1999-2003 1999-2003 1999-2003 1996-2004 1996-2004 2003-2003
Portugal 1996-2004 1996-2004 1996-2004 1996-2004 1996-2004 1996-2004 1996-2004 1996-2004 1996-2004
Slovak republic 1995-2004 1995-2004 1995-2004 2000-2004 2000-2004 1995-2004 1995-2004 1995-2004 1995-2004
Sweden 1996-2004 1996-2004 1997-2004 1997-2004 1996-2004 1995-2004 1995-2004 1997-2002 1997-2004
Non-EU Countries
Australia 2001-2002 2001-2002 2001-2002 2001-2002 2001-2002 1997-2002 1997-2002 1997-2000 2001-2002
Canada
Switzerland
Iceland
Japan 1995-2004 1996-2004 1995-2004
Korea 1999-2003 1990-2003 1999-2003 1997-2003 1997-2003 1990-2003 1995-2003
Mexico 2003-2003 2003-2003 2003-2003 2003-2003
New Zealand 1999-2004 1999-2004 1999-2004 1999-2004 1999-2004
Turkey 1994-2001 1994-2001 1994-2001 1994-2001 1999-2001
United States 1990-1997 1991-2002 0 1999-2002
16
Table 3: Data currently held in the SDBS database by country - SSIS Variables CSGS EHOU EMPE EMPF EMPN EMPU ENTR ESTB ESUP FTEE GFBS GFEQ GFLA GITG GOPS INEN EU Countries (+ Norway) Austria 1995-2004 1995-2004 1995-2004 1995-2004 1995-2004 1995-2004 1995-2004 1995-2004 1995-2004 1995-2004 1995-2004 1995-2004 1995-2004 1995-2004 1995-2004
Belgium 1995-2004 1995-2004 1995-2004 1995-2004 1995-2004 1995-2004 1995-2004 1995-2004 1995-2004 1995-2004 1995-2004 1995-2004 1995-2004 1995-2004
Czech republic 1995-2004 1995-2004 1995-2004 1995-2004 1995-2004 1995-2004 1995-2004 1995-2004 1995-2004 1995-2004 1995-2004 1995-2004 1995-2004 1995-2004
Germany 1995-2004 1995-2004 1995-2004 1995-2004 1995-2004 1995-2004 1995-2004 1995-2004 1995-2004 1995-2004 1995-2004 1995-2004 1995-2004 1995-2004
Denmark 1995-2004 1995-2004 1995-2004 1995-2004 1995-2004 1995-2004 1995-2004 1995-2004 1995-2004 1995-2004 1995-2004 1995-2004 1995-2004 1995-2004 1995-2004
Spain 1995-2004 1995-2004 1995-2004 1995-2004 1995-2004 1995-2004 1995-2004 1995-2004 1995-2004 1995-2004 1995-2004 1995-2004 1995-2004 1995-2004
Finland 1995-2004 1995-2004 1995-2004 1995-2004 1995-2004 1995-2004 1995-2004 1995-2004 1995-2004 1995-2004 1995-2004 1995-2004 1995-2004 1995-2004
France 1995-2004 1995-2004 1995-2004 1995-2004 1995-2004 1995-2004 1995-2004 1995-2004 1995-2004 1995-2004 1995-2004 1995-2004 1995-2004 1995-2004 1995-2004
United Kingdom 1995-2004 1995-2004 1995-2004 1995-2004 1995-2004 1995-2004 1995-2004 1995-2004 1995-2004 1995-2004 1995-2004 1995-2004 1995-2004 1995-2004 1995-2004
Greece 1995-2004 1995-2004 1995-2004 1995-2004 1995-2004 1995-2004 1995-2004 1995-2004 1995-2004 1995-2004 1995-2004 1995-2004 1995-2004
Hungary 1995-2004 1995-2004 1995-2004 1995-2004 1995-2004 1995-2004 1995-2004 1995-2004 1995-2004 1995-2004 1995-2004 1995-2004 1995-2004 1995-2004
Ireland 1995-2004 1995-2004 1995-2004 1995-2004 1995-2004 1995-2004 1995-2004 1995-2004 1995-2004 1995-2004 1995-2004 1995-2004 1995-2004 1995-2004
Italy 1995-2004 1995-2004 1995-2004 1995-2004 1995-2004 1995-2004 1995-2004 1995-2004 1995-2004 1995-2004 1995-2004 1995-2004 1995-2004 1995-2004
Luxembourg 1995-2004 1995-2004 1995-2004 1995-2004 1995-2004 1995-2004 1995-2004 1995-2004 1995-2004 1995-2004 1995-2004 1995-2004 1995-2004 1995-2004
Netherlands 1995-2004 1995-2004 1995-2004 1995-2004 1995-2004 1995-2004 1995-2004 1995-2004 1995-2004 1995-2004 1995-2004 1995-2004 1995-2004 1995-2004
Norway 1995-2004 1995-2004 1995-2004 1995-2004 1995-2004 1995-2004 1995-2004 1995-2004 1995-2004 1995-2004 1995-2004 1995-2004 1995-2004 1995-2004 1995-2004
Poland 1995-2004 1995-2004 1995-2004 1995-2004 1995-2004 1995-2004 1995-2004
Portugal 1995-2004 1995-2004 1995-2004 1995-2004 1995-2004 1995-2004 1995-2004 1995-2004 1995-2004 1995-2004 1995-2004 1995-2004 1995-2004 1995-2004 1995-2004
Slovak republic 1995-2004 1995-2004 1995-2004 1995-2004 1995-2004 1995-2004 1995-2004 1995-2004 1995-2004 1995-2004 1995-2004 1995-2004 1995-2004 1995-2004
Sweden 1995-2004 1995-2004 1995-2004 1995-2004 1995-2004 1995-2004 1995-2004 1995-2004 1995-2004 1995-2004 1995-2004 1995-2004 1995-2004 1995-2004
Non-EU Countries
Australia 1994-2003 1995-2003 1994-2004 1994-2004 1994-2004 2001-2001 1994-2004 1994-2003 1992-2003 1994-2003 1994-2003 2002-2003 1994-1994
Canada 1990-2003 1998-2003 1990-2003 1990-2003
Switzerland 1997-2003 1997-2002 1997-2003 2002-2003 1997-2003
Iceland 1999-2005
Japan 1995-2003 1995-2003 1995-2003 1995-2003 1995-2003 2002-2003 1995-2003 1995-2003 1995-2003 1995-2003 1995-2003
Korea 2000-2003 1990-2004 1990-2004 1990-2004 2000-2003 1994-2004 1990-2003 1990-2003 2002-2003 2000-2004 1990-2004 2000-2004 1990-2004 1990-2003 2000-2003
Mexico 1994-2000 1994-2003 1994-2003 1994-2000 1994-2000 1994-2003
New Zealand 2002-2004 1991-2004 1991-2004 1991-2002 1991-2002 1991-2004 1992-2004 2002-2004 2002-2004 1996-2004 2002-2004 1996-2004 2002-2004
Turkey 1996-2001 1992-2001 1992-2001 1992-2001 1996-2001 1992-2001 1992-2001 1996-2001 1992-2001 1996-2001 1992-2001 1992-2001
United States 1998-2002 1998-2002 1998-2002 1997-2003

17
Table 3: Data currently held in the SDBS database by country – Continued Variables INGS NITG PROD RDEM RDVA REME REMN SFCF TUTT VAFC VALU WASE WASN
EU Countries (+ Norway)
Austria 1995-2004 1995-2004 1995-2004 1995-2004 1995-2004 1995-2004 1995-2004 1995-2004 1995-2004 1995-2004 1995-2004
Belgium 1995-2004 1995-2004 1995-2004 1995-2004 1995-2004 1995-2004 1995-2004 1995-2004 1995-2004 1995-2004 1995-2004
Czech republic 1995-2004 1995-2004 1995-2004 1995-2004 1995-2004 1995-2004 1995-2004 1995-2004 1995-2004 1995-2004 1995-2004
Germany 1995-2004 1995-2004 1995-2004 1995-2004 1995-2004 1995-2004 1995-2004 1995-2004 1995-2004 1995-2004 1995-2004
Denmark 1995-2004 1995-2004 1995-2004 1995-2004 1995-2004 1995-2004 1995-2004 1995-2004 1995-2004 1995-2004 1995-2004
Spain 1995-2004 1995-2004 1995-2004 1995-2004 1995-2004 1995-2004 1995-2004 1995-2004 1995-2004 1995-2004 1995-2004
Finland 1995-2004 1995-2004 1995-2004 1995-2004 1995-2004 1995-2004 1995-2004 1995-2004 1995-2004 1995-2004 1995-2004
France 1995-2004 1995-2004 1995-2004 1995-2004 1995-2004 1995-2004 1995-2004 1995-2004 1995-2004 1995-2004 1995-2004
United Kingdom 1995-2004 1995-2004 1995-2004 1995-2004 1995-2004 1995-2004 1995-2004 1995-2004 1995-2004 1995-2004 1995-2004
Greece 1995-2004 1995-2004 1995-2004 1995-2004 1995-2004 1995-2004 1995-2004 1995-2004 1995-2004 1995-2004
Hungary 1995-2004 1995-2004 1995-2004 1995-2004 1995-2004 1995-2004 1995-2004 1995-2004 1995-2004 1995-2004 1995-2004
Ireland 1995-2004 1995-2004 1995-2004 1995-2004 1995-2004 1995-2004 1995-2004 1995-2004
Italy 1995-2004 1995-2004 1995-2004 1995-2004 1995-2004 1995-2004 1995-2004 1995-2004 1995-2004 1995-2004 1995-2004
Luxembourg 1995-2004 1995-2004 1995-2004 1995-2004 1995-2004 1995-2004 1995-2004 1995-2004 1995-2004 1995-2004 1995-2004
Netherlands 1995-2004 1995-2004 1995-2004 1995-2004 1995-2004 1995-2004 1995-2004 1995-2004 1995-2004
Norway 1995-2004 1995-2004 1995-2004 1995-2004 1995-2004 1995-2004 1995-2004 1995-2004 1995-2004 1995-2004 1995-2004
Poland 1995-2004 1995-2004 1995-2004 1995-2004 1995-2004 1995-2004 1995-2004 1995-2004
Portugal 1995-2004 1995-2004 1995-2004 1995-2004 1995-2004 1995-2004 1995-2004 1995-2004 1995-2004 1995-2004 1995-2004
Slovak republic 1995-2004 1995-2004 1995-2004 1995-2004 1995-2004 1995-2004 1995-2004 1995-2004 1995-2004 1995-2004 1995-2004
Sweden 1995-2004 1995-2004 1995-2004 1995-2004 1995-2004 1995-2004 1995-2004 1995-2004 1995-2004 1995-2004 1995-2004
Non-EU Countries
Australia 1994-2003 1995-2003 1994-2003 2002-2003 2002-2003 1994-2003 1994-2003 1994-2004
Canada 1990-2003 1990-2003 1990-2003
Switzerland 1997-2003 1997-2003 1997-2003 1997-2003 1997-2003 1997-2003 1997-2003
Iceland 1998-2005
Japan 1995-2003 1994-2004 1999-2003 1995-2003 1995-2003 1995-2003
Korea 2000-2003 1990-2004 1990-2003 2000-2004 1995-2004 1990-2004 1990-2003 2000-2004
Mexico 2003-2003 1994-2003 1994-2000 2003-2003 1994-2003 1994-2000
New Zealand 2002-2004 1996-2004 2002-2004 1996-2004 2002-2004 1996-2004 2002-2004 2002-2004
Turkey 1996-2001 1992-2001 1992-2001 1996-2001 1996-2001 1992-2001 1992-2001
United States 1997-2003 1997-2003 1997-2003 1998-2002

Table 4: Data currently held in the SDBS database by country - BD
Variables Birth rate Death rate 2 Year Survival rate
5 Year Survival rate
EU countries (+Norway) Austria 1995-2004 Belgium 1998-2000 1997-1999 Czech republic 2001-2003 2000-2002 2001 Germany 1995-2003 1995-2003 Denmark 1998-2001 1997-2000 Spain 1998-2003 1997-2003 1998-2001 1998 Finland 1998-2003 1997-2002 1998-2001 1998 France 2001-2004 1998 United Kingdom 1998-2003 1998-2003 1998-2001 1998 Greece Hungary 2000-2003 2000-2002 2000-2001 Ireland Italy 1998-2004 1997-2003 1998-2002 1998-1999 Luxembourg 1998-2003 1997-2002 1998-2001 1998 Netherlands 1999-2003 1998-2002 1999-2001 Norway 1998-2001 1997-2000 Poland 1998-2003 1998-2003 Portugal 1998-2003 1997-2002 1998, 2001 Slovak republic 2000-2003 2000-2003 2000-2001 Sweden 1998-2003 1997-2003 1998-2001 1998 Non-EU Countries Australia 2001-2003 2001-2003 2001 Canada Switzerland 2003 2003 Iceland 1999-2004
Japan 1996-1999,
2004 1996-1999,
2004 Korea Mexico New Zealand 2000-2004 2000-2004 Turkey United States 1995-2005 1995-2005 1995-2003 1995-2000
7. At the end of 2007 the OECD has also started to collect information on the following variables: Births of Enterprises based on a two-employee threshold; Contribution of Births to employment; Contribution of Deaths to employment; Number of High Growth Firms (with growth based on Employment); Number of Gazelles (with growth based on Employment); and the Hirschman-Herfindahl concentration index.
2007 Publication
8. The new publication, planned for later this year, will give these new (business demography) statistics a much higher profile, reflecting the considerable demand for this data, and the growing policy interest in entrepreneurship. But this is not the only area where changes are planned. Another important development reflects the organisational changes in the OECD that have seen the OECD business statistics unit merge with the OECD’s Entrepreneurship Indicators Project. As such, the publication will have a much stronger focus on entrepreneurship issues, which in any case is consistent with a higher profile for business demography statistics, including many new comparable indicators on entrepreneurship.
18

9. The OECD’s Entrepreneurship Indicators Steering Group has been working with a Eurostat Working Party to develop a list of indicators that measure entrepreneurship and are in themselves measurable and comparable. The list has not yet been finalised but a draft of the list is shown in the Box below for convenience, and will be discussed in more detail during Session II of this meeting. It’s too early to say how many of these indicators will be included in the publication but clearly the intention is to have as many as possible and delegates are asked to consider whether and by when they might be able to provide this information (for discussion in Session II).
Box 1: Inventory of Entrepreneurship Indicators
Box 1: Inventory of Entrepreneurship Indicators E-SHIP PERFORMANCE Rate of new firm start-ups Survival rate for three-year old businesses Survival rate for five-year old businesses Proportion of young firms - 3-year survival Proportion of young firms - 5-year survival Business churn (rates of the total dynamic of entry and exit) Net business population growth Business ownership rate among start-ups Business ownership in total enterprise population Export propensity of new and/or small firms E-SHIP IMPACT Employment in 3 (and/or 5)-year old firms Average firm size after 3 (and/or 5) years Rate of high-growth firms by employment Rate of young high-growth firms by employment: "gazelles" Rate of high-growth firms by turnover Value-added contribution by new firms Rate of self-employment Contribution of firms to productivity growth by size class Contribution of firms to productivity growth by their age E-SHIP DETERMINANTS Competition The competitive arena Competition and anti-trust laws Degree of Public ownership Degree of Public involvement in business operations Access to Technology infrastructure and support University/industry research collaboration Technological cooperation between firms Measures of technology transfer Communication Patent system R&D data Access to Finance Measures of access to debt financing Costs of debt financing by firm size and age Existence and nature of business angel financing Size and performance of Venture Capital markets
Access to Markets Access to the domestic markets Access to foreign markets Share in total country exports of young/new firms Comparative measures of export credits and insurance Supply of entrepreneurial spirit Socio-demographic and ethnical characteristics of entrepreneurs Education and experience of entrepreneurs Availability and quality of business and entrepreneurship education Availability and quality of public and private entrepreneurship support infrastructure Immigration and entrepreneurship Intrapreneurship possibilities Fiscal environment Personal income tax Capital taxes Business tax and fiscal incentives Wealth and bequest taxes Court-legal framework Tort Litigation Brand protection Regulatory framework Accounting systems Product market regulations Compliance burden Labor market regulations Insolvency rules, bankruptcy protection and restart possibilities Protection of investors and business interactions Exit possibilities for investors and founders Stock markets Other administrative burdens Entrepreneurship culture Risk attitudes in societies Attitudes towards entrepreneurs, business owners Desire for business ownership or self employment Macro-economic environment Other interesting indicators SME-indicators GDP development Productivity and competitiveness R&D and innovation spending Sustainability
10. But there are other areas where the OECD would like to see continued expansion described in the accompanying paper to this meeting in Session (IV) which describes potential areas for new statistics based on the same source data currently used in structural business statistics but which are composite indicators or describe the underlying distributions of structural business statistics.
19

11. Statistical offices for example could provide information on the distributions of each of the variables currently provided to the OECD, for example by providing simple medians, standard deviations, kurtosis coefficients etc in addition to the means that can already be derived, thus providing analysts with the means to better understand the nature of an industry’s heterogeneity. Going one step further statistical offices could begin to provide similar statistics relating to composite indicators, for example providing information relating to the distribution of labour productivity within a particular industry, thus allowing analysts to explore the frontiers of productivity3. In this sense statistical offices should be encouraged to provide ‘distribution information’ (standard deviation, kurtosis, median, and quartile information, bottom 25%, top 25%, 95% confidence intervals) relating to all of the variables described above and the following sets of indicators for example:
Labour productivity: (turnover, value-added, production) /employment (head count and FTE, hours worked) by 4 digit SIC and size class.
Labour productivity growth – (where SBS data can be linked longitudinally)
Social contributions as per cent of compensation of employees
Labour-capital ratios
12. The key question, of course, is, whether this is feasible, from a resource perspective.
Data issues
13. With regards to the data there remain some issues relating to the metadata for each country as described in the publication. NSOs have already been asked to confirm that these notes accurately reflect the data by way of the OECD meta-data Questionnaire but Delegates are also encouraged to review these notes.
14. One big challenge on the data front concern the on-going attempt to improve the harmonisation and comparability of statistics by size class, where last year a set of 5 more comparable size classes were constructed to facilitate comparisons. Another concerns the internal consistency of variables for a given country, for example, and in particular, monetary variables and employment variables, where different sources are often used causing problems when different variables are combined (in this example productivity analyses would be affected.)
Meeting User-Needs
15. Clearly the 2007 publication will have an entrepreneurship focus but that is not to say that other important policy areas dependent on business statistics need necessarily be crowded out. In this sense Delegates are invited to consider areas that are of policy relevance in their own countries, and where business statistics have an important role to play, and that could warrant special sections in the forthcoming section (to be discussed in Session III).
Where is the Data?
16. The three datasets of the SDBS database can be accessed and downloaded through three modes, each mode being related to the level of detail requested:.
OECD.Stat, OECD's new online statistical data warehouse at http://dotstat/wbos/. OECD.Stat is a browser that allows selections, visualisations and downloads of data. The Structural and
3 Indeed just such an approach has been undertaken by academics, see for example Bartelsman, Haskel and Martin, 2006, “Distance to Which Frontier?”
20

Business Demography Statistics (SDBS) database is located under the theme ‘Industry and Services’. The datasets are indicated by a red triangle, when you double-click on the name of the dataset, a default query is launched and a table will appear. The default query (in the ‘Current Query’ box) can be customized by changing the selections for each dimension. Two datasets are available:
- Business Demography Indicators (BDI) - Structural Business Statistics (SBS) that covers both Structural Statistics on Industry and
Services (SSIS) data and Business Statistics by Size Class (BSC) data. You can choose the specific dataset by selecting SSIS and/or BSC in the dimension ‘Source’ of the query.
OLIS Statistics Data Files at http://intradomino.oecd.org/olis/OECDDATA.NSF is a free access service for OECD’s country delegates and other officials in national administrations and international organisations/agencies. SDBS data are available by country in a pre-defined excel table format. You can access the SDBS data in three ways: by theme (select ‘Industry’), or by name (click Next until ‘SDBS’ appears on the list), or by directorate (select ‘STD’).
SourceOECD at http://www.sourceoecd.org, the OECD's Online Library of Statistical Databases, Books and Periodicals. The SDBS publication (Complete Edition - ISBN 9264025685) is easily accessible with the “search for” wizard (e.g. search for “SDBS”).
SDBS data sources
Format available
OLIS - data by country, in excel pre-defined format (questionnaire format), rolling updates
- B20/20 IVT files by dataset, yearly updates
OECD.Stat data selection through a query, result downloadable in Excel format, rolling updates
SourceOECD data in synthetic tables (2 digits ISIC rev.3 activity sectors) in the paper publication
21