the new industrial organization and small...
TRANSCRIPT

THE NEW INDUSTRIAL ORGANIZATION AND SMALL BUSINESS
John E. Kwoka, Jr.George Washington University
Lawrence J. WhiteStern School of Business
New York University
Paper Presented at the Conference onResearch Issues in Industrial Organization and Small Business
Office of AdvocacySmall Business Administration
Washington, DCJanuary 21, 2000
Draft: March 1, 2000
Comments welcomed
Abstract
The small business sector is an important part of the American economic landscape, in bothabsolute and relative terms. Despite its absolute growth, however, the sector accounts for adiminishing share of private sector activity. But its importance, and changes in importance, varyacross industrial sectors of the economy.
Drawing on the theoretical and empirical insights developed in recent books by JohnSutton, we suggest that the presence or absence of endogenous strategic behaviors of the largerfirms with respect to advertising, promotion, research and development, and other sunk costexpenditures may well play an important role in explaining the differing levels of small businessimportance, both cross-sectionally and over time. We conclude the paper with suggestions forresearch directions that could shed further light on these ideas.

THE NEW INDUSTRIAL ORGANIZATION AND SMALL BUSINESS*
John E. Kwoka, Jr.George Washington University
Lawrence J. WhiteStern School of Business
New York University
* We would like to thank Brian Headd and Alicia Robb for their assistance in providing andexplaining the SBA data and F.M. Scherer for his valuable comments on an earlier draft.
I. INTRODUCTION
When asked why he robbed banks, Willie Sutton was reputed to have explained, "Because
that’s where the money is." If asked why they study large profit-making enterprises, most industrial
organization economists would probably answer, "Because that’s where the interesting questions
are." (Some might give Willie Sutton’s response as well.) But while large profit-making
enterprises clearly raise interesting and important questions, so do nonprofit organizations, public
enterprises, and small businesses. This paper focuses on the role and importance of small business,
and on the economic research issues that they raise. We are particularly interested in the
implications of the so-called "new industrial organization" for small business.
This paper begins with an analysis of the importance of small business in the U.S. economy.
As the analysis makes clear, small business constitutes a major sector in the economy, but equally
importantly, it is of differential importance in different industries and over time. One concern
highlighted by this review is the number of industries where the role of small business has
diminished over time, raising a question as to whether this is the result of market forces or of less
benign factors. That question is addressed is the second part of this paper. There we discuss an
important framework from the new industrial organization that provides one explanation as to how

2
small business may be systematically disadvantaged by strategic behavior undertaken by larger
companies. We will then show how this framework can help explain small businesses’ differential
success among industries and indicate what further research would help clarify the mechanism and
its policy implications.
II. THE POSITION OF SMALL BUSINESS IN THE U.S. ECONOMY
In this section we describe and discuss the recent (1988-1996) aggregate absolute and
relative position of the small business sector in the U.S. economy. As our discussion at the end of
this section indicates, these data are consistent with earlier findings.
Our definition of small business encompasses firms that have either fewer than 100
employees or fewer than 500 employees. Both are standard benchmarks,1 although an enterprise
with 499 employees would strike many observers as "small" only in a comparative sense.2
Our measure of the position of small business is the aggregate employment in those firms.3
1 See, for example, Acs and Audretsch (1990). 2 After all, if the labor cost per employee were $50,000 and employee value added were 50% ofthe firm’s revenues, a 499 employee firm would have about $50 million in revenues. 3 In principle, the value added in enterprises would be a better measure of their economicimportance; in practice these data are not available. Two other potential measures, which areavailable -- the number of firms and the number of establishments -- are less indicative of theabsolute and relative importance of a sector. A final potential measure is aggregate payroll, whichis available (and which, of course, is a component of value added). Payroll data are less evocativeof relative importance, however, than is employment. Accordingly, we will focus on employment. It is worth noting, however, that the payroll data show a similar pattern to that which we report foremployment -- i.e., an absolute increase but relative decrease for the small business sector over the1988-1996 period.

3
The employment data come from the Small Business Administration’s Office of Advocacy.4 The
data pertain to "private employer firms," which encompass private-sector enterprises that have
employees. The data exclude the self-employed; farms; railroads; the U.S. Postal Service;
households (e.g., as employers of domestic workers); and large pension, health, and welfare funds.
The data do, however, include enterprises in the non-profit sector.5
As can be seen in Table 1, the aggregate employment in small businesses, under both
definitions, increased over the years 1988-1996.6 For the under-100 category, the percentage
increase over these years was 9.6%; for the under-500 category, the increase was 11.0%. In all
years except 1991 (a recession year), the annual change in both categories was positive.
The overall private sector was growing during these years (except for 1991) as well,
however. As the last column of Table 1 indicates, overall private sector employment by these
"employer firms" rose by 16.3% during the 1988-1996. Thus, in relative terms, the small business
sector lost ground. Further, it is worth noting that this loss of ground occurred during a period that
(with the exception of 1990-1991) encompassed strong economic growth for the U.S. economy.
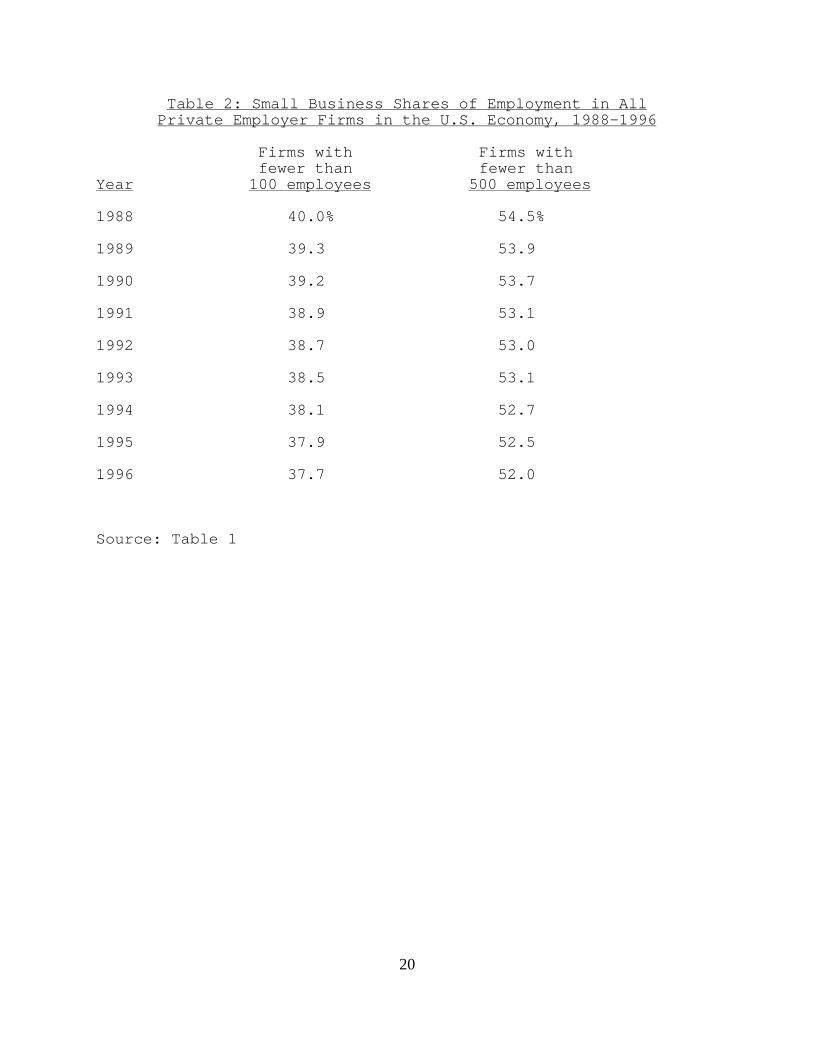
This loss of relative position is revealed dramatically in Table 2. Regardless of the category
of small business that is used, the relative importance of the small business sector declined steadily
4 The data are posted on the Office of Advocacy’s Website. The sources of the data are filescompiled by the Bureau of the Census. 5 For further descriptions of the data, see Armington (1998) and Robb (1999, 2000a, 2000b). 6 It is important to note that these data constitute a contemporaneous "snapshot" of employmentin firms of each size category in each year. By contrast, other estimates of the importance of smallbusiness -- especially those that emphasize job growth -- sometimes trace the subsequentemployment totals for firms that were initially (as of a base year) in a small business size category. See, for example, U.S.SBA (1999).

4
through the 1988-1996 years. For both categories the rate of decline has been almost one
percentage point for every three years of changes.
This relative decline can be explored in somewhat greater depth by examining the
employment data for broad (one-digit) sectors of the U.S. economy. In Table 3 we present the
small business shares for 1988 and 1996 for the broad sectors. For the first five sectors shown in
the table, the relative positions of small business within the sectors did not change substantially
over the 1988-1996 period; in some instances, the relative position of small business even
increased. For the remaining four classifiable sectors, however, the relative decline of small
business was substantial. The relative decline of small business in the services sector was
especially sizable.
These sector-specific patterns raise the following question with respect to the pattern of
relative decline of small business that is reported in Table 2: To what extent was the pattern of
decline in the aggregate position of small business influenced by these sectoral changes and to what
extent was it influenced by the changing relative importance of the various sectors (e.g., the decline
in manufacturing and the rise in services)?
To address this question, we first report the broad sectoral employment percentages for
1988 and 1996 in Table 4. As can be seen, the services sector experienced a large increase in
relative importance over these years. All but one of the other classifiable sectors experienced
declines in relative importance; the decline in the importance of the manufacturing sector was the
most sizable.
The changes in the manufacturing and services sectors illustrate the potential influence that

5
changes in sectoral importance could play in determining the overall pattern of the relative decline
of small business. Manufacturing was a sector in which small business was relatively less
important in 1988 (only 21.3% of employment in that sector was in firms with less than 100
employees), but manufacturing experienced a decline in relative importance over 1988-1996. By
contrast, services was a sector in which small business was relatively more important in 1988
(44.7% of employment in that sector was in firms with less than 100 employees), and services
experienced a sharp increase in relative importance over 1988-1996. These changes in weights,
with the rising importance of services, could offset declines within sectors.
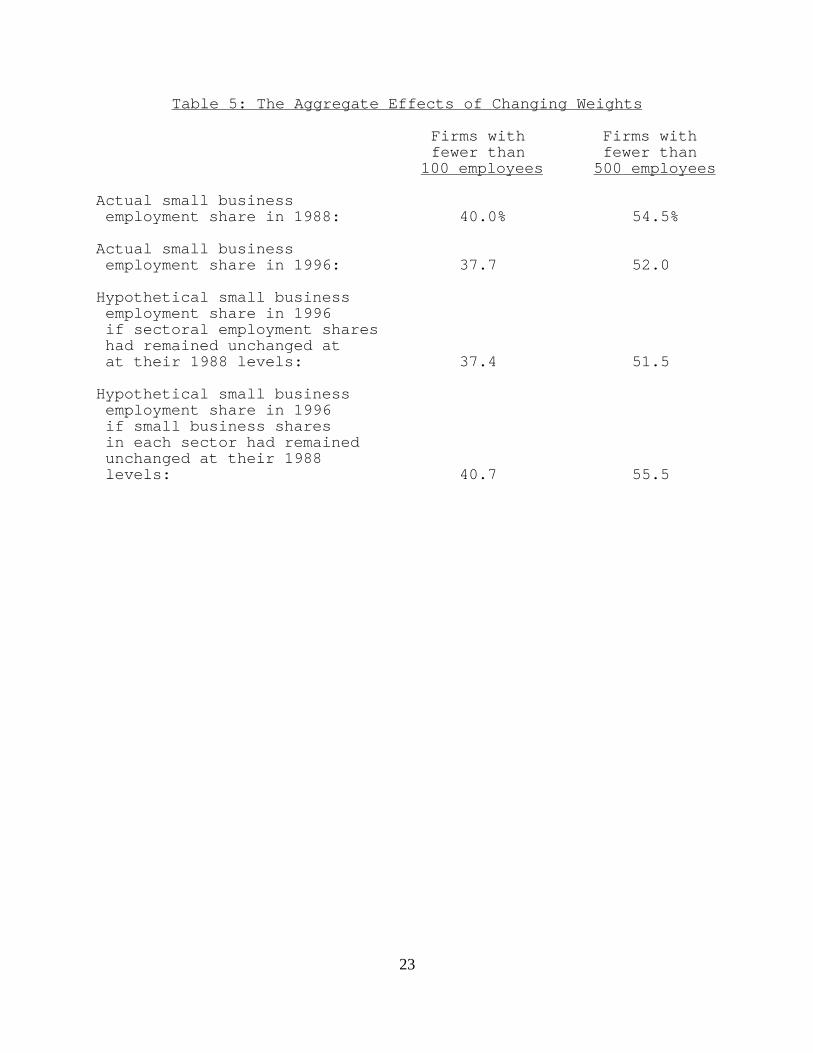
In Table 5 we present the results of calculations that bring out these roles of the changing
relative importances of small businesses within sectors and the changing relative importances of the
sectors themselves. In the first two rows of Table 5 we reproduce the aggregate percentage figures
from Table 2 for 1988 and 1996. In the third row we present the computational result of holding
the relative employment shares (weights) of the sectors constant at their 1988 levels and allowing
only the relative importance of small business within each sector to reflect their 1996 values. As
can be seen, if sectoral employment weights had remained unchanged, the aggregate small business
percentage share would have been even lower in 1996 than it actually was. The changes in the
employment weights (especially the increase in the relative importance of the services sector)
clearly did offset the more severe declines in the small business shares that were occurring within
some sectors.
In the fourth row of Table 5 we present a somewhat similar computational result, in which
we held the small business shares within each sector constant at their 1988 values and allowed only

6
the relative employment importance of the sectors to reflect their 1996 values. As can be seen, if
the small business shares within each sector had remained constant, the changes in the employment
shares would have caused the aggregate small business percentage to rise from its 1988 levels.
Again, the powerful role of the services sector is primarily responsible for this result.
Thus, the actual changes in the relative role of small business in the overall economy were
indeed the result of the interplay between the changes in relative positions of small business within
the individual sectors and the changes in the relative importances of the sectors themselves.
The patterns that we have described in this study -- absolute increases but relative decreases
for the small business sector, with the relative decreases influenced by changes in sectoral
employment weights -- are consistent with the patterns reported in an earlier study by one of the
authors (White 1981, 1984) for the years 1958-1977. The relative decline of the small business
sector that we have found for 1988-1996 thus appears to be a continuation of a longer-term trend.
III. SUNK COSTS AND SMALL BUSINESS
As the above review makes clear, small business is of considerable importance in the U.S.
economy overall, but there is enormous diversity in its prevalence across sectors, and there have
been substantial changes in its importance in some industries over time. The traditional explanation
for this diversity and change relies on exogenous cost considerations, specifically, on the interaction
of scale economies and demand factors.7 We shall show why that explanation leaves much to be
desired and introduce a different framework from the new industrial organization. This alternative

7
view focuses on the endogenous, strategic actions on the part of leading firms that alter the
competitive process in their favor and to the disadvantage of smaller businesses.
The traditional view of small versus large business is straightforward: Scale economies in
an industry can be described by a declining-and-then-flattening long-run average cost curve such as
that in Figure 1. The smallest output at which cost is minimized is the so-called "minimum
efficient scale" (MES). No firm needs to be larger than this to achieve all cost efficiencies. Thus, if
one knows the "size of the market" -– roughly, the output where the demand curve intersects the
long-run average cost curve -– then the "necessary" degree of market concentration (i.e., the
minimum level of market concentration that is consistent with all firms' being at MES) can be
determined. One divides that market size S by the minimum efficient scale m to obtain the number
of efficient-size firms that fit into the industry, N:
N = S/m (1)
This framework has several straightforward implications. Markets that are relatively large,
with demand curves like D1, allow numerous efficient-size firms and have correspondingly low
concentration. Smaller markets like D2 result in higher concentration, but market growth over time
should result in deconcentration as rightward shifts of demand overtake scale considerations. On
the other hand, if scale economies in an industry increase over time, so should concentration, other
things equal. Finally, it should be observed that firms exceeding minimum efficient scale must
have achieved such size for reasons other than scale economies.
This model of market concentration dates back to Bain (1956) and has been relied upon in
7 For example, see White (1982) and Acs and Audretsch (1990, ch. 4).

8
most subsequent research. While it provides important insights into the broad contours of industry
structure, this model ultimately does not do a very good job at explaining the finer details of the
structure of many industries. In their benchmark review of this literature, Scherer and Ross (1990,
p. 114), for example, conclude that "least-cost plant sizes tend to be quite small relative to the
national market -– too small to warrant [the] high levels of concentration" that actually occur. Even
after allowing for regional markets for some industries and for multiple plants where those confer
additional economies, their conclusion persists: In U.S. industry generally, concentration is greater,
leading firms are larger, and smaller firms are less numerous than would be implied by the
relationship of scale economies and market size.
Consider the often-studied brewing industry: In 1947 the industry was composed of over
400 companies and had a four-firm concentration ratio of just 21 percent. Over the next 35-40
years, while industry sales (in physical quantities and in constant dollars) more than doubled, the
number of companies declined by about 85 percent, driving four-firm concentration up to 87
percent. Thus, instead of market growth's resulting in a reduction in concentration, it was
accompanied by the largest concentration increase of any major industry over this period of time.
True, the underlying technology of the industry caused some increase in minimum efficient scale.
But this can account for at most a four-fold increase in size (Scherer 1996, pp. 405-406), whereas
the average size of the top four firms has gone from $435 million to $3.66 billion (in 1992 dollars) -
– a nearly nine-fold increase.
Such empirical anomalies have been a source of interest to industrial organization for a long
time, but until recently there has been no comprehensive, compelling, and testable explanation for

9
them. That awaited the advent of the new industrial organization over the past fifteen years. The
new I.O. has two manifestations. On the one hand, it models individual oligopoly firms using game
theory and a dynamic framework, with a view to an improved understanding of how individual
firms develop and exploit their unique market positions. This is in contrast to traditional theory,
which focuses on how oligopolists collectively achieve cooperative outcomes and maintain above-
competitive profits for all. The second characteristic of the new I.O. is its emphasis on careful
empirical estimation of theoretical predictions and underlying phenomena rather than the more
casual empiricism that often characterized the older tradition. Of course, in order to undertake
estimation based on the new I.O., that theory must yield testable implications, and data must be
available for measuring such novel concepts as sunk costs.
The new industrial organization consists of a diverse set of models and evidence, and by no
means do all of them satisfy these criteria. One example that does this –- and that forms the basis
for analysis of the key questions posed in this paper -- is the work of John Sutton (no known
relation to Willie). Sutton (1991, 1998) integrates some observations from traditional theory with
key elements of the new I.O. into a testable model of industry structure and evolution. The model
explains a great deal of the variation in firm sizes and in the different fates of small versus large
businesses in various types of industries.8
The last phrase is key, since Sutton's theory carefully distinguishes between different types
of industries in terms of the forces that govern their structure and evolution. Specifically, Sutton
(1991) shows that the simple model of equation (1) above is approximately correct only for an

10
industry characterized by exogenous sunk costs. Sunk costs are those that cannot be recovered
when production ceases. These would be illustrated by capital investment that has no use outside
the industry in question and hence is lost upon exit. Exogenous sunk costs are those that are
determined by the underlying production technology in the industry. These are precisely the
assumptions implicit in the discussion underlying equation (1), and Sutton concurs that in this case
a larger market is generally associated with lower concentration. This proposition is illustrated by
the line in Figure 2, which shows the declining relationship between market concentration and a
variable representing the ratio of market size divided by minimum efficient scale (as a proxy for
sunk costs).9
Sutton adds two refinements to this proposition. First, he notes that the actual relationship
between seller concentration and market size also depends upon the strength of price competition in
the industry. When such competition is stronger, fewer new competitors are attracted by market
growth since the profit expectations for entrants are low.10 Hence, the line in Figure 2 describes a
lower bound on the relationship, rather than the exact estimate for all such industries. Second,
8 Major reviews of Sutton (1991) are provided by Bresnahan (1992) and Schmalensee (1992). 9 See Sutton (1991, chs. 4 and 5) for further discussion of the development of these estimates. 10 As an illustration of this apparently counter-intuitive proposition, consider an industry thatproduces homogeneous goods and in which there are no diseconomies of large-scale production. Ifcompetition in this industry is characterized by "tough" (i.e.,"Bertrand") rivalry -- i.e., each sellerignores the price reactions of others when it contemplates the setting of its own prices -- then as fewas two firms will produce a zero (economic) profit equilibrium, regardless of the size of theindustry. The prospective profit opportunities for entrants will generally appear dismal, entrantswill be unlikely to enter, and seller concentration will remain high. As competitive conjecturesamong the incumbent firms "soften," a larger number of firms will be required to achieve a zero-profit equilibrium (or a limit-price equilibrium with positive profits for incumbents), and sellerconcentration will be lower.

11
Sutton distinguishes homogenous products industries from those characterized by product
differentiation. Figure 2 holds (as a lower bound) for the former, whereas a differentiated products
industry will lie above that bound to a degree that depends upon the extent of differentiation.
Sutton finds good evidence that these considerations apply to a number of industries.
Figure 2 reproduces his scatter diagram for six homogeneous goods industries in six countries,
showing that concentration does indeed persistently decline as the size/sunk cost variable grows,
with the solid line denoting the lower bound.
If this were all that there was to Sutton’s theory, it would represent at most a modest
extension of Bain’s theory of industry structure. But there is another class of industries that Sutton
identifies and analyzes. The scatterplot of seller concentration versus market size for these other
industries is depicted in Figure 3, and for these industries there is no tendency for market
concentration to decline regardless of how large the industry grows. Firm sizes increase in tandem
with market growth, smaller firms do not thrive, and high concentration persists. Which are these
industries, and how does this occur?
The crucial element of this facet of Sutton’s theory is endogenous sunk costs -- that is, sunk
costs not determined by the underlying technology but rather by the strategic decisions of the
leading firm (or firms) in the industry to make such an investment. The necessary characteristic of
this investment is that it increases buyers’ demand for the firm’s product. Other firms that do not
follow will lose customers and profits. But following entails higher fixed and sunk costs, giving
rise to a larger necessary scale of operation and hence maintaining and even elevating the position
of large leading firms, despite growth of the market. To extend our previous example of the

12
brewing industry, the discretionary sunk expenditure would be advertising. In other industries its
role might be played by R&D or product development costs.
Sutton shows that for industries that conform to these not-overly-stringent assumptions,
there is a lower bound on concentration regardless of market size: That is, the market will never
converge to a fragmented state regardless of how large the market might become so long as further
sunk expenditures continue to increase demand. The lower bound is higher as consumers are more
attracted by the advertised product, but any demand shift will prevent deconcentration. The
scatterplot in Figure 3 illustrates this non-convergence for fourteen advertising-intensive industries
in six countries analyzed by Sutton. His regression analysis on the underlying data confirms that
market size is a statistically insignificant explanator of concentration for these industries, although
market size is highly significant in explaining concentration for the relatively unadvertised products
in Figure 2.
In his second book, Sutton (1998) generalizes his earlier analysis by examining industries
that are composed of several different groups or segments. Now couched in terms of R&D, this
model focuses on a measure of the degree to which a firm that is spending more than its rivals on
R&D thereby earns high returns. That, in turn, is a function of economies of scope among product
groups as well as a parameter relating R&D to product quality and consumer willingness to pay.
Sutton now demonstrates that for industries with low R&D/sales ratios, once again the lower bound
of the relationship of concentration to market size is effectively zero, but where R&D (or
advertising) intensity is greater, the lower bound of this relationship is an increasing function of the
degree of homogeneity among product groups.

13
Sutton’s theoretical approach, embodied in both books, provides a novel explanation for the
failure of certain industries to become more fragmented as they grow. At the same time it suggests
how fragmented industries can be transformed into highly concentrated ones, and how smaller
businesses will lose ground. By initiating demand-shifting expenditures, large firms force smaller
businesses to choose between the loss of customers and a heightened cost disadvantage (if the
smaller firms attempt to match the larger firms’ advertising or promotion expenditures). In this
manner they alter the competitive process to their persistent advantage and preserve or even
increase market concentration.
Among the prominent manufacturing industries that illustrate this theory are brewing, autos,
computers, and coffee; a few words on each will highlight the mechanism.11 In brewing the 1972
acquisition of Miller by Philip Morris resulted in a huge expansion of advertising expenditures and
a bifurcation of the industry into a segment of large advertiser/brewers and a second tier of much
smaller niche brewers (Scherer 1996). Consolidation of the auto industry in the 1930s and again in
the 1960s coincided with periods of much more rapid (and expensive) style change, led by the
larger firms at the time (Kwoka 1998). Computer platforms underwent shakeouts during the 1970s
and 1980s as product development costs escalated (Bresnahan and Greenstein 1999). The coffee
industry is notable since it consists of two segments –- roasted and instant –- both with high
advertising but with very different setup costs. The roasted segment has low sunk costs and
exhibits considerably lower concentration than the high-sunk-cost instant segment (Sutton 1991, ch.
11 These illustrations should not be interpreted as a claim that small business has largely orcompletely disappeared from manufacturing; the data in Table 3 clearly indicate otherwise.

14
12).
What does all this imply? Most importantly, it implies that the fate of small businesses is
often in the hands of leading firms in their markets. Small businesses may be forced to compete on
terms not of their choosing, and indeed on terms chosen strategically to disadvantage them. A
further implication is that there is much to be learned from detailed study of particular industries, as
has been undertaken by Sutton and the other named authors above. Sweeping generalizations
simply cannot reveal the mechanisms that determine the structure and evolution of specific
industries. Moreover, while any good industry study addresses all segments of the industry,
industrial organization research would do well to devote more attention to the market and strategic
environment in which small business operates. Such a focus would usefully complement the
conventional preoccupation with large firms. It would help in understanding how the competitive
environment is shaped and how small business must adapt to and operate within that environment.
This would bring into sharper relief the constraints on small business and possibly suggest policies
to address them.
IV. CONCLUSIONS
We began this paper by citing Willie Sutton’s response to a question about the focus of his
strategic behavior. We conclude with observations based on John Sutton’s focus on the strategic
behavior of large firms and their implications for smaller firms.
The small business sector is an important part of the American economic landscape, in both
Nevertheless, the manufacturing sector does provide excellent illustrations of Sutton’s theory.

15
absolute and relative terms. Despite its absolute growth, however, the sector accounts for a
diminishing share of private sector activity. But its importance, and changes in importance, vary
across industrial sectors of the economy. Among the likely reasons for these variances are the
presence or absence of endogenous strategic behaviors of the larger firms with respect to
advertising, promotion, research and development, and other sunk cost expenditures in specific
industries.
If analysts and policy makers are to understand the reason for and role of small business in
individual industries, the research base related to small business must be expanded. Sutton’s
explication of the strategic environments of industries suggests a number of research directions:
-- Why are some industries more prone to experience endogenous sunk costs (which tend to
place small business at a greater disadvantage) than are others?12 What are their important
characteristics? What role does technological change -- exogenous or endogenous -- play?
-- To what extent are large firms’ advertising and similar promotional expenditures focused
solely on the firms’ own perceived demand conditions and to what extent are they strategically
aimed at disadvantaging their smaller rivals (i.e., "raising rivals’ costs")?13
-- What potential counter-strategies are available to smaller firms when they face
disadvantages of endogenous sunk costs? Why are the counter-strategies effective? Where and
12 As an initial observation, we note that the "commodityness" of an industry’s output is likely tobe a necessary condition for an industry not to be prone to endogenous sunk costs; butcommodityness is probably not a sufficient condition. After all, it is difficult to think of a productthat is more a commodity than is water; yet bottled ("designer") water has become an importantmarket in the last two decades. Might we someday see "designer sugar" or "designer salt"? 13 See Salop and Scheffman (1983, 1987).
16
when are they effective?
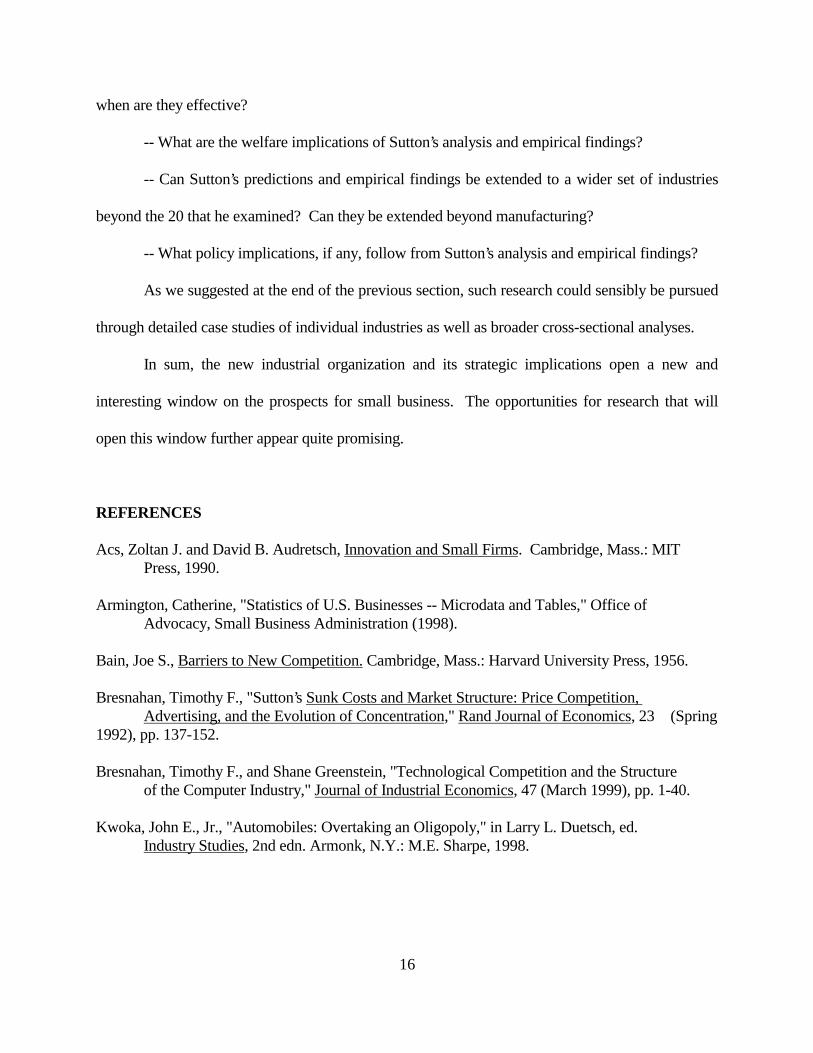
-- What are the welfare implications of Sutton’s analysis and empirical findings?
-- Can Sutton’s predictions and empirical findings be extended to a wider set of industries
beyond the 20 that he examined? Can they be extended beyond manufacturing?
-- What policy implications, if any, follow from Sutton’s analysis and empirical findings?
As we suggested at the end of the previous section, such research could sensibly be pursued
through detailed case studies of individual industries as well as broader cross-sectional analyses.
In sum, the new industrial organization and its strategic implications open a new and
interesting window on the prospects for small business. The opportunities for research that will
open this window further appear quite promising.
REFERENCES
Acs, Zoltan J. and David B. Audretsch, Innovation and Small Firms. Cambridge, Mass.: MIT Press, 1990.
Armington, Catherine, "Statistics of U.S. Businesses -- Microdata and Tables," Office of Advocacy, Small Business Administration (1998).
Bain, Joe S., Barriers to New Competition. Cambridge, Mass.: Harvard University Press, 1956.
Bresnahan, Timothy F., "Sutton’s Sunk Costs and Market Structure: Price Competition, Advertising, and the Evolution of Concentration," Rand Journal of Economics, 23 (Spring
1992), pp. 137-152.
Bresnahan, Timothy F., and Shane Greenstein, "Technological Competition and the Structure of the Computer Industry," Journal of Industrial Economics, 47 (March 1999), pp. 1-40.
Kwoka, John E., Jr., "Automobiles: Overtaking an Oligopoly," in Larry L. Duetsch, ed. Industry Studies, 2nd edn. Armonk, N.Y.: M.E. Sharpe, 1998.

17
Robb, Alicia, "New Data for Dynamic Analysis: Research Using Confidential Microdata at the Center of Economic Studies, U.S. Census Bureau," Office of Advocacy, Small Business Administration (1999).
Robb, Alicia, "New Data for Dynamic Analysis: The Business Information Tracking System (BITS)." Washington, D.C.: U.S. Small Business Administration, Office of Advocacy. January 2000a.
Robb, Alicia, "The New Longitudinal Establishment and Enterprise Microdata," Statistics of Income Bulletin, forthcoming (2000b).
Salop, Steven C., and David T. Scheffman, "Raising Rivals’ Costs," American Economic Review, 73 (May 1983), pp. 267-71.
Salop, Steven C., and David T. Scheffman, "Cost-Raising Strategies," Journal of Industrial Economics, 36 (September 1987), pp. 19-34.
Scherer, F.M., Industry Structure, Strategy, and Public Policy. New York: HarperCollins, 1996.
Scherer, F.M., and David Ross, Industrial Market Structure and Economic Performance, 3rd edn. Boston: Houghton Mifflin, 1990.
Schmalensee, Richard, "Sunk Costs and Market Structure: A Review Article," Journal of Industrial Economics, 40 (June 1992), pp. 125-134.
Sutton, John, Sunk Costs and Market Structure: Price Competition, Advertising, and the Evolution of Concentration. Cambridge, Mass.: MIT Press, 1991.
Sutton, John, Technology and Market Structure: Theory and History. Cambridge, Mass.: MIT Press, 1998.
U.S. Small Business Administration, Office of Advocacy, "The Facts About Small Business 1999." Washington, D.C.: U.S.SBA, 1999.
White, Lawrence J., Measuring the Importance of Small Business in the American Economy,Monograph Series in Finance and Economics, Salomon Brothers Center for the Study ofFinancial Institutions, Graduate School of Business Administration, New York University,Monograph 1981-4.
White, Lawrence J., "The Determinants of the Relative Importance of Small Business," Review

18
of Economics and Statistics, 64 (February 1982), pp. 42-49.
White, Lawrence J., "The Role of Small Business in the U.S. Economy," in Paul M. Horvitz and R. Richardson Pettit, ed., Small Business Finances: Problems in the Financing of Small Business. Greenwich, Conn.: JAI Press, 1984, pp. 19-50.

19
Table 1: Employment in Private Employer FirmsU.S. Economy, 1988-1996
Employment in Employment in firms with fewer firms with fewer Employment
Year than 100 employees than 500 employees in all firms
1988 35,153,344 47,914,723 87,844,303
1989 35,980,220 49,166,797 91,626,094
1990 36,621,948 50,166,797 93,469,275
1991 35,859,223 49,002,613 92,307,559
1992 36,057,451 49,200,841 92,825,797
1993 36,490,825 50,316,063 94,773,913
1994 36,889,313 51,007,688 96,721,594
1995 37,992,089 52,652,510 100,314,946
1996 38,524,694 53,174,501 102,187,297
Source: U.S.SBA, Office of Advocacy
20
Table 2: Small Business Shares of Employment in AllPrivate Employer Firms in the U.S. Economy, 1988-1996
Firms with Firms with fewer than fewer than
Year 100 employees 500 employees
1988 40.0% 54.5%
1989 39.3 53.9
1990 39.2 53.7
1991 38.9 53.1
1992 38.7 53.0
1993 38.5 53.1
1994 38.1 52.7
1995 37.9 52.5
1996 37.7 52.0
Source: Table 1

21
Table 3: Small Business Shares of Employment inPrivate Employer Firms, by Sector, 1988 and 1996
Firms with Firms withfewer than fewer than
100 employees 500 employees
Sector 1988 1996 1988 1996
Ag. svcs., forestry, fishing 77.4% 80.3% 87.0% 88.3%
Mining 28.3 27.8 39.4 41.3
Construction 73.7 75.1 88.4 89.5
Manufacturing 21.3 22.3 37.4 38.4
Trans., communications, utilities 25.6 25.5 35.4 36.0
Wholesale trade 53.1 50.2 68.4 65.9
Retail trade 45.4 40.9 56.2 51.2
Finance, insurance, real estate 32.3 31.3 44.7 42.7
Services 44.7 38.6 62.4 55.5
Nonclassifiable 70.1 100.0 54.5 100.0
All sectors 40.0% 37.7% 54.5% 52.0%
Source: U.S.SBA, Office of Advocacy

22
Table 4: Sectoral Shares of Employment in AllPrivate Employer Firms in the U.S. Economy, 1988 and 1996
Sector 1988 1996
Ag. svcs., forestry, fishing 0.5% 0.6%
Mining 0.8 0.6
Construction 5.7 5.1
Manufacturing 21.9 18.2
Trans., communications, utilities 6.0 5.9
Wholesale trade 6.8 6.5
Retail trade 21.5 21.0
Finance, insurance, real estate 7.6 7.0
Services 28.7 35.0
Nonclassifiable 0.4 0.1
Total 100.0% 100.0%
Source: U.S.SBA, Office of Advocacy
23
Table 5: The Aggregate Effects of Changing Weights
Firms with Firms withfewer than fewer than
100 employees 500 employees
Actual small business employment share in 1988: 40.0% 54.5%
Actual small business employment share in 1996: 37.7 52.0
Hypothetical small business employment share in 1996 if sectoral employment shares had remained unchanged at at their 1988 levels: 37.4 51.5
Hypothetical small business employment share in 1996 if small business shares in each sector had remained unchanged at their 1988 levels: 40.7 55.5

24
$
D2 D1
LRAC
0 m S Q
Figure 1: The relationship between minimum efficient scale (m) and market size (S)

25
Source: Sutton (1991, Figure 5.4 (i), p. 118). The solid line is the estimated lower bound of thescatterplot representing six homogeneous goods industries in six countries. The vertical axis isthe logit transformation of an industry’s four-firm concentration ratio; i.e., it is Y = log (C/(1-C)).The horizontal axis is the ratio of the corresponding industry’s sales divided by Sutton’s estimateof the industry’s minimum efficient scale.
Market concentration
Figure 2:Market size/minimumefficient scale

26
Market size/minimum efficient scale
Marketconcentration
Figure 3:
Source: Sutton (1991, Figure 5.4(ii), p. 118). The shallow solid line is the lower bound of the scatterplot representing fourteen advertising-intensive industries in six countries. The steeper line is that for homogeneous goods industries, reproduced from Figure 2 for comparison. See Figure 2 for further descriptions of the axes.