the net benefits of low and no-carbon electricity technologies · the net benefits of low and...
TRANSCRIPT

THE NET BENEFITS OF LOW AND NO-CARBON ELECTRICITY TECHNOLOGIES
Charles R. Frank, Jr.
GLOBAL ECONOMY & DEVELOPMENT
WORKING PAPER 73 | MAY 2014
Global Economyand Developmentat BROOKINGS

Global Economyand Developmentat BROOKINGS
Charles R. Frank, Jr. is a nonresident senior fellow at
the Brookings Institution.
Acknowledgements:
The author is indebted to Claire Langley, Ricardo Borquez, A. Denny Ellerman, Claudio Marcantonini, and Lee
Lane for their helpful suggestions in the preparation of this paper. I would also like to acknowledge the contribu-
tions made by participants in a roundtable discussion of an earlier draft of this paper chaired by Kemal Derviş of
the Brookings Institution.
Abstract:
This paper examines five different low and no-carbon electricity technologies and presents the net benefits of
each under a range of assumptions. It estimates the costs per megawatt per year for wind, solar, hydroelectric,
nuclear, and gas combined cycle electricity plants. To calculate these estimates, the paper uses a methodology
based on avoided emissions and avoided costs, rather than comparing the more prevalent “levelized” costs.
Three key findings result:
First—assuming reductions in carbon emissions are valued at $50 per metric ton and the price of natural gas
is $16 per million Btu or less—nuclear, hydro, and natural gas combined cycle have far more net benefits than
either wind or solar. This is the case because solar and wind facilities suffer from a very high capacity cost per
megawatt, very low capacity factors and low reliability, which result in low avoided emissions and low avoided
energy cost per dollar invested.
Second, low and no-carbon energy projects are most effective in avoiding emissions if a price for carbon is levied
on fossil fuel energy suppliers. In the absence of an appropriate price for carbon, new no-carbon plants will tend
to displace low-carbon gas combined cycle plants rather than high-carbon coal plants and achieve only a fraction
of the potential reduction in carbon emissions. The price of carbon should be high enough to make production
from gas-fired plants preferable to production from coal-fired plants, both in the short term, based on relative
short-term energy costs, and the longer term, based on relative energy and capacity costs combined.
Third, direct regulation of carbon dioxide emissions of new and existing coal-fired plants, as proposed by the U.S.
Environmental Protection Agency, can have some of the same effects as a carbon price in reducing coal plant
emissions both in the short term and in the longer term as old, inefficient coal plants are retired. However, a
price levied on carbon dioxide emissions is likely to be a less costly way to achieve a reduction in carbon dioxide
emissions.


Annualized capital cost The annual payments of interest, return on equity, and amortization of the ini-tial capital cost required to fully amortize the capital cost per MW of capacity over the expected economic life of a power plant.
Availability factor The percentage of time in a year during which a power plant is producing, or able to produce, at full capacity.
Avoided capacity cost The capacity cost of a fossil fuel plant that would have been incurred had not a new plant using low or no-carbon technology been built.
Avoided emissions The reduction in total emissions of an electricity system caused by the introduc-tion of a new plant.
Avoided energy cost The reduction in total energy cost of an electricity system caused by the intro-duction of a new plant.
Balancing costs The costs incurred by an electrical system, such as spinning reserves, to bal-ance supply and demand for electricity and avoid excessive voltage fluctua-tions.
British thermal unit (Btu) The measurement of the amount of heat required to raise the temperature of one pound of water one degree Fahrenheit.
Capacity The electrical producing capacity of a power plant, typically measured in mega-watts (MW). A plant of one MW of capacity can produce one megawatt-hour (MWH) of electrical energy per hour when operating at full capacity.
Capacity cost The annualized capital cost plus fixed operation and maintenance costs per year per MW of capacity, also called the fixed costs.
Capacity factor The ratio of the actual annual megawatt hours of electrical energy production per megawatt of capacity of a power plant divided by 8,760 megawatt-hours, the total energy that could be generated by a plant of one megawatt capacity operated continuously at full capacity throughout the 8,760 hours in a year.
Combined cycle gas plant A power plant that utilizes both a gas turbine and a steam turbine to produce electricity. The waste heat from the gas turbine burning natural gas to produce electricity is utilized to heat water and produce steam for the steam turbine to produce additional electricity.
Cost of capital Interest payments and return on equity per dollar of investment in a new power plant.
Cycling costs The costs incurred by an electrical system in starting up and closing down plants in order to take account of variations in the supply and demand for elec-tricity.
GLOSSARY OF TERMS

Efficiency The percentage ratio between Btu’s released in the burning of fuel to the Btu equivalent of electrical energy produced by a power plant.
Electricity system A system of producers and consumers of electricity connected by transmission and distribution networks.
Energy The electrical energy produced by a power plant, typically measured in mega-watt-hours (MWH).
Energy cost The cost of fuel plus the variable operation and maintenance costs per MWH of energy produced, also called the variable cost per MWH produced.
Feed-in tariff A special price for electricity produced by qualified renewable energy sources.
Heat rate The number of Btu of energy in fuel required to produce one kilowatt-hour of electrical energy. The lower the heat rate of a power plant, the greater is its ef-ficiency.
Load factor The same as the capacity factor.
Levelized cost The cost per MWH of a power plant calculated as the sum of (a) the capacity cost of a power plant divided by the number of MWH of energy produced (or expected to be produced) in a year plus (b) the energy cost per MWH.
Overnight capital cost The capital cost of a new plant per MW of capacity, excluding the cost of capital during construction.
Renewable energy certificate
Certificates issued to qualified renewable energy electricity producers that electricity distributors must buy in amounts large enough to demonstrate that a specified percentage of electricity that they distribute comes directly or indi-rectly from renewable sources. The sale of the certificates constitutes a subsidy for qualified renewable energy producers, financed by distributors by charging higher prices to consumers.
Simple cycle gas plant A gas power plant that utilizes only a gas turbine.
Spinning reserves Potential power created by running a gas or steam turbine without producing and feeding power into the grid unless and until needed to meet a sharp in-crease in demand.
System Reliability The ability of an electricity system to provide a continuous flow of electricity from producers to consumers, typically measured as the inverse of the system’s loss-of-load probability, the probability that during any given period of time some or all consumers will suffer a reduction or complete loss of electrical load.

CONTENTS
Introduction . . . . . . . . . . . . . . . . . . . . . . . . . . . . . . . . . . . . . . . . . . . . . . . . . . . . . . . . . . . . . . . . . . . . . . . . . . .1
Avoided Emissions . . . . . . . . . . . . . . . . . . . . . . . . . . . . . . . . . . . . . . . . . . . . . . . . . . . . . . . . . . . . . . . . . . . . . 3
Baseload Replacement and Avoided Emissions . . . . . . . . . . . . . . . . . . . . . . . . . . . . . . . . . . . . . . . . 3
Capacity Factors . . . . . . . . . . . . . . . . . . . . . . . . . . . . . . . . . . . . . . . . . . . . . . . . . . . . . . . . . . . . . . . . . . . 4
Avoided Energy Cost . . . . . . . . . . . . . . . . . . . . . . . . . . . . . . . . . . . . . . . . . . . . . . . . . . . . . . . . . . . . . . . . . . . 6
Avoided Capacity Cost . . . . . . . . . . . . . . . . . . . . . . . . . . . . . . . . . . . . . . . . . . . . . . . . . . . . . . . . . . . . . . . . . 8
Replacement and Avoided Capacity Costs . . . . . . . . . . . . . . . . . . . . . . . . . . . . . . . . . . . . . . . . . . . . . 8
Reliability and Avoided Capacity Costs . . . . . . . . . . . . . . . . . . . . . . . . . . . . . . . . . . . . . . . . . . . . . . . . 9
Capacity Costs . . . . . . . . . . . . . . . . . . . . . . . . . . . . . . . . . . . . . . . . . . . . . . . . . . . . . . . . . . . . . . . . . . . . . . . 12
Other Costs Incurred . . . . . . . . . . . . . . . . . . . . . . . . . . . . . . . . . . . . . . . . . . . . . . . . . . . . . . . . . . . . . . . . . . 13
Net Benefits . . . . . . . . . . . . . . . . . . . . . . . . . . . . . . . . . . . . . . . . . . . . . . . . . . . . . . . . . . . . . . . . . . . . . . . . . 15
Displacement of Baseload Production . . . . . . . . . . . . . . . . . . . . . . . . . . . . . . . . . . . . . . . . . . . . . . . . . . . 18
Break-even Carbon Price in the Short Term . . . . . . . . . . . . . . . . . . . . . . . . . . . . . . . . . . . . . . . . . . 18
Break-even Carbon Price in the Longer Term . . . . . . . . . . . . . . . . . . . . . . . . . . . . . . . . . . . . . . . . . 19
Sensitivity to Carbon Prices . . . . . . . . . . . . . . . . . . . . . . . . . . . . . . . . . . . . . . . . . . . . . . . . . . . . . . . . 20
Sensitivity to Natural Gas Prices . . . . . . . . . . . . . . . . . . . . . . . . . . . . . . . . . . . . . . . . . . . . . . . . . . . . 20
Implications for CO2 Emission Reduction Policies . . . . . . . . . . . . . . . . . . . . . . . . . . . . . . . . . . . . . . . . . 21
Renewable Incentives . . . . . . . . . . . . . . . . . . . . . . . . . . . . . . . . . . . . . . . . . . . . . . . . . . . . . . . . . . . . . . 21
Carbon Trading Systems . . . . . . . . . . . . . . . . . . . . . . . . . . . . . . . . . . . . . . . . . . . . . . . . . . . . . . . . . . . 21
Tighter regulations . . . . . . . . . . . . . . . . . . . . . . . . . . . . . . . . . . . . . . . . . . . . . . . . . . . . . . . . . . . . . . . . 22
Summary and Conclusions . . . . . . . . . . . . . . . . . . . . . . . . . . . . . . . . . . . . . . . . . . . . . . . . . . . . . . . . . . . . . 24
References . . . . . . . . . . . . . . . . . . . . . . . . . . . . . . . . . . . . . . . . . . . . . . . . . . . . . . . . . . . . . . . . . . . . . . . . . . 25
Endnotes . . . . . . . . . . . . . . . . . . . . . . . . . . . . . . . . . . . . . . . . . . . . . . . . . . . . . . . . . . . . . . . . . . . . . . . . . . . . 28
LIST OF TABLES
Table 1. CO2 Emissions per MWH: Fossil Fuel Plants . . . . . . . . . . . . . . . . . . . . . . . . . . . . . . . . . . . . . . . . . 3
Table 2A. Avoided Emissions per MW per Year Displacing Coal Off-Peak and Gas SC On-Peak . . . . . . . . . . . . . . . . . . . . . . . . . . . . . . . . . . . . . . . . . . . . . . . . . . . . . . . . . . . . . . 5
Table 2B. Avoided Emissions per MW per Year Displacing Gas CC Off-Peak and Gas SC On-Peak . . . . . . . . . . . . . . . . . . . . . . . . . . . . . . . . . . . . . . . . . . . . . . . . . . . . . . . . . . . . . . 5
Table 3. Energy Cost per MWH: Old Fossil Fuel Plants . . . . . . . . . . . . . . . . . . . . . . . . . . . . . . . . . . . . . . . 6
Table 4A. Net Avoided Energy Cost/MW/Year Displacing Coal Off-Peak and Gas SC On-Peak . . . . . . . . . . . . . . . . . . . . . . . . . . . . . . . . . . . . . . . . . . . . . . . . . . . . . . . . . . . . . . 7
Table 4B. Net Avoided Energy Cost/MW/Year Displacing Gas CC Off-Peak and Gas SC On-Peak . . . . . . . . . . . . . . . . . . . . . . . . . . . . . . . . . . . . . . . . . . . . . . . . . . . . . . . . . . . . . . 7
Table 5. Capacity Cost per Year per MW: New Fossil Fuel Plant . . . . . . . . . . . . . . . . . . . . . . . . . . . . . . . 8
Table 6A. Avoided Capacity Cost: Coal Baseload Production Displaced . . . . . . . . . . . . . . . . . . . . . . 10
Table 6B. Avoided Capacity Cost: Gas CC Baseload Production Displaced . . . . . . . . . . . . . . . . . . . . 10
Table 7. Capacity Cost per MW per Year: New No-Carbon Electricity Plants . . . . . . . . . . . . . . . . . . . 12
Table 8. Other Costs for Nuclear Plants . . . . . . . . . . . . . . . . . . . . . . . . . . . . . . . . . . . . . . . . . . . . . . . . . 14
Table 9A. Net Benefits per Year per MW: Displacement of Coal Baseload Production . . . . . . . . . . 15
Table 9B. Net Benefits per Year per MW: Displacement of Gas CC Baseload Production . . . . . . . . 16
Table 9C. Net Benefits with More Favorable Assumptions for Wind and Solar . . . . . . . . . . . . . . . . . 16
Table 10A. Short-term Break-even Carbon Price: Sensitivity to Natural Gas Prices . . . . . . . . . . . . 19
Table 10B. Longer Term Break-even Carbon Price: Sensitivity to Natural Gas Prices . . . . . . . . . . . 19
Table 11. Sensitivity of Net Benefits to Carbon Dioxide Prices (1) . . . . . . . . . . . . . . . . . . . . . . . . . . . . 20
Table 12. Sensitivity of Net Benefits to Natural Gas Prices (1) . . . . . . . . . . . . . . . . . . . . . . . . . . . . . . . 20

THE NET BENEFITS OF LOW AND NO-CARBON ELECTRICITY TECHNOLOGIES 1
THE NET BENEFITS OF LOW AND NO-CARBON ELECTRICITY TECHNOLOGIES
Charles R. Frank, Jr.
There are several different technologies available for
reducing carbon dioxide emissions in the electricity
sector. There is much debate and concern over which
technologies deserve the most government policy
support and what the costs and benefits are of each.
In this paper we examine five different electricity
technologies, wind, solar, hydroelectric, nuclear, and
gas combined cycle, the first four of which are no-car-
bon technologies (emit no carbon dioxide) and the last
of which, gas combined cycle, is a low-carbon technol-
ogy, especially compared to coal and gas simple-cycle
technologies.
The most common method for comparing the cost
of different electricity technologies is to compute
and compare the “levelized” cost of each alternative.
However, Joskow (2011) argues convincingly that lev-
elized costs are not appropriate for ranking technolo-
gies. An electricity plant that produces electricity with
a relatively high levelized cost may be more valuable
than a plant with a lower levelized cost if the plant
with a high levelized cost delivers electricity more
reliably and more cheaply when the price of electri-
cal energy is high—that is, during periods of peak
demand. For example, a high levelized-cost hydroelec-
tric project with ample storage capacity can produce
electricity at near zero marginal cost at full capac-
ity during peak periods. While levelized costs might
suggest that hydroelectric plants are higher-cost
than fossil fuel plants, the hydroelectric plant may
in fact be more profitable and valuable if that fossil
fuel plant is burdened with a high energy cost during
peak hours. Similarly, a solar plant that delivers more
power during daytime (when electricity demand is at
its peak) may be more valuable than a wind plant that
produces more power during the night (when electric-
ity demand is lower).
Thus, rather than using levelized costs to compare
alternative technologies, one should compute the an-
nual costs and benefits of each project and then rank
those projects by net benefits delivered per megawatt
(MW) of new electrical capacity. The benefits of a
new electricity project are its avoided carbon dioxide
emissions, avoided energy costs and avoided capacity
costs.1 The costs include its own carbon dioxide emis-
INTRODUCTION
2 GLOBAL ECONOMY AND DEVELOPMENT PROGRAM
sions, its own energy cost, and its own capacity cost.
In addition, there are costs unique to certain technolo-
gies. For example, the decommissioning of a nuclear
plant and disposal of its spent nuclear fuel at the end
of its useful life can be very costly. Wind, solar and
hydroelectric plants produce electricity intermittently
and therefore generate additional system balancing
and cycling costs that have to be taken into account
(described in more detail later).
There is relatively little literature that analyzes ben-
efits of low or no-carbon projects in terms of avoided
emissions and avoided costs. Most of the literature
that does exist focuses on avoided costs for specific
electricity systems and for a limited range of tech-
nologies. For example, Gowrisankaran et al (2011)
estimate the benefits and costs of solar power in
Arizona. Marcantonini and Ellerman (2013) provide
estimates for wind and solar in Germany. This paper
estimates benefits and costs for five different tech-
nologies on a generic basis, using recently published
data from the U.S. Energy Information Administration
(EIA, April 2013a) on updated capital costs, operation
and maintenance costs and carbon dioxide emissions.
While costs can vary geographically, the market for
power plant construction, operation and maintenance
is global and there are few major differences in such
costs among countries. The International Energy
Agency also publishes cost data for construction op-
eration and maintenance which are broadly consistent
with data published by the EIA.
Similarly, markets for coal and oil are international
and major price differences among countries arise
largely from government trade policies. Prices for
natural gas, however, are highly variable among coun-
tries because of the high cost of, and long lead times
for, pipelines and liquid natural gas facilities required
to transport natural gas over long distances. Also
there are large differences among countries regarding
capacity factors (or load factors) for renewable energy
because of geographical variations in wind and solar
intensity and availability of hydroelectric sites among
countries. Thus this paper includes an analysis of the
sensitivity of results to natural gas prices and capac-
ity factors to demonstrate the applicability of results,
or lack thereof, among countries. We also examine the
implications of the analysis for government policies,
including renewable incentives, taxation of carbon di-
oxide emissions, trading of carbon dioxide emissions
allowances, and regulation of emission standards for
fossil fuel electric generating facilities.

THE NET BENEFITS OF LOW AND NO-CARBON ELECTRICITY TECHNOLOGIES 3
An important part of the value of any new plant is
the avoided emissions that they generate—in other
words, the reduction in carbon dioxide emissions
achieved by displacing production from CO2-emitting
fossil fuel plants. The avoided emissions of any new
low or no-carbon plant depend on two main factors: (1)
whether the new plant displaces baseload, coal-fired
electricity production or baseload, gas-fired electric-
ity production (Fell et al, 2012), and (2) the percentage
capacity factor of the new plant.
Baseload Replacement and Avoided Emissions
Avoided emissions of a new plant are much higher if
it displaces a baseload coal plant rather than a basel-
oad natural gas combined cycle plant during off-peak
hours. Emissions from a baseload coal plant are much
greater than emissions from a baseload gas plant
using combined cycle technology. The differences in
emissions between coal-fired and gas-fired plants de-
rive from two main factors. First, coal contains more
carbon per British thermal unit (Btu) than natural gas
and therefore emits greater amounts of carbon diox-
ide per Btu. Second, coal-fired generating plants are
less efficient than gas combined cycle (CC) plants in
producing electricity and utilize more Btu per mega-
watt-hour (MWH) produced than gas CC plants.
As shown in Table 1, the difference in emissions be-
tween a new gas-fired, combined cycle plant and an
old coal plant is great. Old coal plants generate 2,162.6
pounds of CO2 emissions (nearly a metric ton) per
MWH of electricity produced, nearly three times more
emissions than a new gas CC plant. The EIA data are
based on an energy efficiency of around 53 percent
for a new combined cycle plant. However, the most
modern, large-scale, combined cycle gas plants can
AVOIDED EMISSIONS
Table 1. CO2 Emissions per MWH: Fossil Fuel Plants
Heat Rate (Btu/KWH) Gas CC Coal Gas SCNew Plant (1) 6,430 8,800 9,750
Old Plant (2) 7,050 10,498 10,850
EfficiencyNew Plant 53.1% 38.8% 35.0%
Old Plant 48.4% 32.5% 31.5%
CO2 Emissions: Pounds per MWH (3)New Plant 752.3 1,812.8 1,140.8
Old Plant 824.9 2,162.6 1,269.5
Footnotes:
(1) EIA (April, 2013a) Table 1, p.6
(2) EIA (April, 2013a) Table 1, p.6 for gas; EIA (December 2013a), Table 8.1 for coal
(3) Pounds CO2 per million Btu Gas Coal
EIA (April, 2013a), Table 2-5, p. 2-10 117.0 206.0

4 GLOBAL ECONOMY AND DEVELOPMENT PROGRAM
actually achieve an efficiency of 60 percent or more
(Siemens May 2011). An old coal plant generates 3.25
times the carbon emissions of the most modern and
efficient gas-fired combined cycle plant. Compared to
coal, and to a simple cycle (SC) gas plant, gas CC is
truly a low carbon alternative.
To put the difference in context, based on 2012 data
for emissions from coal-fired plants and total emis-
sions by the electricity sector (EIA December 2013a,
Tables 3.1A and 9.1), if US coal-fired plants were re-
placed by the most efficient gas-fired plants, total
carbon emissions from the electricity sector would
decline by almost one half.
Capacity Factors
Other things equal, the higher the capacity factor
of a new plant, the greater are avoided emissions
per MW of new capacity. The emissions avoided by
a new wind, solar or hydroelectric project during a
given period of time depend on whether and to what
extent the wind is blowing, the sun is shining, or the
water is flowing. Wind, solar and hydro plants can only
avoid emissions when they are producing electricity,
which is only part of the time. Typically wind projects
have a capacity factor between 20 percent and 40
percent (Renewable Energy Research Laboratory).
Photovoltaic solar projects can have a capacity fac-
tor as low as 5.1 percent in 2011 in the United Kingdom
(Department of Energy and Climate Change (UK),
2013, Chapter 6, Table 6.5) and as high as 19 percent in
the state of Arizona (Apt, April 2008). Hydroelectric
projects worldwide have an average capacity factor
of 44 percent (Intergovernmental Panel on Climate
Change, 2012, Chapter 5 Hydroelectric).
A nuclear plant typically has a much higher capacity
factor—around 90 percent, far more than wind, solar,
or hydro—and thus can avoid far more emissions per
MW of capacity than wind, solar or hydro. Similarly, a
baseload gas combined cycle plant can operate at a
capacity factor around 90 percent. In this paper, we
have used capacity factors for wind, solar, hydro and
nuclear based on actual average U.S. capacity factors
from 2003 to 2012 for each type of plant. We assume
that a highly efficient combined cycle gas turbine can
operate at a 92 percent capacity factor.
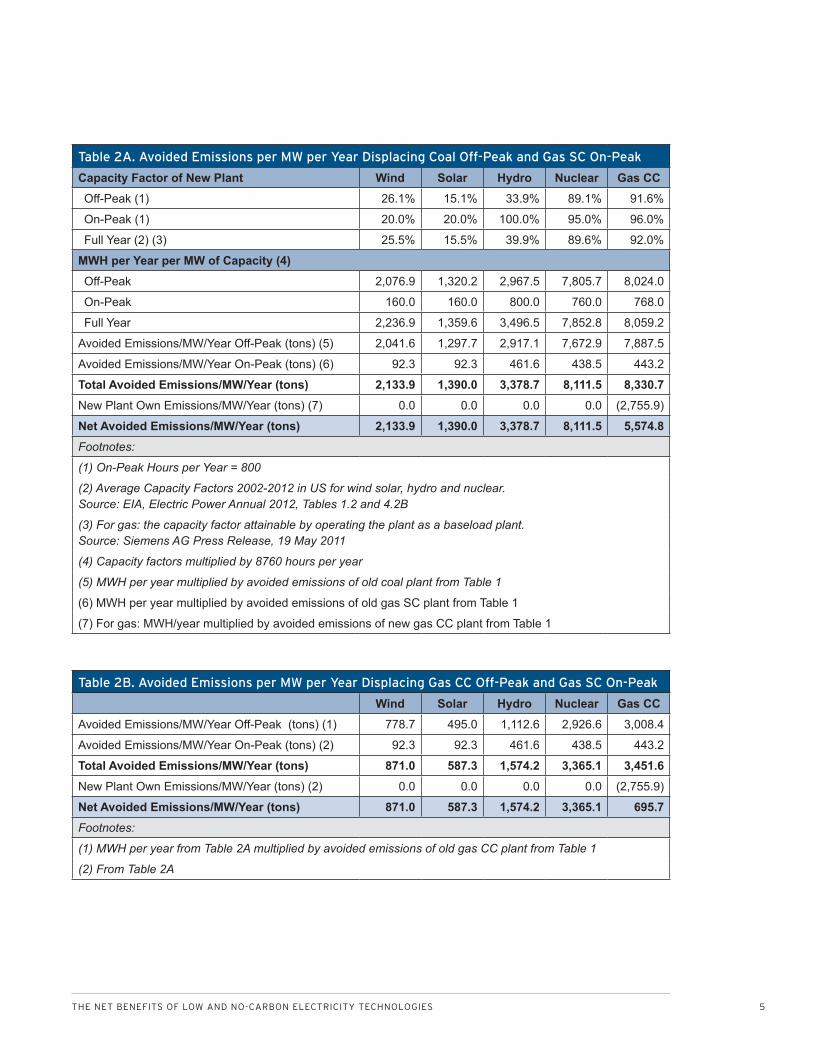
Table 2A gives avoided emissions for new plants based
on the assumption that the new plant displaces coal-
fired electricity production during off-peak hours.
Table 2B gives avoided emissions for new plants based
on the assumption that the new plant replaces gas
CC electricity production during off-peak hours. Both
tables are based on the assumption that the new plant
displaces simple cycle gas turbines during peak hours.
As shown in Tables 2A and 2B, among the no-carbon
energy alternatives, nuclear plants avoid the most
emissions per MW of new capacity, simply because
nuclear plants have far and away the highest capacity
factor. However, a new gas combined cycle plant that
displaces an old coal plant during off-peak hours is
second only to a new nuclear plant in terms of avoid-
ing carbon emissions per MW of new capacity and
is superior to wind, solar and hydroelectric in that
regard. A new solar plant avoids fewer emissions per
MW of capacity than any other kind of new plant dis-
placing an old coal plant. The reason is that a typical
solar plant has a much lower capacity factor than any
other kind of new plant.
THE NET BENEFITS OF LOW AND NO-CARBON ELECTRICITY TECHNOLOGIES 5
Table 2A. Avoided Emissions per MW per Year Displacing Coal Off-Peak and Gas SC On-Peak
Capacity Factor of New Plant Wind Solar Hydro Nuclear Gas CCOff-Peak (1) 26.1% 15.1% 33.9% 89.1% 91.6%
On-Peak (1) 20.0% 20.0% 100.0% 95.0% 96.0%
Full Year (2) (3) 25.5% 15.5% 39.9% 89.6% 92.0%
MWH per Year per MW of Capacity (4)Off-Peak 2,076.9 1,320.2 2,967.5 7,805.7 8,024.0
On-Peak 160.0 160.0 800.0 760.0 768.0
Full Year 2,236.9 1,359.6 3,496.5 7,852.8 8,059.2
Avoided Emissions/MW/Year Off-Peak (tons) (5) 2,041.6 1,297.7 2,917.1 7,672.9 7,887.5
Avoided Emissions/MW/Year On-Peak (tons) (6) 92.3 92.3 461.6 438.5 443.2
Total Avoided Emissions/MW/Year (tons) 2,133.9 1,390.0 3,378.7 8,111.5 8,330.7 New Plant Own Emissions/MW/Year (tons) (7) 0.0 0.0 0.0 0.0 (2,755.9)
Net Avoided Emissions/MW/Year (tons) 2,133.9 1,390.0 3,378.7 8,111.5 5,574.8 Footnotes:
(1) On-Peak Hours per Year = 800
(2) Average Capacity Factors 2002-2012 in US for wind solar, hydro and nuclear. Source: EIA, Electric Power Annual 2012, Tables 1.2 and 4.2B
(3) For gas: the capacity factor attainable by operating the plant as a baseload plant. Source: Siemens AG Press Release, 19 May 2011
(4) Capacity factors multiplied by 8760 hours per year
(5) MWH per year multiplied by avoided emissions of old coal plant from Table 1
(6) MWH per year multiplied by avoided emissions of old gas SC plant from Table 1
(7) For gas: MWH/year multiplied by avoided emissions of new gas CC plant from Table 1
Table 2B. Avoided Emissions per MW per Year Displacing Gas CC Off-Peak and Gas SC On-Peak
Wind Solar Hydro Nuclear Gas CCAvoided Emissions/MW/Year Off-Peak (tons) (1) 778.7 495.0 1,112.6 2,926.6 3,008.4
Avoided Emissions/MW/Year On-Peak (tons) (2) 92.3 92.3 461.6 438.5 443.2
Total Avoided Emissions/MW/Year (tons) 871.0 587.3 1,574.2 3,365.1 3,451.6 New Plant Own Emissions/MW/Year (tons) (2) 0.0 0.0 0.0 0.0 (2,755.9)
Net Avoided Emissions/MW/Year (tons) 871.0 587.3 1,574.2 3,365.1 695.7 Footnotes:
(1) MWH per year from Table 2A multiplied by avoided emissions of old gas CC plant from Table 1
(2) From Table 2A

6 GLOBAL ECONOMY AND DEVELOPMENT PROGRAM
Another important benefit of a new solar, wind or hy-
droelectric plant is that none have any energy cost.
The energy from the wind, sun or water is free. Such a
new plant displaces electricity produced by fossil fuel
plants that do have an energy cost. Thus in addition to
avoided emissions costs, one of the main benefits of
renewable energy plants is the energy cost avoided in
the displacement of fossil fuel electricity production.
Nuclear plants do have an energy cost. However, the
energy cost of a nuclear plant is much lower than that
of a fossil fuel electricity plant that it displaces. Thus
a nuclear plant also creates value in terms of avoided
energy cost.
The avoided energy cost of a new plant is a function
of the type of fossil fuel plant that it displaces as well
as the ratio of the on-peak capacity factor to the off-
peak capacity factor. Except when natural gas prices
are very low, as in 2012 in the United States, the en-
ergy cost of a combined cycle gas plant is greater than
that of a coal plant. A simple cycle gas plant has a very
high energy cost, as shown in Table 3.
Thus a new plant that displaces gas-fired electricity
production will have a higher avoided energy cost
than one that displaces a coal-fired plant.
Table 3. Energy Cost per MWH: Old Fossil Fuel Plants
Gas CC Coal Gas SCFuel Cost per mmbtu average 2013 (1) $4.33 $2.36 $4.33
Fuel Cost per MWH from Old Plant (2) $30.53 $24.78 $46.98
Variable O&M per MWH from Old Plant (3) $3.60 $6.24 $15.45
Total $34.13 $31.02 $62.43 Footnotes:
(1) EIA (March 2014), Table 9.9.
(2) Fuel cost per MWH multiplied by the heat rate from Table 1.
(3) Variable operation and maintenance costs from EIA (April 2013a), Table 8.1.
Avoided energy costs are higher for projects that
produce energy during peak periods, when system
energy costs are high because of the use of simple
cycle gas turbines and diesel fuel to provide for peak
load power. A project that produces energy mainly
during baseload periods when system energy costs
are lower will have a lower avoided energy cost. For
instance, a wind plant is likely to produce more energy
during non-peak periods than peak periods, and thus
will have a lower avoided energy cost. In contrast,
it is generally assumed that solar plant production
does correlate with peak energy demands, which are
likely to be greater during periods of intense sunshine.
Baseload nuclear, coal, and combined cycle gas plants
are likely to produce more energy during on-peak
periods because scheduled maintenance is normally
performed during off-peak periods.
AVOIDED ENERGY COST
THE NET BENEFITS OF LOW AND NO-CARBON ELECTRICITY TECHNOLOGIES 7
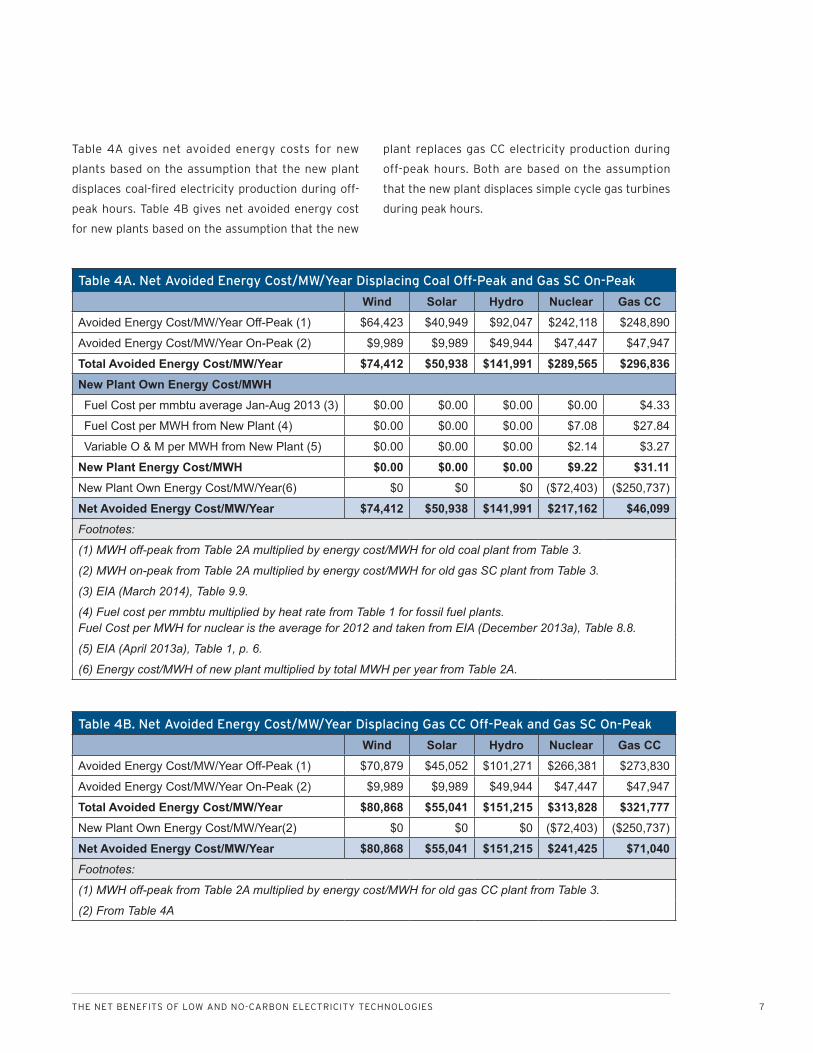
Table 4A gives net avoided energy costs for new
plants based on the assumption that the new plant
displaces coal-fired electricity production during off-
peak hours. Table 4B gives net avoided energy cost
for new plants based on the assumption that the new
plant replaces gas CC electricity production during
off-peak hours. Both are based on the assumption
that the new plant displaces simple cycle gas turbines
during peak hours.
Table 4A. Net Avoided Energy Cost/MW/Year Displacing Coal Off-Peak and Gas SC On-Peak
Wind Solar Hydro Nuclear Gas CCAvoided Energy Cost/MW/Year Off-Peak (1) $64,423 $40,949 $92,047 $242,118 $248,890
Avoided Energy Cost/MW/Year On-Peak (2) $9,989 $9,989 $49,944 $47,447 $47,947
Total Avoided Energy Cost/MW/Year $74,412 $50,938 $141,991 $289,565 $296,836 New Plant Own Energy Cost/MWHFuel Cost per mmbtu average Jan-Aug 2013 (3) $0.00 $0.00 $0.00 $0.00 $4.33
Fuel Cost per MWH from New Plant (4) $0.00 $0.00 $0.00 $7.08 $27.84
Variable O & M per MWH from New Plant (5) $0.00 $0.00 $0.00 $2.14 $3.27
New Plant Energy Cost/MWH $0.00 $0.00 $0.00 $9.22 $31.11 New Plant Own Energy Cost/MW/Year(6) $0 $0 $0 ($72,403) ($250,737)
Net Avoided Energy Cost/MW/Year $74,412 $50,938 $141,991 $217,162 $46,099 Footnotes:
(1) MWH off-peak from Table 2A multiplied by energy cost/MWH for old coal plant from Table 3.
(2) MWH on-peak from Table 2A multiplied by energy cost/MWH for old gas SC plant from Table 3.
(3) EIA (March 2014), Table 9.9.
(4) Fuel cost per mmbtu multiplied by heat rate from Table 1 for fossil fuel plants. Fuel Cost per MWH for nuclear is the average for 2012 and taken from EIA (December 2013a), Table 8.8.
(5) EIA (April 2013a), Table 1, p. 6.
(6) Energy cost/MWH of new plant multiplied by total MWH per year from Table 2A.
Table 4B. Net Avoided Energy Cost/MW/Year Displacing Gas CC Off-Peak and Gas SC On-Peak
Wind Solar Hydro Nuclear Gas CCAvoided Energy Cost/MW/Year Off-Peak (1) $70,879 $45,052 $101,271 $266,381 $273,830
Avoided Energy Cost/MW/Year On-Peak (2) $9,989 $9,989 $49,944 $47,447 $47,947
Total Avoided Energy Cost/MW/Year $80,868 $55,041 $151,215 $313,828 $321,777 New Plant Own Energy Cost/MW/Year(2) $0 $0 $0 ($72,403) ($250,737)
Net Avoided Energy Cost/MW/Year $80,868 $55,041 $151,215 $241,425 $71,040 Footnotes:
(1) MWH off-peak from Table 2A multiplied by energy cost/MWH for old gas CC plant from Table 3.
(2) From Table 4A
8 GLOBAL ECONOMY AND DEVELOPMENT PROGRAM
Avoided capacity costs arise from the fact that a new
electric power plant can reduce the need to invest in
building some other type of plant to achieve the same
amount of system output and same degree of system
reliability.2 Avoided capacity costs are a function of
which type of plant is displaced.
Replacement and Avoided Capacity Costs
In this paper, we assume that during off-peak periods
a new plant will displace either a baseload coal plant
or baseload gas combined cycle plant. During on-peak
it will displace a gas simple-cycle plant, which is typi-
cally used for peaking power but has a much higher
energy cost than any of the low or no-carbon alterna-
tives. Table 5 gives estimates of the capacity costs of
the plants that are displaced.
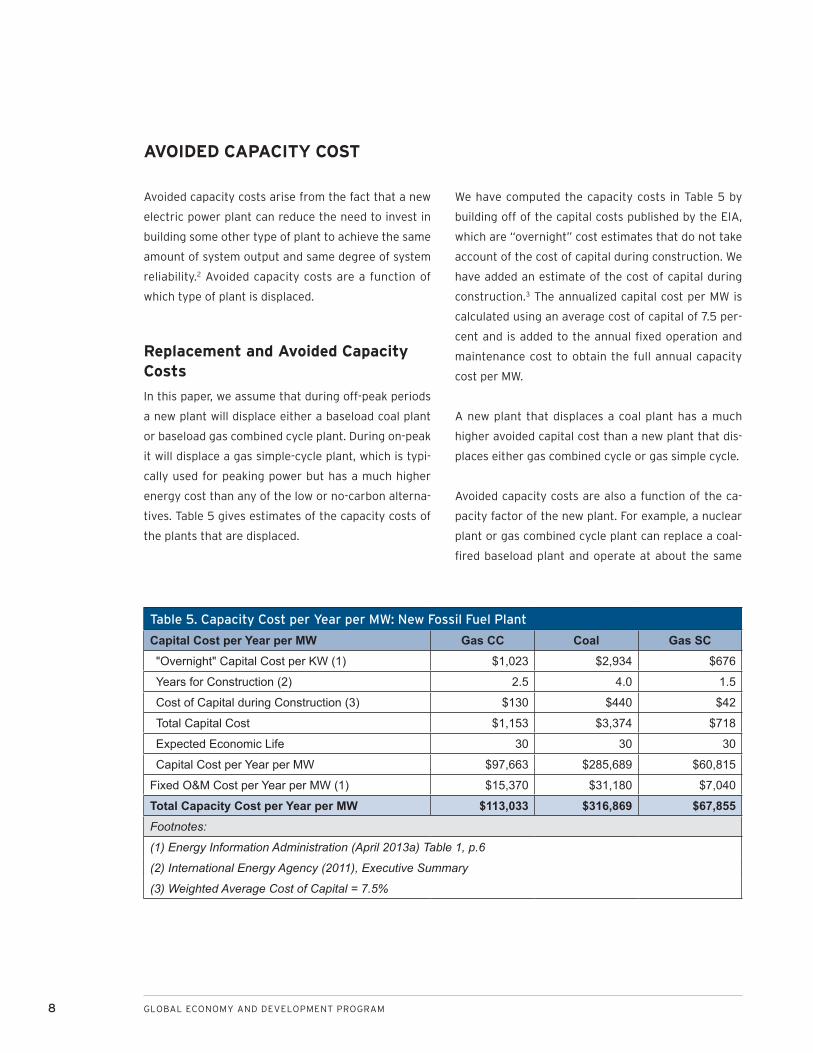
We have computed the capacity costs in Table 5 by
building off of the capital costs published by the EIA,
which are “overnight” cost estimates that do not take
account of the cost of capital during construction. We
have added an estimate of the cost of capital during
construction.3 The annualized capital cost per MW is
calculated using an average cost of capital of 7.5 per-
cent and is added to the annual fixed operation and
maintenance cost to obtain the full annual capacity
cost per MW.
A new plant that displaces a coal plant has a much
higher avoided capital cost than a new plant that dis-
places either gas combined cycle or gas simple cycle.
Avoided capacity costs are also a function of the ca-
pacity factor of the new plant. For example, a nuclear
plant or gas combined cycle plant can replace a coal-
fired baseload plant and operate at about the same
AVOIDED CAPACITY COST
Table 5. Capacity Cost per Year per MW: New Fossil Fuel Plant
Capital Cost per Year per MW Gas CC Coal Gas SC"Overnight" Capital Cost per KW (1) $1,023 $2,934 $676
Years for Construction (2) 2.5 4.0 1.5
Cost of Capital during Construction (3) $130 $440 $42
Total Capital Cost $1,153 $3,374 $718
Expected Economic Life 30 30 30
Capital Cost per Year per MW $97,663 $285,689 $60,815
Fixed O&M Cost per Year per MW (1) $15,370 $31,180 $7,040
Total Capacity Cost per Year per MW $113,033 $316,869 $67,855 Footnotes:
(1) Energy Information Administration (April 2013a) Table 1, p.6
(2) International Energy Agency (2011), Executive Summary
(3) Weighted Average Cost of Capital = 7.5%
THE NET BENEFITS OF LOW AND NO-CARBON ELECTRICITY TECHNOLOGIES 9
capacity factor as a coal-fired baseload plant. Thus
each megawatt of a nuclear or gas CC plant can re-
place one megawatt of a coal plant and avoid the capi-
tal cost associated with a coal plant. However, a wind,
solar or hydro plant can operate only at a fraction of
the capacity of a coal plant. All other things equal, a
wind plant that operates at a capacity factor of 30
percent can replace only a third of a megawatt of a
coal plant operating at a 90 percent capacity factor.
Reliability and Avoided Capacity Costs
However, all other things are not equal. Wind, solar,
and hydroelectric plants without storage are inher-
ently less reliable, not because they are mechanically
more prone to forced outages, but because the avail-
ability of wind, sun or water is highly variable. In order
to maintain system reliability, additional investments
in capacity are required. Thus a wind plant with a 30
percent capacity factor can actually replace only less
than a third of a coal plant with a 90 percent capac-
ity factor, if system reliability is to be maintained. In
theory one can overcome the problem of variability
of wind, solar and hydro with adequate storage of
electricity produced during off-peak periods and re-
leased during on-peak hours. Practically, however, the
technology for electricity storage is not yet developed
enough to make it economical without government
subsidies.
If all power plants were equally reliable, then one
could calculate avoided capacity costs by taking the
ratio of capacity factors between the new plant and
the plant to be replaced and multiplying it by the ca-
pacity cost of the plant to be replaced. The challenge
is to deduce avoided capacity costs for a new plant
that is less reliable than the plant that it replaces. The
capacity factors have to be adjusted to take account
of differing reliability.
In this paper, we have addressed this challenge by es-
timating a 99 percent confidence level capacity factor
(the adjusted capacity factor) for the new plant and
for the plant that it replaces. For example, as shown in
Table 6A, we have estimated that for a wind plant that
operates off-peak on average with a 26.1 percent ca-
pacity factor, the probability is 99 percent that in any
given year it will operate with a capacity factor of 20.4
percent or higher.4 For the baseload coal plant with a
89.5 percent off-peak capacity factor that it displaces
during off-peak hours, we estimate that in any given
year the probability is 99 percent that the coal capac-
ity factor will be 87.5 percent or higher. Thus a wind
plant of 1 MW capacity can only replace 0.233 MW (the
ratio of 20.4 to 87.5) of a baseload coal plant with the
same degree of reliability each year. In other words, it
takes 4.28 MW of wind capacity to produce the same
amount of electricity with the same degree of reliabil-
ity as 1 MW of off-peak coal plant capacity.5 Similarly, it
takes 7.30 MW of solar capacity to produce the same
amount of electricity with the same degree of reliabil-
ity as 1 MW of off-peak coal plant capacity.
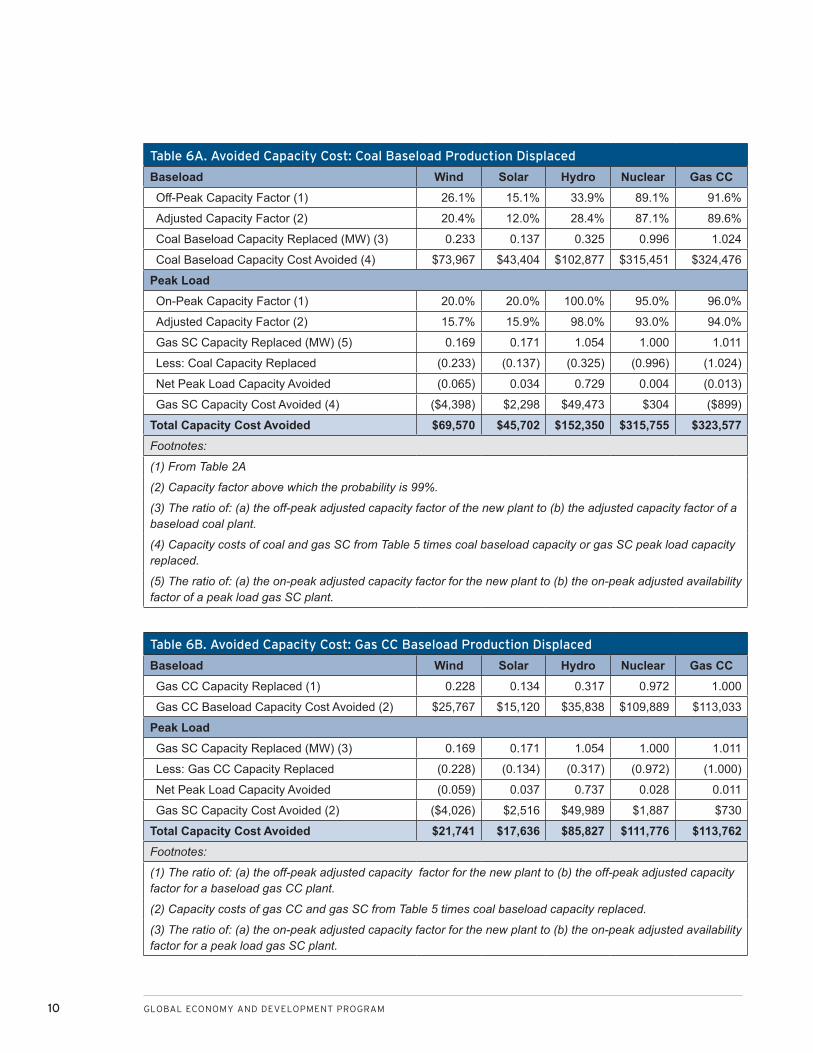
Table 6A is based on the assumption that a new no or
low-carbon plant displaces a coal baseload plant dur-
ing off-peak hours. Since the capacity cost of a gas CC
plant is substantially less than that of a coal plant, the
avoided capacity cost is lower by a factor of two or
three if gas CC rather than coal capacity is displaced,
as shown in Table 6B.
The size of the investment required to maintain sys-
tem reliability when a new plant replaces a baseload
plant depends on a number of factors other than
the variance of the capacity factor of the new plant.
It depends on the degree of covariance between the
capacity factor and the demand for electricity. A
plant with a high capacity factor during peak peri-
ods is more capable of maintaining system reliability
than a plant with a low capacity factor during peak
10 GLOBAL ECONOMY AND DEVELOPMENT PROGRAM
Table 6A. Avoided Capacity Cost: Coal Baseload Production Displaced
Baseload Wind Solar Hydro Nuclear Gas CCOff-Peak Capacity Factor (1) 26.1% 15.1% 33.9% 89.1% 91.6%
Adjusted Capacity Factor (2) 20.4% 12.0% 28.4% 87.1% 89.6%
Coal Baseload Capacity Replaced (MW) (3) 0.233 0.137 0.325 0.996 1.024
Coal Baseload Capacity Cost Avoided (4) $73,967 $43,404 $102,877 $315,451 $324,476
Peak LoadOn-Peak Capacity Factor (1) 20.0% 20.0% 100.0% 95.0% 96.0%
Adjusted Capacity Factor (2) 15.7% 15.9% 98.0% 93.0% 94.0%
Gas SC Capacity Replaced (MW) (5) 0.169 0.171 1.054 1.000 1.011
Less: Coal Capacity Replaced (0.233) (0.137) (0.325) (0.996) (1.024)
Net Peak Load Capacity Avoided (0.065) 0.034 0.729 0.004 (0.013)
Gas SC Capacity Cost Avoided (4) ($4,398) $2,298 $49,473 $304 ($899)
Total Capacity Cost Avoided $69,570 $45,702 $152,350 $315,755 $323,577 Footnotes:
(1) From Table 2A
(2) Capacity factor above which the probability is 99%.
(3) The ratio of: (a) the off-peak adjusted capacity factor of the new plant to (b) the adjusted capacity factor of a baseload coal plant.
(4) Capacity costs of coal and gas SC from Table 5 times coal baseload capacity or gas SC peak load capacity replaced.
(5) The ratio of: (a) the on-peak adjusted capacity factor for the new plant to (b) the on-peak adjusted availability factor of a peak load gas SC plant.
Table 6B. Avoided Capacity Cost: Gas CC Baseload Production Displaced
Baseload Wind Solar Hydro Nuclear Gas CCGas CC Capacity Replaced (1) 0.228 0.134 0.317 0.972 1.000
Gas CC Baseload Capacity Cost Avoided (2) $25,767 $15,120 $35,838 $109,889 $113,033
Peak LoadGas SC Capacity Replaced (MW) (3) 0.169 0.171 1.054 1.000 1.011
Less: Gas CC Capacity Replaced (0.228) (0.134) (0.317) (0.972) (1.000)
Net Peak Load Capacity Avoided (0.059) 0.037 0.737 0.028 0.011
Gas SC Capacity Cost Avoided (2) ($4,026) $2,516 $49,989 $1,887 $730
Total Capacity Cost Avoided $21,741 $17,636 $85,827 $111,776 $113,762 Footnotes:
(1) The ratio of: (a) the off-peak adjusted capacity factor for the new plant to (b) the off-peak adjusted capacity factor for a baseload gas CC plant.
(2) Capacity costs of gas CC and gas SC from Table 5 times coal baseload capacity replaced.
(3) The ratio of: (a) the on-peak adjusted capacity factor for the new plant to (b) the on-peak adjusted availability factor for a peak load gas SC plant.

THE NET BENEFITS OF LOW AND NO-CARBON ELECTRICITY TECHNOLOGIES 11
demand. If the capacity factor during peak hours is
high enough, no new investment in peaking capacity
may be required, even if the new plant is less reliable
than the coal plant that it displaces. For example, a
hydroelectric plant that has adequate water storage
capability can reliably operate close to or at a capac-
ity factor of 100 percent during peak hours. While the
year-round capacity factor of a hydro plant may be a
fraction of its total capacity and highly variable, its
ability to operate at a much higher and more reliable
capacity factor during peak hours can enable invest-
ments in peaking capacity to be reduced rather than
increased while still maintaining the same degree of
system reliability. Solar plants tend to have higher
capacity factors during peak hours because peak
loads are more likely to occur when the sun is shin-
ing. Nuclear and gas CC have higher capacity factors
during peak hours because preventative maintenance
is normally performed during off-peak hours. Thus in
Tables 6A and 6B, hydro, solar, nuclear and gas CC
have positive avoided capacity costs associated with
peak periods. Wind, which is assumed to have a lower
capacity factor during peak and off-peak periods, has
negative peak period avoided capacity cost.
As shown in Tables 6A and 6B, wind and solar plants
have the lowest avoided capacity cost (save less in
capacity cost) and nuclear and gas CC have the high-
est avoided capacity cost (save more in capacity cost).
The main reasons why wind and solar have such low
avoided capacity costs per MW is their low capacity
factors and low reliability compared to nuclear and
fossil fuel plants. If unadjusted capacity factors are
used, it takes 3.43 MW of wind and 5.94 MW of solar
capacity to produce the same output of a 1 MW of coal
baseload capacity. When capacity factors are adjusted
to take account of reliability, it takes 4.28 MW of wind
and 7.30 MW of solar capacity to produce the same
output with the same degree of reliability as 1 MW of
capacity of a baseload coal plant.6
Another important determinant of system reliability
is the degree of correlation in the capacity factor of a
new plant during any given time period with the over-
all system availability. If there is a high degree of posi-
tive correlation between the capacity factor of a new
plant and the system availability factor, then the new
plant’s ability to contribute to peak loads is much less
than if the correlation were zero or negative. The wind
or solar plant capacity factor of a new plant tends to
be positively correlated with capacity factors of ex-
isting wind and solar plants in the geographic area
served by an electricity system. Thus as the degree of
wind and solar penetration in a system increases, new
wind and solar plants contribute increasingly less to
system reliability.
12 GLOBAL ECONOMY AND DEVELOPMENT PROGRAM
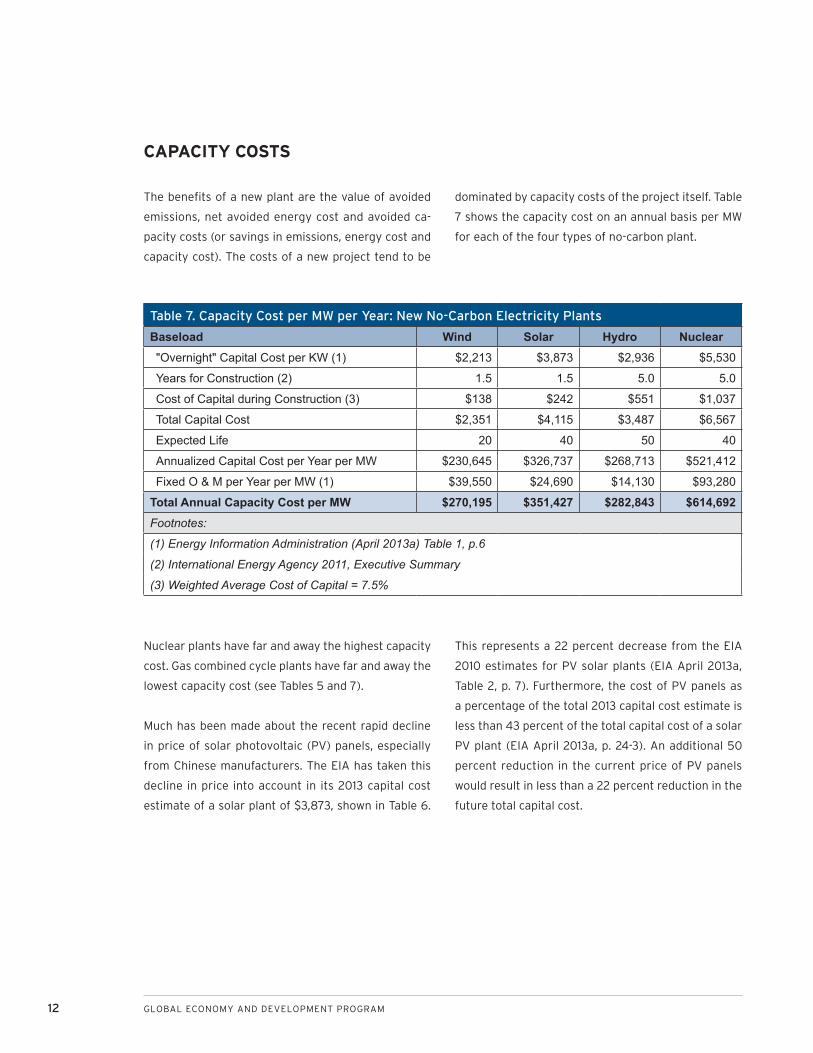
Nuclear plants have far and away the highest capacity
cost. Gas combined cycle plants have far and away the
lowest capacity cost (see Tables 5 and 7).
Much has been made about the recent rapid decline
in price of solar photovoltaic (PV) panels, especially
from Chinese manufacturers. The EIA has taken this
decline in price into account in its 2013 capital cost
estimate of a solar plant of $3,873, shown in Table 6.
This represents a 22 percent decrease from the EIA
2010 estimates for PV solar plants (EIA April 2013a,
Table 2, p. 7). Furthermore, the cost of PV panels as
a percentage of the total 2013 capital cost estimate is
less than 43 percent of the total capital cost of a solar
PV plant (EIA April 2013a, p. 24-3). An additional 50
percent reduction in the current price of PV panels
would result in less than a 22 percent reduction in the
future total capital cost.
The benefits of a new plant are the value of avoided
emissions, net avoided energy cost and avoided ca-
pacity costs (or savings in emissions, energy cost and
capacity cost). The costs of a new project tend to be
dominated by capacity costs of the project itself. Table
7 shows the capacity cost on an annual basis per MW
for each of the four types of no-carbon plant.
CAPACITY COSTS
Table 7. Capacity Cost per MW per Year: New No-Carbon Electricity Plants
Baseload Wind Solar Hydro Nuclear"Overnight" Capital Cost per KW (1) $2,213 $3,873 $2,936 $5,530
Years for Construction (2) 1.5 1.5 5.0 5.0
Cost of Capital during Construction (3) $138 $242 $551 $1,037
Total Capital Cost $2,351 $4,115 $3,487 $6,567
Expected Life 20 40 50 40
Annualized Capital Cost per Year per MW $230,645 $326,737 $268,713 $521,412
Fixed O & M per Year per MW (1) $39,550 $24,690 $14,130 $93,280
Total Annual Capacity Cost per MW $270,195 $351,427 $282,843 $614,692 Footnotes:
(1) Energy Information Administration (April 2013a) Table 1, p.6
(2) International Energy Agency 2011, Executive Summary
(3) Weighted Average Cost of Capital = 7.5%
THE NET BENEFITS OF LOW AND NO-CARBON ELECTRICITY TECHNOLOGIES 13
In addition to the capacity cost of a renewable en-
ergy project, wind and solar projects have additional
system costs. Since both wind and energy are highly
variable over time, such projects impose additional
“balancing costs”—costs of balancing the periodic
fluctuations with spinning reserves in order to avoid
excessive voltage fluctuations. Using wind and so-
lar also causes non-renewable energy production
facilities to start up and shut down more frequently,
reducing the energy efficiency of the non-renewable
units and increasing the cost of repair and mainte-
nance, known as “cycling costs.” However, the effect
of cycling and balancing costs is quite small. A study
by Ellerman and Marcantonini (May, 2013) found that
balancing costs are around 2 euros per MWH for wind.
Van Bergh and others (2013) show that variability in
renewable energy production adds little to the normal
variability of residual electricity demand, suggesting
that the cycling and balancing costs are quite modest.
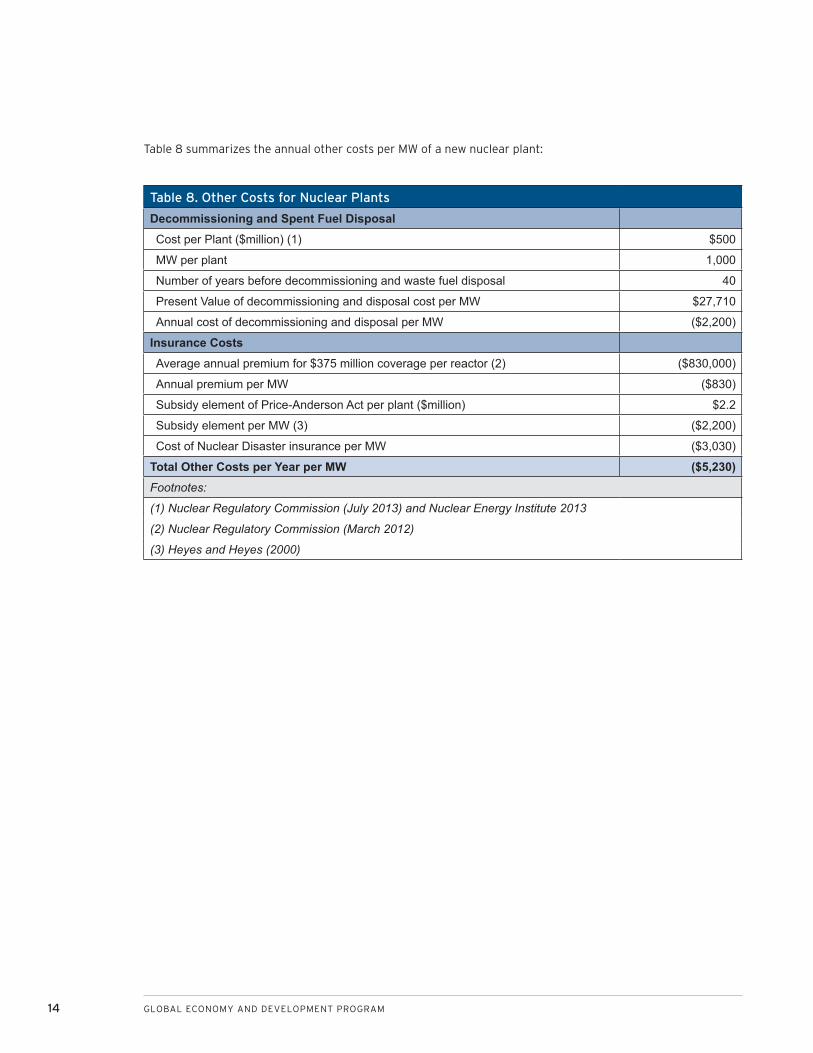
Nuclear plants also have additional costs, including
nuclear decommissioning, spent fuel disposal costs
and disaster insurance. The average cost of decom-
missioning a nuclear plant is approximately $300 to
$400 million according to the U.S. Nuclear Regulatory
Commission (July 2013) and the cost of disposing of
spent fuel is another $100 million according to the
Nuclear Energy Institute (2013). On an annualized ba-
sis, this works out to an annual cost of $2,200 per MW.
According to the Nuclear Regulatory Commission
(March 2012) the cost of private disaster insurance
per year per MW is $830,000 per reactor. However,
the Price-Anderson Act, which was renewed in 2005
for another 20 years, provides government insur-
ance that is available once the private insurance limit
of $375 million is reached. The provisions of the act
amount to a government subsidy, which has been es-
timated by Heyes and Heyes (2000) to be in the order
of $2.2 million per reactor.
OTHER COSTS INCURRED
14 GLOBAL ECONOMY AND DEVELOPMENT PROGRAM
Table 8 summarizes the annual other costs per MW of a new nuclear plant:
Table 8. Other Costs for Nuclear Plants
Decommissioning and Spent Fuel DisposalCost per Plant ($million) (1) $500
MW per plant 1,000
Number of years before decommissioning and waste fuel disposal 40
Present Value of decommissioning and disposal cost per MW $27,710
Annual cost of decommissioning and disposal per MW ($2,200)
Insurance CostsAverage annual premium for $375 million coverage per reactor (2) ($830,000)
Annual premium per MW ($830)
Subsidy element of Price-Anderson Act per plant ($million) $2.2
Subsidy element per MW (3) ($2,200)
Cost of Nuclear Disaster insurance per MW ($3,030)
Total Other Costs per Year per MW ($5,230)Footnotes:
(1) Nuclear Regulatory Commission (July 2013) and Nuclear Energy Institute 2013
(2) Nuclear Regulatory Commission (March 2012)
(3) Heyes and Heyes (2000)
THE NET BENEFITS OF LOW AND NO-CARBON ELECTRICITY TECHNOLOGIES 15
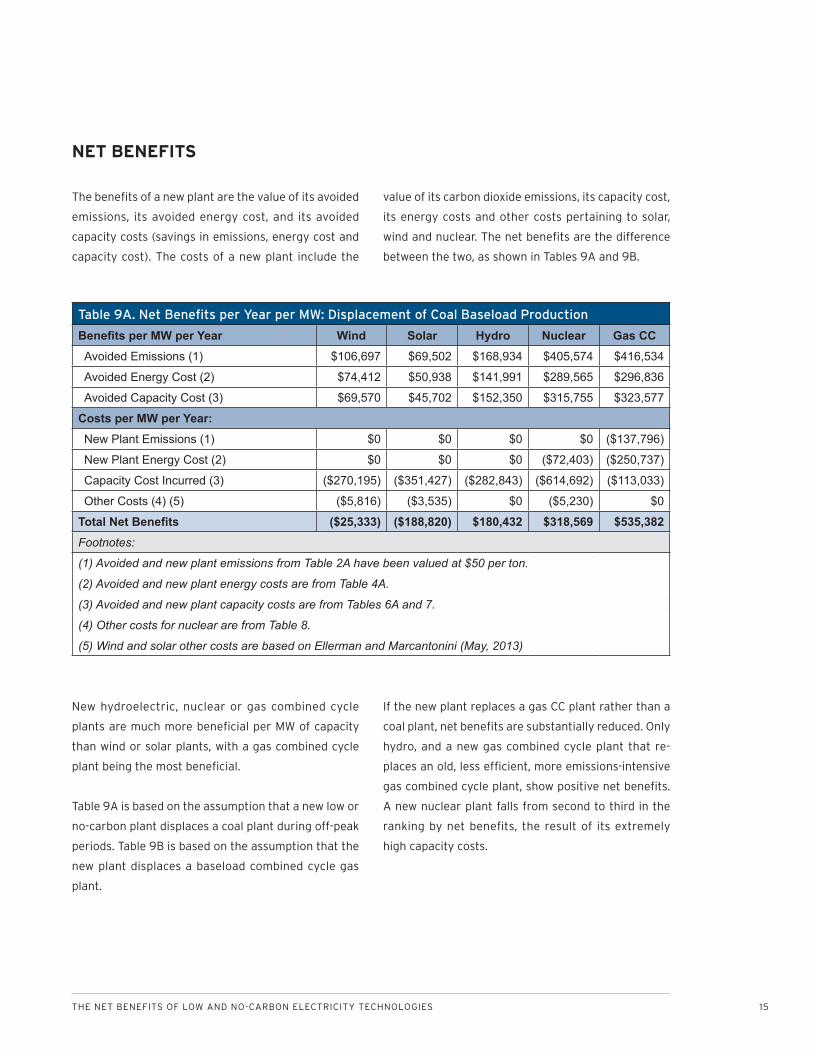
The benefits of a new plant are the value of its avoided
emissions, its avoided energy cost, and its avoided
capacity costs (savings in emissions, energy cost and
capacity cost). The costs of a new plant include the
value of its carbon dioxide emissions, its capacity cost,
its energy costs and other costs pertaining to solar,
wind and nuclear. The net benefits are the difference
between the two, as shown in Tables 9A and 9B.
NET BENEFITS
Table 9A. Net Benefits per Year per MW: Displacement of Coal Baseload Production
Benefits per MW per Year Wind Solar Hydro Nuclear Gas CCAvoided Emissions (1) $106,697 $69,502 $168,934 $405,574 $416,534
Avoided Energy Cost (2) $74,412 $50,938 $141,991 $289,565 $296,836
Avoided Capacity Cost (3) $69,570 $45,702 $152,350 $315,755 $323,577
Costs per MW per Year:New Plant Emissions (1) $0 $0 $0 $0 ($137,796)
New Plant Energy Cost (2) $0 $0 $0 ($72,403) ($250,737)
Capacity Cost Incurred (3) ($270,195) ($351,427) ($282,843) ($614,692) ($113,033)
Other Costs (4) (5) ($5,816) ($3,535) $0 ($5,230) $0
Total Net Benefits ($25,333) ($188,820) $180,432 $318,569 $535,382 Footnotes:
(1) Avoided and new plant emissions from Table 2A have been valued at $50 per ton.
(2) Avoided and new plant energy costs are from Table 4A.
(3) Avoided and new plant capacity costs are from Tables 6A and 7.
(4) Other costs for nuclear are from Table 8.
(5) Wind and solar other costs are based on Ellerman and Marcantonini (May, 2013)
New hydroelectric, nuclear or gas combined cycle
plants are much more beneficial per MW of capacity
than wind or solar plants, with a gas combined cycle
plant being the most beneficial.
Table 9A is based on the assumption that a new low or
no-carbon plant displaces a coal plant during off-peak
periods. Table 9B is based on the assumption that the
new plant displaces a baseload combined cycle gas
plant.
If the new plant replaces a gas CC plant rather than a
coal plant, net benefits are substantially reduced. Only
hydro, and a new gas combined cycle plant that re-
places an old, less efficient, more emissions-intensive
gas combined cycle plant, show positive net benefits.
A new nuclear plant falls from second to third in the
ranking by net benefits, the result of its extremely
high capacity costs.

16 GLOBAL ECONOMY AND DEVELOPMENT PROGRAM
Table 9B. Net Benefits per Year per MW: Displacement of Gas CC Baseload Production
Benefits per MW per Year Wind Solar Hydro Nuclear Gas CCAvoided Emissions (1) $43,552 $29,365 $78,712 $168,257 $172,580
Avoided Energy Cost (2) $80,868 $55,041 $151,215 $313,828 $321,777
Avoided Capacity Cost (3) $21,741 $17,636 $85,827 $111,776 $113,762
Costs per MW per Year:New Plant Emissions (1) $0 $0 $0 $0 ($137,796)
New Plant Energy Cost (2) $0 $0 $0 ($72,403) ($250,737)
Capacity Cost Incurred (3) ($270,195) ($351,427) ($282,843) ($614,692) ($113,033)
Other Costs (4) (5) ($5,816) ($3,535) $0 ($5,230) $0
Total Net Benefits ($129,852) ($252,920) $32,911 ($98,465) $106,554 Footnotes:
See footnotes to Table 9A substituting Tables 2B, 4B, and 6B for Tables 2A, 4A, and 6A.
Table 9C. Net Benefits with More Favorable Assumptions for Wind and Solar
Benefits per MW per Year Wind Solar Hydro Nuclear Gas CCAvoided Emissions (1) $284,526 $185,338 $337,867 $811,148 $833,069
Avoided Energy Cost (2) $98,925 $67,732 $141,680 $288,746 $295,994
Avoided Capacity Cost (3) $70,482 $46,425 $116,816 $240,284 $246,215
Costs per MW per Year:New Plant Emissions (1) $0 $0 $0 $0 ($275,592)
New Plant Energy Cost (2) $0 $0 $0 ($72,403) ($250,737)
Capacity Cost Incurred (3) ($162,867) ($181,434) ($195,058) ($455,843) ($87,574)
Other Costs (4) (5) ($7,755) ($4,713) $0 ($7,169) $0
Total Net Benefits $283,311 $113,349 $401,306 $804,763 $761,375 Footnotes:
(1) Avoided emissions from Table 3 have been valued at $100 per ton.
(2) Wind and solar other costs are based on Ellerman and Marcantonini (May, 2013)

THE NET BENEFITS OF LOW AND NO-CARBON ELECTRICITY TECHNOLOGIES 17
The results shown in Tables 9A and 9B are very robust
if we change some key assumptions to favor wind and
solar. For example, if we increase the price of carbon
to $100 per ton, reduce the cost of capital to 5 per-
cent, and reduce the capital cost and increase the
capacity factor of solar and wind by one-third, we get
the results shown in Table 9C.
A new nuclear plant becomes the most favored alter-
native. Wind and solar continue to rank fourth and fifth
among all the alternatives, mainly because of the very
high capacity cost and the very low capacity factors.
Furthermore, capacity factors in the United States
are much higher than those in some other countries,
suggesting that in those countries wind and solar are
even less economical. For example, in Germany the
average capacity factors for wind and solar between
2006 and 2010 were 18 percent and 8.1 percent, re-
spectively, compared to 25.5 percent and 15.5 percent,
respectively, in the United States (Federal Ministry for
the Environment Nature Conservation and Nuclear
Safety (Germany) 2012). In the U.K., wind capacity fac-
tors are about the same as in the United States, but
the average capacity factor for solar between 2008
and 2012 was only 8.3 percent, little more than half of
that in the United States (Department of Energy and
Climate Change (UK), Chapter 6, Table 6.4).
18 GLOBAL ECONOMY AND DEVELOPMENT PROGRAM
The net benefits of the various technologies are very
sensitive as to whether a new plant displaces a coal
plant or a gas CC plant. If a coal plant is shut down, the
avoided emissions and the avoided capacity costs are
greater than if a gas plant is shut down. The avoided
energy costs are less, but the value of the avoided
emissions and the avoided capacity costs outweigh
the energy cost benefits.
The decision as to whether to shut down or reduce the
output of a coal plant or a gas plant depends on the
price of natural gas relative to the price of coal and
the price attached to carbon dioxide emissions. The
decision also has a short-term and a long-term dimen-
sion. A new plant may replace gas-fired production in
the short term and coal-fired production in the longer
term. In the short term, the choice between coal-fired
or gas-fired production is based on short-term mar-
ginal cost, or the cost of producing energy from an
existing plant, the costs of which have already been
incurred. In the longer term, the choice between an in-
vestment in a coal plant or a gas plant is governed by
relative total cost, both capacity cost and energy cost.
Break-even Carbon Price in the Short Term
Net benefits in the short term depend on how vari-
ous plants within the system are chosen to be uti-
lized, or dispatched. Whether the dispatch system is
“command and control” or is determined by market
supply and demand for electricity, the dispatch of a
particular plant depends on the energy cost of elec-
tricity produced by the plant (where the energy cost
is the sum of the fuel cost per MWH plus variable op-
eration and maintenance cost per MWH). Wind, solar
and hydro plants have zero energy cost per MWH and
therefore are always likely to be dispatched, provided
the wind is blowing, the sun is shining or the water is
flowing. Nuclear plants have always had energy costs
much lower than those of fossil-fuel plants. Therefore
a nuclear plant is also always likely to be dispatched.
In recent years, nuclear plants have been running
at a capacity factor of about 90 percent (EIA 2009,
Table 5.2, p. 148). Thus variations in the demand for
electricity typically have been met by variations in the
dispatch of fossil-fuel plants, not wind, solar, hydro,
or nuclear plants that are likely already to be utilized.
What matters most is which kind of fossil fuel plant
is dispatched—one powered by coal or one powered
by natural gas. Historically gas prices per Btu have
been much higher than coal prices. Thus a coal plant
has been more likely to be dispatched than a gas-fired
plant. Under these circumstances, a new electricity
plant is less likely displace a high carbon emission coal
plant and more likely to displace a much lower carbon
emission gas CC plant. This perverse result from an
emissions standpoint can be remedied by a carbon tax
or a price for carbon emission allowances as shown in
Table 10A.
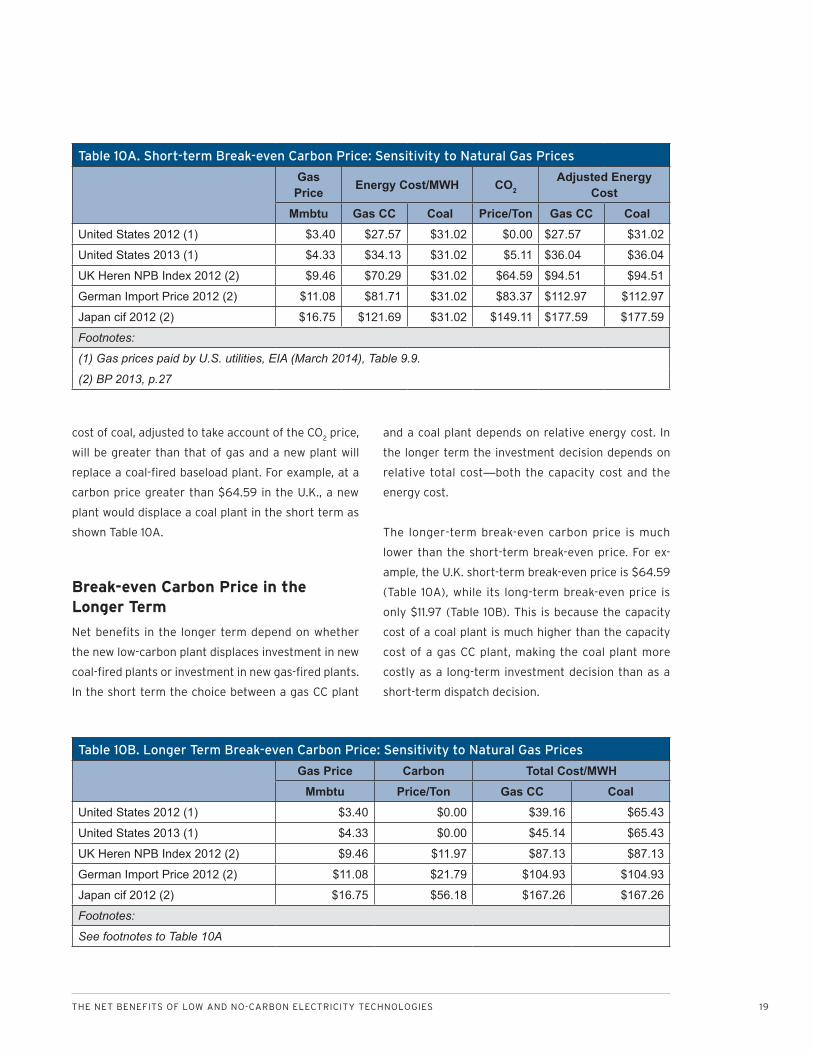
Without any cost of carbon emissions, and a natural
gas price of $3.40 per million Btu as in the United
States in 2012, the energy cost per MWH of a gas
CC plant ($27.57) is less than that of coal ($31.02).
However, the gas price in the United States in 2012
was atypically low. At higher gas prices in the United
States, the U.K., Germany and Japan, the energy cost
of a coal plant is much lower than that of a gas CC
plant. Thus most typically the energy cost of coal is
less than that of gas and a new low-carbon plant will
normally replace a gas CC plant. However, if a price
is attached to carbon dioxide emissions, the energy
DISPLACEMENT OF BASELOAD PRODUCTION
THE NET BENEFITS OF LOW AND NO-CARBON ELECTRICITY TECHNOLOGIES 19
cost of coal, adjusted to take account of the CO2 price,
will be greater than that of gas and a new plant will
replace a coal-fired baseload plant. For example, at a
carbon price greater than $64.59 in the U.K., a new
plant would displace a coal plant in the short term as
shown Table 10A.
Break-even Carbon Price in the Longer Term
Net benefits in the longer term depend on whether
the new low-carbon plant displaces investment in new
coal-fired plants or investment in new gas-fired plants.
In the short term the choice between a gas CC plant
and a coal plant depends on relative energy cost. In
the longer term the investment decision depends on
relative total cost—both the capacity cost and the
energy cost.
The longer-term break-even carbon price is much
lower than the short-term break-even price. For ex-
ample, the U.K. short-term break-even price is $64.59
(Table 10A), while its long-term break-even price is
only $11.97 (Table 10B). This is because the capacity
cost of a coal plant is much higher than the capacity
cost of a gas CC plant, making the coal plant more
costly as a long-term investment decision than as a
short-term dispatch decision.
Table 10A. Short-term Break-even Carbon Price: Sensitivity to Natural Gas Prices
Gas Price Energy Cost/MWH CO2
Adjusted Energy Cost
Mmbtu Gas CC Coal Price/Ton Gas CC CoalUnited States 2012 (1) $3.40 $27.57 $31.02 $0.00 $27.57 $31.02
United States 2013 (1) $4.33 $34.13 $31.02 $5.11 $36.04 $36.04
UK Heren NPB Index 2012 (2) $9.46 $70.29 $31.02 $64.59 $94.51 $94.51
German Import Price 2012 (2) $11.08 $81.71 $31.02 $83.37 $112.97 $112.97
Japan cif 2012 (2) $16.75 $121.69 $31.02 $149.11 $177.59 $177.59
Footnotes:
(1) Gas prices paid by U.S. utilities, EIA (March 2014), Table 9.9.
(2) BP 2013, p.27
Table 10B. Longer Term Break-even Carbon Price: Sensitivity to Natural Gas Prices
Gas Price Carbon Total Cost/MWHMmbtu Price/Ton Gas CC Coal
United States 2012 (1) $3.40 $0.00 $39.16 $65.43
United States 2013 (1) $4.33 $0.00 $45.14 $65.43
UK Heren NPB Index 2012 (2) $9.46 $11.97 $87.13 $87.13
German Import Price 2012 (2) $11.08 $21.79 $104.93 $104.93
Japan cif 2012 (2) $16.75 $56.18 $167.26 $167.26
Footnotes:
See footnotes to Table 10A

20 GLOBAL ECONOMY AND DEVELOPMENT PROGRAM
Sensitivity to Carbon Prices
In Tables 9A and 9B, the net benefits for both wind
and solar are negative. However, if the carbon price is
increased from $50 to $61.87 or above, then the net
benefits of wind are positive (as shown in Table 11).
Above $185.84, the net benefits of solar are also posi-
tive. This result is broadly consistent with the results
of Marcantonini and Ellerman (2013) for Germany.
They estimated that for 2006-2010 the cost of CO2
emission abatement for wind was 43 euros higher and
for solar 537 euros higher than the European Trading
System carbon price. Solar is less economical in
Germany than in the United States as German capac-
ity factors are well below those in the United States.
Table 11. Sensitivity of Net Benefits to Carbon Dioxide Prices (1)
CO2 Net Benefits of:Price Wind Solar Hydro Nuclear Gas CC$50.00 ($25,333) ($188,820) $180,432 $318,569 $535,382
$61.87 $0 ($172,318) $220,541 $414,863 $601,562
$185.84 $264,539 $0 $639,385 $1,420,420 $1,292,650
Footnotes:
(1) Displacement of Coal-Fired Baseload Plants and Gas Price of $4.33/mmbtu
Table 12. Sensitivity of Net Benefits to Natural Gas Prices (1)
Gas Net BenefitsPrice (2) Wind Solar Hydro Nuclear Gas CC
United States Henry Hub $2.76 ($28,058) ($191,546) $166,804 $305,623 $603,658
UK Heren NPB Index $9.46 ($16,427) ($179,914) $224,960 $360,871 $312,289
German Import Price $11.08 ($13,615) ($177,102) $239,022 $374,229 $241,839
Japan cif $16.75 ($3,772) ($167,259) $288,237 $420,984 ($4,737)
Footnotes:
(1) Displacement of Coal-Fired Baseload Plants and $50 CO2 Price
(2) 2012 average prices: BP 2013, p.27
Sensitivity to Natural Gas Prices
The results in Tables 9A and 9B are highly sensitive
to natural gas prices, which have been highly vari-
able, both over time and geographically. In the United
States, the average annual cost of natural gas to
electricity producers reached a high of $9.01 per mil-
lion Btu in 2008. The average monthly cost reached a
low of $2.68 in April 2012 (EIA, November 2013, Table
9.10.). The variation among countries, and the effect
on net benefits, is illustrated in Table 12.
At any price of natural gas below $16 per million Btu,
wind and solar rank fourth and fifth among the five
alternatives. At the Japanese price of $16.75, however,
natural gas CC ranks fourth. Regardless of the price
of natural gas, nuclear and hydro rank above wind
and solar and the net benefits of solar power are even
negative.

THE NET BENEFITS OF LOW AND NO-CARBON ELECTRICITY TECHNOLOGIES 21
Governments in both Europe and the United States
have instituted CO2 emission reduction policies of
three different types. First, they have adopted a wide
variety of renewable energy incentives such as feed-in
tariffs, production and investment tax credits, grants
and loan subsidies for renewable energy projects,
renewable energy targets, and tradable renewable
energy certificates. Second, they have introduced car-
bon trading systems designed to produce a market-
driven price for carbon dioxide emissions based on
government imposed emissions targets. Third, they
have instituted, or are in the process of instituting,
tighter regulations on emissions standards for coal-
fired generating plants.
Renewable Incentives
Renewable incentives in the United States and Europe
are available for wind, solar, small-scale hydro, bio-
mass and other renewable energy sources. Generally,
no incentive policies are available for other low or no-
carbon alternatives such as nuclear, large-scale hydro,
or gas combined cycle. Yet the results of this paper
demonstrate clearly that these three alternatives (as-
suming the price of gas is $16 per million Btu or less)
are far more cost effective per MW of capacity in re-
ducing carbon dioxide emissions than wind or solar. In
both the United States and Europe, there is political
opposition to all three of these alternatives on envi-
ronmental and safety grounds, despite their superior-
ity in reducing carbon dioxide emissions.
Renewable incentives in both Europe and the United
States rarely, if at all, make distinctions among renew-
able projects based on avoided emissions. For exam-
ple, auction awards for feed-in tariffs could be based
not just on cost but on cost less the value of avoided
emissions. Renewable Energy Certificates could be
granted not on the basis of MWH produced but on the
basis of avoided carbon dioxide emissions. These in-
centive programs would then become more effective
in reducing carbon emissions.
Carbon Trading Systems
There are two generally recognized methods of in-
troducing a price for carbon dioxide emissions: (1) a
carbon tax, and (2) a cap-and-trade system for enforc-
ing carbon dioxide emissions reduction targets. There
is relatively little support for a carbon tax in both
Europe and the United States. The European Union
has established a European Trading System for carbon
dioxide emission permits. In the United States, there
has been little progress in establishing a country-wide
carbon emission trading system, but a group of states
in New England and the state of California have been
successful in establishing regional carbon emission
trading systems.
The price of carbon emissions on the European
Trading system (ETS) reached a peak of 30 euros in
2006 and was trading below 5 euros at the end of
2013, far too low to make gas production more prof-
itable than coal production of electricity. The reduc-
tion in the ETS carbon emissions price, along with
increases in the price of natural gas in Europe, has
made coal more attractive as an energy source. The
experience in the U.K. reflects this trend. Between
2009 and 2012, U.K. natural gas prices almost doubled
(BP 2013, p. 27). Between 2011 and 2012 alone, the
natural gas share of electricity production fell from
40 percent to 28 percent, and the coal-fired share
increased from 30 percent to 39 percent. As a result,
carbon dioxide emissions from the power generation
IMPLICATIONS FOR CO2 EMISSION REDUCTION POLICIES
22 GLOBAL ECONOMY AND DEVELOPMENT PROGRAM
sector in the U.K. increased by 7.62 percent, despite
the economic recession and despite increased renew-
able energy production (Department of Energy and
Climate Change 2013, Table 5.1.2 and Department of
Energy and Climate Change, March 28, 2013, Table 17).
The need for a carbon price in the United States has
been less than in Europe in part because of lower
natural gas prices in the United States. Between 2008
and 2012 U.S. natural gas prices decreased by 68.9
percent; coal production decreased from 48.2 per-
cent to 37.4 percent; gas production increased from
21.4 percent to 30.3 percent; and emissions from the
electricity sector declined by 13.2 percent (BP 2013, p.
27 and EIA 2013a, Tables 3.1A and 9.1). The increase in
natural gas prices in 2013 and 2014, however, makes
gas less attractive than coal as a baseload production
alternative and could put an end to the increasing
share of natural gas in U.S. electricity production.
Prices in the California carbon market in 2013, its
first year of operation, ranged between $12 and $20,
enough to make natural gas more attractive than
coal, at least in California. Prices in the Regional
Greenhouse Gas Initiative (RGGI) carbon market,
however, have been consistently lower, less than or a
little more than $3 a ton since the first carbon allow-
ance auction in September 2008. However, in January
2014, RGGI announced a 45 percent reduction in the
target emissions level for 2014 to 91 million tons and
further annual reductions of 2.5 percent a year until
2020, all of which should substantially increase future
RGGI auction prices. If gas prices in the United States
continue to increase, higher carbon prices will be nec-
essary to keep carbon emissions from rising in the
RGGI region and California.
Tighter regulations
The United States has failed to adopt a national car-
bon emissions trading system because of political
opposition in the U.S. Congress. However, the U.S.
Environmental Protection Agency (EPA) has been for-
mulating tougher regulations under the Clean Air Act
of 1990, affecting mainly coal-fired electric generating
plants.
Some of the new regulations do not directly affect
the carbon dioxide emissions of fossil fuel plants, but
will increase the cost of electricity produced by coal-
fired plants. These new proposed regulations include
those that would reinstate EPA control of interstate
sulfur dioxide and nitrous oxide emissions, after the
U.S. Supreme Court in April 2014 overruled the ear-
lier decision of the U.S. Circuit Court of Appeals for
the District of Columbia that held such regulations to
be unconstitutional. Other regulations would include
standards for mercury and other air toxics; waste
water quality; and disposal of coal ash. The proposed
regulations would, in effect, have some of the same
impact on coal-fired plants as a carbon price (Beasley
and Morris, 2012).
On January 8, 2014, the EPA published in the U.S.
Federal Register a new set of much more radical pro-
posed regulations, directly aimed at establishing new
standards for carbon dioxide emissions from new
fossil-fuel fired electricity generating plants. The new
standards would require that new coal plants emit
no more than 1,100 pounds of CO2 per MWH and new
large gas combined cycle plants to emit no more than
1,000 pounds of CO2 per MWH. New combined cycle
gas plants can easily meet the new proposed standard
(as shown in Table 1). New coal plants, however, cannot
possibly meet the new standard without investments
in carbon capture and sequestration (CCS).

THE NET BENEFITS OF LOW AND NO-CARBON ELECTRICITY TECHNOLOGIES 23
CCS is very costly according to EIA cost estimates—
the capital cost of a coal CCS plant is 60 percent
greater and its fuel efficiency more than 33 percent
less than a conventional advanced pulverized coal
plant, excluding the cost of sequestration. The tech-
nology is unproven. If the CO2 captured is close to an
oil field being exploited using enhance oil recovery
techniques, then captured carbon has a ready use.
Without nearby enhanced oil recovery, the CO2 must
be sequestered in very deep geologic formations with
specific characteristics. There is no certainty that the
CO2 from these formations will not eventually leak
into the atmosphere. The transportation of the cap-
tured CO2 to such geologic formations requires new
pipelines that are expensive and difficult to permit. As
a practical matter, the implementation of the new pro-
posed EPA regulations would result in very few new
coal-fired electricity generation plants.
It is likely to be far less costly to achieve reductions in
carbon dioxide emissions through an effective carbon
trading system that allows the market to determine
the most effective way to reduce emissions rather
than through establishment of EPA standards for
emissions. For example, a new coal plant with 38.8
percent efficiency that replaces an old coal plant with
32.5 percent efficiency generates more avoided emis-
sions per MW per year than a solar plant, and more
net benefits than either solar or wind when the carbon
dioxide emission price is $50. The new proposed EPA
regulations would exclude this option from the elec-
tricity portfolio mix.
24 GLOBAL ECONOMY AND DEVELOPMENT PROGRAM
Assuming that reductions in carbon dioxide emissions
are valued at $50 per metric ton and the price of natu-
ral gas is not much greater than $16 per million Btu,
the net benefits of new nuclear, hydro, and natural gas
combined cycle plants far outweigh the net benefits
of new wind or solar plants. Wind and solar power are
very costly from a social perspective because of their
very high capacity cost, their very low capacity fac-
tors, and their lack of reliability.
For example, adjusting U.S. solar and wind capacity
factors to take account of lack of reliability, we es-
timate that it would take 7.30 MW of solar capacity,
costing roughly four times as much per MW to pro-
duce the same electrical output with the same degree
of reliability as a baseload gas combined cycle plant.
It requires an investment of approximately $29 mil-
lion in utility-scale solar capacity to produce the same
output with the same reliability as a $1 million invest-
ment in gas combined cycle. Reductions in the price
of solar photovoltaic panels have reduced costs for
utility-scale solar plants, but photovoltaic panels ac-
count for only a fraction of the cost of a solar plant.
Thus such price reductions are unlikely to make solar
power competitive with other electricity technologies
without government subsidies.
Wind plants are far more economical in reducing emis-
sions than solar plants, but much less economical
than hydro, nuclear and gas combined cycle plants.
Wind plants can operate at a capacity factor of 30
percent or more and cost about twice as much per
MW to build as a gas combined cycle plant. Taking ac-
count of the lack of wind reliability, it takes an invest-
ment of approximately $10 million in wind plants to
produce the same amount of electricity with the same
reliability as a $1 million investment in gas combined
cycle plants.
Renewable incentives work best if electricity produc-
ers face an internalized price for natural gas emis-
sions sufficiently high to discourage the use of coal
both for short-term and longer-term investment ho-
rizons. Since a highly efficient gas combined cycle
plant produces one-third of the emissions of a coal
plant per MWH, replacement of coal-fired production
by gas-fired plants can substantially reduce carbon
dioxide emissions. However, carbon dioxide emissions
prices are too low in both Europe and in the Regional
Greenhouse Gas Initiative in the United States to en-
courage the use of natural gas rather than coal. As a
result, for example, coal-fired electricity production
and emissions have increased in the U.K., despite sub-
stantial reliance on renewable incentives.
Increasing regulation by the U.S. Environmental
Protection Agency of mercury, sulfur dioxide and ni-
trous oxide emissions, waste water disposal, and ash
disposal will increase the cost of operating coal plants.
This regulation, combined with direct regulation of
carbon dioxide emissions from new and existing coal-
fired plants, as proposed or contemplated by the EPA,
can have some of the same effects as an internalized
carbon price. However, a carbon dioxide emissions
trading system with effective limits and adequate car-
bon prices is likely to be much less costly to electricity
producers and consumers than direct regulation of
carbon dioxide emissions.
SUMMARY AND CONCLUSIONS
THE NET BENEFITS OF LOW AND NO-CARBON ELECTRICITY TECHNOLOGIES 25
Apt, Jay and Aimee Cutright, “The Spectrum of Power
from Utility-Scale Wind Farms and Solar Voltaic
Arrays”, Working Paper CEIC-08-04, Carnegie
Mellon Electricity Industry Center, April 2008.
Baker E, Fowlie M, Lemoine D, and Reynolds SS.
2013. The Economics of Solar Electricity, Annual
Review of Resource Economics 5.
Beasley, Blair and Daniel Morris, “Modeling the
Electricity Sector: A Summary of Recent Analysis
of New EPA Regulations,” Resources for the
Future, RFF DP 12-52, November 2012.
British Petroleum (BP), Statistical Review of World
Energy 2013, http://www.bp.com/statisticalreview
Burtraw, Dallas, Karen Palmer, Clayton Munnings,
Paige Weber, and Matt Woerman, “Linking by
Degrees, Incremental Alignment of Cap-and-
Trade Markets, Resources for the Future”, RFF DP
13-04, April 2013.
Climate Policy Initiative, California Carbon Dashboard,
http://calcarbondash.org/?gclid=CLLczIvBgrwCF
ag7OgodIx0AqQ.
Department of Energy and Climate Change (UK),
Digest of United Kingdom Energy Statistics 2013.
Department of Energy and Climate Change (UK),
Emissions for 2012, Provisional Estimates, March
28. 2013, www.gov.uk/government/publications/
provisional-uk-emissions-estimates.
Department of Energy and Climate Change (UK),
National Renewable Energy Action Plan for the
United Kingdom, Article 4 of the Renewable en-
ergy Directive 2009/28/EC, no date.
Ellerman, A. Denny and Paul Joskow, “The European
Union’s Emission Trading System in Perspective”,
Pew Center on Global Climate Change, May 2008
Energy Information Administration (US), Electric
Power Annual 2009, April 2011
Energy Information Administration (US), Updated
Capital Cost Estimates for Utility Scale Electricity
Generating Plants, April 2013a.
Energy Information Administration (US), Annual
Energy Outlook 2013, April 2013b
Energy Information Administration (US), Monthly
Energy Review, March 2014
Energy Information Administration (US), Electric
Power Annual 2012, December 2013a
Energy Information Administration (US), Annual
Energy Outlook 2014, Early Release, December
2013b
Energy Information Administration (US), US Natural
Gas Liquid Composite Price, 2013, January 2014a,
http://www.eia.gov/dnav/ng/hist/ngm_epg0_plc_
nus_dmmbtuM.htm
Energy Information Administration (US), Henry Hub
Natural Gas Spot Price (Dollars per Million Btu),
January, 2014b. http://www.eia.gov/dnav/ng/hist/
rngwhhdm.htm
Environmental Protection Agency (US), “Standards
of Performance for Greenhouse Gas Emissions
from New Stationary Sources: Electric Utility
Generating Units,” proposed rule, Federal
Register, January 8, 2014.
REFERENCES

26 GLOBAL ECONOMY AND DEVELOPMENT PROGRAM
European Commission, “Report from the Commission
to the European Parliament, the Council, the
European Economic and Social Committee and
the Committee of the Regions: Renewable Energy
Progress Report”, Brussels, March 2013.
European Union, Energy Directive 2009.28/EC
Federal Ministry for the Environment Nature
Conservation and Nuclear Safety (Germany),
Renewable Energy Sources in Figures, National
and International Developments, 2012
Fell, Harrison, Joshua Linn, and Clayton Munnings,
“Designing Renewable Electricity Policies to
Reduce Emissions,” Resources for the Guture,
RFF DP 12-54, 2012.
Garver, L.L., “Effective Load Carrying Capability of
Generating Units,” IEEE Transactions on Power
Apparatus and Systems, vol. 85, no. 8, pp. 910-
920, August 1966.
Gowrisankaran, Gautam, Stanley S. Reynolds, and
Mario Samano, “Intermittency and the Value of
Renewable Energy”, National Bureau of Economic
Research Working Paper 17086, May 2011
Gupta, Arjun K. and Saralees Nadarajah, Handbook
of Beta Distribution and Its Applications, Denker
Series of Textbooks and Monographs, 2004
Hepburn, C., “Regulating by prices, quantities or both:
an update and an overview”. Oxford Review of
Economic Policy 22 (2): 226–247, 2006.
Heyes, Anthony and Catherine Liston Heyes, “An
Empirical Analysis of the Nuclear Liability
Act (1970) in Canada, Resource and Energy
Economics, 22, 2000, pp. 91-101.
Intergovernmental Panel on Climate Change,
“Renewable Energy Sources and Cl imate
Change”, Special Report, November 2012
International Energy Agency, Projected Costs of
Generating Electricity, 2010
International Energy Agency, Projected Costs
of Generating Electricity, 2011, Executive
Summary, http://www.iea.org/textbase/npsum/
ElecCostSUM.pdf
Joskow, Paul L., Comparing the Costs of Intermittent
and Dispatchable Generating Technologies
CEEPR Working Paper, (revised February 2011). A
short version appears in the American Economic
Review Papers and Proceedings 2011, 101(3):238-
241, May 2011.
Lannoye, Eamonn; Michael R. Milligan, John Adams,
Aidan Tuohy, Hugo Chandler, Damian Flynn,
and O’Malley, Mark, “Integration of Variable
Generation : Capacity Value and Evaluation of
Flexibility”, Proceedings of 2010 IEEE Power and
Energy Society General Meeting, July 2007.
Marcantonini, Claudio and A. Denny Ellerman, “The
Cost of Abating CO2 Emissions by Renewable
Energy Incentives in Germany”, Robert Schuman
Center for Advanced Studies, European
Universtiy Institute, Working Paper RSCAS
2013/05, May 2013
Milligan, M. and B. Parsons, “A Comparison and Case
Study of Capacity Credit Algorithms for Wind
Power Plants,” Journal of Wind Engineering, vol.
23, no. 3, 1999.
Milligan, M. and K. Porter, “Wind Capacity Credit in
the United States,” in Proceedings of the IEEE
THE NET BENEFITS OF LOW AND NO-CARBON ELECTRICITY TECHNOLOGIES 27
Power and Electronics Society General Meeting,
Pittsburgh, 2008
Newbery, D., Memorandum Submitted by David
Newbery to the UK Parl iament House of
Commons, Environmental Audit Select commit-
tee, February 26, 2009
Nuclear Energy Institute, “Costs: Fuel, Operation,
Waste Disposal and Life Cycle”, 2013 http://www.
nei.org/Knowledge-Center/Nuclear-Statistics/
Costs-Fuel,-Operation,-Waste-Disposal-Life-Cycle
N u c l e a r R e g u l a t o r y C o m m i s s i o n ( U S ) ,
Decommissioning Nuclear Power Plants, July 10,
2013 http://www.nrc.gov/reading-rm/doc-collec-
tions/fact-sheets/decommissioning.html
Nuclear Regulatory Commission (US), Fact Sheet on
Nuclear Insurance and Disaster Relief Funds,
March 29, 2012 http://www.nrc.gov/reading-rm/
doc-collections/fact-sheets/funds-fs.html
Pérez-Arriaga, I. J. and C. Batlle, “Impacts of inter-
mittent renewables on electricity generation
system operation”, Economics of Energy and
Environmental Policy 1(2), 3–17, 2002
Poputoaia, Diana and Mathew Fripp, “European
Experience with Tradable Green Certificates
and Feed-in Tariffs for Renewable Electricity
Support”, Prepared for FPL, December 20, 2008.
Regional Greenhouse Gas Initiative, Auction Results,
http://www.rggi.org/market/co2_auctions/re-
sults.
Regional Greenhouse Gas Initiative, Press Release,
January 13, 2014, http://www.rggi.org/docs/
PressReleases/PR011314_AuctionNotice23.pdf.
Renewable Energy Research Laboratory, “Wind
Power: Capacity Factor, Intermittency, and
What Happens When the Wind Doesn’t Blow”,
University of Massachusetts Amherst, Wind en-
ergy Center, no date.
Reuters, “Analysis: Strong start for California car-
bon market but challenges loom”, December 20,
2013, http://www.reuters.com/article/2013/12/20/
us-california-carbon-market-analysis-idUSBRE-
9BJ17U20131220.
Rothwell, Geoffrey S., “Does the US Subsidize
Nuclear Power Insurance”, Stanford Institute for
Economic Policy Research, January, 2002
Siemens AG “Siemens pushes world record in effi-
ciency to over 60 percent while achieving maxi-
mum operating flexibility”, Press Release, 19 May
2011.
Troy, N., E. Denny, and M. O’Malley, “Base-load cycling
on a system with significant wind penetration,”
IEEE Transactions on Power Systems 25(2), 1088–
1097, 2010.
Van den Bergh, K; Delarue, E.; D’haeseleer, “The
Impact of Renewable Injections on Cycling of
Conventional Power Plants, European Energy
Market, 10th International Conference, May 2013,
pp. 1-8.
28 GLOBAL ECONOMY AND DEVELOPMENT PROGRAM
1. It is sometimes difficult to think of avoided costs
as a benefit. It may be easier to think of “avoided”
emissions, energy costs and capacity costs as
“savings” in emissions, energy costs, and capac-
ity costs.
2. There exists an extensive literature on the capac-
ity credit for a new solar or wind plant (Garver
1966, Lannoye et al 2007, Milligan and Parsons
2007, Milligan and Porter 2008). The capacity
credit is estimated using a model of the electri-
cal system to calculate an expected load carrying
capacity (ELCC). The new solar or wind capacity
allows some increase in the load on the system
without any decrease in reliability. The capacity
credit is the ratio of the allowed increase in sys-
tem load to the name-plate capacity of the new
plant.
3. We assume that the capital costs are incurred on
a straight-line basis, that is, the portion of the
capital cost incurred each month during construc-
tion is the same each month.
4. To calculate the adjusted capacity factors for wind,
solar and off-peak hydroelectric technologies, we
first calculated the mean and variance in annual
capacity factors using 10 years of data from the
EIA. With the estimates of mean and variance, we
were able to calculate the parameters required to
make an estimate of the 99 percent confidence
level using a Beta distribution. The Beta probabil-
ity distribution was used rather than the normal
distribution because the Beta distribution is for
random variables that are restricted between
zero and one. For a discussion of the properties
and application of the Beta distribution see Gupta
(2004). Ideally, estimates of the 99 percent con-
fidence level capacity factors should be based
on the variance of capacity factors over a much
shorter period than a year—hourly or less. The
variance would be greater for wind, solar and
hydro and the avoided capacity costs would be
lower if shorter time periods were used to make
the estimates. However, we do not have access to
such short-term data.
5. The calculations for on-peak avoided capacity
costs are slightly different than those for off-peak
avoided capacity costs. Instead of using the ratio
of the adjusted capacity factor of the new plant
to the adjusted capacity factor for an on-peak gas
simple cycle plant, we use the ratio of the adjust-
ed capacity factor of the new plant to the estimat-
ed adjusted availability factor of the on-peak gas
simple cycle plant. An on-peak gas simple cycle
plant is valuable not because of the electrical en-
ergy that it actually produces, but because of its
availability to produce power to meet peak-loads
when needed.
6. The cost of the lack of reliability for wind and so-
lar is probably underestimated here. As noted in
footnote 5 above, the data used to calculate the
variance in wind and solar capacity factors is not
fine enough and better data is likely to increase
the estimated variance. Furthermore, more work
needs to be done in estimating 99 percent confi-
dence level capacity factors for nuclear and fossil
fuel plants. Our estimates here are based on the
author’s experience in financing power plants but
are not backed up by hard data. If anything the
author believes that better data would increase
the adjusted capacity factors for nuclear and fos-
sil fuel plants.
ENDNOTES

The views expressed in this working paper do not necessarily reflect the official position of Brookings, its board or the advisory council members.
© 2014 The Brookings Institution
ISSN: 1939-9383

1775 Massachusetts Avenue, NW Washington, DC 20036 202-797-6000 www.brookings.edu/global