the molecular genetics of myelodysplastic...
TRANSCRIPT
The Molecular Genetics of Myelodysplastic Syndromes
Rafael Bejar MD, PhD
November 2nd, 2013
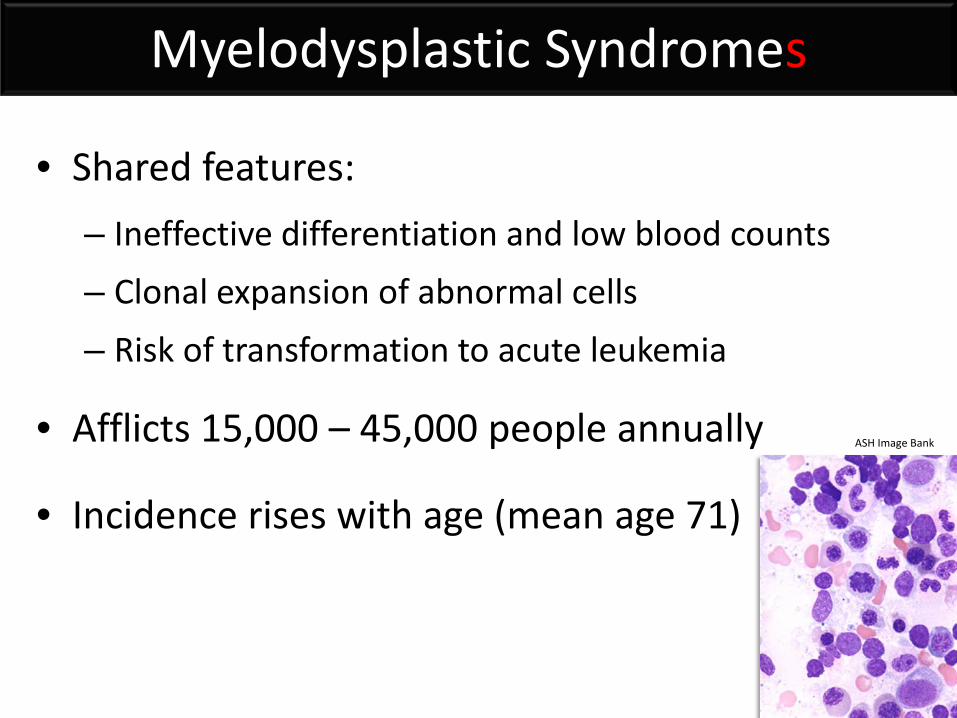
Myelodysplastic Syndromes
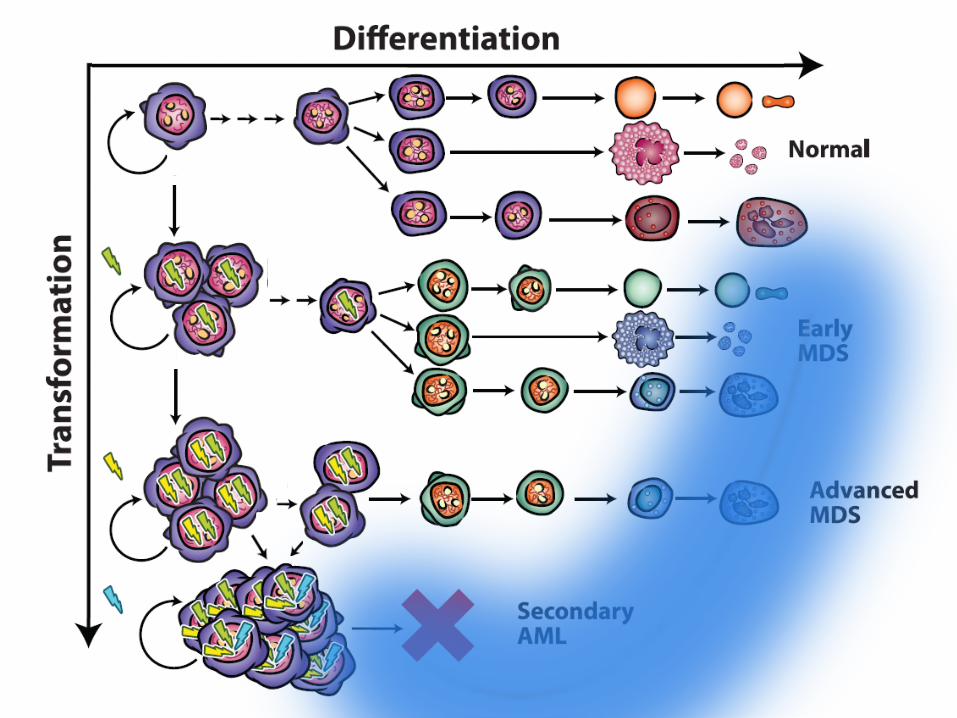
• Shared features: – Ineffective differentiation and low blood counts – Clonal expansion of abnormal cells – Risk of transformation to acute leukemia
• Afflicts 15,000 – 45,000 people annually
• Incidence rises with age (mean age 71)
ASH Image Bank
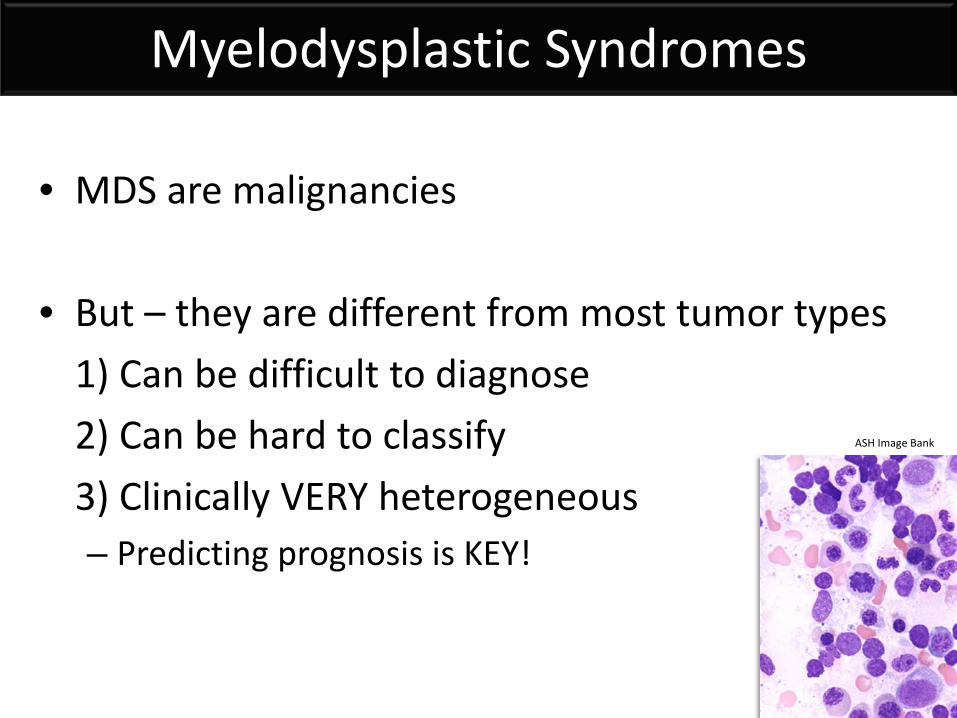
Myelodysplastic Syndromes
• MDS are malignancies • But – they are different from most tumor types 1) Can be difficult to diagnose 2) Can be hard to classify 3) Clinically VERY heterogeneous
– Predicting prognosis is KEY!
ASH Image Bank
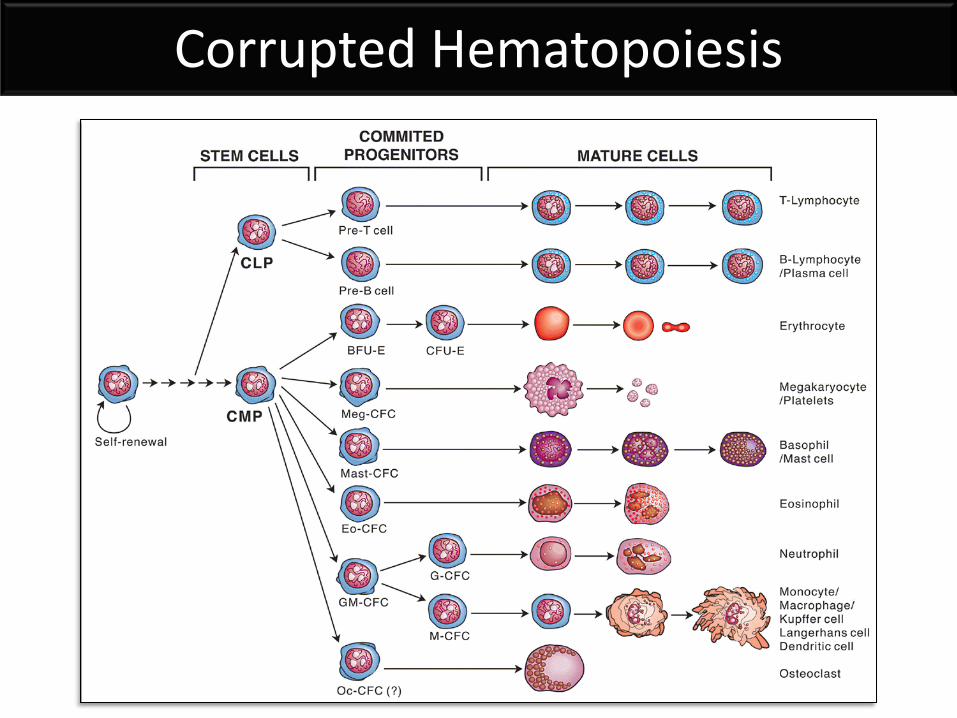
Corrupted Hematopoiesis
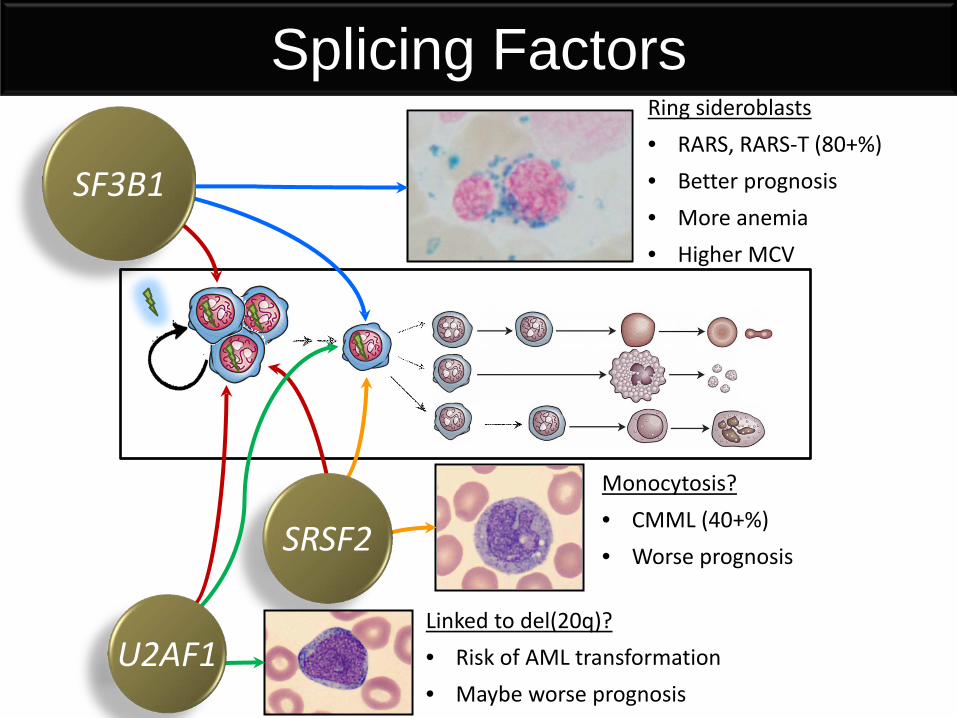
Splicing Factors Ring sideroblasts • RARS, RARS-T (80+%) • Better prognosis • More anemia • Higher MCV
Monocytosis? • CMML (40+%) • Worse prognosis
Linked to del(20q)? • Risk of AML transformation • Maybe worse prognosis
SRSF2
SF3B1
U2AF1
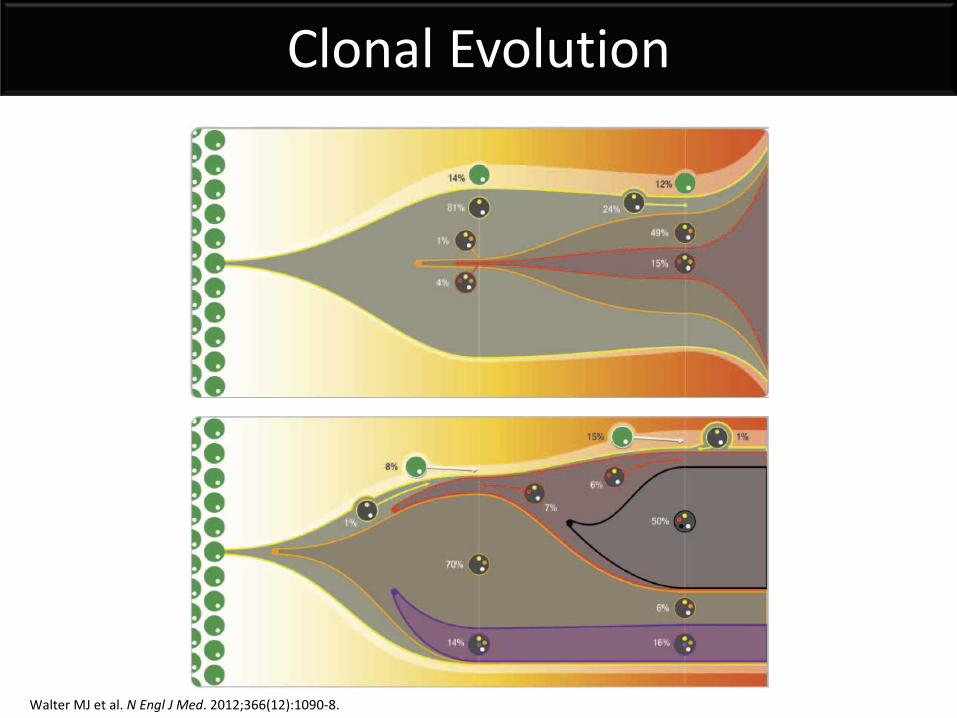
Clonal Evolution
Walter MJ et al. N Engl J Med. 2012;366(12):1090-8.
Genetic Abnormalities in MDS
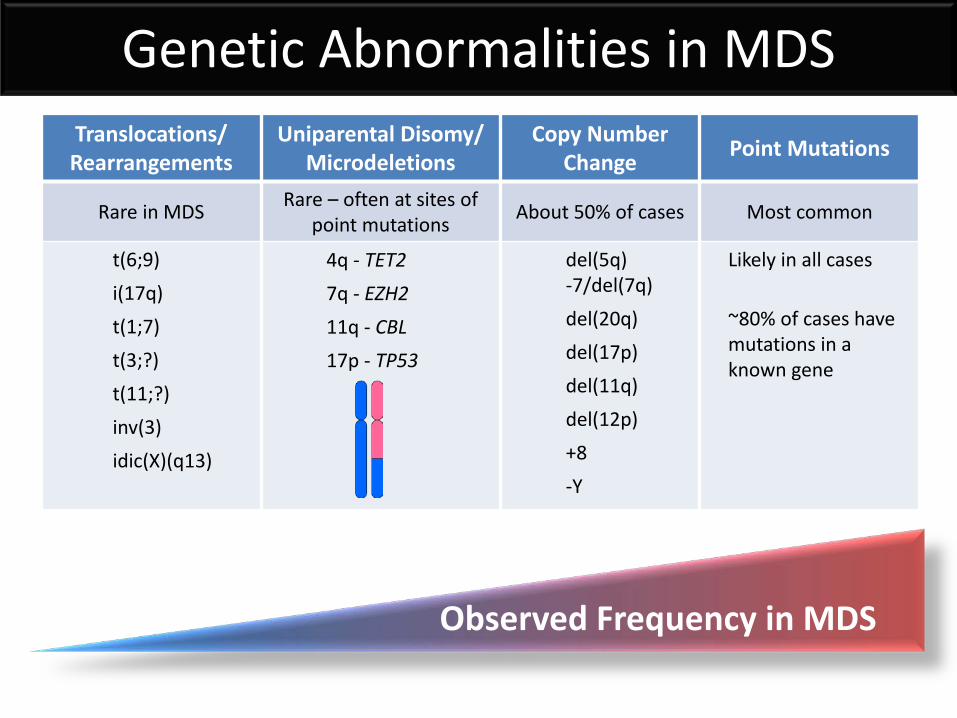
Observed Frequency in MDS
Genetic Abnormalities in MDS Translocations/ Rearrangements
Rare in MDS
t(6;9) i(17q) t(1;7) t(3;?) t(11;?) inv(3) idic(X)(q13)
Uniparental Disomy/ Microdeletions
Rare – often at sites of point mutations
4q - TET2 7q - EZH2 11q - CBL 17p - TP53
Copy Number Change
About 50% of cases
del(5q) -7/del(7q) del(20q) del(17p) del(11q) del(12p) +8 -Y
Point Mutations
Most common
Likely in all cases ~80% of cases have mutations in a known gene
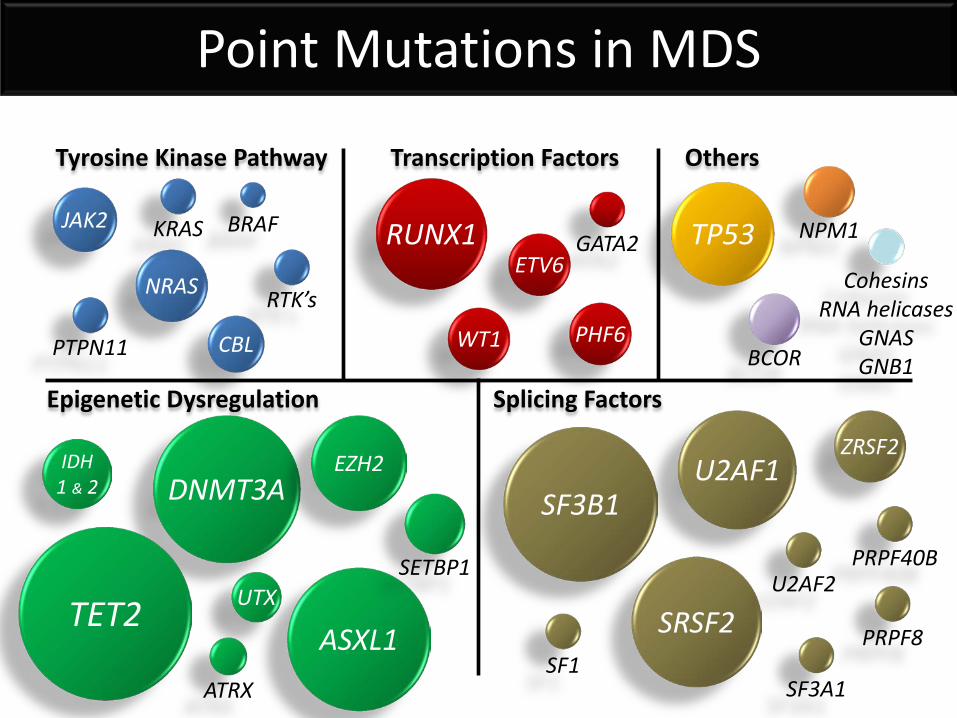
RUNX1 ETV6
WT1 PHF6
GATA2
DNMT3A EZH2
ASXL1
IDH 1 & 2
UTX
TP53
Transcription Factors Tyrosine Kinase Pathway
Epigenetic Dysregulation
SF3B1
Splicing Factors
JAK2
NRAS
BRAF
KRAS
RTK’s
PTPN11
Cohesins RNA helicases
GNAS GNB1
CBL
NPM1
ATRX
Others
SRSF2
U2AF1 ZRSF2
SETBP1
SF1
SF3A1
PRPF40B
U2AF2
PRPF8
BCOR
TET2
Point Mutations in MDS
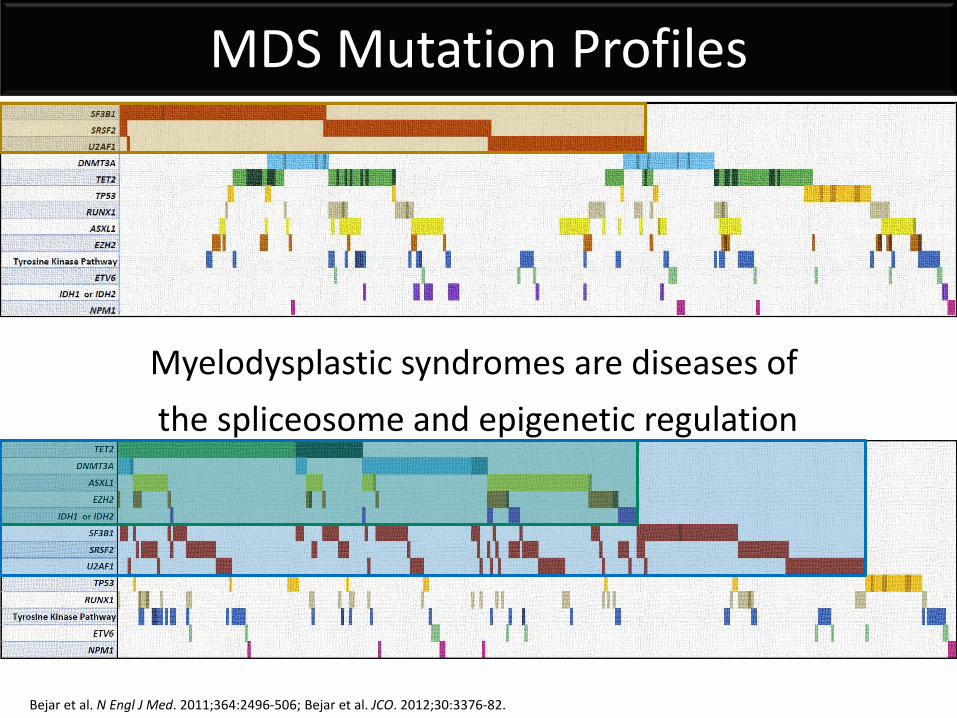
Myelodysplastic syndromes are diseases of the spliceosome and epigenetic regulation
MDS Mutation Profiles
Bejar et al. N Engl J Med. 2011;364:2496-506; Bejar et al. JCO. 2012;30:3376-82.

Molecular Mechanisms
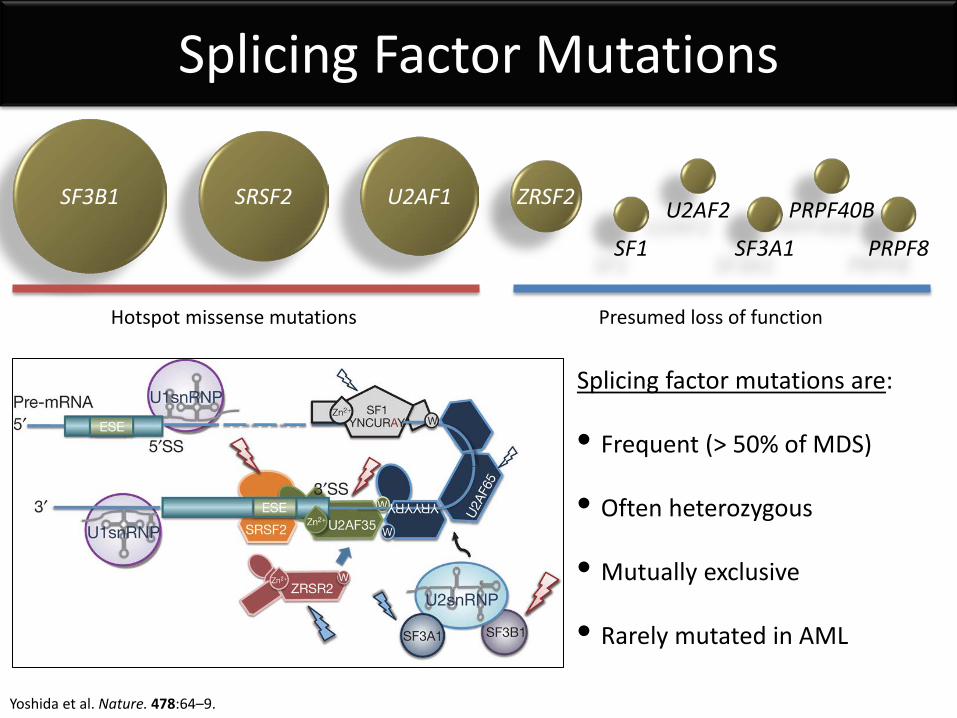
Splicing Factor Mutations
SF3B1 SRSF2 U2AF1 ZRSF2
SF1
SF3A1
PRPF40B
U2AF2
PRPF8
Yoshida et al. Nature. 478:64–9.
Splicing factor mutations are: • Frequent (> 50% of MDS)
• Often heterozygous
• Mutually exclusive
• Rarely mutated in AML
Hotspot missense mutations Presumed loss of function
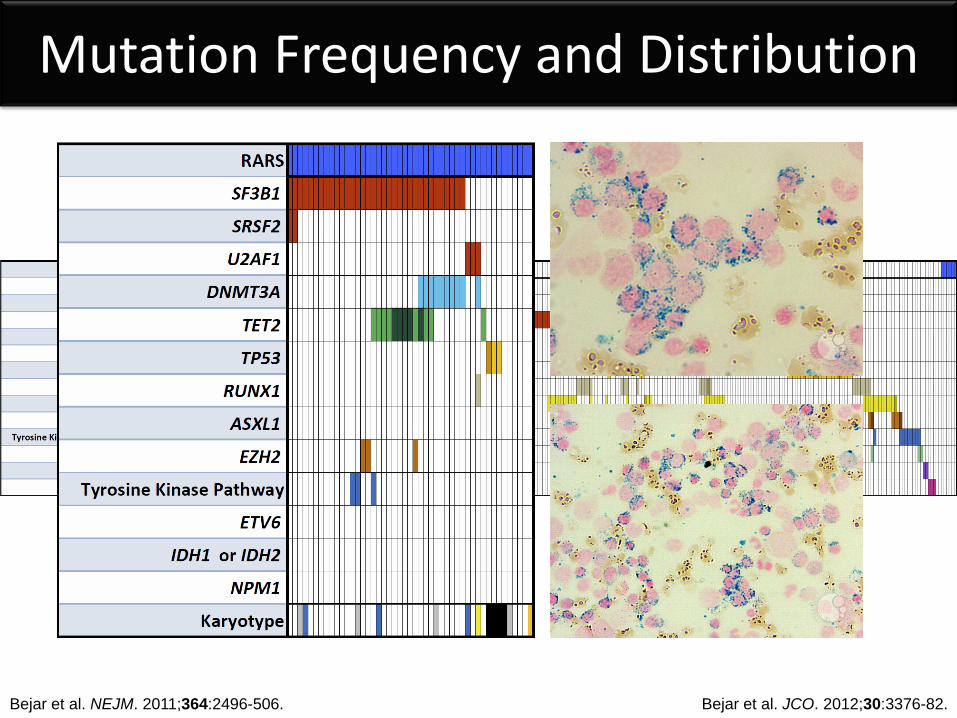
Bejar et al. NEJM. 2011;364:2496-506. Bejar et al. JCO. 2012;30:3376-82.
Mutation Frequency and Distribution
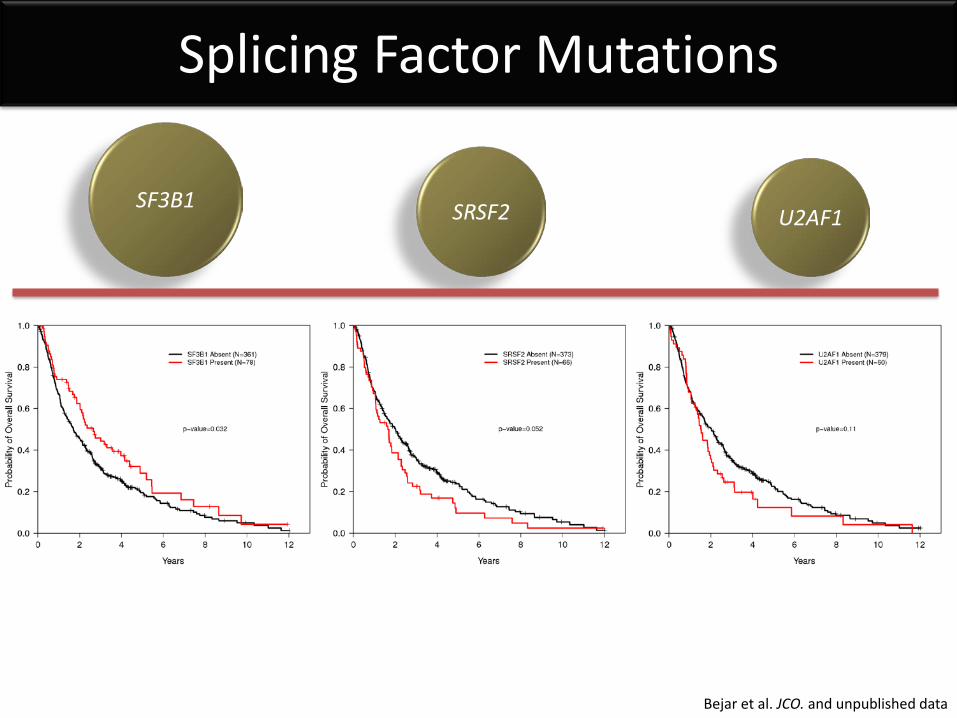
Splicing Factor Mutations
SF3B1 SRSF2 U2AF1
Bejar et al. JCO. and unpublished data
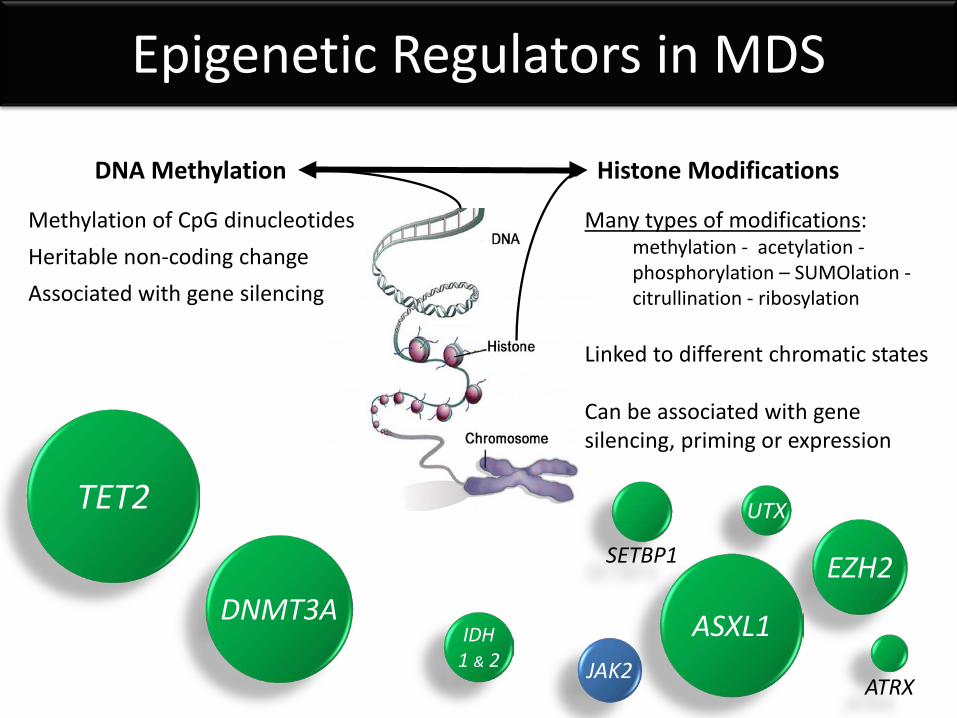
Epigenetic Regulators in MDS
DNA Methylation Histone Modifications
TET2
EZH2
ASXL1 IDH 1 & 2
UTX
ATRX
Methylation of CpG dinucleotides Heritable non-coding change Associated with gene silencing
JAK2
Many types of modifications: methylation - acetylation - phosphorylation – SUMOlation - citrullination - ribosylation
Linked to different chromatic states Can be associated with gene silencing, priming or expression
DNMT3A
SETBP1
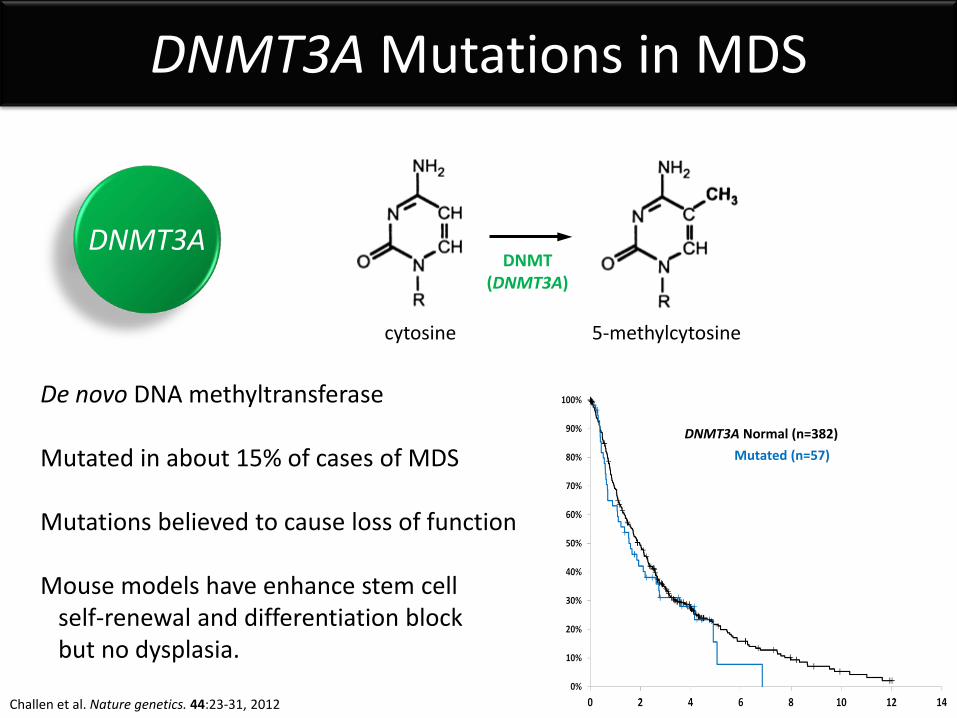
DNMT3A Mutations in MDS
DNMT3A DNMT
(DNMT3A)
cytosine 5-methylcytosine
De novo DNA methyltransferase Mutated in about 15% of cases of MDS Mutations believed to cause loss of function Mouse models have enhance stem cell self-renewal and differentiation block but no dysplasia.
DNMT3A Normal (n=382) Mutated (n=57)
Challen et al. Nature genetics. 44:23-31, 2012
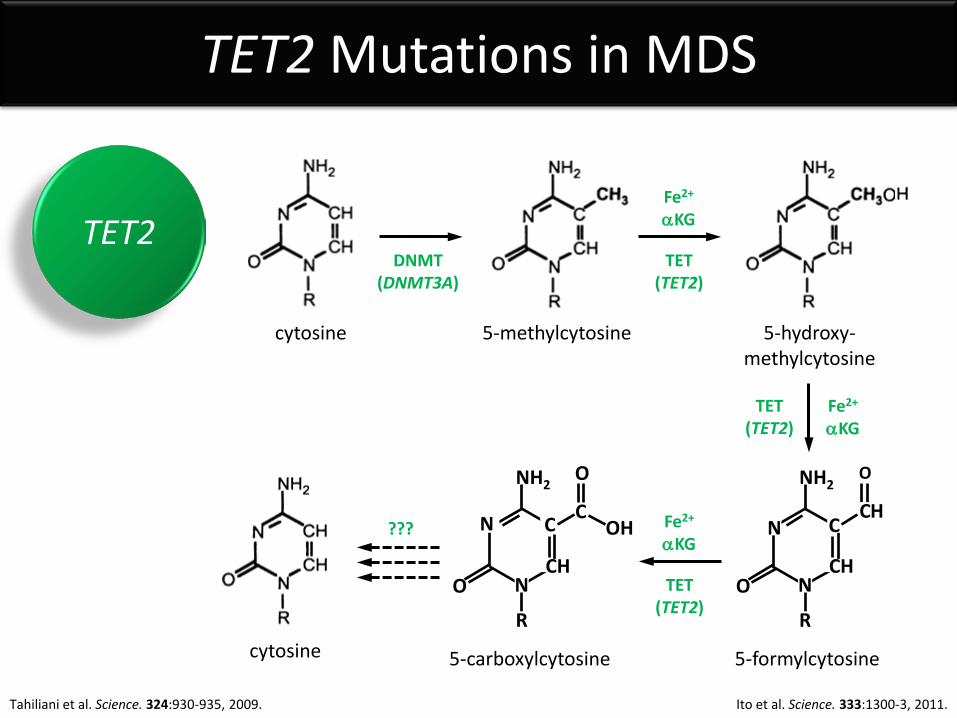
TET2 Mutations in MDS
TET2
N
NH2
N O
C
CH
R
C
O
OH
2
DNMT (DNMT3A)
TET (TET2)
cytosine 5-methylcytosine 5-hydroxy- methylcytosine
Fe2+
αKG
TET (TET2)
Fe2+
αKG
TET (TET2)
Fe2+
αKG
5-formylcytosine 5-carboxylcytosine cytosine
???
O
N
NH2
N O
C
CH
R
C H
Tahiliani et al. Science. 324:930-935, 2009. Ito et al. Science. 333:1300-3, 2011.
TET2 Mutations in MDS
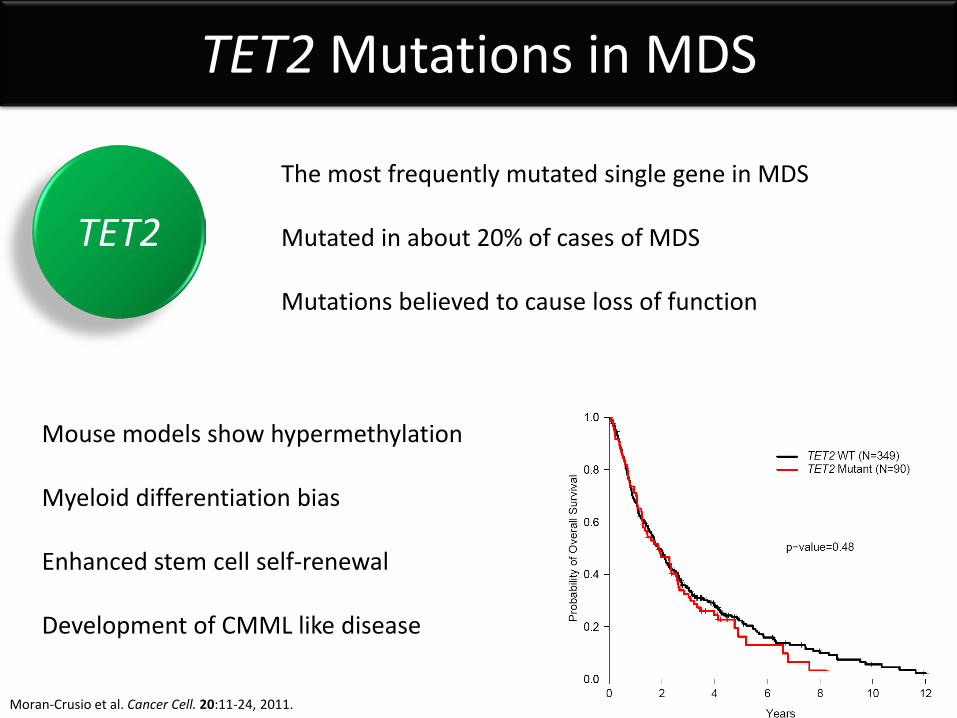
TET2 The most frequently mutated single gene in MDS Mutated in about 20% of cases of MDS Mutations believed to cause loss of function
Mouse models show hypermethylation Myeloid differentiation bias Enhanced stem cell self-renewal Development of CMML like disease
Moran-Crusio et al. Cancer Cell. 20:11-24, 2011.
TET (TET2)
5-methylcytosine 5-hydroxy- methylcytosine
αKG Fe2+
2
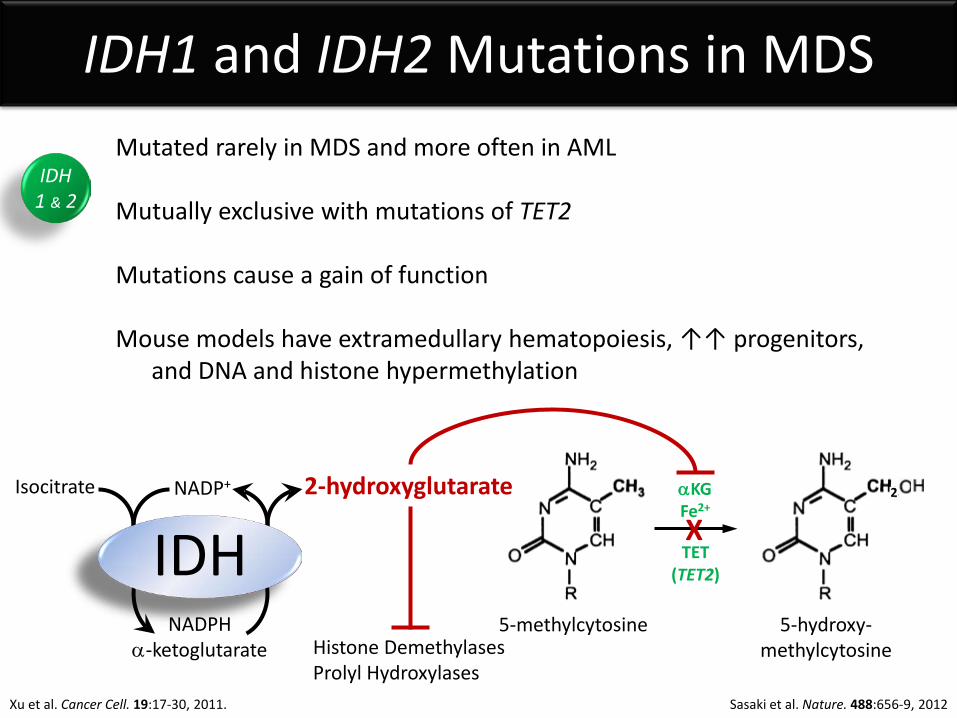
IDH1 and IDH2 Mutations in MDS Mutated rarely in MDS and more often in AML Mutually exclusive with mutations of TET2 Mutations cause a gain of function Mouse models have extramedullary hematopoiesis, ↑↑ progenitors, and DNA and histone hypermethylation
Isocitrate NADP+
NADPH α-ketoglutarate
2-hydroxyglutarate
IDH X
Histone Demethylases Prolyl Hydroxylases
IDH 1 & 2
Sasaki et al. Nature. 488:656-9, 2012 Xu et al. Cancer Cell. 19:17-30, 2011.
EZH2 Mutations in MDS
EZH2
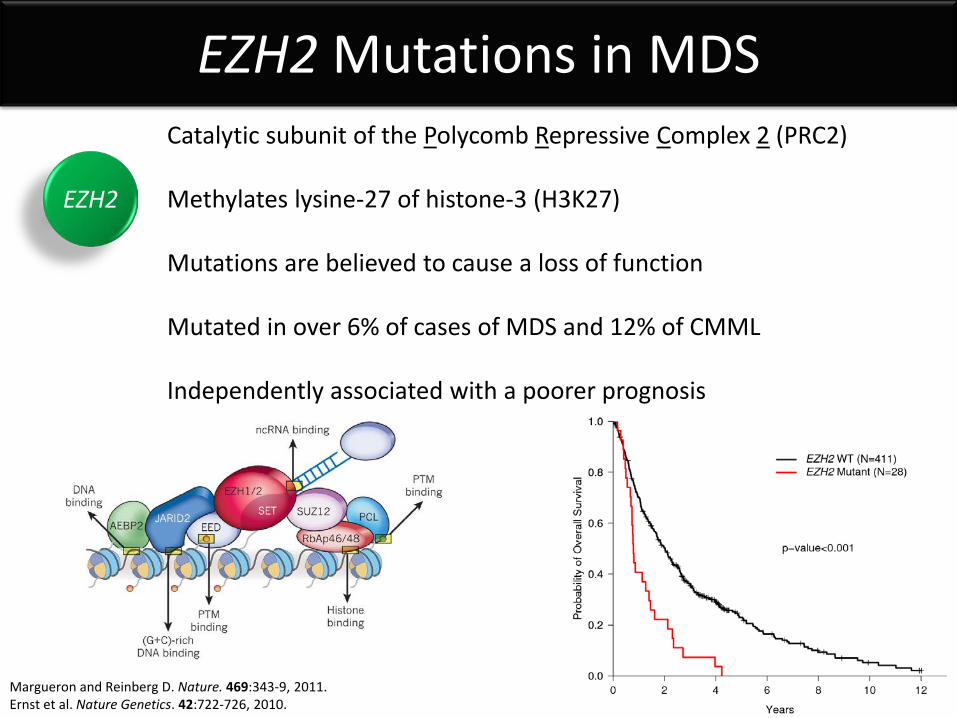
Catalytic subunit of the Polycomb Repressive Complex 2 (PRC2) Methylates lysine-27 of histone-3 (H3K27) Mutations are believed to cause a loss of function Mutated in over 6% of cases of MDS and 12% of CMML Independently associated with a poorer prognosis
Margueron and Reinberg D. Nature. 469:343-9, 2011. Ernst et al. Nature Genetics. 42:722-726, 2010.
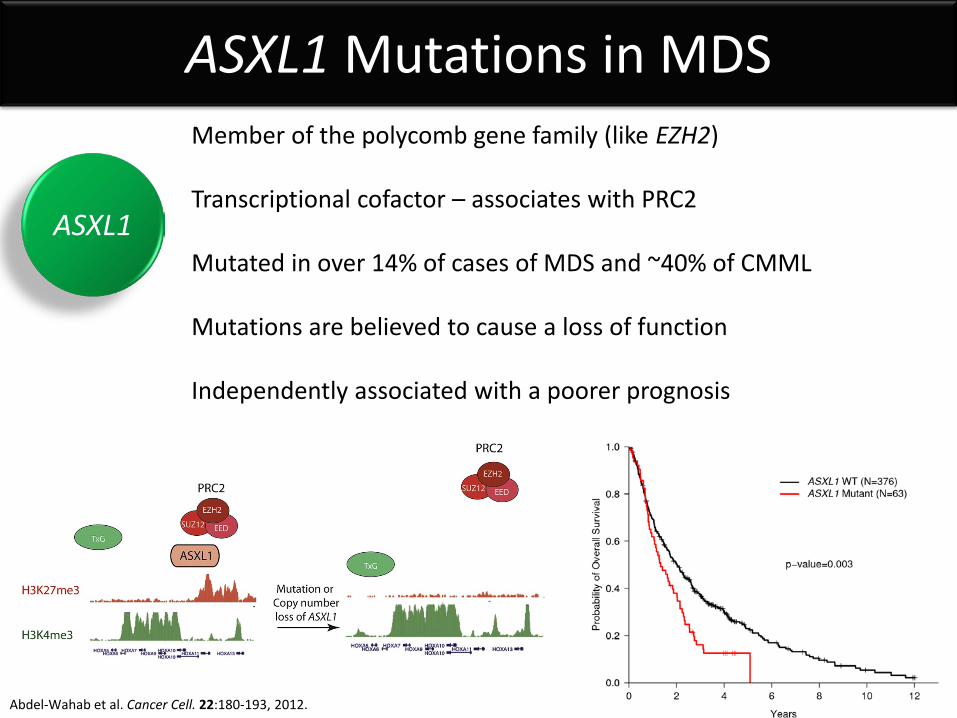
ASXL1 Mutations in MDS Member of the polycomb gene family (like EZH2) Transcriptional cofactor – associates with PRC2 Mutated in over 14% of cases of MDS and ~40% of CMML Mutations are believed to cause a loss of function Independently associated with a poorer prognosis
ASXL1
Abdel-Wahab et al. Cancer Cell. 22:180-193, 2012.
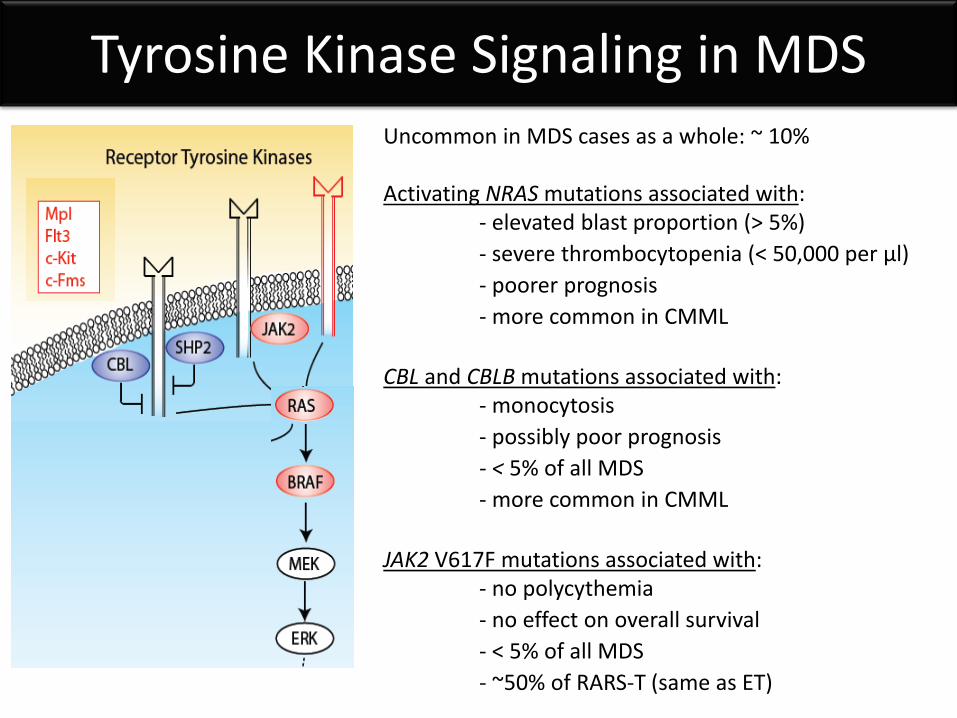
Tyrosine Kinase Signaling in MDS Uncommon in MDS cases as a whole: ~ 10% Activating NRAS mutations associated with: - elevated blast proportion (> 5%) - severe thrombocytopenia (< 50,000 per µl) - poorer prognosis - more common in CMML CBL and CBLB mutations associated with: - monocytosis - possibly poor prognosis - < 5% of all MDS - more common in CMML JAK2 V617F mutations associated with: - no polycythemia - no effect on overall survival - < 5% of all MDS - ~50% of RARS-T (same as ET)
Diagnosing MDS
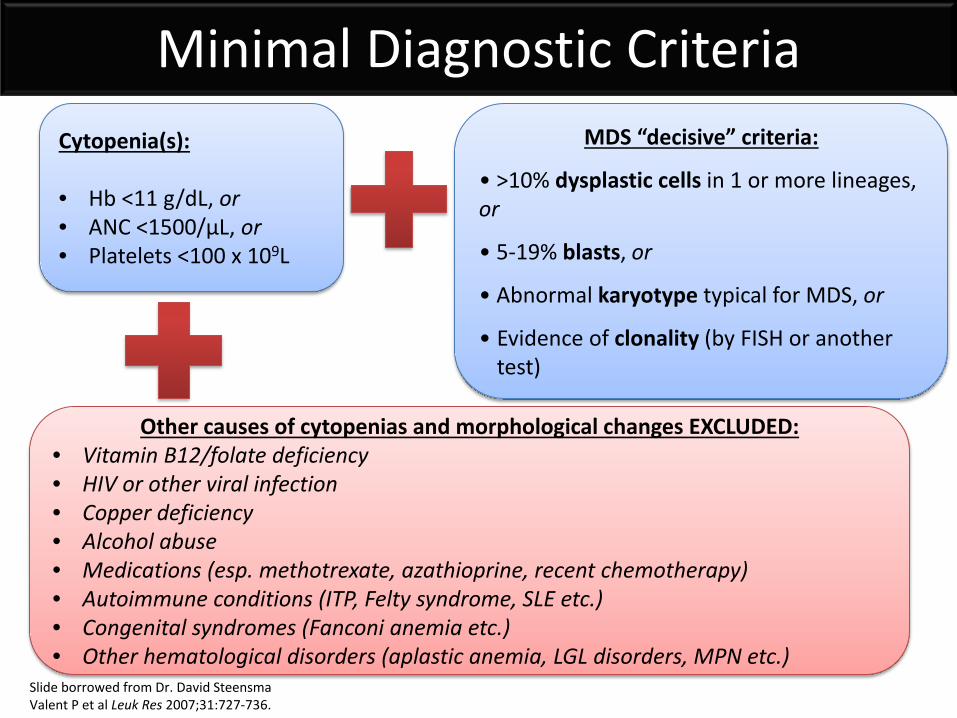
Cytopenia(s): • Hb <11 g/dL, or • ANC <1500/μL, or • Platelets <100 x 109L
MDS “decisive” criteria:
• >10% dysplastic cells in 1 or more lineages, or
• 5-19% blasts, or
• Abnormal karyotype typical for MDS, or
• Evidence of clonality (by FISH or another test)
Other causes of cytopenias and morphological changes EXCLUDED: • Vitamin B12/folate deficiency • HIV or other viral infection • Copper deficiency • Alcohol abuse • Medications (esp. methotrexate, azathioprine, recent chemotherapy) • Autoimmune conditions (ITP, Felty syndrome, SLE etc.) • Congenital syndromes (Fanconi anemia etc.) • Other hematological disorders (aplastic anemia, LGL disorders, MPN etc.)
Minimal Diagnostic Criteria
Slide borrowed from Dr. David Steensma Valent P et al Leuk Res 2007;31:727-736.
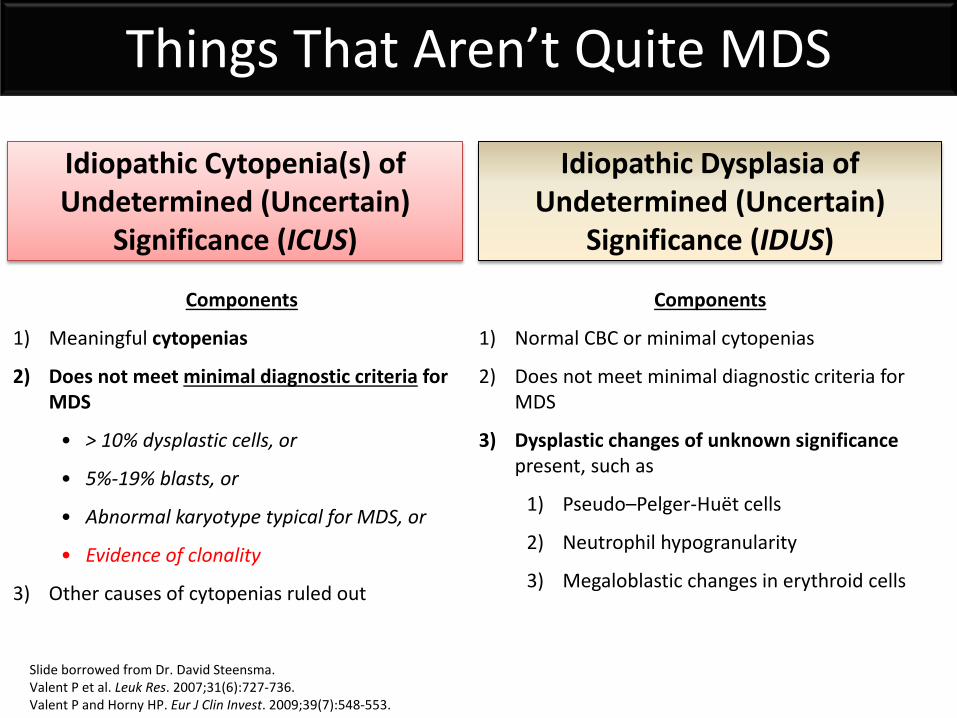
Idiopathic Cytopenia(s) of Undetermined (Uncertain)
Significance (ICUS)
Idiopathic Dysplasia of Undetermined (Uncertain)
Significance (IDUS)
Components
1) Meaningful cytopenias
2) Does not meet minimal diagnostic criteria for MDS
• > 10% dysplastic cells, or
• 5%-19% blasts, or
• Abnormal karyotype typical for MDS, or
• Evidence of clonality
3) Other causes of cytopenias ruled out
Components
1) Normal CBC or minimal cytopenias
2) Does not meet minimal diagnostic criteria for MDS
3) Dysplastic changes of unknown significance present, such as
1) Pseudo–Pelger-Huët cells
2) Neutrophil hypogranularity
3) Megaloblastic changes in erythroid cells
Things That Aren’t Quite MDS
Slide borrowed from Dr. David Steensma. Valent P et al. Leuk Res. 2007;31(6):727-736. Valent P and Horny HP. Eur J Clin Invest. 2009;39(7):548-553.
Classification of MDS Subtypes
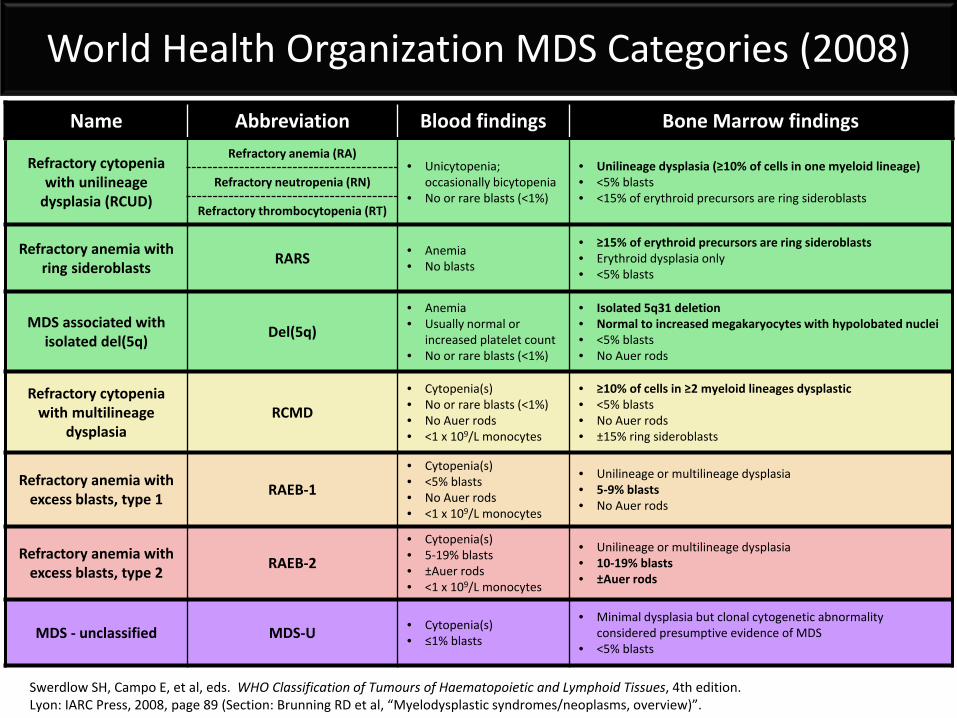
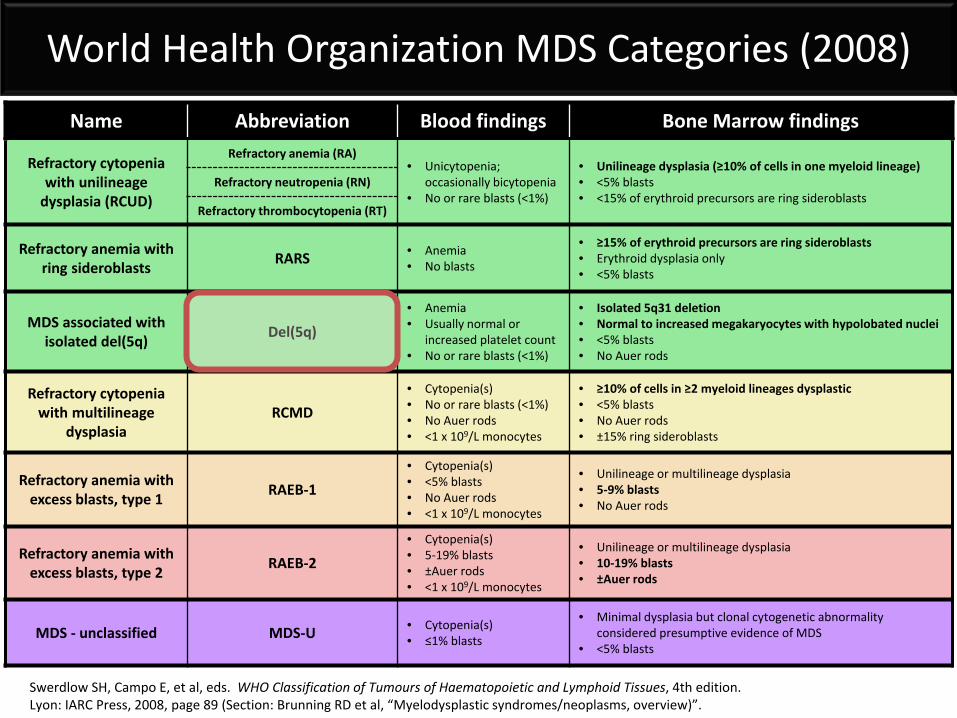
Name Abbreviation Blood findings Bone Marrow findings
Refractory cytopenia with unilineage
dysplasia (RCUD)
Refractory anemia (RA) • Unicytopenia;
occasionally bicytopenia • No or rare blasts (<1%)
• Unilineage dysplasia (≥10% of cells in one myeloid lineage) • <5% blasts • <15% of erythroid precursors are ring sideroblasts
Refractory neutropenia (RN)
Refractory thrombocytopenia (RT)
Refractory anemia with ring sideroblasts RARS • Anemia
• No blasts
• ≥15% of erythroid precursors are ring sideroblasts • Erythroid dysplasia only • <5% blasts
MDS associated with isolated del(5q) Del(5q)
• Anemia • Usually normal or
increased platelet count • No or rare blasts (<1%)
• Isolated 5q31 deletion • Normal to increased megakaryocytes with hypolobated nuclei • <5% blasts • No Auer rods
Refractory cytopenia with multilineage
dysplasia RCMD
• Cytopenia(s) • No or rare blasts (<1%) • No Auer rods • <1 x 10⁹/L monocytes
• ≥10% of cells in ≥2 myeloid lineages dysplastic • <5% blasts • No Auer rods • ±15% ring sideroblasts
Refractory anemia with excess blasts, type 1 RAEB-1
• Cytopenia(s) • <5% blasts • No Auer rods • <1 x 10⁹/L monocytes
• Unilineage or multilineage dysplasia • 5-9% blasts • No Auer rods
Refractory anemia with excess blasts, type 2 RAEB-2
• Cytopenia(s) • 5-19% blasts • ±Auer rods • <1 x 10⁹/L monocytes
• Unilineage or multilineage dysplasia • 10-19% blasts • ±Auer rods
MDS - unclassified MDS-U • Cytopenia(s) • ≤1% blasts
• Minimal dysplasia but clonal cytogenetic abnormality considered presumptive evidence of MDS
• <5% blasts
World Health Organization MDS Categories (2008)
Swerdlow SH, Campo E, et al, eds. WHO Classification of Tumours of Haematopoietic and Lymphoid Tissues, 4th edition. Lyon: IARC Press, 2008, page 89 (Section: Brunning RD et al, “Myelodysplastic syndromes/neoplasms, overview)”.
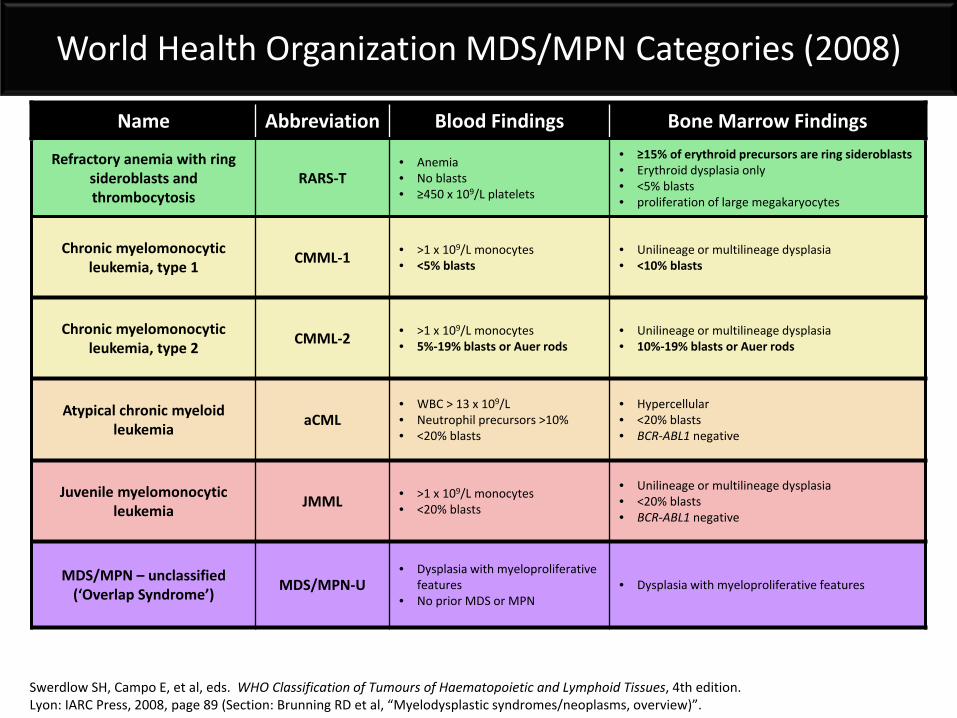
Name Abbreviation Blood Findings Bone Marrow Findings
Refractory anemia with ring sideroblasts and thrombocytosis
RARS-T • Anemia • No blasts • ≥450 x 109/L platelets
• ≥15% of erythroid precursors are ring sideroblasts • Erythroid dysplasia only • <5% blasts • proliferation of large megakaryocytes
Chronic myelomonocytic leukemia, type 1 CMML-1 • >1 x 10⁹/L monocytes
• <5% blasts • Unilineage or multilineage dysplasia • <10% blasts
Chronic myelomonocytic leukemia, type 2 CMML-2 • >1 x 10⁹/L monocytes
• 5%-19% blasts or Auer rods • Unilineage or multilineage dysplasia • 10%-19% blasts or Auer rods
Atypical chronic myeloid leukemia aCML
• WBC > 13 x 109/L • Neutrophil precursors >10% • <20% blasts
• Hypercellular • <20% blasts • BCR-ABL1 negative
Juvenile myelomonocytic leukemia JMML • >1 x 10⁹/L monocytes
• <20% blasts
• Unilineage or multilineage dysplasia • <20% blasts • BCR-ABL1 negative
MDS/MPN – unclassified (‘Overlap Syndrome’) MDS/MPN-U
• Dysplasia with myeloproliferative features
• No prior MDS or MPN • Dysplasia with myeloproliferative features
World Health Organization MDS/MPN Categories (2008)
Swerdlow SH, Campo E, et al, eds. WHO Classification of Tumours of Haematopoietic and Lymphoid Tissues, 4th edition. Lyon: IARC Press, 2008, page 89 (Section: Brunning RD et al, “Myelodysplastic syndromes/neoplasms, overview)”.
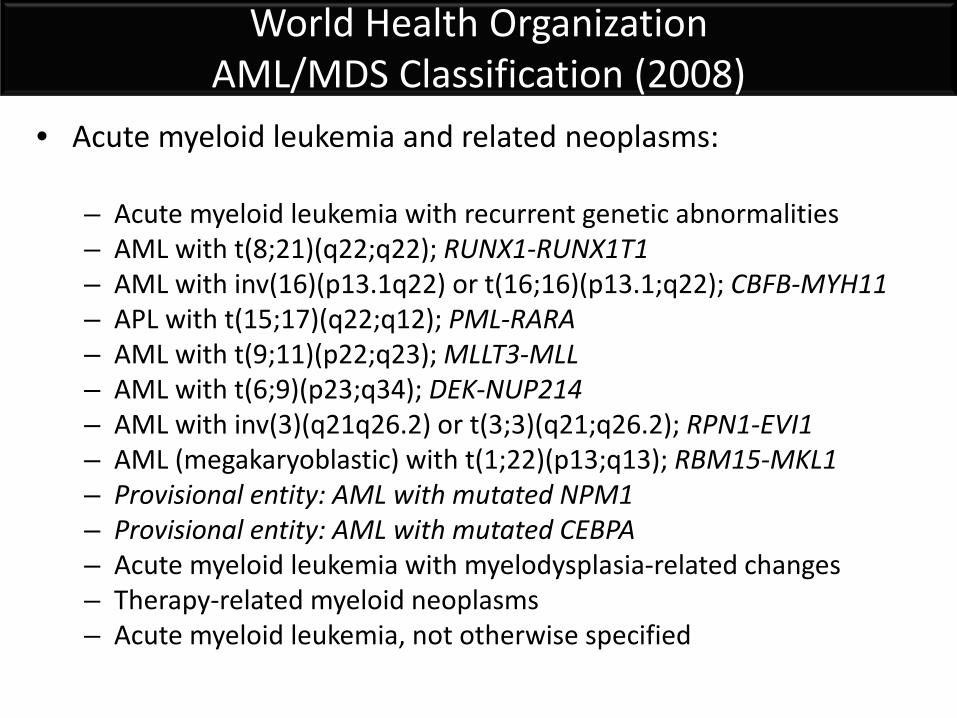
World Health Organization AML/MDS Classification (2008)
• Acute myeloid leukemia and related neoplasms:
– Acute myeloid leukemia with recurrent genetic abnormalities – AML with t(8;21)(q22;q22); RUNX1-RUNX1T1 – AML with inv(16)(p13.1q22) or t(16;16)(p13.1;q22); CBFB-MYH11 – APL with t(15;17)(q22;q12); PML-RARA – AML with t(9;11)(p22;q23); MLLT3-MLL – AML with t(6;9)(p23;q34); DEK-NUP214 – AML with inv(3)(q21q26.2) or t(3;3)(q21;q26.2); RPN1-EVI1 – AML (megakaryoblastic) with t(1;22)(p13;q13); RBM15-MKL1 – Provisional entity: AML with mutated NPM1 – Provisional entity: AML with mutated CEBPA – Acute myeloid leukemia with myelodysplasia-related changes – Therapy-related myeloid neoplasms – Acute myeloid leukemia, not otherwise specified
Name Abbreviation Blood findings Bone Marrow findings
Refractory cytopenia with unilineage
dysplasia (RCUD)
Refractory anemia (RA) • Unicytopenia;
occasionally bicytopenia • No or rare blasts (<1%)
• Unilineage dysplasia (≥10% of cells in one myeloid lineage) • <5% blasts • <15% of erythroid precursors are ring sideroblasts
Refractory neutropenia (RN)
Refractory thrombocytopenia (RT)
Refractory anemia with ring sideroblasts RARS • Anemia
• No blasts
• ≥15% of erythroid precursors are ring sideroblasts • Erythroid dysplasia only • <5% blasts
MDS associated with isolated del(5q) Del(5q)
• Anemia • Usually normal or
increased platelet count • No or rare blasts (<1%)
• Isolated 5q31 deletion • Normal to increased megakaryocytes with hypolobated nuclei • <5% blasts • No Auer rods
Refractory cytopenia with multilineage
dysplasia RCMD
• Cytopenia(s) • No or rare blasts (<1%) • No Auer rods • <1 x 10⁹/L monocytes
• ≥10% of cells in ≥2 myeloid lineages dysplastic • <5% blasts • No Auer rods • ±15% ring sideroblasts
Refractory anemia with excess blasts, type 1 RAEB-1
• Cytopenia(s) • <5% blasts • No Auer rods • <1 x 10⁹/L monocytes
• Unilineage or multilineage dysplasia • 5-9% blasts • No Auer rods
Refractory anemia with excess blasts, type 2 RAEB-2
• Cytopenia(s) • 5-19% blasts • ±Auer rods • <1 x 10⁹/L monocytes
• Unilineage or multilineage dysplasia • 10-19% blasts • ±Auer rods
MDS - unclassified MDS-U • Cytopenia(s) • ≤1% blasts
• Minimal dysplasia but clonal cytogenetic abnormality considered presumptive evidence of MDS
• <5% blasts
World Health Organization MDS Categories (2008)
Swerdlow SH, Campo E, et al, eds. WHO Classification of Tumours of Haematopoietic and Lymphoid Tissues, 4th edition. Lyon: IARC Press, 2008, page 89 (Section: Brunning RD et al, “Myelodysplastic syndromes/neoplasms, overview)”.

Prognostic Risk Assessment
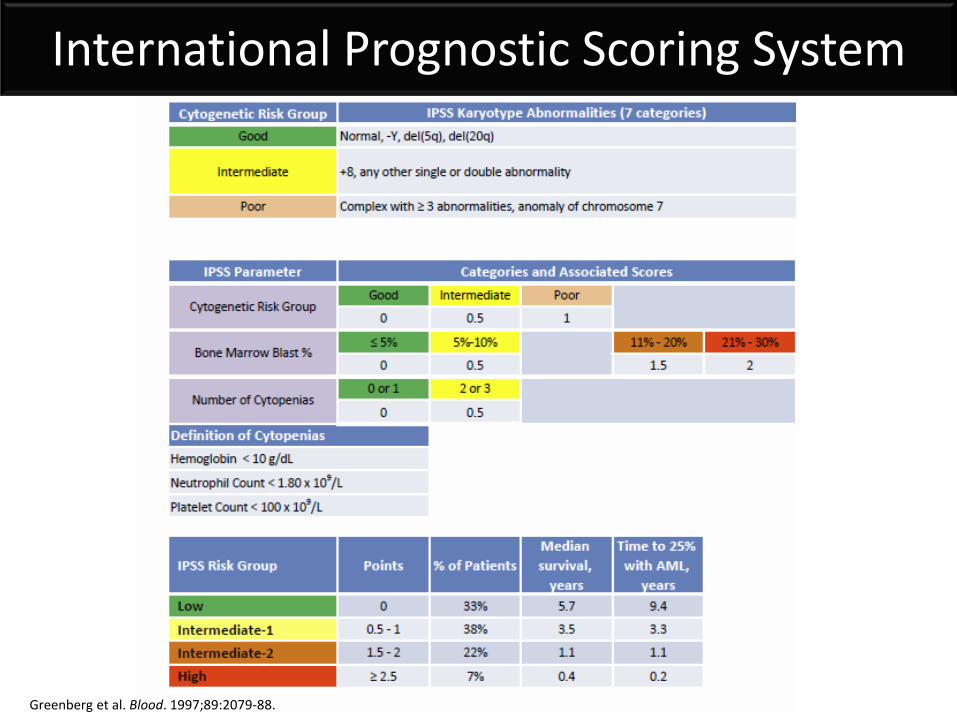
International Prognostic Scoring System
Greenberg et al. Blood. 1997;89:2079-88.
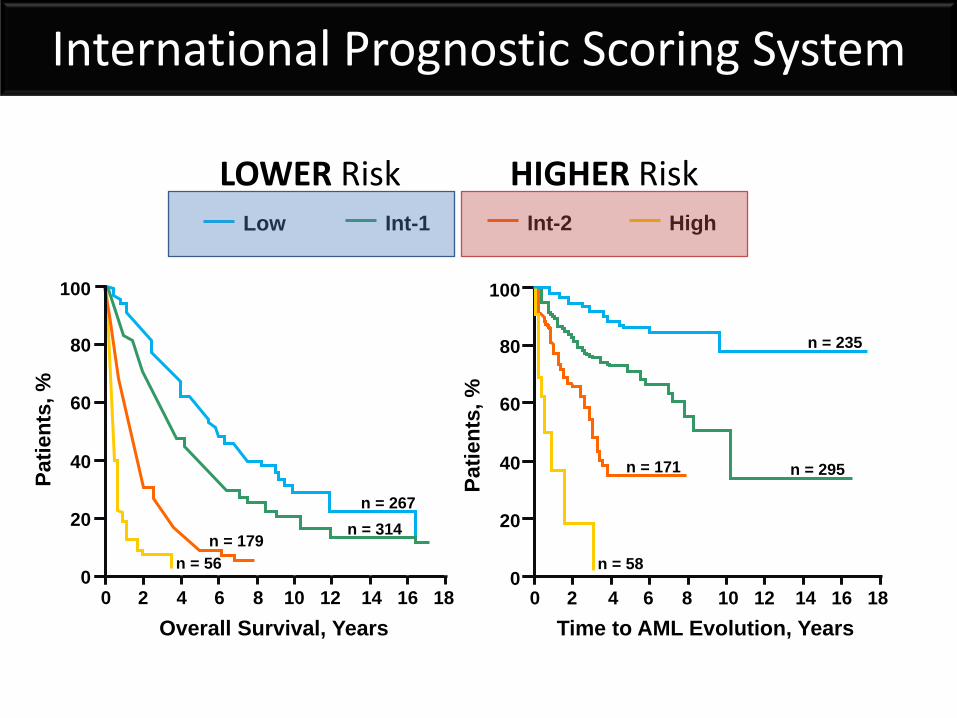
Low Int-1 Int-2 High
n = 56
n = 314 n = 179
n = 267
Patie
nts,
%
Overall Survival, Years 0 2 4 6 8 10 12 14 16 18
100
80
60
40
20
0
n = 295 n = 171
n = 58
n = 235
Patie
nts,
%
Time to AML Evolution, Years
100
80
60
40
20
0 0 2 4 6 8 10 12 14 16 18
LOWER Risk HIGHER Risk
International Prognostic Scoring System
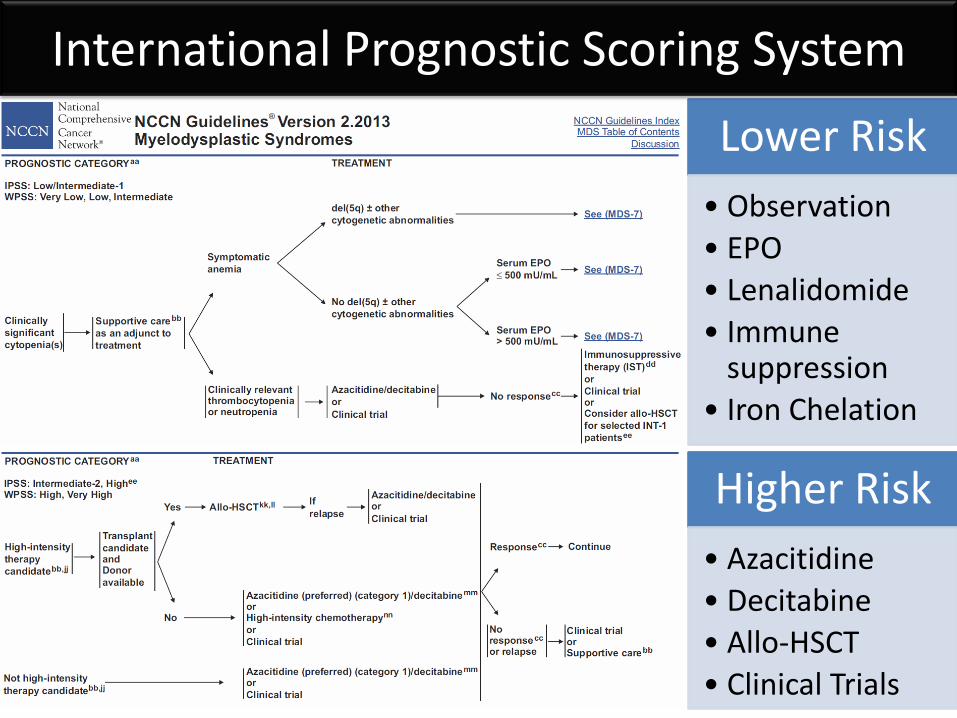
Lower Risk • Observation • EPO • Lenalidomide • Immune
suppression • Iron Chelation
Higher Risk • Azacitidine • Decitabine • Allo-HSCT • Clinical Trials
International Prognostic Scoring System
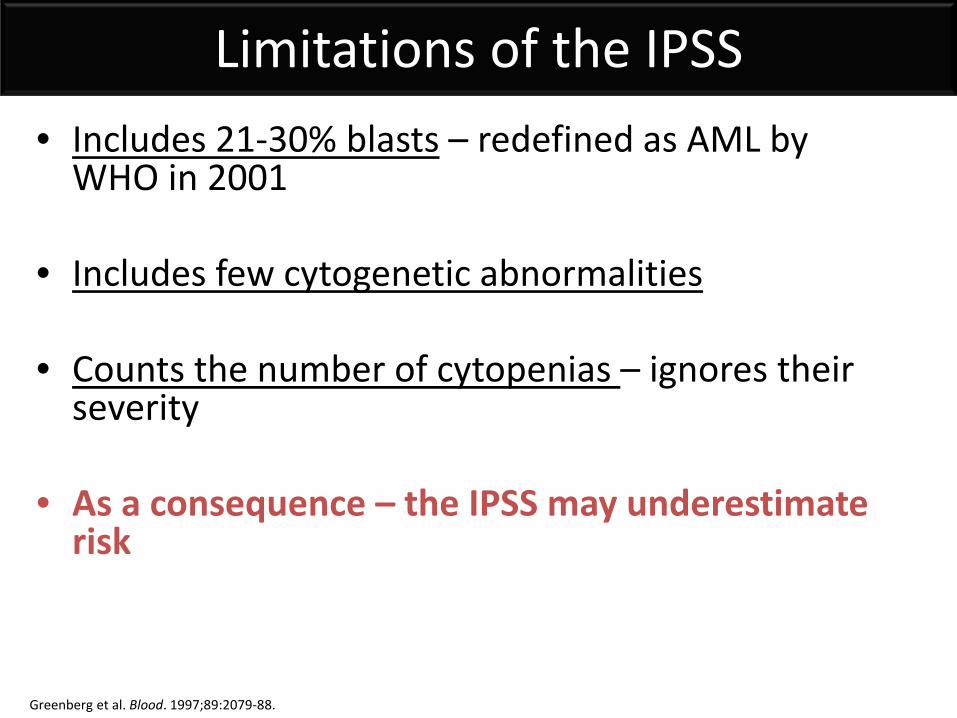
Limitations of the IPSS • Includes 21-30% blasts – redefined as AML by
WHO in 2001
• Includes few cytogenetic abnormalities
• Counts the number of cytopenias – ignores their severity
• As a consequence – the IPSS may underestimate risk
Greenberg et al. Blood. 1997;89:2079-88.
Survival, months from referral
Patie
nts,
%
0 24 12 48 36 60 84 72 96 0
20
40
60
80
100
LR-PSS Risk Categories
Category 1 (n=57)
Category 2 (n=160)
Category 3 (n=71)
p < 0.001
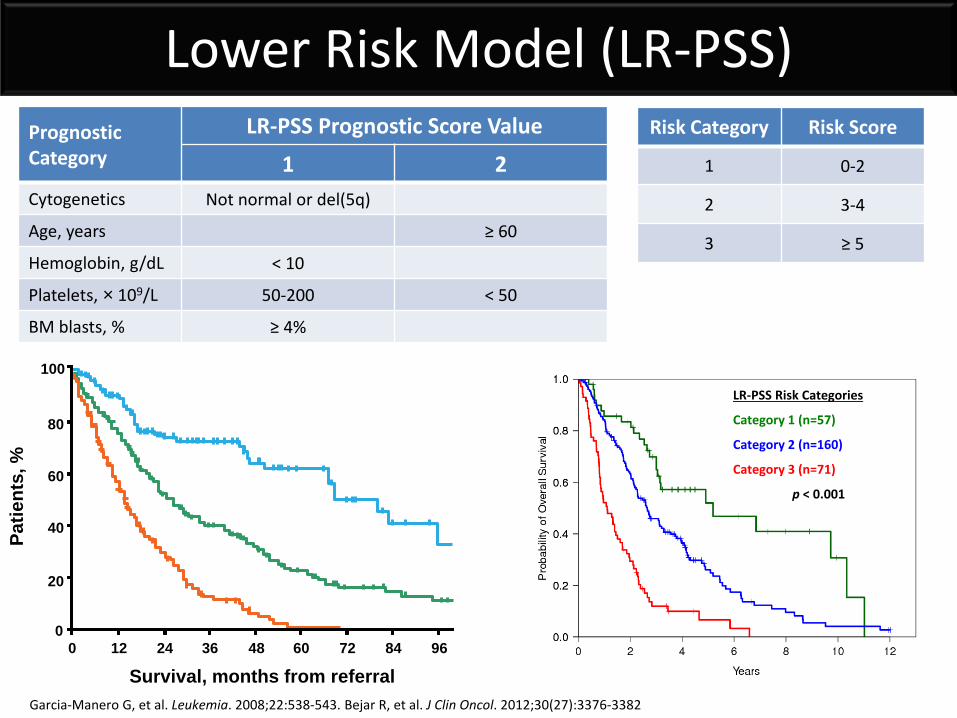
Lower Risk Model (LR-PSS)
Garcia-Manero G, et al. Leukemia. 2008;22:538-543. Bejar R, et al. J Clin Oncol. 2012;30(27):3376-3382
Prognostic Category
LR-PSS Prognostic Score Value
1 2 Cytogenetics Not normal or del(5q)
Age, years ≥ 60
Hemoglobin, g/dL < 10
Platelets, × 109/L 50-200 < 50
BM blasts, % ≥ 4%
Risk Category Risk Score
1 0-2
2 3-4
3 ≥ 5
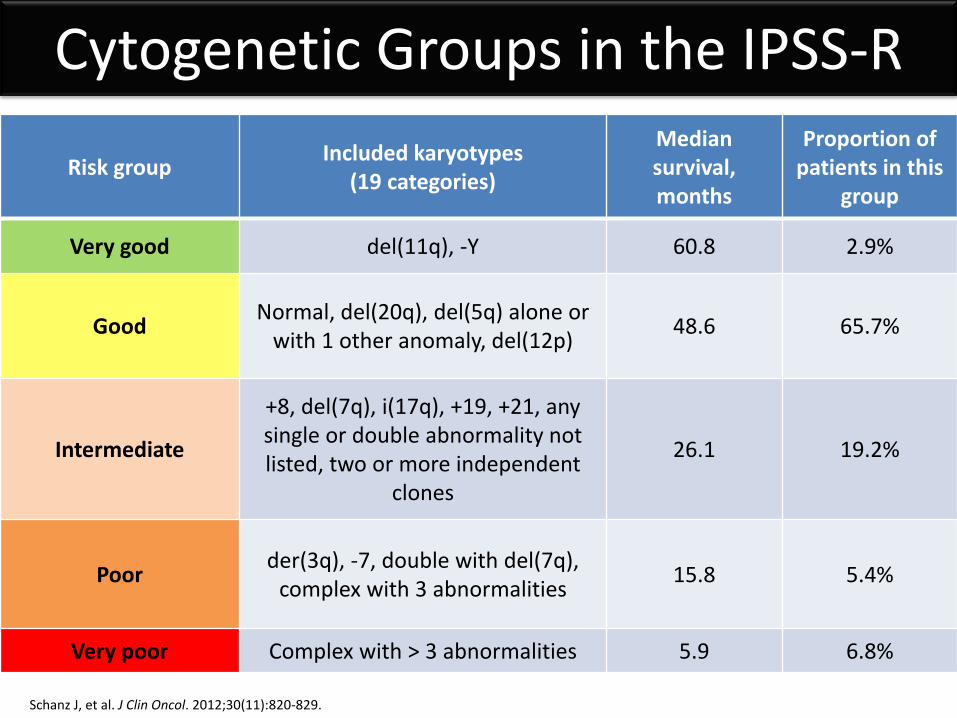
Risk group Included karyotypes (19 categories)
Median survival, months
Proportion of patients in this
group
Very good del(11q), -Y 60.8 2.9%
Good Normal, del(20q), del(5q) alone or with 1 other anomaly, del(12p) 48.6 65.7%
Intermediate
+8, del(7q), i(17q), +19, +21, any single or double abnormality not listed, two or more independent
clones
26.1 19.2%
Poor der(3q), -7, double with del(7q), complex with 3 abnormalities 15.8 5.4%
Very poor Complex with > 3 abnormalities 5.9 6.8%
Cytogenetic Groups in the IPSS-R
Schanz J, et al. J Clin Oncol. 2012;30(11):820-829.
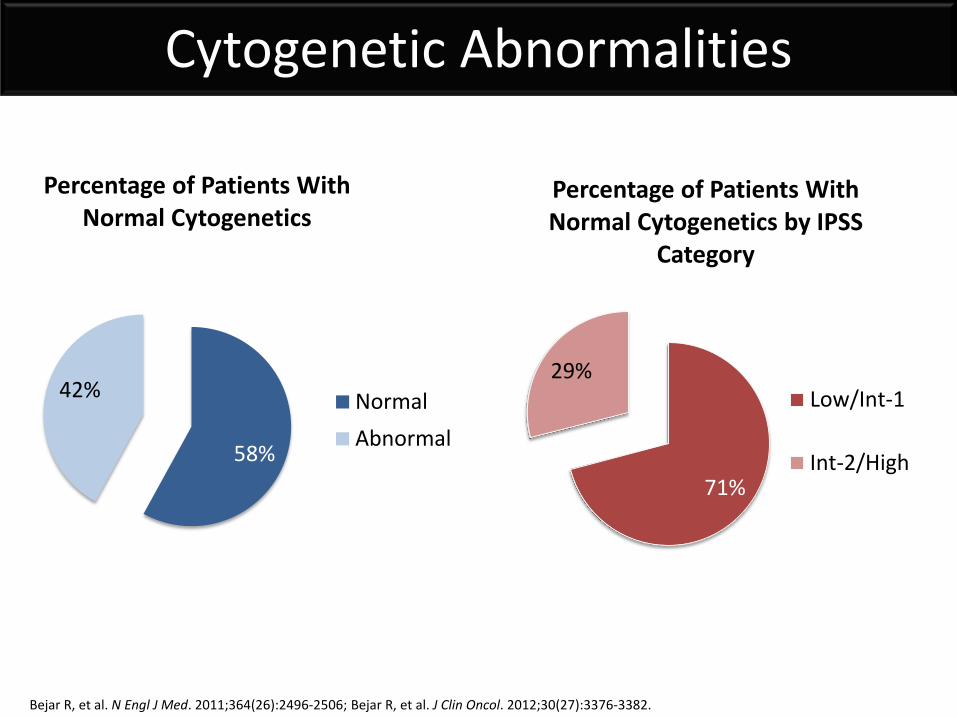
71%
29%
Percentage of Patients With Normal Cytogenetics by IPSS
Category
Low/Int-1
Int-2/High58%
42%
Percentage of Patients With Normal Cytogenetics
NormalAbnormal
Cytogenetic Abnormalities
Bejar R, et al. N Engl J Med. 2011;364(26):2496-2506; Bejar R, et al. J Clin Oncol. 2012;30(27):3376-3382.
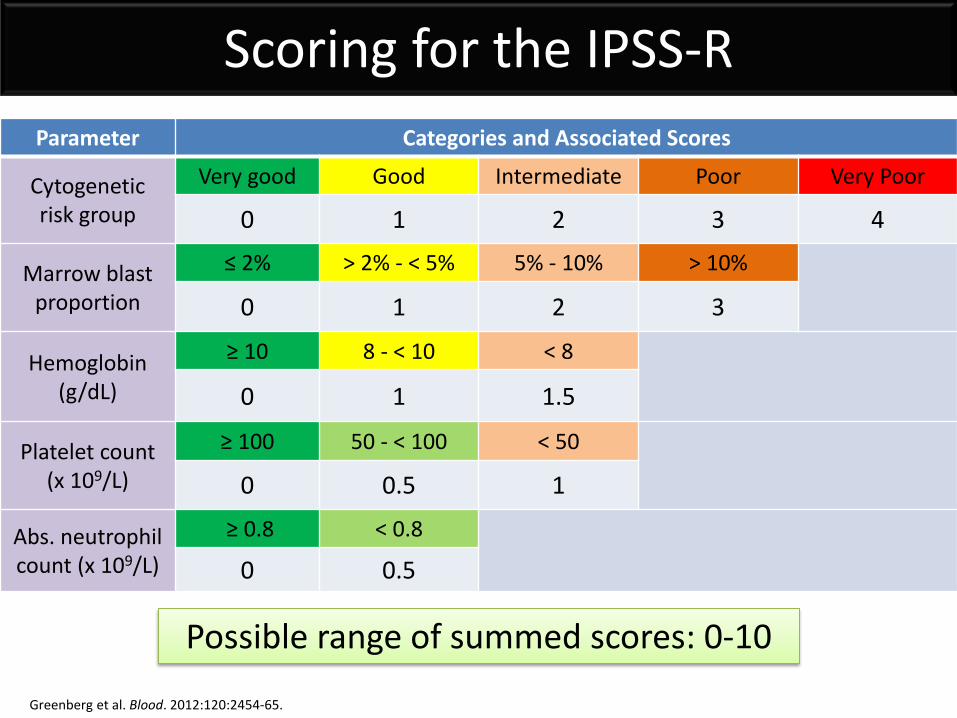
Scoring for the IPSS-R Parameter Categories and Associated Scores
Cytogenetic risk group
Very good Good Intermediate Poor Very Poor
0 1 2 3 4
Marrow blast proportion
≤ 2% > 2% - < 5% 5% - 10% > 10%
0 1 2 3
Hemoglobin (g/dL)
≥ 10 8 - < 10 < 8
0 1 1.5
Platelet count (x 109/L)
≥ 100 50 - < 100 < 50
0 0.5 1
Abs. neutrophil count (x 109/L)
≥ 0.8 < 0.8
0 0.5
Possible range of summed scores: 0-10
Greenberg et al. Blood. 2012:120:2454-65.
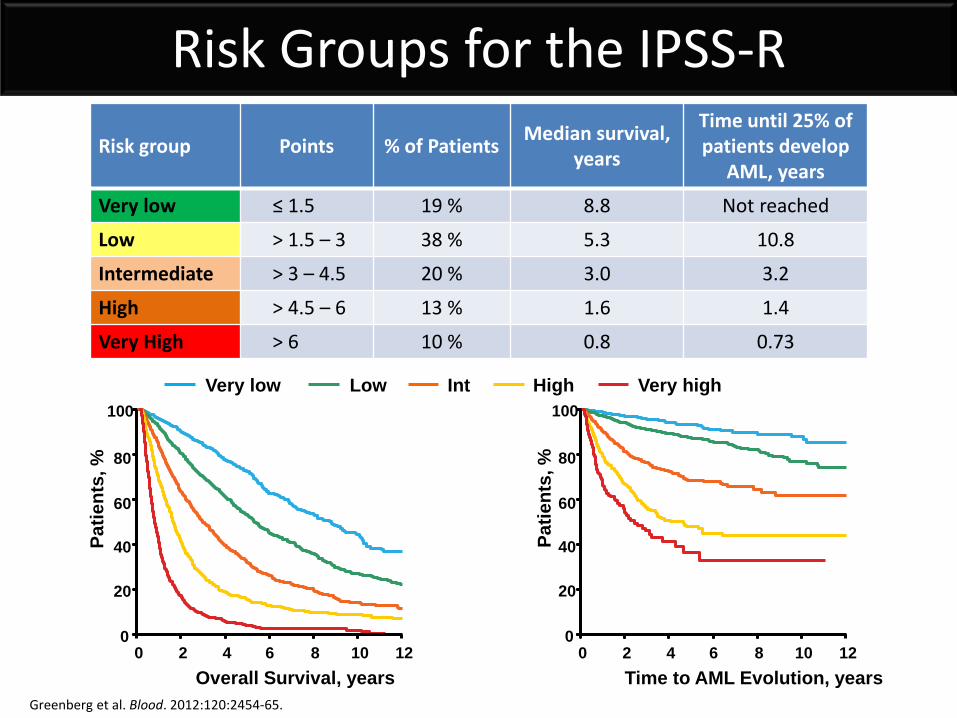
Risk Groups for the IPSS-R Risk group Points % of Patients Median survival,
years
Time until 25% of patients develop
AML, years
Very low ≤ 1.5 19 % 8.8 Not reached
Low > 1.5 – 3 38 % 5.3 10.8
Intermediate > 3 – 4.5 20 % 3.0 3.2
High > 4.5 – 6 13 % 1.6 1.4
Very High > 6 10 % 0.8 0.73
100
Overall Survival, years
Patie
nts,
%
0 0 2 4 6 8 10 12
20
40
60
80
Patie
nts,
%
Time to AML Evolution, years 0 2 4 6 8 10 12
100
0
20
40
60
80
Very low Low Int High Very high
Greenberg et al. Blood. 2012:120:2454-65.
Greenberg PL, et al. Blood. 2012;120:2454-2465.
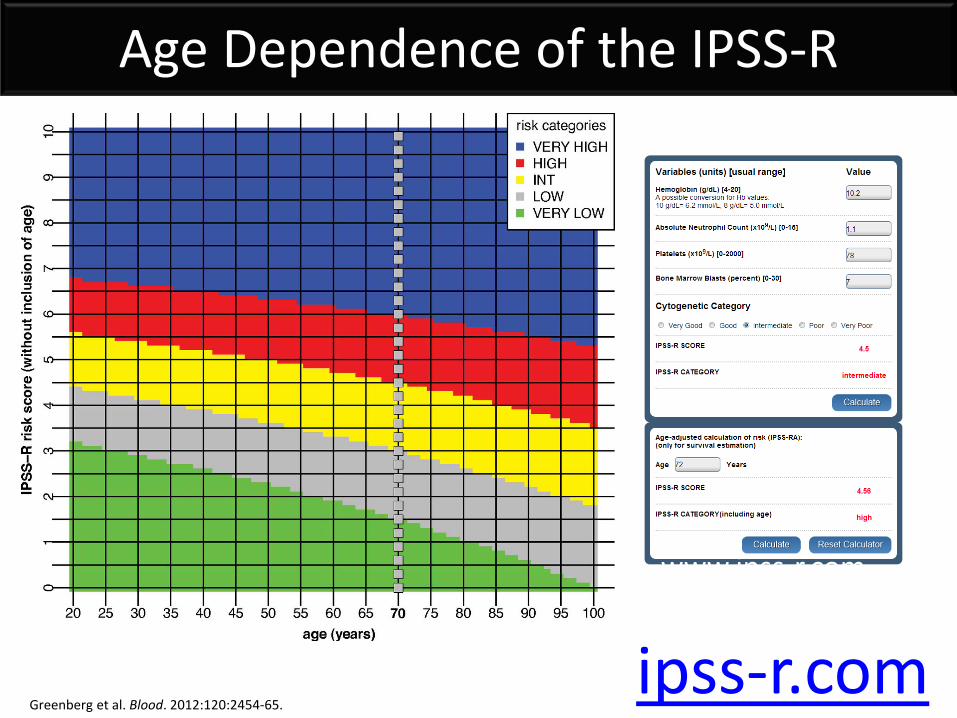
www.ipss-r.com
Age Dependence of the IPSS-R
Greenberg et al. Blood. 2012:120:2454-65. ipss-r.com
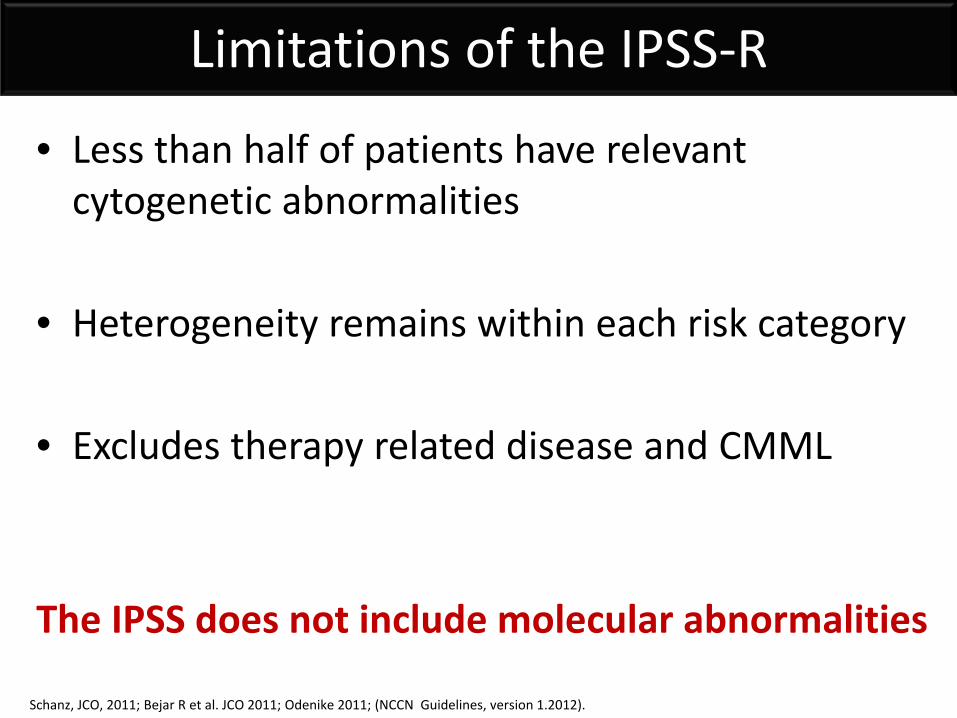
Limitations of the IPSS-R
• Less than half of patients have relevant cytogenetic abnormalities
• Heterogeneity remains within each risk category
• Excludes therapy related disease and CMML The IPSS does not include molecular abnormalities
Schanz, JCO, 2011; Bejar R et al. JCO 2011; Odenike 2011; (NCCN Guidelines, version 1.2012).
Challenges to Interpreting Genetic Test Results
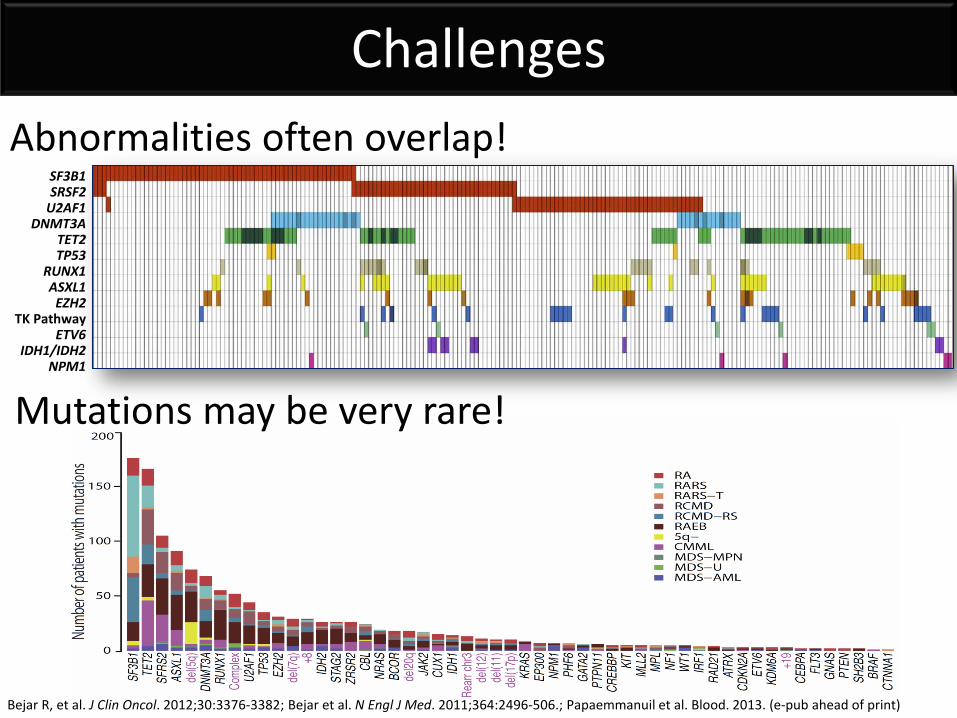
Challenges
Bejar R, et al. J Clin Oncol. 2012;30:3376-3382; Bejar et al. N Engl J Med. 2011;364:2496-506.; Papaemmanuil et al. Blood. 2013. (e-pub ahead of print)
Abnormalities often overlap!
SF3B1 SRSF2
TET2 TP53
RUNX1 ASXL1
EZH2 TK Pathway
ETV6 IDH1/IDH2
NPM1
U2AF1 DNMT3A
Mutations may be very rare!
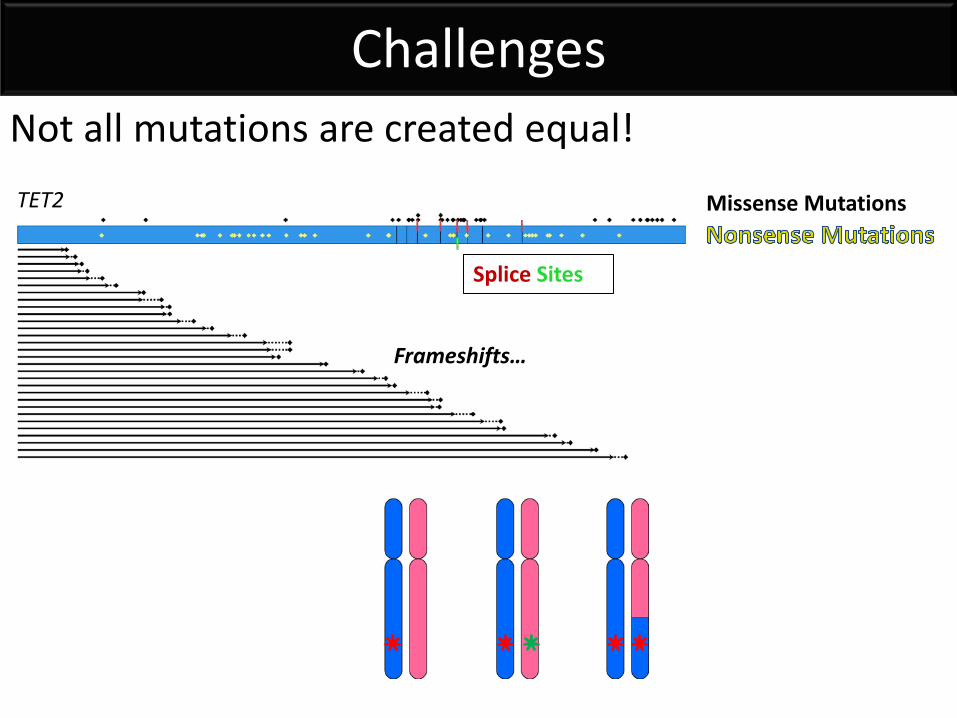
Challenges Not all mutations are created equal! TET2 Missense Mutations
Splice Sites
Frameshifts…
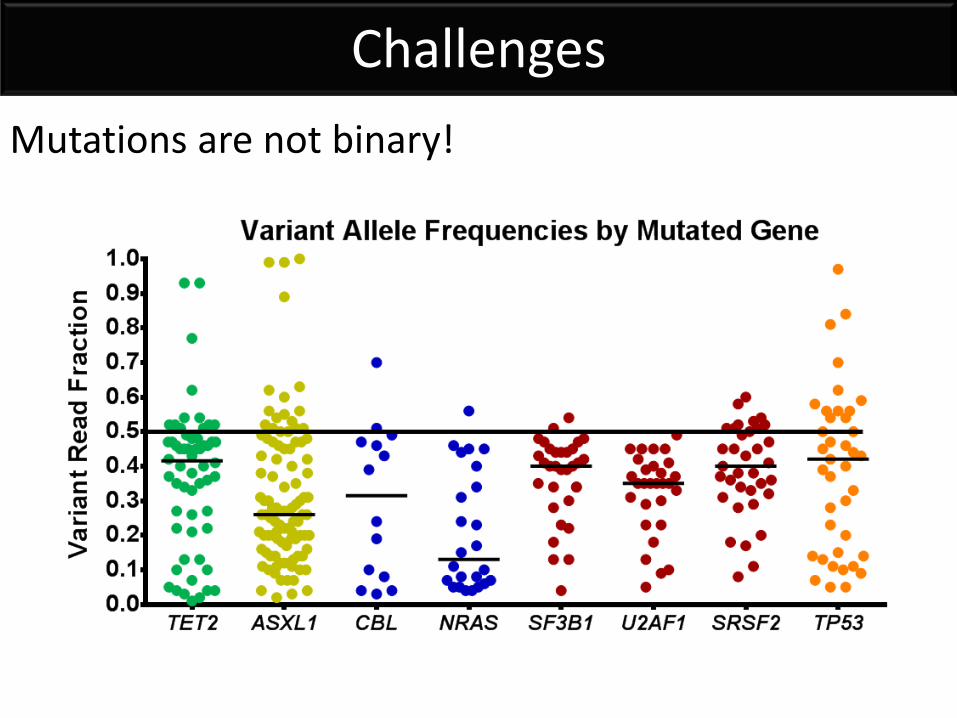
Challenges Mutations are not binary!
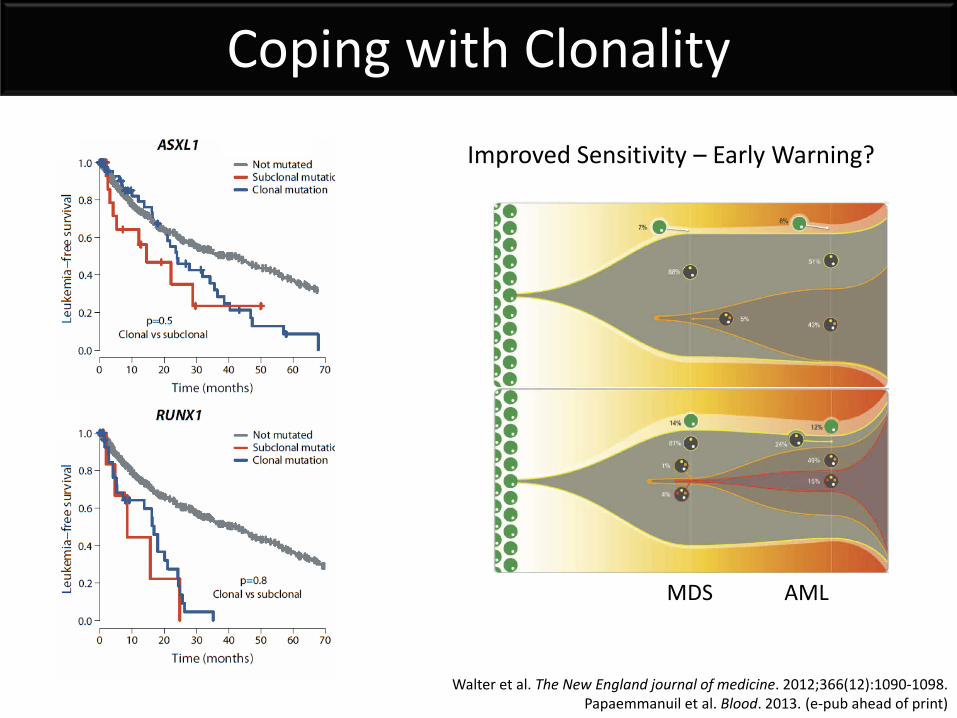
Coping with Clonality
Improved Sensitivity – Early Warning?
MDS AML
Walter et al. The New England journal of medicine. 2012;366(12):1090-1098. Papaemmanuil et al. Blood. 2013. (e-pub ahead of print)
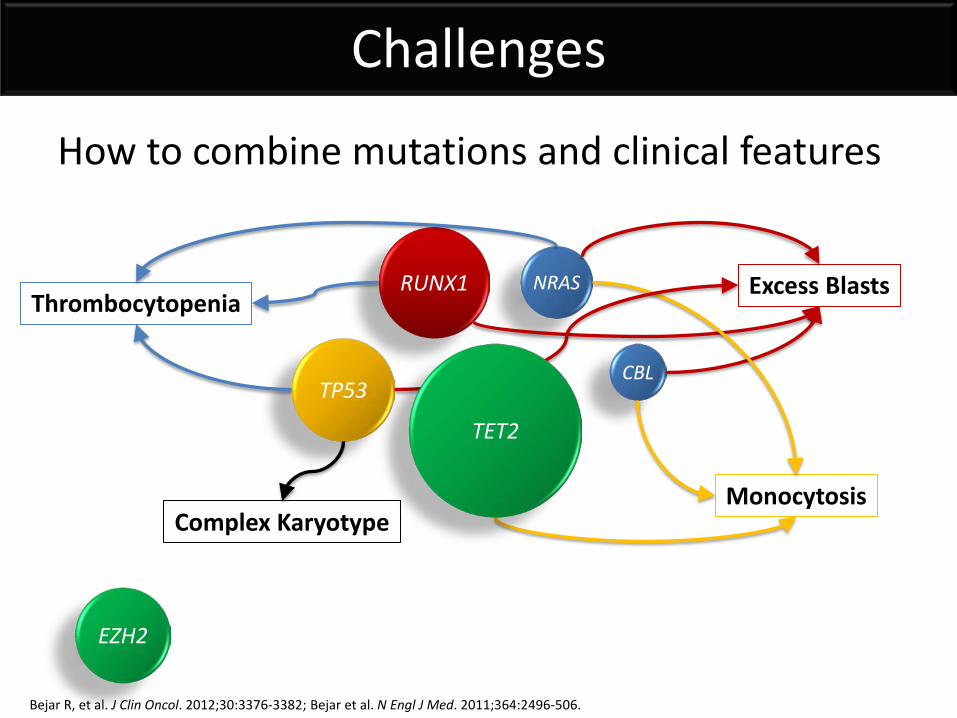
Challenges
How to combine mutations and clinical features
RUNX1
TP53
NRAS
CBL
EZH2
Thrombocytopenia Excess Blasts
Monocytosis Complex Karyotype
TET2
Bejar R, et al. J Clin Oncol. 2012;30:3376-3382; Bejar et al. N Engl J Med. 2011;364:2496-506.
Can Mutation Testing Be Useful at All?
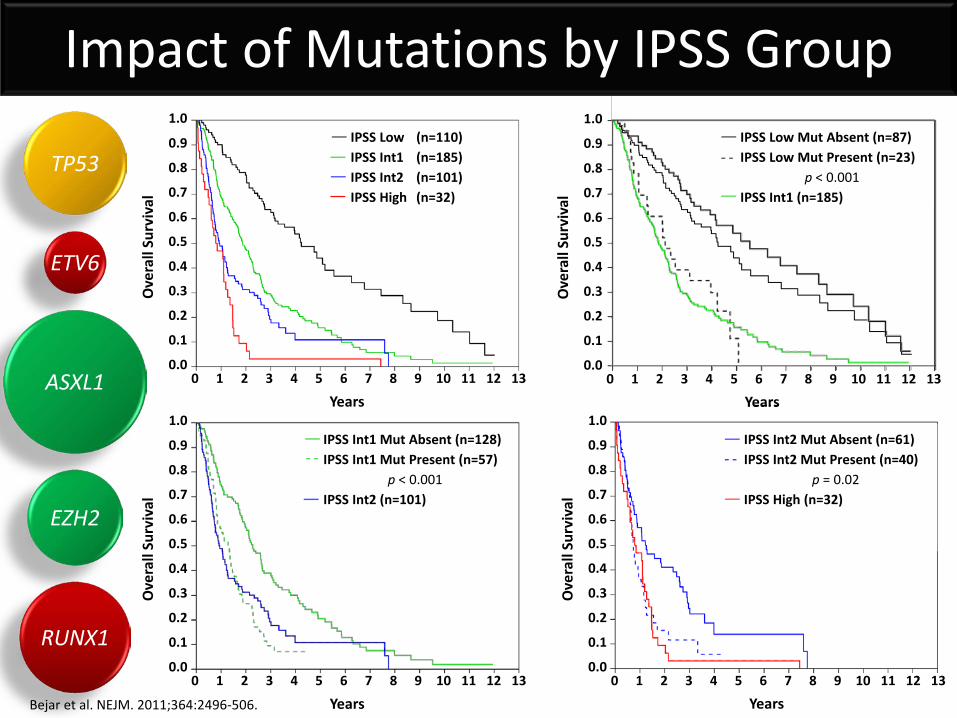
IPSS Int2 Mut Absent (n=61) IPSS Int2 Mut Present (n=40)
p = 0.02 IPSS High (n=32)
1.0
0.9
0.8
0.7
0.6
0.5
0.4
0.3
0.2
0.1
0.0 0 1 2 3 4 5 6 7 8 9 10 11 12 13
Ove
rall
Surv
ival
Years
IPSS Int1 Mut Absent (n=128) IPSS Int1 Mut Present (n=57)
p < 0.001 IPSS Int2 (n=101)
1.0
0.9
0.8
0.7
0.6
0.5
0.4
0.3
0.2
0.1
0.0 0 1 2 3 4 5 6 7 8 9 10 11 12 13
Ove
rall
Surv
ival
Years
IPSS Low (n=110)
0.9
0.8
0.7
0.6
0.5
0.4
0.3
0.2
0.1
0.0 0 1 2 3 4 5 6 7 8 9 10 11 12 13
Ove
rall
Surv
ival
Years
1.0 IPSS Low (n=110) IPSS Int1 (n=185) IPSS Int2 (n=101) IPSS High (n=32)
1.0
0.9
0.8
0.7
0.6
0.5
0.4
0.3
0.2
0.1
0.0 0 1 2 3 4 5 6 7 8 9 10 11 12 13
Ove
rall
Surv
ival
Years
IPSS Low Mut Absent (n=87) IPSS Low Mut Present (n=23)
p < 0.001
1.0
0.9
0.8
0.7
0.6
0.5
0.4
0.3
0.2
0.1
0.0 0 1 2 3 4 5 6 7 8 9 10 11 12 13
Ove
rall
Surv
ival
Years
IPSS Low Mut Absent (n=87) IPSS Low Mut Present (n=23)
p < 0.001 IPSS Int1 (n=185)
Impact of Mutations by IPSS Group
RUNX1
ETV6
EZH2
ASXL1
TP53
Bejar et al. NEJM. 2011;364:2496-506.
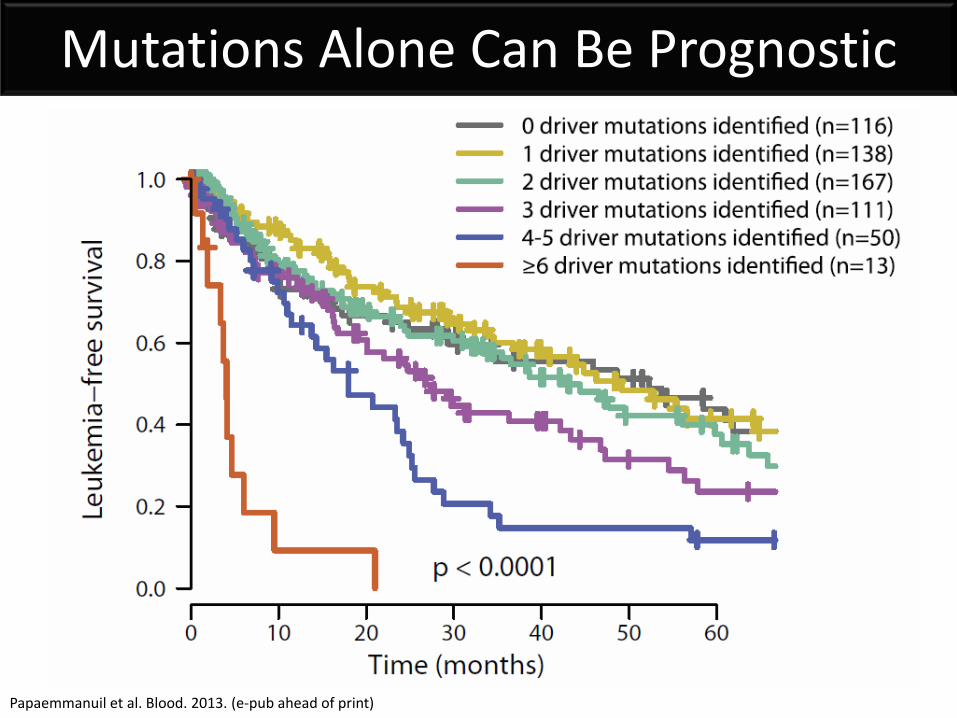
Mutations Alone Can Be Prognostic
Papaemmanuil et al. Blood. 2013. (e-pub ahead of print)
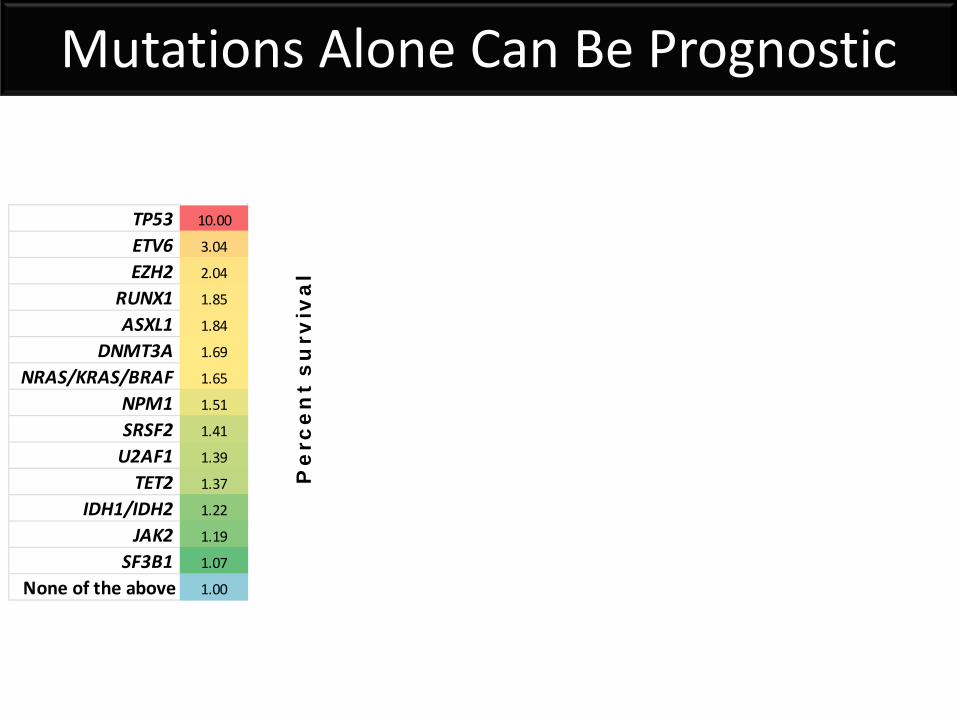
Mutations Alone Can Be Prognostic
Pe
rce
nt
su
rviv
al
TP53 10.00
ETV6 3.04
EZH2 2.04
RUNX1 1.85
ASXL1 1.84
DNMT3A 1.69
NRAS/KRAS/BRAF 1.65
NPM1 1.51
SRSF2 1.41
U2AF1 1.39
TET2 1.37
IDH1/IDH2 1.22
JAK2 1.19
SF3B1 1.07
None of the above 1.00
Complex (3 or more abnormalities)
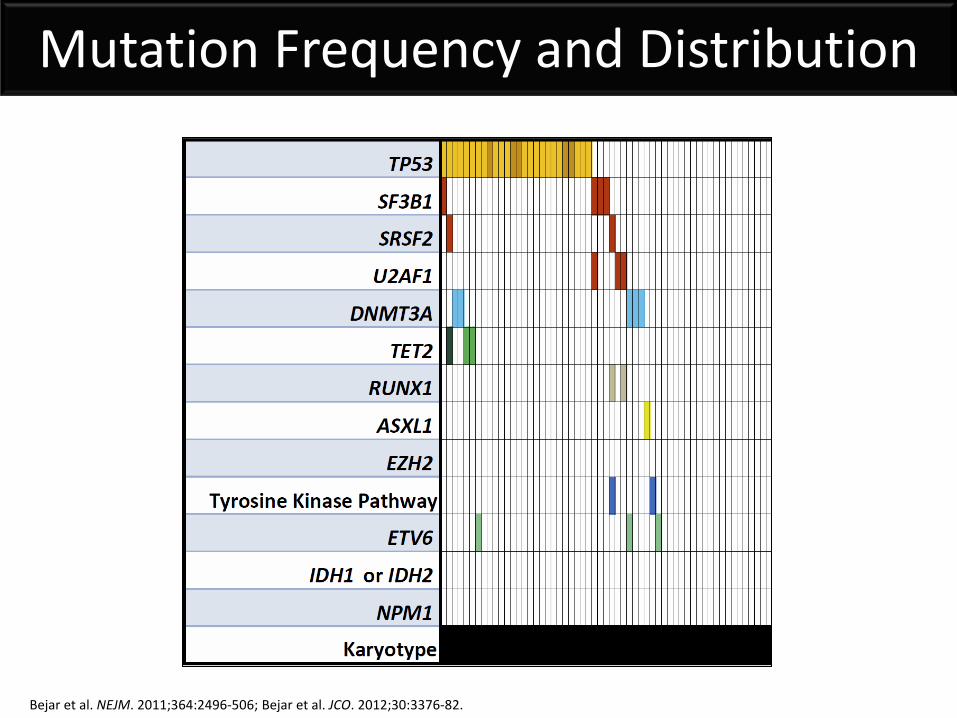
Mutation Frequency and Distribution
Bejar et al. NEJM. 2011;364:2496-506; Bejar et al. JCO. 2012;30:3376-82.
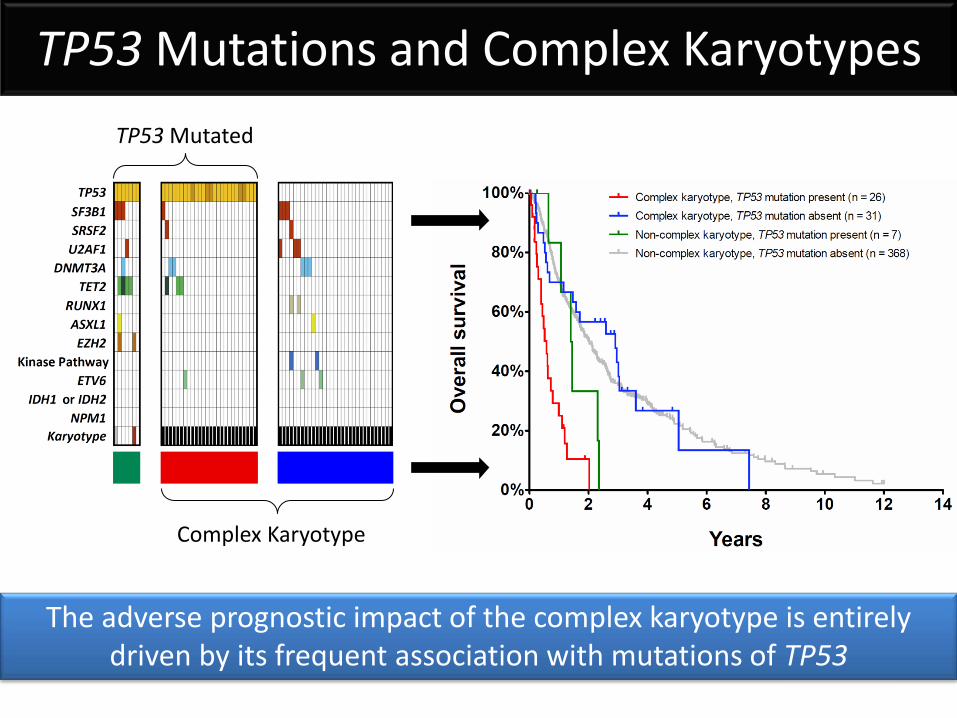
Complex Karyotype
TP53 Mutated
The adverse prognostic impact of the complex karyotype is entirely driven by its frequent association with mutations of TP53
TP53 Mutations and Complex Karyotypes
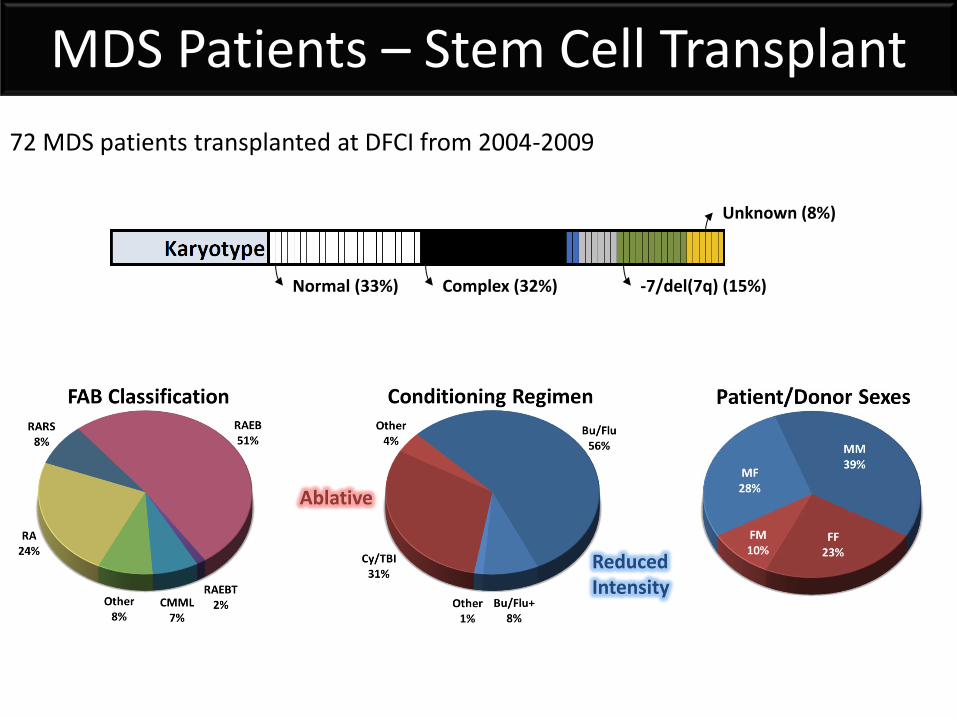
72 MDS patients transplanted at DFCI from 2004-2009
Normal (33%) -7/del(7q) (15%) Complex (32%)
Unknown (8%)
Reduced Intensity
Ablative
MDS Patients – Stem Cell Transplant
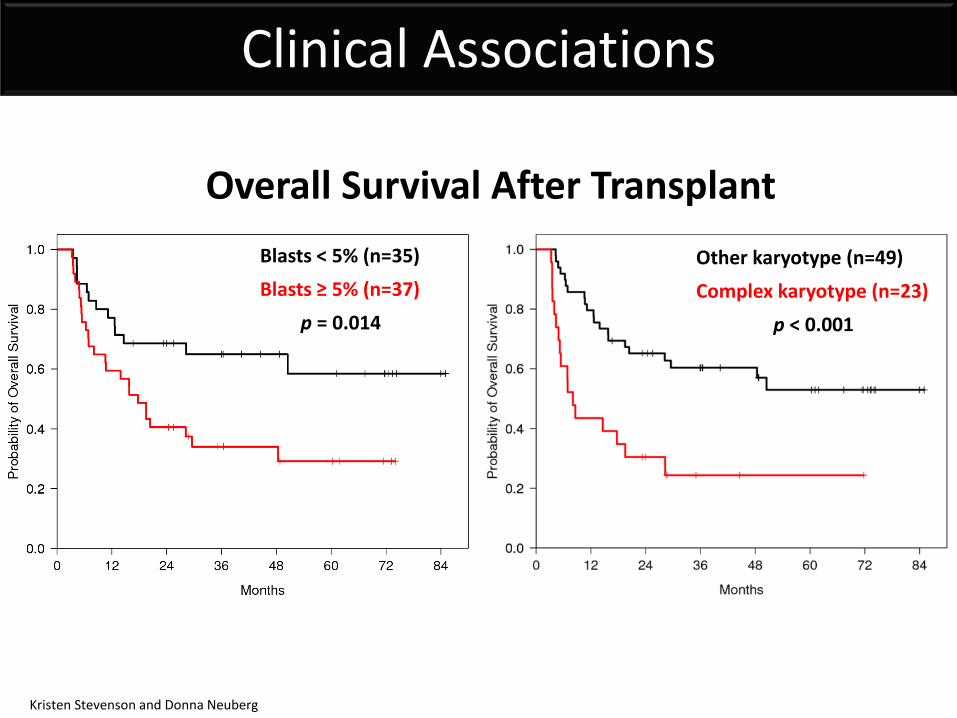
Blasts < 5% (n=35) Blasts ≥ 5% (n=37)
p = 0.014
Other karyotype (n=49) Complex karyotype (n=23)
p < 0.001
Overall Survival After Transplant
Clinical Associations
Kristen Stevenson and Donna Neuberg
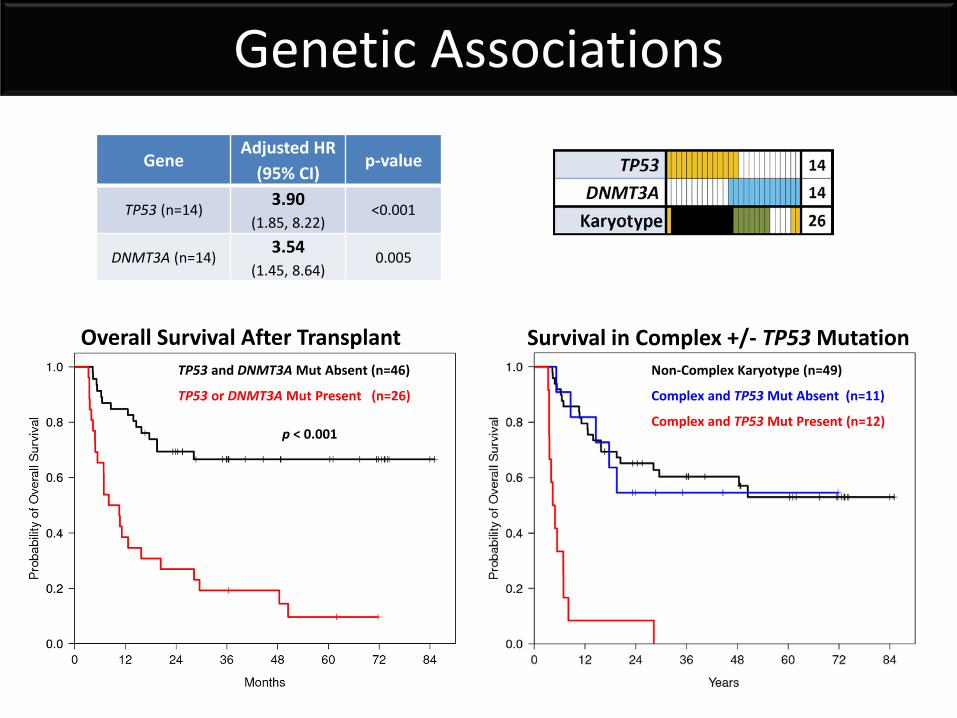
TP53 and DNMT3A Mut Absent (n=46)
TP53 or DNMT3A Mut Present (n=26)
p < 0.001
Overall Survival After Transplant Survival in Complex +/- TP53 Mutation Non-Complex Karyotype (n=49)
Complex and TP53 Mut Absent (n=11)
Complex and TP53 Mut Present (n=12)
Genetic Associations
Gene Adjusted HR
(95% CI) p-value
TP53 (n=14) 3.90 (1.85, 8.22)
<0.001
DNMT3A (n=14) 3.54 (1.45, 8.64)
0.005
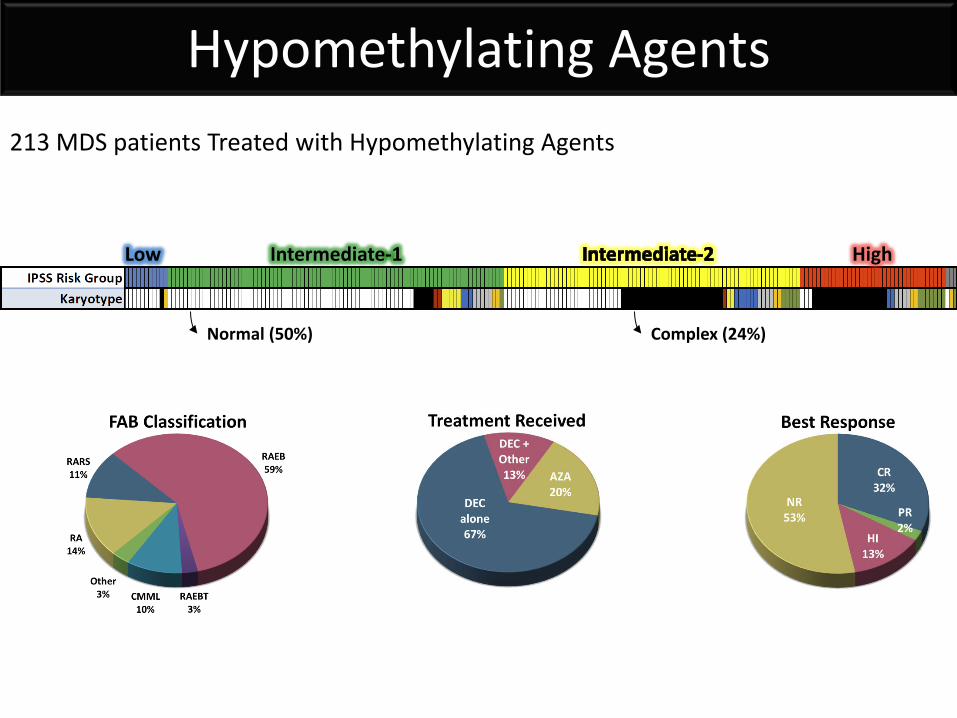
213 MDS patients Treated with Hypomethylating Agents
Low Intermediate-1 High
Normal (50%) Complex (24%)
Hypomethylating Agents
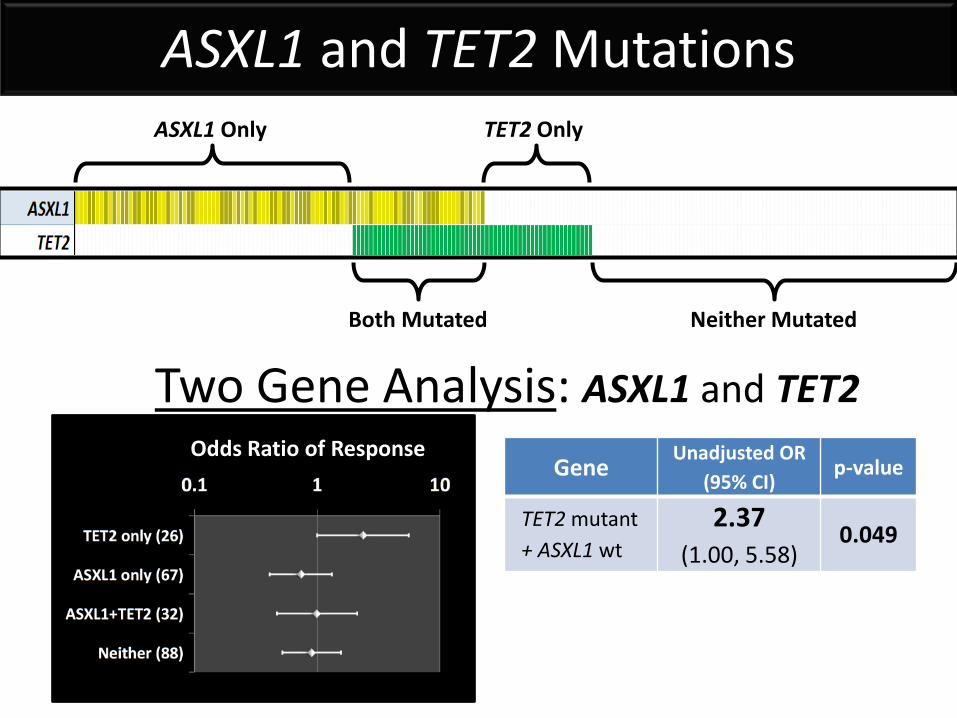
Odds Ratio of Response
Two Gene Analysis: ASXL1 and TET2
ASXL1 Only
Both Mutated
TET2 Only
Neither Mutated
ASXL1 and TET2 Mutations
Gene Unadjusted OR
(95% CI) p-value
TET2 mutant + ASXL1 wt
2.37 (1.00, 5.58)
0.049
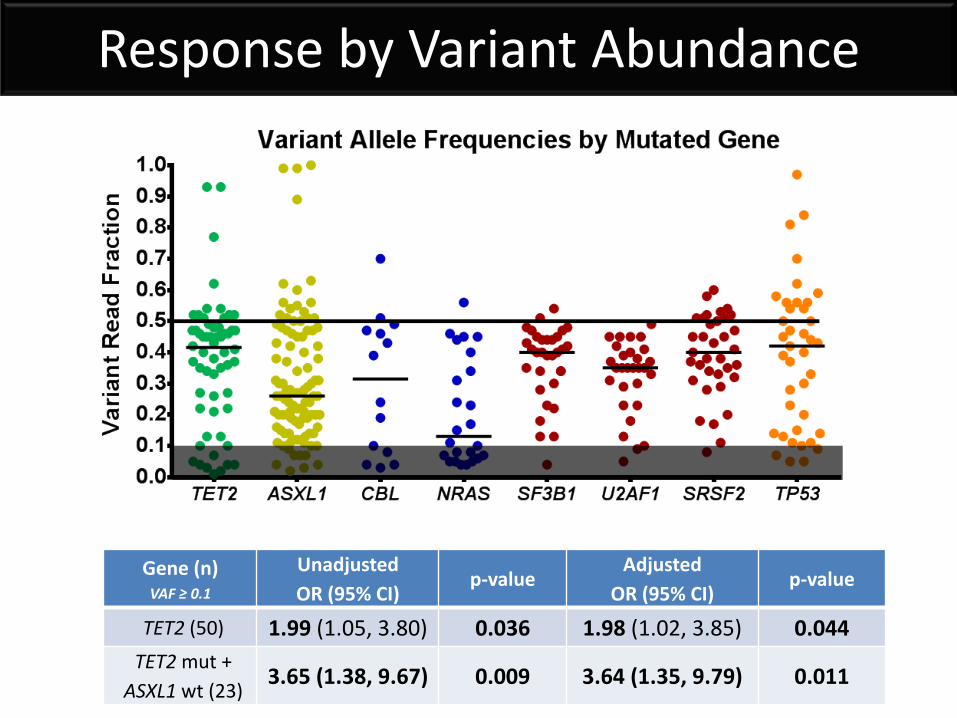
Response by Variant Abundance
Gene (n) VAF ≥ 0.1
Unadjusted OR (95% CI)
p-value Adjusted
OR (95% CI) p-value
TET2 (50) 1.99 (1.05, 3.80) 0.036 1.98 (1.02, 3.85) 0.044 TET2 mut +
ASXL1 wt (23) 3.65 (1.38, 9.67) 0.009 3.64 (1.35, 9.79) 0.011
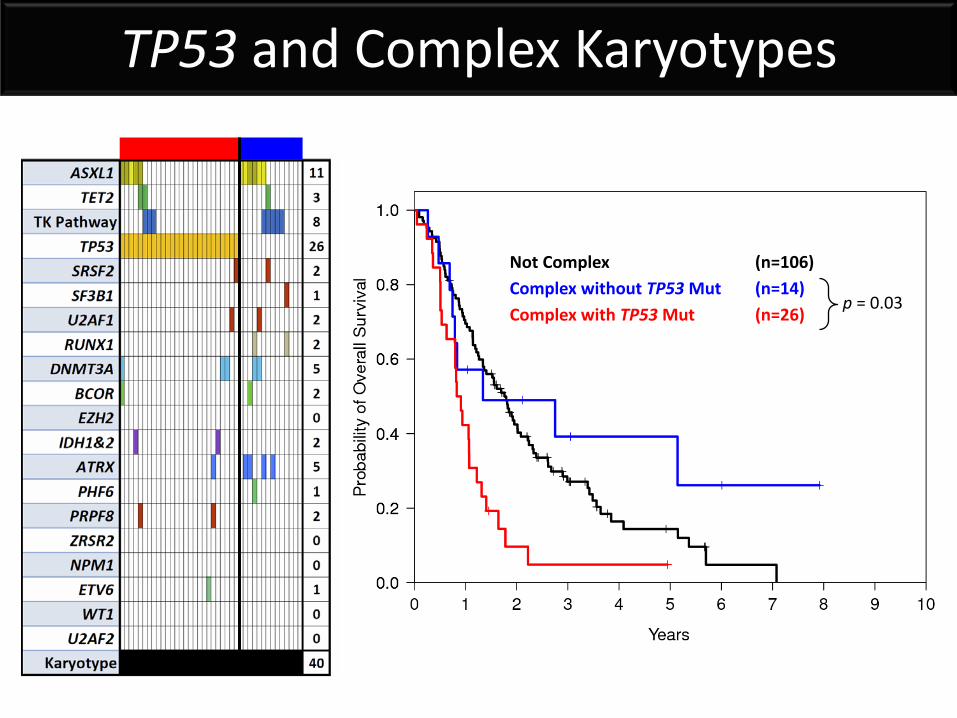
Not Complex (n=106) Complex without TP53 Mut (n=14) Complex with TP53 Mut (n=26)
p = 0.03
TP53 and Complex Karyotypes
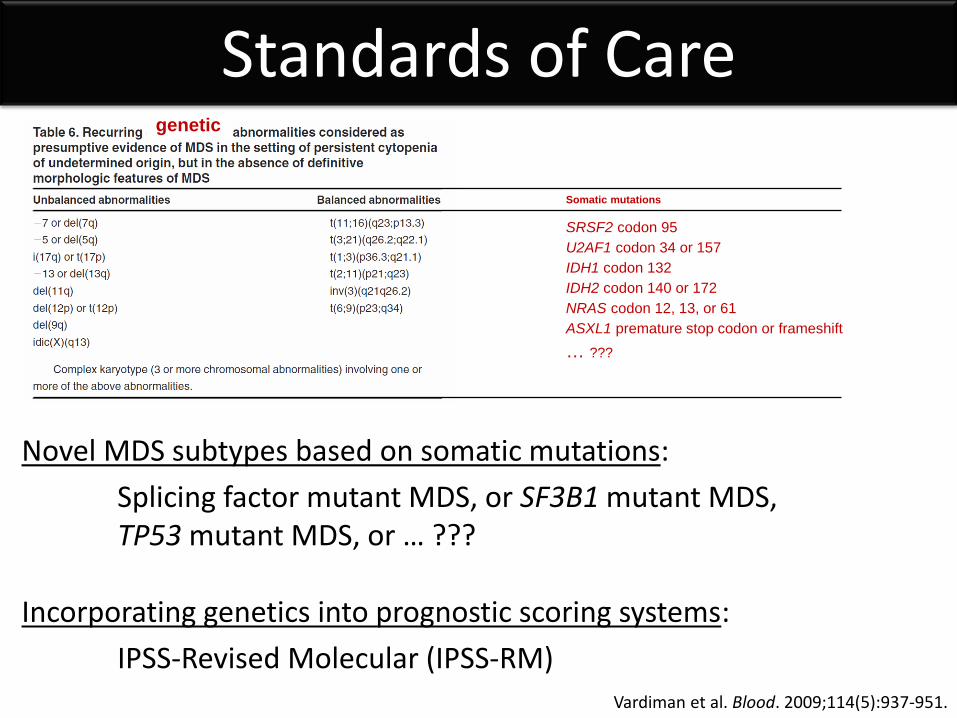
Novel MDS subtypes based on somatic mutations: Splicing factor mutant MDS, or SF3B1 mutant MDS, TP53 mutant MDS, or … ??? Incorporating genetics into prognostic scoring systems: IPSS-Revised Molecular (IPSS-RM)
Somatic mutations
SRSF2 codon 95 U2AF1 codon 34 or 157 IDH1 codon 132 IDH2 codon 140 or 172 NRAS codon 12, 13, or 61 ASXL1 premature stop codon or frameshift … ???
genetic
Vardiman et al. Blood. 2009;114(5):937-951.
Standards of Care
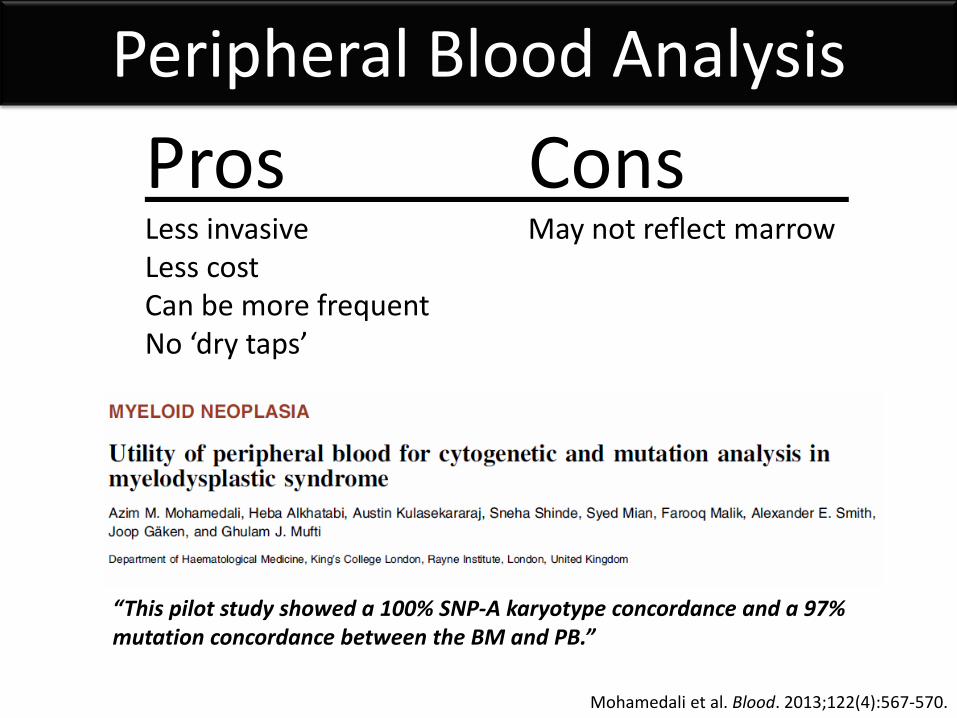
Peripheral Blood Analysis Pros Cons Less invasive May not reflect marrow Less cost Can be more frequent No ‘dry taps’
Mohamedali et al. Blood. 2013;122(4):567-570.
“This pilot study showed a 100% SNP-A karyotype concordance and a 97% mutation concordance between the BM and PB.”
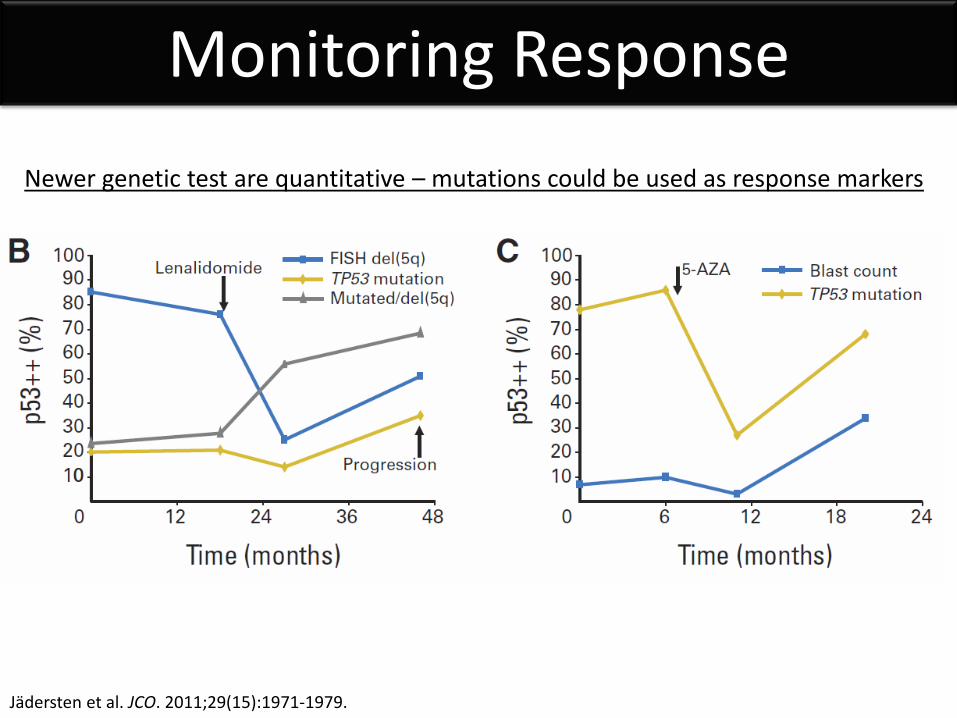
Monitoring Response
Jädersten et al. JCO. 2011;29(15):1971-1979.
Newer genetic test are quantitative – mutations could be used as response markers
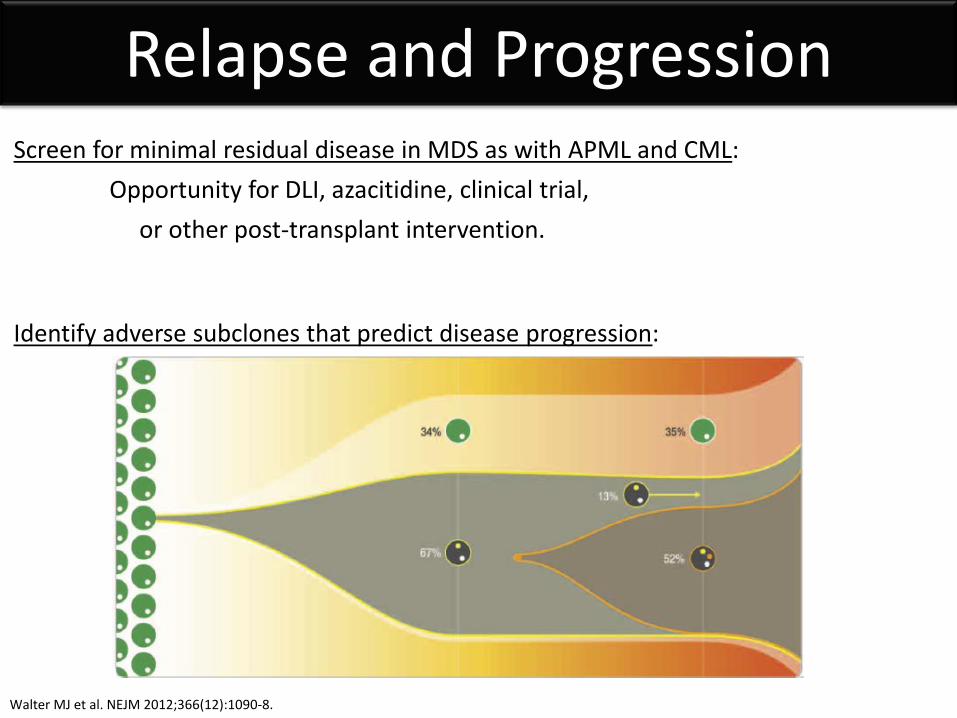
Relapse and Progression Screen for minimal residual disease in MDS as with APML and CML: Opportunity for DLI, azacitidine, clinical trial, or other post-transplant intervention. Identify adverse subclones that predict disease progression:
Walter MJ et al. NEJM 2012;366(12):1090-8.
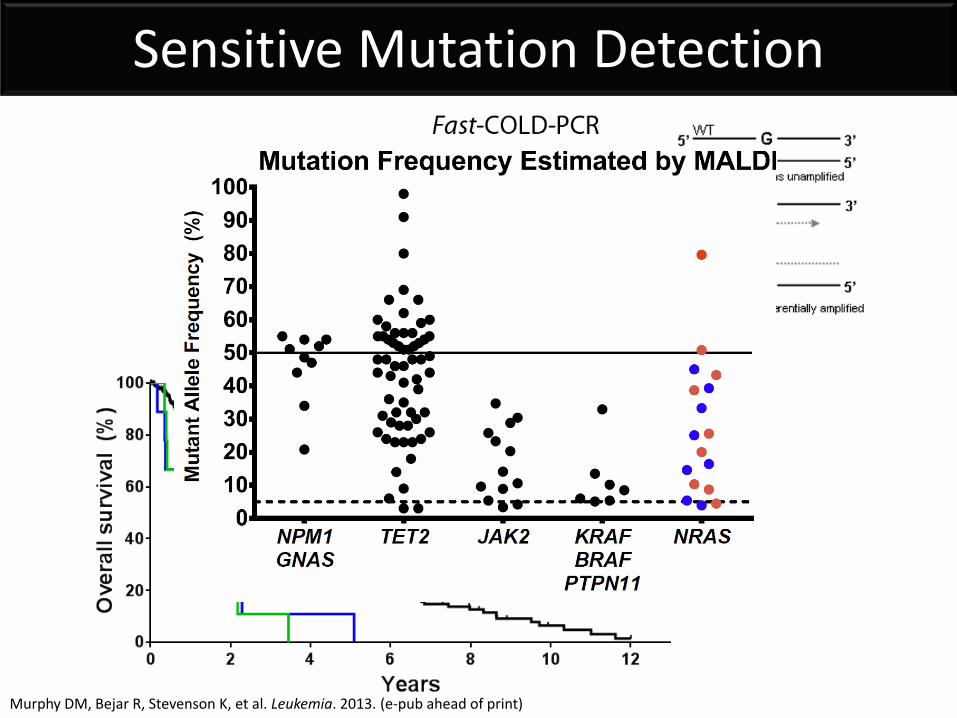
Sensitive Mutation Detection
Murphy DM, Bejar R, Stevenson K, et al. Leukemia. 2013. (e-pub ahead of print)
Genetics Summary
• Single gene mutations are the most common genetic abnormality in MDS
• Mutations can be challenging clinically, BUT … • Mutations can identify clonality and aid diagnosis • Mutations can inform the prediction of prognosis • Mutations may predict responses to therapy and
outcomes after stem cell transplantation
Clinical access to genetic testing is now available!
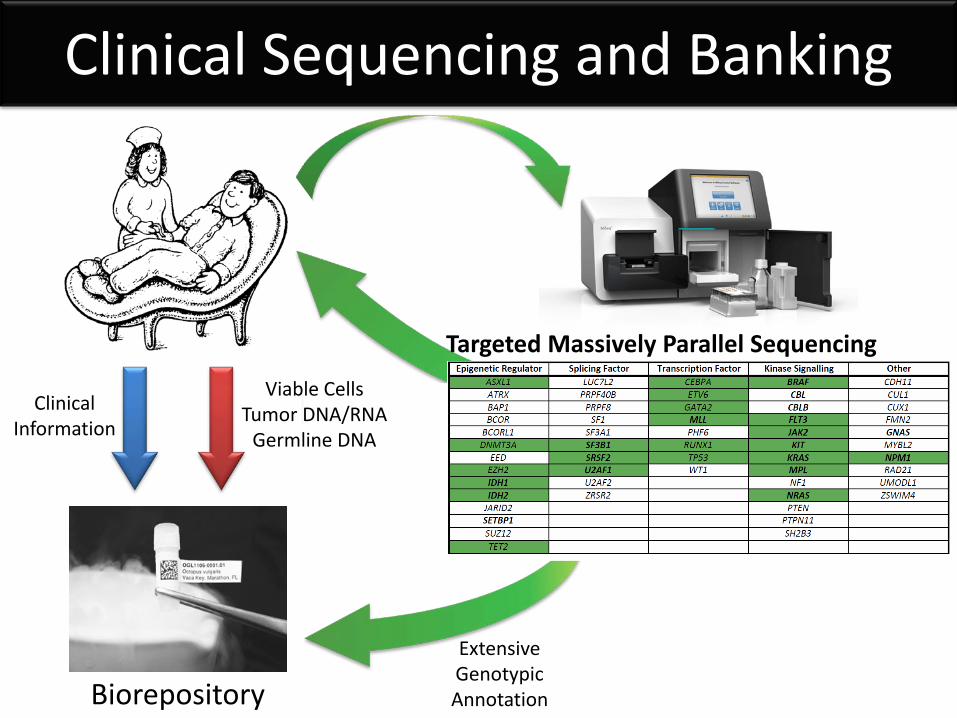
Clinical Sequencing and Banking
Clinical Information
Biorepository
Viable Cells Tumor DNA/RNA
Germline DNA
Extensive Genotypic Annotation
Targeted Massively Parallel Sequencing
Columbia University Azra Raza Naomi Galili
Brigham and Women’s Ben Ebert Allegra Lord Ann Mullally Anu Narla Bennett Caughey Bernd Boidol Damien Wilpitz Marie McConkey
DFCI / Broad David Steensma Donna Neuberg Kristen Stevenson Mike Makrigiorgos Derek Murphy
Bejar Lab Albert Perez Bennett Caughey Sigrid Katz
MD Anderson Cancer Center Guillermo Garcia-Manero Hagop Kantarjian Sherry Pierce
Memorial Sloan-Kettering Ross Levine Omar Abdel-Wahab
Acknowledgements: