the microstructure of the bond market in the 20th century
TRANSCRIPT
The Microstructure of the Bond Market in the 20th Century
Bruno Biais1 and Richard Green2
November 2005
We are very grateful for the support and information provided by the Research Department and the Archives of the New York Stock Exchange, and for extremely useful discussions with Paul Bennet, Mark Gurliacci, Pam Moulton, Steve Poser, Bill Tschirhart, Li Wei and Steve Wheeler. We are also indebted, for helpful discussions and information, to Amy Edwards, Liam Brunt, Paul David, Jim Jacoby, Ken Garbade, Tal Heppenstall, Phil Hoffman, Allan Meltzer, Mike Piwowar, Jean-Laurent Rosenthal,Norman Shurhoff, Chester Spatt, Ilya Strebulaev, Eugene White, Luigi Zingales and participants at the SEC seminar and the University of Lausanne seminar as well as at, the Toulouse conference in honour of Jean Jacques Laffont, and the University of Lausanne. Dan Li provided excellent research assistance.
1 Toulouse University (Gremaq/CNRS, CRG/IAE, IDEI) 2 Carnegie Mellon University
2
Abstract
Bonds are traded in OTC markets, where opacity and fragmentation imply large
transaction costs for retail investors. Is there something special about bonds, in contrast to
stocks, that precludes trading in transparent, limit-order markets? Historical experience
suggests this is not the case. Before WWII, there was an active market in corporate and
municipal bonds on the NYSE. Activity dropped dramatically, in the late 1920s for
municipals and in the mid 1940s for corporate, as trading migrated to the OTC market.
This migration occurred simultaneously with an increase in the role of institutional
investors, which fare better than retail investors in OTC market. Based on current and
historical high frequency data, we find that, for retail investors, trading costs in municipal
bonds were half as large in 1926-1927 as they are now. The difference in transactions
costs is likely to reflect the difference in market structures.
3
The Microstructure of the Bond Market in the 20th Century
I. Introduction
Bonds are almost universally traded on over-the-counter (OTC) markets in the U.S.,
in contrast to stocks, which for the most part are traded on organized exchanges. The
OTC markets are decentralized and dealer-intermediated. There is little pre-trade
transparency, as dealers do not post publicly accessible firm quotes. Post-trade
transparency is also quite limited, although it has recently improved under pressure from
Congress, the SEC, buy-side traders, and the NASD. Furthermore, only dealers can post
quotes, and thus investors cannot compete to supply liquidity.
How costly is this lack of transparency and competition for investors? This is a
central question for investors, policy makers and researchers alike. Are the differences in
the structure of the markets on which different types of securities trade an efficient
response to the needs of the different types of investors holding those securities? Is it
inherently problematic to trade bonds on a transparent limit-order book? Or, are
differences in market structures the result of externalities in liquidity provision and
strategic behavior by financial intermediaries? Could mandated changes in disclosure of
price and volume information, or in the mechanisms through which trade is organized,
lower costs for investors? Or, would such regulatory interference simply suppress a
natural diversity in institutional arrangements that benefits investors?
Answers to these questions are difficult to obtain through cross-sectional comparisons
of existing markets because volume, prices, and trading mechanisms are all jointly
endogenous variables. Perhaps corporate and municipal bonds have low liquidity and
high trading costs because they are traded in opaque, decentralized, broker-dealer
markets. Alternatively, perhaps they trade over the counter because the infrequent need
4
for trade, and sophistication of the traders involved, renders the continuous maintenance
of a widely disseminated, centralized limit-order book wasteful and costly.
We believe the historical experience can shed light on these questions, because it has
not always been the case that equities and bonds were traded in such different venues.
Until 1945, there was an active market in corporate bonds on the NYSE. In the 1930s, the
trading volume in bonds was between one fifth and one third of the trading volume in
stocks on the Exchange. In earlier periods, there was also an active market for municipal
bonds and government bonds. Indeed, the first organized exchange in New York, from
which the modern NYSE traces its descent, was established by a group of brokers “under
the buttonwood tree” to trade U.S. government bonds. Municipal bond trading largely
migrated from the exchange in the late 1920s, and volume in corporate bonds dropped
dramatically in the late 1940s.3 Since this collapse, bond trading on the Exchange has
been limited.
This historical evidence shows that an active bond market with a centralized and
transparent limit order book was feasible. This, in turn, raises other questions. Why did
liquidity of the bond market dry up on the NYSE, and why has it been so difficult for the
exchange to regain volume despite its periodic attempts to do so?
To answer these questions we first provide institutional information on the
microstructure of the bond market in the twentieth century. Then, we consider possible
explanations for the drop in the liquidity of the bond market on the Exchange. First, we
ask whether decreases in liquidity could have been associated with changes in the role of
bond financing generally. Based on data assembled from different sources (Federal
Reserve, NBER and Guthman (1950)) we show that bond financing actually grew during
the periods when trading volume collapsed on the Exchange.
Second, we ask whether the drop in liquidity could have resulted from SEC
regulations increasing the cost of listing on the Exchange. We show that the decline in
liquidity was not correlated with a decline in listings. Furthermore, while Exchange
trading disappeared in securities which were exempt from the 1933 and 1934 acts (such
3 The historical evolution of trading volume in municipal and corporate bonds is documented in the present paper. The Treasury and Federal Study of the Government Securities Market, published in July 1959, mentions (Part I, page 95) that trading volume in Treasury securities migrated from the NYSE to the OTC market during the first half of the 1920s.
5
as municipal bonds), it remained active in securities which were subject to this regulation
(most notably stocks).
A third possible explanation focuses on the interaction between different traders, with
different preferences. It is widely recognized that there are positive externalities in
liquidity (see for example the insightful theoretical analyses of Admati and Pfleiderer
(1988) and Pagano (1989)). Traders prefer to route their orders where they expect that
they will find liquidity, i.e., where they expect the other investors to have sent their
orders. These complementarities give rise to multiple equilibria. While each of these
equilibria can be locally stable, it can be upset by an exogenous shock, or a change in the
characteristics of the players. Different equilibria will vary in terms of their attractiveness
for different categories of market participants. Intermediaries benefit when liquidity
concentrates in venues where they earn rents, such as opaque and fragmented markets.
Large institutional investors are likely to benefit relative to retail investors in a dealership
market. We find evidence that, simultaneously with the switch in liquidity from the
exchange to the OTC market, institutional investors and dealers became more important,
relative to retail investors. We ague that, as institutions and dealers became more
prevalent in bond trading, they tipped the balance in favor of the over-the-counter
markets.
To complement this general analysis, we provide detailed analysis of the evolution of
trading in municipal bonds. Municipal bonds are a natural security to study in this
context. The interest on the bonds is tax-exempt, and retail investors are therefore a
significant presence in the market, as they are with equities.4 Migration of liquidity from
the Exchange to the OTC market is most costly for retail investors.
We observe a striking drop in municipal bond trading on the NYSE in the late 1920s.
At that time trading volume was soaring. The Exchange was desperately short of capacity
(see Davis, Neal and White, 2005). The NYSE decided to reallocate capacity from
relatively inactive bonds towards equity, which were more profitable for the floor traders.
4 The other types of securities we observe trading through broker-dealer markets are largely held by institutions, for which transparency is less critical. Corporate and treasury bonds in the U.S. are unattractive to individual investors. Interest is taxed as ordinary income, at high rates in comparison to the returns on stocks. (See Dammon, Spatt, and Zhang (2004).) They are accordingly more naturally held through intermediaries in tax-deferred or tax-free entities.
6
Simultaneously, retail investors, attracted to equities by the large recent returns, lost their
appetite for municipal bonds, leaving investment in this market to institutions. At this
point, trading activity in municipal bonds rapidly migrated to the OTC market. This
experience illustrates how shocks can lead to shifts in the focal point for trading. The
difficulty of reversing such shifts once they have occurred (even if the conditions
triggering the shift change) is illustrated by the inability of the Exchange to regain
volume in municipal bonds, even when equity trading dropped relative to bonds during
the years of the Great Depression.
But did this shift in venues actually affect trading costs? Did the migration of the
municipal bonds from the Exchange to the OTC market alter spreads and liquidity? To
shed light on these questions we compare the costs of trading municipal bonds in the
1920s on the exchange to the costs of trading them today over the counter. The natural or
potential liquidity of these bonds is unlikely to have been higher historically than it is
today. The availability of counterparties is likely to have improved and the costs of
finding them is likely to have decreased since 1927, given the improvements in
communication and data processing. Yet we find that the cost of trading municipals
today is more than twice as high as it was when they were traded on the NYSE 80 years
ago.
A series of recent papers have shown empirically that the microstructure of the bond
market generates large transactions costs, and that the costs of trade are much higher for
smaller trades.5 As Mende, Menkhoff, and Osler (2004) point out, this runs contrary to
models of microstructure based on asymmetric information. In their study of the market
for municipal bonds, Harris and Piwowar (2004) write: “Our results show that municipal
bond trades are significantly more expensive than equivalent sized equity trades.” That
bonds command larger transactions costs than stocks, at least for small and medium sized
trades, is surprising. Risk is one of the main components of the cost of supplying
liquidity. Bonds are less risky than stocks. They should have lower spreads. Harris and
Piwowar (2004) suggest that such large transactions costs reflect the lack of transparency
of the bond market. Another empirical study of the municipal bond market, Green,
5 This is consistent with Bernhardt et al (2004) who show theoretically that, in dealer markets, imperfect competition will lead to greater transactions costs for retail trades. Bernhardt et al (2004) offer empirical evidence that this was the case on the London Stock Exchange when it was a dealer market.
7
Hollifield, and Schürhoff (2004), estimates a structural model of bargaining between
dealers and customers, and concludes that dealers exercise substantial market power. In
their study of the corporate bond market, Edwards, Harris and Piwowar (2004) and
Goldstein, Hotchkiss and Sirri (2005) show that the lack of transparency in the corporate
bond market led to large transactions costs, while the recent improvement in post-trade
transparency associated with the implementation of the TRACE system lowered these
costs for the bonds included in the TRACE system. 6
While these papers all suggest that the relatively large transactions costs facing
bondholders are due to the fragmented and opaque microstructure of the bond market,
they cannot speak to what the costs would be if the bonds were traded in an alternative
venue. The historical experience offers an opportunity to observe such trading.
In the next section we review the organization of the bond market in the 20th century.
In Section III we describe the general factors that appear to have led volume to leave the
exchange. Section IV considers a particular example, involving several New York City
bonds for which trading suddenly evaporated in the late 1920s. In Section V we compare
the costs of trading historically on the exchange and currently over the counter. Section
VI concludes.
II. The organization of bond trading in the 20th century
Corporate and municipal bonds have historically been available both on organized
exchanges and on over-the-counter markets, with the relative importance of these venues
changing over time. A few mechanical aspects of the trading process are similar across
the different venues. Prices on long-term bonds have traditionally been (and still are)
expressed as percentage of par, with trading in eighths, except for Treasuries which trade
in finer increments. In other respects the trading process on the exchange differs
dramatically from its counterpart over-the-counter. In this section we describe the
mechanics of bond trading on the NYSE and in the OTC market in the twentieth century.
6 See also Bessembinder, Maxwell, and Venkataraman (2005).

8
We also summarize the discussion by market participants from the 20s to the 50s of the
relative roles and merits of the two market venues.
Our sources for this information are the books and publications to which we had
access at the Archives of the NYSE.7 We also benefited from useful discussions with
brokers who operated in the bond market on the NYSE in the 1950s.
II.1) Bond trading on the NYSE
Bond trading on the NYSE has always been purely “order-driven,” in contrast
with the equities market, where specialists play a central role. In the equity market
specialists are assigned particular stocks, and assume responsibility for providing
liquidity and maintaining continuous prices. In an order-driven market, the exchange
simply collects, posts and matches the orders of customers and the brokers acting for
them.
The physical separation of bond from stock dealing took place in 1902, when the
so called “bond crowd” was formed. Until the late twenties, bond trading took place in
the same room as stock trading. Trading in the “bond corner” was organized around three
booths in the North East corner of the Exchange (see Meeker, 1922). As trading in bonds
increased, it was allocated more and more space. In May, 1928, the “bond room,” located
at 20 Broad Street, and connected directly with the NYSE floor, was opened for trading
(NYSE Fact Book, 1938). This was part of a general program to increase capacity on the
exchange in response to the increases in volume in the 1920s (see Davis, Neal, and
White, 2005).
Investors trading on the Exchange must pay commissions to the brokers facilitating
the trade. Until 1975, commissions were regulated by the Governing Committee of the
exchange. The constitution of the NYSE, with amendments to November 25, 1927, states
the commission rates in its Article XIX. For bonds, the relevant rules are as follows:
Sec. 2. Commissions shall be as follows: (a) On business for parties not members of the exchange… On Bonds: Not less that $2.00 per $1,000 value.
7 We are very grateful for the kind hospitality and help of the Archives department of the NYSE, especially Steve Wheeler.
9
(b) On business for members of the Exchange when a principal is not given up…
On bonds: Not less than 80 cents per $ 1,000 value. (c) On business for members of the Exchange when a principal is given up… On bonds: Not less than 40 cents per $ 1,000 value… (d) On obligations of the United States, Porto Rico, Philippine Islands and
States, Territories and Municipalities therein…Such rates as members or non-members as may be mutually agreed upon.
Thus, commissions were already deregulated for Treasuries and municipal bonds in
the 1920s. Even for the other bonds, the constraints on commissions on bonds tended to
be quite lenient, relative to commissions on stock trades. For example, on stocks priced
between $10 and $25, for parties not members of the exchange, the minimum
commission could not be less than 12.5 cents per share traded. Hence, for the sale of 50
shares, at a unit price of $20, the commission would have to be above $6.25, substantially
above the $2 threshold prevailing for bonds.
Meeker (1922) and Shultz (1946), who were economists at the NYSE, offer very
detailed descriptions of the bond trading process on the exchange. Meeker (1922)
explains that, in the “bond corner,” trading in foreign bonds and Liberty Bonds was
conducted in the two smaller booths, while the other bonds were traded in the third, and
largest, bond booth. For the more recent period, Shultz (1946) explains that the “bond
room” was divided in four separate divisions: the “active crowd”, the “inactive” or
“book” or “cabinet” crowd, the foreign crowd, and the Government securities crowd.
Frequently-traded domestic bond issues were assigned to the active crowd.
Active bonds were traded on the open outcry floor market. Meeker (1922, page 163)
reports that:
In the case of market orders in the active bonds, whose prices are reported on the right side of the quotation board, the broker after noting the latest price on the board, goes directly to the bond crowd and effects a sale at the most favorable bid or asked price he can obtain.
Shultz (1946) offers a detailed example of order placement and trading in the “active
crowd”:
Broker A’s telephone clerk on the floor receives an order over the direct telephone wire from his office to buy 5 Atchison General 4s of 1995 at 106. He makes out a “buy” order blank and hands it to his broker, who proceeds to bid for the bonds in the crowd. There are no immediate sellers so Broker A leaves the

10
center of the crowd for the time being. The quotation clerk makes a notation to the effect that Broker A is bidding 106 for the bonds. Broker B’s telephone clerk then receives an order from his office to sell 3 Atchison General 4s at 106 ¼ . A “sell” order slip … is made out and handed to broker B, who offers the bonds in the crowd. The quotation clerk records on his slate that Broker B is offering Atchison General 4s at 106 ¼ . A short time later Broker C’s telephone clerk gets a call from his office for a “quote” on Atchison General 4s. The quotation clerk informs him that the market is 106 – ¼ , 106 bid, offered at 106 ¼ . The telephone clerk relays this information back to his office and shortly thereafter receives an order to sell 10 bonds at 106. Broker C takes the “sell” order slip, enters the crowd and learns from the quotation clerk that Broker A is bidding 106 for the bonds… Broker A “takes” 5 at 106 and broker C reduces his offer to 5 Atchison General 4s at 106. The quotation clerk changes his record to show the new offer and erases Broker A’s bid.
The majority of the listed domestic bonds, however, were traded in the inactive,
or cabinet, crowd. In the inactive crowd, all orders were written on standard slips and
filed in the bond “cabinets” or “ledgers.” This was, in effect, a limit-order book,
collecting firm buy and sell orders and enforcing time and price priority. Apart from the
manual technology, the workings of the “bond cabinet” are very similar to those of
electronic order books in the 21st century, such as Euronext, Xetra, Sets, or Inet. Meeker
(1922, page 161) writes:
Since most bonds are relatively inactive, the bid and asked quotations for them are kept on the bond ledgers… Under the name of a given bond issue, the clerk inscribes the various bid and ask quotations for it, as well as the amounts of bonds to be purchased or sold and the initials of the various brokers and dealers from whom he received the information. When these bid and ask quotations are for any reason withdrawn by the bond men, they are erased from the ledger. A bond man can thus learn the market for any inactive bond which he may desire to purchase or to sell, by asking the ledger clerk.
Shultz (1946) provides a detailed illustration the workings of the cabinet:
For example, Broker A’s clerk receives an order to sell 5 Peoples’ Gas, Light and Coke 5s of 47 at 116. He makes out a “sell” order slip and takes it to the cabinet to which the particular bond issue is assigned. The order is handed to a “bond clerk,” a Stock Exchange employee who files the order… Broker B’s clerk then hands the bond clerk an order to sell 30 Peoples’ Gas, Light and Coke 5s of 47 at 116. This order is placed behind Broker A’s order, notwithstanding the size of Broker B’s offer. Broker C’s clerk later enters a “buy” order for the same issue calling for 15 bonds at 115 ¾ … The quotation would now be “115 ¾ -116, 15 and 35”… Broker D receives an order to buy 25 Peoples’ Gas 5s at 116. Inasmuch as Broker A has priority as to time, his order for 5 bonds is completely filled and broker B then sells 20 bonds to broker D.
11
Once the trades had been completed, they were widely disseminated. Meeker
(1922, page 161) explains that:
Reporters obtain the prices of sales as they occur in the bond crowd, make out slips and pass them to the board boys, who at once post the prices on the board – if the bond is one which is recorded there. Simultaneously they inform the telegraph operator, and very shortly afterward the quotations appear on the bond tickers throughout the country.
Thus, the bond market on the NYSE enjoyed a very high level of pre- and post-
trade transparency. All brokers could observe the book of available orders and the recent
trades, and inform their customers about them. In 1976, the NYSE introduced the
Automated Bond System, an electronic order book with full price and time priority. This
system is still in use today, but activity confined to a relatively small number of retail
trades. More than 1000 bond issues are still listed on the Exchange, including Treasury
bonds, Corporate bonds (e.g., General Motors), Utility bonds (Baby Bells), State bonds
(e.g., State of California bonds), and Municipal bonds (e.g., NYC bonds). In all these
cases, however, the overwhelming majority of trades are conducted over the counter.
II.2) The over-the-counter market
While many bonds are (and have traditionally been) exchange listed, many more
are (and have traditionally been) unlisted. Unlisted bonds trade over the counter, in a
market based on bilateral, informal contacts between dealers. Listed bonds too have been
traditionally traded OTC. Bond dealers typically maintain inventories in the securities for
which they “make markets.” A good description of the over-the-counter market at that
time is offered in an investment analysis text published by an NYU professor in 1946:
The market in over-the-counter securities is made by dealers within and between their offices at prices established by individual negotiation, that is, through bid and ask prices… A dealer creates and maintains a market for any issue of bonds or of stock by announcing openly to the other dealer and broker houses that he stands ready both to buy and sell that security at the bid price and the offering price that he quotes to those who inquire… The securities houses that act as dealers or brokers in the over-the-counter market include investment banking houses, over-the-counter houses, municipal bond dealers, government bond dealers, stock exchange firms which operate over-the-counter trading departments, and dealer banks… A house that makes a market in an issue usually “maintains a position” in the security by trading (buying and selling) against its
12
position in the issue. It buys and sells for its own account and risk as principal… Unlike exchanges, where sales in a particular security are concentrated at one post on the exchange floor and the actual prices at which the security is sold are reported, the over-the-counter market is unable to report all transactions in a security. (Prime, 1946, pages 60 to 63.)
In contrast with the exchange, there are no explicit commissions in the over-the-counter
market. In the words of Gellermann (1957, page 104):
“…the price charged by the over-the-counter dealer will be a net price – no mention will be made of a commission, but you can be sure that the equivalent of a commission, or more, will be included in the price.”
We see, then, that a central difference between the two types of trading
mechanisms lies in their relative transparency. On an exchange, there is a location where
orders and transactions prices are recorded, and these are, to varying degrees, available to
the public. In an over-the-counter market, obtaining information about prices involves
contacting several dealers to obtain price quotes. Up to the very recent pas, the resulting
transactions prices were not recorded in any central location, nor were the dealers under
any obligation to disclose them.
Transparency, however, is an endogenous outcome. It would be premature to
conclude that the institutional setting is the cause of the lack of transparency. Both could
be a response to a more fundamental lack of liquidity. If investors almost never wish to
trade their bonds, it may be economically wasteful to maintain the infrastructure to
provide continuous price quotations. On the other hand, investors may rarely trade their
bonds because information about prices is not available at low cost, or because they know
the lack of transparency will put them at an informational disadvantage in negotiating
terms of trade.
II.3) The roles and merits of the two trading venues as viewed by market observers
and participants from the 1920s to the 1950s
II.3.1) Where do bonds trade?
13
Even listed bonds have traditionally also been traded over the counter. The
trading of Treasury bonds, which historically had occurred on the Exchange, migrated to
the OTC dealer market in the twenties. Migration of the trading of corporate bonds
occurred later, during the 1940s. These developments are evident in Figure 1. Panel A
plots bond turnover on the NYSE per year. Bond volume peaked in the 1920’s and 1930s,
fell dramatically in the 1940s, and then rose moderately in the 1960s before tailing off to
negligible amounts in recent years. (The increase in the 1960s was largely due to the
popularity which convertible bonds traded on the exchange enjoyed with retail investors
during this period – see our discussion below in Section III.4.3.) Panel B illustrates that
relative to the volume in equities, the drop in bond volume in the 1940s was even more
dramatic. Bond volume rose to over 30% of stock volume during the depression years,
fell precipitously in the 1940s, and has continued a steady decline since then.
Contemporary observers were aware of these trends. As early as 1946, an
investments textbook mentioned that:
Prominent among the issues that are traded both on an exchange and over-the-counter are United States Treasury bonds and such instrumentalities as Federal Farm Mortgage Corporations and Home Owners Loan Corporation issues. The volume of trading in these issues, especially Treasury bonds, in the over-the-counter market ordinarily exceeds that on the exchanges. (Prime, 1946, page 59.)
A few pages later in the same book, we find, “Stocks are bought and sold primarily
through the exchanges; bonds are usually bought and sold over the counter. (Prime, 1946,
page 65)”
Along the same lines, P. Shultz concluded his book with a list of open issues,
including the following question, “What is to be done about bond trading, only 10 per
cent of which is now done on the exchange and the rest over-the-counter?” (Shultz, 1946)
A book written in the 1950’s by an investment banker, noted that:
The major, and often the only, market for state, county, city, town, and village bonds—as well as the increasing number of obligations issued by the so-called authorities—is also the over-the-counter market. … Corporate bonds—industrial, rail, and utility—are frequently traded over-the-counter even though such issues are listed on an exchange. (Gellermann, 1957, pages 102 and 103).
14
II.3.2) What are the relative advantages and disadvantages of exchange and OTC
trading, and for whom?
In the thirties, it seems to have been recognized that exchange listing was
associated with greater liquidity—the ability to trade cheaply and quickly without
moving the price. An interesting little book, published in 1932, The Confessions of a
Bond Salesman, concludes its Chapter III (page 19) as follows:
He who is likely to need quickly to turn his capital into cash—and what investor is not—should, by all means, buy listed securities, or securities whose market is based upon the listed market. Even, Lawrence Chamberlain, who was a senior manager of a Bond House,
conducting trading in the OTC market, and a vocal advocate of the latter system, writes
that, “It is unquestionably true that the average listed bond can be more readily sold or
hypothecated than the average unlisted.” (Chamberlain, 1925, page 63) On the other
hand, Chamberlain described the OTC market as a significant competitor of the
exchange, already in the 1920s:
The great system of American bond houses … is really an immense exchange in itself, reaching out with its branch offices and traveling representatives over the more settled parts of the United States and Canada. This system, with the aid of telegraph and telephone, fulfils for most purposes the legitimate functions of an investment exchange. There is of course no similar system for stocks… So satisfactory is this system of bond-interchange that over 90 per cent of transactions in listed bonds (it is estimated) takes place outside of the exchanges. If one wished to buy or sell Peoples’ Gas Light and Coke Company Refunding 5s he would probably do slightly better with a well-known Chicago Bond house than on the New York or Chicago exchange. (Chamberlain, 1925, page 66.)
Market participants and observers were also aware that different trading venues
were preferable for different types of investors. In his 1946 investment analysis textbook,
NYU professor John Prime wrote:
Some securities have certain features that make them especially adaptable to trading in the over-the-counter market. Among those features [is the] eligibility for purchase by banks and insurance companies… Institutional
15
investors such as banks and insurance companies usually buy and sell securities in large blocks… They desire to avoid a public record of large purchases or sales of bonds because of the adverse effect such a transaction may have on the market price of such issues… Furthermore, since a large buying order on the Exchange at a limited price must give precedence to all orders having priority at that price, the institutional order would experience difficulty in completion at the limited price. The over-the-counter-dealer is in a better position to provide this service than the stock exchange broker. (Prime, 1946, page 66.)
While this emphasizes the advantages of the OTC market for large institutions,
Gellerman, who was an investment banker, mentions the disadvantages of this market for
small investors:
There is no record of transactions in the over-the-counter market, which puts the individual investor at a strong disadvantage. The professional or institutional investor can transact business with an over-the-counter firm on some basis of equality, but the individual is more or less forced to rely on the integrity of the firm with which it is dealing. Almost all over-the-counter firms are members of the National Association of Securities Dealers, which has regulatory authority over its members. NASD has never ruled on what it considers a reasonable profit on a purchase or sale by one of its members, but is known to favor between 3 and 5 per cent. There have been some startling deviations from this policy, however. (Gellermann, 1957, pages 104 and 105.)
III. Why did the bond market move to the OTC?
In this section, we first describe the data we use in our study. Then, we then
consider possible explanations for the migration of volume away from exchange trading
in light of these data.
III.1) Data
We collected historical data on the bond market from several different sources.
III.1.1 Total amount of bonds outstanding
Hickman (1960) provides data on the total par amount of outstanding corporate
bond issues between 1900 and 1944. He also documents which of these issues are listed
16
on the NYSE and which are not. The latter are mostly private issues, traded over-the-
counter. This book provides no information on Treasuries or Municipal bonds, however.
The NYSE factbook on line (www.nysedata.com/factbook) provides rich
historical data on the total amount of outstanding bond issues listed on the NYSE, often
dating back to the first half of the 20th century. It does not, however, categorize the bonds
by type of issuer.
The Federal Reserve bank (www.federalreserve.gov/releases/z1/) provides a
yearly time-series, dating back to 1944, of the flow of funds statistics. That includes the
total amount of outstanding bonds, categorized by type of issuers (Treasury, Municipal,
Corporate), as well as information on who holds these bonds. However, it does not
document whether these bonds are listed on the NYSE or not.
Guthman (1950) provides information on the total amount of bonds outstanding
between 1920 and 1948. He categorizes these bonds by issuer type (Treasuries,
Corporate, Munis). He also gives information on who holds these bonds, but does not
document whether the bonds are listed on the NYSE.
III.1.2 Trading volume
The NYSE factbook on line (www.nysedata.com/factbook) also provides
historical data on the trading volume in bond issues listed on the NYSE, often dating
back to the first half of the 20th century. Again, it does not categorize these bonds by type
of issuer. There are no historical data available on trading volume in the OTC market.
Until very recently, trades conducted over the counter were not compiled in a central
source, or reported to the investing public and regulatory authorities.
III.2) Trends in bond financing
We first note that the decline in bond trading on the exchanges has occurred
despite broad increases in the supply of bonds outstanding in all sectors. Figure 2
combines data from different sources (Guthman, 1950, Hickman, 1960 and The Flow of
Funds compiled by the Federal Reserve Bank) to show increases in par value outstanding
from 1920 to 2002 for treasury, municipal, and corporate bonds. To ensure comparability
17
all the figures are in 2002 dollars, using the Consumer Price Index. There is a steady
geometric increase in corporate bonds outstanding (in real terms), reflecting economy-
wide growth in economic activity and new investment in the corporate sector.8 Both
municipal and federal debt show more variable growth rates, reflecting the cycles in
government surpluses and deficits. Treasury debt jumped dramatically in the early 1940s
to finance the war effort. Both municipal and federal debt decreased in real terms slightly
in the 1990s because of government surpluses.
Comparing Figure 2 to Figure 1, it is clear that changes in trading volume on the
exchange are not explained by changes in the supply of bonds. There is no evidence of a
drop in debt financing in the 1940s, which was the period when the drop in volume is
most striking. Bond trading volume on the exchange largely disappeared in the 1980s
and 1990s. Yet this was a period when U.S. corporations made net substitutions of debt
for equity, as shown, for example, in Rajan and Zingales (1995). Debt outstanding grew
by more than net new investment, because firms financed repurchases of shares with
debt.
III.3) The regulatory and disclosure costs
A second possibility, which is often advanced by practitioners, is that trading
volume dropped on the exchange in the 1940s because bond listings declined, in response
to the regulatory requirements associated with New Deal security legislation.9 The
Securities Act of 1933, which is concerned with the initial distribution of securities, states
that securities offered to the public must be registered with the SEC. The registration
statement must contain specific information about the security, the issuer, and the
underwriters. The Securities Exchange Act of 1934, which is concerned with secondary
trading, states that no security may be listed on an exchange unless its issuer files an
application for registration containing much the same information as is required by the
8 This increase also reflects the financial choices of US corporations in the 2 postwar decades, during which debt increased from 15 to 30% of corporate financing, while the use of equity declined from 5 to 2% of corporate financing (see White, 2000, page 777). 9 For a description of this regulatory framework, see Loss and Seligman, 1998, in particular Volume I, pages 225 and 226. See also White, 2000.
18
1933 Act. This information must be kept current by the filing of annual and other reports
with the exchange and the SEC. Securities that are not listed on an exchange are not
subject to these provisions. The regulatory burden associated with public trading and
exchange listing may have encouraged their private placement and led to a decrease in
trading volume on the exchange.
In light of this hypothesis, consider the time series of the number of bond issues
listed on the NYSE between 1925 and 2003 which we obtained from the NYSE factbook
on line (www.nysedata.com/factbook). To shed some light on the relation between this
variable and trading volume on the exchange, we also plot on the same graph the time
series of bond trading volume on the NYSE. The trading volume figures are expressed in
2003 dollars, using the Consumer Price index.
Figure 3 shows no evident association between the bond volume and bond listings
on the exchange. Bond trading volume was at its peak in the mid 1930s, when the number
of bonds listed was slightly lower than 1600. The number of bonds listed was at its peak
in 1986, with 3856 issues listed, and yet bond trading volume on the exchange was very
limited at this point in time.
The overall drop in bond trading volume on the exchange was, apparently, not
driven primarily by a drop in the number of listings. More direct evidence to this effect
comes from considering Treasury and municipal securities. Trading in these bonds
migrated away from the NYSE before 1930, and Exchange trading never recovered in
these securities. Yet they were exempt from the 1933 and 1934 Acts. In contrast, stocks
were subject to the 1933 and 1934 acts, and yet did not migrate to the OTC market.
It seems implausible, then, to attribute the drop in bond trading volume on the
Exchange to increased listing costs associated with the New Deal securities legislation.
III.4) The balance of trading clienteles
Liquidity attracts liquidity. There are obvious positive externalities in trading.
Once a trading venue becomes a focal point for trading, it is difficult to move trading
elsewhere because of the coordination problems involved. The first defectors from the
19
status quo will have no one to trade with, unless they can bring large numbers of other
participants with them. Similarly, once volume migrates away from a venue, it can be
very difficult to get it back.
As discussed earlier, dealers and large institutions are likely to fare well in an
over-the-counter setting. Their professionalized management and frequent presence in the
market makes transparency less important to them than to less sophisticated small
investors who trade infrequently. The repeated interaction that dealers and institutions
have with each other renders them less vulnerable to the opportunities which a lack of
transparency affords other participants to profit at their expense on a one-time basis.
Smaller institutions and individuals, for the opposite reasons, will tend to fare better in an
exchange-based trading regime. Indeed, the theoretical model of Bernhardt et al (2004)
shows that, in a dealer market, large institutions will trade more frequently and in larger
amounts than retail investors, and incur lower transactions costs.10
Nevertheless, the theory of market microstructure also makes clear that large
traders and small traders need each other. Institutions and dealers are likely to be better
informed. Their trades inform prices and this benefits small uninformed investors who
can thus trade at “informationally efficient” prices. Institutions and dealers need small
investors (the fabled “liquidity traders” of market microstructure models) to absorb large
positions they are unwinding in their roles as intermediaries to issuers or arbitrageurs.
Thus, there are forces that will lead traders of different types to follow each other to
venues that might at first appear disadvantageous to them. This point is formally
established in the insightful theoretical analysis of Admati and Pfleiderer (1988).
In the case of the bond markets, over-the-counter and exchange-based trading
coexisted for decades in the 20th century with viable levels of activity in each setting.
What upset this balance? A natural place to look is to changes in the relative importance
of types of traders. We argue that several factors combined in the late 1940s to increase
the importance of the coalition of dealers and institutions, allowing them to abandon the
exchanges and forcing smaller investors to follow them to the OTC market.
10 Bernhardt et al (2004) also offer an interesting empirical illustration of these effects in the case of the London Stock Exchange.
20
III.4.1) Dealers
As mentioned earlier, there was a sharp increase in the total amount of Treasury
bonds outstanding from 1940 to 1945 (see Figure 2). While this increase was partly
corrected between 1945 and 1950, the amount of public debt remained quite high.
Treasury bonds were mostly traded over-the-counter by dealers. The increase in the total
amount of public debt is likely to have enhanced the role of dealers in global financial
markets.
As mentioned by Meltzer and von der Linde (1960, page 2), 17 dealers operated
in the Treasury market in the post-war period. Five were bank dealers.11 The others were
nonbank dealers.12 Meltzer and von der Linde (1960, page 11) note that:
In five cases, Government securities operations are conducted in a relatively small department of a large bank. For some nonbank dealers other activities – dealing in corporate or municipal bonds, underwriting new issues, or trading on organized exchanges – are regarded as the principal occupation of the firm.
Thus, enhanced activity in the Treasury market might have interacted with the activities
of the dealers in the other segments of the bond market. Indeed, market-making in the
bond market hinges on providing immediacy and price discovery in relatively illiquid
securities, while relying on highly liquid securities for hedging and information. For
example, if a dealer purchases large quantity of municipal bonds, in underwriting or
providing liquidity to a large investor, it could hedge interest rate exposure by lowering
its inventory in liquid Treasuries. Also, when pricing corporate bonds, dealers can rely on
their direct observation of the benchmark Treasury yield curve. Thus, it is likely that
increased activity and liquidity in the Treasury market facilitated market making in other
segments of the bond market, such as the municipal and corporate bond markets.
The above discussion suggests that the importance and effectiveness of dealers in
the bond market is likely to have increased in the 1940s, relative to the 1930s.
11 Bankers Trust, Chemical Bank, Continental Illinois, First National Bank of Chicago and Morgan. 12 Bartow, Leeds & Co, Briggs, Schaedle & Co, C.F. Childs & Co, C.J. Devine & Co, Discount Corp, First Boston, Aubrey, Lanston & Co, New York Hanseatic Corp, Wm. E. Pollock & Co, Cha. E. Quincey & Co, D. W. Rich & Co, Salomon Bros & Hutzler.
21
III.4.2) Institutional investors
To examine further the balance between investor clienteles, we study the
evolution of the structure of the ownership of bonds. Excellent data on bond ownership
structure is available from the Fed for the period starting in 1944. For the previous
period, data is more difficult to obtain. However, Guthman (1950) does offer data on
institutional ownership from 1920 to 1948. Combining these two data sources, we present
in Figure 4 a (somewhat incomplete) picture of the evolution of bond ownership between
1920 and 2004.13
As can be seen in Figure 4, Panel A, there was a dramatic increase in institutional
ownership in corporate bonds between 1940 and 1960. In the 1940s the weight and
importance of institutional investors in the bond market grew tremendously. Given the
ownership structure, it is very likely that these investors came to amount for the majority
of the trading activity in the bond market. Naturally, they chose to direct their trades to
the dealer market, where they could effectively exploit their bargaining power, without
being hindered by reporting and price priority constraints. Thus, the liquidity of the
corporate bond market migrated to the dealer market.
As can be seen in Figure 4, Panel B, the ownership structure is quite different in
the municipal market. There, households hold a very large fraction of the bonds, typically
between 30% and 40%. This percentage does not tend to decrease throughout the
century. This is due to the tax-exempt status of Municipal bonds, which made them
relatively attractive for individual investors, especially at a time when personal income
taxation was rising. For example, an NBER study conducted in the 1950s finds:
…personal income tax rates starting at 4% at the first bracket and reaching 79% at the top in 1940 compared with the 1944 (and 1945) rate schedule which spanned a range from 23% to 94%. (Holland, 1958, page 9)
13 The fraction of the bonds owned by different categories of investors is depicted on the vertical axis. For the period before 1945, we only have the total amount and the amount owned by insurance companies, banks and savings institutions. For the period following 1945, we have data on all categories of owners. The percentages on the figure don’t add up to one because we have not depicted certain categories of investors. For example, foreign corporate bond ownership, which has become important in the recent years, is not depicted in the figure.
22
While individuals have always had an important presence in the municipal
market, the figure shows the composition of institutional holders changed dramatically in
the 1980s. The share of municipals held by banks dropped dramatically, while that of
mutual funds rose to offset this drop. This reflects changes in the tax law that limited the
ability of commercial banks to deduct interest liabilities used to finance holdings of
municipals. (See Feldstein, Fabozzi, and Fabozzi (1995), p. 178.) The ability to engage
in this quasi-tax-arbitrage obviously made municipal bonds especially attractive to banks.
Mutual funds, in contrast, simply pass the tax-exempt treatment of the bonds through to
the mutual-fund shareholder.
Yet, in spite of significant individual ownership, the municipal market also
migrated to the OTC market (see for example the above quotation from Gellerman,
1957). In the next section, we offer a detailed investigation of this migration. Before we
turn to municipal bonds, we discuss the case of convertible bonds and stocks, which offer
interesting benchmarks.
III.4.3) Convertible bonds
A relatively recent example of migration from the Exchange to the OTC market is
offered by the convertible bond market. As can be seen in Figure 1, Panel A and in
Figure 3, there was some revival of the NYSE bond market in the late 1960s. This was
due to the rise of the convertible market, and the interest that retail investors took in this
market.14 An early indication of this evolution is given in the NYSE fact book from 1967,
on page 14:
Bond volume on the exchange in 1966 was the highest since 1943... the 50
bonds with the largest volume accounted for 65% of the of the activity... Among the 50 most active bonds, 42 were either convertible bonds or bonds maturing within a year or so... Convertible bonds are exempt from the FRB margin requirements at banks and, when selling above the conversion price, rise and fall with the stock into which they are convertible. Thus, these bonds have more appeal to individual traders and investors than do straight corporate bonds.
14 Unlike the other segments of the bond market, trading in convertible bonds remained floor-based even after 1976.
23
1967 was a further record breaking year for bond trading volume, and, as
mentioned on page 15 in the NYSE fact book for that year, convertible bonds amounted
to 63% of all the trading volume that year. The next years continued to see high bond
trading volume on the Exchange, and significant retail activity. For example, the 1972
fact book notes, on page 17: "Individual investors continued to be attracted to the bond
market in 1971.” And a few sentences later: “Of the 50 leading bonds, 32 were
convertible issues, the same number as in 1970.” Then, as can be seen in Figures 1 and 3,
bond trading on the Exchange declined again. As was explained to us by a bond broker
who operated in that market at the time, as the market for convertibles matured, it became
dominated by large institutions. The latter chose to direct their orders to the OTC market,
and liquidity migrated away from the Exchange. Correspondingly, in 1973, the NYSE
fact book, noted, on page 17, that: “individual investor's participation in the bond market
diminished.” This anecdotal evidence is consistent with our argument that when the
weight of institutions reaches a critical point, small traders are forced to follow large
traders to the OTC venue.
III.4.3) Stocks
One may wonder why exchange trading remained predominant in the stock
market, in such a stark contrast with the bond market.
As mentioned above, one difference between bond and stock trading on the
Exchange is that, while the bond market has always been purely order driven, specialists
have traditionally supplied liquidity supply in the stock market. It is possible that the
presence of the specialist anchored the liquidity on the exchange. Because it was common
knowledge that the specialist would be there to supply liquidity, small and medium sized
trades could continue to be directed to the exchange. Because liquidity attracts liquidity,
the larger traders also found it attractive to trade there, in line with the logic of Admati
and Pfleiderer (1988).
Our arguments in the previous subsections also suggest that Exchange trading
should be expected as long as small investors played an important role in the market.
24
Consistent with this prediction, the rise of institutional investors was weaker and more
delayed in the stock market than in the bond market. In the latter it took place in the
thirties and the forties, while in the former it only started in the second half of the fifties.
Quite remarkably, this is when the Exchange introduced Rule 394 (later Rule 390), which
prohibited NYSE members from trading NYSE listed securities away from the Exchange.
As noted by White (2000, page 784): “The NYSE specialists lobbied their exchange to
adopt Rule 394 in 1955 to prevent commission houses from abandoning the floor of the
exchange for telephones.”
IV. The disappearance of municipal bonds trading on the exchange
Through the 1920s the NYSE made a market in sixteen long-term New York City
municipal bonds. All the bonds had initially been issued with a maturity of 50 years. In
this section and the following one, we study a representative sub-sample of 6 municipal
bonds.
IV.1) Data
Thanks to the help and hospitality of the Archives Department of the NYSE, we
have manually collected data on Exchange trades and quotes for the representative sub-
sample of 6 of these 16 municipal bonds, during 292 trading days, from July 1, 1926 to
March 31, 1930.
The Exchange supplied data on all trades and daily quotes to a data vendor,
Francis Emory Fitch, which reported it in a daily publication. Quotes were also reported,
on a weekly basis, in the Commercial and Financial Chronicle. The Chronicle also
reported the highest and lowest transaction price during the week, as well as the total
quantity traded that week. On weeks without trades, the Chronicle reported the price and
month of the last trade. Both the Francis Emory Fitch and the Commercial and Financial
Chronicle data are available at the NYSE archives.
25
For the largest part of this period, our data stems from the Francis Emory Fitch
reports, which contain more information than the Commercial and Financial Chronicle.
The Francis Emory Fitch data was unfortunately not available at the Archives for the first
6 months of 1928. For that period, we relied only on the Commercial and Financial
Chronicle. For the periods for which both data sources are available, we checked that the
information reported by the Commercial and Financial Chronicle were consistent with
that reported by Francis Emory Fitch.
For the period for which we have the Francis Emory Fitch data (July 1, 1926 to
December 31, 1927, and July 1, 1928 to March 31, 1930) we have data on each and every
trade conducted on the Exchange in these 6 bonds. We know which day the trade took
place, as well as the transaction price and the quantity traded. We also have an indication
of when during the day the trade took place. To be specific, we know if the trade took
place between 10:00 a.m and 12:00 noon, or between 12:00 noon and 2:00 p.m, or
between 2:00 p.m and 4:00 p.m. We also observe the bid and ask quotes reported at 11:00
a.m. For the first year of the sample (July 1, 1926 to June 30, 1927), we have also
collected the bid and ask quotes on days without transactions. The time series of bid and
ask quotes and transactions prices for the six New York City municipal bonds from July
1, 1926 to June 30, 1927 is depicted in Figure 5.
For the first 6 month of 1928, we rely on the Commercial and Financial
Chronicle, and thus we observe bid and ask quotes only at the weekly frequency. Also,
for each week, we observe only the highest and lowest price and total traded quantity. For
the large majority of the weeks, this is not a limitation, however, as there is no more than
one trade per week.
IV.2) Results
IV.2.1) Trading in municipals on the NYSE collapsed at the beginning of 1929
Figure 6, Panel A, displays monthly trading volume on the NYSE for the six NYC
municipal bonds, measured in number of lots traded. Figure 6, Panel B, plots the average
price impact of trades within each month, where the price impact is the absolute value of
26
the percentage difference between the transaction price and the mid-quote for that day.
Figure 6 shows that the market was quite active, and price impact rather low in 1926 and
1927 (below 50 bp!). Towards the end of the period, however, liquidity, whether
measured by the cost of trading or the amount of trading, collapsed in a remarkably short
period of time. As can be seen in Panel A, volume collapsed in February 1929. Panel B
shows that price impact had been rising since August 1928. While it had remained below
.5% until July, it approached 1% in August. After February, it ranged between 1.5% and
2.5%. Through March of 1930, Francis Emory Fitch continued to report some quotes for
Municipal bonds, and a few rare trades. After April of 1930, liquidity had permanently
vanished. Francis Emory Fitch had no longer any quote or trade data to report for
municipal bonds. We checked that this continued through the end of the decade. In
January 1933, October 1936, and October 1939, for example, there were no trades and no
quotes whatsoever.
The disappearance of municipal trading on the exchange does not appear to be
associated with similar happenings in the corporate bond market. In general, during the
1930s, bond trading on the NYSE was very active, as illustrated in Figure 1. There was
no transient decrease in bond trading overall on the exchange in early 1929. For
example, the Wall Street Journal reported bond sales on the exchange for the year of
$3.045 billion, up slightly over the $2.962 for 1928. (WSJ, “Yearly Bond Sales,” January
3, 1930, p. 20)
So, why did liquidity suddenly disappear in municipal trading on the Exchange?
Municipal bond volume migrated off the exchange because of a convergence of factors,
which now we examine in turn.
IV.2.2) The surge in stock trading in the late 1920s raised the profits of members but
created capacity constraint problems
Bond volume on the exchange was flat in the 1920s, in contrast to stock volume.
Figure 7 uses data published January 3, 1929 in the Wall Street Journal, and shows bond
volume (par value), stock volume (shares traded) and exchange seat prices (midpoint
between the high and low dollar values). Each series is normalized by its value in 1890,
27
to emphasize the relative growth rates. Prior to 1920, bond volume and stock volume
trended upward together, along with seat prices. For example, in the post-war recovery,
from 1918 to 1919, all three roughly doubled. Bond volume peaked in 1922, but stock
volume shot up dramatically in the boom of the late 1920s. This surge was in large
measure due to increased access and interest on the part of retail investors.
The increase in stock trading activity raised the profits of the members of the
Exchange. Figure 7 shows that seat prices (which reflect the expectation of the
capitalized profits of the members) tend to follow stock volume, when growth in stock
volume and bond volume depart. The marginal seat price was, apparently, driven by
activity in stocks, not bonds. A regression of the percentage change in the normalized
seat price against percentage changes in normalized bond and stock volumes yields an
adjusted R2 of 43%. The coefficient of stock volume is significantly positive with a t-
statistic of 5.28, while that of bond volume is not significantly different from 0. Given the
strong public demand for investing in stocks, and the commission rates described in
Section II, stock trading was more profitable than bond trading.
While the increase in stock trading activity raised the profits of members, it also
strained capacity. An article in the Wall Street Journal on January 3, 1929 (p. 31) states:
Since the speculative phase in stocks set in April, last, the physical and mechanical facilities of the Exchange have been taxed to capacity and, notwithstanding many improvements made for faster service, the ticker service during many sessions proved to be unable to keep abreast of he actual sales made on the floor, especially during the 2,000,000 and 3,000,000 share days.
Davis, Neal and White (2005) chronicle the exchange’s attempts to increase capacity in
response to the dramatic increases in volume. On several days during 1928, the exchange
was forced to close on the day following a day of unprecedented trading volume. The
exchange eventually declared a quarter-seat dividend to all existing members, in order to
increase the number of seats available and thus the number of people allowed to trade on
the floor.
IV.2.3) One response to these capacity problems was to allocate trading capacity away
from bonds, towards equities
28
The reallocation of resources to stocks is reflected in the minutes of the
Committee on Arrangements of the NYSE through the early part of 1929. In the minutes
of January 3, for example, the committee approved “allowing Arthur E. French & Co. to
have a telephone space in sections WA and WB in the bond crowd, for stock business.”
The committee approved a similar proposal for another member firm on January 8, and
also referred to two individual members the “matter of removing the Inactive Stock
Crowd to the bond room.” In the January 15 meeting, one of those individuals, M. Mills,
“reported progress with reference to the location of post 30 in the bond room.” There
then follows, in February and March, a series of approvals of changes of location,
moving responsibility for 16 individual preferred stocks and two common stocks to Post
30 from other posts. Examples of these entries are: March 26, “Request of Arthur A.
Zucker to move Filene's sons company 6½% cumulative preferred to post 30, effective
April 1, 1929, was approved.” April 2, “The committee approved the request ... that the
Common Stock of the Nickel's Holding Corporation be moved from post 14 to post 30.”
These changes involved costly adjustments to infrastructure, and so were not trivial
decisions. On March 12, for example, the minutes report: “The committee directed that
Post 30 be removed to the Southerly Bond Crowd Room as soon as a separate tube
station relay can be provided...As soon as post 30 is moved, telephone booths are to be
placed in the space now occupied by that post.”
IV.2.4) In the late 1920s, institutions became relatively more important than retail
investors in municipal bonds
As retail investors were attracted by the dramatic appreciation in equities, they
lost interest in less exciting securities, which they had held traditionally, such as
municipal bonds. The New York Times states in late January, 1929:
Since municipalities in various parts of the country have found, to their chagrin, that they cannot borrow at nearly as advantageous rates this year as last, the charge is made in many quarters that the stock market is directly responsible. In other words, an investor will not take a municipal bond at 4 per cent if he sees an
29
opportunity to double his money in the stock market. (NYT, Jan. 31, 1929, “Topics in Wall Street,” p. 29.)
This left institutions as the major player in the municipal market. For example, near the
end of January 1929 the New York Times reported, “There were probably fewer
municipal bonds sold at retail this week than in any week since December. Insurance
companies and institutions did what little buying was noted.” (NYT, Jan. 26, 1929,
“$21,488,121 Sought by Municipalities.”) In early February the Times stated:
The municipal bond market this week has been extremely quiet, though most of the new offerings have been fairly well received. Institutions continue to furnish most of the buying power, and, in addition to the new offerings, have been called upon to absorb various blocks of old issues which have been brought out of retirement. (NYT, Feb. 2, 1929, “58 Loans Sought by Municipalities,” p. 27.)
As discussed above, while retail investors tend to be hurt by OTC trading, institutions can
benefit from it. Hence, the investors active in municipal bonds in the late 1920s were
naturally attracted by the OTC market.
IV.2.5) Putting the pieces together
These several factors—booming demand for high margin stock trading services,
flat demand for lower margin bond trading services, waning interest in municipal bonds
in particular from the retail clienteles which the Exchange serves best, and reduction by
the Exchange of the resources available for bond trading, to better serve stock traders—
combine to provide a circumstantial case that Exchange trading in municipal bonds
stopped in early 1929 because floor traders had more profitable activities to pursue and
institutions, which had become the main players in this market, naturally gravitated to
OTC trading.
As it turned out, of course, the boom in equity volume was short-lived. Yet
municipal bond volume never returned to the Exchange. This irreversibility is not
surprising, due to the positive externalities associated with liquidity, and the coordination
problems in moving volume from one venue to another. Concerned with the competition
of the OTC market, in the mid 1930s the Exchange introduced the “nine bond rule”:

30
The Committee has recently ruled that members must seek a market on the Exchange in certain bonds before executing orders for less than 10 bonds elsewhere. This rule is likewise intended to give the public the full benefit of the existing market and it is hoped that eventually it will result in bringing to the Exchange a larger portion of the business in listed bonds which is now done over the counter. (New York Stock Exchange Committee on Bonds: Report to the Governing Committee. May 12, 1936).
While this rule may have had some effect in corporate bonds, it did not result in a revival
of municipals trading on the Exchange.
V. Historical evidence on the consequences of the migration of the bond market to the OTC
Volume, trading costs, and the trading venue are all jointly endogenous outcomes.
Of these outcomes the structure of the trading venue is the one that falls within the
control of regulatory authorities. The natural policy questions in market micro-structure,
therefore, involve how the structure of the trading venue affects the ease, frequency, and
cost of trading. Market makers, exchange authorities, and providers of trading services
also have a natural interest in this question, as they attempt to compete for trading
volume. So do investors and issuers.
A centralized exchange, like the NYSE, and the decentralized, dealer-
intermediated market through which bonds are traded in the U.S., represent polar
extremes in market design. The exchange offers transparency ex-ante, through publicly
posted bid-ask spreads, and ex-post, through public reporting of transaction prices. There
is no such transparency in the bond market. Comparing the costs of trading stocks, which
are listed on exchanges, and bonds, which trade through a dealer market, confounds the
effects of trading different types of securities with the consequences of the trading in
different venues.
In this section we compare the costs of trading municipal bonds at a time when
they traded actively on the NYSE with the costs of trading the bonds recently, when they
traded in dealer markets. Examining the historical experience does not eliminate the
problems with the joint endogeneity of the variables of interest, but it does inform the
31
questions at hand in a unique manner. The natural concern is that the use of broker-
dealer intermediated markets, infrequent trade, and the high costs of trading are all
attributable to the lack of a need for frequent trade by bondholders—the natural or
potential liquidity in the market. It is difficult (at least for the authors) to imagine how
this could have been higher in the1920s than it is today, when virtually all other measures
of liquidity in financial markets—such as volume and turnover—in all other sectors have
increased so dramatically in the intervening years. Similarly, the underlying exogenous
costs of trading have surely decreased through time. These costs are largely the costs of
gathering and disseminating information, and matching buyers and sellers who are
physically separated in time and space. Technology has lowered these costs
tremendously, due to the speed of electronic communication and data processing.
Accordingly, if we find that it is more expensive to trade a municipal bond
through the dealership market in 2002 than it was on the exchange in 1926, one might
more confidently attribute much of the cost differential to the transparency of the trading
venue.
All the bonds in the historical sample are New York City municipals. These
were, and are today, among the most liquid bonds in the municipal market. All six of
these bonds were “seasoned” during the sample period. They had all been issued more
than ten years previously. They were all very long maturity, having been issued with a
maturity of 50 years. Table 1 reports descriptive information and summary statistics for
the bonds.
Table 2 reports similar statistics for modern New York municipal bonds. New
York bonds are among the most liquid municipal bonds in the modern market for several
reasons. Because New York has high state income taxes, and only New York issues
qualify as tax-exempt for New York state income tax, New York residents
understandably favor New York bonds. The state also has many high-income residents,
with high marginal tax rates, who are attracted to municipals. It is also a state with a
large population. Thus, the bonds in Table 2 trade relatively frequently when compared
to the population of municipal bonds. The modern environment does not offer a set of
municipal bonds with maturities as long as the bonds from the 1920s. Municipal bonds
today are typically issued “in series.” A single underwriting includes a range of
32
maturities up to 20-30 years. Most long-term municipals are also callable. Therefore, by
the time most of the bonds have five to ten years of seasoning, they are often close to
their call date. All the bonds we have selected have more than five years of seasoning.
Nevertheless, it is obvious from inspection of the table that the modern bonds typically
trade with greater frequency and in larger volumes than did the New York City bonds
during 1926-1927.
The sample of 39 modern bonds was gathered from the web site
“Investinbonds.com.” This web site reports historical transactions in municipal bonds
gathered by the Municipal Securities Rule Making Board (MSRB), and combines these
transactions data with information on the bonds, such as credit ratings, obtained from
other data vendors. The MSRB began requiring all registered broker dealers to report
transactions in municipal bonds to them beginning in May of 2000. The data was
initially made available to the public with a 30-day lag, unless the bond traded more than
four times in a day, in which case it was reported with a one-day lag. Through a series of
steps, the MSRB has moved to more timely reporting, until currently transactions are
reported 15 minutes after they are executed. The MSRB data identify trades as customer
purchases, customer sales, or interdealer trades.
The time series of bid and ask quotes and transactions prices from the 1920s for
the six New York City municipal bonds in our sample is shown in Figure 5. Most trades
occur at the best quotes or between them. The latter case corresponds to the situation
where the brokers of the buyer and the seller meet on the floor and agree on a transaction
price within the quotes. Thus, the average “price impact” (defined as the absolute value
of the difference between the transaction price and the mid-quote, divided by the latter) is
slightly lower than half the spread. There are also some trades outside of the quotes.
These may arise because the transaction occurred at a different point in time than the
quotation, because of the large size of the trade, or because of a data error. Nevertheless,
it appears that the quoted spread provides a reasonably generous measure of the cost of
trading for the bonds, when augmented with the commission.
For the modern sample, we do not have quoted spreads. Trading is quite
infrequent, however, and most trades can be matched with offsetting transactions that
clear dealer inventories. Trades in seasoned bonds are usually initiated with a sale by a
33
customer to a dealer. We select all customer sales followed by customer purchases that
add up in par value to the initial sale, with no intervening transactions. Our measure of
trading cost is the realized “dealer markup,” the percentage return earned by the dealer on
the round-trip transaction. Green, Hollifield, and Schürhoff (2004) apply other trade
matching methods, such as a first-in-first-out rule, and find that they yield similar
measure of trading costs. Harris and Pirowar (2004) use time-series methods to estimate
effective spreads for the bonds that experienced more than four trades during their sample
period, and also find measures of trading cost that average between 1.5% and 2.0% for
retail trades.
While there is cross-sectional variation in the measures of trading cost for both
sets of bonds, and the costs of trading appear correlated with trading frequency and
volume, the trading costs are still uniformly lower in the historical sample. The average
dealer markup across the bonds in the modern sample is 2.45%. For the municipals
trading on the NYSE in 1926-1927, the average percentage bid-ask spread was 0.59%.
The average price impact was 0.246%. As discussed earlier, traders had to pay
commissions on the exchange. A generous estimate of the magnitude for a commission
would be $2 for a $1000 trade. Even after adding the corresponding round-trip
commission of 0.4% to the average bid-ask spread, our findings suggest that transactions
costs for retail investors in the municipal bond market in the 1920s were less than half
what they are now. Our sample of modern municipals are very seasoned, and hence may
have higher costs associated with them than other bonds. Harris and Piwowar (2004)
find that effective spreads in the municipal bond market average 2 percent for retail size
trades.
It is also striking that on dimensions other than cost, the modern sample appears
more “liquid.” The vast majority of the bonds trade with greater frequency, and with
much higher par volumes.
To gain a better sense of whether variation in trade frequency and volume
mitigates or reinforces the conclusions suggested by the averages, we ran the following
cross-sectional regression using the averages for the modern sample reported in Table 2:
(Mean markup)i = b0 + b1(Mean days with trade)i + b2(Mean yearly volume)i +ei
34
where i=1,…,39 indicates the bond. Using the fitted values of b0=2.615 (t=13.822),
b1=-0.0122 (t=-2.040) and b3=0.0007 (t=2.274), we predict the mean markup on a
modern bond with the same annual trading frequency and volume as the bonds trading in
1926-1927. The volume is adjusted to the 2003 price level. Table 3 displays the
resulting fitted values for the trading markup for each bond, along with the difference
between it and the average bid-ask spread plus round trip commission on the NYSE. The
average difference is -1.37%. The average fitted value based on the modern data is 2.4
times higher than the average trading costs in 1926-1927.
In summary, in the modern period the bonds trade more often, at higher volumes,
and yet the cost of retail trades is one and a half to two times higher.
VI. Conclusions
When several trading venues are available there will typically be multiple
equilibria in the allocation of trades. This multiplicity reflects the positive externalities
associated with liquidity. When the investors expect that one market venue will attract all
the orders, then they direct their own orders to that market, thus confirming the initial
expectation. Because of such strategic complementarities, liquidity may not gravitate to
the most efficient trading venue, and market forces may fail to correct this inefficiency,
even in the long term. The history of the bond market in the US in the twentieth century
offers an interesting illustration of these tensions.
The bond market was quite active on the NYSE until the 1940s. Then liquidity
collapsed on the Exchange as trading migrated to the OTC market. This change was not
due to a decline in the role of bond financing in the economy at large. Neither does it
seem to have been driven by a drop in the number of listings. The migration of liquidity
happened simultaneously with sudden changes in the balance of ownership of the
securities. Liquidity gravitated to the OTC market at a time when dealers and large
institutions became more important in the bond market.
The shift in trading venue arguably increased the rents earned by financial
intermediaries and large institutional traders, at the expense of small and medium-sized
35
investors, for whom this evolution translated into higher transactions costs. The decline
in transparency is costly to many parties besides small investors. Accurate price
information is a public good that is critical in coordinating economic decisions. Firms
rely on financial market prices in making investments and capital structural decisions.
Final investors rely on these prices to evaluate the performance of intermediaries and
managers of firms to whom they delegate decision-making power.
Our historical investigation emphasizes the interaction between different building
blocks of the financial system. The supply of trading mechanisms, with different
microstructures, by competing market centers, such as the NYSE and the OTC market,
contributes to the allocation of liquidity, but it does not do so alone. Rather, it interacts
with other elements, such as the distribution of the ownership of securities. This
ownership structure, itself, reflects the distribution of income, the tax system, and the
development of financial institutions. Designing an efficient financial market, with such
desirable features as transparency, priority rules and openness, does not guarantee that it
will emerge as the primary trading venue.
Our finding that transaction costs in municipal bond market were lower in 1927
than at the beginning of the twenty first century is not unlike the finding, by Rajan and
Zingales (2003), that equity markets were more developed in 1913 than in the major part
of the post-World War II period. Both suggest that the interaction between economic
agents does not always naturally lead to a trend of gradual improvement in financial
architectures.
What are the implications of our analysis for market organizers? The
microstructure of the bond market on the NYSE exhibits several desirable features. It is
an electronic limit-order book, with full transparency. More than one thousand issues are
listed on this market, including some very large and liquid bonds, issued by corporations,
municipalities, agencies or the Treasury. Yet, trading on this system is negligible. Our
analysis suggests that investing money and energy in attracting new listings may not be
an effective course of action. There is very little correlation between the number of issues
listed on the Exchange and the trading volume on this market.
Dealers and large institutions benefit from the OTC market, but this market is
costly for retail and medium-sized investors. The Exchange could possibly improve the
36
liquidity of its bond market by attracting retail and medium size orders. To achieve this
goal it could be useful to increase the accessibility of the bond market, e.g., by providing
rich data on the internet and relying on retail brokers. It could also be useful to institute
dedicated liquidity suppliers, who would intermediate the immediacy needs of retail
investors in the bond market.
The municipal bond market may be an appropriate target in this respect, as it is a
large market, in which retail investors play a major role. These investors would likely
benefit from a transparent, easily accessible, limit-order book. So would municipal
issuers, for whom a decline in secondary market transactions costs would translate into a
decline in the cost of funds.
37
References
Admati, A., Peiderer, P., 1988, “A theory of intraday patterns: Volume and price variability.” Review of Financial Studies 1, 3-40.
Anonymous, 1932, Confessions of a Bond Salesman, Early Publishing Co, Pittsburgh, PA.
Bernhardt, D., V. Dvoracek, E. Hughson, and I. Werner, 2004, “Why do large orders
receive discounts on the London Stock Exchange?” forthcoming, Review of Financial Studies.
Bessimbinder, H., W. Maxwell, and K.Venkataraman, (2005) “Optimal Market
Transparency: Evidence from the Initiation of Trade Reporting in Corporate Bonds.”
Working paper, University of Utah.
Dammon, R., C. Spatt and H. Zhang, 2004, “Optimal Asset Location and Allocation with
Taxable and Tax-Deferred Investing,” Journal of Finance 59, 999-1037.
Davis, L., L. Neal and E. White, 2005, “The Highest Price Ever: The Great NYSE Seat Sale
of 1928-1929, and Capacity Constraints,” Working paper, Department of Economics,
Rutgers University.
Hickman, W. B., 1960, Statistical measures of corporate bond financing since 1900, NBER,
Princeton.
Chamberlain, L., 1925, The principles of bond investment, Henry Holt and Company, New
York.
Edwards, A., Harris, L., and M. Piwowar, 2004, “Corporate Bond Market Transparency
and Transaction Costs,” Working paper, USC.
38
Felstein, S. G., Fabozzi, F. J., and Fabozzi, T. D., 1995, “Municipal Bonds,” in The
Handbook of Fixed Income Securities, 4th edition, Fabozzi, F.J. and Fabozzi, T. D., Editors.
Irwin Professional Publishing, New York, pp. 155-185.
Gellermann, H., 1957, How to make money make money: Professional advice about stocks and
bonds, Thomas Y. Crowell Company, New York.
Goldstein, M., E. Hotchkiss and E. Sirri, 2005, “Transparency, and Liquidity: A
Controlled Experiment on Corporate Bonds,” Working paper, Babson College.
Green, R., B. Hollifield, and N. Shurhoff, 2004, “Financial intermediation and the costs of
trading in an opaque market,” Working paper, Carnegie Mellon University.
Guthmann, H., 1950, “The movement of debt to institutions and its implications for the
interest rate,” The Journal of Finance, 5, 70-87.
Harris, L., and M. Piwowar, 2004, “Municipal Bond Liquidity,” Working paper, USC.
Holland, D., 1958, The income-tax burden on stockholders. NBER, Princeton University Press,
Princeton.
Kemmerer, D., 1952, “American financial institutions: The marketing of securities, 1930-
1952.” Journal of Economic History, 4, 454-468.
Loss, L., and J. Seligman, 1998, Securities regulation, Aspen Law and Business, New York.
Mende, A., L. Menkhoff, and C. L. Osler, 2004, “Asymmetric Information and the Cross-
Section of Currency Spreads,” working paper, Brandeis University.
39
Meltzer, A. and G. von der Linde, 1960, “A study of the dealer market for Federal
Government securities,” Materials prepared for the Joint Economic Committee, Congress
of the United States, Washington.
Pagano, M., 1989, Trading volume and asset liquidity, Quarterly Journal of Economics 104,
255-276.
Prime, J., 1946, Investment analysis. Prentice-Hall, New York.
Rajan, R., and L. Zingales, 1995, “What do we know about capital structure: Some
evidence from international data.” Journal of Finance, 50, 1421-1460.
Rajan, R., and L. Zingales, 2003, “The great reversals: The politics of financial
development in the twentieth century.” Journal of Financial Economics, 69, pages 5-50.
Shultz, B., 1946, The securities market and how it works, Harper Bros Publishers, New York.
United States Treasury and Federal Reserve Board, 1959, “Treasury-Federal Reserve Study
of the Government Securities Market.”
White, E., 2000, “Banking and finance in the twentieth century.” In The Cambridge
Economic history of the United States, Volume III. Edited by S. Engerman and R. Gallman.
Cambridge University Press.
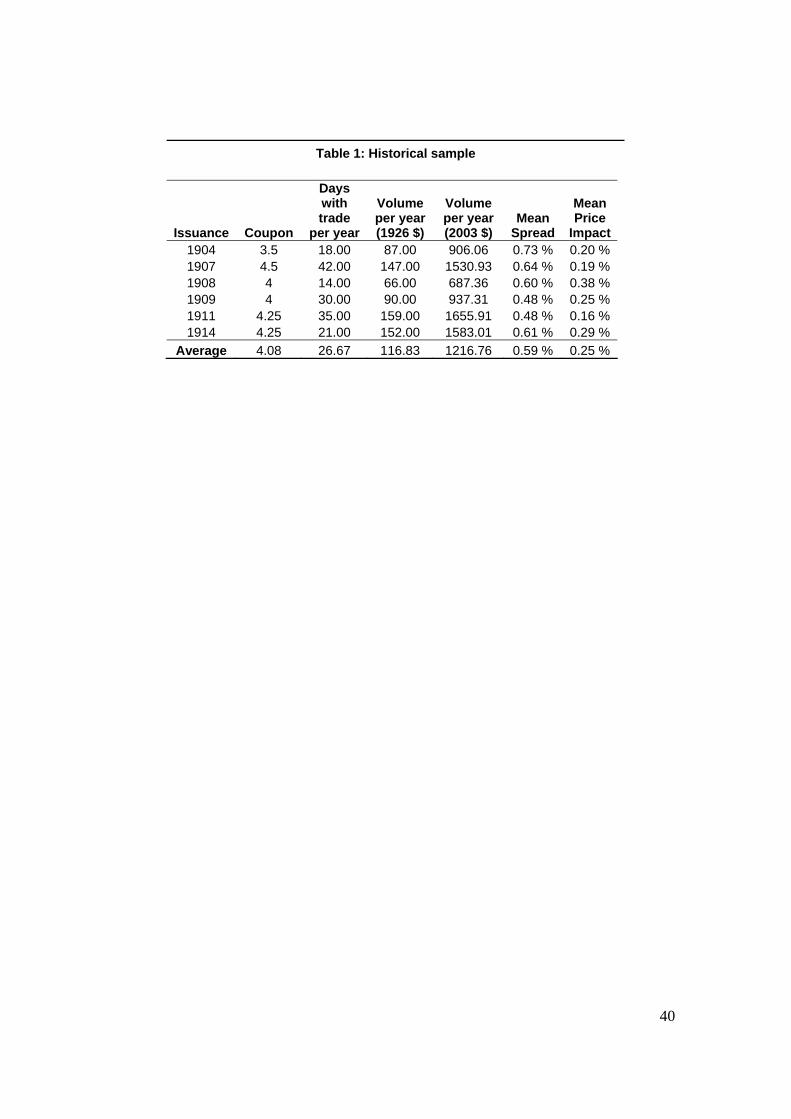
40
Table 1: Historical sample
Issuance Coupon
Days with trade
per year
Volume per year (1926 $)
Volume per year (2003 $)
Mean Spread
Mean Price
Impact 1904 3.5 18.00 87.00 906.06 0.73 % 0.20 % 1907 4.5 42.00 147.00 1530.93 0.64 % 0.19 % 1908 4 14.00 66.00 687.36 0.60 % 0.38 % 1909 4 30.00 90.00 937.31 0.48 % 0.25 % 1911 4.25 35.00 159.00 1655.91 0.48 % 0.16 % 1914 4.25 21.00 152.00 1583.01 0.61 % 0.29 %
Average 4.08 26.67 116.83 1216.76 0.59 % 0.25 %
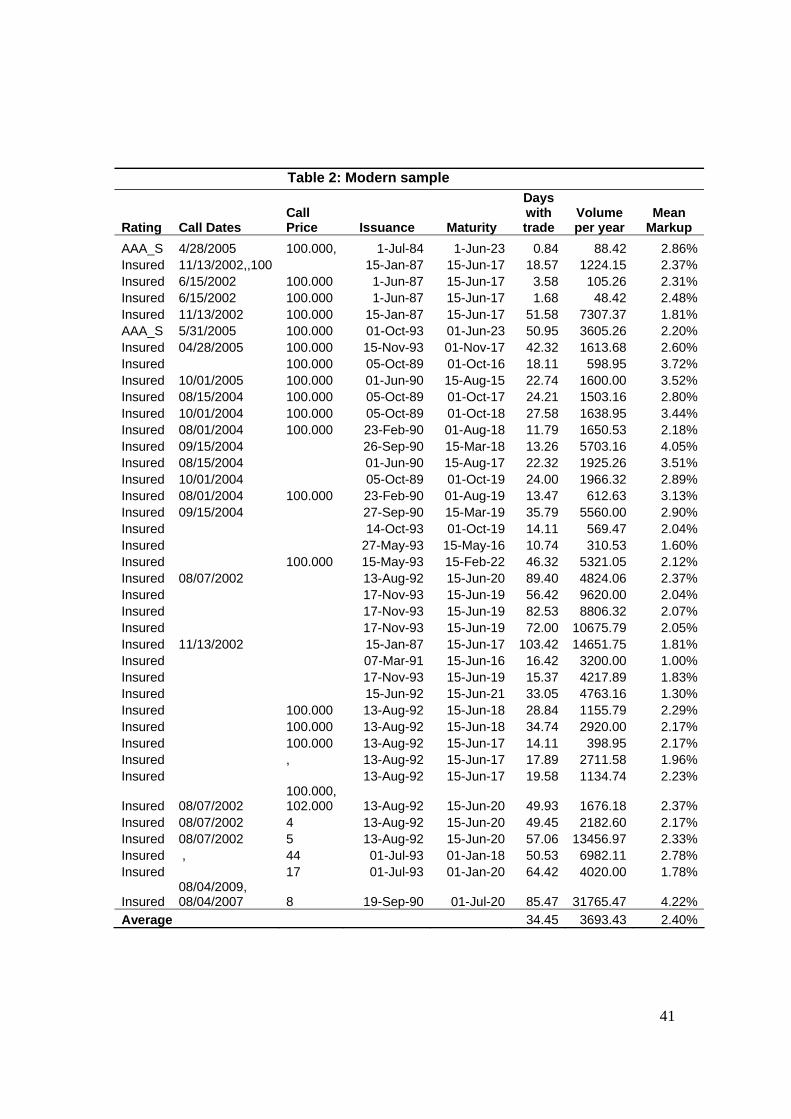
41
Table 2: Modern sample
Rating Call Dates Call Price Issuance Maturity
Days with trade
Volume per year
Mean Markup
AAA_S 4/28/2005 100.000, 1-Jul-84 1-Jun-23 0.84 88.42 2.86%Insured 11/13/2002,,100 15-Jan-87 15-Jun-17 18.57 1224.15 2.37%Insured 6/15/2002 100.000 1-Jun-87 15-Jun-17 3.58 105.26 2.31%Insured 6/15/2002 100.000 1-Jun-87 15-Jun-17 1.68 48.42 2.48%Insured 11/13/2002 100.000 15-Jan-87 15-Jun-17 51.58 7307.37 1.81%AAA_S 5/31/2005 100.000 01-Oct-93 01-Jun-23 50.95 3605.26 2.20%Insured 04/28/2005 100.000 15-Nov-93 01-Nov-17 42.32 1613.68 2.60%Insured 100.000 05-Oct-89 01-Oct-16 18.11 598.95 3.72%Insured 10/01/2005 100.000 01-Jun-90 15-Aug-15 22.74 1600.00 3.52%Insured 08/15/2004 100.000 05-Oct-89 01-Oct-17 24.21 1503.16 2.80%Insured 10/01/2004 100.000 05-Oct-89 01-Oct-18 27.58 1638.95 3.44%Insured 08/01/2004 100.000 23-Feb-90 01-Aug-18 11.79 1650.53 2.18%Insured 09/15/2004 26-Sep-90 15-Mar-18 13.26 5703.16 4.05%Insured 08/15/2004 01-Jun-90 15-Aug-17 22.32 1925.26 3.51%Insured 10/01/2004 05-Oct-89 01-Oct-19 24.00 1966.32 2.89%Insured 08/01/2004 100.000 23-Feb-90 01-Aug-19 13.47 612.63 3.13%Insured 09/15/2004 27-Sep-90 15-Mar-19 35.79 5560.00 2.90%Insured 14-Oct-93 01-Oct-19 14.11 569.47 2.04%Insured 27-May-93 15-May-16 10.74 310.53 1.60%Insured 100.000 15-May-93 15-Feb-22 46.32 5321.05 2.12%Insured 08/07/2002 13-Aug-92 15-Jun-20 89.40 4824.06 2.37%Insured 17-Nov-93 15-Jun-19 56.42 9620.00 2.04%Insured 17-Nov-93 15-Jun-19 82.53 8806.32 2.07%Insured 17-Nov-93 15-Jun-19 72.00 10675.79 2.05%Insured 11/13/2002 15-Jan-87 15-Jun-17 103.42 14651.75 1.81%Insured 07-Mar-91 15-Jun-16 16.42 3200.00 1.00%Insured 17-Nov-93 15-Jun-19 15.37 4217.89 1.83%Insured 15-Jun-92 15-Jun-21 33.05 4763.16 1.30%Insured 100.000 13-Aug-92 15-Jun-18 28.84 1155.79 2.29%Insured 100.000 13-Aug-92 15-Jun-18 34.74 2920.00 2.17%Insured 100.000 13-Aug-92 15-Jun-17 14.11 398.95 2.17%Insured , 13-Aug-92 15-Jun-17 17.89 2711.58 1.96%Insured 13-Aug-92 15-Jun-17 19.58 1134.74 2.23%
Insured 08/07/2002 100.000, 102.000 13-Aug-92 15-Jun-20 49.93 1676.18 2.37%
Insured 08/07/2002 4 13-Aug-92 15-Jun-20 49.45 2182.60 2.17%Insured 08/07/2002 5 13-Aug-92 15-Jun-20 57.06 13456.97 2.33%Insured , 44 01-Jul-93 01-Jan-18 50.53 6982.11 2.78%Insured 17 01-Jul-93 01-Jan-20 64.42 4020.00 1.78%
Insured 08/04/2009, 08/04/2007 8 19-Sep-90 01-Jul-20 85.47 31765.47 4.22%
Average 34.45 3693.43 2.40%
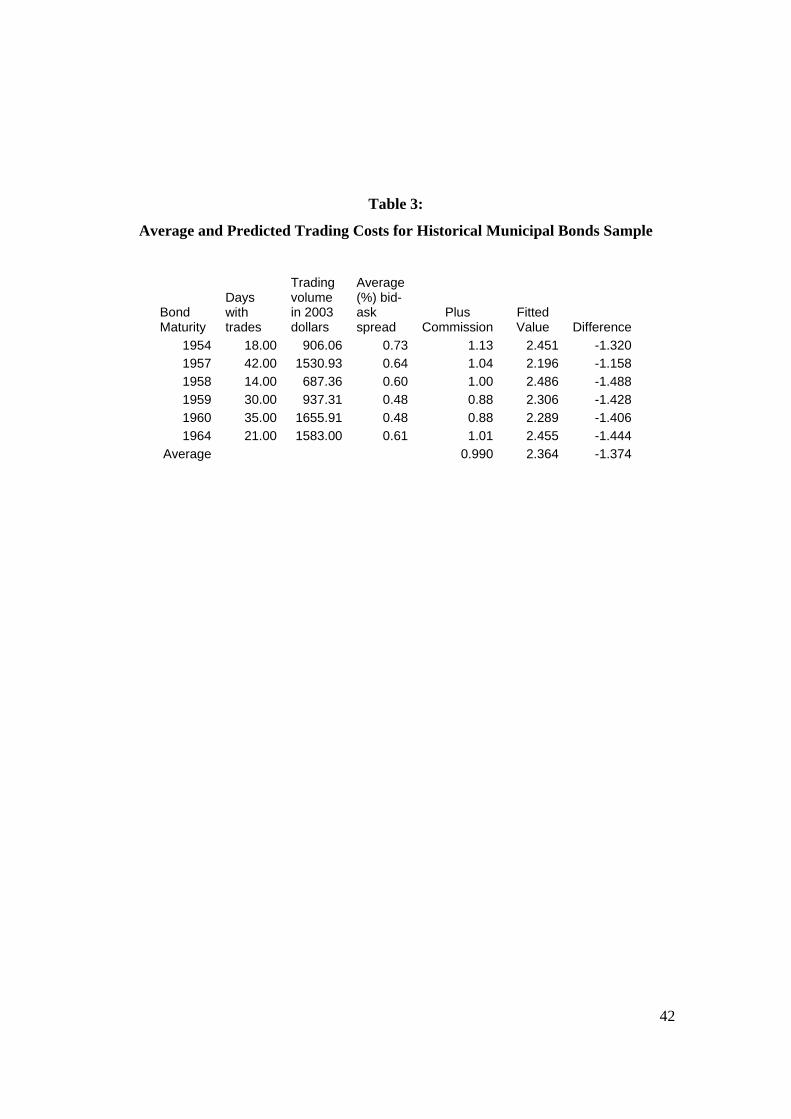
42
Table 3:
Average and Predicted Trading Costs for Historical Municipal Bonds Sample
Bond Maturity
Days with trades
Trading volume in 2003 dollars
Average (%) bid-ask spread
Plus Commission
Fitted Value Difference
1954 18.00 906.06 0.73 1.13 2.451 -1.320 1957 42.00 1530.93 0.64 1.04 2.196 -1.158 1958 14.00 687.36 0.60 1.00 2.486 -1.488 1959 30.00 937.31 0.48 0.88 2.306 -1.428 1960 35.00 1655.91 0.48 0.88 2.289 -1.406 1964 21.00 1583.00 0.61 1.01 2.455 -1.444
Average 0.990 2.364 -1.374
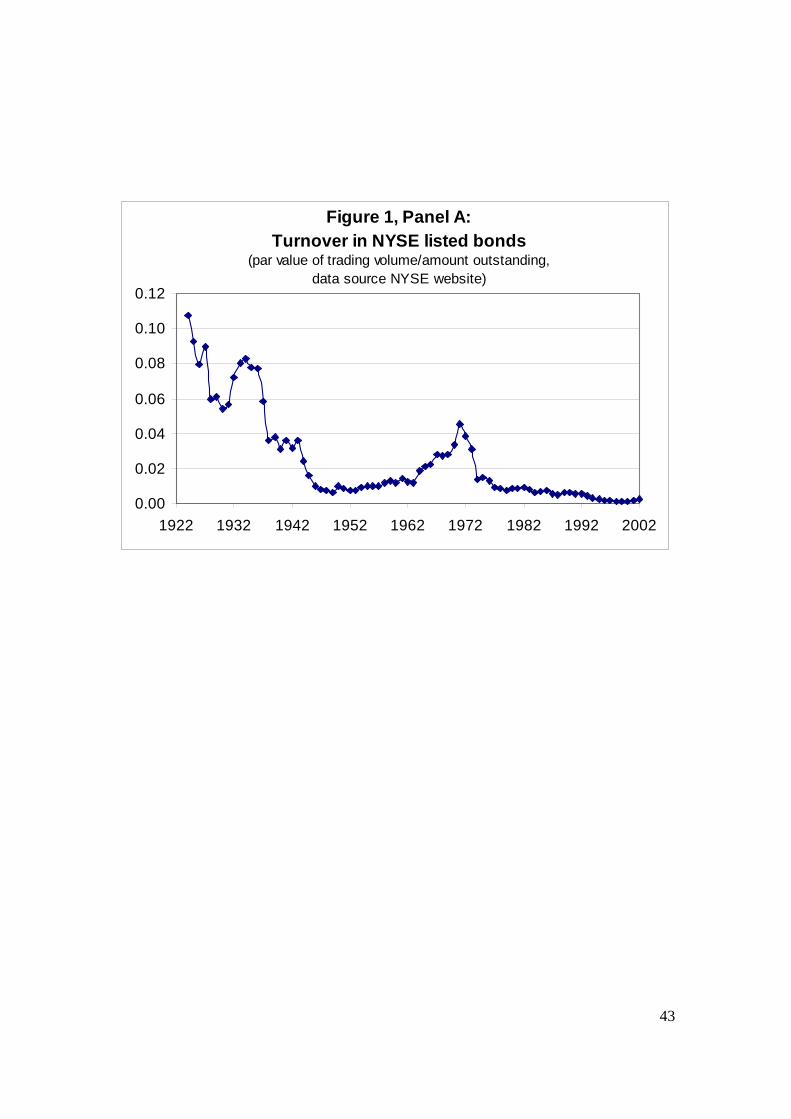
43
Figure 1, Panel A:Turnover in NYSE listed bonds
(par value of trading volume/amount outstanding, data source NYSE website)
0.00
0.02
0.04
0.06
0.08
0.10
0.12
1922 1932 1942 1952 1962 1972 1982 1992 2002
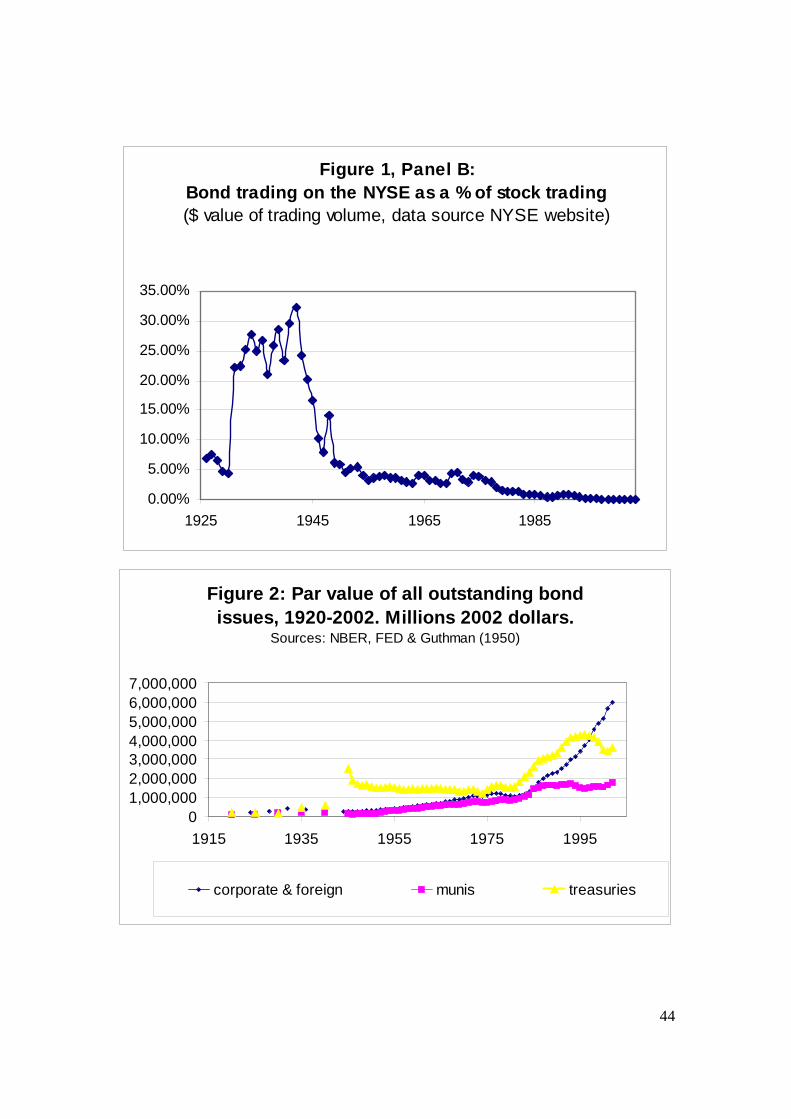
44
Figure 1, Panel B:Bond trading on the NYSE as a % of stock trading ($ value of trading volume, data source NYSE website)
0.00%
5.00%
10.00%
15.00%
20.00%
25.00%
30.00%
35.00%
1925 1945 1965 1985
Figure 2: Par value of all outstanding bond issues, 1920-2002. Millions 2002 dollars.
Sources: NBER, FED & Guthman (1950)
01,000,0002,000,0003,000,0004,000,0005,000,0006,000,0007,000,000
1915 1935 1955 1975 1995
corporate & foreign munis treasuries
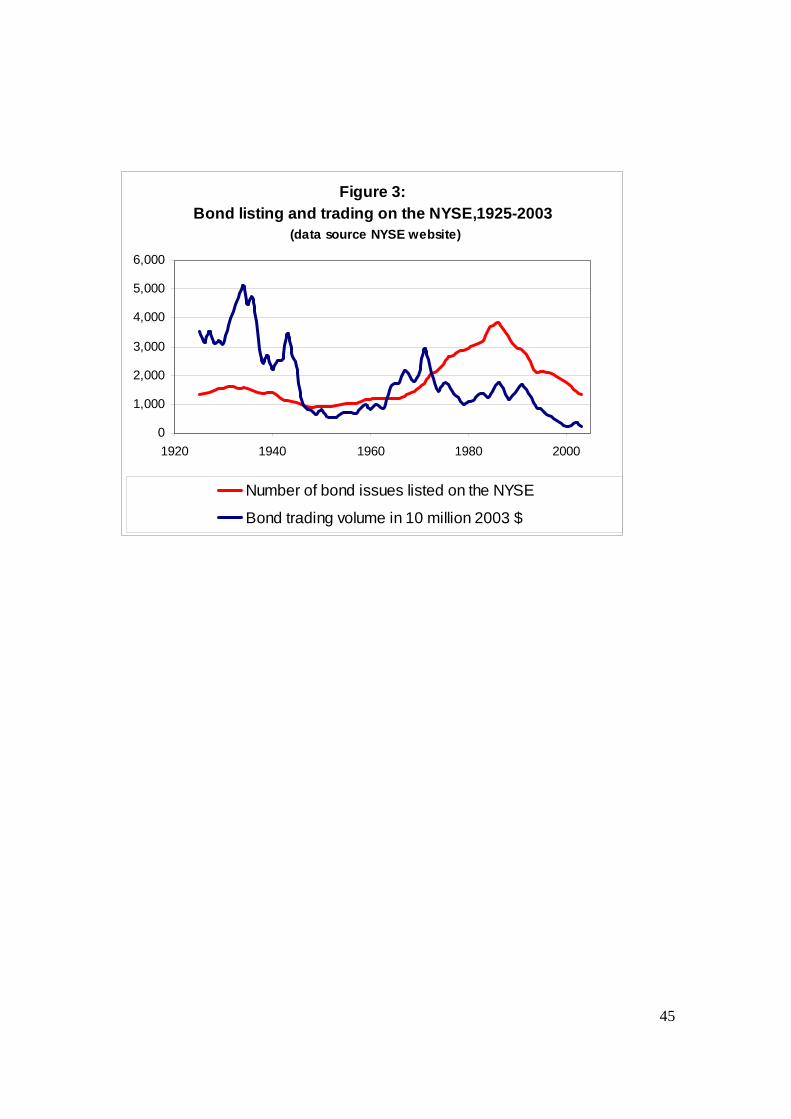
45
Figure 3: Bond listing and trading on the NYSE,1925-2003
(data source NYSE website)
0
1,000
2,000
3,000
4,000
5,000
6,000
1920 1940 1960 1980 2000
Number of bond issues listed on the NYSE
Bond trading volume in 10 million 2003 $
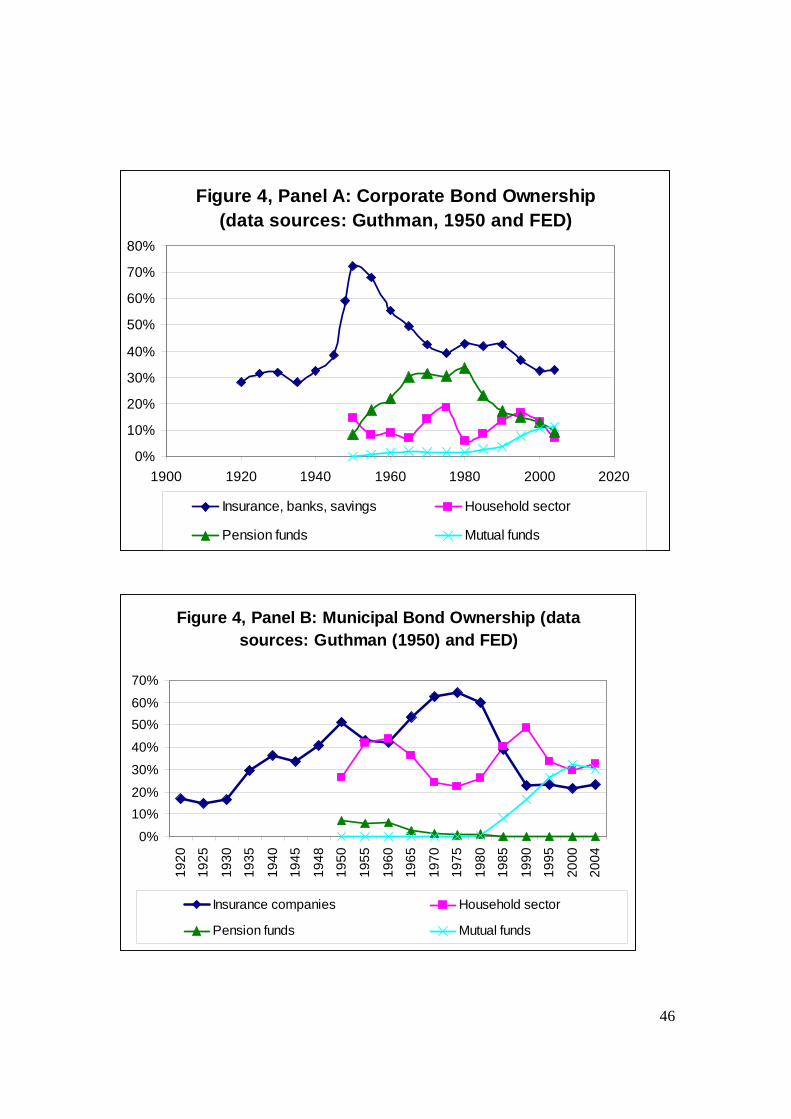
46
Figure 4, Panel A: Corporate Bond Ownership (data sources: Guthman, 1950 and FED)
0%
10%
20%
30%
40%
50%
60%
70%
80%
1900 1920 1940 1960 1980 2000 2020
Insurance, banks, savings Household sector
Pension funds Mutual funds
Figure 4, Panel B: Municipal Bond Ownership (data sources: Guthman (1950) and FED)
0%
10%20%
30%
40%
50%60%
70%
1920
1925
1930
1935
1940
1945
1948
1950
1955
1960
1965
1970
1975
1980
1985
1990
1995
2000
2004
Insurance companies Household sector
Pension funds Mutual funds
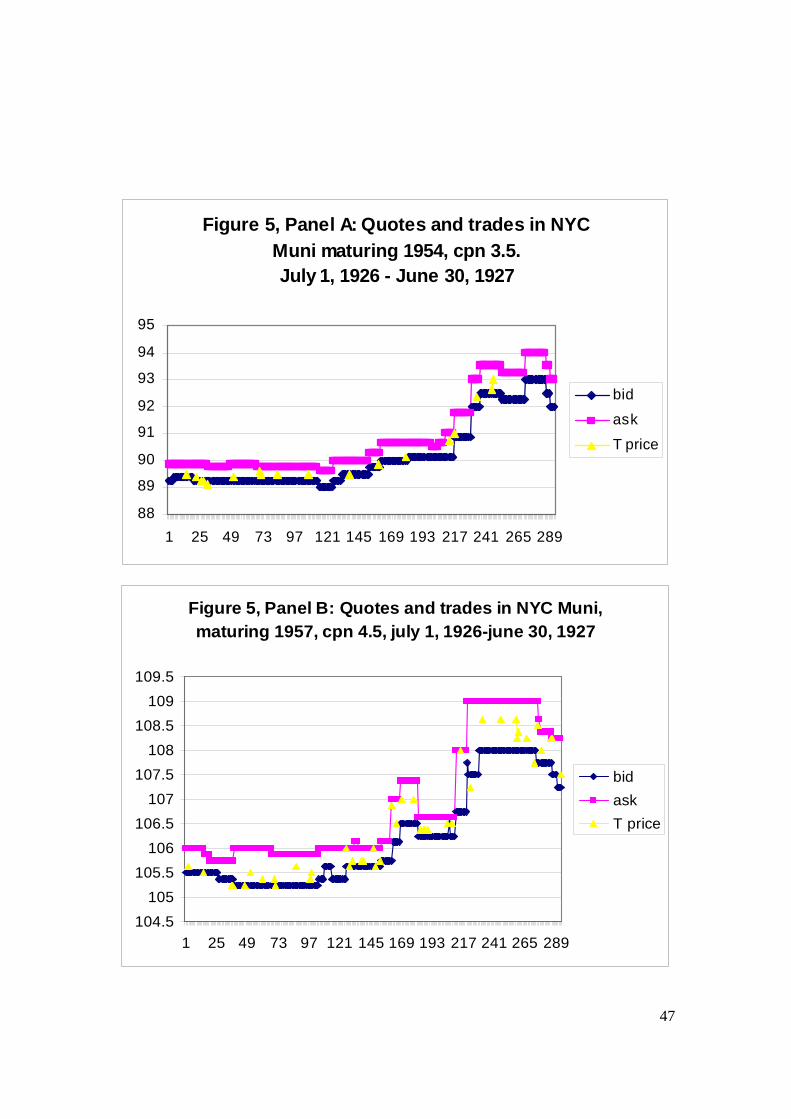
47
Figure 5, Panel A: Quotes and trades in NYC Muni maturing 1954, cpn 3.5. July 1, 1926 - June 30, 1927
88
89
90
91
92
93
94
95
1 25 49 73 97 121 145 169 193 217 241 265 289
bid
ask
T price
Figure 5, Panel B: Quotes and trades in NYC Muni, maturing 1957, cpn 4.5, july 1, 1926-june 30, 1927
104.5105
105.5106
106.5107
107.5108
108.5109
109.5
1 25 49 73 97 121 145 169 193 217 241 265 289
bid askT price
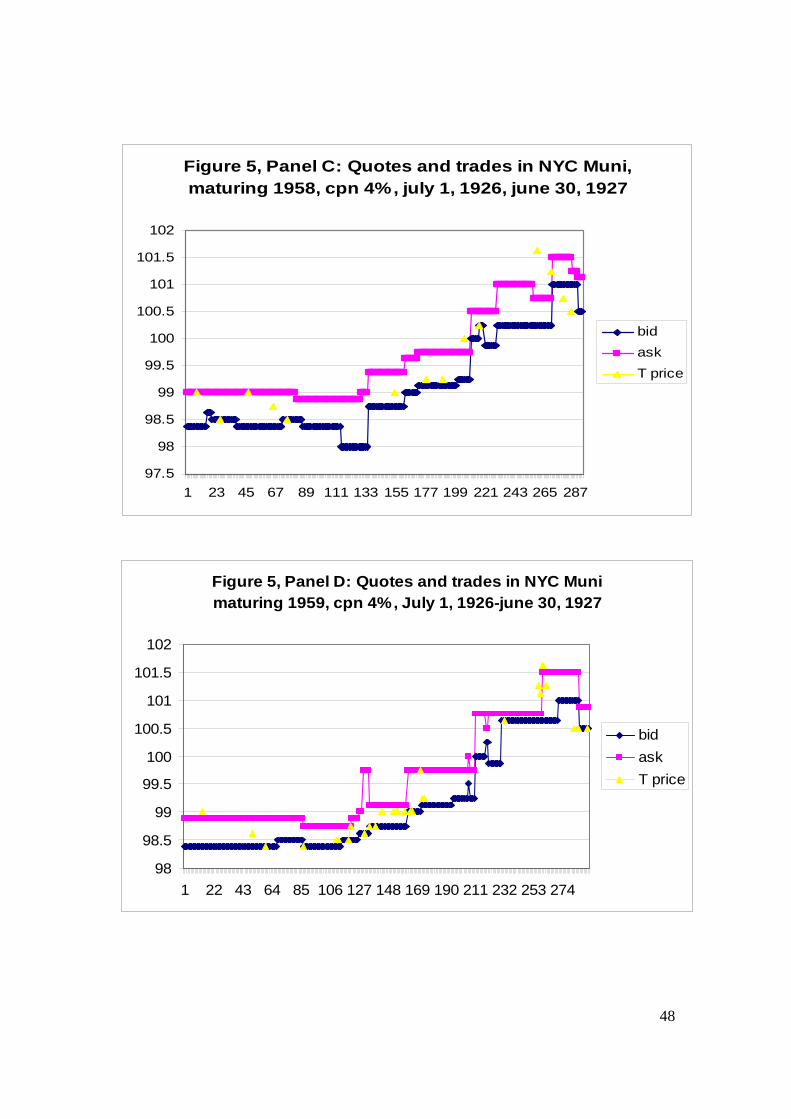
48
Figure 5, Panel C: Quotes and trades in NYC Muni, maturing 1958, cpn 4%, july 1, 1926, june 30, 1927
97.5
98
98.5
99
99.5
100
100.5
101
101.5
102
1 23 45 67 89 111 133 155 177 199 221 243 265 287
bid askT price
Figure 5, Panel D: Quotes and trades in NYC Muni maturing 1959, cpn 4%, July 1, 1926-june 30, 1927
98
98.5
99
99.5
100
100.5
101
101.5
102
1 22 43 64 85 106 127 148 169 190 211 232 253 274
bid askT price
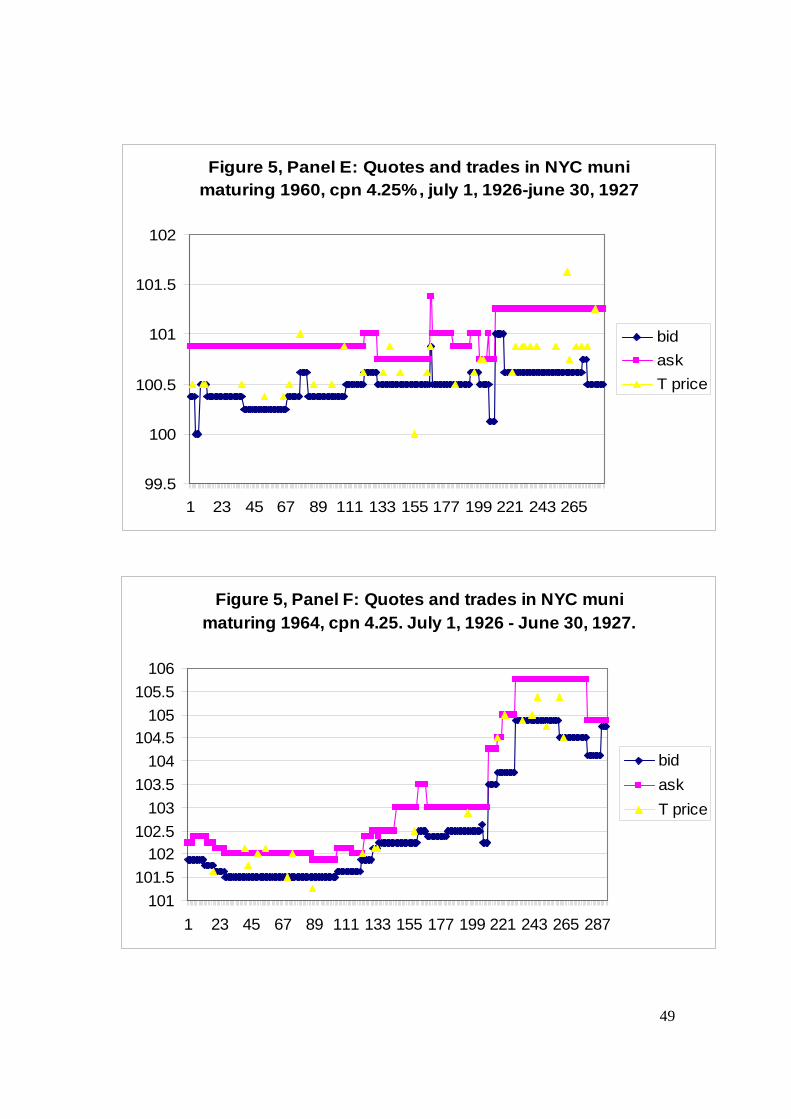
49
Figure 5, Panel E: Quotes and trades in NYC muni maturing 1960, cpn 4.25%, july 1, 1926-june 30, 1927
99.5
100
100.5
101
101.5
102
1 23 45 67 89 111 133 155 177 199 221 243 265
bid askT price
Figure 5, Panel F: Quotes and trades in NYC muni maturing 1964, cpn 4.25. July 1, 1926 - June 30, 1927.
101101.5
102102.5
103103.5
104104.5
105105.5
106
1 23 45 67 89 111 133 155 177 199 221 243 265 287
bid askT price
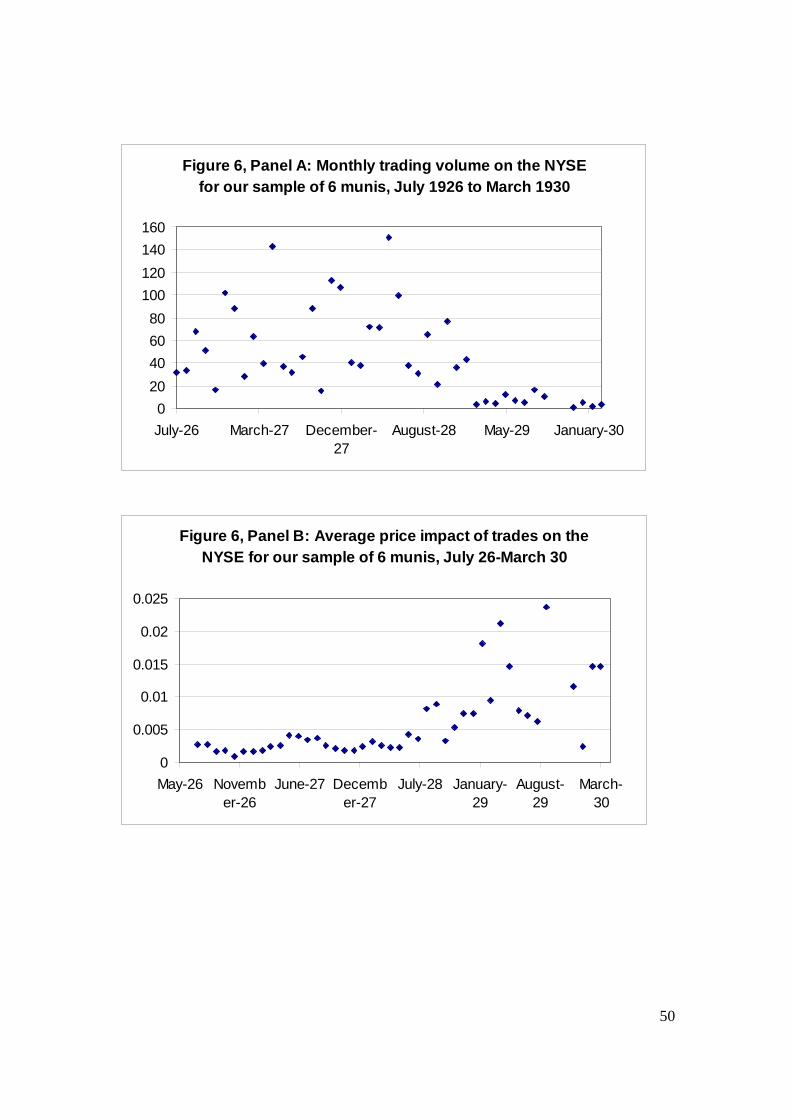
50
Figure 6, Panel A: Monthly trading volume on the NYSE for our sample of 6 munis, July 1926 to March 1930
020406080
100120140160
July-26 March-27 December-27
August-28 May-29 January-30
Figure 6, Panel B: Average price impact of trades on the NYSE for our sample of 6 munis, July 26-March 30
0
0.005
0.01
0.015
0.02
0.025
May-26 November-26
June-27 December-27
July-28 January-29
August-29
March-30
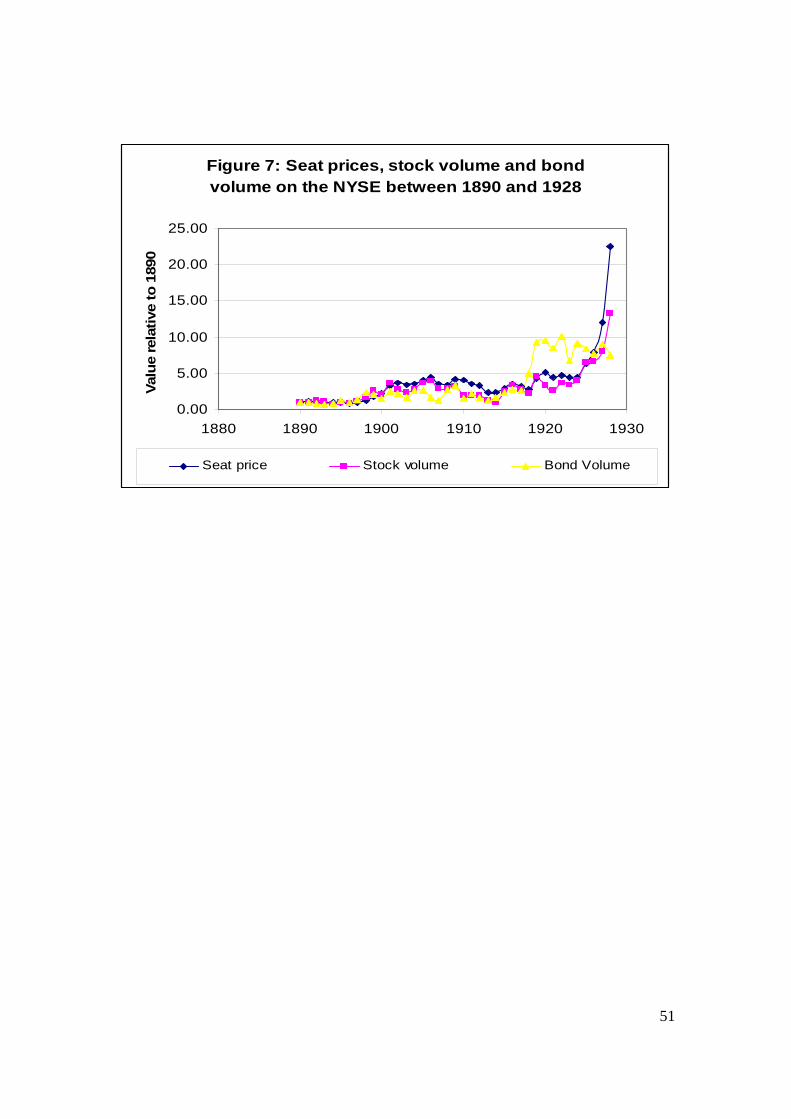
51
Figure 7: Seat prices, stock volume and bond volume on the NYSE between 1890 and 1928
0.00
5.00
10.00
15.00
20.00
25.00
1880 1890 1900 1910 1920 1930
Valu
e re
lativ
e to
189
0
Seat price Stock volume Bond Volume