the microfinance industry in uganda: sustainability
TRANSCRIPT
THE MICROFINANCE INDUSTRY IN UGANDA: sustainability, outreach and regulation
LUKA JOVITA OKUMU
Dissertation presented for the degree of Doctor of Philosophy (Economics) at the University of Stellenbosch
PROMOTER: Prof. G.A. Schoombee
CO-PROMOTER: Prof. N. Biekpe
December, 2007
DECLARATION
I, the undersigned, hereby declare that the work contained in this dissertation is my own
original work and that I have not previously in its entirety or in part submitted it at any
university for a degree.
Signature Date
Copyright © 2007 University of Stellenbosch
All rights reserved
i
ii
ABSTRACT
Using an econometric approach on panel data collected from 53 microfinance institutions
(MFIs) in Uganda over a period of six years (annual), this study has identified the
determinants of sustainability and outreach of MFIs. In addition, the study has also used
survey data from 31 non-Bank of Uganda (BOU) regulated MFIs or Tier 4 MFIs, four
BOU-regulated non-bank MFIs, 12 commercial banks and the BOU itself to assess the
effects of financial regulation of MFIs on their sustainability and outreach.
The results indicate that sustainability is positively and significantly driven by real effective
lending rates and age of an MFI, and negatively by the ratio of gross outstanding loan
portfolio to total assets, the ratio of average loan size to the national per capita income, the
unit cost of loans disbursed, and a group-based delivery mechanism compared to an
individual-based delivery mechanism. Outreach is positively and significantly driven by an
MFI being a savings and credit co-operative (SACCO) compared to being a private
company, effectiveness of governance, the age of an MFI, the ratio of gross outstanding
loan portfolio to total assets, and the ratio of salary/wage paid to staff to the national per
capita income, and negatively by the ratio of average loan size to the national per capita
income and the unit cost of loans disbursed. In the short run, financial regulation negatively
influences the outreach of MFIs, but positively affects their sustainability. In the long term,
financial regulation positively influences both the sustainability and the outreach of MFIs.
The results suggest a number of policy options. First, the MFIs should focus on the real
effective lending rate, given its significance in their sustainability. Second, for a real
effective lending rate to be relatively low, the rate of inflation should be low. This calls for
prudent monetary policy management by the government. Thirdly, the cost of doing
business should be kept low. This calls for prudence in business management by the MFIs
and creating a cost-effective business environment by the government. While the results are
tentative, in order to expand outreach more SACCOs should be established and the MFIs
should commit more funds to lending purposes compared to other investments. Finally,
before enacting financial legislation, it is important that its benefits and costs are adequately
assessed to ensure that the benefits outweigh the costs both in the short and long term.
iii
OPSOMMING
Hierdie studie maak gebruik van 'n ekonometriese benadering tot paneeldata verkry van 53
mikro-finansiële instellings (MFIs) in Uganda oor 'n tydperk van ses jaar (jaarliks) om die
determinante van volhoubaarheid en die reikwydte (of uitreik) van MFIs te identifiseer. Die
studie gebruik ook data uit opnames vanaf 31 nie-“Bank of Uganda” (BOU) gereguleerde of
Vlak 4 MFIs, vier BOU-gereguleerde MFIs, 12 kommersiële banke, en die BOU self om die
effek van finansiële regulering van MFIs op hul volhoubaarheid en reikwydte te bepaal.
Die resultate toon dat volhoubaarheid positief en beduidend beïnvloed word deur reële
effektiewe uitleenkoerse en die ouderdom van 'n MFI. Dit word negatief beïnvloed deur die
verhouding van bruto uitstaande leningsportefeulje tot totale bates, die verhouding van
gemiddelde leningsgrootte tot nasionale per capita inkomste, die eenheidskoste van lenings
uitgereik, en deur 'n groep-gebasseerde afleweringsmeganisme in vergelyking met 'n
idividueel-gebasseerde afleweringsmeganisme. Reikwydte word positief en beduidend
beïnvloed indien 'n MFI 'n besparings- en kredietkoöperasie (SACCO) is eerder as 'n private
maatskappy, deur die effektiwiteit van bestuur, die ouderdom van 'n MFI, die verhouding van
bruto uitstaande leningsportefeulje tot totale bates, en die verhouding van salaris/loon betaal
aan personeel tot nasionale per capita inkomste. Reikwydte word negatief beïnvloed deur die
verhouding van gemiddelde leningsgrootte tot nasionale per capita inkomste en die
eenheidskoste van lenings uitgereik. In die kort termyn het finansiële regulering 'n negatiewe
effek op die reikwydte van MFIs, maar 'n positiewe effek op hul volhoubaarheid. In die lang
termyn het finansiële regulering 'n positiewe effek op beide die volhoubaarheid en reikwydte
van MFIs.
'n Paar beleidsopsies vloei voort uit die resultate. Eerstens moet MFIs op die reële effektiewe
leningskoers fokus op grond van die belangrikheid daarvan vir volhoubaarheid. Tweedens, vir
'n reële effektiewe leningskoers om relatief laag te wees, moet die inflasiekoers laag wees. Dit
vereis verstandige monetêre beleidsoptrede. Derdens, die koste om handel te dryf moet laag
gehou word. Dit doen 'n beroep op MFIs tot verstandige bestuur en op die regering tot die
ontwikkeling van 'n koste-effektiewe besigheidsomgewing. Al is die resultate tentatief, sal meer
SACCOs gestig moet word ten einde MFIs se reikwydte te verbeter en MFIs sal meer fondse
vir lenings moet allokeer in vergelyking met ander beleggings. Laastens, voor finansiële
regulering toegepas word, is dit belangrik dat die voordele en kostes daarvan bepaal word om te
verseker dat die voordele die kostes in beide die lang en kort termyn oortref.
iv
ACKNOWLEDGEMENTS
First, my sincere gratitude goes to my parents: Mr Jovita Okelo and Mrs Esther Nyapendi
for bringing me up and paying the school fees that eventually made it possible for me to
pursue this study.
Second, I sincerely thank my wife Betty and children (Brenda, Angella and Trevor) for the
constant encouragement and bearing the pain of staying alone whenever I was away
studying both in Uganda and abroad.
I sincerely thank my supervisors, Prof. G.A. Schoombee and Prof. N. Biekpe, for tirelessly
guiding me during the study and reading through my work. May the Almighty God reward
them for the efforts put in.
I must not forget to most gratefully thank Mr R.S. Apire, the former Director of
Development Finance, Bank of Uganda, and Mr Patrick Ochailap, the Director of Budget at
the Ministry of Finance Department, Planning and Economic Development for the support
provided, while seeking for the initial funding for this study.
Last but not least are the research and technical assistants who collected and cleaned the
data required for this study. Without them, this study would not have reached this point.
v
TABLE OF CONTENTS
Declaration i
Abstract ii
Opsomming iii
Acknowledgements iv
List of Tables xii
List of Figures xv
List of Acronyms xvi
CHAPTER ONE: INTRODUCTION 1 1.1 Background to the study 1
1.2 Objectives of the study 5
1.3 Significance of the study 6
1.4 Scope and methodology 7
1.5 Research hypotheses 8
1.5.1 Sustainability (measured by Operational Self-sustainability) 8
1.5.2 Outreach (measured by the number of clients (OUTR)) 8
1.5.3 The relationship between OSS and OUTR 9
1.5.4 Effects of financial regulation of MFIs on their sustainability and 9
outreach
1.6 Problems encountered and limitations of the study 9
1.7 Organisation of the dissertation 10
CHAPTER TWO: UGANDA’S ECONOMY AND MICROFINANCE INDUSTRY
2.1 Introduction 12
2.2 Economic policy reforms and the major developments 13
2.2.1 The period between 1962-70 13
2.2.2 The period between 1971-86 14
2.2.3 The period from 1987 onwards 15
2.2.4 Key results of the stabilisation policies and SAPs from 1987 onwards 16
2.2.4.1 Major developments in inflation and Gross Domestic Product (GDP) 16
2.2.4.2 Major developments in the balance of payments and fiscal deficits 17
vi
2.2.4.3 Major developments in the financial sector 18
2.2.4.4 Major developments in the privatisation drive 22
2.3. Uganda’s current economic structure 23
2.4 The microfinance industry 26
2.4.1 Sources of funds for MFIs 26
2.4.2 Products offered, terms and conditions of the products and the clients 27
served
2.4.3 Growth of the industry 27
2.4.4 The external environment 28
2.4.5 Linkages between commercial banks and MFIs 28
2.5 Conclusion 29
CHAPTER THREE: CONCEPTS AND MEASURES OF SUSTAINABILITY AND OUTREACH
3.1 Introduction 30
3.2 The concept and measures of sustainability 30
3.2.1 The concept of sustainability 30
3.2.2. The relationship between the concept of sustainability and profitability 33
3.2.3 Measures of sustainability 36
3.2.3.1 Subsidy Dependence Index (SDI) 36
3.2.3.2 Self-sufficiency (Sustainability) measures 38
3.2.3.3 Adjusted variants of traditional measures of financial performance 43
3.2.3.4 Arrears rate 46
3.2.4 Adopted measures of sustainability 46
3.3 The concept and measures of outreach 49
3.3.1 The concept of outreach 49
3.3.2 Measures of outreach 50
3.3.3 Adopted measure of outreach 55
3.4 Summary of the chapter 57
CHAPTER FOUR: DETERMINANTS OF SUSTAINABILITY AND OUTREACH 4.1 Introduction 59
4.2 The determinants of sustainability and outreach 60
vii
4.2.1 Sources and uses of funds 60
4.2.1.1 Sources of funds 60
4.2.1.2 Uses of funds 61
4.2.1.3 Sources of funds and the implications for sustainability and outreach 61
4.2.1.4 Uses of funds and the implications for sustainability and outreach 65
4.2.2 Governance 66
4.2.2.1 Concept of governance 66
4.2.2.2. The evolution and rationale for governance 67
4.2.2.3 Characteristics of an effective governance structure 70
4.2.2.4 Governance and the implications for sustainability and outreach 73
4.2.3 Savings mobilisation 75
4.2.3.1 Concepts of savings and intermediation 75
4.2.3.2 Role of savings mobilisation 76
4.2.3.3 The implications of providing savings product for sustainability and 77
outreach
4.2.4 Average loan size and the implications for sustainability and outreach 79
4.2.5 Lending interest rates 82
4.2.5.1 The concept and role 82
4.2.5.2 The implications of lending interest rates for sustainability and outreach 84
4.2.6 Repayment rate and the implications for sustainability and outreach 87
4.2.7 Costs and the implications for sustainability and outreach 88
4.2.8 Microfinance institutions delivery mechanisms 90
4.2.8.1 Definition of a delivery mechanism 90
4.2.8.2 MFIs delivery mechanisms 90
4.2.8.3 The implications of MFI delivery mechanisms for sustainability and 94
outreach
4.2.9 Age of the institution providing microfinance and the implications for 98
sustainability and outreach
4.2.10 Economic, social and political environment 99
4.3 Analysis of the relationship between sustainability and outreach 100
4.4 Summary and Conclusion 103
viii
CHAPTER FIVE: THE THEORY OF THE FIRM, SUSTAINABILITY AND
OUTREACH
5.1 Introduction 105
5.2 The concept and the theory of the firm 106
5.2.1 The concept of the firm 106
5.2.2 The theory of the firm 108
5.2.2.1 The definition of the theory of the firm 108
5.2.2.2 The neoclassical theory of the firm 109
5.2.2.3 Transaction cost theory and other views of the firm 116
5.2.2.4 Areas of consensus on the theory of the firm 118
5.3 The production function 121
5.3.1 Analysis of the production function 121
5.3.1.1 Short-run analysis 123
5.3.1.2 Long-run analysis 124
5.3.2 Introduction of costs into the production function 125
5.4 The profit function 127
5.5 A description of a microfinance institution 129
5.6 Can a microfinance institution be equated to the firm in the theory of 132
the firm?
5.7 Application of the production function to the outreach model 135
5.8 Application of the profit function to the sustainability model 138
5.9 Summary of the determinants of sustainability and outreach, and the 139
hypotheses
5.10 Conclusion 140
CHAPTER SIX: REGULATION OF MICROFINANCE INSTITUTIONS AND THE
EFFECTS ON THEIR SUSTAINABILITY AND OUTREACH 6.1 Introduction 141
6.2 The concept of financial regulation 142
6.3 Economic benefits and costs of regulating the financial system with 143
emphasis on the microfinance institutions
ix
6.3.1 Economic benefits for regulating the financial system 143
6.3.2 Economic benefits of regulating microfinance institutions 144
6.3.3 Economic costs of regulating microfinance institutions 148
6.3.3.1 Economic costs of regulating MFIs for the regulators 148
6.3.3.2 Economic costs of regulating MFIs for the MFIs 152
6.3.3.3 Economic costs of regulating MFIs for the microfinance industry, their 154
clients and the economy
6.4 Instruments for financial regulation and the possible effects on 155
sustainability and outreach of microfinance institutions
6.4.1 Instruments for financial regulation in Uganda 155
6.4.2 Possible effects of financial regulation of MFIs on sustainability and 156
outreach
6.4.2.1 Capital Adequacy (CA) 156
6.4.2.2 Asset Quality (AQ) 160
6.4.2.3 Management (M) 163
6.4.2.4 Earnings (E) 165
6.4.2.5 Liquidity Management (LM) 166
6.4.2.6 Supervision and Compliance (SC) 167
6.4.2.7 Deposit Protection Fund (DPF) 170
6.4.2.8 Other licensing conditions and effects on sustainability and outreach of 171
MFIs
6.5 Conclusion 173
CHAPTER SEVEN: RESEARCH METHODOLOGY 7.1. Introduction 174
7.2 Specification of econometric equations of sustainability and outreach 175
models
7.2.1 Introduction 175
7.2.2 Econometric specification of the sustainability model 175
7.2.3 Econometric specification of the outreach model 177
7.3 Selection and estimation of sustainability and outreach model 178
7.3.1 Model selection 178
7.3.2 Estimation of sustainability and outreach models 180
x
7.4 The Microfinance institutions selected and the method of selection 182
7.5 Data, data capture and method of analysis 185
7.5.1 Data and the variables constructed 185
7.5.2 Data capture and analysis 187
CHAPTER EIGHT: EMPIRICAL ANALYSIS AND DISCUSSIONS 8.1 Introduction 189
8.2 Descriptive statistics 189
8.3 Correlation 191
8.4 Variable selection 193
8.5 The econometric results and discussions 198
8.5.1 The econometric results 198
8.5.2 Discussions of the econometric results 199
8.5.2.1 Gross outstanding loan portfolio 199
8.5.2.2 Governance 199
8.5.2.3 Average loan size 200
8.5.2.4 Real effective lending interest rates 200
8.5.2.5 Unit cost of loans disbursed 201
8.5.2.6 Delivery mechanisms 201
8.5.2.7 Age of the institution providing the financial services 202
8.5.2.8 Salaries/Wages 202
8.5.2.9 Institutional types 203
8.6 Empirical results of the survey on the effects of financial regulation
of the MFIs in Uganda on their sustainability and outreach 204
8.6.1 The number of Tier 4 MFIs interviewed, whether accepting savings
or not and, if accepting savings, why 204
8.6.2 Effects of financial regulation of MFIs on their industry structure
and products offered 206
8.6.3 Effects of the MDI Act, 2003 on the legal status of Tier 4 MFIs 206
8.6.4 Effects of the key provisions under the MDI Act, 2003 on the
decision of the Tier 4 MFIs to register as MDIs 208
xi
8.6.5 Effects of financial regulation of MFIs on their selected sustainability
and outreach indictors 208
8.6.6 Effects of financial regulation of MFIs on their sources of funding,
time taken to mobilise additional capital, cost of external supervision
and audit, and investment options 211
8.6.7 Effects of financial regulation of MFIs on their linkage with
commercial banks in Uganda 214
8.6.8 Effects of financial regulation of MFIs on their sustainability and
outreach from the Bank of Uganda perspective and experience 216
8.7 Summary and conclusion 219
CHAPTER NINE: SUMMARY OF FINDINGS AND POLICY
RECOMMENDATIONS 9.1 Introduction 221
9.2 Summary of Findings 222
9.2.1 Uses of funds 222
9.2.2 Governance 223
9.2.3 Average loan size 223
9.2.4 Real effective lending interest rates 223
9.2.5 Unit cost of loans disbursed 223
9.2.6 Delivery mechanisms 223
9.2.7 Salaries/Wages 224
9.2.8 Institutional types 224
9.2.9 Financial regulation of MFIs and the effects on their sustainability
and outreach 224
9.3 Policy recommendations 225
9.3.1 Uses of funds 225
9.3.2 Governance 225
9.3.3 Average loan size 225
9.3.4 Real effective lending interest rates 226
xii
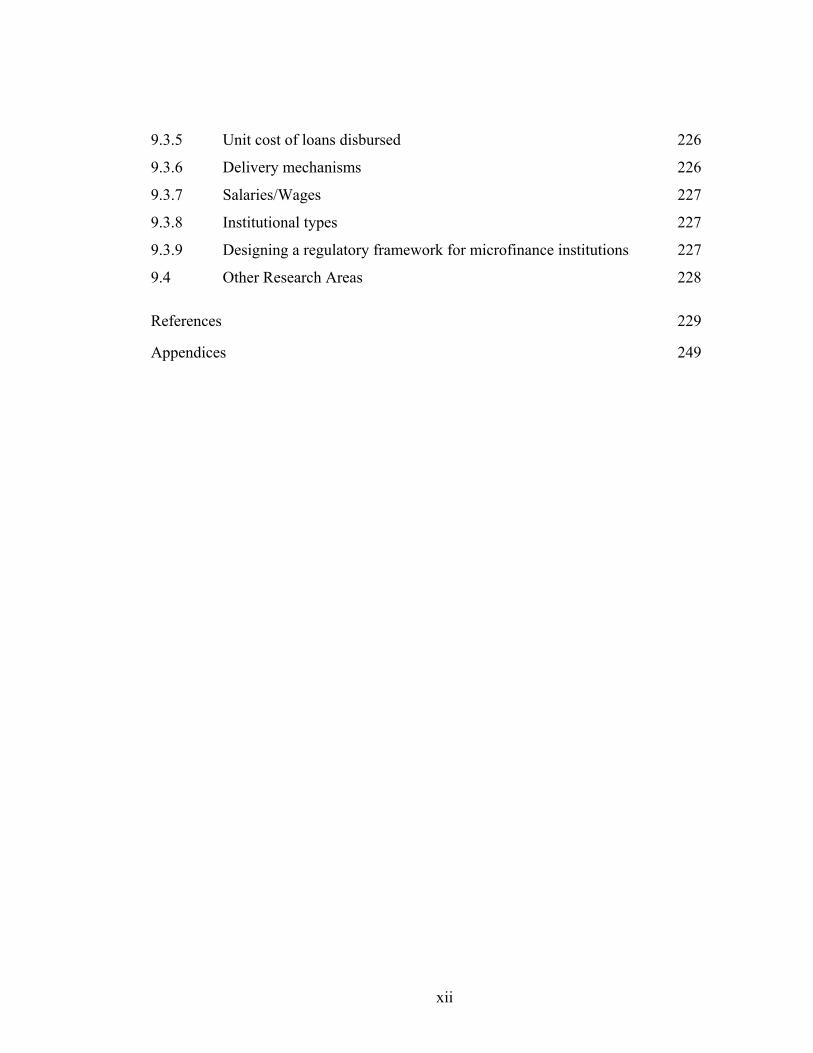
9.3.5 Unit cost of loans disbursed 226
9.3.6 Delivery mechanisms 226
9.3.7 Salaries/Wages 227
9.3.8 Institutional types 227
9.3.9 Designing a regulatory framework for microfinance institutions 227
9.4 Other Research Areas 228
References 229
Appendices 249
xiii
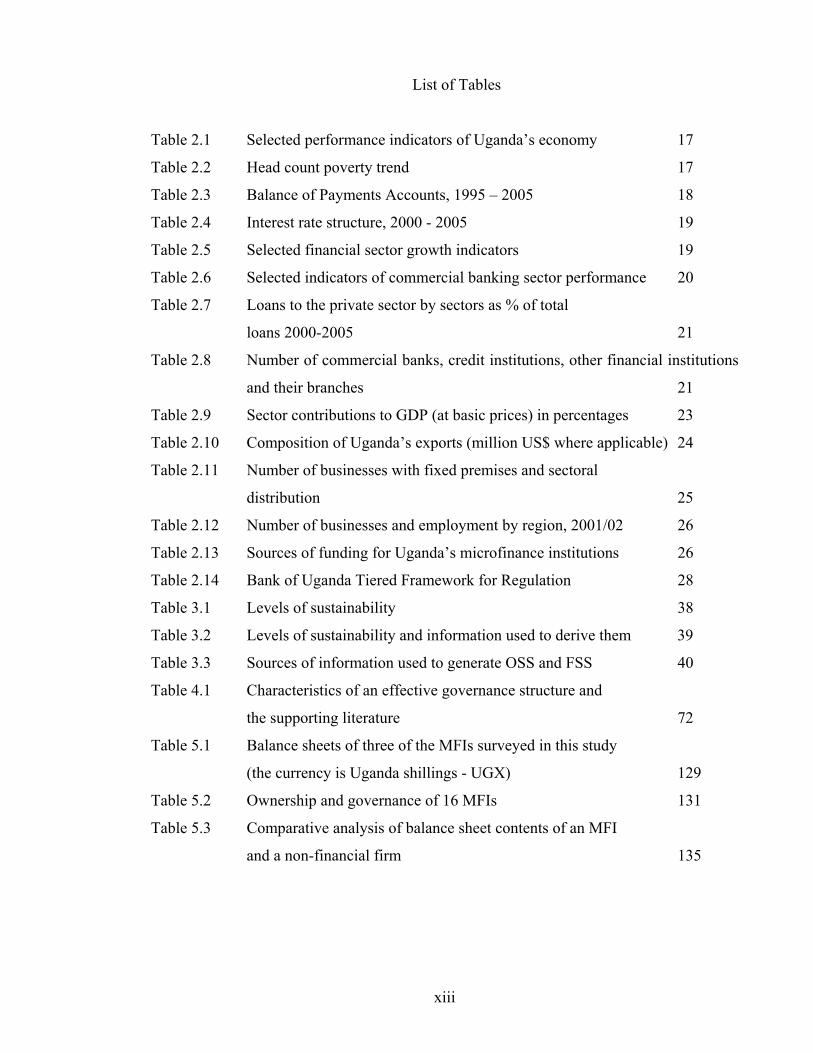
List of Tables
Table 2.1 Selected performance indicators of Uganda’s economy 17
Table 2.2 Head count poverty trend 17
Table 2.3 Balance of Payments Accounts, 1995 – 2005 18
Table 2.4 Interest rate structure, 2000 - 2005 19
Table 2.5 Selected financial sector growth indicators 19
Table 2.6 Selected indicators of commercial banking sector performance 20
Table 2.7 Loans to the private sector by sectors as % of total
loans 2000-2005 21
Table 2.8 Number of commercial banks, credit institutions, other financial institutions
and their branches 21
Table 2.9 Sector contributions to GDP (at basic prices) in percentages 23
Table 2.10 Composition of Uganda’s exports (million US$ where applicable) 24
Table 2.11 Number of businesses with fixed premises and sectoral
distribution 25
Table 2.12 Number of businesses and employment by region, 2001/02 26
Table 2.13 Sources of funding for Uganda’s microfinance institutions 26
Table 2.14 Bank of Uganda Tiered Framework for Regulation 28
Table 3.1 Levels of sustainability 38
Table 3.2 Levels of sustainability and information used to derive them 39
Table 3.3 Sources of information used to generate OSS and FSS 40
Table 4.1 Characteristics of an effective governance structure and
the supporting literature 72
Table 5.1 Balance sheets of three of the MFIs surveyed in this study
(the currency is Uganda shillings - UGX) 129
Table 5.2 Ownership and governance of 16 MFIs 131
Table 5.3 Comparative analysis of balance sheet contents of an MFI
and a non-financial firm 135
xiv
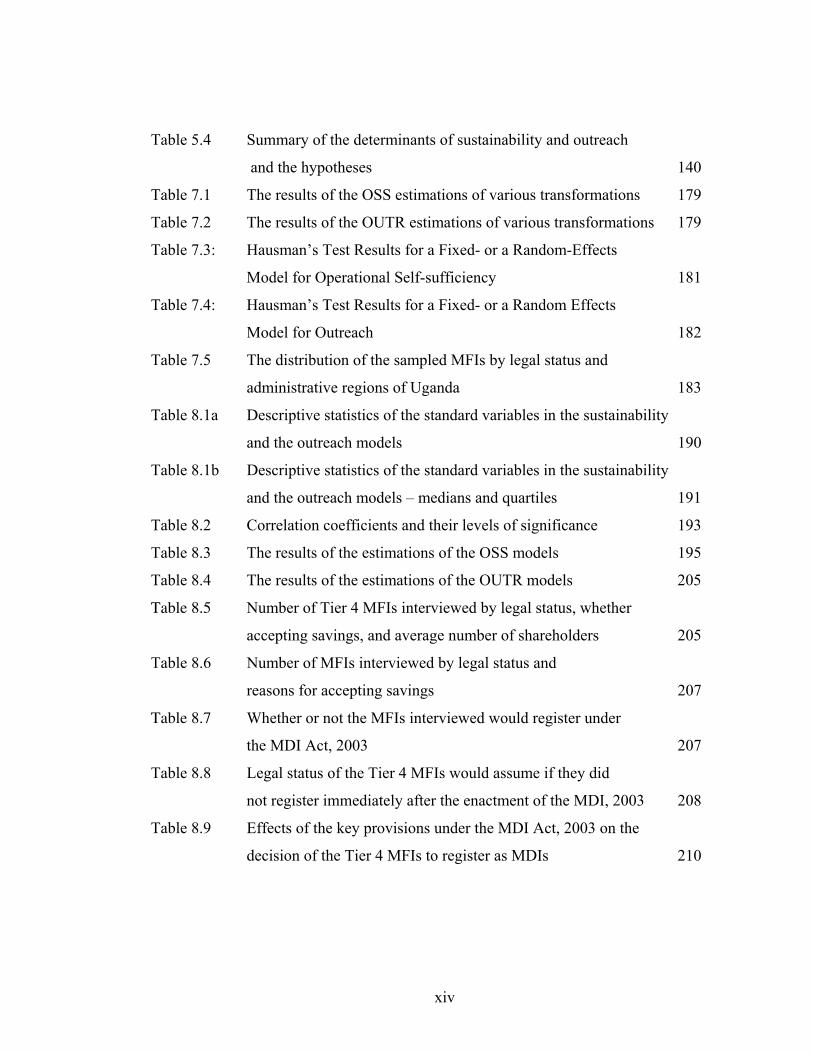
Table 5.4 Summary of the determinants of sustainability and outreach
and the hypotheses 140
Table 7.1 The results of the OSS estimations of various transformations 179
Table 7.2 The results of the OUTR estimations of various transformations 179
Table 7.3: Hausman’s Test Results for a Fixed- or a Random-Effects
Model for Operational Self-sufficiency 181
Table 7.4: Hausman’s Test Results for a Fixed- or a Random Effects
Model for Outreach 182
Table 7.5 The distribution of the sampled MFIs by legal status and
administrative regions of Uganda 183
Table 8.1a Descriptive statistics of the standard variables in the sustainability
and the outreach models 190
Table 8.1b Descriptive statistics of the standard variables in the sustainability
and the outreach models – medians and quartiles 191
Table 8.2 Correlation coefficients and their levels of significance 193
Table 8.3 The results of the estimations of the OSS models 195
Table 8.4 The results of the estimations of the OUTR models 205
Table 8.5 Number of Tier 4 MFIs interviewed by legal status, whether
accepting savings, and average number of shareholders 205
Table 8.6 Number of MFIs interviewed by legal status and
reasons for accepting savings 207
Table 8.7 Whether or not the MFIs interviewed would register under
the MDI Act, 2003 207
Table 8.8 Legal status of the Tier 4 MFIs would assume if they did
not register immediately after the enactment of the MDI, 2003 208
Table 8.9 Effects of the key provisions under the MDI Act, 2003 on the
decision of the Tier 4 MFIs to register as MDIs 210
xv
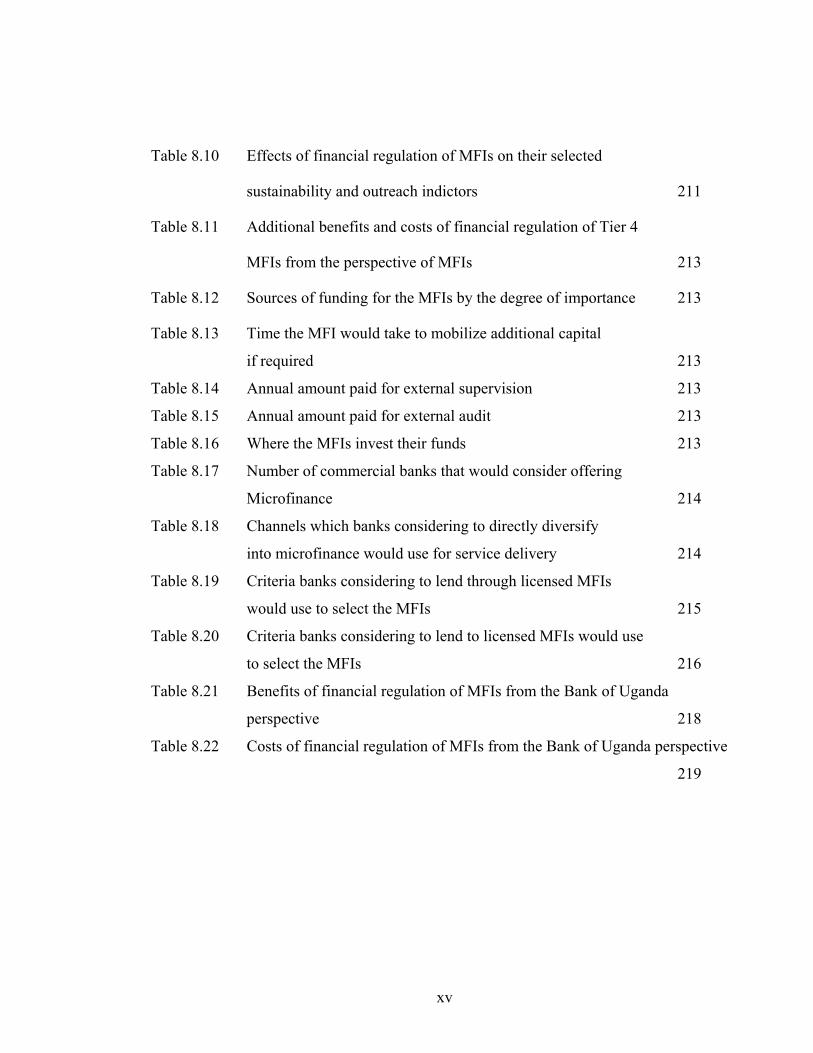
Table 8.10 Effects of financial regulation of MFIs on their selected
sustainability and outreach indictors 211
Table 8.11 Additional benefits and costs of financial regulation of Tier 4
MFIs from the perspective of MFIs 213
Table 8.12 Sources of funding for the MFIs by the degree of importance 213
Table 8.13 Time the MFI would take to mobilize additional capital
if required 213
Table 8.14 Annual amount paid for external supervision 213
Table 8.15 Annual amount paid for external audit 213
Table 8.16 Where the MFIs invest their funds 213
Table 8.17 Number of commercial banks that would consider offering
Microfinance 214
Table 8.18 Channels which banks considering to directly diversify
into microfinance would use for service delivery 214
Table 8.19 Criteria banks considering to lend through licensed MFIs
would use to select the MFIs 215
Table 8.20 Criteria banks considering to lend to licensed MFIs would use
to select the MFIs 216
Table 8.21 Benefits of financial regulation of MFIs from the Bank of Uganda
perspective 218
Table 8.22 Costs of financial regulation of MFIs from the Bank of Uganda perspective
219
xvi
List of Figures
Figure 4.1 The linkage between sources and uses of funds, and outreach
and sustainability 61
Figure 4.2: Ownership and governance relationship of an MFI 70
Figure 4.3 An illustration of a delivery mechanism 90
Figure 5.1: An illustration of an industrial firm and its boundary 108
Figure 5.2: An illustration of a typical MFI and its boundary 129
xvii
LIST OF ACRONYMS
AMFIU Association of Microfinance Institutions of Uganda. ANT Average number of times AROA Adjusted return on assets AROB Adjusted return on business AROE Adjusted return on equity ASA Association for Social Advancement AvLz Average loan size BOU Bank of Uganda BRAC Bangladesh Rural Advancement Committee BRI Bank Rakyat Indonesia CAMELS Capital, asset quality, management, earnings, liquidity and market
sensitivity CAR Capital adequacy ratio CERUDEB Centenary Rural Development Bank CGAP Consultative Group to Assist the Poorest CIC Currency in circulation CK Core capital CLD Unit cost of loans disbursed CMA Capital Markets Authority DANIDA Danish International Development Agency DDM Dominant product delivery mechanism DER Debt-equity ratio DFID Department for International Development DOI Depth of Outreach Index DPF Deposit Protection Fund FE Fixed effects FIA Financial Institutions Act FINCO Financial costs to the MFI of borrowing from other institutions FS Financial saving FSS Financial self-sufficiency GDP Gross Domestic Product GINDEX Governance index GLP Gross loan portfolio GLS Generalized Least Squares GM Efficiency parameter GOLP Ratio of gross loan portfolio to total assets GOU Government of Uganda ICGN International Corporate Governance Network ICS Cost of maintaining the value of equity relative to inflation and the
surplus revenue resulting from subsidised loans INDCO In-kind expenses LLP Loan loss provision LSDV Least Squares Dummy Variable
xviii
M2 Broad money MC Marginal cost MCR Minimum capital requirement MDI Micro Finance Deposit-taking Institution MFI Microfinance institution MFO Microfinance organisation MGDP Monetary GDP MIX Microfinance Information Exchange MOFPED Ministry of Finance, Planning and Economic Development. MR Marginal revenue MSEPU Micro- and Small Enterprise Policy Unit MSROA Modified subsidy-adjusted ROA NBO Number of borrowers only NGO Non-governmental organisation NL Number of loans NNRB Number of non-repeat borrowers NRB Number of repeat borrowers NSB Number of single borrowers NSO Number of savers only NSOBO Number of savers and borrowers OECD Organization of Economic Cooperation and Development OLS Ordinary Least Squares OPCO Direct and indirect operating costs incurred by the MFI in the
process of lending and related activities OR Operating revenue OSS Operational self-sufficiency OUTR Scale of outreach or number of clients served in a given period PCSU Private Enterprise Coordination and Support Unit RE Random Effects RELRD Real effective lending interest rate RFI Rural finance institutions ROA Return on asset ROE Return on equity SACCO Savings and Credit Cooperatives SDI Subsidy Dependency Index SEEP Small Enterprise Education and Promotion TERUDET Teso Rural Development Trust TK Total capital TRWA Total risk-weighted assets UBOS Uganda Bureau of Statistics UGX Uganda shillings UMU Uganda Microfinance Union UNESCAP United Nations Economic and Social Commission for Asia and The
Pacific US United States USE Uganda Securities Exchange
1
CHAPTER ONE: INTRODUCTION
1.1 Background to the study
Microfinance, generally defined as financial services, such as savings, credit, insurance and
payment products to low-income clients, including the self-employed,1 has a long history.
However, formal microfinance can be traced back to the pioneer work of Grameen Bank in
Bangladesh and Accion International in Latin America in the late 1970s (Accion
International, 2006 and 2007; Chu, 2006; Ledgerwood, 1999; Christen, 1997). The major
thrust of Grameen Bank was to promote access to financial services for the poor to enhance
their participation in productive activities. For Accion International, the primary objective
was to promote access to financial services for those unable to access them from the
traditional formal financial sector. The two roles ascribed to microfinance have become key
driving forces for promoting access to formal financial services for low-income earners and
reducing poverty (Kalpana, 2005; Fernando, 2004; Littlefield et al., 2003; Mathie, 2002;
Morduch, 1999; Schreiner, 1999).
Over the years, microfinance has not only acquired an additional dimension as a tool for
financial systems development,2 it has also recorded impressive growth (Ledgerwood,
1999; Woller and Schreiner, 2006). In Asia and the Pacific, UNESCAP (2006) reports that
microfinance is the fastest growing segment of rural financial intermediation. The range of
products currently provided by the microfinance industry has widened, the repayment rates
have been maintained at close to 100 per cent, the number of loans per borrower has
increased significantly, and several microfinance institutions (MFIs)3 are reportedly
financially sustainable and profitable (Accion International, 2007; Cull et al., 2006; Rhyne
and Otero, 2006; Kalpana, 2005; Morduch, 1999). The number of MFIs regulated under the
banking laws has also increased since 1992, when the first specialised MFI, BancoSol in
Bolivia, transformed into a regulated commercial MFI (Ledgerwood and White, 2006; Chu,
2006). Rhyne and Otero (2006:4) and UNESCAP (2006:5) further report that the formal
1 See Rhyne and Otero (2006); Chu (2006); Fernando (2004); Dasgupta and Rao (2003); and Ledgerwood (1999). Schreiner (1999:1) defines microfinance as the supply of loans and savings services to the poor. 2 Citing Otero and Rhyne (1994), Ledgerwood and White (2006: xl) state that the financial systems approach refers to the use of market-driven principles in the provision of financial services to the poor. 3 CGAP website: http://www.cgap.org/about/faq05.html (visited on 6 December 2006) defines a microfinance institution as an organisation whose principal activity is to provide financial services to the poor.
2
banking sector has also started entering the microfinance market and is competing with
specialised MFIs.
In terms of scale of outreach, the number of savers and borrowers, and the value of loan
portfolios have increased exponentially. Citing a publication by the Consultative Group to
Assist the Poorest (CGAP), Ledgerwood and White (2006:xxx) report that the current
combined loan portfolio of MFIs worldwide is approximately US$15 billion and they claim
that microfinance is believed to be growing annually at between 15 and 30 per cent. MIX
Market Inc. (2006:3) reports that its databases show that in 2005 MFIs served a total of 35
million borrowers, up from 29 million in 2004. Based on the number of active borrowers,
of the 512 MFIs that reported to MIX Market Inc. in 2005, 43 of the top 100 MFIs are from
Asia, serving over 24 million active borrowers.
Grameen Bank, Association for Social Advancement (ASA), Bangladesh Rural
Advancement Committee (BRAC), Bank Rakyat Indonesia (BRI) and PROSHIKA alone
had 18.3 million active borrowers in 2005. By August 2006 Grameen Bank had 6.61
million active borrowers (an increase from 5,050,000 by the end of December 2005),
disbursing a total of US$5.72 billion in loans since its inception, and recording a repayment
rate of 98.9% (Yunus, 2006). Latin America had 31 of the top 100 MFIs, serving about 3.7
million active borrowers, while Africa had 23 of the top 100 MFIs, serving about 2.8
million active borrowers (MIX Market Inc., 2006). In the case of the latter this represents a
substantial growth from the 2003 levels. MIX Market Inc. (2005:4) reports that in 2003 the
163 MFIs in Africa that reported to the MIX Market Inc. in that year served more savers
(6.3 million) than borrowers (2.4 million).
In Uganda at the beginning of the 1990s there was no specialised formal financial
institution delivering microfinance, but a handful of non-governmental organisations
(NGOs) and government programmes doing so. The last 15 years have experienced a rapid
expansion of the industry. By December 2005 the number of active MFIs was about 750,
the majority of which were savings and credit cooperatives (SACCOs) (MOFPED, 2006).
In 2004 and 2005 four formerly non-Bank of Uganda (BOU)-regulated MFIs or Tier 4
MFIs, namely Finca-Uganda, Uganda Microfinance Union (UMU), Pride-Uganda and
Uganda Women’s Finance Trust (UWFT) transformed into BOU-regulated MFIs following
3
the enactment of the Micro Finance Deposit-taking Institutions (MDI) Act, 2003.
Furthermore, a lot of restructuring is taking place in the industry, as some MFIs are putting
in place the necessary requirements to become MDIs, while others are changing their legal
status and restructuring operations to conform to the new legal regime (see section 8.6).
As the microfinance industry has evolved and rapidly expanded both globally and in
Uganda, questions regarding sustainability and outreach have come to the fore. For
example, Morduch (1999) and Cull et al. (2006) ask whether microfinance can meet the full
promise of reducing poverty without ongoing subsidies. They also observe that high
repayment rates recorded by MFIs cannot be translated easily into profitability. Buckley
(1997) questions whether MFIs are any different from past smallholder rural and co-
operative finance of the 1960s and 1970s, suggesting that they may not be sustainable
without either substantial donor subsidies or a shift toward less poor clients. Ledgerwood
and White (2006:xv) observe that the microfinance industry has seen impressive growth for
longer than a decade, yet still reaches only a small percentage of its potential market
worldwide. In this regard the authors ask: “What steps can we take to make microfinance
available to more people and do so on a lasting basis and, as well, provide them with
financial services they need other than just credit?”
The microfinance literature is filled with theoretical arguments as to what needs to be done
to improve sustainability and outreach of MFIs. Rhyne and Otero (1992) and Otero and
Rhyne (1994) have argued that to achieve significant outreach, sustainability of MFIs is a
prerequisite. This argument has since been elevated to include the commercialisation4 and
transformation5 of microfinance, which have strong links to regulation (Christen with
Drake, 2002; Ledgerwood and White, 2006). In the late 1990s and early 2000s there were
widespread discussions as to whether or not to regulate MFIs (CGAP, 2000; Hannig and
Bruan, 2000; AMFIU, 2005). Accion International (2007:1) argues that “Ultimately,
microfinance’s progress over the next 10 years will depend on favourable regulatory and
4According to Ledgerwood and White (2006:xxvi), commercialisation of microfinance refers to the application of market-based principles and to the movement out of the heavily donor-dependent arena of subsidised operations into one in which microfinance institutions manage on a business basis as part of the regulated financial system. 5Transformation in the microfinance industry means the institutional process of changing the legal structure and operational activities of an NGO microfinance provider or a microfinance project into a share-capital company and to become licensed as a regulated financial institution (Ledgerwood and White, 2006:xxviii).
4
policy environments, which determine the extent to which MFIs can reach the poor.” In
Uganda a legal and regulatory framework, called the MDI Act, 2003, provides a licensing
and regulatory framework for MFIs. An important question in this regard that requires an
answer is: what impact does financial regulation of MFIs have on their sustainability and
outreach?
Empirical research on sustainability and outreach, using econometric analysis, has rarely
been undertaken. One of the first comprehensive studies was carried out by Christen et al.
(1995). It examined 11 MFIs in Africa, Asia and Latin America to establish how far they
had come in providing outreach and achieving financial viability, and the challenges they
were facing. Before then Gurgand et al. (1994) examined outreach and sustainability of six
RFIs in Sub-Saharan Africa.
A couple of other international studies on sustainability and outreach have since followed.
Studying eight RFIs in Indonesia, Chaves and Gonzalez-Vega (1996) examine the effects
of design features on sustainability and outreach. The key question asked in this study is:
can RFIs profitably reach large numbers of clients? Paxton and Fruman (1998) investigate
the extent of outreach and sustainability of eight African MFIs. Using correlation measures,
the study also sought to establish the strength of the relationship between sustainability and
outreach. Conning (1999) examines the relationship between outreach, sustainability and
leverage in monitored and peer-monitored lending, while Sharma and Zeller (1999)
investigate factors affecting the placement of programmes across communities and outreach
of three group-based credit organisations in Bangladesh. More recently, using a data set
from 124 institutions in 49 countries, Cull et al. (2006) investigate why high loan
repayment rates recorded by most microbanks have not translated easily into profits.
In Uganda few studies focusing on sustainability and outreach have been done over the last
10 years (Seibel, 2000; Schadwinkel, 2000; Almeyda, 2002; Kiiza et al., 2004). With the
exception of Schadwinkel’s (2000) study, which covers two financial institutions, namely
the Centenary Rural Development Bank (CERUDEB) (U) Ltd and MED-Net,6 the rest
covered one institution each. The second major issue of concern about these studies, except
that by Kiiza et al. (2004), is that they are descriptive. They simply describe outreach in 6 MED-Net is one of the specialised NGO MFIs in Uganda providing microfinance.
5
terms of scale and depth of poverty and sustainability measures. On the basis of the
observed and calculated numbers and ratios, it is concluded that there is both a trade-off
and correlation between sustainability and outreach. In the Kiiza et al. (2004) study the
purpose was to determine self-sustainability using the Subsidy Dependence Index (SDI)7
and Depth of Outreach8 as the measure of outreach for the Teso Rural Development Trust
(TERUDET).
Empirical studies that have investigated the effects of financial regulation on the
sustainability and outreach of MFIs are also few and far between. The study in Bolivia by
Theodore and Loubiere (2002) comes close to such an assessment. No such studies have
been undertaken in Uganda.
The current research employs an econometric approach using panel data from a relatively
large sample of MFIs (53) over a period of 6 years (2000-2005) to identify the determinants
of sustainability and outreach. It uses operational self-sufficiency (OSS) as a measure of
sustainability and the scale of outreach (OUTR) as a measure of outreach. Secondly, the
study examines the correlation between OSS and OUTR. By controlling for the MFIs
regulated under the banking laws of Uganda using a dummy variable in both the OSS and
OUTR models, and through analysis of data collected from 31 Tier 4 MFIs, four Bank of
Uganda-regulated MFIs, 12 commercial banks, and the Bank of Uganda itself, the study
investigates the effects of financial regulation of MFIs on their sustainability and outreach.
1.2 Objectives of the study
The overall objective of this research is to investigate and establish the determinants of
sustainability and outreach and the effects of financial regulation of MFIs on their
sustainability and outreach. With reference to Uganda, this study specifically intended to:
• Identify the determinants of sustainability and outreach;
• Establish the relationship between sustainability and outreach;
7 SDI is explained in Chapter Three. 8 Depth of Outreach is explained in Chapter Three.
6
• Investigate the potential and actual effects of financial regulation of MFIs in
Uganda on their sustainability and outreach; and
• Propose policies and practices for promoting sustainability and outreach, and to
facilitate the design and implementation of an appropriate regulatory framework for
the microfinance industry in Uganda.
1.3 Significance of the study
The studies that have been undertaken in the microfinance industry in Uganda have not
been comprehensive in terms of the institutions covered or the depth of analysis, especially
with respect to the application of econometric methods. This study has, therefore, been
justified in that it:
• Identifies the determinants of sustainability and outreach using econometric
methods and covering several MFIs. It also investigates the relationship between
sustainability and outreach using the correlation method. Furthermore, the study
evaluates the potential and actual effects of financial regulation of MFIs on their
sustainability and outreach; and
• The results of the study are useful for various actors in the microfinance industry,
including the potential/current regulators and supervisors of MFIs, to get a broader
understanding of the determinants of sustainability, which is a major institution-
building policy issue, the determinants of outreach, which is a major public policy
issue, and the relationship between the two. The study also provides a deeper insight
into the implications of financial regulation of MFIs on their sustainability and
outreach.
7
1.4 Scope and methodology
This study has three parts, namely sustainability, outreach and regulation, which have been
grouped into two parts for analytical convenience. The first part is principally modelling the
determinants of sustainability and outreach, using econometric methods and panel data
collected from or on 53 MFIs for six years (annual) from 2000 to 2005. Following the
results of the Hausman’s tests, a random-effects (RE) model has been estimated for
sustainability and a fixed-effects (FE) model for outreach.
The data collected were both secondary and primary. The secondary data were collected
from http://www.mixmarket.org, a website for MIX Market, Inc., and Bank of Uganda
reports. The primary data were collected from the MFIs in the sample using a structured
questionnaire (Appendix A1). A significant number of MFIs supplied printed data captured
by the performance-monitoring tool (PMT) or audited accounts. For consistency only data
not found on the website of the MIX Market, Inc. were collected from the MFIs. The
measure of the dependent variable in the sustainability model is the OSS and for the
outreach model it is the Number of Clients (OUTR).
The second main part of the study covers the potential and actual effects of financial
regulation of MFIs on their sustainability and outreach. The investigation of these effects
has been done in two ways:
Way 1: A dummy variable to capture the effects of deposit taking was included both in the
sustainability and outreach models. The sign of this dummy variable and its statistical level
of significance were examined.
Way 2: Survey data were collected from four distinct respondents: 31 Tier 4 MFIs, four
BOU-regulated MFIs, 12 commercial banks, and the BOU itself, and analysed to determine
the effects of financial regulation of MFIs on their sustainability and outreach. Evaluation
of the effects of financial regulation of MFIs on their sustainability and outreach was based
on the licensing requirements and capital, asset quality, management, earnings, liquidity
and market sensitivity (CAMELS) as the main framework.
8
1.5 Research hypotheses
Four categories of hypotheses have been formulated, corresponding to the different aspects
of the study, namely sustainability, outreach, the relationship between sustainability and
outreach, and effects of financial regulation of MFIs on their sustainability and outreach.
Debt equity ratio and savings mobilisation were found insignificant and dropped.
1.5.1 Sustainability (measured by Operational Self-sufficiency (OSS))
Hypothesis 1: Ratio of Gross Loan Portfolio to total assets (GOLP) and OSS are
negatively related.
Hypothesis 2: Effectiveness of Governance (GINDEX) and OSS are positively
related.
Hypothesis 3: SACCO and MDI have positive effects on OSS compared to private
company (COMP), while NGO has negative effects on OSS
compared to COMP.
Hypothesis 4: Average Loan size (AvLz) in relation to the national per capita
income and OSS are positively related.
Hypothesis 5: Real Effective Lending Interest Rate (RELRD) and OSS are
positively related.
Hypothesis 6: Unit Cost of Loans Disbursed (CLD) & OSS are negatively related.
Hypothesis 7: Average Salaries/Wages and benefits in relation to the national per
capita income (WL) and OSS are positively related.
Hypothesis 8: Group-based lending mechanism (DDMg) has a positive effect on
OSS compared to individual lending mechanism (DDMi).
Hypothesis 9: AGE of an MFI and OSS are positively related.
1.5.2 Outreach (measured by the number of clients (OUTR))
Hypothesis 1: GOLP and OUTR are positively related.
Hypothesis 2: GINDEX and OUTR are positively related.
Hypothesis 3: SACCO, MDI and NGO have positive effects on OUTR compared to
COMP.
9
Hypothesis 4: AvLz and OUTR are negatively related.
Hypothesis 5: RELRD and OUTR positively related.
Hypothesis 6: CLD and OUTR are negatively related.
Hypothesis 7: WL and OUTR are positively related
Hypothesis 8: Group-based lending (DDMg) has a positive effect on OUTR
compared to individual lending (DDMi).
Hypothesis 9: AGE and OUTR are positively related.
1.5.3 The relationship between OSS and OUTR
Hypothesis: OSS and OUTR are positively related.
1.5.4 Effects of financial regulation of MFIs on their sustainability and outreach
Hypothesis: The overall potential and actual effect of financial regulation of MFIs is
positive on their OSS and negative on their OUTR.
1.6 Problems encountered and limitations of the study
Considerable difficulties were encountered in collecting standard information on
sustainability and outreach for a number of reasons. First, most of the MFIs were not
keeping the data in the required format. Therefore, a lot of time was spent re-organising the
data. Second, because some of the data required were panel data, repeated visits had to be
made to the sampled MFIs. These were expensive and time consuming. Third, the sampled
MFIs were either reluctant to provide the data or demanded money for the time spent in
assembling the required data. This made the data collection expensive and time consuming.
Fourth, because the microfinance industry is relatively young in Uganda, data for a long
period of time were not available in several institutions. Therefore, it was possible to collect
annual data for six years only from 53 MFIs. Fifth, due to the restructuring that was taking
place in the microfinance industry in Uganda, including the enactment of the MDI Act,
2003, some of the MFIs which were in the sample at the beginning of the survey in 2003
either closed or were restructured and had to be dropped from the sample studied. Despite
10
these problems and limitations, the data collected are reasonable and the best that could be
assembled. In addition, 53 MFIs is a relatively large number of MFIs.
1.7 Organisation of the dissertation
The dissertation is divided into 9 chapters, followed by appendices. The previous sections
of this chapter cover the background, the objectives and the significance of the study, the
scope and methodology, the research hypotheses, and the problems encountered and the
limitations of the study.
Chapter Two presents and discusses Uganda’s economy and the microfinance industry in
order to provide a country context to guide the interpretation of the results. Chapter Three
covers the concepts and measures of sustainability and outreach, and the dependent
variables. Chapter Four focuses on the determinants of sustainability and outreach.
Due to limited guidelines in the microfinance literature on the functional relationship
between OSS and outreach and their determinants, this study makes recourse to the theory
of the firm, and in particular the production and profit functions. A modified Cobb-Douglas
production function and the profit function were estimated and tested.
Chapter Five defines the firm and reviews the literature on the theory of the firm to provide
a framework for a review of the production and profit functions. The chapter argues that a
microfinance institution is a business just like any other in the theory of the firm. Therefore,
the OSS function can be estimated based on the profit function, while the outreach function
can be estimated based on the production function.
Chapter Six brings into the picture financial regulation of MFIs and its potential and actual
effects on their sustainability and outreach. As a background, the chapter first defines the
concept of regulation and discusses the rationale for regulation before discussing the
benefits and costs of regulation. The effects of financial regulation of MFIs on their
sustainability and outreach are assessed based on the Licensing Requirements and the
CAMEL framework extracted from the MDI Act, 2003 as the main framework.
11
A detailed account of the methodology employed in this study is provided in Chapter
Seven, while Chapter Eight covers the empirical analysis. The results of the study indicate
that sustainability is positively and significantly driven by real effective lending rates and
the age of an MFI, and negatively by the ratio of gross outstanding loan portfolio to total
assets, the ratio of average loan size to the national per capita income, the unit cost of loans
disbursed, and a group-based delivery mechanism compared to individual delivery
mechanism. Outreach is positively and significantly driven by an MFI being a SACCO
compared to being a private company, the level of the effectiveness of governance, the age
of an MFI, the ratio of gross outstanding loan portfolio to total assets, and the ratio of
salary/wage paid to staff to the national per capita income, and negatively by the ratio of
average loan size to the national per capita income and the unit cost of loans disbursed. In
the short run financial regulation negatively influences outreach of MFIs, but positively
affects their sustainability.
Chapter Nine summarises the findings and policy recommendations that include:
1) The MFIs should focus on real effective lending rate and let the market forces
determine lending rates. Additionally, the MFIs should be innovative and efficient
in the increasingly competitive microfinance market;
2) The government should keep the rate of inflation low by continuing to implement
effective fiscal and monetary policy;
3) The cost of doing business should be kept low through prudence and efficiency in
business management by the MFIs and creation of a cost-effective business
environment by the government;
4) To expand outreach, more sustainable SACCOs should be established;
5) The MFIs should commit more funds to lending purposes as compared to other
investments; and
6) Before enacting financial laws, it is important that their benefits and costs are
adequately assessed to ensure that the benefits outweigh the costs.
Finally, Appendix A is a list of the MFIs and commercial banks interviewed. Appendix B is
a set of questionnaires used for data collection.
12
CHAPTER TWO: UGANDA’S ECONOMY AND MICROFINANCE INDUSTRY
2.1 Introduction
In Chapter One microfinance and a microfinance institution are defined. The chapter also
covers the background, the objectives and the significance of the study, the scope and
methodology, the research hypotheses, and the problems encountered and the limitations of
the study. This chapter focuses on the context in which the MFIs in Uganda operate, with
an emphasis on the economic environment. The motivation for the chapter is threefold.
First, it is important that the country context in which the study has been done is
substantially described, so that the empirical results are interpreted and understood in a
clearly defined framework. Second and related to the first point, the experience of countries
with a large microfinance industry shows that a country context and more so the economic
aspect is particularly critical in determining the success or failure of financial institutions
(Chaves and Gonzalez-Vega, 1996).
For example, Chaves and Gonzalez-Vega (1996) and Gurgand et al. (1994) identify
dynamism of the economy, macroeconomic stability (low and stable inflation), stable
political environment, high and rapid growth of national outputs and rural incomes
accompanied by the availability of profitable investment opportunities, reduction in
poverty, high density of population, well-developed infrastructure (particularly the physical
and telecommunications infrastructure), integrated domestic markets, and liberalised trade
and exchange rate policies as some of the important country context factors that determine
the success of microfinance activities and institutions.
Furthermore, a strong presence of government at all levels, a high degree of social cohesion
and the existence of the traditional social structures also offer effective mechanisms for
financial contract enforcement, and ultimately high repayment rates, which are critical for
institutional success. In Indonesia, for example, the government intervened, rather
successfully, by establishing semi-independent and locally operated networks (Chaves and
Gonzalez-Vega, 1996:70). In Uganda the government has put in place structures similar to
those in Indonesia (Local Councils and Financial Extension Workers) that could be used to
13
address the question of information asymmetry and improve access to financial services by
the rural and low-income earners (Government of Uganda, 1997).
Third, it is assumed in this study that the demand for microfinance in Uganda is given for
variety of reasons that include a large segment of the low income people living in rural
areas and engaging in small holder agricultural activities and petty trade (See Uganda
Bureau of Statistics, 2002; Meyer et al. 2004). It is therefore important that the rationale for
this assumption is explained and illustrated.
Thus, this chapter reviews Uganda’s economy taking into account the above-mentioned
factors. The chapter is organised as follows: section 2.2 provides an account of the major
economic policy reforms and developments in Uganda since 1962 to highlight some of the
factors that could be responsible for the rapid expansion of the microfinance industry.
Section 2.3 is a description and an analysis of Uganda’s current economic structure. Section
2.4 provides a review of Uganda’s microfinance industry, including a discussion on the
linkages between MFIs and commercial banks. Section 2.5 concludes the chapter.
2.2 Economic policy reforms and the major developments
2.2.1 The period between 1962-70
At Uganda’s independence in 1962 agricultural production dominated the economy. It
provided income to the majority of the population and the country. From its introduction,
cotton was grown mainly by smallholders, while cultivation of coffee shifted to
smallholders following the collapse of the coffee price in 1920/22 (Bank of Uganda,
1970:8). In 1968 cotton and coffee accounted for about 75 per cent of the country’s export
outside East Africa (Bank of Uganda, 1970:11).
While coffee and cotton growing were mainly by the private sector, the public sector set the
pace for the industrial development of the country. However, as the country was preparing
for independence, the World Bank recommended the encouragement of the private sector
(Balunywa, 2002:14).
14
Up until 1969 Uganda pursued a mixed economy policy, whereby the public sector worked
with the private sector. For example, while exporters were required to surrender their
foreign exchange earnings to commercial banks at the prevailing official exchange rates,
the banks held foreign exchange earnings and re-allocated them to importers. The exchange
rate was fixed, but the trade policy was relatively liberal. Internally, however, the
government established industries as joint ventures. Interest rates were administered, and
loans granted to selected sectors, including small farmers, usually in kind through the co-
operative movement. The fiscal policy mainly concentrated on expenditure restraint, and
monetisation of fiscal deficits, through printing money, was limited.
Over the period 1962-70 the macroeconomic situation remained stable and the economy
performed reasonably well. GDP grew by 6 per cent per annum between 1963-70, fiscal
deficits rarely exceeded 2.5 per cent of GDP, inflation was maintained at below 10 per cent
per annum, real interest rates were positive and, except for the last two years, the current
account balance was in surplus (World Bank, 1990). The domestic savings rate averaged 15
per cent of GDP, which could finance a reasonable level of investment. Although narrow,
the financial sector was sound and the formal microfinance activities were not as prevalent
as they are today (Bank of Uganda, 1970). The systems of transportation, education and
health were highly effective (World Bank, 1993).
The World Bank (1993) further reports that the country was self-sufficient in food.
Smallholders produced the major exports and were able to earn cash for the purchase of
non-farm goods and services. Poverty was not widespread. Besides growing faster than the
rest of the economy, the industrial sector supplied the economy with basic inputs, consumer
goods and foreign exchange earnings through the export of textiles and copper.
2.2.2 The period between 1971-86
In 1969 private enterprises were nationalised. Between 1971-1979 and subsequently up to
1986 Uganda’s economy was engulfed in economic mismanagement and civil strife that
had a substantial negative impact on the gains made during the 1962-70 period. For
example, between 1970-80 Uganda’s GDP declined by 25 per cent, exports by 60 per cent
and imports by close to 50 per cent (World Bank, 1993:3). The decline in GDP and poor
15
export performance were translated into low income per capita and growing poverty in the
country. The rate of inflation averaged 70 per cent as the government financed public
expenditure through bank borrowing.
Although in the early 1980s attempts were made to turn the economy around, with a mix of
policies such as floating the Uganda shilling, removal of government control on prices,
raising agricultural producer prices and control of government spending, widespread civil
strife and political turmoil in the country limited the achievement of positive results to such
an extent that by 1987 the inflation rate was reportedly at 250 per cent (Musinguzi and
Smith, 2000; The Economist Intelligence Unit Limited, 1999; World Bank, 1993).
The majority of Uganda’s population were plunged into subsistence agricultural
production. With a fixed exchange rate regime and a high domestic inflation rate, Uganda’s
exports were uncompetitive and the opportunities to earn foreign exchange were
significantly curtailed. Rising import levels and a fixed exchange rate led to a “black”
market exchange rate. The balance of payments deficits widened as a result, and the
economy became increasingly fragile both internally and externally. At this stage, clearly,
the economy needed immediate re-dress.
2.2.3 The period from 1987 onwards
In 1987 the Government of Uganda launched a comprehensive Economic Recovery
Programme (ERP) to bring down and stabilise the inflation rate and reduce imbalances in
the economy in order to lay a foundation for broad-based economic growth (World Bank,
1990, 1993; Kibirango and Kasekende, 1992; Bategeka, 1999). The ERP was comprised of
stabilisation policies and structural adjustment programmes (SAPs). While stabilisation
policies were designed to restrict the demand within the overall resource envelope to
restore internal financial equilibrium, SAPs were designed to increase efficiency, stimulate
the supply side of the economy and encourage economic growth.
In the financial sector a number of reforms were instituted. New laws were enacted and the
monetary policy formulation and implementation shifted from administered to a market-
based approach, where open market operations (OMO) are the major means of influencing
16
the level of money supply in the economy. For example, the BOU Act, 1966 was replaced
by the BOU Statute, 1993 (Government of Uganda, 1993). The government also undertook
to divest from owning any financial institution, a policy objective that was fully realized in
2002, when the last government-owned commercial bank was privatised. In addition, the
Capital Markets Authority (CMA) was established to spearhead the development of the
capital markets in the country.
2.2.5 Key results of the stabilisation policies and SAPs from 1987 onwards
The results of the stabilisation policies, the SAPs as well as the subsequent consolidation
policies have been mixed. Although fragile, overall, the internal equilibrium has been
restored and the external equilibrium has improved. However, there have been concerns,
especially since the late 1990s, about whether the macroeconomic success achieved is
being shared by all Ugandans (Musinguzi and Smith, 2000:124). In particular, the trickle-
down effects do not seem to be visible in rural areas and most Ugandans were reportedly
poor (Ochieng, 1998), prompting the UNDP to refer to the “two faces of Uganda” (cited in
Musinguzi and Smith, 2000:124).
2.2.4.1 Major developments in inflation and Gross Domestic Product (GDP)
Table 2.1 provides a summary of some selected key macroeconomic indicators for the
period 1989-2005. The inflation rate was brought down from 250 per cent in 1987 to 6.4
per cent by the end of September, 1997 with a slight increase to 8.5 per cent by the end of
2005. Between 1989-97 real GDP grew, on average, by 6.2 per cent per annum, peaking at
10.1 per cent in 1994/95. At the turn of 2000 and up to 2005 GDP has been growing, on
average, at a lower rate. The performance of the GDP per capita has been sluggish,
increasing, on average, by about 2.5 per cent per annum between 2002 and 2005. The
nominal exchange rate depreciated steadily between 1989 and 2005.
Table 2.2 shows the proportions of the number of people below the poverty line9 who lived
in urban and rural areas between 1992-2000. The number of people living below the
9 The poverty line was constructed based on the World Bank approach of spending less than US$1 a day.
17
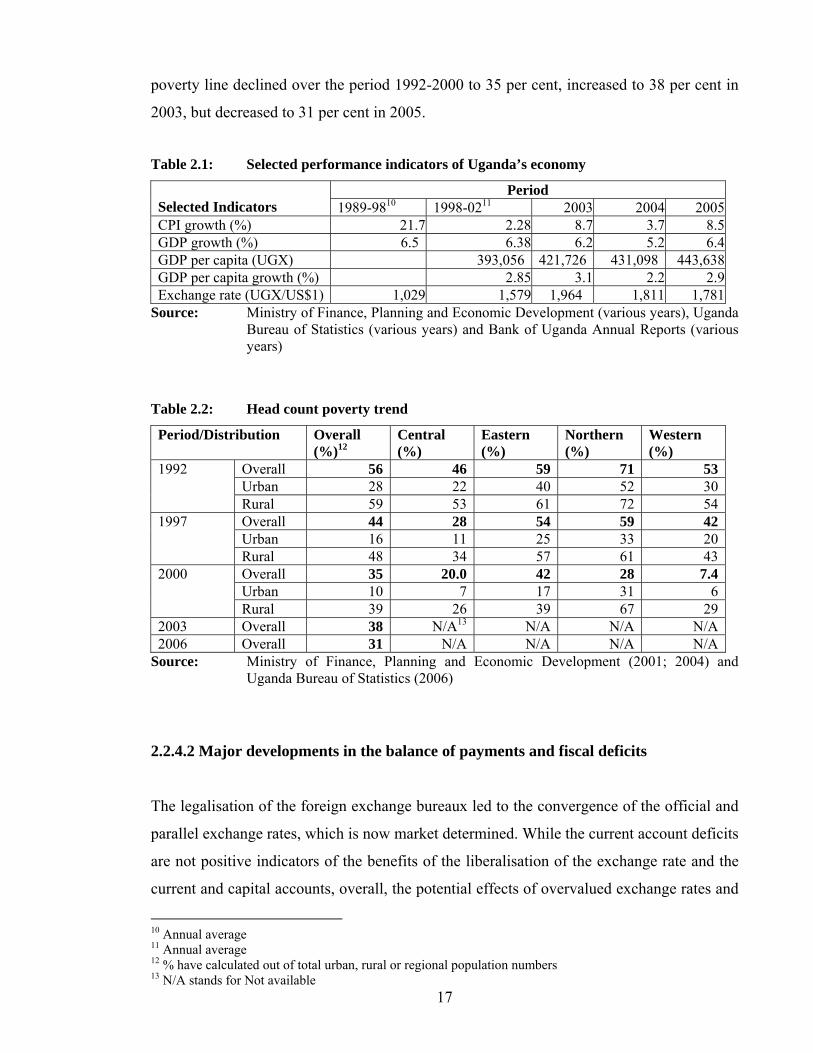
poverty line declined over the period 1992-2000 to 35 per cent, increased to 38 per cent in
2003, but decreased to 31 per cent in 2005.
Table 2.1: Selected performance indicators of Uganda’s economy
Period Selected Indicators 1989-9810 1998-0211 2003 2004 2005CPI growth (%) 21.7 2.28 8.7 3.7 8.5GDP growth (%) 6.5 6.38 6.2 5.2 6.4GDP per capita (UGX) 393,056 421,726 431,098 443,638GDP per capita growth (%) 2.85 3.1 2.2 2.9Exchange rate (UGX/US$1) 1,029 1,579 1,964 1,811 1,781
Source: Ministry of Finance, Planning and Economic Development (various years), Uganda Bureau of Statistics (various years) and Bank of Uganda Annual Reports (various years)
Table 2.2: Head count poverty trend
Period/Distribution Overall (%)12
Central (%)
Eastern (%)
Northern (%)
Western (%)
Overall 56 46 59 71 53Urban 28 22 40 52 30
1992
Rural 59 53 61 72 54Overall 44 28 54 59 42Urban 16 11 25 33 20
1997
Rural 48 34 57 61 43Overall 35 20.0 42 28 7.4Urban 10 7 17 31 6
2000
Rural 39 26 39 67 292003 Overall 38 N/A13 N/A N/A N/A2006 Overall 31 N/A N/A N/A N/A
Source: Ministry of Finance, Planning and Economic Development (2001; 2004) and Uganda Bureau of Statistics (2006)
2.2.4.2 Major developments in the balance of payments and fiscal deficits
The legalisation of the foreign exchange bureaux led to the convergence of the official and
parallel exchange rates, which is now market determined. While the current account deficits
are not positive indicators of the benefits of the liberalisation of the exchange rate and the
current and capital accounts, overall, the potential effects of overvalued exchange rates and
10 Annual average 11 Annual average 12 % have calculated out of total urban, rural or regional population numbers 13 N/A stands for Not available
18
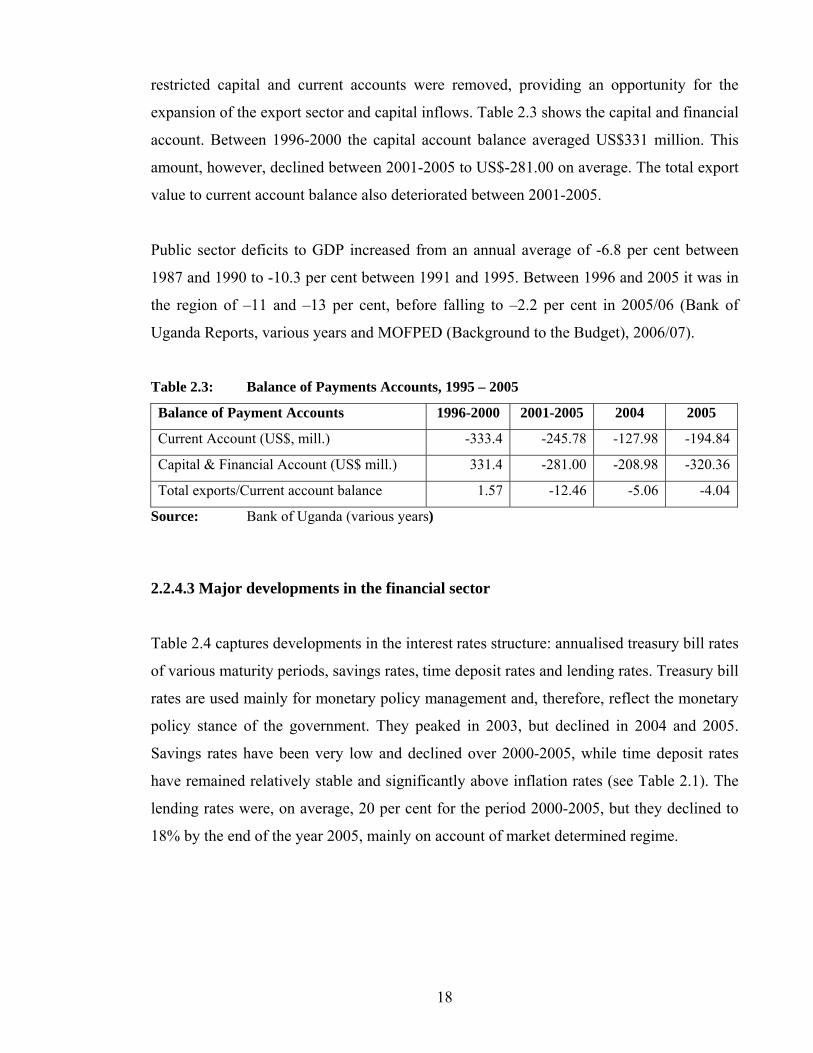
restricted capital and current accounts were removed, providing an opportunity for the
expansion of the export sector and capital inflows. Table 2.3 shows the capital and financial
account. Between 1996-2000 the capital account balance averaged US$331 million. This
amount, however, declined between 2001-2005 to US$-281.00 on average. The total export
value to current account balance also deteriorated between 2001-2005.
Public sector deficits to GDP increased from an annual average of -6.8 per cent between
1987 and 1990 to -10.3 per cent between 1991 and 1995. Between 1996 and 2005 it was in
the region of –11 and –13 per cent, before falling to –2.2 per cent in 2005/06 (Bank of
Uganda Reports, various years and MOFPED (Background to the Budget), 2006/07).
Table 2.3: Balance of Payments Accounts, 1995 – 2005
Balance of Payment Accounts 1996-2000 2001-2005 2004 2005
Current Account (US$, mill.) -333.4 -245.78 -127.98 -194.84
Capital & Financial Account (US$ mill.) 331.4 -281.00 -208.98 -320.36
Total exports/Current account balance 1.57 -12.46 -5.06 -4.04
Source: Bank of Uganda (various years)
2.2.4.3 Major developments in the financial sector
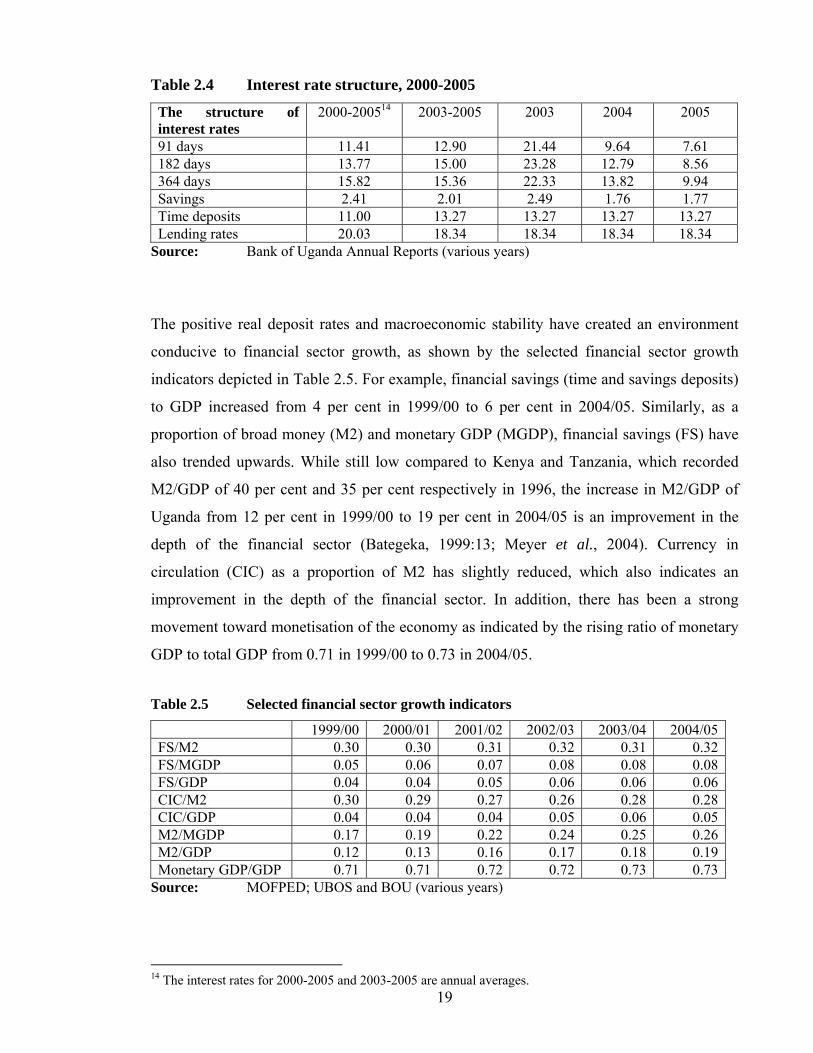
Table 2.4 captures developments in the interest rates structure: annualised treasury bill rates
of various maturity periods, savings rates, time deposit rates and lending rates. Treasury bill
rates are used mainly for monetary policy management and, therefore, reflect the monetary
policy stance of the government. They peaked in 2003, but declined in 2004 and 2005.
Savings rates have been very low and declined over 2000-2005, while time deposit rates
have remained relatively stable and significantly above inflation rates (see Table 2.1). The
lending rates were, on average, 20 per cent for the period 2000-2005, but they declined to
18% by the end of the year 2005, mainly on account of market determined regime.
19
Table 2.4 Interest rate structure, 2000-2005
The structure of interest rates
2000-200514 2003-2005 2003 2004 2005
91 days 11.41 12.90 21.44 9.64 7.61 182 days 13.77 15.00 23.28 12.79 8.56 364 days 15.82 15.36 22.33 13.82 9.94 Savings 2.41 2.01 2.49 1.76 1.77 Time deposits 11.00 13.27 13.27 13.27 13.27 Lending rates 20.03 18.34 18.34 18.34 18.34
Source: Bank of Uganda Annual Reports (various years)
The positive real deposit rates and macroeconomic stability have created an environment
conducive to financial sector growth, as shown by the selected financial sector growth
indicators depicted in Table 2.5. For example, financial savings (time and savings deposits)
to GDP increased from 4 per cent in 1999/00 to 6 per cent in 2004/05. Similarly, as a
proportion of broad money (M2) and monetary GDP (MGDP), financial savings (FS) have
also trended upwards. While still low compared to Kenya and Tanzania, which recorded
M2/GDP of 40 per cent and 35 per cent respectively in 1996, the increase in M2/GDP of
Uganda from 12 per cent in 1999/00 to 19 per cent in 2004/05 is an improvement in the
depth of the financial sector (Bategeka, 1999:13; Meyer et al., 2004). Currency in
circulation (CIC) as a proportion of M2 has slightly reduced, which also indicates an
improvement in the depth of the financial sector. In addition, there has been a strong
movement toward monetisation of the economy as indicated by the rising ratio of monetary
GDP to total GDP from 0.71 in 1999/00 to 0.73 in 2004/05.
Table 2.5 Selected financial sector growth indicators
1999/00 2000/01 2001/02 2002/03 2003/04 2004/05FS/M2 0.30 0.30 0.31 0.32 0.31 0.32FS/MGDP 0.05 0.06 0.07 0.08 0.08 0.08FS/GDP 0.04 0.04 0.05 0.06 0.06 0.06CIC/M2 0.30 0.29 0.27 0.26 0.28 0.28CIC/GDP 0.04 0.04 0.04 0.05 0.06 0.05M2/MGDP 0.17 0.19 0.22 0.24 0.25 0.26M2/GDP 0.12 0.13 0.16 0.17 0.18 0.19Monetary GDP/GDP 0.71 0.71 0.72 0.72 0.73 0.73
Source: MOFPED; UBOS and BOU (various years)
14 The interest rates for 2000-2005 and 2003-2005 are annual averages.
20
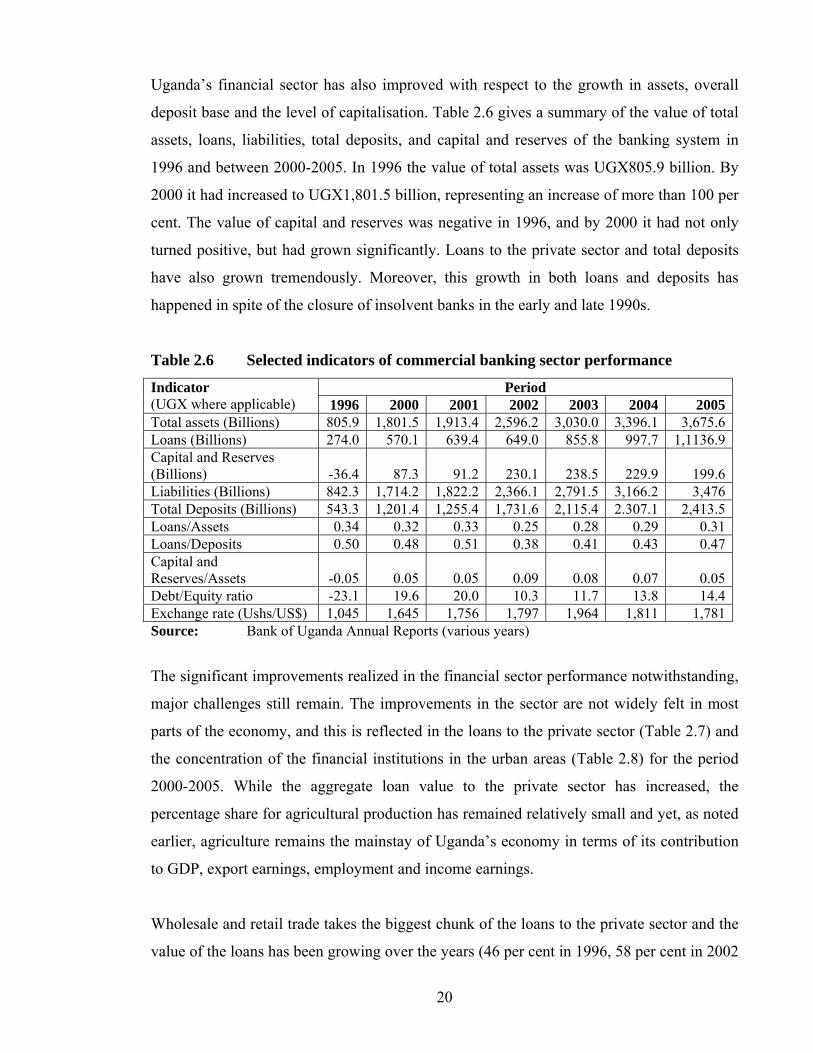
Uganda’s financial sector has also improved with respect to the growth in assets, overall
deposit base and the level of capitalisation. Table 2.6 gives a summary of the value of total
assets, loans, liabilities, total deposits, and capital and reserves of the banking system in
1996 and between 2000-2005. In 1996 the value of total assets was UGX805.9 billion. By
2000 it had increased to UGX1,801.5 billion, representing an increase of more than 100 per
cent. The value of capital and reserves was negative in 1996, and by 2000 it had not only
turned positive, but had grown significantly. Loans to the private sector and total deposits
have also grown tremendously. Moreover, this growth in both loans and deposits has
happened in spite of the closure of insolvent banks in the early and late 1990s.
Table 2.6 Selected indicators of commercial banking sector performance
Period Indicator (UGX where applicable) 1996 2000 2001 2002 2003 2004 2005Total assets (Billions) 805.9 1,801.5 1,913.4 2,596.2 3,030.0 3,396.1 3,675.6Loans (Billions) 274.0 570.1 639.4 649.0 855.8 997.7 1,1136.9Capital and Reserves (Billions)
-36.4
87.3
91.2
230.1
238.5
229.9
199.6
Liabilities (Billions) 842.3 1,714.2 1,822.2 2,366.1 2,791.5 3,166.2 3,476Total Deposits (Billions) 543.3 1,201.4 1,255.4 1,731.6 2,115.4 2.307.1 2,413.5Loans/Assets 0.34 0.32 0.33 0.25 0.28 0.29 0.31Loans/Deposits 0.50 0.48 0.51 0.38 0.41 0.43 0.47Capital and Reserves/Assets
-0.05
0.05
0.05
0.09
0.08
0.07
0.05
Debt/Equity ratio -23.1 19.6 20.0 10.3 11.7 13.8 14.4Exchange rate (Ushs/US$) 1,045 1,645 1,756 1,797 1,964 1,811 1,781Source: Bank of Uganda Annual Reports (various years)
The significant improvements realized in the financial sector performance notwithstanding,
major challenges still remain. The improvements in the sector are not widely felt in most
parts of the economy, and this is reflected in the loans to the private sector (Table 2.7) and
the concentration of the financial institutions in the urban areas (Table 2.8) for the period
2000-2005. While the aggregate loan value to the private sector has increased, the
percentage share for agricultural production has remained relatively small and yet, as noted
earlier, agriculture remains the mainstay of Uganda’s economy in terms of its contribution
to GDP, export earnings, employment and income earnings.
Wholesale and retail trade takes the biggest chunk of the loans to the private sector and the
value of the loans has been growing over the years (46 per cent in 1996, 58 per cent in 2002
21
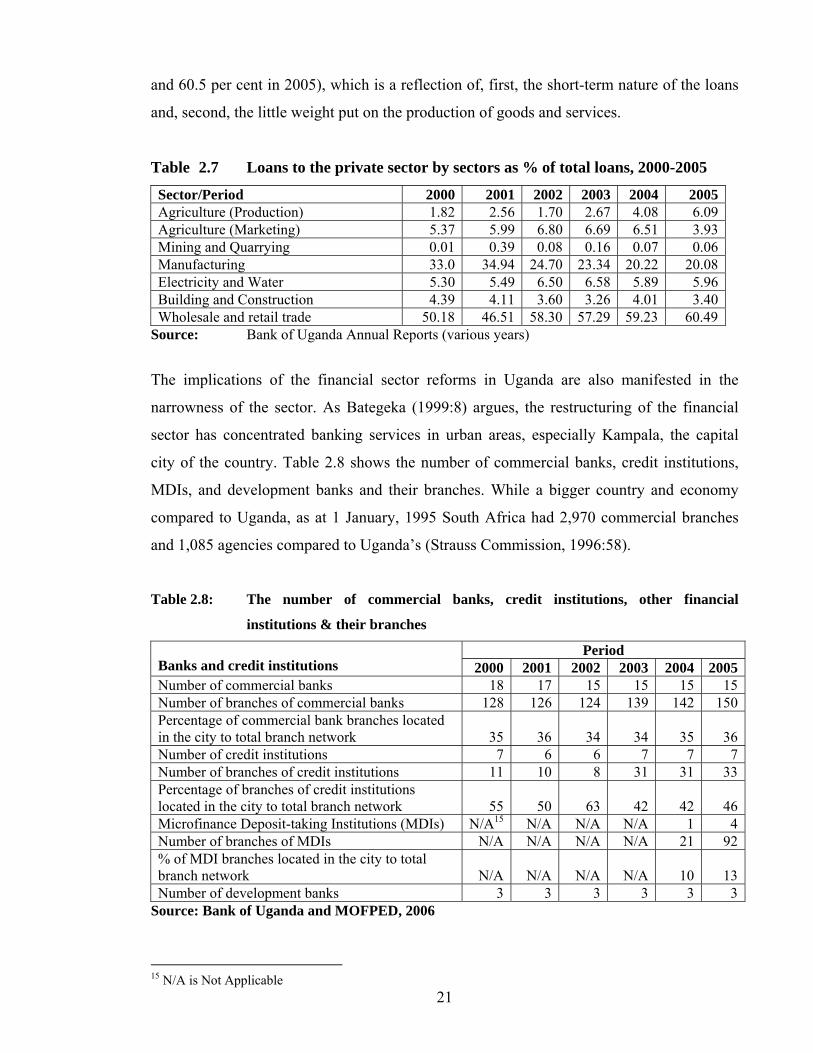
and 60.5 per cent in 2005), which is a reflection of, first, the short-term nature of the loans
and, second, the little weight put on the production of goods and services.
Table 2.7 Loans to the private sector by sectors as % of total loans, 2000-2005
Sector/Period 2000 2001 2002 2003 2004 2005Agriculture (Production) 1.82 2.56 1.70 2.67 4.08 6.09Agriculture (Marketing) 5.37 5.99 6.80 6.69 6.51 3.93Mining and Quarrying 0.01 0.39 0.08 0.16 0.07 0.06Manufacturing 33.0 34.94 24.70 23.34 20.22 20.08Electricity and Water 5.30 5.49 6.50 6.58 5.89 5.96Building and Construction 4.39 4.11 3.60 3.26 4.01 3.40Wholesale and retail trade 50.18 46.51 58.30 57.29 59.23 60.49
Source: Bank of Uganda Annual Reports (various years)
The implications of the financial sector reforms in Uganda are also manifested in the
narrowness of the sector. As Bategeka (1999:8) argues, the restructuring of the financial
sector has concentrated banking services in urban areas, especially Kampala, the capital
city of the country. Table 2.8 shows the number of commercial banks, credit institutions,
MDIs, and development banks and their branches. While a bigger country and economy
compared to Uganda, as at 1 January, 1995 South Africa had 2,970 commercial branches
and 1,085 agencies compared to Uganda’s (Strauss Commission, 1996:58).
Table 2.8: The number of commercial banks, credit institutions, other financial
institutions & their branches
Period Banks and credit institutions 2000 2001 2002 2003 2004 2005Number of commercial banks 18 17 15 15 15 15Number of branches of commercial banks 128 126 124 139 142 150Percentage of commercial bank branches located in the city to total branch network
35
36
34
34
35
36
Number of credit institutions 7 6 6 7 7 7Number of branches of credit institutions 11 10 8 31 31 33Percentage of branches of credit institutions located in the city to total branch network
55
50
63
42
42
46
Microfinance Deposit-taking Institutions (MDIs) N/A15 N/A N/A N/A 1 4Number of branches of MDIs N/A N/A N/A N/A 21 92% of MDI branches located in the city to total branch network
N/A
N/A
N/A
N/A
10
13
Number of development banks 3 3 3 3 3 3Source: Bank of Uganda and MOFPED, 2006
15 N/A is Not Applicable
22
All the financial institutions have their head offices located in the capital city and there are
only two banks with a widespread national branch network, namely CERUDEB and
Stanbic Bank (U) Ltd. PostBank Uganda Ltd, which was formerly part of Uganda Post and
Telecommunications Corporation (UPTC), uses the branch network of the former parent
company located in several parts of the country.
By December 2005 CERUDEB had 25 branches, Stanbic Bank (U) Ltd had 67 branches
and PostBank Uganda had 20 branches. However, apart from PostBank Uganda, with a
branch network stretching beyond district headquarters, CERUDEB and Stanbic Bank (U)
Ltd have their branches located at the district headquarters. Three branches of CERUDEB
and 14 of Stanbic Bank (U) Ltd were located in Kampala. This shows that the rural areas in
Uganda are seriously under-served by the formal financial sector, which is one main reason
why the microfinance industry has expanded so rapidly (Bategeka, 1999:8).
In 1996 the Capital Markets Authority (CMA) was established and a year later Uganda
Securities Exchange (USE) was formed. CMA is the licensing and regulatory body set up
by the Government of Uganda, while USE is a stock exchange, where agents of buyers and
sellers trade securities. These agents are licensed by the CMA and are members of USE.
Currently USE is the only licensed stock exchange in Uganda and by the end of 2005 nine
companies had been listed (Capital Markets Authority, 2006:12).
2.2.4.4 The major developments in the privatisation drive
Besides privatisation of all commercial banks in the country, other enterprises have been
privatised (or are in the process of being privatised). In 1992, when the privatisation
exercise was launched, there were 154 enterprises in which the government had shares
(Jaramogi, 2004; Wood, 2000:31). Of these 89 have been privatised and 33 have been
either deleted from the Register of Companies or liquidated as of October 2006
(Privatization and Utility Reform Project, 2006).
One of the companies privatised, which has had a major impact on Uganda’s economy, is
the former government-owned UPTC. The privatisation of this company has resulted in the
licensing of additional telecommunication companies, including Mobile Telephone
23
Network (MTN), Celtel Uganda, Starcom Corporation, and Mango. In less than three years
after privatisation the number of phones in the country increased from 45,000 to 150,000
(Balunywa, 2002) and several jobs have been created. By the end of 2005, 1.5 million
subscribers had been registered (MOFPED, 2006).
Other sectors that have been liberalised – with enormous impact on the economy – include
education, health, transport and power. For example, private primary and secondary
schools, tertiary institutions and universities have been established and enrolment has
increased. The universities, in particular, are more widespread across the country. These
have led to an increase in the demand for financial services to finance education.
2.3. Uganda’s current economic structure
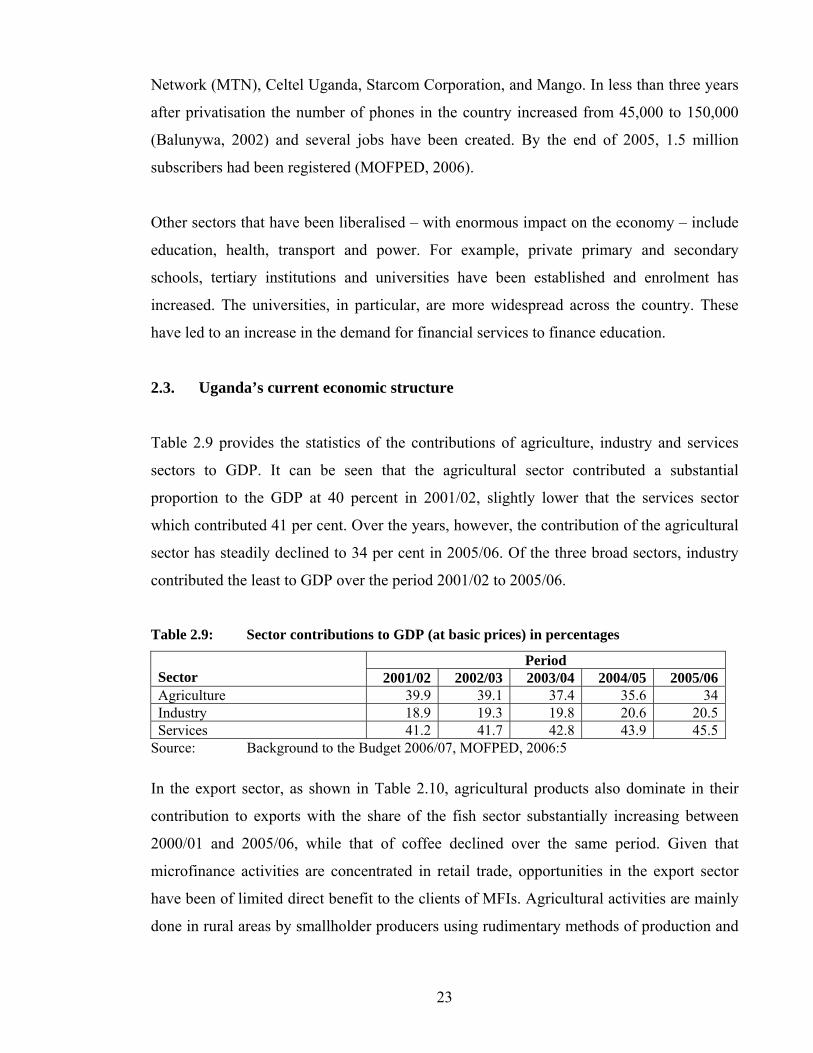
Table 2.9 provides the statistics of the contributions of agriculture, industry and services
sectors to GDP. It can be seen that the agricultural sector contributed a substantial
proportion to the GDP at 40 percent in 2001/02, slightly lower that the services sector
which contributed 41 per cent. Over the years, however, the contribution of the agricultural
sector has steadily declined to 34 per cent in 2005/06. Of the three broad sectors, industry
contributed the least to GDP over the period 2001/02 to 2005/06.
Table 2.9: Sector contributions to GDP (at basic prices) in percentages
Period Sector 2001/02 2002/03 2003/04 2004/05 2005/06Agriculture 39.9 39.1 37.4 35.6 34Industry 18.9 19.3 19.8 20.6 20.5Services 41.2 41.7 42.8 43.9 45.5
Source: Background to the Budget 2006/07, MOFPED, 2006:5
In the export sector, as shown in Table 2.10, agricultural products also dominate in their
contribution to exports with the share of the fish sector substantially increasing between
2000/01 and 2005/06, while that of coffee declined over the same period. Given that
microfinance activities are concentrated in retail trade, opportunities in the export sector
have been of limited direct benefit to the clients of MFIs. Agricultural activities are mainly
done in rural areas by smallholder producers using rudimentary methods of production and
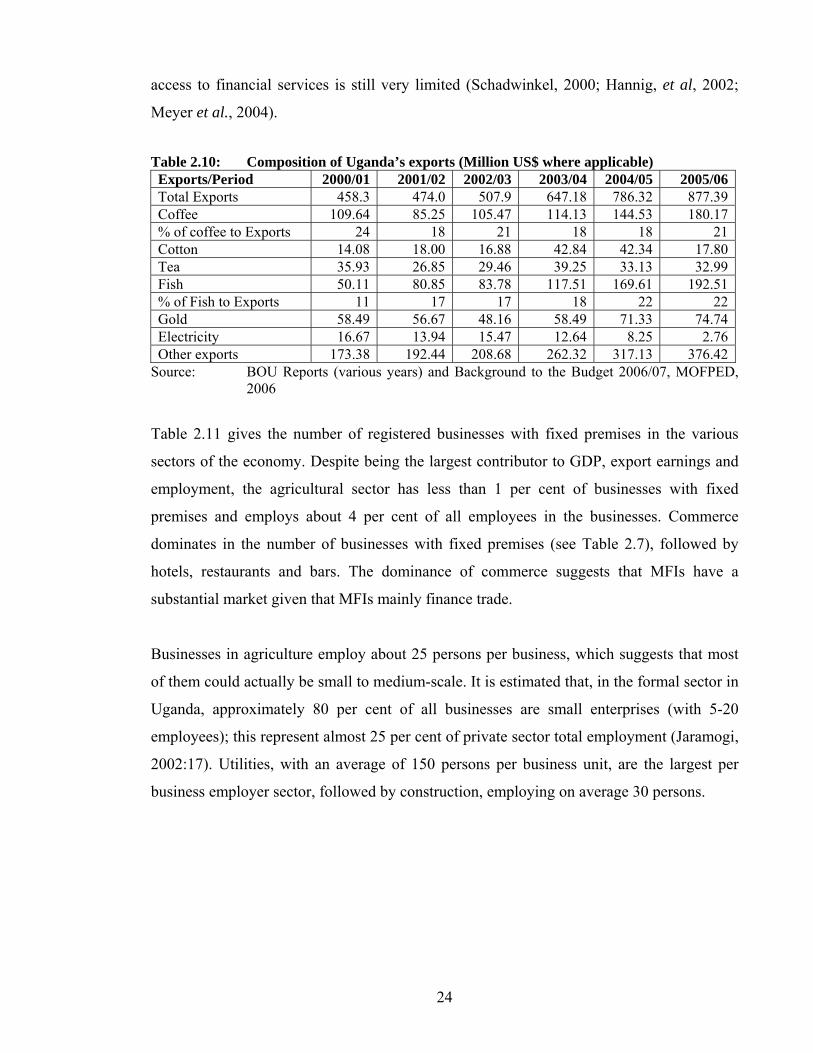
24
access to financial services is still very limited (Schadwinkel, 2000; Hannig, et al, 2002;
Meyer et al., 2004).
Table 2.10: Composition of Uganda’s exports (Million US$ where applicable) Exports/Period 2000/01 2001/02 2002/03 2003/04 2004/05 2005/06Total Exports 458.3 474.0 507.9 647.18 786.32 877.39Coffee 109.64 85.25 105.47 114.13 144.53 180.17% of coffee to Exports 24 18 21 18 18 21Cotton 14.08 18.00 16.88 42.84 42.34 17.80Tea 35.93 26.85 29.46 39.25 33.13 32.99Fish 50.11 80.85 83.78 117.51 169.61 192.51% of Fish to Exports 11 17 17 18 22 22Gold 58.49 56.67 48.16 58.49 71.33 74.74Electricity 16.67 13.94 15.47 12.64 8.25 2.76Other exports 173.38 192.44 208.68 262.32 317.13 376.42
Source: BOU Reports (various years) and Background to the Budget 2006/07, MOFPED, 2006
Table 2.11 gives the number of registered businesses with fixed premises in the various
sectors of the economy. Despite being the largest contributor to GDP, export earnings and
employment, the agricultural sector has less than 1 per cent of businesses with fixed
premises and employs about 4 per cent of all employees in the businesses. Commerce
dominates in the number of businesses with fixed premises (see Table 2.7), followed by
hotels, restaurants and bars. The dominance of commerce suggests that MFIs have a
substantial market given that MFIs mainly finance trade.
Businesses in agriculture employ about 25 persons per business, which suggests that most
of them could actually be small to medium-scale. It is estimated that, in the formal sector in
Uganda, approximately 80 per cent of all businesses are small enterprises (with 5-20
employees); this represent almost 25 per cent of private sector total employment (Jaramogi,
2002:17). Utilities, with an average of 150 persons per business unit, are the largest per
business employer sector, followed by construction, employing on average 30 persons.
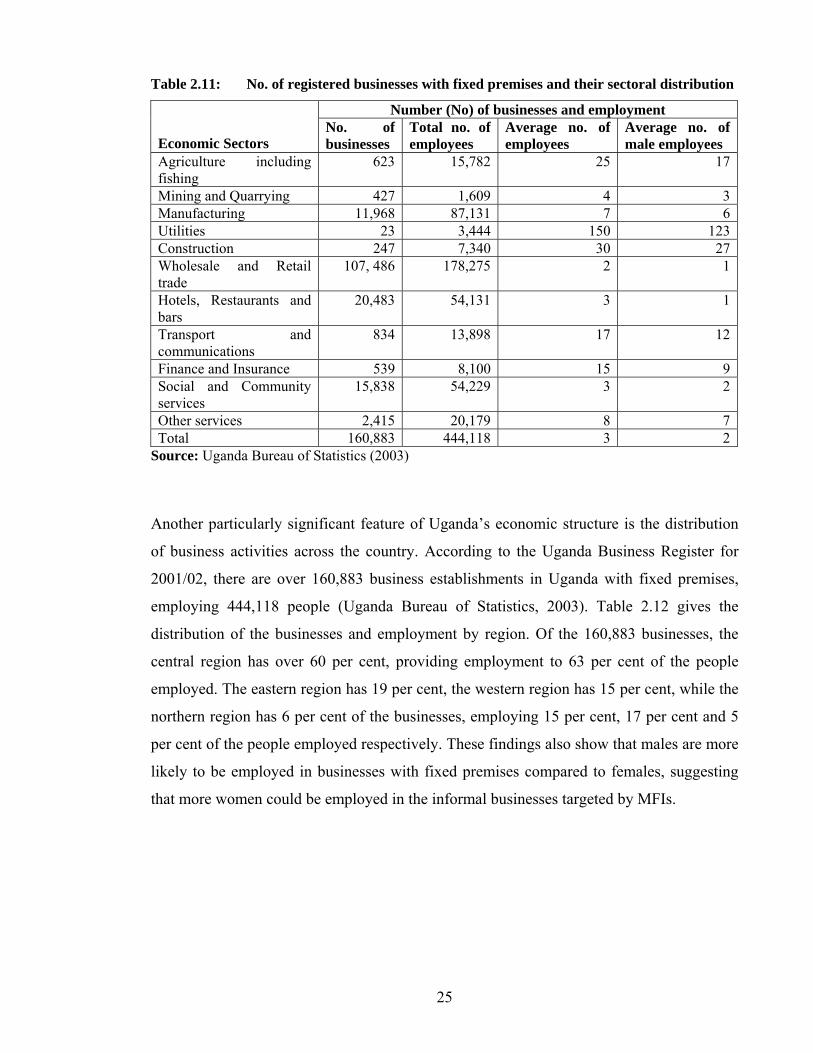
25
Table 2.11: No. of registered businesses with fixed premises and their sectoral distribution
Number (No) of businesses and employment Economic Sectors
No. of businesses
Total no. of employees
Average no. of employees
Average no. of male employees
Agriculture including fishing
623 15,782 25 17
Mining and Quarrying 427 1,609 4 3Manufacturing 11,968 87,131 7 6Utilities 23 3,444 150 123Construction 247 7,340 30 27Wholesale and Retail trade
107, 486 178,275 2 1
Hotels, Restaurants and bars
20,483 54,131 3 1
Transport and communications
834 13,898 17 12
Finance and Insurance 539 8,100 15 9Social and Community services
15,838 54,229 3 2
Other services 2,415 20,179 8 7Total 160,883 444,118 3 2
Source: Uganda Bureau of Statistics (2003)
Another particularly significant feature of Uganda’s economic structure is the distribution
of business activities across the country. According to the Uganda Business Register for
2001/02, there are over 160,883 business establishments in Uganda with fixed premises,
employing 444,118 people (Uganda Bureau of Statistics, 2003). Table 2.12 gives the
distribution of the businesses and employment by region. Of the 160,883 businesses, the
central region has over 60 per cent, providing employment to 63 per cent of the people
employed. The eastern region has 19 per cent, the western region has 15 per cent, while the
northern region has 6 per cent of the businesses, employing 15 per cent, 17 per cent and 5
per cent of the people employed respectively. These findings also show that males are more
likely to be employed in businesses with fixed premises compared to females, suggesting
that more women could be employed in the informal businesses targeted by MFIs.
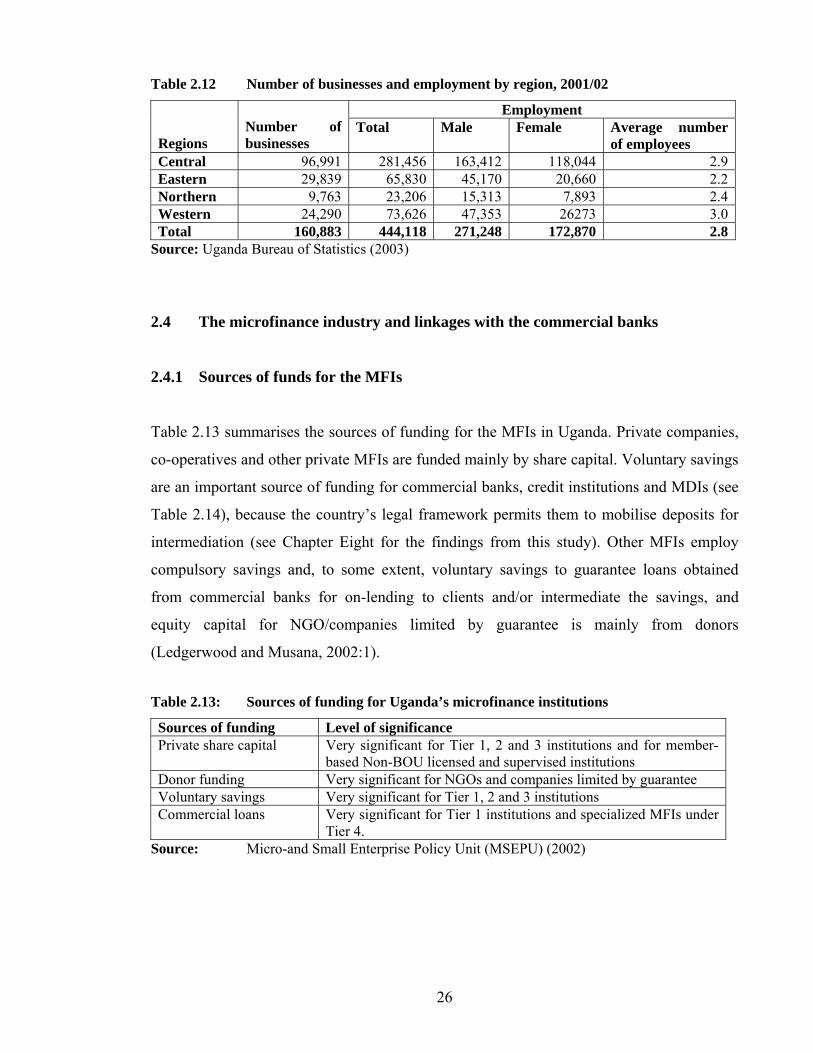
26
Table 2.12 Number of businesses and employment by region, 2001/02
Employment Regions
Number of businesses
Total Male Female Average number of employees
Central 96,991 281,456 163,412 118,044 2.9Eastern 29,839 65,830 45,170 20,660 2.2Northern 9,763 23,206 15,313 7,893 2.4Western 24,290 73,626 47,353 26273 3.0Total 160,883 444,118 271,248 172,870 2.8
Source: Uganda Bureau of Statistics (2003)
2.4 The microfinance industry and linkages with the commercial banks
2.4.1 Sources of funds for the MFIs
Table 2.13 summarises the sources of funding for the MFIs in Uganda. Private companies,
co-operatives and other private MFIs are funded mainly by share capital. Voluntary savings
are an important source of funding for commercial banks, credit institutions and MDIs (see
Table 2.14), because the country’s legal framework permits them to mobilise deposits for
intermediation (see Chapter Eight for the findings from this study). Other MFIs employ
compulsory savings and, to some extent, voluntary savings to guarantee loans obtained
from commercial banks for on-lending to clients and/or intermediate the savings, and
equity capital for NGO/companies limited by guarantee is mainly from donors
(Ledgerwood and Musana, 2002:1).
Table 2.13: Sources of funding for Uganda’s microfinance institutions
Sources of funding Level of significance Private share capital Very significant for Tier 1, 2 and 3 institutions and for member-
based Non-BOU licensed and supervised institutions Donor funding Very significant for NGOs and companies limited by guarantee Voluntary savings Very significant for Tier 1, 2 and 3 institutions Commercial loans Very significant for Tier 1 institutions and specialized MFIs under
Tier 4. Source: Micro-and Small Enterprise Policy Unit (MSEPU) (2002)
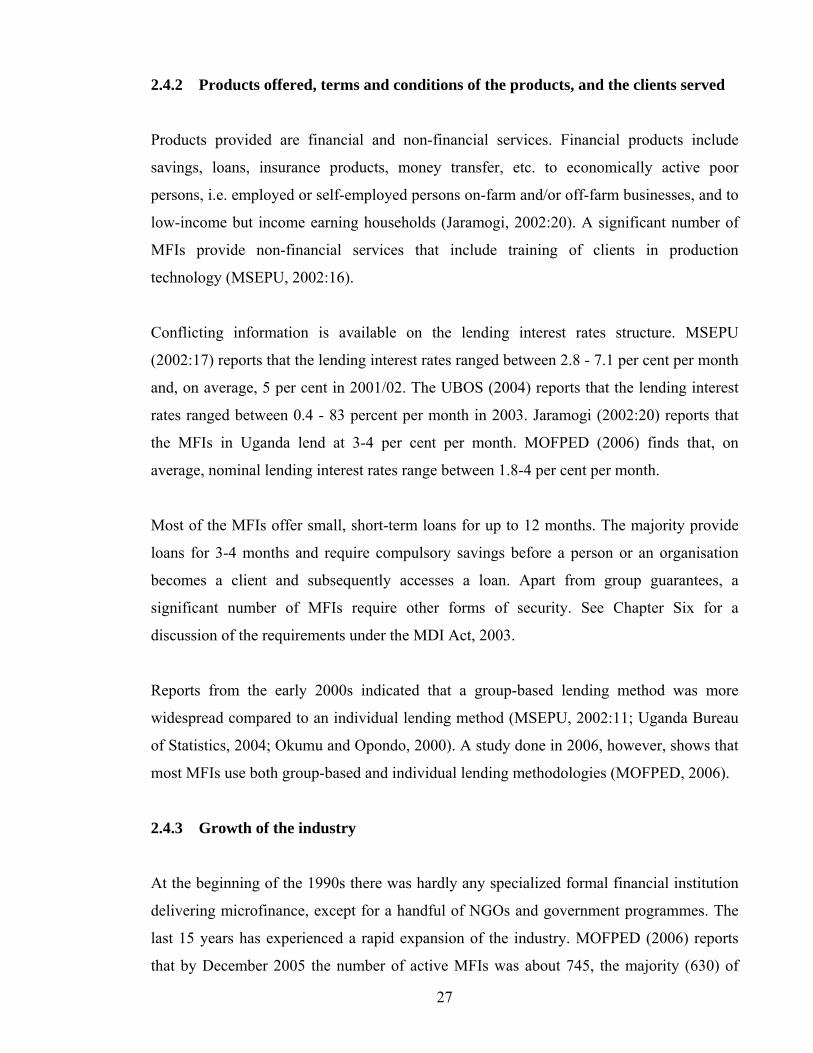
27
2.4.2 Products offered, terms and conditions of the products, and the clients served
Products provided are financial and non-financial services. Financial products include
savings, loans, insurance products, money transfer, etc. to economically active poor
persons, i.e. employed or self-employed persons on-farm and/or off-farm businesses, and to
low-income but income earning households (Jaramogi, 2002:20). A significant number of
MFIs provide non-financial services that include training of clients in production
technology (MSEPU, 2002:16).
Conflicting information is available on the lending interest rates structure. MSEPU
(2002:17) reports that the lending interest rates ranged between 2.8 - 7.1 per cent per month
and, on average, 5 per cent in 2001/02. The UBOS (2004) reports that the lending interest
rates ranged between 0.4 - 83 percent per month in 2003. Jaramogi (2002:20) reports that
the MFIs in Uganda lend at 3-4 per cent per month. MOFPED (2006) finds that, on
average, nominal lending interest rates range between 1.8-4 per cent per month.
Most of the MFIs offer small, short-term loans for up to 12 months. The majority provide
loans for 3-4 months and require compulsory savings before a person or an organisation
becomes a client and subsequently accesses a loan. Apart from group guarantees, a
significant number of MFIs require other forms of security. See Chapter Six for a
discussion of the requirements under the MDI Act, 2003.
Reports from the early 2000s indicated that a group-based lending method was more
widespread compared to an individual lending method (MSEPU, 2002:11; Uganda Bureau
of Statistics, 2004; Okumu and Opondo, 2000). A study done in 2006, however, shows that
most MFIs use both group-based and individual lending methodologies (MOFPED, 2006).
2.4.3 Growth of the industry
At the beginning of the 1990s there was hardly any specialized formal financial institution
delivering microfinance, except for a handful of NGOs and government programmes. The
last 15 years has experienced a rapid expansion of the industry. MOFPED (2006) reports
that by December 2005 the number of active MFIs was about 745, the majority (630) of
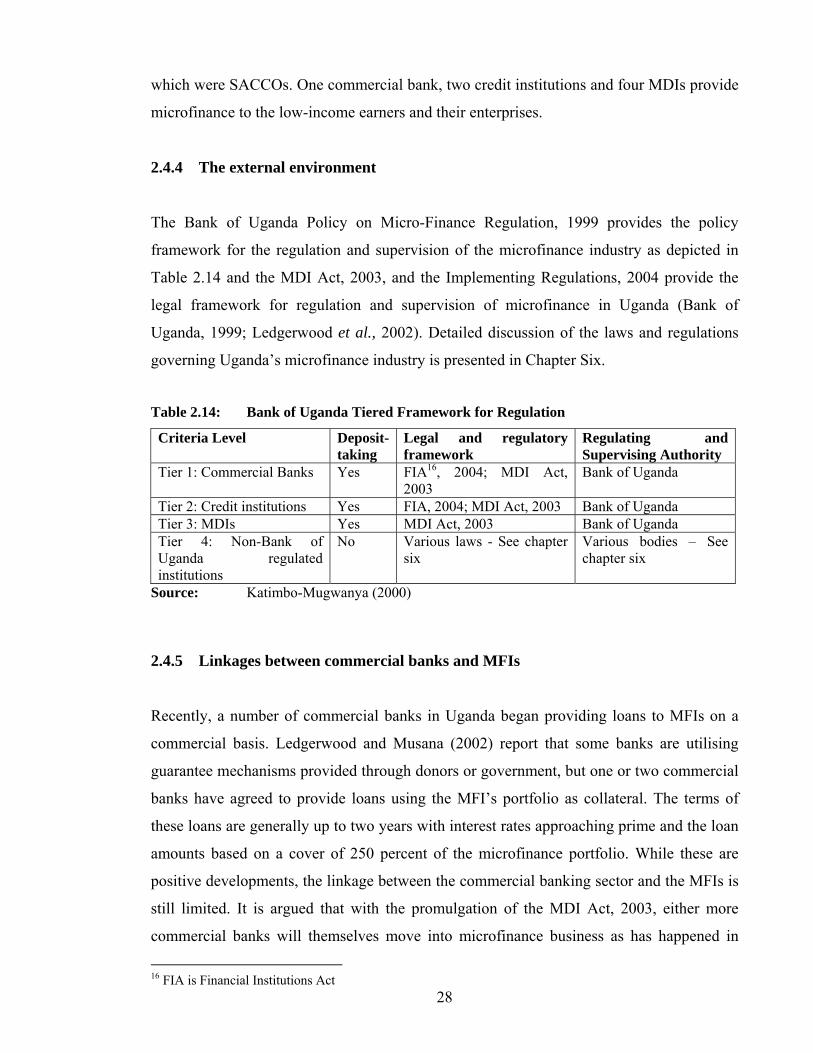
28
which were SACCOs. One commercial bank, two credit institutions and four MDIs provide
microfinance to the low-income earners and their enterprises.
2.4.4 The external environment
The Bank of Uganda Policy on Micro-Finance Regulation, 1999 provides the policy
framework for the regulation and supervision of the microfinance industry as depicted in
Table 2.14 and the MDI Act, 2003, and the Implementing Regulations, 2004 provide the
legal framework for regulation and supervision of microfinance in Uganda (Bank of
Uganda, 1999; Ledgerwood et al., 2002). Detailed discussion of the laws and regulations
governing Uganda’s microfinance industry is presented in Chapter Six.
Table 2.14: Bank of Uganda Tiered Framework for Regulation
Criteria Level Deposit-taking
Legal and regulatory framework
Regulating and Supervising Authority
Tier 1: Commercial Banks Yes FIA16, 2004; MDI Act, 2003
Bank of Uganda
Tier 2: Credit institutions Yes FIA, 2004; MDI Act, 2003 Bank of Uganda Tier 3: MDIs Yes MDI Act, 2003 Bank of Uganda Tier 4: Non-Bank of Uganda regulated institutions
No Various laws - See chapter six
Various bodies – See chapter six
Source: Katimbo-Mugwanya (2000)
2.4.5 Linkages between commercial banks and MFIs
Recently, a number of commercial banks in Uganda began providing loans to MFIs on a
commercial basis. Ledgerwood and Musana (2002) report that some banks are utilising
guarantee mechanisms provided through donors or government, but one or two commercial
banks have agreed to provide loans using the MFI’s portfolio as collateral. The terms of
these loans are generally up to two years with interest rates approaching prime and the loan
amounts based on a cover of 250 percent of the microfinance portfolio. While these are
positive developments, the linkage between the commercial banking sector and the MFIs is
still limited. It is argued that with the promulgation of the MDI Act, 2003, either more
commercial banks will themselves move into microfinance business as has happened in
16 FIA is Financial Institutions Act
29
Latin America (Valenzuela, 2002), or there might be linkages created between
microfinance institutions and the commercial banks. Chapter Eight presents the findings of
a survey of the effects of financial regulation of MFIs on their sustainability and outreach
as well as the possible linkages between microfinance institutions and commercial banks.
2.5 Conclusion
This chapter has focused on the context in which the MFIs in Uganda operate, with an
emphasis on the economic environment. The motivation for the chapter was threefold: (i) to
describe the country context so that the empirical results of this study are interpreted and
understood in a clearly defined framework; (ii) to illustrate the importance of the economic
environment in determining the success or failure of financial institutions, including
microfinance institutions; and (iii) to explain and illustrate the rationale for assuming that
the demand for microfinance in Uganda is a given.
The chapter has thus described the macroeconomic environment of Uganda, the economic
reforms that have been instituted over the last two decades, and the resultant achievements
as well as the key sectors such as agriculture, industry, services and finance. The chapter
has illustrated that many Ugandans are still poor, live in rural areas, and depend heavily on
agricultural activities. For this reason microfinance has a significant role to play in
increasing their productivity, and generating employment and incomes.
The chapter has also argued that, despite the positive achievements resulting from
economic reforms, Uganda’s financial sector is still narrow and lacks depth. For this reason
MFIs are expanding to those areas that still lack formal financial services. It can therefore
be deduced that the demand for microfinance remains huge and unmet.
30
CHAPTER THREE: CONCEPTS AND MEASURES OF SUSTAINABILITY AND
OUTREACH
3.1 Introduction
The terms sustainability and outreach are extensively used in the field of microfinance
without, in many instances, providing clear definition (Ledgerwood, 1999; Hulme and
Mosley, 1996). For the purpose of this study it is important that these terms are defined for
two main reasons. First, they are used in different contexts and their meaning thus depends
on the specific context in which they are used. Second, two of the focal areas of this study
are to establish the determinants of sustainability and outreach (the determinants are
identified and discussed in Chapter Four). To be able to do this meaningfully, it is not only
imperative that these concepts are clearly defined, but it is also important that their
measures are investigated and appropriate ones identified. This chapter investigates and
discusses the definitions of these concepts and their measures. It also proposes definitions
and measures considered more appropriate. Besides, given the rapid evolution of the field
of microfinance and the concepts of sustainability and outreach, the chapter briefly traces
their historical development.
The rest of the chapter is organized as follows. In section 3.2 the concept of sustainability,
its measures, and the measures adopted in this study and its limitations are discussed. In
section 3.3 the concept of outreach, its measures and measure adopted in this study and its
limitations are also discussed. Section 3.4 provides a summary of the chapter.
3.2 The concept and measures of sustainability
3.2.1 The concept of sustainability
The term sustainability is widely used interchangeably with other concepts such as
profitability, self-sufficiency, financial self-sufficiency, self-sustainability, financial
sustainability, financial efficiency, institutional sustainability, viability and financial
viability (see SEEP Network and Calmeadow, 2000; Ledgerwood, 1999; Paxton and
Fruman, 1998; Christen, 1997; Buckley, 1997; Johnson and Rogley, 1997; Hulme and
31
Mosley, 1996; Christen et al., 1995; Rhyne and Otero, 1992; Strauss Commission, 1996;
and Yaron, 1992). This practice can be confusing, especially to new readers in
microfinance.
Woller and Schreiner (2006:2) define sustainability as the non-profit equivalent of
profitability, while UNESCAP (2006:15) defines sustainability as the ability of the
organisation to meet the cost of operations and build enough reserves for capitalisation.
Navajas et al. (2000:335) define sustainability as “…permanence…Sustainability is not an
end in itself but rather a means to the end of improved social welfare (Rhyne, 1998).”
Schreiner (1999:2) defines sustainability as the ability to break even in an accounting
period while compensating all factors of production at their opportunity cost. Conning
(1999:52) argues that “In most discussions sustainability is taken to mean full cost recovery
or profit making, and is associated with the aim of building microfinance institutions that
can last into the future without continued reliance on government subsidies or donor
funds.” Strauss Commission (1996:96) defines self-sustainability as “…the degree of
subsidy independence attained by a DFI…”
The scope of the debate around the concept of sustainability is well captured in Brinkerhoff
and Goldsmith (1992:369) (see Mog, 2004 as well):
Whether development assistance “works” has been bitterly debated since international, government-to-government transfers of capital and expertise first began on a large scale, more than 40 years ago. Criticism of foreign aid, whether from the left (Lappe, Schurman and Danaher, 1987) or from the right (Eberstadt, 1988) shows no sign of abating. At the heart of this controversy is sustainability.
From a project point of view, sustainability is about the life of a project beyond a period
during which its finances come from external sources, such as donors. Therefore,
sustainability is a question of self-reliance in the medium to long term, or as Mog
(2004:2139) puts it, is a question of unending desire or process, not a fixed goal to be
achieved through specific designed processes. In terms of an institution, Brinkerhoff and
Goldsmith (1992:371) argue that in a strict sense the concept of sustainability of an
institution is redundant, since an institution is by definition sustained by the ways that
people interact. However, in development circles the conventional meaning of a sustainable
institution refers to an organisation consciously designed to do one or more of the
32
following: (i) survive over time as an identified unit, (b) recover some or all of its costs,
and (c) supply a continuing stream of benefits using its own resources (Brinkerhoff and
Goldsmith, 1992).
Some authors have argued that the above suggested characteristics of a sustainable
institution do not take into account the possibility of implicit subsidies flowing into the
institution and/or a mission drift. A more complete definition is that which underscores the
ability of the organisation to grow and provide services on a long-term basis with either its
own resources or debt secured from commercial sources, which it (MFI) must have the
ability to repay (SEEP Network and Calmeadow, 1995:1; Chaves and Gonzalez-Vega,
1996). While other authors have argued that this definition of sustainability is only one part
of the sustainability equation (Edgcomb and Cawley, 1994:89), the other parts being its
ability to achieve regular and significant results for the institution’s clients and reaching
enough of them to have an impact on geographical outreach.
Relating to profitability, sustainability is an adjusted measure of profitability in an
accounting sense, generally defined as the difference between total revenue (TR) generated
by an organisation from its operations and the total associated costs (TC). While
profitability is generally used to assess the financial performance of organisations that do
not depend on external subsidies, sustainability is considered more appropriate to assess the
financial performance of subsidy-dependent organisations, as argued in Hulme and Mosley
(1996:42):
It is common to assess the performance of any commercial organisation, including the development finance institutions, in terms of the profits it makes; and without profits, of course no commercial organisation can sustain itself. However, if profits depend on external subsidy, they imply nothing about the efficiency of the organisation, or even about its sustainability, since the abolition of a subsidy can make the institution incapable of standing on its own. For these reasons, it is right to evaluate the financial performance of our selected institutions in terms of indicators which measure more accurately the organisation’s financial efficiency.
In a nutshell, the concept of sustainability is not an end state, but an on-going input-output
process. Specifically, the concept is used in the microfinance literature to describe the
performance of institutions or programmes that at one point or another rely on external
support in the form of grants, concessionary loans or implicit subsidies. It is a concept
developed to answer the question of whether it is possible for an institution to exist for a
33
long time providing valuable services without subsidies. The concept is also widely
applicable to institutions or programmes that do not reflect inflation costs in their pricing
mechanisms. In this dissertation, therefore, the sustainability of a microfinance institution
means its ability to exist for a long time providing microfinance services without subsidies.
3.2.3. The relationship between the concept of sustainability and profitability
To gain more insight into the concept of sustainability its relationship with profitability and
its historical development, further analysis is provided below.
In business accounting the difference between TR and TC is commonly referred to as
profit. Denoting profit by ∏, this can be expressed algebraically as:
∏ = TR-TC -------------------------------------------------------------------------------------------3.1
In equation 3.1, ∏ > 0 if TR and TC > 0 and TR > TC or if TR > 0, but TC = 0. (This case
is rare because to generate revenue costs have to be incurred.) Profit is important for
increasing the value of assets or capitalisation from an organisation’s own internally
generated funds.
However, equation 3.1 is often used to define a profit function of a typical firm which does
not (or is assumed not to) rely on subsidies and produces tangible goods such as loaves of
bread, where TR may be expressed in terms of the product of the number of loaves of bread
(Q) sold and the average (P). That is,
TR = P*Q ---------------------------------------------------------------------------------------------3.2
where * is a multiplication symbol.
For a firm producing all that it sells, Q is obtained from the production function examined
in Chapter Five.
Substituting TR in equation 3.1 with PQ in equation 3.2, equation 3.3 is obtained:
34
∏ = (P*Q)-TC ----------------------------------------------------------------------------------------3.3
From equation 3.3, the problem of a profit-maximising firm is that of either minimising TC
subject to a given revenue level (equation 3.2), or maximising revenue subject to a given
TC. In perfect competitive markets, in which the prices of output sold and of the factor
inputs are given, the solutions to either the minimisation or maximisation problem lead to
the determination of the equilibrium conditions in employment of factors inputs (see
Chapter Five).
While for a typical private firm, Q in equation 3.3 is the quantity sold, in a typical private
loan-granting financial institution (FI), Q can be equated to the product of the number of
loans (NL) granted by the institution and average loan size (AvLz), assuming loans are the
only source of income for the FI (Rose and Fraser, 1988). In this narrow sense of the output
of a loan-granting FI, its revenue from loans (LY) can be expressed as:
LY = NL * AvLz * i ---------------------------------------------------------------------------------3.4
where i is the average lending interest rate on loans, and can be equated to P in equation 3.3
or equation 3.2.
But apart from the loan portfolio, typical private loan-granting FIs can earn income from
other sources such as commissions, investments, etc. If Z denotes additional income earned
from other sources, then the total revenue (FY) to a loan-granting FI can be represented as:
FY = NL*AvLz*i + Z -------------------------------------------------------------------------------3.5
Defining the total costs incurred in generating FY by TC, the profit of a typical private
loan-granting financial institution can be expressed as:
π = (NL*AvLz*i + Z) – TC ------------------------------------------------------------------------3.6
35
In equation 3.6, if π > 0, it means the FI is making a profit; if π = 0, the FI is at break-even
point (recovering costs); and if π < 0, the FI is incurring losses (Hulme and Mosley,
1996:19).
Comparing equations 3.6 and 3.3, TR of a typical private firm with FY of a typical private
lending FI, the difference lies in what are constituted in output and other sources of income.
The price of output of a typical private firm is called a commodity price, while that of a
typical private lending financial institution is called an effective lending interest rate
(nominal lending interest rate plus the rate of other charges).
Secondly, for a typical private firm, the output sold (Q) is often a tangible quantity that is
sold and never returned to the seller, while for a typical private lending financial institution,
the output sold (NL*AvLz) is loan principal expected to be used by the borrower (buyer) at
a price (interest rate and other charges) and repaid. In equation 3.6, the principal loan repaid
to the FI by its clients and the principal loan the FI repays to its lenders are assumed to off-
set each other and therefore excluded.17
Equation 3.6 depicts a profit definition for a financial institution whose equity and other
forms of capital come from private sources, usually private investors or borrowed at
commercial rates. However, as already argued, most MFIs today rely heavily on external
subsidies, technical assistance (TA), and in some cases owner-manager services, and
therefore their profit is significantly influenced by these forms of support (Hulme and
Mosley, 1996; Christen, 1997; Ledgerwood, 1999; SEEP Network and Calmeadow, 1995;
Yaron, 1992). As a result, it has been suggested that the appropriate framework to reflect
their financial performance should be sustainability, which is the adjusted form of equation
3.6 discussed in the next sub-section.
17 It is assumed that the loan to an MFI is all on-lent to clients and, when the clients repay, the MFI also repays its lenders.
36
3.2.3 Measures of sustainability
The various views on the concept of sustainability have been translated into various
versions of its measures, which are now discussed under four categories: i) the subsidy
dependency index (SDI), ii) self-sufficiency measures, iii) adjusted profitability ratios and
modified subsidy-adjusted return on assets, and iv) the arrears rate. Adjusted measures of
SDI suggested by Khandker et al. (1995), the profitability gap suggested by Sacay (1996)
and the SDI of Humle and Mosley (1996) as cited in Schreiner and Yaron (1999) are not
reviewed, based on Schreiner and Yaron’s (1999) argument that as a whole the recent
attempts to adjust the SDI are either meaningless or answer unimportant questions.
Empirical measures such as productivity and efficiency have been used as measures of
sustainability and are addressed together with the arrears rate.
3.2.3.1 Subsidy Dependence Index (SDI)
While proposing the concept of self-sustainability, Yaron (1992:5) also proposed its
measure: SDI. He argued that SDI is the inverse of self-sustainability, and Schreiner and
Yaron (1999) contend that SDI is the most common way to measure the importance of
public support for development financing institutions. Algebraically, SDI is expressed as:
SDI = (A (m-c) + ((E*m)-P) +K)/LP*i ----------------------------------------------------------3.7
where,
A = average annual outstanding concessionary loans accessed by the
institution
m = market interest rate
c = rate at which the concessionary loans have been accessed
E = equity
P = reported annual profit (before tax and adjusted, when necessary, for
loan loss provision, inflation, and so on)
K = the sum of other annual grants received by the institution
37
LP = average annual outstanding loan portfolio extended by the institution to its
clients, and
i = rate of interest at which the institution lends to its clients.
The SDI is a continuous variable fully defined when LP*i ≠ 0. This technically means that
both LP and i ≠ 0. The index is, however, unbounded when the numerator of the function
generating it tends to +∞ and the denominator is comparatively very small. In practice,
though, it is unlikely that SDI can be undefined and unbounded, because for any rational
business firm lending money, i and LP > 0 in the medium to long term. Similarly, following
arguments about imperfect financial markets (Stiglitz and Weiss, 1981), it is also unlikely
that the numerator can grow infinitely big to cause the index to be unbounded.
The SDI measures the degree to which an MFI relies on subsidies for its continued
operations (Yaron, 1992; Ledgerwood, 1999) or a ratio that measures the percentage
increase required in the average lending rate to compensate a subsidy dependent institution
for the elimination of all the subsidies in a given year, while keeping its return on equity
equal to the market reference deposit rate, assuming all other factors are held constant
(Strauss Commission, 1996:159).
SDI = 0 means that the MFI in question has achieved financial self-sufficiency, i.e. it is
obtaining all its funds on a commercial basis including equity. SDI< 0 implies that an MFI
has not only achieved full self-sustainability, but that its annual profits, minus its capital
(equity) charged at the appropriate market interest rate, exceeds the total annual value of
subsidies (if subsidies were received by the MFI). SDI< 0 also implies that the MFI can
lower its average on-lending interest rate, while simultaneously eliminating any subsidies
received in the same year. SDI > 0 implies that an MFI is dependent on subsidies that could
be coming from any of the following sources (see Yaron, 1992:5; Ledgerwood, 1999:219):
• Concessionary central bank discounting facilities or similar lending by other
organisations;
• Donated equity;
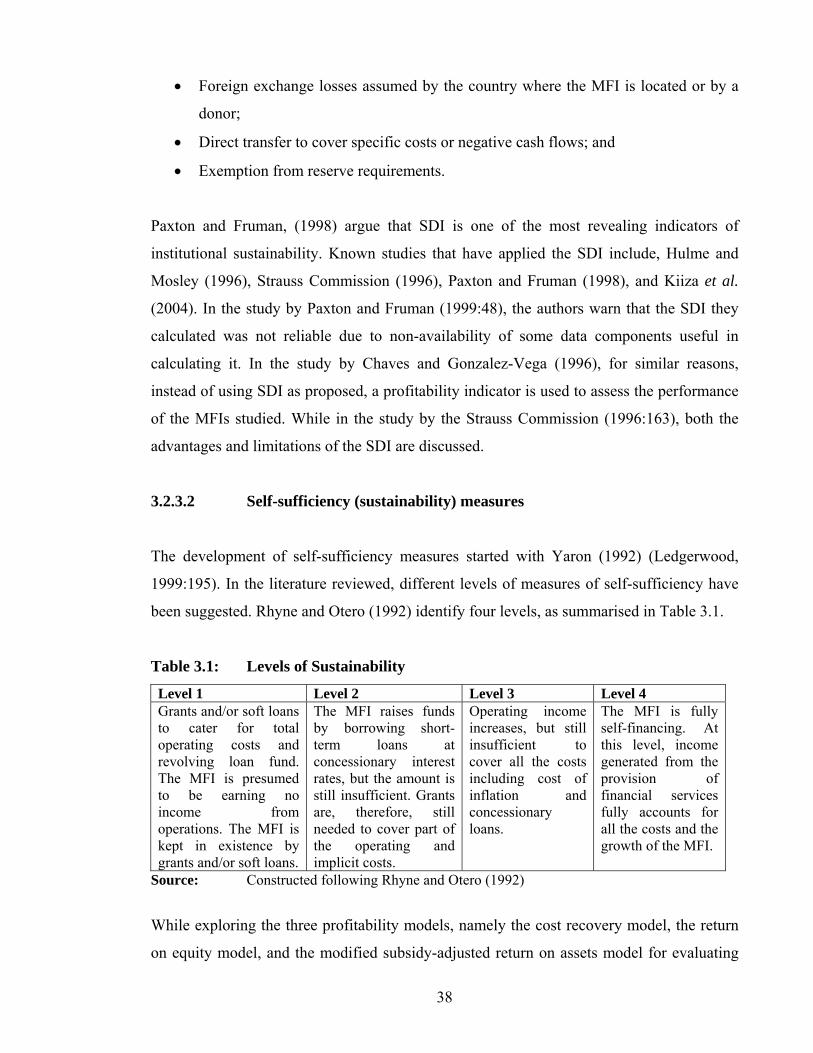
38
• Foreign exchange losses assumed by the country where the MFI is located or by a
donor;
• Direct transfer to cover specific costs or negative cash flows; and
• Exemption from reserve requirements.
Paxton and Fruman, (1998) argue that SDI is one of the most revealing indicators of
institutional sustainability. Known studies that have applied the SDI include, Hulme and
Mosley (1996), Strauss Commission (1996), Paxton and Fruman (1998), and Kiiza et al.
(2004). In the study by Paxton and Fruman (1999:48), the authors warn that the SDI they
calculated was not reliable due to non-availability of some data components useful in
calculating it. In the study by Chaves and Gonzalez-Vega (1996), for similar reasons,
instead of using SDI as proposed, a profitability indicator is used to assess the performance
of the MFIs studied. While in the study by the Strauss Commission (1996:163), both the
advantages and limitations of the SDI are discussed.
3.2.3.2 Self-sufficiency (sustainability) measures
The development of self-sufficiency measures started with Yaron (1992) (Ledgerwood,
1999:195). In the literature reviewed, different levels of measures of self-sufficiency have
been suggested. Rhyne and Otero (1992) identify four levels, as summarised in Table 3.1.
Table 3.1: Levels of Sustainability
Level 1 Level 2 Level 3 Level 4 Grants and/or soft loans to cater for total operating costs and revolving loan fund. The MFI is presumed to be earning no income from operations. The MFI is kept in existence by grants and/or soft loans.
The MFI raises funds by borrowing short- term loans at concessionary interest rates, but the amount is still insufficient. Grants are, therefore, still needed to cover part of the operating and implicit costs.
Operating income increases, but still insufficient to cover all the costs including cost of inflation and concessionary loans.
The MFI is fully self-financing. At this level, income generated from the provision of financial services fully accounts for all the costs and the growth of the MFI.
Source: Constructed following Rhyne and Otero (1992)
While exploring the three profitability models, namely the cost recovery model, the return
on equity model, and the modified subsidy-adjusted return on assets model for evaluating
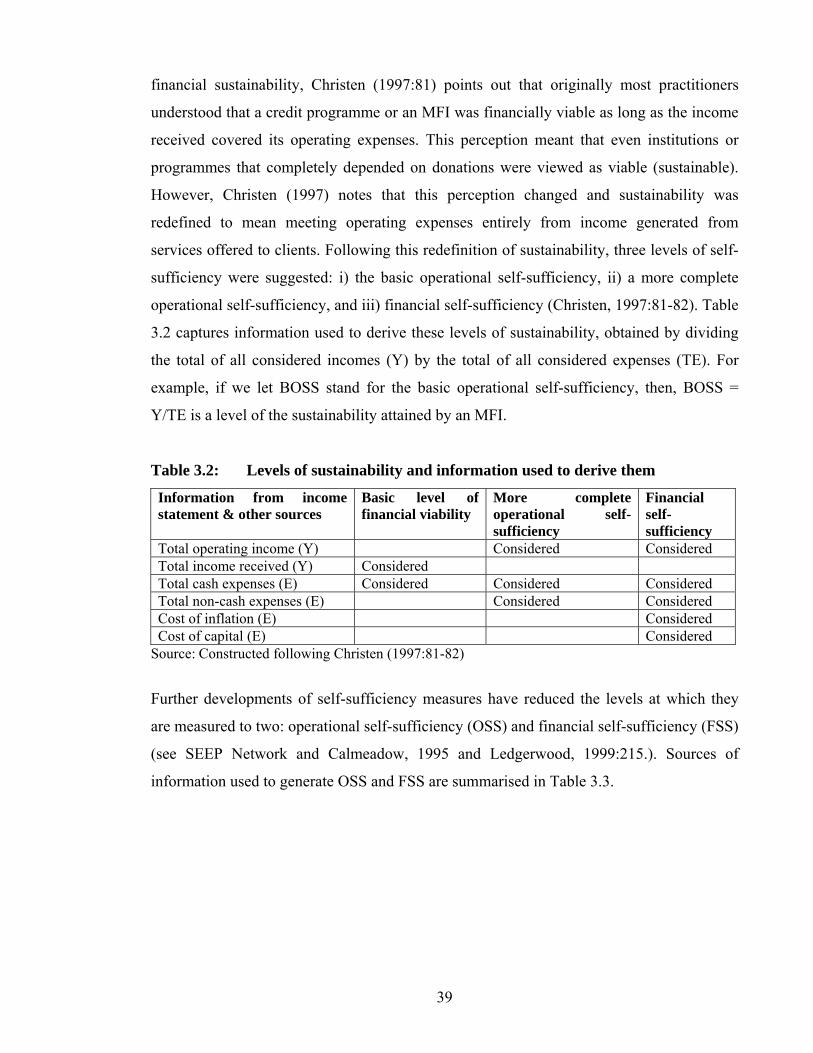
39
financial sustainability, Christen (1997:81) points out that originally most practitioners
understood that a credit programme or an MFI was financially viable as long as the income
received covered its operating expenses. This perception meant that even institutions or
programmes that completely depended on donations were viewed as viable (sustainable).
However, Christen (1997) notes that this perception changed and sustainability was
redefined to mean meeting operating expenses entirely from income generated from
services offered to clients. Following this redefinition of sustainability, three levels of self-
sufficiency were suggested: i) the basic operational self-sufficiency, ii) a more complete
operational self-sufficiency, and iii) financial self-sufficiency (Christen, 1997:81-82). Table
3.2 captures information used to derive these levels of sustainability, obtained by dividing
the total of all considered incomes (Y) by the total of all considered expenses (TE). For
example, if we let BOSS stand for the basic operational self-sufficiency, then, BOSS =
Y/TE is a level of the sustainability attained by an MFI.
Table 3.2: Levels of sustainability and information used to derive them
Information from income statement & other sources
Basic level of financial viability
More complete operational self-sufficiency
Financial self-sufficiency
Total operating income (Y) Considered Considered Total income received (Y) Considered Total cash expenses (E) Considered Considered Considered Total non-cash expenses (E) Considered Considered Cost of inflation (E) Considered Cost of capital (E) Considered
Source: Constructed following Christen (1997:81-82)
Further developments of self-sufficiency measures have reduced the levels at which they
are measured to two: operational self-sufficiency (OSS) and financial self-sufficiency (FSS)
(see SEEP Network and Calmeadow, 1995 and Ledgerwood, 1999:215.). Sources of
information used to generate OSS and FSS are summarised in Table 3.3.
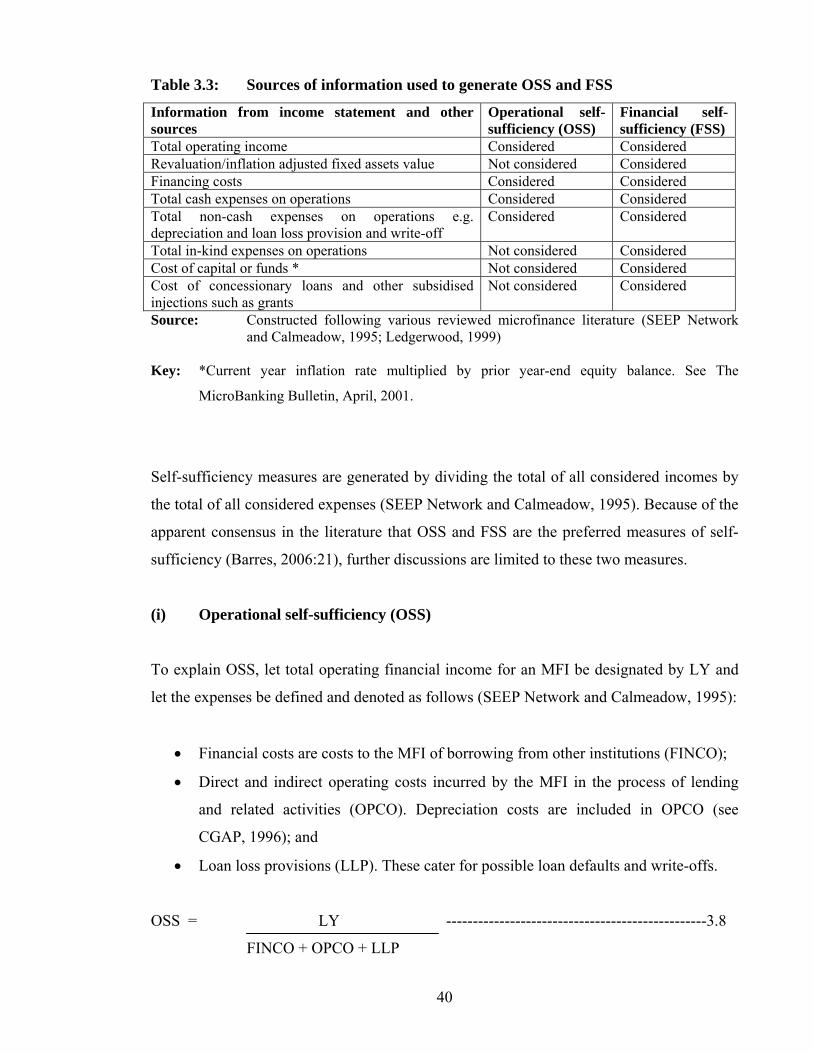
40
Table 3.3: Sources of information used to generate OSS and FSS
Information from income statement and other sources
Operational self-sufficiency (OSS)
Financial self-sufficiency (FSS)
Total operating income Considered Considered Revaluation/inflation adjusted fixed assets value Not considered Considered Financing costs Considered Considered Total cash expenses on operations Considered Considered Total non-cash expenses on operations e.g. depreciation and loan loss provision and write-off
Considered Considered
Total in-kind expenses on operations Not considered Considered Cost of capital or funds * Not considered Considered Cost of concessionary loans and other subsidised injections such as grants
Not considered Considered
Source: Constructed following various reviewed microfinance literature (SEEP Network and Calmeadow, 1995; Ledgerwood, 1999)
Key: *Current year inflation rate multiplied by prior year-end equity balance. See The
MicroBanking Bulletin, April, 2001.
Self-sufficiency measures are generated by dividing the total of all considered incomes by
the total of all considered expenses (SEEP Network and Calmeadow, 1995). Because of the
apparent consensus in the literature that OSS and FSS are the preferred measures of self-
sufficiency (Barres, 2006:21), further discussions are limited to these two measures.
(i) Operational self-sufficiency (OSS)
To explain OSS, let total operating financial income for an MFI be designated by LY and
let the expenses be defined and denoted as follows (SEEP Network and Calmeadow, 1995):
• Financial costs are costs to the MFI of borrowing from other institutions (FINCO);
• Direct and indirect operating costs incurred by the MFI in the process of lending
and related activities (OPCO). Depreciation costs are included in OPCO (see
CGAP, 1996); and
• Loan loss provisions (LLP). These cater for possible loan defaults and write-offs.
OSS = LY -------------------------------------------------3.8
FINCO + OPCO + LLP
41
OSS is a continuous variable fully defined when (FINCO+OPCO+LLP) ≠ 0. This means
that at least one of the variables in the denominator, that is, FINCO, OPCO or LLP ≠ 0. The
index is unbounded when the numerator of the function generating it tends to +∞ and the
denominator is comparatively very small or zero.
In practice, though, it is unlikely that OSS can be undefined and unbounded, because no
MFI can operate without incurring any cost. As Samuelson and Nordhraus (1996) argue,
there is a fixed cost that an organisation must incur whether it is producing outputs or not.
Similarly, it is unlikely that LY can increase to +∞ while the value of the denominator
remains comparatively small or zero, since to generate LY, expenses are incurred.
Furthermore, the main component of LY is the product of loan portfolio (LP) and interest
rate (i) charged on loans. To grant more LP, more factor inputs are required, but the law of
diminishing returns to scale postulates that LP cannot increase infinitely. Following Stiglitz
and Weiss (1981), it is also unlikely that i can be increased infinitely, because at i = +∞, the
demand for loans = 0, and secondly, it is not practical to charge infinite i. See subsection
4.2.5 for further discussions on charging high interest rates in the presence of information
asymmetries.
OSS < 0 implies that either LY or total expenses are negative. This is unlikely to occur,
because a negative income is not feasible and costs can be zero or positive. OSS = 1 means
that the MFI is at break-even point, while OSS > 1 implies that the MFI fully covers cash
and non-cash costs and OSS < 1 but positive means total expenses are more than LY, and
therefore the MFI is making losses.
(ii) Financial self-sufficiency (FSS)
Following the derivation of OSS, to explain FSS, let total operating financial income for an
MFI be denoted by FY and let the expenses be defined and denoted as (SEEP Network and
Calmeadow, 1995):
• Financial costs which are costs to the MFI of borrowing from other institutions
(FINCO);
42
• Direct and indirect operating costs incurred by the MFI in the process of lending
and related activities (OPCO). Depreciation costs are included in OPCO (see
CGAP, 1996);
• Loan loss provisions (LLP). These are made to cater for possible loan defaults and
write-offs;
• In kind expenses that would be incurred for technical assistance received but not
paid for by the MFI (INDCO); and
• The cost of maintaining the value of equity relative to inflation and the surplus
revenue resulting from subsidised loans (ICS).
FSS can be expressed as:
FSS = FY ---------------------------------3.9
FINCO + OPCO + LLP + INDCO + ICS
Like OSS, FSS is also a continuous variable fully defined when
(FINCO+OPCO+LLP+INDCO+ICS) ≠ 0. This implies that at least one of the variables in
the denominator, that is, FINCO, OPCO, LLP, INDCO or ICS, ≠ 0. The index is, however,
unbounded when the numerator of the function generating it tends to +∞ and the
denominator is comparatively very small. In practice, though, it is unlikely that FSS can be
undefined and unbounded, because no MFI can operate without incurring any cost for
reasons already advanced. For this reason, as long as an MFI is in operation, it must incur
positive costs. Similarly, it is unlikely that FY can increase to +∞ while the value of the
denominator remains comparatively small, since to generate FY, expenses are incurred, and
the law of diminishing returns to scale applies on the loan portfolio components of FY.
FSS < 0 implies that either FY or total expenses are negative. This is unlikely to occur,
because a negative income is not feasible and costs cannot be negative for reasons already
advanced. FSS = 1 means that the MFI is at break-even point, while FSS > 1 implies that
the MFI fully covers all costs and FSS < 1 but positive means total expenses are more than
FY, and therefore the MFI is making losses or depending on subsidies.
43
3.2.3.3 Adjusted variants of traditional measures of financial performance
In addition to SDI and self-sufficiency measures, modified or adjusted traditional measures
of financial performance have been suggested. Specifically, these measures include
adjusted return on equity (AROE), adjusted return on assets (AROA), modified subsidy-
adjusted ROA (MSROA), and adjusted return on business (AROB) (see Yaron, 1992:5;
Christen, 1997:84; and Ledgerwood, 1999:220). With the exception of MSROA, the rest of
the adjusted profitability ratios measure an MFI’s adjusted net income items in relation to
the structure of its adjusted specified balance sheet items. MSROA, on the other hand, is
the ratio of administrative expenses to total assets (see Christen, 1997:91). As mentioned
before, these measures have been suggested in recognition of the inadequacy of the
traditional measures of profitability: ROE, ROA, and ROB, which are used to evaluate the
financial performance of the banking sector, individual banks within peer groups, and other
business organisations. Detailed analysis of the adjusted measures follows below.
(i) Adjusted ROE
While different authors have defined ROE differently, for the purpose of this study we
adopt the definition in Ledgerwood (1999:223), defining ROE as a measure of the return on
funds that are owned by the accounting entity such as an MFI. It is a measure of the net
income of a business organisation in relation to its capital employed (Kohler, 1975). Unlike
ROA discussed below, ROE is best suited to guide investors on the profitability of their
investment in comparison to available alternatives. Thus, it is more of an evaluation tool for
investors than a management tool for managers of a financial institution.
AROE is a ratio of net adjusted income to average adjusted equity. Net adjusted income is
generated by netting out all incomes that are not generated by the institution from
operations, and adding any re-valuation income resulting from revaluation of property such
as buildings and land during the accounting period. Equity is adjusted to take into account
the effect of inflation. The adjustments are similar to those done while deriving the self-
sufficiency measures explained above.
44
Theoretically, AROE would allow analysis of the MFI’s performance in a way similar to
analysis of the banking sector. However, practically, this kind of analysis is difficult for
two main reasons. The first is due to lack of consistent data for selecting MFIs to constitute
a peer group and, secondly, the capital structures of the majority of MFIs are significantly
different from those of the institutions constituting the banking sector. Historically most
MFIs have been financed from donated funds, whereas for banks and other financial
institutions equity is principally from private sources.
(ii) Adjusted ROA
Like ROE, ROA has also been defined differently by different authors (Kohler, 1975;
Christen, 1997; Ledgerwood, 1999). Generally, however, ROA can be defined as a ratio of
net earnings of an accounting entity such as an MFI to its assets for a given period of time,
say, a year. It is a return on all assets employed, including fixed assets to earn the income
during a specified period. This suggests that total assets rather than performing assets only
should be considered when calculating ROA. For practical reasons, though, the literature
suggests using average total assets, average outstanding loan portfolio or average
performing assets as a denominator of ROA. Note that ROA is affected by varying loan
terms, interest rates and fees, changes in the delinquency levels, and the split between
interest income and fees. Consequently, it is an important model for analysing the effects of
pricing policy and changes in term structures.
Derivation of AROA is based on the same principle as ROA, except that it is obtained after
making adjustments to both the net income and the assets. On the net income side, all
expenses that, by accounting convention, are normally excluded when calculating the net
income are subtracted from operating income18 to obtain the adjusted net income. These
additional expenses include the cost of inflation, implicit cost of capital (opportunity cost),
implicit cost of concessionary loans, and any payments made to staff or technical assistance
from a source other than the revenue of the institution, for example, a grant. On the assets
side, fixed assets are re-valued to arrive at the current market value, which is then added to
the rest of the other assets to get the value of total assets.
18 Operating income excludes all forms of donated income, but includes income from re-valued property.
45
As already stated, AROA is more of a tool for management of an MFI than a tool for
investors to use for assessing the profitability of their investment. Nevertheless, AROA
should indicate to the investor whether or not the managers of an MFI are utilising its
resources efficiently. In this respect, AROA is a useful measure for assessing the efficiency
of the management of an MFI.
(iii) Modified subsidy-adjusted ROA
The MSROA has been suggested by Christen (1997:91) as an alternative to ROE. It is
argued that ROE has proven to be inadequate as a model for understanding the overall
financial performance of MFIs. As a result, MSROA would be a more suitable alternative
to ROE, because it explicitly takes into account the effects of inflation and subsidies, and
relates expenses to total adjusted assets and not to income.
(iv) Adjusted ROB
Like AROE and AROA, AROB is also obtained after making adjustments on the generated
income, assets and liabilities. It is the ratio of net adjusted income to the average adjusted
sum of assets and liabilities. Ledgerwood (1999:223) argues that by obtaining an average of
assets and liabilities, an average of a business base is established, which is important when
the institution in question is collecting deposits. Adding liabilities to assets and dividing by
two captures the effects of costs associated with deposit mobilisation. AROA does not give
weight to the cost of deposit mobilisation. If these costs were excluded, an AROA would be
reported.
Given that ROB is a ratio of net income to average of assets (A) and liabilities (L), it is
clear that it is directly affected by the level of liabilities and capital (K) from the accounting
equation of A = L + K. For a fixed A, a higher K implies a lower L and, therefore, a higher
ROB. If the majority of the MFI’s equity and liabilities is composed of equity, for example,
then adjusted ROB is misleading.
3.2.3.4 Arrears rate
46
The arrears rate as a measure of sustainability was proposed and used by Hulme and
Mosley (1996:42). The authors define the arrears rate as the proportion of loans more than
six months in arrears. Generally, several arrears rates can be calculated depending on the
purpose for which they are to be used. For example, an MFI can decide to calculate an
arrears rate on a weekly, fortnightly, monthly or annual basis. However, the period over
which an arrears rate is calculated tends to follow the repayment schedule of loans or their
maturity periods.
In general, the arrears rate is the ratio of the amount of loan principal that has become due
and has not been recovered divided by the portfolio outstanding (i.e. the total amount of
loans lent out and not yet recovered). It is commonly used as an indicator of portfolio
quality along with other portfolio quality ratios such as portfolio at risk (PAR) and the
number of delinquent borrowers (Ledgerwood, 1999:207). Its application as a measure of
sustainability is not widespread.
Another set of indicators infrequently used as measures of sustainability are productivity
and efficiency ratios. These ratios provide information about the rate at which MFIs
generate revenue to cover their expenses. Productivity refers to the per capita volume of
business that is generated by inputs, while efficiency refers to the cost per unit of output.
By calculating productivity and efficiency ratios over time, the MFIs can determine
whether they are maximising their use of resources. Thus, these ratios are proxy measures
of sustainability.
3.2.4 Adopted measures of sustainability
As shown in the above analysis, a wide range of measures has been suggested for
measuring sustainability of MFIs. This underlines first and foremost the extent to which the
microfinance industry has evolved. Secondly, it is an indication of the greater emphasis that
has been placed on the sustainability of microfinance institutions in the recent past, and the
need to find appropriate measures that can be widely accepted as standard measures of
sustainability.
In this study OSS has been preferred for the following reasons:
47
1. Like FSS, it can easily be related to the standard profitability definition of revenue
minus associated expenses, which makes it easy to understand the linkage between
profitability and sustainability;
2. It explicitly relates income to expenses, which are the two main components that are
critical in determining whether or not an institution is able to cover all its costs of
doing business;
3. While FSS is a more appropriate measure of sustainability (see Barres, 2006:21),
the data required to derive it are enormous and often not available in most MFIs,
more specifically those in Uganda;
4. Unlike SDI, which relies on average annual outstanding loans, part of which has a
positive probability of not being recovered, OSS like FSS is derived using actual
data. In addition, it is straightforward as it makes it easy to see whether an MFI is
sustainable or not, instead of inverting the ratio. SDI is best suited for assessing the
relationship between external subsidies and operating income generated by the MFI;
5. Compared to adjusted traditional measures, OSS like FSS does not focus on returns
on equity, returns on assets, or returns on business. It can be described as holistic as
it gives a global picture of the institution in terms of the overall financial
performance and not with respect to particular aspects of the institution; and
6. Finally, the choice of arrears rate as a measure of sustainability is subjective,
because different researchers may choose to use different rates. For example, a
researcher can choose to use an arrears rate defined as the proportion of loans more
than three months in arrears or more than nine months depending on the maturity of
the loan period or repayment schedule. Furthermore, and as already argued, arrears
rates are more suitable indicators for portfolio quality than sustainability.
While OSS as a measure of sustainability has some advantages discussed above, it also has
some limitations:
48
1. Unlike SDI that uses a market rate when adjusting for the cost of the MFI’s equity or
FSS that uses the inflation rate to adjust for the cost of equity, in OSS the cost of equity
as well as other implicit subsidies is not adjust for. In OSS, like SDI, in-kind support that
the MFI may receive is not adjusted for. FSS controls for in-kind subsidies as well.
2. OSS, like other measures of sustainability, does not measure the benefits of
microfinance, and the measurement of costs in the framework ignores the costs borne by
clients as well as social costs (Yaron et al. 1997 cited in Ledgerwood, 1999:225). Thus
the measure does not lead to a cost-benefit analysis, perhaps the most natural and
defensible method of evaluation (Schreiner, 1999:2).
3. OSS, like other measures of sustainability, is a point estimate as it establishes the level
of operational self-sustainability at a point in time, but it does project what may happen
in the future (Schreiner, 1999:2).
4. Finally, Ledgerwood (1999:217) reports that the definition of OSS – and therefore its
derivation – varies among MFIs and donors. The difference is reported to be due to the
inclusion of the cost of debts, which could be incurred by some MFIs and not others.
These different ways of deriving OSS limit the comparability of the MFIs using this
measure.
49
3.3 The concept and measures of outreach
3.3.1 The concept of outreach
The contexts where the concept of outreach has been or is mostly used are religion,
community activities, targeted credit programmes and microfinance, or more generally,
development programmes or activities. For the purpose of this study, outreach is examined
within the context of microfinance.
Conning (1999:52) defines outreach as the term “...typically used to refer to effort by
MFOs19 to extend loans and financial services to an ever-wider audience (breadth of
outreach) and especially toward the poorest of the poor (depth of outreach).” In this
definition, outreach is reflected as an effort made to provide loans and financial services to
the poorest of the poor.
Schreiner (1999:2) refers to outreach as proxies for the benefits of microfinance in terms of
the numbers of clients or average deposit amount. In this definition outreach is a proxy of
the benefits of microfinance assessed in terms of six aspects of outreach: worth to clients,
cost to clients, depth, breadth, length and scope. Similarly, Navajas, et al. (2000:335) define
outreach as “…the social value of the output of a microfinance organisation in terms of
depth, worth to users, cost to users, breadth, length, and scope.” In this definition outreach
is seen in the value of output of an MFO. In other words, an MFO must first produce an
output, which the authors do not indicate, and the value of the output is what is considered
outreach.
Some authors (such as Schadwinkel 2000:2) have argued that the concept of outreach is
vague as it has proven to be difficult to assess, because it includes quantitative as well as
qualitative aspects. In addition, the clients that are the subject of assessment are difficult to
identify and to obtain their status. For example, when assessing outreach, should it be
measured in terms of the number of clients accessing financial services in general or only
the number of the poor accessing financial services? If only the poor accessing financial
services should be considered, how can they be identified? 19 MFO stands for microfinance organisation.
50
While the definitions of outreach by Schreiner (1999) and Navajas, et al. (2000) are more
elaborate, they are not clear and therefore not very helpful in understanding outreach
precisely in the context of microfinance. Conning’s (1999) definition of outreach is more
appropriate, but it is not the definition adopted in this study. The author of this dissertation
adopts a less restrictive definition of outreach, defined as the extent to which formal
financial services are accessible to the low-income earners, measured by the scale of
outreach as argued in the next sub-section. This definition is similar to Conning’s (1999)
definition of outreach, but it is less restrictive because it does not specifically refer to the
poor or the poorest of the poor. It implicitly recognises that MFIs have a niche market,
which is primarily the low-income section of the population, who have no or limited access
to financial services from the traditional formal financial sector under free market-driven
conditions. Henceforth, outreach in this dissertation refers to the extent to which formal
financial services are accessible to the low-income earners, measured by the scale of
outreach. Subsection 3.3.2 addresses measures of outreach.
3.3.2 Measures of outreach
Attaining high levels of economic growth and improving the quality of life of the majority
of the people in developing countries have remained major policy goals of governments in
these countries. Throughout the 1960s and most of the 1970s developing countries
intervened in their economies using various means, one of which was channelling domestic
and international donor funds to the agricultural sector in general and, more specifically, to
small-scale farmers at subsidised lending rates. The main objectives of these initiatives
were to increase agricultural output and productivity, induce the optimal rate of adoption of
new technology and utilisation of inputs, improve income distribution, reduce poverty and
increase the level of employment. It was generally believed that extending credit to the
rural people would achieve these objectives (Adams and Vogel, 1986; Braverman and
Guash, 1986; Adams and von Pischke, 1992; Johnson and Rogaly, 1997; Robinson, 2001a).
The concern at the time was more on outreach than sustainability (Wiemaier-Pfister and
Steinwand, 2003:1).
51
The results of these policies were assessed in terms of outreach, using measures such as the
number of loans made, tons of fertiliser sold, number of tractors purchased, acres of land
irrigated and of crops financed by loans, and number of cattle purchased. Adams and Von
Pischke (1992:465), for example, argue that these measures did not adequately capture the
ultimate objectives of the stated policies.
When micro-credit and later formal microfinance (as generally known today) gained
currency in the 1990s with different approaches to the delivery of financial services to the
poor, the concept of outreach begun to be widely used in microfinance and other measures
developed. It was during this time that Yaron (1992:5-7) also argued that the traditional
quantifiable measures of institutional success based on profit presented in standard
financial statements provide only partial, often meaningless information with respect to
financial self-sustainability (see Gurgand et al. 1994). For this reason Yaron (1992)
suggested alternative sets of measures that would be far more revealing not only in terms of
actual cost of continued institutional operations, but the extent to which formal financial
services are accessible to the low-income earners.
Yaron (1992:7) suggests that seven different measures could be used to measure the
outreach of an MFI: (i) the value of outstanding loan portfolio and the average value of
loans extended, (ii) the amount of savings and average value of savings accounts, (iii) the
variety of financial services offered, (iv) the number of branches and village posts/units, (v)
percentage of the total rural population served, (vi) the annual growth of MFI assets over
recent years in real terms, and (vii) women’s participation.
Over the years, the measures of outreach first proposed by Yaron (1992) have either been
broadened, refined or categorised. The CGAP (1997) and Yaron et al. (1997) as cited in
Ledgerwood (1999:226) broadened outreach measures and classified them under three
groups: (i) clients and staff outreach, (ii) loans outreach, and (iii) savings outreach. Under
each of these groups a number of specific measures were proposed to capture the extent to
which the MFI is reaching out to clients with its services, and whether or not the clients
reached could be described as poor. One example of these measures used by Valenzuela
(2002:53) is the number of active loans.
52
Although not specifically referring to them as measures of outreach, the framework for
outreach in terms of six aspects: worth to clients, cost to clients, depth, breadth, length, and
scope first proposed and used by Schreiner (1999:2) to estimate the net social benefits of
the best-known microfinance organization in Latin America - BancoSol of Bolivia - has
been treated as measures of outreach. Navajas et al. (2000) explain that the depth of
outreach is the value that society attaches to the net gain from the use of micro-credit by a
given borrower. Since society places more weight on the poor than on the rich, poverty is a
good proxy for depth of outreach. For example, the authors argue that society is likely to
value more the net gain from a small loan for a street kid or for a widow than the same gain
for a rich person. This means deeper outreach occurs when social value increases, which
happens when poorer people are reached. But as Conning (1999) shows, reaching poorer
people has higher costs resulting from the difficulty associated with heterogeneity and less
ability to signal repayment ability and willingness, which invites intensive appraisal and
monitoring processes. Thus lending to poorer people creates more social value only if
increased depth of outreach is accompanied by lower costs of service delivery.
Worth of outreach is the willingness to pay and cost to users is the sum of price costs and
transaction costs. Price costs are direct cash payments for interest and fees which constitute
revenue to the microfinance organization. Transaction costs are non-price costs for both
non-cash and opportunity cost such as the value of time to get and repay the loan as well as
indirect cash expenses for such things as transport, documents, food, and taxes needed to
use a financial contract. Transaction cost is not revenue to the lender (see Schreiner, 1999:5
and Chapter Four).
Worth is a function of the cost of access and taste. If the cost of access, for example,
declines and the taste remains the same, the gain increases. Thus the trend of costs, ceteris
paribus, is an indicator of the extent of outreach. Conversely, with constant costs an
increase in worth of access to credit is a measure of increased outreach. Costs to users are
relatively easy to measure using present costs, while gains are difficult to measure.
Breadth of outreach is the number of users. In this case outreach is measured in terms a
numeric value such as the number of clients to whom an MFI is providing financial
53
services, especially those previously having no access. This measure of outreach is similar
to the scale of outreach described below.
Length of outreach is the timeframe in which an MFI produces loans. In theory a perpetual
source of support can allow an MFI to achieve length of outreach without sustainability.
Loan losses shorten the length of outreach as both the employees and users of services may
take the opportunity to defraud the organisation through bloated administrative costs and
loan defaults respectively.
Scope of outreach is the number of types of financial contracts offered by an MFI – for
example, different loan sizes and savings, which increase worth to users and boost length of
outreach. Deposits matter for two reasons: all poor people are deposit worthy and save to
smooth consumption, finance investment and buffer risk. In contrast, not all poor people are
creditworthy. Deposits strengthen the incentives for sustainability and continuous access to
financial services by the users.
Further refinement of measures of outreach has re-classified them into two categories: scale
(or breadth) of outreach and depth of outreach, although Microbanking Bulletin (2006:38)
has maintained a long list of outreach indicators, and MIX Market (2006:3) uses the
Number of Active Borrowers as a measure of outreach due to the fact that it is the most
commonly available proxy to measure the breadth of outreach. By the scale of outreach is
meant the number of clients served in a defined period, and by the depth of outreach is
meant the level of poverty of the clients served (Ledgerwood, 1999:39).
From the definition of the scale of outreach, it is noticeable that the number is an
aggregation of the number of clients accessing various services offered by an MFI during a
given period or at a point in time. Denoting the number of clients an MFI serves by OUTR,
and assuming that this MFI provides only two products: savings accounts (SAC) and loans
(L), and assuming further that the people with SAC do not borrow, OUTR can be obtained
by SAC+L. If SAC∩L ≠ ∅, then OUTR = [SAC-(SAC∩L) + L-(SAC∩L) + SAC∩L],
where ∩ standards for an intersection set and ∅ stands for a null set. For MFIs that either
require compulsory deposits or condition borrowing to having a savings account or both, L
is a sub-set of SAC.
54
The above re-classification of the measures of outreach is an attempt to capture the number
of clients served and the extent to which they can be described as poor, as opposed to the
earlier measures that captured several aspects of the operations of an MFI, some of which
have nothing to do with outreach as defined above.
Chaves and Gonzalez-Vega, (1996:66) propose the quality of the services measured by the
clients' cost of transactions as a proxy measure for outreach. But quantifying this measure is
problematic due to the difficulties in quantifying clients' transaction costs. Besides, both the
poor and non-poor may incur the same costs, which make it difficult to distinguish between
the transaction costs attributable to the poor and those attributable to the non-poor.
Consequently, the measure may be an inaccurate indicator of the depth of poverty.
Christen (1997:26) uses average loan size divided by GDP per capita income as a measure
of the depth of outreach but notes that, although it is widely used, it has not been
systematically tested. This can be misleading because of the heterogeneity of loan products
in terms of maturity periods and purposes, and therefore may not reflect the target market
and the level of poverty of the clients served.
Following Barres (2006), the consensus in the microfinance industry appears to be that all
the above proposed measures can be conveniently and exhaustively grouped into two
categories: scale and depth of outreach, already explained above. Similarly, Ledgerwood
(1999:217) argues that currently most people in the microfinance industry refer to only two
levels of self-sufficiency: operational self-sufficiency and financial self-sufficiency.
Ledgerwood (1999:225) further argues that the scale of outreach is a straightforward
measure but less nebulous than the depth of outreach, because it captures the total number
of clients served by an MFI without taking into account their poverty status. A more
nebulous measure is one that captures the characteristics of the poor clients served. This
argument, however, ignores the fact that it is not only the poor who are denied access to
financial services in the formal financial sector. There are millions of non-poor people who
are also denied access to financial services in the formal sector. Moreover, as argued in
Chapter Four, the delivery technology employed by MFIs tends automatically to close out
55
those who can access financial services from the formal sector, leaving out mainly those
who are unable and have to turn to MFIs for financial services (Johnson and Rogaly, 1997;
Ledgerwood, 1999; Jain, 1996). The depth of outreach, which is considered a more
nebulous measure of outreach, is also very contentious because of its roots in poverty
indicators.
Paxton and Fruman (1998) have constructed an alternative measure of the depth of
outreach, namely the depth of outreach index (DOI). According to Ledgerwood (1999:225),
the DOI is a simple, useful measure of the depth of outreach. However, the index suffers
from a number of problems, one of which is that it is calculated on the basis of only four
characteristics of the target population, namely, being a rural inhabitant, a woman, poor and
uneducated. Another area of weakness of the DOI is the underlying assumption that the
variables in the DOI characterise the people excluded from accessing financial services in
the formal financial sector. This is not the case in many of the countries where MFIs
operate. In effect, therefore, the index measures access to financial services rather than the
extent of poverty of the clients.
3.3.3 Adopted measure of outreach
From the above proposed measures of outreach the scale of outreach is straightforward and
easy to establish. The depth of outreach has been proposed as a better measure of outreach
from the poverty perspective. For the purpose of this study the scale of outreach is
considered an adequate measure of outreach for the following reasons:
1. First, it is a reasonable measure of people excluded from accessing financial services
from the traditional formal financial sector. It is a quantifiable proxy of the extent to
which the MFI has reached its outreach objective (Yaron et al. 1997 cited in
Ledgerwood, 1999:225). Indeed, one of the basic reasons for the evolution of
microfinance is to provide access to financial services for those who have been
consistently left out or underserved by the traditional formal financial sector
(Ledgerwood, 1999:34; Schadwinkel, 2000:14). Scale of outreach, therefore, reasonably
captures the number of people who are served by most MFIs, given the self-selection
methodology employed by MFIs. For example, MFIs use groups or co-operative
56
arrangements which require attending weekly meetings. In addition, graduation
techniques are used as mechanisms of granting loans. These methods are generally
known to promote self-selection as the more affluent clients usually see them as an
inconvenience, making credit attractive only to poor clients (Johnson and Roglay, 1997;
Jain, 1996; Ledgerwood, 1999:35). Ledgerwood (1999:225) argues that indicators of
outreach are relatively simple to collect and provide a good measure of scale of outreach
and good proxies for depth of outreach.
The second reason for the choice of scale of outreach is that the data are readily available
and generating them is quite straightforward compared with, for example, the Depth of
Outreach Index (DOI) of Paxton and Fruman (1998) or clients’ transaction costs of Chaves
and Gonzalez-Vega (1996).
The third reason for preferring scale outreach is that it is cheaper to construct. Outreach
measures that take into account the characteristics of the poor usually require regular
collection of detailed information about the MFI clients to determine their level of poverty.
In addition to being expensive and time consuming, it has also been observed that poverty
related measures get entangled in the controversies of the definition of poverty and who
constitute the poor, which are often resolved through highly subjective processes (Chaves
and Gonzalez-Vega, 1996:76 footnote 3).
The scale of outreach measure has some limitations:
1. Like the sustainability measures, scale of outreach lacks a need to measure the benefits
of microfinance. Thus the measure does not lead to a cost-benefit analysis (Schreiner,
1999:2).
2. As Ledgerwood (1999:225) argues, the scale of outreach is less nebulous than the depth
of outreach, because it captures the total number of clients served with different types of
financial instruments by an MFI without taking into account their poverty status. A more
nebulous measure is one that captures the characteristics of the poor clients served.
Similarly, scale of outreach does not provide full assessment of the economic impact of
the operations of the MFI as it does not disaggregate the clients by income levels, sex,
57
economic activities, rural-urban location, the uneducated, and so forth, which are often
positively associated with poverty and lack of access to formal financial services.
3. Finally, from the perspective of the six aspects of outreach originally proposed by
Schreiner (1999) and later expounded by Navajas, et al. (2000), scale of outreach only
gives a picture of the number of clients served (breadth). It does not, for example, give a
full account of outreach in terms of the value to clients, cost to clients, depth, length and
scope.
3.4 Summary of the chapter
This chapter has investigated the various definitions and measures of sustainability and
outreach, because these concepts have been used in different contexts without first defining
them. Thus, the chapter has defined the concepts of sustainability and outreach, identified
and discussed their measures and stated the adopted measures and their limitations.
The chapter argues that the concept of sustainability is not an end state but an ongoing
input-output process. Specifically, sustainability is used to describe the performance of
microfinance institutions or programmes that at one point or another rely on external
support in the form of grants, concessionary loans or other implicit subsidies. It is a concept
developed to answer the question of whether or not it is possible for an institution to exist
for a long time providing valuable services to its clients without subsidies.
The measures of sustainability discussed in the chapter include the subsidy dependency
index (SDI), self-sustainability measures (OSS and FSS), adjusted variants of traditional
measures of financial performance, and the arrears rate. Of these, the adopted measure is
OSS for reasons that include: i) it can easily be related to the standard profitability
definition of revenue minus associated expenses; ii) it explicitly relates income to expenses;
ii) the data required to derive it are less onerous and often readily available in most MFIs;
iv) it is straightforward to derive and it uses actual data; v) it does not focus on traditional
measures of financial performance; and vi) it is objective. The limitations of the OSS were
also discussed, one of which is that it does not take into account implicit subsidies and in-
58
kind support to the MFI which are important in determining whether or not an MFI is
sustainable.
Regarding outreach, the less restrictive definition adopted is the extent to which formal
financial services are accessible to the low-income earners and the adopted measure is the
scale outreach for two important reasons. First, it is a reasonable measure of people
excluded from accessing financial services from the traditional formal financial sector, and
second, it is straightforward to calculate and the data required to generate it are readily
available. Limitations of scale outreach include its lack of a need to measure benefits of
microfinance, and the narrow focus on breadth, leaving out the five aspects of outreach
originally proposed by Schreiner (1999), namely the worth to clients or users, cost to
clients or users, depth, length and scope unattended to.
59
CHAPTER FOUR: DETERMINANTS OF SUSTAINABILITY AND OUTREACH
AND ANALYSIS OF THEIR RELATIONSHIP
4.1 Introduction
Chapter Three defines and examines the concepts of sustainability and outreach and how
they are measured. It also indicates the definitions and measures of sustainability and
outreach adopted in this study. The adopted measure of outreach is the number of clients an
MFI has served with financial services in a defined period. The adopted measure of
sustainability is operational self-sufficiency (OSS), although the financial self-sufficiency
(FSS) is considered to be a more appropriate measure of sustainability.
This chapter presents and examines the determinants of sustainability and outreach that
have been identified through a review of the literature on supply leading finance theory,
subsidised credit programmes, the imperfect information paradigm in the credit markets,
rural finance markets, organisational development and evolution, and the rapidly expanding
field of microfinance. For a systematic analysis and presentation, each widely
acknowledged determinant identified in the literature has been tackled separately so that the
relationship between the dependent variable and the explanatory variable is fully
investigated. The analysis also investigates the relationship between sustainability and
outreach.
The chapter is organised in four sections. Section 4.1 is the introduction. Section 4.2
presents and examines the determinants of sustainability and outreach, while section 4.3 is
an analysis of the relationship between sustainability and outreach. The chapter ends with a
summary and conclusion in section 4.4. The hypotheses tested in this study are presented in
Chapter Five.
60
4.2 The determinants of sustainability and outreach
4.2.1 Sources and uses of funds
4.2.1.1 Sources of funds
Organisations can be distinguished in two broad ways: by sources of equity and legal status
although this varies from country to country. Based on sources of equity, an organisation
can be private, public or state. Private and public organisations are initially funded by
equity from individuals or private entities while state organisations are funded by equity
from the state or government. Based on legal status, an organisation can be incorporated or
unincorporated, and it can be private, public, state or non-governmental. In Uganda some
organisations incorporated as limited by guarantee also take the form of non-governmental
organisations (NGOs). The bulk of funding for NGOs tends to come from donors in the
form of grants or proceeds from concessionary loans (Chu and Otero, 2002). – can be
different in different countries.
Beyond the initial funding for establishing an organisation, additional funds can be in the
form of retained earnings or surpluses, grants, loans (concessionary or commercial) or
intermediated savings (see Figure 4.1). Retained earnings or surpluses and grants are part of
the equity, while the rest are liabilities. Therefore, sources of funds can be categorised into
net worth/equity and liabilities.
Van Greuning et al. (1999:5) identify three broad types of MFIs according to their main
sources of funds for operations and loans: (i) those using other people’s money in the form
of grants and donations, limited deposits, and concessionary and commercial borrowing;
(ii) those using members’ money in the form of contributions and savings deposits; and (iii)
those using the public’s money in the form of retail deposits, savings deposits, wholesale
funds and commercial borrowing.
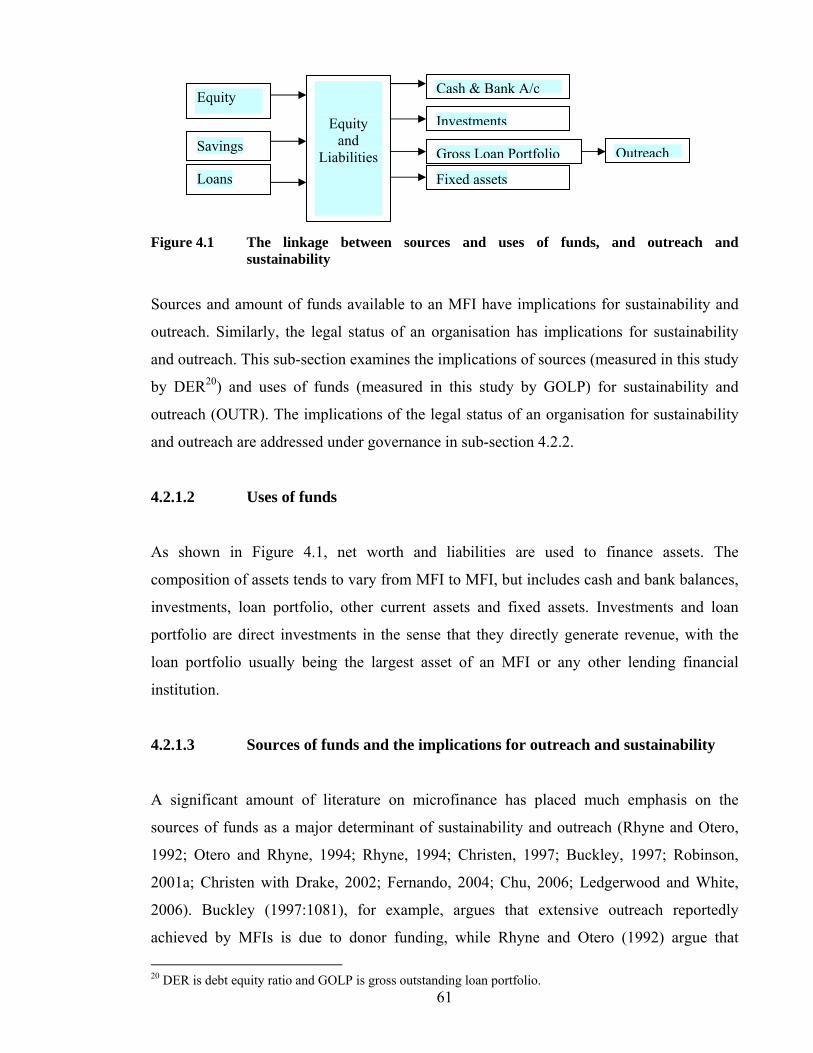
61
Figure 4.1 The linkage between sources and uses of funds, and outreach and sustainability
Sources and amount of funds available to an MFI have implications for sustainability and
outreach. Similarly, the legal status of an organisation has implications for sustainability
and outreach. This sub-section examines the implications of sources (measured in this study
by DER20) and uses of funds (measured in this study by GOLP) for sustainability and
outreach (OUTR). The implications of the legal status of an organisation for sustainability
and outreach are addressed under governance in sub-section 4.2.2.
4.2.1.2 Uses of funds
As shown in Figure 4.1, net worth and liabilities are used to finance assets. The
composition of assets tends to vary from MFI to MFI, but includes cash and bank balances,
investments, loan portfolio, other current assets and fixed assets. Investments and loan
portfolio are direct investments in the sense that they directly generate revenue, with the
loan portfolio usually being the largest asset of an MFI or any other lending financial
institution.
4.2.1.3 Sources of funds and the implications for outreach and sustainability
A significant amount of literature on microfinance has placed much emphasis on the
sources of funds as a major determinant of sustainability and outreach (Rhyne and Otero,
1992; Otero and Rhyne, 1994; Rhyne, 1994; Christen, 1997; Buckley, 1997; Robinson,
2001a; Christen with Drake, 2002; Fernando, 2004; Chu, 2006; Ledgerwood and White,
2006). Buckley (1997:1081), for example, argues that extensive outreach reportedly
achieved by MFIs is due to donor funding, while Rhyne and Otero (1992) argue that 20 DER is debt equity ratio and GOLP is gross outstanding loan portfolio.
Equity
Savings
Equity and
Liabilities
Cash & Bank A/c
Investments
Loans
Gross Loan Portfolio
Fixed assets
Outreach
62
extensive outreach by the MFIs can be achieved and sustained through savings mobilisation
and access to commercial loans. In Asia and Latin America the success of MFIs in terms of
sustainability and outreach is attributed mainly to savings mobilisation and access to
commercial loans. BRI in Indonesia, for example, is reported to be funding a greater part of
its loan portfolio using savings from low-income people. BancoSol in Bolivia is reported to
be relying heavily on commercial loans to fund its loan portfolio (Robinson, 2001a). White
and Campion (2002:28) report that between 1998 and 2000, in Peru, Mibanco increased its
clients from 32,000 to 58,000 and its loan portfolio from US$14 million to US$40,
following its transformation and access to savings for intermediation.
Figure 4.1 illustrates the possible channels through which sources of funds affect
sustainability and outreach of an MFI. While it is not easy to see a direct relationship
between the various sources of funds, on the one hand, and sustainability and outreach, on
the other hand from the Figure, given the accounting principle that the value of net worth
plus liabilities (sources of funds) is equal to the value of assets, an increase in the sources of
funds should lead to an increase in the uses of funds. Thus, if a sustained amount of savings
and commercial loans can be mobilised, it is possible that sustainability and expanded
outreach can be achieved, consistent with the hypothesis stated in section 1.5. It can also be
seen that additional equity arising from retained earnings or donor funding or both leads to
an increase in the uses of funds.
However, the growth in the uses of funds (measured by GOLP) due to the growth in the
sources of funds may not automatically be translated into improved sustainability and
increased outreach for a variety of reasons. As Figure 4.1 shows, when more savings are
mobilised and/or commercial loans obtained, they may be converted into cash or put in a
bank and/or in fixed assets other than in gross loan portfolio (GLP) and/or investments,
which are directly linked to sustainability and outreach. For example, out of increased
savings, higher wages and salaries may be paid or money spent on strengthening the
governance structure with a long-term effect on sustainability and outreach.
Secondly, even if the savings mobilised and/or commercial loans obtained are used to
increase GLP, if the average loan size (AvLz) increases at a rate higher than the rate at
which GLP increases, an increase in GLP may not be translated into an increase in outreach
63
although sustainability could improve. Thirdly, an increase in GLP may not be translated
into an increase in outreach, if the number of repeat borrowers increases. Therefore, access
to more savings and/or commercial loans may not necessarily lead to an increase in
outreach and/or improved sustainability, as has been argued in the literature (see for
example, Rhyne and Otero, 1992; Otero and Rhyne, 1994; Rhyne, 1994; Christen, 1997).
Furthermore, mobilisation of public savings for intermediation has its own complexities
and direct costs that would require more funds to be spent, for example, in payment of staff
salaries and incentives, training staff and improvement of physical infrastructure for the
institution (Robinson, 2001a; Ledgerwood, 1999; Ledgerwood and White, 2006). White
and Campion (2002:27) note that there is evidence that, in some instances, regulation has
not enhanced savings volume, because the development of a savings product is expensive
and complex, requiring high levels of liquidity and risk-management skills, as well as a
thorough understanding of the local economy (Ledgerwood and White, 2006).
Similarly, access to commercial funds may come with its own costs. However, the level of
these costs depends on the state of development of a given financial sector. In most
developing countries the financial sector is still underdeveloped, making the costs of funds
relatively high. This could negatively affect sustainability and outreach. Other factors such
as weak governance and lack of institutional vision can play a major role in impeding
translation of an increase in the sources of funds into increased sustainability and outreach
of the institution. From the foregoing analysis, the effect of the sources of funds on
sustainability and outreach is an empirical question. In this study it is hypothesised that
sources of funds measured by DER positively affect sustainability and outreach, because it
is widely expected that an increase in the resource inflow to a microfinance institution
should lead to an increase in loanable funds and the number of clients accessing the loans.
Another subject that has attracted widespread debate regarding the linkage between sources
of funds and sustainability and outreach is the application of subsidies. Citing
institutionalist literature, Woller et al. (1999) define the term subsidy as any financial
resource received by an organisation at below market price or at zero price, which includes
all types of donations, explicit or implicit.
64
A number of MFIs that receive grants apply part of them to the provision of non-financial
services such as staff and client training, research and development, and other activities of
particular interest to donors. These non-financial services are reported to have had a huge
effect on outreach. For instance, Grameen Bank serves several million members (6.61
million by August, 2006 – Yunus, 2006) mainly through donor support (Morduch, 1999).
Valenzuela (2002:71) finds that technical assistance plays a key role in helping re-orient
and expand programmes of downscalers,21 and that in Chile, subsidising special operating
expenses proved hugely successful in enhancing institutional performance. This implies
that subsidies could be positively related to outreach. However, if the subsidy negatively
affects the attitudes of the recipients (the receiving institution and/or its clients), then it is
likely to have negative effects on sustainability and outreach of the institution receiving it.
Chaves and Gonzalez-Vega (1996:73) called this possible influence an “organisational
dependency attitude.”
Chaves and Gonzalez-Vega (1996) report that Indonesia subsidies contributed to the
financial viability of rural finance institutions that received them, but only because of two
fundamental factors:
• The subsidies were one-time loans and/or direct transfers in the form of capital and
no more. Besides, no operating subsidies were granted thereafter; and
• The subsidies were directed to the organisation and not to its clients, and the
resulting earnings were retained. The clients of the MFIs had absolutely no illusion
that they would not be able to access the funds as a political gift.
Based on the above analysis, the relationship between subsidies, on the one hand, and
sustainability and outreach, on the other hand, can be either positive or negative depending
on the extent to which it affects the attitudes of the management of the institution and the
clients receiving it. This study has not tested this hypothesis for lack of accurate data.
4.2.1.5 Uses of funds and the implications for sustainability and outreach
21 Downscalers is a term used to refer to commercial banks that have entered into the microfinance market.
65
Figure 4.1 also shows the items on the uses side of funds. Operating revenue (OR) is
directly generated from two main uses of funds: investments and disbursed loans proxied
by the gross outstanding loan portfolio (GLP). The direct way to increase investments and
GLP, given fixed sources of funds, is to re-allocate funds within the uses side, a fairly
logical argument that has received less emphasis in microfinance empirical studies. If
investments generate more revenue compared to other forms of uses of funds, re-allocating
resources to other forms of uses of funds (ceteris paribus) results in increased OR and,
therefore, sustainability. Similarly, assuming all other factors remain constant, an increase
in GLP results in higher OR and improves sustainability. Thus, an increase in investments
and GLP, ceteris paribus (lending interest rates, costs and repayment rates), translates
directly into improved sustainability. The loan size does not have any effect, except where
it leads to increased cost of loan administration (see sub-section 4.2.7). On the other hand,
an increase in GLP could also lead to a decrease in OR, because as more loans are
disbursed and left uncollected, less revenue is generated. Thus, an increase in GLP could be
negatively associated with sustainability, but positively with outreach as hypothesised in
this study.
Unlike sustainability, where more revenue can be generated from investments and GLP to
improve sustainability as argued above, outreach is only influenced through GLP
(assuming loans are the only products offered). Denoting the number of loans by NL and
average loan size by AvLz, GLP = AvLz*NL. Assuming there are no repeat borrowers
(NRB), then NL is the same as outreach. This means that for NL to increase when GLP
increases, AvLz and NRB have to be constant. If these variables increase, an increase in
GLP may not be translated into an increase in outreach.
66
4.2.2 Governance22
4.2.2.1 Concept of governance
Different authors have defined the concept of governance differently. A sample of these
definitions provided below can help to illuminate an understanding of the concept.
Ledgerwood (1999:111) refers to governance as a system of checks and balances whereby a
board of directors is established to oversee the management of the MFI (see Ledgerwood
and White, 2006; Carmichael, 2006). Similarly, CGAP (1997) defines governance as “a
system of checks and balances whereby a board is established to manage the managers.
Governance is sometimes conceived as a virtuous circle that links the shareholder to the
board, the management, the staff, the customer, and the community at large.”
Otero and Chu (2002:220) define governance as:
…the process by which a board of directors, through management, guides an institution in the fulfilment of its corporate mission and protects the institution’s assets over the course of time. The board of directors provides oversight, gives direction to managers of the institution, and carries out its functions on behalf of the third party. Shareholders constitute the third party in for profit corporations; in nonprofits the third party is not as easily defined because they are not owners and can include clients, staff and donors.
OECD (1999) defines governance as:
… the system by which business corporations are directed and controlled. The corporate governance structure specifies the distribution of rights and responsibilities among different participants in the corporation, such as the board, the managers, shareholders, and other stakeholders, and spells out the rules and procedures for making decisions to corporate affairs. By doing this, it also provides the structure through which the company objectives are set, the means of obtaining those objectives and monitoring performance.
In a more compressed form, Shleifer and Vishny (1997:737) define governance as “ways in
which suppliers of finance to corporations assure themselves of getting a return on their
investment.”
22 Widely referred to as corporate governance
67
PCSU (2000) states:
…corporate governance refers to the set of rules and incentives by which the management of a company is directed and controlled. Good corporate governance maximises the profitability and long-term value of the firm for shareholders.
ICGN (1999) defines governance as “the relationship among various participants in
determining the direction and performance of corporations. The primary participants are (1)
the shareholders, (2) the management (led by the chief executive officer), and (3) the board
of directors.”
A synthesis of the above definitions identifies common and crucial elements that
characterise the definition of governance. First, governance is an organisational
arrangement in which the key organisational layers of equity holders, Board of Directors
(BOD) and management are constituted and aligned to control and distribute power within
the organisation to achieve the desired objectives. Second, in order for the organisational
arrangement to achieve its objective(s), it must provide adequate checks and balances.
Finally, the rights and responsibilities of the key stakeholders in the organisational
arrangement should be part of the organisational structure. Therefore, a more complete
definition of governance should include all these identified elements.
4.2.2.2. The evolution and rationale for governance
In the Principal-Agent framework, the risk bearers are called Principals, who contribute
equity capital in exchange for the rights to profits/surpluses and appreciation of corporate
value. These rights include selling shares, electing and removing directors, and approving
fundamental changes in a company to safeguard equity ownership (OECD, 1999). The
equity holders are also called owners of the organisation. The Agents are the managers who
carry out the day-to-day operations of the organisation. They can be the principals or a team
of professionals completely different from the principals. In NGOs equity holders are not
clearly defined and constitute shadow equity owners as opposed to real shareholders in for-
profit organisations (Otero and Chu, 2002; Christen, 1997).
68
In the early part of an organisation’s life, especially a private organisation, outside equity
may or may not be required depending on the ability and willingness of the shareholders to
supply it. Besides, in such organisations, the principal(s) might be few, holding the same
value of equity, and are also the managers of the organisation. In this case the interests of
the principals and of the agents may be perfectly aligned, and therefore the principal-agent
problem may not arise at all. However, as the organisation grows, it may require an
injection of more equity capital and/or debt that may come from several sources and in
unequal amounts, leading to a diffuse ownership with several major and minority
principals. In this situation the following scenarios are likely to obtain:
(i) The principals are not the same as the agents;
(ii) There could be less incentive for those not in management to pay for the cost of
monitoring the agents; and
(iii) There is a dichotomy between dominant and minority equity holders.
When any of the above scenarios obtains, the interests of the principals may significantly
diverge from those of the agents. For a profit organisation governance issues arise
whenever all its principals do not manage the organisation, or there is a majority-minority
shareholding relationship whereby the majority shareholders tend to dominate the minority
shareholders or abuse their rights (OECD, 1999).
The problem may also arise if there is a diffuse equity ownership, as Gillan et al. (2001)
observe: “it is not just the separation of ownership and control that gives rise to the agency
problem between shareholders and managers, rather it is the atomistic or diffusion nature of
the corporate ownership i.e., an ownership structure characterized by a large number of
small shareholders.” (See also Mas-Colell et al., 1995:153.) Given a diffuse ownership,
there is no incentive for an individual owner to monitor corporate management, since
he/she meets the entire monitoring costs, but the benefits from improved management of
the organisation accrue to all the shareholders/founders. In this case, therefore, the nature
and magnitude of the agency problem is a function of the equity ownership structure.
69
The absence of any incentive to closely monitor the managers gives them (managers)
opportunity to maximise their own objective function. As PCSU (2000) and Kasper and
Streit (1998:271) argue, if left without adequate oversight, the managers might:
• Pay themselves above the market wages;
• Undertake unprofitable investments that provide no long-term benefits to
shareholders, such as overly elaborate and expensive headquarters buildings,
excessive growth, etc;
• Undertake overly risky financial transactions such as borrowing to promote
expansion, without concern for high levels of leverage that might get the company
into trouble when market growth slows;
• Engage in asset stripping i.e., removing assets from the company, without the
knowledge of other shareholders; and
• Recruit relatives without due regard for competence.
The BOD represents the basic interests of the principals (and sometimes other parties’
interests). Its principal functions are therefore to: i) select, oversee and compensate senior
management based on performance; ii) with input from management, undertake strategic
planning including succession planning; iii) communicate with equity holders; iv) with
input from management, design risk identification and management systems including
internal financial control (part of fiduciary responsibility); and v) ensure management and
general legal compliance (Otero and Chu, 2002; PCSU, 2000; OECD, 1999; ICGN, 1999;
CGAP, 1997; Edgcomb and Cawley, 1994). Some BODs are also responsible for declaring
dividends/surpluses (PCSU, 2000). Since the BOD may be composed of representatives of
equity holders, managers, creditors, workers and other stakeholders, its interests can be
mixed, and therefore should be guided by well-defined principles discussed in 4.2.2.5 (b).
Management reports to the BOD and is responsible for the day-to-day operations of the
organisation, as well as maximising corporate profits/surpluses and equity holders’ value
(Otero and Chu, 2002; PCSU, 2000; OECD, 1999; ICGN, 1999). A long-standing debate
among scholars is whether or not the objectives of equity holders and of managers are
consistent. Sub-section 4.2.2.3 and Chapter Five address some of the points of contention.
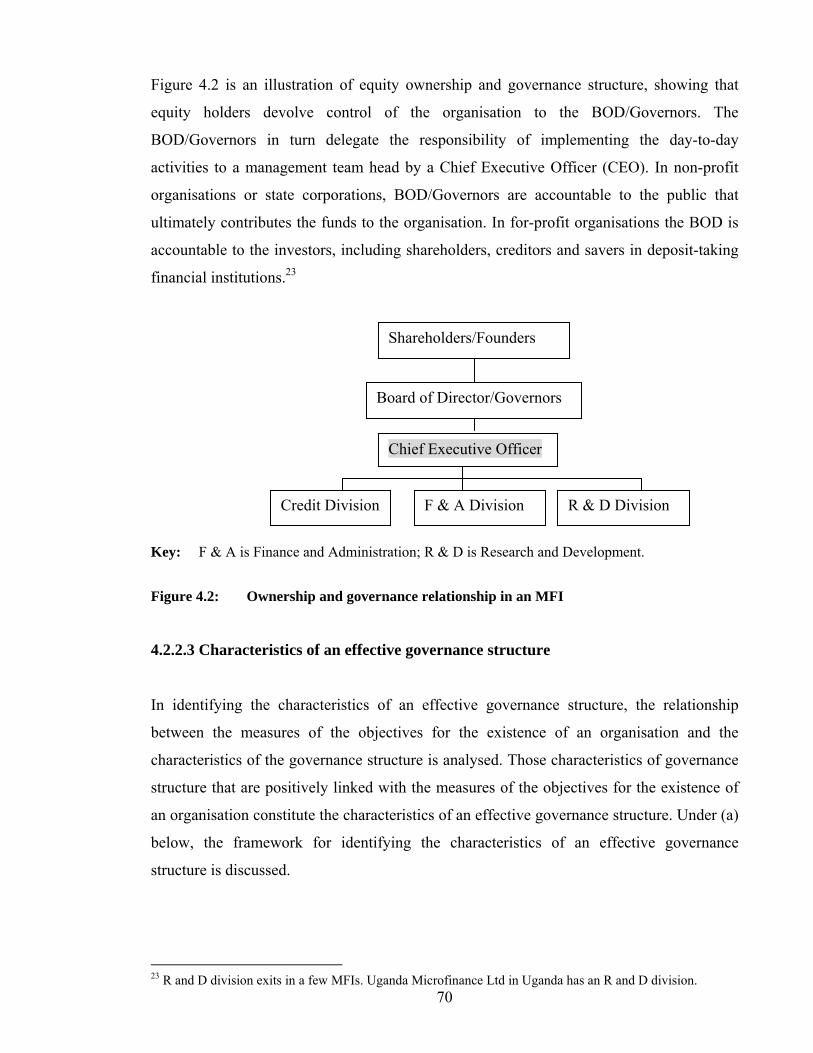
70
Figure 4.2 is an illustration of equity ownership and governance structure, showing that
equity holders devolve control of the organisation to the BOD/Governors. The
BOD/Governors in turn delegate the responsibility of implementing the day-to-day
activities to a management team head by a Chief Executive Officer (CEO). In non-profit
organisations or state corporations, BOD/Governors are accountable to the public that
ultimately contributes the funds to the organisation. In for-profit organisations the BOD is
accountable to the investors, including shareholders, creditors and savers in deposit-taking
financial institutions.23
Key: F & A is Finance and Administration; R & D is Research and Development.
Figure 4.2: Ownership and governance relationship in an MFI
4.2.2.3 Characteristics of an effective governance structure
In identifying the characteristics of an effective governance structure, the relationship
between the measures of the objectives for the existence of an organisation and the
characteristics of the governance structure is analysed. Those characteristics of governance
structure that are positively linked with the measures of the objectives for the existence of
an organisation constitute the characteristics of an effective governance structure. Under (a)
below, the framework for identifying the characteristics of an effective governance
structure is discussed.
23 R and D division exits in a few MFIs. Uganda Microfinance Ltd in Uganda has an R and D division.
Shareholders/Founders
Board of Director/Governors
F & A Division R & D Division Credit Division
Chief Executive Officer
71
(a) Framework for identifying the characteristics of an effective governance
structure
The main objective for the existence of most private organisations is to maximise profits.
This classical assumption has been strongly challenged mainly on account of separation of
ownership and control (Chapter Five). It is argued that when equity owners are not the
managers of the organisation, their interests may not be aligned. Due to this mismatch,
organisations may not aim at profit maximisation only. Besides, organisations such as co-
operative societies do not exist for profit maximisation. Similarly, state organisations and
NGOs do not exist purely for profits.
Cognisant of their social obligations, some state companies and NGOs are established to
disperse possible surpluses through lower prices, additional services or higher rewards to
the factors of production employed. For example, given their NGO background, the main
goal of MFIs may be attaining significant outreach. Therefore, to assess whether a given
governance structure is effective or not requires an assessment of whether the governance
structure leads to profit maximisation/sustainability, increased outreach and so forth, based
on the objective function of the organisation.
(b) Characteristics of an effective governance structure
Various authors have suggested a number of characteristics that an effective governance
structure must display. These characteristics together with the supporting literature are
summarised in Table 4.1.
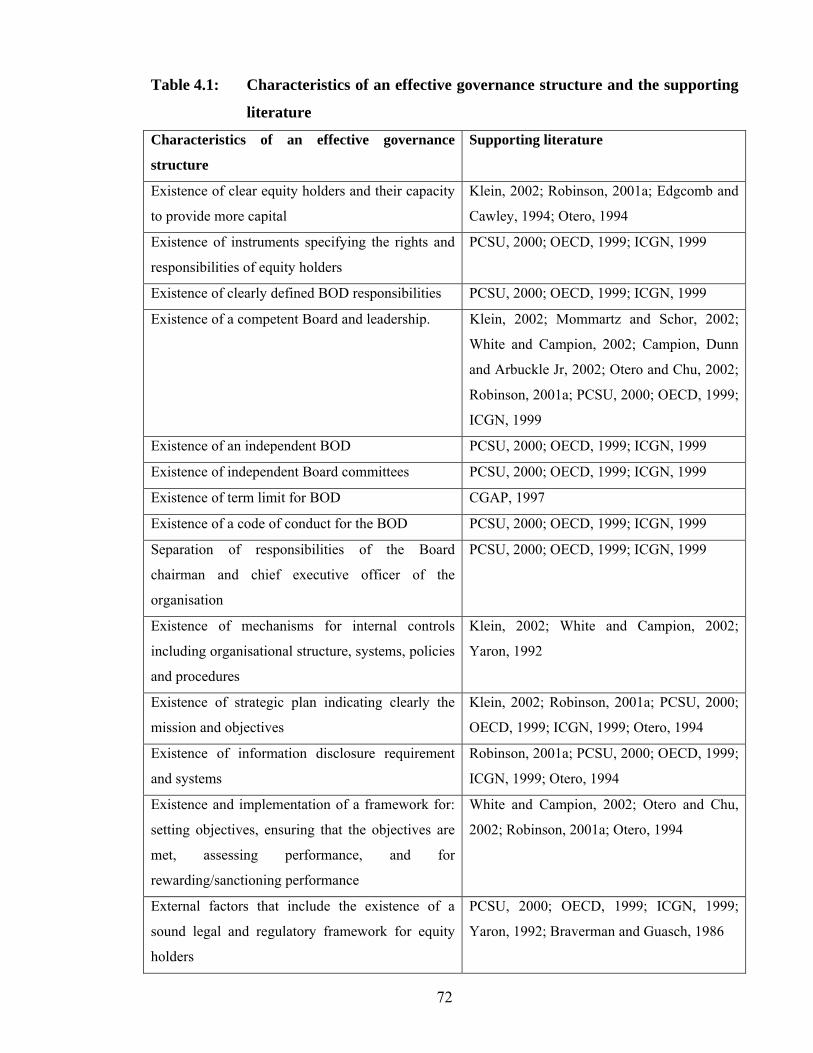
72
Table 4.1: Characteristics of an effective governance structure and the supporting
literature
Characteristics of an effective governance
structure
Supporting literature
Existence of clear equity holders and their capacity
to provide more capital
Klein, 2002; Robinson, 2001a; Edgcomb and
Cawley, 1994; Otero, 1994
Existence of instruments specifying the rights and
responsibilities of equity holders
PCSU, 2000; OECD, 1999; ICGN, 1999
Existence of clearly defined BOD responsibilities PCSU, 2000; OECD, 1999; ICGN, 1999
Existence of a competent Board and leadership. Klein, 2002; Mommartz and Schor, 2002;
White and Campion, 2002; Campion, Dunn
and Arbuckle Jr, 2002; Otero and Chu, 2002;
Robinson, 2001a; PCSU, 2000; OECD, 1999;
ICGN, 1999
Existence of an independent BOD PCSU, 2000; OECD, 1999; ICGN, 1999
Existence of independent Board committees PCSU, 2000; OECD, 1999; ICGN, 1999
Existence of term limit for BOD CGAP, 1997
Existence of a code of conduct for the BOD PCSU, 2000; OECD, 1999; ICGN, 1999
Separation of responsibilities of the Board
chairman and chief executive officer of the
organisation
PCSU, 2000; OECD, 1999; ICGN, 1999
Existence of mechanisms for internal controls
including organisational structure, systems, policies
and procedures
Klein, 2002; White and Campion, 2002;
Yaron, 1992
Existence of strategic plan indicating clearly the
mission and objectives
Klein, 2002; Robinson, 2001a; PCSU, 2000;
OECD, 1999; ICGN, 1999; Otero, 1994
Existence of information disclosure requirement
and systems
Robinson, 2001a; PCSU, 2000; OECD, 1999;
ICGN, 1999; Otero, 1994
Existence and implementation of a framework for:
setting objectives, ensuring that the objectives are
met, assessing performance, and for
rewarding/sanctioning performance
White and Campion, 2002; Otero and Chu,
2002; Robinson, 2001a; Otero, 1994
External factors that include the existence of a
sound legal and regulatory framework for equity
holders
PCSU, 2000; OECD, 1999; ICGN, 1999;
Yaron, 1992; Braverman and Guasch, 1986
73
4.2.2.4 Governance and the implications for sustainability and outreach
Until the 1990s governance in relation to institutional performance was hardly a subject of
discussion in the field of microfinance and credit programmes (Private Sector Corporate
Governance Trust, 2002). Adams and Vogel (1986) argue that it is policies and not
organisational form that appear to be the main determinant of institutional success or
failure. PCSU (2000) notes that ten years ago the phrase ‘corporate governance’ was hardly
used, while Gillibrand (2004) goes a step farther to state:
Even three years ago, the conventional approach to corporate governance regarded it as irrelevant for state-owned enterprises, family owned corporations, small and medium enterprises – and even unimportant in the banking sector. One of the main reasons was theoretical: the concepts of corporate governance were based on the principal-agent relationship, which was considered to apply only to joint stock companies.
In contrast, however, most of the current literature underscores the importance of
governance in institutional building and performance. For example, Gillibrand (2004)
reports that Sir Adrian Cadbury has published a book on corporate governance for family-
owned companies. Gillibrand (2004) further observes that today there are well-established
codes for state enterprises and universities in many countries including India, Australia and
New Zealand, and that the Commonwealth Secretariat has prepared guidelines of corporate
governance for co-operatives and small and medium enterprises, while work is in progress
for developing corporate governance guidelines for NGOs.
Noting the increasing importance of governance, CGAP (1997:1) argues that in emerging
industries the person who starts the company is often a visionary. But as the business
experiences some success, and there is a need to generate adequate income to pay workers
competitive wages and salaries or attract an investor, professional management with
effective oversight becomes crucial.
Otero and Chu (2002:221) argue that governance has assumed increasing importance in
microfinance because as the MFIs grow in their outreach, the size of their assets (measured
by their loan portfolio) also grows to a considerable size. Ensuring effective management of
this growth requires an added input and involvement by a board.
74
Similarly, Mommartz and Schor (2002:76-9) observe: “an appropriate credit technology
can only be effective if it is used in an appropriate institutional setting (in terms of
governance and ownership structure).” In addition, resources must be acquired and
combined for production in the most efficient and cost-effective way. This requires a
desirable institutional ownership and governance structure. Thus, an effective governance
structure is positively associated with sustainability and outreach, consistent with one of the
hypotheses stated in section 1.5. The authors further note that lack of real owners of an MFI
does not necessarily result in unstable and risky institutions. They cite the experience of
MFIs that span the spectrum from very weak to very successful, not so much on account of
ownership but rather on account of good governance. NGOs such as Compartamos in
Mexico, ACP in Peru, ADEMI in the Dominican Republic, Kenya Rural Enterprise
Program (K-REP) in Kenya, ABA in Egypt, RAC and ASA in Bangladesh, and Share in
India do not have owners and yet they have been successful. These arguments suggest that
ownership may not be an important issue in the performance of an MFI, but governance.
Following the Asian financial crisis and the Russian debt default, in 1998 the leaders of the
G7 nations announced a new focus on corporate behaviour and incentives. By mid-1999 the
OECD had adopted a set of basic principles. These principles have been endorsed by
organisations such as ICGN and California Public Employees’ Retirement System
(CalPERS) (ICGN, 1999). The OECD Principles of Corporate Governance were arrived at
following consultations with 30 member countries (OECD, 1999), and the principles are
designed to ensure good practice in corporate behaviour.
In Uganda the government enacted the Micro Finance Deposit-Taking Institutions (MDI)
Act, 2003 and Financial Institutions Act, 2004, which explicitly recognise the importance
of corporate governance (Government of Uganda, 2003; 2004).
Empirically, rigorous studies which have investigated the effects of governance on
institutional performance have focused on joint-stock companies (Gillibrand, 2004). In
microfinance the existing evidence linking governance structure to institutional
performance, especially with regard to sustainability and outreach, is not widespread, and
in most cases are of a general and qualitative nature. For example, Klein (2002:3) finds that
“adequate ownership structure, board composition and control mechanisms are essential.
75
The successful MFIs tend to be those that establish clear mission and business objectives at
the outset.”
In Indonesia Chaves and Gonzalez-Vega (1996) find that the design of institutions that
perform financial intermediation matters a great deal, because it determines the
performance of the organisation and hence its success or failure. In particular, the human
element in institution building is noteworthy. Supporting this argument, Klein (2002:3)
notes that it is very important that the management of an MFI is highly professional and
remains free of government interference.
Adams and Vogel (1986) report that most of the subsidised credit programmes were
unsuccessful, because the organisational form of the institutions through which the directed
credit programmes were implemented was not suited to the conditions in the recipient
countries, having been formed on the basis of the dominant economic philosophy of the
donor country.
While the overall performance of directed credit programmes in the past was poor, the
performance of a few programmes such as INVIENO Development Bank Program
implemented in Nicaragua in 1975 indicate that about 80% of the targeted small farmers
were reached in the region containing the largest number of small producers and lowest
rural family incomes. According to Braverman and Guasch (1986), such performance was
attributed to internal auditing of local office operations, low monitoring costs, technical
help received for operational procedures, new methods of programme implementation, and
the expeditious manner in which loan applications were processed and funds disbursed.
These are major elements of governance.
4.2.3 Savings mobilisation
4.2.3.1 Concepts of savings and intermediation
The term ‘saving’ is widely used to mean income not spent on current consumption but put
aside for future spending (Bannock et al., 1998). It is often assumed that savings arise from
the surplus income available for current consumption. However, in most developing
76
economies savings may not occur in the form of income not spent on current consumption,
but on non-financial assets. Moreover, the savings may not necessarily be the result of
surplus income, but a genuine sacrifice of current consumption for either investment to
produce goods and services for future consumption or for an unforeseen eventuality
(Robinson, 2001a). If saving has occurred and is placed in a financial institution, it
becomes a financial product offered by that financial institution. Intermediation of savings
means lending the money out at the risk of the lender (GOU, 2003).
4.2.3.2 The role of savings mobilisation
There is a large amount of literature on savings. Until recently, however, much of the
literature focused on the role of savings in growth and development, determinants of
savings, reasons for savings, and savings behaviour mainly at household and national
levels. For example, in a review of alternative theories of savings, Jensen (2003:5) states
that whenever a growth model is formulated, a theory of savings is adopted. This implies
that savings were viewed as an important source of funds for investment to generate
economic growth rather than as a product offered by financial institutions. In financial
development theories the focus on savings has been from the point of view of ensuring its
safety in the financial system, how to attract it, and the role it plays in granting loans.
Savings seen as a financial product that attracts clients to a monetised financial system is a
relatively recent development.
Citing Vogel (1984b), Robinson (2001a:224) argues that, despite the large demand for
financial savings in rural areas of developing countries, savings remains forgotten in much
of institutional microfinance. Adams and Vogel (1986) argue that the subsidised supply-led
credit programmes of the 1960s and 1970s crumbled partly because savings were not
viewed as an additional product useful for the low-income earners. It was argued that the
low-income earners did not have the capacity to save or did not even know how to save.
Therefore, prospective clients who did not need credit could not become clients of the
programmes. Consequently, outreach was curtailed.
Sub-section 4.2.1 identifies sources and uses of funds as determinants of sustainability and
outreach consistent with the traditional arguments of the role of savings in economic
77
growth and development. On the sources side, savings are identified as a source of funds
for investment. However, apart from being a source of funds for investment, savings have
other characteristics that affect sustainability and outreach. This sub-section discusses
savings as a financial product and the implications of this for sustainability and outreach.
The discussion is limited to savings, because several writers have noted that it is an
important product that most MFIs do not provide, and yet it (savings) significantly affects
sustainability and outreach (Otero and Rhyne, 1994; Seibel, 1996; Chaves and Gonzalez-
Vega, 1996; Hulme and Mosley, 1996; Hollis and Sweetman, 1998; Schoombee, 1998;
Morduch, 1999; Schreiner, 1999; Robinson, 1994, 2001a; Ledgerwood and White, 2006).
4.2.3.3 The implications of providing savings products for sustainability and outreach
Savings affect sustainability and outreach of MFIs through four main channels. In Uganda,
for example, and as also argued in the Strauss Report (1996), savings are a source of
relatively cheap loan funds compared to funds from commercial sources, because it
(savings) usually attracts low interest rates (MOFPED, 2006). Cheap loan funds can be lent
at relatively low lending interest rates, which in turn may attract more clients and, hence,
increased outreach and revenue depending on the elasticity of demand for credit. More
revenue may lead to increased profitability. There is, therefore, a positive relationship
between savings and both sustainability and outreach.
The second way through which savings affect outreach is as a financial service. To
illustrate this point, consider an MFI engaged in providing microfinance services. Assume
that this MFI provides only two products: loans and savings, either directly or indirectly.
These products can be accessed by savers only (do not borrow), borrowers only (do not
save) or by both savers and borrowers. Given that the products of the MFI can be accessed
by savers only, borrowers only or by both savers and borrowers, the outreach of this MFI
denoted by OUTR is a summation of the number of savers only (NSO), the number of
borrowers only (NBO), and the number of both borrowers and savers (NSOBO). Expressed
algebraically, OUTR is:
OUTR = NSO+NBO + NSOBO--------------------------------------------------------------------4.1
78
But NBO + NSOBO in equation 4.1 can also be expressed in terms of the number of non-
repeat borrowers (NNRB) and the number of repeat borrowers (NRB). Substituting NNRB
+ NRB into equation 4.1 gives:
OUTR = NSO+NNRB+NRB-----------------------------------------------------------------------4.2
Equation 4.2 tells us that outreach of an MFI providing loans and saving products is a
summation of: the number of savers only, the number of non-repeat borrowers and the
number of repeat borrowers. For an MFI not providing saving services, NSO = 0, and
therefore clients who would want to access saving services only would not be reached. In
this case the outreach of the MFI may be lower than if the MFI provided saving services as
well. Similarly, an MFI that pursues a policy of a high retention rate through granting
repeat loans may reach fewer clients, although the institution may experience high growth
in its loan portfolio. This is a signal that a high retention rate through repeat loans could
actually conflict with the outreach objective. Furthermore, it has been argued that a high
retention rate is positively related to financial sustainability. Thus, given that there can be a
conflict between granting repeat loans and outreach, this conflict can be translated into a
conflict between outreach and sustainability.
Studies have shown that low-income earners can and do save, and evidence from MFIs
such as BRI, BancoSol and rural banking in Mexico has shown that there can be more
savers than borrowers (CGAP, 2004; Morduch, 1999). Lafourcade et al. (2005) found that
in 2003, the 163 MFIs in Africa reporting to MIX Market Inc served almost three times as
many voluntary savers (6.3 million) as borrowers (2.4 million). Chaves and Gonzalez-Vega
(1996:67) observe that in Indonesia, “in an interesting encounter, over 10 million savers use
deposit services.” CGAP (2004:3) argues that supply-driven microenterprise credit
methodologies do not reach the millions of poor people who do not need loans, but other
services such as savings, consumption credit, insurance, and money transfer services (see
also Fernando, 2004:3). By providing savings services to the low-income earners, a
significant level of outreach can be attained and sustainability improved.
The third channel through which savings affects sustainability and outreach is by providing
relatively less expensive information for loan appraisal (Hulme and Mosley, 1996:3). Many
79
authors have identified information asymmetry as one of the major obstacles in the delivery
of financial services to the low income earners, more so in rural areas (Bose, 1998; Hollis
and Sweetman, 1998; Sharma and Zeller, 1997; Steel et al., 1997; Chaves and Gonzalez-
Vega, 1996; Stiglitz, 1990; Hoff and Stiglitz, 1990; and Udry, 1990). As clients deposit
their savings and withdraw, the MFI gets information about their behaviour at a much
lower cost than when the institution has absolutely no information about a potential
borrower, which reduces the level of information asymmentry about the client. This
channel affects sustainability through improving the repayment rate and lowering the cost
of loan appraisal. High repayment rates and lower costs should be translated into profit for
the MFI and increased outreach, although as Cull et al. (2006) have argued, many MFIs
have not realised this promise.
Finally, savings may also improve governance of the MFI, because it heightens the board’s
and management’s client orientation for effective supervision and oversight, leading to
higher outreach (White and Campion, 2002:26). In some financial institutions, savings act
as collateral for loans.
However, as argued in section 4.2.1, while savings may generate many benefits to an MFI,
handling many small deposit accounts can be expensive due to the cost of complying with
the legal requirements to mobilise deposits for intermediation, costs incurred in
mobilisation and interest costs paid to depositors (Ledgerwood and White, 2006;
Ledgerwood, 1999; Paxton and Fruman, 1998). Schreiner (1999:13) argues that the supply
of passbook savings increases the overall cost of supply of financial services and thus leads
to higher prices for those services such as loans – that directly earn revenue, reducing net
gain to per borrower. Ledgerwood and White (2006) argue that in spite of the costs
imposed on the MFI by deposit mobilisation, the net effect is positive on both sustainability
and outreach, which is consistent with the hypothesis of this study stated in section 1.5.
4.2.4 Average loan size and the implications for sustainability and outreach
Empirical evidence suggests that subsidised and directed credit programmes perform poorly
partly because their loan sizes are attractive to non-targeted clients. For example, figures
80
from BRAC’s 1995 impact study indicate that 10% of members were from non-target
families (Johnson and Rogaly, 1997:37).
Research has also shown that many potential poorer clients of MFIs are self-excluding,
because the MFIs’ loan products simply do not meet their cash flow patterns; as Johnson
and Rogaly (1997:29) report, “ACTIONAID found, through the experience of running a
group-based lending programme similar to that of the Grameen Bank, that many very poor
people were nervous of taking a large loan…” Johnson and Rogaly (1997:13) further report
that research on the effects of credit programmes on the empowerment of women found
that women retained significant control over the use of the loan more often when the loan
sizes were small.
An alternative to directly targeting low-income clients is to use design features that
promote self-exclusion of the better-offs. One such design feature is the use of small loans.
Richer people are less likely to be interested in accessing small loans. However, Johnson
and Rogaly (1997:37) argue that while, on the one hand, indirect mechanisms for
increasing outreach such as using small loan size are able to lower costs, on the other hand,
targeting can be difficult to implement and monitor in terms of time and cost, especially in
the fast expanding and large programmes.
Nevertheless, compared to programmes that do not use loan sizes, those that use them (loan
sizes) as part of their design features tend to serve more low-income clients compared to
those that do not (Johnson and Rogaly, 1997). This can be explained from two
perspectives: in terms of the absolute loan size and self-selection.
To illustrate how absolute loan size affects outreach, assume a given loan fund of, say,
US$15,000. Assume further that three different loan sizes are extended to clients: US$50,
US$75 and US$100. This illustration assumes constant costs of delivering the loans,
constant number of repeat loans and unlimited demand for loans.24 From the illustration,
the smaller the loan size, the greater the number of clients served and the greater the
outreach. This means that MFIs that deliver small loan sizes, if not constrained by the
24 Throughout this study it is assumed that the demand for financial services provided by MFIs is a given (see Chapter Two).
81
amount of funds available for lending, can reach more clients and therefore achieve a
greater outreach compared to those with relatively larger loan sizes.
The second channel through which loan size affects outreach is the self-selection
mechanism. It is assumed that most of the people without access to financial services are
low-income earners, who are interested and able to access only small size loans. For
example, Christen, et al (1995) use average loan size as a proxy for client income, implying
that low-income earners borrow small amounts. In view of the above arguments, it is
hypothesised that small loan size is positively related to outreach.
SEEP Network and Calmeadow (1995:29) identifies average loan size as one of the three
key factors that influence the level of activities and hence operational costs. Small loans
tend to be very expensive to administer. Secondly, micro-borrowers usually live in rural
areas, which may be sparsely populated and with poor infrastructure, making the provision
of financial services to them expensive. In addition, low-income clients have no formal
collateral and information about their business activities is frequently asymmetric. Due to
the high cost of giving small loans and reaching low-income clients, it has been argued that
institutions that target low-income clients cannot break even. Therefore, to continue
providing financial services to low-income earners, these institutions must rely on
subsidies. This has two implications. First, there is no guarantee that subsidies can last
forever. Over time, therefore, institutions that cannot break-even collapse, which means
that at some point in time outreach can drop to zero. The second implication is that if the
clients and staff of an institution perceive it (the MFI) as temporary, they will be tempted to
defraud it.
In a study of 72 MFIs reported in the Micro-banking Bulletin, Conning (1999:72) finds that
it is more costly to serve lower-income clients than the higher-income clients, although as a
result of inadequate data it was not possible to determine whether the higher costs are due
to fixed or variable monitoring and delegation costs. Using anecdotal evidence, however,
the author concludes that the higher costs are due to variable costs attributed to monitoring
and delegation costs. Based on the theoretical and empirical evidence discussed above, it is
hypothesised that small loan size is negatively related to sustainability.
82
4.2.5 Lending interest rates
4.2.5.1 The concept and role
Although contested in the literature (see, for example, Jackson, 2003:4; Smithin, 2005), it is
generally accepted that the rate of interest is the price of borrowed money.25 To a financial
institution this rate is that charged to the institution when borrowing money or the rate the
institution charges when lending money to its clients.
Three different types of lending interest rates can be distinguished: nominal, effective and
real. The nominal lending interest rate is usually explicitly quoted by a financial institution,
while an effective lending rate includes the nominal interest rate plus other charges that are
directly associated with the loan granted (Ledgerwood, 1999; CGAP, 1996). Examples of
such charges are fees, commissions, etc. The real lending interest rates and the real
effective lending interest rates take into account the rate of inflation. Each of these lending
interest rates has different implications for sustainability and outreach of an MFI.
In classical economic theory interest rates adjust sensitively to allocate all available funds
for investment. In this instance it is a tool that links savings to investment. In other
instances the role of interest rates is to clear the loans market (Hoff and Stiglitz, 1990;
Stiglitz and Weiss, 1981). For example, an increase in the lending rate, apart from lowering
the demand for credit and outreach as it (credit) becomes more expensive, also induces an
increase in credit supply and investment. In the process the demand and the supply of credit
converge, the equilibrium condition is attained and the market clears. The converse is also
true, although as argued in Stiglitz and Weiss (1981), where there is credit rationing, the
market does not clear.
In the liquidity preference theory Keynes argues that the interest rate is a reward for parting
with liquidity. In this model the rate of interest is inversely related to liquidity preference.26
By implication, therefore, to counter liquidity preference, the interest rate should be raised.
25 See Johnson and Rogaly (1997) for the definition of the rate of interest, and Stiglitz and Weiss (1981) and Stiglitz and Hoff (1993) for a discussion of the purpose of the rate of interest. 26 Keynes uses the term liquidity preference to mean keeping significant sums in the sterile form of cash. Keynes assumes that people part with their savings only if offered an interest return.
83
However, this has been shown to be a fallacy, as interest rates are not the only factors that
affect liquidity preference. For example, safety and convenience of the institutions into
which the cash is placed are critical factors in liquidity preference.
Following the independence of a number of developing countries, lending interest rates
were used to allocate loans by artificially fixing them at below market rates (Hulme and
Mosley, 1996; Strauss Commission, 1996; Morduch, 1999; Robinson, 2001a). It was
argued that subsidised interest rates lower the cost of credit and increase credit supply to
boost economic growth and rural development. In Uganda targeted programmes have
included the Rural Farmers Scheme implemented through the then Uganda Commercial
Bank (UCB) during the late 1980s and early 1990s, the Entandikwa Credit Scheme
instituted in 1994, and the current loans extended by Microfinance Support Center Limited
(MSCL) (MOFPED, 2007).
There is, however, widespread evidence indicating that subsidised credit programmes lead
to massive problems that include: (1) lack of sustainability of the institutions that provide it
as a result of low lending rates; (2) high loan losses and low repayment rates; (3) limited
outreach because only a limited number of low-income farmers and enterprises are reached;
(4) widespread corruption; and (5) high cost of administering small loans (Adams and
Vogel, 1986; Otero and Rhyne, 1994; Rhyne, 1994; Hulme and Mosley, 1996; Strauss
Commission, 1996; Robinson, 2001a). Adams, Graham and von Pischke (1984) report that
the repayment rates of some of the subsidised credit programmes at one time dropped well
below 50 per cent; costs of subsidies ballooned; and there was widespread credit diversion
to the politically powerful away from the intended recipients. In a Costa Rica study by
Vogel (in Adams et al., 1984:133-145), the author demonstrates that ‘approximately 80 per
cent of bank agricultural credit and hence about 80 per cent of the subsidy went to large
farmers who received the largest 10 per cent of the loans, an indication that subsidised
credit programmes often fail to reach intended recipients.27 Low lending interest rates
charged also means that bank managers and staff had little incentive and capacity to expand
loan portfolios. It has also been argued that subsidised lending rates are a disincentive to
savings mobilisation considered important for institutional sustainability and outreach (see
sub-section 4.2.3). 27 In this regard see also Hulme and Mosley (1996:7) and Robinson (2001a:59).
84
4.2.5.2 The implications of lending interest rates for sustainability and outreach
From the perspective of the banking sector, Stiglitz and Weiss (1981:393) argue that banks
making loans are concerned about the interest rate they receive on the loan, and the
riskiness of the loan although the interest rate a bank charges may itself affect the riskiness
of the pool of funds by either: 1) sorting potential borrowers or 2) affecting the actions of
borrowers. Both effects derive directly from the residual imperfect information which is
present in loan markets after banks have evaluated loan applications. When the price
(interest rate) affects the nature of transactions, it may not also clear the market, which
could lead to a lower outreach (discussed below).
To enable us investigate systematically the relationship between lending interest rates and
sustainability, as well as lending interest rates and outreach, we use operational self-
sufficiency (OSS) defined in this study as (see equation 3.10),
OSS = [[(NL*AvLz*i)(1-γ)]+Z]/[FINCO+OPCO+LLP] -------------------------------------- 4.3
where OSS is a sustainability measure, NL is the number of loans disbursed by an MFI
during a defined period, AvLz is the average loan amount disbursed to clients over the
same period, i is the average nominal lending rate charged by the MFI, γ is the rate of
default, Z is other operating income, FINCO is financing cost, OPCO is operating costs,
including the cost of depreciation, and LLP is loan loss provision (see Chapter Three).
To identify the relationship between i and outreach in a systematic manner, let NL in
equation 4.3 be expressed in terms of the number of clients i.e., single borrowers (NSB),
the number of repeat borrowers (NRB) and the average number of times (ANT) repeat
borrowers take loans in a defined period i.e. NL = NSB+(NRB*ANT). Note that outreach
also includes non-borrower clients (NNB). Substituting NL by NSB+NRB*ANT in
equation 4.3 gives:
OSS = [[((NSB+NRB*ANT)*AvLz*i)][1-γ]+Z]/[FINCO+OPCO+LLP] -------------------4.4
85
From equation 4.4, i can affect sustainability and outreach through four broad channels.
First, as argued in 4.2.1 and assuming other factors are held constant, a change in i directly
affects OSS and through OSS affects outreach (NSB+NRB*ANT). For example, an
increase in i leads to an increase in OSS and outreach, assuming the profit resulting from an
increase in OSS is invested in expanding outreach. The converse may also be true.
Evidence from Asia and Latin America has shown that financial institutions that charge
commercial rates have attained sustainability and reached millions of low-income clients.
Those that charge subsidised lending rates cannot achieve wide outreach (Chaves and
Gonzalez-Vega (1996:70).
Chaves and Gonzalez-Vega (1996:70) further argue that the authorities in Indonesia have
recognised that it is more useful, in terms of development, to promote organisations that
provide financial services at market prices, in a permanent fashion, rather than to sponsor
subsidised credit programmes with a short-lived impact. They find that charging a
sufficiently high rate, positive in real terms, to cover costs and risks, was a more critical
element in ensuring the success of the MFIs, both in terms of sustainability and outreach.
This implies that MFIs should not only consider nominal interest rates while pricing their
loans, but a broad range of charges summed up in Z, costs incurred in generating
operational revenue, cost of default, and cost of inflation and other funding subsidies (see
Otero and Rhyne, 1994; CGAP, 1996; Swaminathan, 1991; Braverman and Guasch, 1986;
Adams and Vogel, 1986; Hulme and Mosley, 1996; and Adams and Von Pischke, 1992).
Conning (1999:52) argues that “The ‘institutionist’ or ‘financial systems’ approach that has
become increasingly dominant (at least officially) at the World Bank and in much of the
donor community, exhorts microfinance providers to aggressively pursue sustainability
through raising interest rates and lowering costs.” He also finds that lower-income clients
also pay higher interest rates on loans than higher-income clients (see CGAP, 2004:3).
The second channel through which i affects sustainability and outreach is through the
repayment rate. In the first channel it is implicitly assumed that an MFI can increase the
lending rate progressively without any problem. This is not often true. As Stiglitz and
Weiss (1981:393) argue, in imperfect financial markets, at higher interest rates borrowers
with good projects are unlikely to borrow and mainly bad borrowers may be attracted. This

86
can exacerbate the default rate (γ) and cause the flow of revenue to the institution to reduce.
Therefore, in the long term higher lending interest rates could lead to a lower sustainability
and outreach. In this case lending rates are negatively related to sustainability and outreach.
The third channel through which i can affect sustainability and outreach is through the
demand for loans. In the first channel it is argued that i is positively related to sustainability
and outreach. This argument assumes that the demand for credit is given or highly inelastic
and there is no credit rationing arising from information asymmetry in credit markets
(Zeller, 1994; Hoff and stiglitz, 1990; Stiglitz, 1990; and Stiglitz and Weiss, 1981).
Following classical arguments, lending rates are negatively related to the demand for loans.
This means that as lending interest rates increase, the loans become more expensive, which
discourages demand. Lower demand for credit leads to a reduction in outreach and revenue
generated by the institution, unless the average loan size increases to compensate for the
decline in the amount of loans disbursed. The extent to which a higher lending interest rate
discourages borrowing and leads to a lower level of sustainability and outreach, however,
depends on the elasticity of demand for credit and the availability of alternative sources of
external financing (Morduch, 1999).
Finally, and related to the preceding argument, is the cost channel. Hulme and Mosley
(1996:19) derive break-even lending rates to show that costs have implications on lending
rates (see Chapter Three, equation 3.8). Following their argument, in market economies
costs affect sustainability and outreach through their effects on lending rates.
The above arguments indicate that the relationship between lending rates and sustainability
and outreach is an empirical question. For the purpose of this study, holding other factors
constant, it is hypothesised that lending rates are positively related to sustainability and
outreach, because the higher the lending rate, the more the loan income that can be
generated and loaned out to reach more clients.
87
4.2.6 Repayment rates and the implications for sustainability and outreach
One of the remarkable developments in the microfinance industry across the world is the
high repayment rates recorded by MFIs such as BancoSol in Bolivia, Grameen Bank in
Bangladesh, and BRI in Indonesia (Cull et al., 2006; Morduch, 1999; Ghatak, 1999; Bhatt
et al., 1998; Sharma and Zeller, 1997; and Jain, 1996). This development has been
attributed to a variety of factors, one of which is the innovative ways used by MFIs to
deliver financial services. Chaves and Gonzalez-Vega (1996:70) argue that the almost
endemic lack of access on the part of marginal clients to formal financial services is
explained at least in part, by those (usually local) agents who have inexpensive access to
information and monitoring mechanism, to ensure reasonable repayment rates. This
argument underpins the crucial role the availability of relevant information plays in
ensuring high repayment rates. It also implies that the extent of information asymmetry in a
credit market and therefore its relationship with sustainability and outreach can be captured
by the level of repayment rates.
In the analysis of the implications of lending interest rates for sustainability and outreach in
sub-section 4.2.5, repayment rate is captured in the form of default rate (γ) in equations 4.3
and 4.4. Generally a repayment rate is defined as that proportion of the loan lent out
(principal) that is eventually recovered (Ledgerwood, 1999). The repayment rate is the
inverse of the default rate. Either of the rates indicates the extent to which an MFI is able to
recover its loan portfolio. For example, a repayment rate of 100% or a default rate of 0%
means that the MFI can fully recover the money it lends out.
The relationship between repayment rate and sustainability and outreach can be assessed
through two channels: direct effects on OSS as AvLz *NL and repayment rate increase, and
through its effects on OSS via cost (note that a low repayment rate imposes a cost on the
MFI as the portfolio is not being recovered). In both of these cases the effects of the
repayment rate on outreach are through OSS. In equation 4.4 an increase in γ (a decrease in
the repayment rate) leads to a lower OSS and vice versa, assuming that disbursed loans are
the only or the major source of income. This means that the repayment rate is positively
related to sustainability.
88
The second channel through which the repayment rate affects sustainability and outreach is
via costs, as already argued. In equation 4.4 γ is negative, which means that the default rate
is a cost to the institution. The converse is also true (see sub-section 4.2.7).
Empirical research has underlined the contribution of high repayment performance in the
success or failure of an MFI. Chaves and Gonzalez-Vega (1992) attribute the success of a
significant number of MFIs in Indonesia to high repayment or low arrears rates. Pattern and
Rosengard (1991:1) find that the long-term loan loss ratios for BRI-unit desa and BKK
were only 1.35 and 1.98 percent respectively. Yaron (1992), Gurgand et al. (1994) and
Hulme and Mosley (1996) have also underscored the importance of high repayment or low
default rates in institutional performance.
However, as the experience of Grameen Bank in Bangladesh shows, high repayment rates
are only a necessary but not sufficient condition for sustainability. In this study the effects
of repayment rate are captured via costs and the disbursed loan amounts, since they are
highly correlated, as argued above.
4.2.7 Costs and the implications for sustainability and outreach
Literature identifies information asymmetry as one major source of costs to the institution
providing financial services. For example, Steel et al. (1997:818) argue that problems of
imperfect information characterize low-income economies where economy-wide
information flows are limited and financial information is lacking or costly to obtain. Poor
information systems raise the cost to formal institutions of acquiring information on any but
the largest clients. Hoff and Stiglitz (1990:237) argue that the new views of rural credit
markets are based on the following three observations: 1) borrowers differ in the likelihood
that they will default, and it is costly to determine the extent of the risk for each borrower –
the screening problem; 2) It is costly to ensure that borrowers take those actions which
make repayment most likely – the incentive problem; 3) it is difficult to compel repayment
– the enforcement problem. Similarly, Udry (1990) argues that two organizations features
have received particular attention in the literature on credit markets, one of which is the
pledging of collateral in exchange for the receipt of a loan that directly reduces the cost to
the lender of a default on the loan. The collateral serves to reduce the moral hazard
89
associated with lending in credit markets with widespread information asymmetry. These
arguments underpin a strong relationship between the existence of imperfect information
and cost.
There are various definitions of cost. Nicholson (1995:344) distinguishes at least three
different notions of cost: opportunity cost, accounting cost and economic cost. While these
are common notions of cost in standard microeconomics text books, the literature on
microfinance has focused more on transaction cost (Johnson and Rogaly, 1997; Von
Pischke, 1991). For this reason the rest of this sub-section focuses more on transaction cost.
Johnson and Rogaly (1997) define transaction costs as costs other than interest repayment
and they include cost of travel, opportunity cost, costs due to bribes or ‘kickbacks,’ etc.
Von Pischke (1991:11) defines transaction costs as the costs of establishing and conducting
financial relationships and they include costs incurred in marketing and client mobilisation,
credit appraisal, security arrangements to protect cash, documents and other data, recording
systems for transaction processing and decision making. These costs can be divided into
two: costs to the institution providing the financial services and the costs to the clients
accessing the financial services.
In the context of this study costs can broadly be defined as the expenditure incurred for the
attainment of a goal (Free Dictionary website: http://www.thefreedictionary.com/costs;
Investorwords.com website: http://www.investorwords.com/1148/cost.html both visited on
18 December, 2006). In equation 4.4 reproduced below as equation 4.5 and in the context
of this study, these costs are FINCO, OPCO and LLP. Their value is the denominator in the
OSS definition.
OSS = [[((NSB+NRB*ANT)*AvLz*i)][1-γ]+Z]/[FINCO+OPCO+LLP] -------------------4.5
From equation 4.5 and following arguments made in sub-section 4.2.5, costs affect OSS
both directly and indirectly. For instance, an increase in costs leads to a decrease in OSS
and by extension it leads to a decrease in outreach, and vice versa. This is a direct effect of
cost on OSS and indirect effect on outreach. Costs can also affect sustainability and
outreach through their effects on the demand for loans, as argued in sub-section 4.2.5. This
is an indirect effect of cost on OSS and outreach.
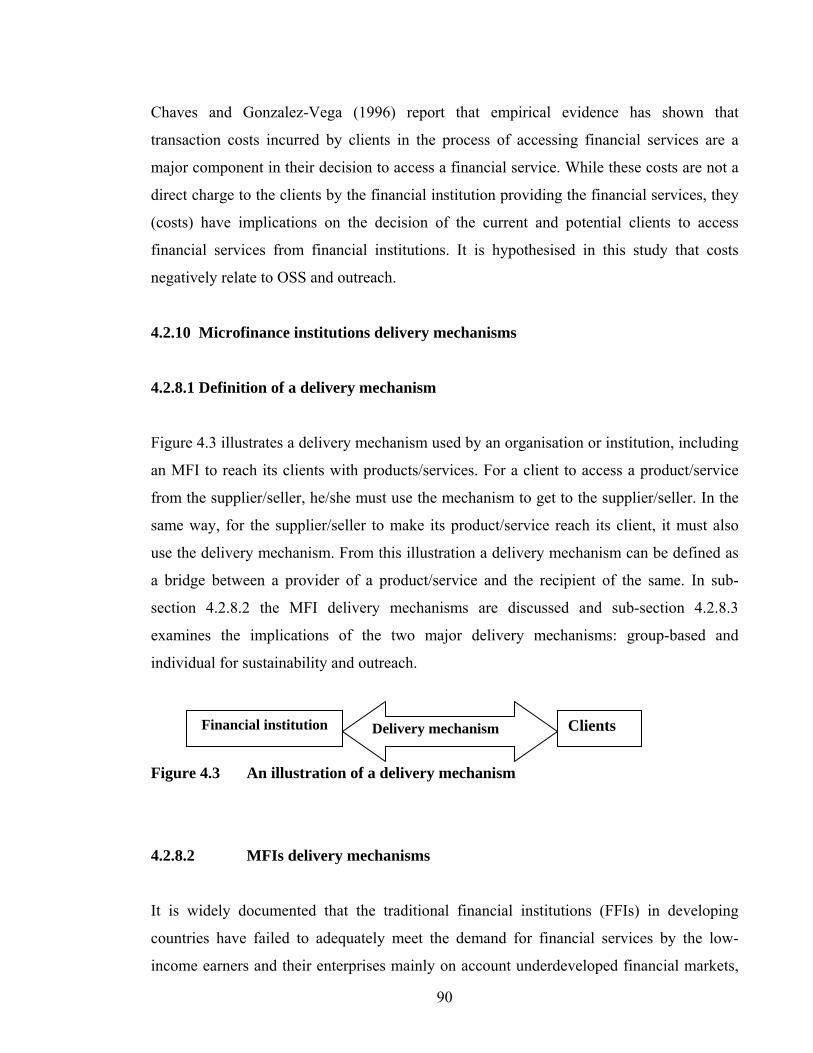
90
Chaves and Gonzalez-Vega (1996) report that empirical evidence has shown that
transaction costs incurred by clients in the process of accessing financial services are a
major component in their decision to access a financial service. While these costs are not a
direct charge to the clients by the financial institution providing the financial services, they
(costs) have implications on the decision of the current and potential clients to access
financial services from financial institutions. It is hypothesised in this study that costs
negatively relate to OSS and outreach.
4.2.10 Microfinance institutions delivery mechanisms
4.2.8.1 Definition of a delivery mechanism
Figure 4.3 illustrates a delivery mechanism used by an organisation or institution, including
an MFI to reach its clients with products/services. For a client to access a product/service
from the supplier/seller, he/she must use the mechanism to get to the supplier/seller. In the
same way, for the supplier/seller to make its product/service reach its client, it must also
use the delivery mechanism. From this illustration a delivery mechanism can be defined as
a bridge between a provider of a product/service and the recipient of the same. In sub-
section 4.2.8.2 the MFI delivery mechanisms are discussed and sub-section 4.2.8.3
examines the implications of the two major delivery mechanisms: group-based and
individual for sustainability and outreach.
Figure 4.3 An illustration of a delivery mechanism
4.2.8.2 MFIs delivery mechanisms
It is widely documented that the traditional financial institutions (FFIs) in developing
countries have failed to adequately meet the demand for financial services by the low-
income earners and their enterprises mainly on account underdeveloped financial markets,
Financial institution Clients Delivery mechanism
91
information asymmetry, high cost of information gathering and lack of physical collateral
(Gine and Karlan, 2006; Schreiner and Woller, 2003; Vaessen, 2001; Robinson, 2001a;
Paxton, Graham and Thraen, 2000; Ghosh et al., 1999; Morduch, 1999; Sharma and Zeller,
1999, 1997; Hollis et al., 1998; Bose, 1997; Otero and Rhyne, 1994; Hoff and Stiglitz,
1990). Attempts by donors and various governments of developing countries since the
1950s to expand access to financial services for low-income earners have also not yielded
desired results (Morduch, 1999; Adams et al., 1984).
The emergence of microfinance institutions with innovative delivery mechanisms has,
therefore, been received as a welcome development. For example, Navajas et al.
(2003:748) contend that the introduction of innovative lending methodologies and the
achievement of economies of scale were key determinants of the expansion of the
population of borrowers reached in Bolivia by MFIs. The authors also argue that some
institutions established with donor funds have become self-sufficient and even profitable.
Otero and Rhyne (1994:117) identify four leading methodologies for providing financial
services to micro-enterprises: solidarity group-based lending, credit unions, village banking
and transformation lending. Ledgerwood (1999) identifies two major lending
methodologies: individual and group-based lending, while Conning (1999) and Cull et al.
(2006) identify three lending methodologies: individual, group and village banking.
A critical analysis of the four leading lending methodologies identified by Otero and Rhyne
(1994) reveals that credit unions, and to a certain extent village banking, would qualify to
be regarded as institutions rather than as a lending methodology because they (credit unions
and village banking), may employ either individual and/or group-based lending methods.
Transformation lending is not widely used (Reed and Befus, 1994). For these reasons, the
rest of this sub-section focuses on two categories of delivery mechanisms: group-based and
individual.
(a) Group lending methodology
In this method borrowers in a group co-sign for loans to mitigate the problems created by
informational asymmetry between the lender and the borrower, and therefore have
92
incentives to monitor each other and to exclude risky borrowers from participation without
necessarily demanding formal collateral (Morduch, 1999; Hollis and Sweetman,
1998:1875; Otero and Rhyne, 1994; Breverman and Guasch, 1986). In so doing, costs of
loan appraisal, recovery and enforcement are also reduced.
There are two widely known forms of group-based lending mechanisms: the Grameen Bank
model (reviewed in 2002 and now called Grameen Generalized System (GGS) or the
Grameen Bank II to distinguish it from the Grameen Classic System (GCS) or Grameen
Bank I), and the solidarity group model pioneered by Accion International (Yunus, 2002;
Morduch, 1999; Ledgerwood, 1999; Berenbach and Guzman, 1994). The basic tenet of
both of these group-based lending mechanisms is that services are provided to or through a
group, and the major form of loan contract is joint liability (Gine and Karlan, 2006; Van
Tassel, 1999; Morduch, 1999; Ghatak, 1999; Aghion, 1999).
In the GCS groups are formed voluntarily and loans are made to individuals, but all
members are liable for loan repayment. The group consists of five borrowers, and when
lending, loans are first granted to two, then to the next two, and then to the fifth member of
the group. Eight groups combine to form an economic group, which holds a meeting with
bank staff on a weekly basis. This is designed to increase the caseload, that is, the number
of clients handled by a bank staff member in order to benefit from economies of scale. If
one member defaults, all the members in the group are denied subsequent loans. The
mechanism takes advantage of the local information and “social assets” that are at the heart
of local enforcement mechanisms.
In the GGS several rules and requirements in the GCS have been relaxed. These include
dropping i) some loans, such as general and seasonal loans; ii) group fund; iii) branch- and
zone-wise wide loan ceiling; iv) fixed size weekly instalment; and v) group liability that
compels every member to repay a loan in time or else the rest of the group members repay
the delinquent loan, or denial of future access to loans (Yunus, 2002).
The BancoSol solidarity group-lending model differs in some respects from the Grameen
Bank model. First, it focuses on urban banking. Second, the loans are made to all individual
members simultaneously, and a solidarity group is comprised of three to seven persons.
93
Repayment schedules and loan durations are flexible, allowing some borrowers to make
weekly repayments and others to do so monthly. Borrowers in BancoSol are better-off than
those in Grameen Bank, and the loans are larger.
Over the years both the Grameen Bank and BancoSol lending models have been adapted in
various countries, and they can be distinguished by various characteristics (see Yunus,
2002; Robinson, 2001a; Morduch, 1999; Yunus and Jolis, 1999; Berenbach and Guzman,
1994; and Robinson, 1992a for an extensive analysis of these characteristics).
Yunus and Jolis (1999) argue that the idea of group-based lending was created to ensure
successful operations of credit delivery and recovery (loan repayment) from the poor who
could not access these services from the formal financial sector, partly because of their
inability to provide the required physical collateral (Schreiner and Woller, 2003:1569). The
methodology was designed after discovering that, individually, a poor person feels exposed
to all kinds of hazards. From the client’s perspective, group membership gives a feeling of
protection as it provides group support, which Schreiner and Woller (2003:1569) call social
capital. From the lending institution’s perspective, group membership smoothes the
behavioural pattern, creates pressure and makes the borrower more reliable. This tendency
reduces moral hazard (hidden actions)28 problem and enhances loan repayment.
The group-based method also provides the MFI with a platform to shift the supervision of
operational activities to the group, thereby reducing the task of the MFI worker and cost of
loan appraisal and administration, which have been major constraints in credit delivery to
low-income earners. For example, the group does the appraisal of the applications for a
loan and approves it. In the process the members feel morally responsible for the loan
repayment, so that if any member falls in arrears, the group takes responsibility (relaxed in
GGS) to put pressure on the individual to repay or the group repays the loan.
28 Mas-Colell et al. (1995:477) argue that the literature has traditionally distinguished between two types of informational problems: those resulting from hidden actions called moral hazard, and those resulting from hidden information called adverse selection. According to Darst (2001:228), “…Moral hazard may arise when a principal cannot observe all of the actions of an agent after a contract has been concluded, thus creating the possibility that the agent may act in ways that run counter to the interests of the principal.” Dutta (1999:293) argues that moral hazard arises in insurance and refers to the fact that a person who has insurance coverage will have less incentive to take proper care of an insured object than a person who does not (see also Mas-Colell et al., 1995:477). In this study Smokestack’s (2001) broader definition of moral hazard is adopted.
94
(b) Individual lending methodology
In the individual lending approach services are delivered directly to individuals and the
MFIs use local agents and community leaders to capture information about borrowers in
their community (Chaves and Gonzalez-Vega, 1996). In this way the gravity of information
asymmetry is reduced as well as the cost of information gathering, while enhancing the
loan repayment rate. A borrower also provides collateral that is loosely defined, allowing
staff to increase loan size for reliable borrowers who may not be able to fully back loans
with traditional assets such as land titles (Morduch, 1999:1577). For instance, in Uganda
the common collateral MFIs accept is a chattel. Chaves and Gonzalez-Vega (1996:66)
argue that the individual lending method uses local information and enforcement
mechanisms as key components of the design of the service delivery, which renders the
need for group formation redundant.
The methodology also uses less sophisticated methods of loan appraisal compared to those
used by the traditional financial institutions. For example, loan applications are no more
than one page and approvals are decentralised (Otero and Rhyne, 1994:15). Loan sizes and
terms increase gradually, and staff of the institution are encouraged to develop an intimate
relationship between the clients and themselves (Ledgerwood, 1999:67; Morduch, 1999).
The method also combines some elements of the practices of the traditional formal
financial institutions with those of informal financial providers such as moneylenders,
which lowers transaction costs for both the lenders and borrowers (Schoombee, 1998:389).
4.2.8.3 The implications of MFI delivery mechanisms for sustainability and outreach
There is a lot of literature assessing the implications of MFI delivery mechanisms for
sustainability and outreach. This sub-section surveys the relevant literature on the
implications of group-based and individual-based lending for sustainability and outreach.
(a) Group-lending methodology
Ghatak (1999) shows that joint liability credit contracts used by group-based lending
schemes can achieve high repayment rates even when borrowers have no conventional
95
collateral to offer. Where it was found absolutely necessary to rely on any other form of
collateral than joint liability, the potential borrower is asked to pledge collateral substitutes
such as chattels (Rhyne and Otero, 1992:1562; Otero and Rhyne, 1994). This shift from
relying on the traditional collateral to collateral substitutes has the potential effect of
increasing outreach directly and indirectly through cost reduction, improved repayment
rates and institutional profitability.
Similarly, Navajas et al. (2000:335) argue that a lender that does not need physical
collateral to judge creditworthiness could serve poorer clients and achieve deeper outreach,
ceteris paribus, than a lender that requires physical collateral. Borrowers repay their loans
because of loan methodology, peer group and other social pressures, repayment incentives
and intensive collection methods (Robinson, 2001a:81; Hulme and Mosley, 1996:55).
Morduch (1999:1571) argues that in Bangladesh, where the MFIs serve millions of people,
although very few programmes require collateral, the major programmes report loan
repayment rates that are in most cases above 95 percent. The programmes have also proven
able to reach poor individuals, especially women, who are usually difficult to reach through
alternatives approaches. As to whether a group-based model performs better than the rest,
Aghion and Morduch (2005) and Morduch (1999) argue that the results are mixed.
The group-based lending model can also affect sustainability and outreach through its
effects on overall cost and, more particularly, the cost of information gathering. Ghatak and
Guinnane (1999) show that joint liability can achieve better screening to contend with
adverse selection, encourages peer monitoring to reduce moral hazard, gives group
members incentives to enforce repayment of loans, and reduces the lender’s audit costs for
cases where some group members claim inability to repay their loans.
Conning (1999:267) shows that peer groups enable fixed costs (such as cost of meetings,
training seminars and business) to be imposed on clients, while minimising the
programme’s overhead costs. These costs deter bad clients from participating in the
programme and increase the expected profits and sustainability for the good clients who
participate in the programme and obtain loans. The good clients have an incentive to repay
loans in order to obtain subsequent loans and avoid a bad credit rating. A group-based

96
method, thus, could lead to increased sustainability and outreach as it allows clients without
formal collateral to access loans; it reduces lending and recovery costs for the lending
institutions, and improves repayment rates. Lower costs can be translated into lower interest
rates to the clients, which can boost demand and increase scale (Valenzuela, 2002).
Hulme and Mosley (1996:27) argue that group lending is by far the most important form of
lending method that lenders can use compared to individual lending, because administrative
costs are reduced for the borrower and, secondly, the probability of default is reduced as a
result of peer pressure.
With respect to outreach, a study by Seibel and Parhusip (1998:81-83) established that a
group-lending methodology was a major factor in increasing the scale of outreach. The
authors compared the before and after effect of employing the group-based methodology
and found that in one year the number of clients increased by 69% when the institution
adopted a group lending methodology. Citing a widely held view, Gine and Karlan (2006)
observe that, because of its ability to overcome adverse selection and moral hazard
problems, the growth of the microcredit movement is attributed to the joint liability lending
methodology, which is consistent with the hypothesis of this study that a group-based
lending mechanism has a positive effect on OSS and outreach compared to an individual-
based lending mechanism.
(b) Individual lending methodology
Gine and Karlan (2006) and Morduch (1999) have argued that the role of group-based
lending has been exaggerated, because it is not the only mechanism that differentiates
microfinance contracts from standard loan contracts. The individual lending and other
microfinance methodologies also use dynamic incentives, regular repayment schedules and
collateral substitutes to help maintain high repayment rates. Thus, microfinance
institutions’ individual lending methodology also improves repayment performance
compared with standard loan contracts. Similarly, Chaves and Gonzalez-Vega (1996) have
argued that the demand for loans and deposit services is highly individualised, so much so
that individual financial services would probably be welfare improving for clients as
individuals than when in groups.
97
In line with Krahnen and Schmidt’s (1994), Stiglitz’s (1993a), Varian’s (1990), and Besley,
Coate and Loury’s (1993) arguments, Chaves and Gonzalez-Vega (1996:66) further argue
that “Loans through groups, ceteris paribus, impose transaction costs on individual
borrowers as the formation of the group and the implicit risk-sharing and opportunities for
moral hazard require significant bargaining and monitoring efforts on the part of the group
members.” In the same vein Gine and Karlan (2006:3) contend that one of the reasons why
the shift from group liability loans to individual loans has accelerated in the recent past is
because it is more costly for good clients.
Hulme and Mosley (1996:27-32) have also questioned the effectiveness of group-based
lending in ensuring loan repayment, arguing that group pressure and peer monitoring can be
effective only in small groups and where there is strong social cohesion. In large groups
and where social cohesion is weak or does not exist, group-based lending cannot effectively
ensure repayment. Using regression analysis on a sample of over 83 MFIs, they find that,
contrary to theoretical arguments in favour of group-based lending, the organisation of
borrowers in groups is neither necessary nor sufficient for success.
Citing Bratton (1996) and Paxton (1996b), Ledgerwood (1999:71) reports that, although
institutions employing the group-based methodology have better repayment rates than those
employing the individual-based, this is only in good years. In periods of crisis repayment
rates crash and in many cases there are widespread outright loan defaults (Rhyne, 2002). In
Grameen Bank, Jain (1996) finds that it is not group lending and joint liability that have
contributed to the high repayment rates recorded by the MFIs but rather the institutional
set-up, policies and enforcement mechanisms.
Adams and Vogel (1986:482) observe that the evidence of the effectiveness of group-based
lending in reducing costs both to the institutions and clients is mixed. They report that,
while group-based lending generally reduces loan transactions costs for borrowers, it has
had a less positive impact on the costs of the institutions providing the services, more
especially in terms of credit delivery and recovery. In the same vein Christen (1997:174)
argues that most successful group-based methodologies do individual business evaluations
for each member of the group and that the process accounts for a large part of the direct
98
operating cost. Additionally, group maintenance is costly in terms of extra visits to the
borrowers’ place of business.
Conning (1999:54-55) argues that a group-based methodology relies more on intensive loan
monitoring and social sanctions instead of the traditional collateral. However, these
practices can be costly. Intensive monitoring and delegation costs within the MFIs may
increase exponentially as services are extended to poorer clients (Also see Schreiner, 1999).
This could lead to a backward bending individual supply loan schedule and may lead to a
trade-off between sustainability and outreach. It could also lead to higher average loan
sizes, which are inconsistent with the low-income status of the majority of the MFI clients
and therefore could result in lower outreach.
In a study of eight MFIs in Indonesia Chaves and Gonzalez-Vega (1996) find that the
individual-based lending methodology was positively related to the success of MFIs,
because it significantly leads to reduced transaction costs to the borrowers, thereby
improving the quality of services rendered. The authors, therefore, conclude that individual
lending was less costly and a more suitable method of service delivery to poor clients
compared to group lending. Schadwinkel (2000) also reports the success of individual
lending for the CERUDEB in Uganda. These empirical findings are, however, inconsistent
with the hypothesis of this study that a group-based lending mechanism has a positive
effect on OSS and outreach compared to individual-based lending mechanism.
4.2.11 Age of the institution providing microfinance and the implications for sustainability and outreach
SEEP Network and Calmeadow (1995:29) identifies maturity of the institution as one of the
three key factors that influence the level of activities and operational costs. The others are
turnover of the loan portfolio (related to loan term) and average loan size. Categorising 72
programmes studied by age, lending method, target group and level of sustainability,
Morduch (1999:1588-89) finds that financial progress improves with the age of the
institution, which means that the older the institution, the higher the level of sustainability.
The age of the organisation also affects sustainability and outreach through accumulated
experience from learning by doing, the development of operating systems, experience and
99
training of staff, and the level of scale attained (SEEP Network and Calmeadow, 1995:29).
Hulme and Mosley (1996:21) argue that, when the number of borrowers or the loan
portfolio increases, the costs of operations are lowered due to economies of scale, and this
number increases with time. With lower costs two outcomes are likely: increased incentives
to bring in more clients and, second, improved financial performance that would build up
more capital for lending and thereby increase outreach. But as already argue in this
dissertation, scaling up also leads to higher costs. Therefore, the final effect on
sustainability and outreach depends on the net effect between the revenue generated from
increased scale of operations and the costs. Based on empirical findings reported above, it
is hypothesised in this study that age correlates positively with OSS and outreach.
4.2.10 Economic, social and political environment
The viability of financial markets depends on the economic viability of the clients it serves.
The main function of a depository financial intermediary is to mobilise savings from the
surplus sectors and channel it to the deficit sectors. This means that, on the one hand, there
must be savers who have funds that are of no immediate use and are willing to deposit them
with a financial intermediary and, on the other hand, there must be investors with viable
projects, but lack the necessary funds for investment. Financial markets also facilitate
transactions and play the role of providing insurance and money transfer services.
In most developing countries, and more especially in the agricultural sector, the capacity of
the people to save and invest is very low mainly, because of low returns on the economic
activities (Adams et al., 1984). Consequently, the demand for financial services is low, a
situation that is often not improved by low, and sometimes inappropriate, investment in
agriculture and other rural activities. Poor policy prescriptions and implementation is
another area where there is a major weakness. Policy regimes have often included distorted
exchange rate policies and price controls. These policies and the inherent risks in the
agricultural sector mean that the viability of the borrowers becomes seriously constrained,
because when they borrow, there is limited capacity to repay the loans. Similarly, the
lending institutions are constrained by the same economic factors (Valenzuela, 2002).
100
The case of Indonesia is a clear example of the importance of a suitable environment for the
success of MFIs. Chaves and Gonzalez-Vega (1996) report that Indonesia’s dynamic and
comparatively stable macroeconomic and political environments have offered an auspicious
climate for financial intermediation. The authors also report that the country had enjoyed
comparatively high rates of growth of output, rapid growth of rural incomes and a
significant level of poverty reduction. Numerous profitable investment opportunities
existed and physical infrastructure supported by heavy investment in public utilities had
been developed. Besides, domestic markets had become integrated and the country pursued
liberal trade policies.
Coupled with social cohesion in Indonesian communities and a favourable financial and
legal environment, the external factors played a significant role in the successful
performance of the majority of the MFIs in Indonesia. Similar results have been reported in
Gurgand et al. (1994:4), who in a study of six rural finance in institutions in Africa find that
a stable and liberalised economic environment is critical in achieving sustainability of RFIs.
Therefore, for outreach to be increased and sustainability to be improved, apart from the
determinants that have been identified and discussed above, the economic, social and
political environment within which the clients and institutions operate is a significant factor
as well, but these factors tend to affect all the institutions in the same environment more or
less in the same way. In this study they have not been modelled.
4.3 Analysis of the relationship between sustainability and outreach
The relationship between sustainability and outreach is another area that has been intensely
debated in the microfinance literature. As noted by Woller and Schreiner (2006:2), the
often expressed fear in debate of the relationship between sustainability and outreach is that
a focus on financial self-sufficiency will divert MFIs’ attention and resources away from
their core objective of poverty alleviation and core poor market (“Mission drift”). This fear
is attributed to several reasons. The first is cost related. It is argued that the poor tend to
concentrate in rural areas, which are isolated with very poor physical infrastructure and
financial markets. As such, they are costly to reach, an argument also advanced in
Schreiner (1999) and Johnson and Rogaly (1997).

101
The second argument advanced is related to risk, which in the formal market tends to be
mitigated by the availability of physical collateral. Apart from engaging in economic
activities perceived to be highly risky, low-income earners tend to lack the physical
collateral required by the traditional formal financial institutions (Zeller, 1994).
Related to the issue of risk and cost is the information asymmetries prevalent in poor
communities. Absence of credit information means chances of moral hazard and adverse
selection are very high (Navajas et al., 2003).
Finally, there is the question of loan size. Hulme and Mosley (1996) find that there is a
negative relationship between loan size and cost of administration. The smaller the loan
size, the higher the cost of administering the loan. As a result, high costs mean low revenue
unless there are substantial economies of scale.
Despite the above arguments which suggest existence of a negative relationship between
expanding access to financial services for low-income earners and financial sustainability,
some authors believe that such an inherently dichotomous relationship does not exist
(Woller and Schreiner, 2006; Christen with Drake, 2002; Schadwinkel, 2000; Schreiner,
1999; Christen, 1997).
Based on the six aspects of outreach, Schreiner (1999:13), for example, argues that the
provision of microfinance hinges on the effects of length on its worth to clients, cost to
clients, breadth, depth and scope. More length requires either more profit for the lender or
more donations. All else constant, more profit for the lender requires higher prices and thus
implies more cost to clients, less profits to clients, and less net gain per client. In practice,
the drive for profit for the lender also tends to reward innovations that either increase worth
or decrease costs to clients. The drive for profits for the lender may also lead to long-term
increases in breadth and length that may off-set short-term decreases in net gain per client.
Donations provide weaker incentives for innovation than profits because donors do not
reward innovation and punish stagnation as consistently as clients because their own
welfare is not directly at stake. Donations do, however, reduce the need for higher prices,
which also else reduces the cost to clients and increases net gain per client.
102
Schadwinkel (2000:14) finds that commercial orientation and the commitment to improve
socio-economic status of low-income population are not necessarily contradictory
objectives. By providing innovative financial products and adopting methodologies tailored
to the needs of clients, it is possible for an institution to serve poor market segments
sustainably. In a related study Paxton and Fruman (1998) find that there is a strong positive
correlation between the depth of outreach and sustainability. Similarly, Seibel and Parhusip
(1998:81) also find a positive relationship between sustainability and outreach.
Examining the objective of the MFI, Ledgerwood (1999:34) notes that,
Depending on which target market is selected, there are consequences to the MFI’s financial position, because costs will be affected. In the short run, there are trade-offs involved in the decisions about objectives and how to reach them…For example, if the MFI’s objective is to reach the very poor with financial and other services, its target market will differ from an MFI that wishes to serve [the] economically active poor with only financial services.
As implied in the above quote, providing financial services to the very poor has
implications for the sustainability of the financial institution in question. If providing
financial services to the very poor leads to loss of sustainability, that loss is the opportunity
cost of serving the poor, which is a net benefit to the clients because of access to financial
services. When the clients benefit, the economy benefits, although the MFIs may be
unsustainable. Often however, the benefits of providing financial services to the poor are
assumed to be less than the costs of doing so. In this regard, subsidies have been
encouraged to fill the gap.
However, in most of these empirical studies the focus is on the relationship between
sustainability and depth of outreach or more broadly, the social benefits of microfinance.
An analysis of the relationship between sustainability and scale of outreach measured by
the number of clients has received limited attention, hence the empirical focus of this study.
103
4.4 Summary and Conclusion
In this chapter the determinants of sustainability and outreach have been identified and
discussed as well as the relationship between sustainability and outreach.
The determinants of sustainability and outreach discussed are summarised below.
1) Sources and uses of funds: It is hypothesised that the sources of funds are positively
related to OSS and outreach, and the uses are negatively related to OSS and
positively to outreach.
2) Governance: Two aspects of governance identified are effective governance,
hypothesised to be positively related OSS and outreach, and the legal status,
hypothesised to be positively related to OSS and outreach, if the MFI is a SACCO
or an MDI, and negatively related to OSS and positively to outreach, if the MFI is
an NGO. In both cases, the reference point is a private company.
3) Savings mobilisation is hypothesised to be positively related to OSS and outreach.
4) Average loan size is hypothesised to be positively related to OSS and negatively to
OUTR.
5) Various interest rates are discussed in the chapter, and it is hypothesised that real
effective lending interest rate is positively related to OSS and outreach.
6) Repayment rates: These are argued to be positively related to OSS and outreach.
However, it is also argued that their effects on OSS and outreach can be captured
via costs and disbursed loans. As a result, repayment rate has not been explicitly
modelled as an explanatory variable both in the sustainability and outreach models.
7) Cost of loans is hypothesised to be negatively related to OSS and outreach.
104
8) Delivery mechanisms: Two delivery mechanisms are identified and discussed,
namely group-based and individual-based. Using the latter as a reference point, it is
hypothesised that group-based mechanism is positively related to OSS.
9) The age of the MFI is positively related to OSS and outreach.
10) Economic, social and political environment. This is discussed as a broad category of
determinants of sustainability and outreach, but has not been modelled.
The relationship between sustainability and outreach is noted as one of the most intensely
debated aspects of microfinance. One of the fears often expressed is that a focus on
financial self-sufficiency will divert MFIs’ attention and resources away from their core
objective of poverty alleviation and core poor market. This implies that sustainability and
outreach could be conflicting objectives. It is hypothesised in this study that OSS and
OUTR are positively related.
105
CHAPTER FIVE: THE THEORY OF THE FIRM, SUSTAINABILITY AND
OUTREACH
5.1 Introduction
Whatever the purpose of specifying, estimating and testing a model, there are two aspects
to it: the end (outcome), which can be called the output, and the means, which can be called
the inputs (determinants). Chapter Three presents the output in the sustainability model
(OSS)) and that of the outreach model (OUTR)) served by an MFI in a specified period.
The determinants of sustainability and outreach are analysed in Chapter Four.
Hulme and Mosley (1996: 55) argue that the design features of MFIs can be seen as inputs
into a production function whose output is sustainability, while Chaves and Gonzalez-Vega
(1996:66) state:
We adopt the criteria used by Yaron (1992) to judge success. The first criterion is the number of clients served and the quality of services provided. This is an outreach objective…The second criterion is self-sustainability. This requires that the RFI be able to generate enough income to cover at least the opportunity cost of all the factors of production and assets (e.g., funds) under its command…
Following Hulme and Mosley (1996) and Chaves and Gonzalez-Vega (1996), therefore, an
outreach model can be constructed on the basis of a production function, and a
sustainability model can be constructed on the basis of a profit function defined and
discussed in sections 5.3 and 5.4 respectively.
Chapter Four identifies the determinants of sustainability and outreach with reference to
different theories. For example, the theory of information asymmetry identifies the delivery
mechanism as a determinant of outreach (Gine and Karlan, 2006; Stiglitz and Weiss, 1981;
Hoff and Stiglitz, 1990), while the agency theory explains the relationship between
sustainability and corporate governance, and outreach and corporate governance.
Notwithstanding the above, the theory central to the analysis in this dissertation is the
theory of the firm. In particular, this study has adopted the production function as it helps in
a systematic identification of the factors of production and how they are related to the
106
respective outputs, which have been identified in this study as sustainability and outreach.
Previous studies in microfinance have not used this approach to identify the determinants of
sustainability and outreach.
The layout of the rest of the chapter is as follows. Section 5.2 reviews the concept of the
firm and theory of the firm in order to identify the widely accepted definition of a firm;
provides a benchmark for equating a firm to a microfinance institution; and outlines the
major views on what constitutes the theory of the firm. To specify the relationship between
the inputs and the outputs, section 5.3 presents and discusses the neoclassical production
function, and section 5.4 presents and discusses the profit function. Section 5.5 describes a
microfinance institution and how it operates, citing practical experiences. Section 5.6 then
argues that a microfinance institution is not significantly different from the firm in the
theory of the firm. An application of the profit function to the sustainability model and an
application of the production function to the outreach model is presented in sections 5.7 and
5.8 respectively. Section 5.9 is a summary of the determinants of sustainability and
outreach as well as the hypotheses tested in this study. Section 5.10 concludes the chapter.
5.2 The concept and the theory of the firm
5.2.1 The concept of the firm
Case and Fair (2002:133) describe a firm as an entity that purchases inputs (labour, capital,
natural resources, etc.) to produce and sell outputs (useful things) ranging from computers
to string quartet performances (see also Intrilligator et al., 1996:275). Consistent with Case
and Fair’s (2002) definition of the firm, the neoclassical economists define the firm as a
production unit whose single goal is profit maximisation conditioned on a given production
function and a market structure (Williamson, 1981).
Kasper and Streit (1998:258-9) argue that a firm is an economic organisation, with more or
less durable planned arrangements set up to pool productive resources in order to pursue
one or several shared material purposes. These resources are coordinated within some kind
of hierarchical order by a mix of institutions and commands, with the aid of human
resource input. See also Nicholson (1995) and Rutherford (1993) for a similar definition of
107
what a firm is. Institutions and commands are defined here as man-made rules which
constrain possible arbitrary and opportunistic behaviour in human interaction (Kasper and
Streit, 1998:28). The physical resources of an industrial firm consist of tangible things such
as plant, equipment, land, natural resources, raw materials, semi-finished goods, waste and
by-products, and even unsold stock of finished goods (Penrose, 1995:24). Penrose
(1995:24) further states that “Strictly speaking, it is never resources themselves that are the
‘inputs’ in the production process, but only the services the resources can render.”
Penrose (1995:9) further argues that “A ‘firm’ is by no means an unambiguous clear-cut
entity; it is not an observable object physically separable from other objects, and it is
difficult to define except with reference to what it does or what is done within it.” The
author suggests three ways in which a firm can be defined: (1) a basic unit for the
organisation of production, more especially in market economies; (2) an administrative
organisation; and (3) a collection of productive resources.
Mas-Colell et al. (1995:127) describe a firm as a productive unit that must also represent
the productive possibilities of individuals and households, while Joskow (2006:4) notes that
firms were conceptualised as production sets that defined the technologically most efficient
opportunities to transform inputs into outputs.
The above discussion of what a firm is can be seen in summary form in Figure 5.1. Viewed
as an administrative unit, a firm is represented by Block II. However, viewed more broadly,
a firm is all four blocks, i.e. a unit mobilising external factor inputs, an organisation, a
producer and seller of goods and services, a productive unit and a durable administrative
unit. It is also significant to note that economists hardly agree on how to conceptualise a
firm (Harrod, 1939; Hawkins, 1979; Williamson, 1981; Douma and Schreuder, 1998;
Wikipedia, the Free Encyclopedia). As Foss et al. (1998:1) state, for a long time there has
been economics with the firm but not economics of the firm.
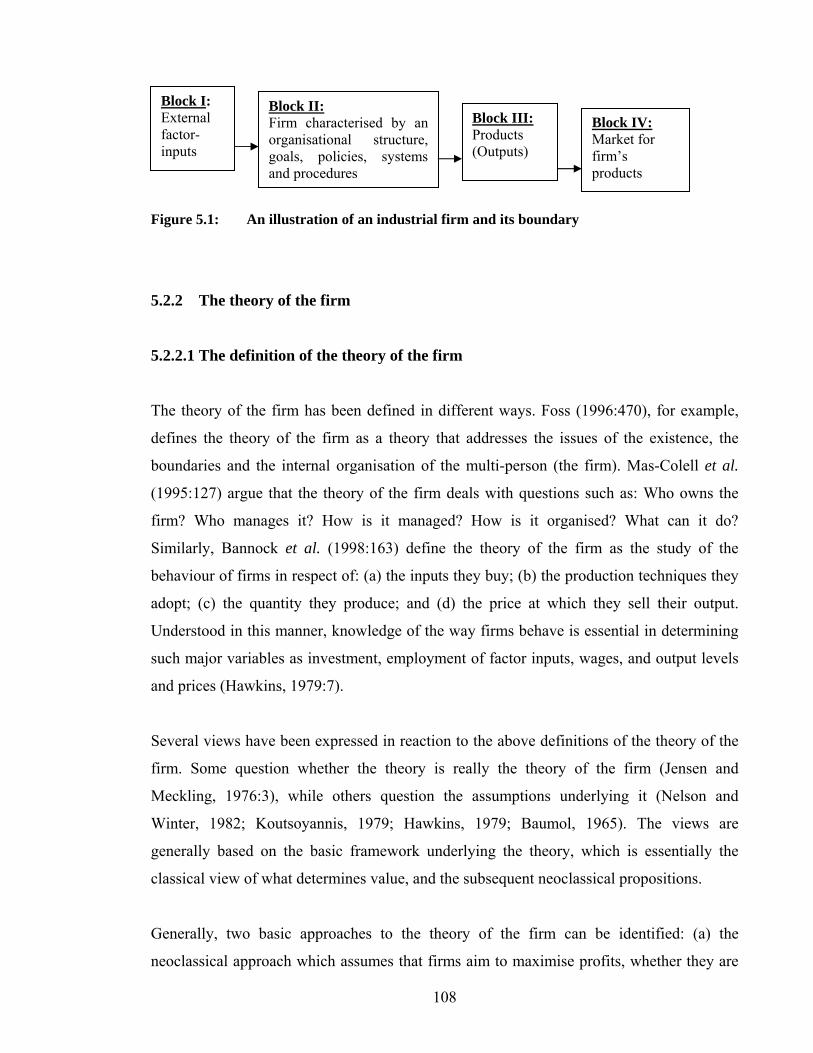
108
Figure 5.1: An illustration of an industrial firm and its boundary
5.2.2 The theory of the firm
5.2.2.1 The definition of the theory of the firm
The theory of the firm has been defined in different ways. Foss (1996:470), for example,
defines the theory of the firm as a theory that addresses the issues of the existence, the
boundaries and the internal organisation of the multi-person (the firm). Mas-Colell et al.
(1995:127) argue that the theory of the firm deals with questions such as: Who owns the
firm? Who manages it? How is it managed? How is it organised? What can it do?
Similarly, Bannock et al. (1998:163) define the theory of the firm as the study of the
behaviour of firms in respect of: (a) the inputs they buy; (b) the production techniques they
adopt; (c) the quantity they produce; and (d) the price at which they sell their output.
Understood in this manner, knowledge of the way firms behave is essential in determining
such major variables as investment, employment of factor inputs, wages, and output levels
and prices (Hawkins, 1979:7).
Several views have been expressed in reaction to the above definitions of the theory of the
firm. Some question whether the theory is really the theory of the firm (Jensen and
Meckling, 1976:3), while others question the assumptions underlying it (Nelson and
Winter, 1982; Koutsoyannis, 1979; Hawkins, 1979; Baumol, 1965). The views are
generally based on the basic framework underlying the theory, which is essentially the
classical view of what determines value, and the subsequent neoclassical propositions.
Generally, two basic approaches to the theory of the firm can be identified: (a) the
neoclassical approach which assumes that firms aim to maximise profits, whether they are
Block I: External factor- inputs
Block II: Firm characterised by an organisational structure, goals, policies, systems and procedures
Block III: Products (Outputs)
Block IV: Market for firm’s products
109
monopolists or perfect competitors (Mas-Colell et al., 1995:135); and (b) the modern
theories that attempt to capture the actual characteristics of modern firms (Bannock et al.,
1998:163; Baumol, 1965:296). In the former case, Romer (2006:340) argues that a central
assumption of most economic models is that agents maximise simple objective functions:
consumers maximise expected utilities, and firms maximise expected profits (see also
Pindyck et al., 1998; Mas-Colell et al., 1995; Varian, 1992). In the latter case, Baumol
(1965:296) argues that there is no reason to believe that all firms must maximise profit all
the time.
Despite the disillusionment with the neoclassical theory of the firm, it continues to hold
sway over modern approaches because of lack of a generally acceptable alternative theory
of the firm that gives precise and definite results about the firm’s behaviour as does the
neoclassical theory of the firm (Hawkins, 1979:8; Penrose, 1995:11; Nicholson, 1995:415).
Consistent with this assertion, Romer (2006:340) argues that the assumption of maximising
expected profits is not that it leads to perfect descriptions of the behaviour of firms, but that
it leads to reasonably good approximations in most cases. Mas-Colell et al. (1995:152)
show that, under reasonable assumptions, the goal of profit maximisation is the goal that all
owners of the firm would agree on, while Pindyck and Rubinfeld (1998:252) argue that the
assumption of profit maximisation is frequently used in microeconomics because it predicts
business behaviour reasonably accurately and avoids unnecessary analytical complications.
In the rest of the following sub-sections, the major theories of the firm and the critiques are
briefly reviewed to highlight their relevance to the present study.
5.2.2.2 The neoclassical theory of the firm
(i) The basic assumptions
From the neoclassical definition of the firm, Koutsoyannis (1979:257), Douma and
Schreuder (1998) and Nelson and Winter, 1982:196) discern the following basic
assumptions that constitute the neoclassical theory of the firm:
1. The entrepreneur of the firm is also its owner;
110
2. Firms choose to maximise profits or present value of their output in the long run,
given the external conditions they face. However, this goal has to be attained both in
the short and long run by equating marginal cost (MC) to marginal revenue (MR);
3. The firm has full knowledge about its past performance, the present conditions and
future developments (global rationality). For example, it is assumed that the firm
knows with certainty its own demand and cost curves (information asymmetry is
assumed to be non-existent). The cost curves are U-shaped both in the short and
long run. It is also assumed that the firm learns from past mistakes and uses the
acquired knowledge to appraise the present and the future;
4. The entry into the market is governed by the respective market conditions (i.e. at
any time firms are viewed as facing a set of alternatives regarding the inputs and
outputs they will procure and produce respectively); and all relevant markets are in
equilibrium;
5. The firm acts with a certain time horizon that is influenced by such factors as the
rate of technological progress, the nature and gestation period of the product, capital
intensity of the methods of production and so on; and
6. No firm can improve its position given what others are doing, except if the supply
of factor inputs expand and production sets are augmented.
(ii) The Limitations of the neoclassical theory of the firm
Over the years there have been sustained criticisms of the traditional neoclassical theory of
the firm on a number of grounds (Nicholson, 1995; Nelson and Winter, 1982;
Koutsoyannis, 1979; Baumol 1965). The first set of criticisms was based on the core model
of the theory of the firm, i.e. the perfectly competitive market model. To address these
criticisms the theory was further developed in the 1930s with the publication of two books
on imperfect markets and monopolistic competition by J. Robinson (1933) and E.
Chamberlin (1933) respectively to include oligopoly models and monopolistic competition
111
(Koutsoyannis, 1979:202). However, this revision has been found unsatisfactory and the
criticisms of the theory have continued, mainly on two counts.
The first is with regard to the main assumptions that constitute the neoclassical theory of
the firm, maximising the expected profits. The second concerns the reasons why the firm
exists, which is widely premised on Coase’s (1937) seminal paper. Coase’s paper points out
that economics had no positive theory to determine the bounds of the firm. The author
characterises the bounds of the firm as that range of exchange over which the market
system was suppressed and instead the authority allocated the resources both in the firm
and in the market (Jensen and Meckling, 1976:7). Williamson (1967) extended Coase’s
view of why firms exist to include asset specificity and opportunism. These criticisms are
further discussed below under three main themes: criticisms of the goal of profit
maximisation; criticisms of equating MC to MR; and criticisms of the facilitating
assumptions. Views on why firms exist are elaborated on in sub-section 5.2.2.3.
(a) Criticisms of the goal of profit maximisation
The criticisms of the goal of profit maximisation are two pronged. First, it is argued that
firms cannot attain the goal of profit maximisation, because they do not have the necessary
knowledge, information and/or ability. The firms do not know with certainty their demand
and cost curves as assumed in neoclassical theory (bounded rationality) and therefore they
cannot apply the principle of MC=MR. Secondly, it is argued that even if the firm wanted
to pursue profit maximisation, it could not do so because there are many other goals to
pursue. For example, Williamson (1963) and Baumol (1965) argue that managers have
discretion to pursue policies that maximise their own utility rather than that of the
shareholders, measured by profits. The managerial utility includes such variables as salary,
security, power, status, prestige and professional excellence (Penrose, 1995). In this
respect, profit acts as a constraint to the managerial behaviour in that the financial market
and the shareholders require a minimum profit to be paid out in the form of dividends,
failure of which puts the job security of the managers in danger.
Similarly, Pindyck et al. (1998) argue that in large firms managers may deviate from
pursuing profit maximisation and be more concerned with goals such as revenue
112
maximisation for firm growth and payment of dividends, and maximising short-run profits.
However, the managers’ freedom to pursue these goals other than long-run profit
maximisation is limited, because shareholders can replace them, the firm can be taken over
or the firm may not survive in the long term.
Baumol (1959) developed the concept of a managerial utility function, which postulates
that managers maximise sales instead of profit. See also Baumol (1965) for similar
arguments. Gordon, Simon and Margolis (1958) cited in Koutsoyannis (1979) developed a
model of satisficing behaviour, which postulates that instead of pursuing profit
maximisation, firms pursue satisfactory profits, satisfactory sales, etc. In a model of long-
run survival and market share, Rothschild (1947) postulates that firms aim at long-run
survival and maintaining or increasing their market share instead of profit maximisation.
Similarly, Nicholson (1995:415) argues that when firms are uncertain about the demand
curve they actually face, or when they have no reliable notion of the marginal costs of their
output, their decision to try to maximise sales may be a reasonable rule of thumb for
assuring their long-run survival.
In a related argument Koutsoyannis (1979) reports that several writers have suggested that
the goal of the firm is to prevent new firms from entering the market, partly to avoid
uncertainty associated with new entrants and also to maintain or increase market share.
However, a critical examination of this goal suggests that the ultimate motive of preventing
new firms entering the market could be for maximising profits in the long run.
(b) Criticisms of equating MC to MR
While the objective of the firm in the long run is profit maximisation, the equilibrium
condition for profit maximisation, MC=MR, must be attained in the short and long run.
This, the neoclassical economists argue, is because the time periods are independent in the
sense that decisions taken in any one period do not affect the behaviour of the firm in other
periods, which is a contradiction of the postulation that firms accumulate knowledge to
guide future decisions.
113
The critics of this condition argue that the results of the studies conducted do not support
the view that firms follow the MC = MR rule in their decision-making. For example, in
Hall and Hitch (1939) it was established that firms set their price on the basis of the
average-cost price principle that aims to cover the average variable cost (AVC), the average
fixed cost (AFC) and a normal profit margin (NPM). It is argued that the firms follow this
principle because they do not know their demand curves and marginal costs. They also
believe that AVC+AFC+NPM is the ‘right price’, since it covers their cost of production
when the plant is ‘normally’ utilised, and includes an acceptable profit level. Mongin
(1997:558) notes that “Typically, the company would make an ex ante estimate of average
cost, as determined by some notion of its normal output, and then add to it one or more
percentage margins (the mark-up).” This means that firms’ main preoccupation is price and
not output levels, as the traditional theory of the firm suggests. They set prices based on
reasons other than profit maximisation (Elmore et al., 2006). Furthermore, it is argued that,
although firms in general would adhere to the AVC+AFC+NPM principle, they would be
prepared to depart from it to secure a big order or goodwill.
Various inquiries followed Hall and Hitch’s (1939) study, as noted in Elmore et al. (2006),
Mongin (1997) and Koutsoyannis (1979). Mongin (1997:559) cites Andrew’s
Manufacturing Business (1949) and Harrod’s non-optimising model in his Economic
Essays (1952) as some of the studies that have followed Hall and Hitch’s (1939) study. The
studies suggest that profit maximisation should be replaced with the full cost principle to be
understood as a novel theoretical construct. However, Mongin (1997) further argues that
the more widespread view in the 1940s and 1950s was that the full cost principle referred to
an empirical finding rather than a theoretical principle.
As cited in Koutsoyannis (1979:266), Gordon (1948) has argued that the industrial world is
extremely complex, with too many variables that vary continuously, determining demand
and costs. This requires continuous adjustments of MC=MR. Entrepreneurs do not have the
ability to continuously adjust MC=MR. Furthermore, the complexity and dynamism of
firms mean that they cannot learn from their past experience. Instead they use the
AVC+AFC+NPM principle, which they think is a more practical action than MC = MR. In
addition and as already observed, particularly by Baumol (1965), firms tend to pursue other
goals such as sales maximisation, retention of employees, goodwill, etc. While such goals
114
are related to the level of profit, it is not certain that the additional goals are compatible or
competing with the goal of profit maximisation, although Baumol (1965) argues that not all
firms pursue profit maximisation. In many organisations managers at any one time tend to
concentrate on solving local problems such as machine break-down, industrial strike, etc.
without applying MC=MR. Preoccupation with solving these institutional issues does not
necessarily lead to profit maximisation, but is important for attaining any goal of the firm.
(c) Criticisms of the assumptions of owner-manager and market structures
• The assumption of owner-manager
The attack on the assumption of ownership and management is based on the fact that in
modern firms, especially in industrialised economies, most equity holders are not managers,
who ultimately determine not only their own productivity, but also that of all other
operating units in the firm (Mas-Colell et al., 1995; Leibenstein, 1966). Consequently,
managers have the discretion to pursue goals that do not necessarily entail profit
maximisation. Fama (1980) argues that the inadequacy of the neoclassical theory of the
firm has led to the development of behavioural and managerial theories of the firm which
focus on the motivation of a manager who controls but does not own the firm (See Baumol,
1959; Simon, 1959; Cyert and March, 1963; and Williamson, 1964 for these theories).
The agency theory attempts to deal with the issue of aligning the interests of the equity
holders with those of the managers (Cella, 2003; Martimort and Verdier, 2002; Foss et al.,
1998). It refers to a set of propositions in governing a modern corporation, which is
typically characterized by large number of shareholders or owners who allow separate
individuals to control and direct the use of their collective capital for future gains (see
subsection 4.2.2). These individuals, typically, may always own shares but may also
possess relevant professional skills in managing the corporation. The theory offers many
useful ways to examine the relationship between owners and managers and verify how the
final objective of maximizing the returns to the owners is achieved, particularly when the
managers do not own the corporation’s resources.
115
Simpson (2006) argues that following Adam Smith (1776), Berle and means (1932)
initiated the discussion relating to the concerns of ownership and control in large
corporations. However, the concerns were aggregated by Jensen and Meckling (1976) into
the ‘agency problem’ in governing the corporation. The author further argues that Jensen
and Meckling (1976) identified managers as the agents who are employed to work for
maximizing the returns to the shareholders, who are the principals (see sub-section 4.2.2.2).
It is assumed that because the agents do not own the corporation resources, they may
pursue interests different from those of the shareholders.
While the agency theory still views the firm as a production set, it allows for the
professional manager to make production choices (e.g. investment, effort, etc.). The
manager deals with day-to-day operations of the firm and the equity holders may probably
appoint a board to strategically direct, control and oversee their activities. Under these
conditions it is impossible for the equity holders to implement their optimal profit
maximisation plan.
To minimise the potential for agency problems, Jensen (1983) recognizes two important
steps: first, the principal-agent risk-bearing mechanism must be designed efficiently and
second, the design must be monitored through the nexus of organizations and contracts.
While these arrangements may reduce the problem of modern representative firms, it is
possible only up to a point where the incentive scheme is effective enough to align the
interests of equity holders with those of the managers.
Another criticism of the owner-manager assumption is that managers of modern firms do
not act with global rationality, as postulated in the neoclassical theory. They are constrained
by the availability and cost of acquiring the relevant information, the technical ability and
time required to act with global rationality as well as information asymmetry. Similarly,
Leibenstein (1966:407) argues that important inputs are frequently not marketed or, if they
are traded, they are not equally accessible (in equal terms) to all potential buyers. For
example, in developing countries the capacity to obtain finance may depend on family
connections. In this respect, therefore, instead of assuming that managers act with global
rationality, it is more appropriate to assume that they work with bounded rationality, in part
due to information asymmetry.
116
• The assumptions on market structures
Critics of the assumptions of market structures argue that the neoclassical theory is silent on
the entry conditions in some markets. For example, while the conditions of entry are clearly
defined in the case of perfect competition, monopolistic competition and monopoly, it is
not in the case of oligopoly. The classical duopoly models, in particular, are said to be
closed in that the number of sellers in the final equilibrium does not change from that at the
initial situation. The potential entry and its effects on decision making are also not dealt
with in the traditional theory. Furthermore, empirical evidence such as that by Hall and
Hitch (1939) as cited in Elmore et al. (2006) and Koutsoyannis (1979) also shows that
firms are interdependent (continuously conscious of the reactions of the other competitors),
which contradicts the postulates of perfect or monopolistic competition. Duopoly theory,
based on assumptions of constant reaction patterns of competitors, also seems inadequate to
deal with oligopolistic interdependence and ensuing uncertainty regarding the demand for
the products of oligopolistic firms (Koutsoyannis, 1979:264).
5.2.2.3 Transaction cost theory and other views of the firm
Major attempts have been made to substitute the neoclassical theory of the firm with other
models, with each attempt motivated by the conviction that the former is inadequate in two
major respects (Joskow, 2006:4; Nicholson, 1995; Penrose, 1995:10; Fama, 1980:289;
Jensen and Meckling, 1976:3; Leibenstein, 1966; Hawkins, 1979:8). The first has already
been covered above (assumptions). The second is generally associated with Coase’s (1937)
article. Foss (2003:3; 1996:470) argues that as the story is normally told, “The theory of the
firm traces its existence back to Coase’s landmark 1937 article, ‘The Nature of the Firm.’”
Holmstrom and Tirole (1989) also observe that, while substantial progress has been made
on the description and analysis of market performance, firm behaviour and organisation
have remained poorly understood. Jensen and Meckling (1976:3) are even more emphatic,
as captured in the following conclusion:
While the literature of economics is replete with references to the “theory of the firm,” the material generally subsumed under the heading is not actually a theory of the firm but rather a theory of markets in which firms are generally actors. The firm is a “black box”
117
operated to meet the relevant marginal conditions with respect to inputs and outputs, thereby maximising profits or more accurately, present value…A number of major attempts have been made during recent years to construct a theory of the firm by substituting other models for profit or value maximisation, with each attempt motivated by a conviction that the latter is inadequate to explain managerial behaviour in large companies…
Coase (1937) and the proponents of his view (see, for example, Foss, 2003; Cella, 2003;
Martimort and Verdier, 2002; Foss et al., 1998; Kasper and Streit, 1998; Demsetz, 1997;
Holmstrom and Tirole, 1989; Williamson, 1981; Leibenstein, 1966) argue that, while it is
theoretically conceivable that a producer may each day buy all the inputs (e.g. labour
service, raw materials, etc.) s/he needs for production from the market place, such a way of
mobilising factors of production would not only involve extremely high transaction costs
in, for instance, discovering the relevant information on prices, negotiating the prices,
drafting and monitoring the execution of contracts, and where necessary, enforcing the
contracts, but some factors may not be marketed. Thus, relying exclusively on one-off
contracts would result in enormous costs. This is why, according to Coase and the
proponents of his view, repetitive production is normally coordinated within organisations
called firms to reduce such costs (Kasper and Streit, 1998:261; Douma and Schreuder,
1998: Joskow, 2006). Thus, a firm exists to reduce transaction costs.
Williamson (1985) extended Coase's (1937) view of the firm as a transaction cost-reducing
agency by introducing the concepts of asset specificity and opportunism. He argues that
owners of capital, knowledge and other resources are often obliged for technical reasons to
commit their resources irreversibly and for a long time to specific firms. The owners of a
company who have invested their capital in buildings and equipment cannot readily switch
out of those investments. They also acquire specific knowledge, which they can use only if
they remain in specific operations. These investments will only pay expected returns if
specific assets can be operated undisturbed for a long time. However, the owners of other
complementary resources, such as flexible skilled labour may want to exploit the
inflexibility of the capital owners and holders of specific knowledge by ‘holding up’
operations and extorting higher pay. A way of mitigating against this opportunistic
behaviour, Williamson (1985) argues, is to sign contracts to bind providers of
complementary resources into an organisation. In many cases this may even be the
precondition for a specific investment to go ahead in order to avoid possible risks (Kasper
and Streit, 1998:261-2). Thus, firms exist as a nexus of contracts.
118
As argued above, the main bone of contention between the neoclassical economists and the
transaction cost theorists is how and where the factor inputs are acquired from and their
implications for the rest of the other variables for production and exchange. In the
neoclassical theory factors of production are acquired from the market via the price system
and the firm plays no central role in the process. In the transaction cost theory factor inputs
are acquired from within the firm and are heavily influenced by the firm’s structure, rules
and procedures, and the incentive system occasioned by the agency theory. In the latter case
the existence of the firm has significant implications for its performance, while in the
former, to put it in the words of Mas-Colell et al. (1995:127), “The firm is viewed merely
as a ‘black-box’, able to transform inputs into outputs” with no other central role to play
(see also Leibenstein, 1966). The essential difference between economic activity inside the
firm and economic activity in the market is that the former is carried on within an
organisation coordinated by policies, systems, procedures and guidelines, while the latter is
not (Penrose, 1995:14).
5.2.2.4 Areas of consensus on the theory of the firm
(i) The goal of profit maximisation
In all the criticisms of the goal of profit maximisation, the interesting question is whether it
is possible for the firm to exist in the long-run if it significantly deviates from the goal of
profit maximisation. The consensus, however, is that earning a profit in the long-run is not
only an essential element for all business firms, but under reasonable assumptions profit
maximisation is the goal all firm owners would agree upon (Romer, 2006; Pindyck et al.,
1998:252; Intrilligator et al., 1996:275; Penrose, 1995:30; Mas-Colell et al., 1995:152;
Haven et al., 1966:303; Cyert and March, 1963). Penrose (1995:30) argues, “Firms will
never invest in expansion for the sake of growth if the return on the investment is negative,
for that would be self-defeating.” Romer (2006:341) argues “A firm that fails to maximise
profits is likely to be out competed by more efficient rivals or purchased by individuals
who can obtain greater value from it…And managers who fail to maximise profits for
owners of their firms are likely to be fired and replaced by ones who do.” Similarly,
Williamson (1981) argues that transaction cost theory is not inconsistent with profit
119
maximising behaviour, a point Jensen and Meckling (1976) agree with when they retain the
notion of maximising behaviour on the part of individuals in the analysis of the theory of
the firm. Therefore, while firms may be motivated by other objectives, pursuit of profit is a
necessary constraint in their production function.
(ii) The objectives of the neoclassical theory of the firm
Some authors believe that some of the attacks on the neoclassical theory are misdirected
and/or do not recognise its objective, which is principally to explain the process of resource
allocation and price determination in a market economy. For instance, Demsetz (1997)
notes that the neoclassical theory of the firm serves an important objective of
conceptualising an economy in which there is interdependence between the households and
firms, whether a firm is a multi-person or not. He further observes that the firm in the
neoclassical model is quite different from the firm in R.H. Coase’s 1937 classic paper on
the nature of the firm in which managed coordination, presumably involving more than one
person, defines the firm. The prime objective of Coase’s article was to explain the existence
of firms and their importance relative to price mechanism, but markets cannot substitute
production. They only provide the framework for exchange. There must be a producer
before an exchange can take place. Firms produce and then exchange takes place.
Case and Fair (2002:134) and Pindyck and Rubinfeld (1998:175) argue that production is
not limited to business firms, private, public or corporation. Households also engage in
transforming factors of production into useful things (outputs). Similarly, the government
also combines factors of production to produce public services for which demand exists.
In the same vein Penrose (1995:11) notes “The ‘theory of the firm’ – as it is called in the
literature – was constructed for the purpose of assisting in the theoretical investigation of
one of the central problems of economic analysis – the way in which prices and allocation
of resources among different uses are determined.” The author concludes that only those
aspects of the behaviour of the firms that are relevant to the problems that the wider theory
is designed to solve should be considered.
Cyert and March (1963:15; also Demsetz, 1997) observe that:
120
…much of the controversy is based on a misunderstanding of the questions the conventional theory of the firm was designed to answer. The theory of the firm, which is primarily a theory of markets, purports to explain at a general level the way resources are allocated by a price system. To the extent to which the model does this successfully, its gross assumptions will be justified.
Thus, many of the attacks on the neoclassical theory of the firm are not so much proper
critiques of the received theory of the firm, but more or less arguments for the development
of a theory appropriate to answer the different questions or interests at hand (Holmstrom
and Tirole, 1989; Penrose, 1995:11).
(iii) Useful purposes served by the production function
The transaction costs theorists’ main focus of attack on the neoclassical theory of the firm
is the production function, which the neoclassical economists assume to be given, as
discussed in section 5.3. However, the attacks are not that the production function is
irrelevant, but rather the assumptions that underlie it. For example, Williamson (1981:1539)
observes that:
The Neoclassical theory treats the firm as a production function to which profit maximisation has been ascribed. Albeit useful for many purposes, such a construction is unhelpful in attempting to assess the purpose served by hierarchical modes of organisation. The firm as a production function needs to make way for the view of the firm as governance structure…
The above observation does not negate the usefulness of the production function, but rather
its usefulness when, for example, assessing the purpose served by hierarchical modes of
organisation. On the other hand, in analysing the determinants of production, the
production function is a fundamental tool, as it provides the framework for identifying the
inputs into a production process, the process of allocation of the inputs and the resulting
output (Pindyck et al., 1998). It is, however, important to note that the traditional
neoclassical production function is inadequate in the analysis of the production function
behaviour of modern firms.
121
5.3 The production function
5.3.1 Analysis of the production function
The production function is one of the pillars of the theory of the firm. In its general form it
is a purely technical relationship between quantities of inputs and quantities of output
(Pindyck and Rubinfeld, 1998; Mas-Colell et al., 1995; Varian, 1992; Koutsoyannis, 1979).
However, Koutsoyannis (1979:70) argues that in practice the measurement of output has
been done in value added terms, which destroys the purely technical nature of the
production function. Hence, the relationship between factor inputs and the corresponding
output can be described as both technical and economic (see also Varian, 1990:300). The
technical part of the relationship is called the technological production function and can be
used to identify the levels of inputs used to produce corresponding level(s) of output(s).
Wallis (1979:38) posits that the technical production function summarises the efficient
production possibilities open to a firm, a technical maximisation problem having been
solved. The economic part of the relationship may be described as the economic production
function, used to identify the least-cost combination of inputs in a feasible production set.
In Figure 1 the firm is illustrated to constitute external and internal factor inputs combined
to produce output, which is exchanged. For a systematic exposition of the production
function and its development, let us begin with the neoclassical model that has only two
factor inputs: labour and capital, denoted by L and K respectively (Wallis, 1979:38;
Zellner, Kmenta, and Dreze, 1966:784). Land is considered constant for the economy as a
whole, although it may not be constant for individual sectors or firms, and for this reason it
is conventional to lump it together with capital. Expressed in a general mathematical form,
this is represented as:
Q = ƒ(L, K)--------------------------------------------------------------------------------------------5.1
where Q is output, L is labour input, and K is capital input. All variables in equation 5.1
are flows, that is, they are measured per unit of time, and L ≥ 0 and K ≥ 0 and the function
is a single-valued, continuous, and at least twice differentiable (Mas-Colell et al., 1995;
Varian, 1992; Varian, 1990; Wallis, 1979).
122
The development of the traditional neoclassical model has incorporated returns to scale (T),
normally experienced in the long-run and an efficiency parameter (GM) as illustrated in a
general mathematical equation 5.2 (Koutsoyannis, 1979:69).
Q = ƒ(L,K,T, GM)------------------------------------------------------------------------------------5.2
where Q, L, and K are as defined above.
Leibenstein (1966) identifies two broad categories of efficiency: allocative efficiency
resulting from allocation of resources via the free market mechanism, and X-efficiency (see
Meador et al., 1997 for the definition of X-efficiency). This study confines its investigation
of the significance of efficiency in the production process to entrepreneurial-organisational
efficiency in general, but more specifically effectiveness of governance. For example, two
business concerns with all factors of production identical may differ just because of the
differences in the entrepreneurial-organisational efficiency. Indeed, Kasper and Streit
(1998:18) argue that China’s excellent technology, especially in the Sung dynasty (960-
1278), was never translated into an industrial revolution because of lack of rules, which are
entrepreneurial-organisational aspects. Penrose (1995) expresses similar views, while
Leibenstein (1966:401) argues that “Clearly there is more to the determination of output
than the obviously observable inputs. The nature of management … and the incentives
employed are significant.”
Equation 5.2 shows that Q is affected by L, K, T, and GM, but it does not tell us the
direction of the relationship. Moreover, the variation of the explanatory variables is tied to
the time period over which each can be varied. Economists have categorised the period
over which factor inputs can be varied into four: the momentary run, the short run, the long
run, and the very long run (Lipsey, 1993; Pindyck and Rubinfeld, 1995; Samuelson and
Nordhaus, 1996). The momentary run is a period within which a firm cannot adjust the
factor inputs to increase output. This normally happens because in every transaction, when
orders to supply a product are placed with a firm, they (orders) must first be scrutinised and
confirmed before taking any supply decisions. This takes time, which means that a firm
123
cannot respond to a placed order at short notice. It is this period when the firm is unable to
respond to a placed order for its product that is referred to as a momentary run.
The short run is a period in which firms can adjust production by changing variable factors
such as raw materials and some labour, but cannot change fixed factors such as capital and
land that can only be changed in the long run. In the very long run technology can also be
changed through research and development that results in innovation of, say, new products,
new techniques of production or new inputs.
5.3.1.1 Short-run analysis
Since our interest is more on what happens to Q in equation 5.2 when the factor inputs
vary, the momentary run is of less importance and therefore it is disregarded in the
subsequent analyses. The analysis begins with the response of Q to variations in the
postulated determinants in the short run. For ease of exposition and in line with the short-
run arguments, assume that L is the only variable factor in the short run, while the rest of
the factors are fixed. Given this assumption, and assume further that a production function
is a representation of an efficient relationship between a set of inputs and output, y can only
increase if L is increased (Mas-Colell et al., 1995). An increase in Q resulting from a very
small unit increase in L is known as the marginal product of labour (MPL), represented
algebraically as MPL = ∂Q/∂L. Similarly, an increase in Q resulting from a very small unit
increase in K is known as the marginal product of capital (MPK) represented algebraically
as MPK = ∂Q/∂K.
In principle the marginal product of a factor may assume any value, positive, zero or
negative. However, the basic production theory concentrates only on the efficient part of
the production function, that is, on the range of output over which the marginal product of
the factor inputs are positive (Koutsoyannis, 1979:71-2; Pindyck and Rubinfeld, 1998:245).
Rational firms would not employ any other factor inputs beyond a point where the marginal
product is zero, because beyond this point any addition of a factor input reduces the total
output. Furthermore, the basic theory of production usually concentrates on the range of
output over which the marginal product of factor inputs, although positive, decreases, that
124
is, over the range of diminishing but non-negative productivity of the factors of production.
These conditions are mathematically expressed as follows (see Varian, 1990:305):
MPL >0 but ∂(MPL )/∂L < 0; MPK >0 but ∂(MPK )/∂K < 0; -∂K/∂L = MRTS29 (the slope of
an isoquant) ≠ MPL/ MPK , but are closely related (Pindyck and Rubinfeld, 1998:192).
Empirical studies show that diminishing returns occur in practice (Samuelson and
Nordhaus, 1996; Pindyck and Rubinfeld, 1998) but might not hold for the entire range of
inputs. For example, Pindyck and Rubinfeld (1998:200) observe that “Most studies of
railroad industry indicate increasing returns to scale at low and moderate freight densities,
but decreasing returns to scale begin to set in after a certain point...” In other production
lines the first inputs such as labour might show increasing marginal products, while the last
unit might show negative marginal products as workers begin to interfere with one
another’s activities and enthusiasm wanes. Therefore, for rational firms the relationship
between output and additional number of staff, for example, is positive as long as the
diminishing returns are positive.
5.3.1.2 Long-run and very long-run analysis
In the long run all factors become variable and the firm can combine different factors of
production to achieve different levels of output (Koutsoyannis, 1979:76). This means that a
decision to increase Q can be executed by varying all the relevant factor inputs. This leads
to a new concept called returns to scale (Pindyck and Rubinfeld, 1998: 197; Mas-Colell et
al., 1995:132; Varian, 1990:308). Technically expressed, returns to scale reflect the
responsiveness of total product when all the inputs are varying proportionately.
Three important concepts of returns to scale are: constant, decreasing and increasing (Mas-
Colell et al., 1995:132). Using Q as the designated letter for output, X as the designated
letter for all the inputs, and Δ as the symbol for a proportional change, we can express the
three concepts as follows: constant returns to scale denote a situation whereby ΔQ = ΔX.
For example, doubling of inputs leads to doubling of output. Decreasing returns to scale
29 MRTS is marginal rate of technical substitution
125
occur where ΔX > ΔQ. For example, an increase of inputs by 30% results in an increase of
output by 25%. Increasing returns to scale arise when ΔX < ΔQ.
While the potential of scale economies are great in many sectors, the law of returns to scale
dictates that decreasing returns to scale are inevitable. For instance, as a firm becomes
larger and larger, the problems of management and coordination (ownership and control)
increase. As a result additional inputs into production make economic sense only when
returns to scale are positive.
Empirical research has shown that most production activities should be able to attain
constant returns to scale. Based on the results of the estimates of Cobb-Douglas, production
function for the macro-economy of the United States and New Zealand, Douglas (1948, as
cited in Intrilligator, 1996:270), concludes that production exhibits approximately constant
returns to scale and that factors of production receive approximately the share they would
receive under perfect conditions, given the elasticity of output with respect to the factor.
While these conclusions have been questioned, economists generally think that production
functions exhibit constant returns to scale (Samuelson and Nordhaus, 1996).
5.3.2 Introduction of costs into the production function
Up to this point the discussion of the production process has focused on the relationship
between the physical units of output and inputs. But the decision to produce and the
combination of inputs to use is often an economic one (Wallis, 1979:44). Production
technology and factor prices determine the cost of production (Pindyck and Rubinfeld,
1998:205). Thus, the main purpose of a production function is to provide the technical
relationship between the inputs and the outputs necessary for attaching cost to the different
input combinations to aid in making economic decisions. Further examination of the
production function and its relationship with the cost of the factor inputs is provided below.
Equation 5.3 is derived from a general form of a production function (equation 5.2):
Q = ƒ(L, K, T, GM)----------------------------------------------------------------------------------5.3

126
As was argued earlier in this chapter, to produce Q a firm must combine the relevant factors
of production postulated on the right-hand side of equation 5.3. These factors are acquired
at a cost (price). When the price of each factor is known, then the total quantity of each
factor is multiplied by the relevant price, after which a sum is obtained to arrive at the cost
of all the factors of production. To illustrate this, let us designate total cost of inputs by TC,
and the prices of L, K, T, and GM by w, r, θ and η respectively such that:
TC = wL + rK + θT + ηGM-----------------------------------------------------------------------5.4
Assuming TC captures all the relevant costs, equation 5.4 tells us that to produce Q units of
output, the firm must spend wL + rK + θT + ηGM outlay of resources to acquire L, K, T
and GM volume of factors of production. Rational firms normally choose a combination of
factor inputs that maximises output given the cost of inputs or vice versa.
From equations 5.3 and 5.4, the Lagrangean function can be written as:
Q* = wL + rK + θT + ηGM - λ{Q-f(L, K, T, GM)}--------------------------------------------5.5
The first order conditions are:
∂Q*/∂L = w + λ fL = 0------------------------------------------5.6
∂Q*/∂K = r + λ fK = 0-------------------------------------------5.7
∂Q*/∂T = θ +ν λ fT = 0-----------------------------------------5.8
∂Q*/∂GM = η + λ fGM = 0--------------------------------------5.9
so that
fL/w = fK/r = fT/θ = fGM/η ------------------------------------------------------------------------------------5.10
and ∂Q*/∂λ = -Q+ f(L, K, T, GM) = 0-----------------------------------------------------------5.11
127
such that the firm remains on its production function. Thus, the optimal solution occurs
when the ratios of each factor to its price are equal for all the factors of production.
Solutions to equations 5.6, 5.7, 5.8, 5.9, and 5.11 give the cost of minimising input levels in
terms of prices and the fixed output level. These would be the input levels that a firm
conscious of minimising its costs of inputs used in production would choose.
Note that, while the exposition of the production function has been done under the
assumption of perfect competition, the extension of the theory of the firm to cover
imperfect markets has generally retained the same basic framework and decision-making
processes postulated in the perfect competition model (Cyert and March, 1963:7; Bannock
et al., 1993:163).
5.4 Profit function
The profit function defines the relationship between the revenue earned by a firm and the
associated costs. Mas-Colell et al. (1995:135), Varian (1990:311), and Zellner, Kmenta and
Dreze (1966:785) define profit as revenue minus cost, while Varian (1992:23) and
Nicholson (1995:347) distinguish between the term profit and economic profit, but define
economic profit essentially in the same way as the other authors define profit.
For a systematic exposition of the profit derivation, the following symbols and letters are
defined:
Π = profit of the firm
P = average price of the output of the firm
Q = average quantity of the output of the firm
X = average quantity of a vector of the inputs of the firm (measured in the same units)
c = average price of the inputs of the firm.
Π = TR–TC ----------------------------------------------------------------------------------------5.12
128
where TR = P*Q, TC = X*c. Q, in this case, is obtained from the production function. It is
assumed that all that is sold is produced by the firm. In the neoclassical formulation Q is
the maximum output attainable from alternative combinations of conceivable factor inputs
(Pindyck and Rubinfeld, 1998; Varian, 1992). Where neoclassical conditions are violated,
as may happen in the real world, the output is sub-optimal (Pindyck and Rubinfeld,
1998:177; Leibenstein, 1966:407). That is, production does not take place at the frontier.
Equation 5.12 shows that profit is a function of prices of factor inputs, quantities of factor
inputs, quantity of output and output price. The function is continuous, homogeneous of
degree one, convex, decreasing in prices of inputs and increasing in the price of output.
Maximising profit by choice of TR in equations 5.12 calls for choosing Q such that,
(∂Π /∂Q) (Q) = P – (∂TC/∂Q) (Q) = 0 -----------------------------------------------------------5.13
Thus, the first-order condition for profit maximisation is
P = (∂TC/∂Q) (Q) ----------------------------------------------------------------------------------5.14
The second-order condition is
∂2Π /∂Q2 = ∂2TC/∂Q2 ≤ 0 -------------------------------------------------------------------------5.15
Equation 5.15 shows that the firm is maximising profit at Q and at this level of output price
= marginal cost. Q is at maximum, while the cost of combinations of inputs (TC) is at
minimum and therefore profit (Π) is at maximum.
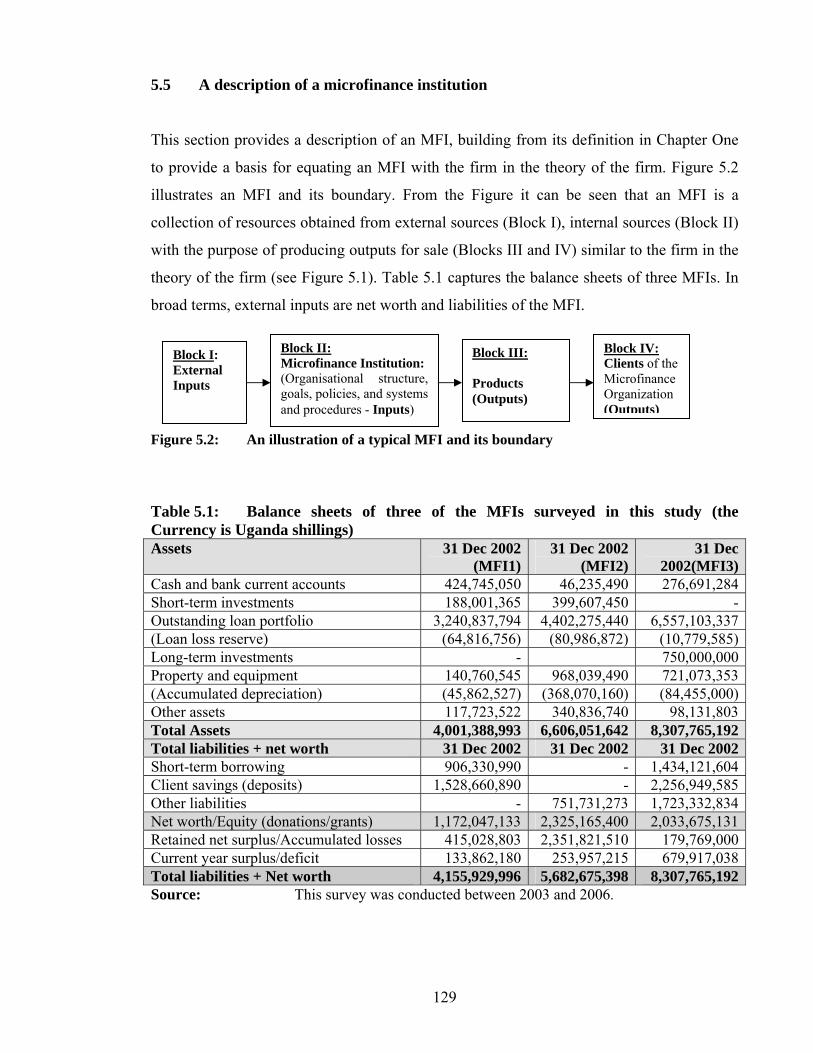
129
5.5 A description of a microfinance institution
This section provides a description of an MFI, building from its definition in Chapter One
to provide a basis for equating an MFI with the firm in the theory of the firm. Figure 5.2
illustrates an MFI and its boundary. From the Figure it can be seen that an MFI is a
collection of resources obtained from external sources (Block I), internal sources (Block II)
with the purpose of producing outputs for sale (Blocks III and IV) similar to the firm in the
theory of the firm (see Figure 5.1). Table 5.1 captures the balance sheets of three MFIs. In
broad terms, external inputs are net worth and liabilities of the MFI.
Figure 5.2: An illustration of a typical MFI and its boundary
Table 5.1: Balance sheets of three of the MFIs surveyed in this study (the Currency is Uganda shillings) Assets 31 Dec 2002
(MFI1)31 Dec 2002
(MFI2) 31 Dec
2002(MFI3)Cash and bank current accounts 424,745,050 46,235,490 276,691,284Short-term investments 188,001,365 399,607,450 -Outstanding loan portfolio 3,240,837,794 4,402,275,440 6,557,103,337(Loan loss reserve) (64,816,756) (80,986,872) (10,779,585)Long-term investments - 750,000,000Property and equipment 140,760,545 968,039,490 721,073,353(Accumulated depreciation) (45,862,527) (368,070,160) (84,455,000)Other assets 117,723,522 340,836,740 98,131,803Total Assets 4,001,388,993 6,606,051,642 8,307,765,192Total liabilities + net worth 31 Dec 2002 31 Dec 2002 31 Dec 2002Short-term borrowing 906,330,990 - 1,434,121,604Client savings (deposits) 1,528,660,890 - 2,256,949,585Other liabilities - 751,731,273 1,723,332,834Net worth/Equity (donations/grants) 1,172,047,133 2,325,165,400 2,033,675,131Retained net surplus/Accumulated losses 415,028,803 2,351,821,510 179,769,000Current year surplus/deficit 133,862,180 253,957,215 679,917,038Total liabilities + Net worth 4,155,929,996 5,682,675,398 8,307,765,192Source: This survey was conducted between 2003 and 2006.
Block I: External Inputs
Block II: Microfinance Institution: (Organisational structure, goals, policies, and systems and procedures - Inputs)
Block III: Products (Outputs)
Block IV: Clients of the Microfinance Organization (Outputs)
130
With the exception of banks, finance companies, co-operatives and indigenous associations
and organisations providing microfinance, most classical (typical) MFIs started as NGOs,
but are now transforming and commercialising due to limitations of NGOs (Ledgerwood
and White, 2006). Table 5.2 shows that out of 16 MFIs randomly identified, eight have
transformed into deposit-taking financial institutions for reasons that include i) the desire
to access sustainable funding sources e.g. from financial markets; ii) gaining financial
independence; and iii) acquiring an appropriate institutional form for sustainable outreach
and effective governance (Ledgerwood and White, 2006).
MFIs have organisational structures, policies, systems and procedures to aid staffing and
internal controls. For example, ASA in Bangladesh has developed a flat management
structure with only three tiers to minimise bureaucracy. A typical branch in ASA has one
manager, 4-5 credit officers and one support staff (Fernando and Meyer, 2002). To
minimise cost and enhance efficiency ASA’s approach and philosophy have been adopted
in various countries, including Uganda. Fernando and Meyer (2002:2) also report that
ASA’s good performance is due to its simple, effective and rigid systems and procedures.
Ledgerwood (1999:34) argues that MFIs have two long-term goals: outreach and
sustainability. Mr Choudhury (managing director of ASA) combines these two long-term
goals into sustainable outreach, and argues that this is central to MFIs (Fernando and
Meyer, 2002:2). This means that MFIs must balance maximising outreach and
sustainability. A survey of the goals of 16 MFIs summarised in Table 5.2 indicates that
these are the goals of many MFIs expressed in various ways. For example, the goal of
Commercial Microfinance Limited in Uganda is to provide quality financial services on a
sustainable basis, while that of Grameen Bank in Bangladesh is to provide small loans to
disadvantaged people on a sustainable basis.
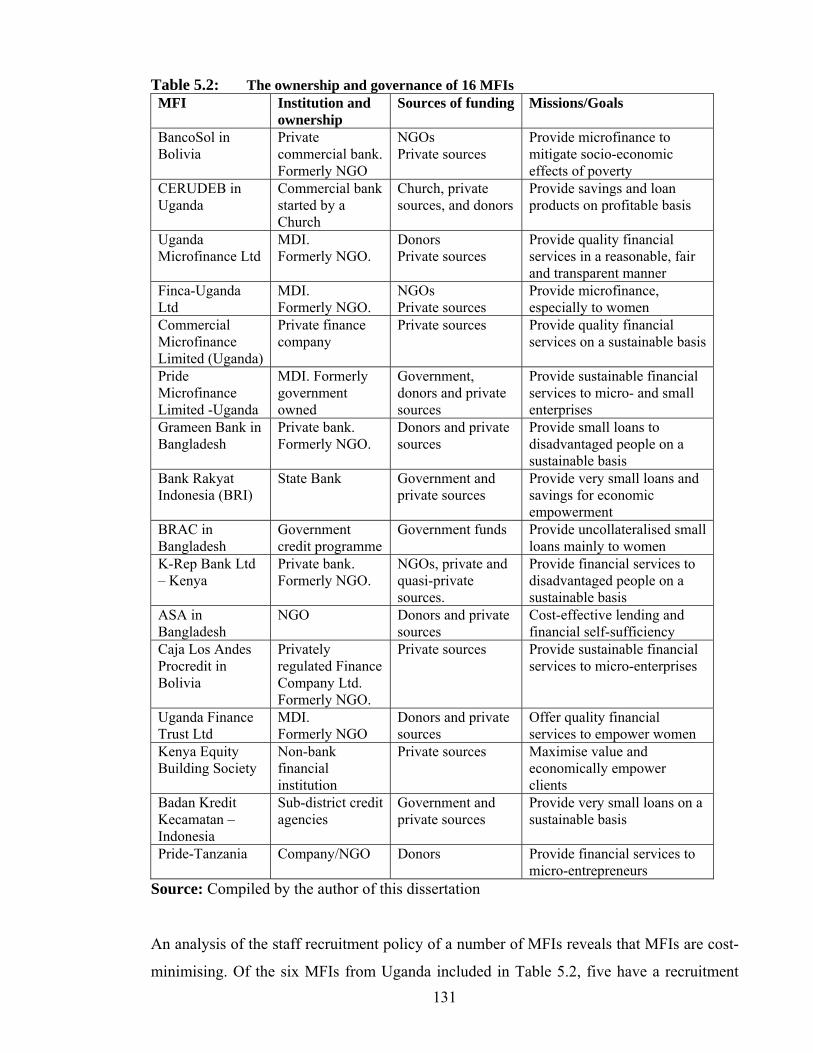
131
Table 5.2: The ownership and governance of 16 MFIs MFI Institution and
ownership Sources of funding Missions/Goals
BancoSol in Bolivia
Private commercial bank. Formerly NGO
NGOs Private sources
Provide microfinance to mitigate socio-economic effects of poverty
CERUDEB in Uganda
Commercial bank started by a Church
Church, private sources, and donors
Provide savings and loan products on profitable basis
Uganda Microfinance Ltd
MDI. Formerly NGO.
Donors Private sources
Provide quality financial services in a reasonable, fair and transparent manner
Finca-Uganda Ltd
MDI. Formerly NGO.
NGOs Private sources
Provide microfinance, especially to women
Commercial Microfinance Limited (Uganda)
Private finance company
Private sources Provide quality financial services on a sustainable basis
Pride Microfinance Limited -Uganda
MDI. Formerly government owned
Government, donors and private sources
Provide sustainable financial services to micro- and small enterprises
Grameen Bank in Bangladesh
Private bank. Formerly NGO.
Donors and private sources
Provide small loans to disadvantaged people on a sustainable basis
Bank Rakyat Indonesia (BRI)
State Bank Government and private sources
Provide very small loans and savings for economic empowerment
BRAC in Bangladesh
Government credit programme
Government funds Provide uncollateralised small loans mainly to women
K-Rep Bank Ltd – Kenya
Private bank. Formerly NGO.
NGOs, private and quasi-private sources.
Provide financial services to disadvantaged people on a sustainable basis
ASA in Bangladesh
NGO Donors and private sources
Cost-effective lending and financial self-sufficiency
Caja Los Andes Procredit in Bolivia
Privately regulated Finance Company Ltd. Formerly NGO.
Private sources Provide sustainable financial services to micro-enterprises
Uganda Finance Trust Ltd
MDI. Formerly NGO
Donors and private sources
Offer quality financial services to empower women
Kenya Equity Building Society
Non-bank financial institution
Private sources Maximise value and economically empower clients
Badan Kredit Kecamatan – Indonesia
Sub-district credit agencies
Government and private sources
Provide very small loans on a sustainable basis
Pride-Tanzania Company/NGO Donors Provide financial services to micro-entrepreneurs
Source: Compiled by the author of this dissertation
An analysis of the staff recruitment policy of a number of MFIs reveals that MFIs are cost-
minimising. Of the six MFIs from Uganda included in Table 5.2, five have a recruitment
132
policy that emphasises recruitment and deployment of staff based on qualification,
experience and performance. Similar policies are pursued in other MFIs such as Badan
Kredit Kecamatan (BKK) and Kredit Usaha Rakyat Kecil (KURK) in Indonesia and
Association of Social Advancement (ASA) in Bangladesh (Hulme and Mosley, 1996;
Fernando and Meyer, 2002).
MFIs provide loans, savings, payment transfers, insurance services and social
intermediation services such as group formation, development of self-confidence, training
in financial literacy and management capabilities among members of a group to low-
income earners and their enterprises (Ledgerwood, 1999; Mckenan, 2002).
5.6 Can a microfinance institution be equated to the firm in the theory of the firm?
In section 5.2 the firm and the theory of the firm are presented and discussed. In section 5.5
a brief description of an MFI is presented. In this section the question addressed is: can a
microfinance institution be equated to the firm in the theory of the firm?
The theory of the firm in general, and of production function in particular, is widely
understood to be more applicable to industrial firms producing tangible goods. Its
application particularly to microfinance institutions that provide a kind of a different
service (not like a hair-cutting service) to its customers, rather than a physical product
raises the question of whether or not it is appropriate. For example, a deposit-taking
financial institution accepts deposits and gives out loans (financial intermediation). In this
intermediation process loan appraisal and granting are not done the same way as when
offering other services. The process involves a customer applying for a loan and the MFI
appraising the application, normally by visiting the client’s project or household to assess
the viability of the project. In this way the process of providing a financial service is
different from that of providing other services, let alone the production of tangible goods.
In short, providing a financial service such as extending a loan tends to be prolonged.
The traditional neoclassical theory of the firm treats the firm as a black box, as argued in
section 5.2.2.3. That is, what takes place within the firm and how that affects its
performance is not explained. However, treating the firm in this way does not make it
133
different from an MFI, since both mobilise external factor inputs to produce outputs.
Secondly, the process of transforming the inputs into outputs is similar and can be
understood in terms of the production function presented in sub-section 5.3.1. The
economic decision taken in the process of choosing the least-cost combination of inputs is
similar in the two institutions. Besides, the sustainability model can be explained in terms
of the profit function.
Turning to the institutional arrangements, both the firm in the theory of the firm and a
financial institution make decisions within an administrative system designed on similar
principles. Both institutions have goals, policies, procedures and systems. Depending on
their level of development and legal status, both categories of firms have organisational
structures to guide their operations (see section 5.5).
Other similarities and differences between a microfinance institution and a non-financial
firm can be captured with the aid of typical items that appear in the balance sheets of both
types of the institutions/organisations. The balance sheet items can provide indications as to
whether a firm is a financial institution or not.
Table 5.3 is a summary of a list of typical items that would appear in the balance sheet of a
microfinance institution and that of an industrial firm. From the Table the major similarities
and differences listed below can be identified.
1. Fixed assets appear in both balance sheets. This is because formal business
organisations are usually required to have fixed locations, indicated by buildings
and equipment. In addition, the organisations use equipment such as vehicles,
motorcycles, etc. to facilitate implementation of their activities. However,
differences are in the structure and value of some of the fixed assets, such as plant,
machinery, land and buildings. In an MFI plant and machinery are normally not
required, while they may be major items in a non-financial firm. Similarly, land and
buildings may form a small proportion of the total assets of an MFI (some MFIs
rent offices) (MOFPED, 2006), but may be substantial in the case of a non-financial
firm, and more specifically an industrial firm.
134
2. Some of the current assets, such as cash and bank balances appear in both balance
sheets. These are normally used to pay for operational expenses such as office
supplies, staff salaries, etc. MFIs can also use cash and bank balances for disbursing
loans and, where the MFI takes deposits, for payment of withdrawals. For these
reasons deposit-taking MFIs normally keep a substantial amount of their assets in
cash and bank balances or near liquid investments such as treasury bills with short
time maturity periods. In non-financial institutions cash and bank balances can also
be used to purchase raw materials used in the production process.
3. Investments that appear in both balance sheets are significant for both institutions.
4. The balance sheet of a non-financial firm shows that debtors (receivables), work in
progress (raw material) and closing stock (inventory) are a major feature, which is
not the case with an MFI.
5. The biggest asset of an MFI is the loan portfolio. A non-financial firm does not
have loan portfolio in its balance sheet. In addition, for a deposit-taking MFI loan
portfolio is partly financed by public deposits.
6. Finally, the equity and retained earnings appear in both balance sheets. For many
MFIs a major source of equity is donations, which is seldom the case for many
private non-financial firms. Borrowings are also reflected as a source of funds for
financing assets of both institutions, except that for MFIs a significant portion of the
borrowings may be from public savings or loans contracted at below the market rate
(subsidised), whereas a private non-financial firm usually borrows at a market rate.
From the perspective of the production process and the framework for decision making, an
MFI is not significantly different from the firm in the theory of the firm. Differences
emerge from the nature of inputs used in production, the institutional set-up, product
delivery methods, terms and conditions of product delivery, and the type of output
produced. Thus, the theory of the firm can still be applied to explain the behaviour of
microfinance institutions, because the decision variables essentially remain the same and
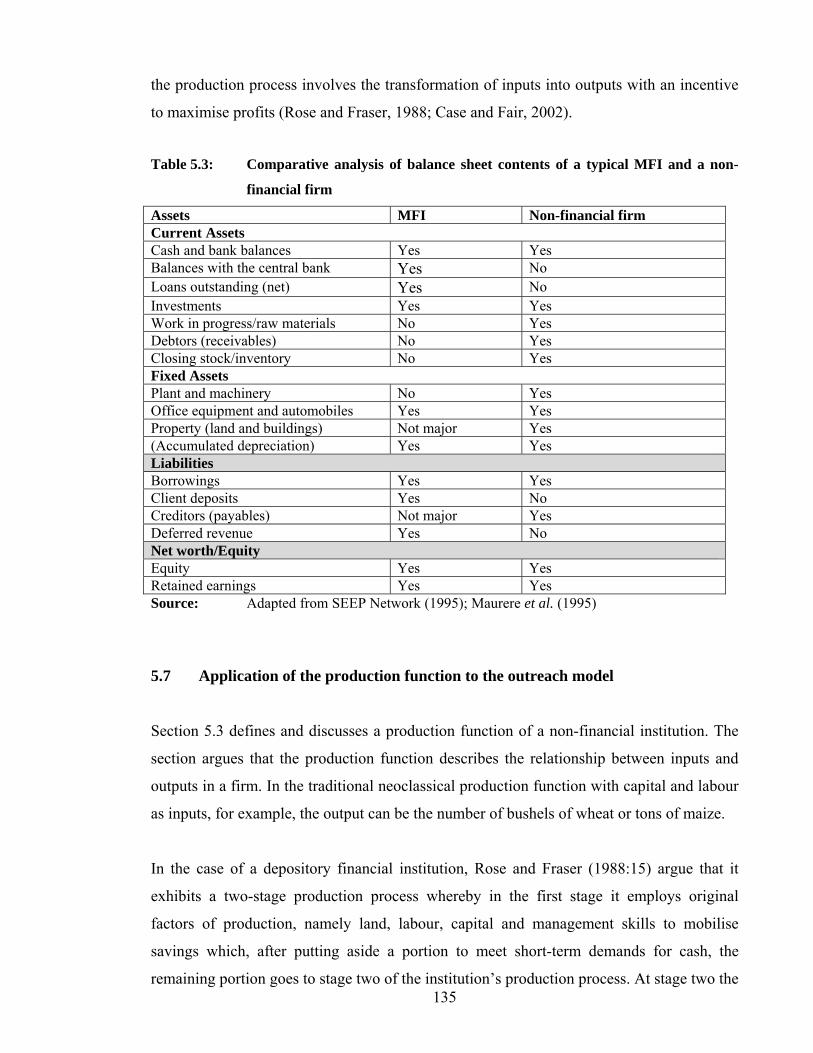
135
the production process involves the transformation of inputs into outputs with an incentive
to maximise profits (Rose and Fraser, 1988; Case and Fair, 2002).
Table 5.3: Comparative analysis of balance sheet contents of a typical MFI and a non-
financial firm
Assets MFI Non-financial firm Current Assets Cash and bank balances Yes Yes Balances with the central bank Yes No Loans outstanding (net) Yes No Investments Yes Yes Work in progress/raw materials No Yes Debtors (receivables) No Yes Closing stock/inventory No Yes Fixed Assets Plant and machinery No Yes Office equipment and automobiles Yes Yes Property (land and buildings) Not major Yes (Accumulated depreciation) Yes Yes Liabilities Borrowings Yes Yes Client deposits Yes No Creditors (payables) Not major Yes Deferred revenue Yes No Net worth/Equity Equity Yes Yes Retained earnings Yes Yes Source: Adapted from SEEP Network (1995); Maurere et al. (1995)
5.7 Application of the production function to the outreach model
Section 5.3 defines and discusses a production function of a non-financial institution. The
section argues that the production function describes the relationship between inputs and
outputs in a firm. In the traditional neoclassical production function with capital and labour
as inputs, for example, the output can be the number of bushels of wheat or tons of maize.
In the case of a depository financial institution, Rose and Fraser (1988:15) argue that it
exhibits a two-stage production process whereby in the first stage it employs original
factors of production, namely land, labour, capital and management skills to mobilise
savings which, after putting aside a portion to meet short-term demands for cash, the
remaining portion goes to stage two of the institution’s production process. At stage two the
136
financial institution continues to utilise the original factors of production, which are then
augmented by the remaining portion of savings generated in the first stage.
Using the factors of production described above, a depository financial institution can
provide a range of services depending on its legal status. For example, a commercial bank
in Uganda accepts deposits (call, demand, savings and time), provides loans, overdrafts,
foreign exchange, participates in inter-bank clearing systems, and provides and assumes
guarantees, bonds, and other warranties on behalf of others (Financial Institutions Act,
2004). An MDI accepts deposits (mainly savings) and extends loans (MDI Act, 2003).
Traditionally, outputs of financial institutions such as commercial banks and MDIs are
measured in terms of values of services provided. However, based on the principle on
which national income and product accounts are compiled, it is argued in this study that the
output of these institutions can also be measured, for example, in terms of the number of
depositors and borrowers, since deposits and loans are deposited and received by depositors
and borrowers respectively, often referred to as clients (see sub-sections 3.3.2 and 4.2.3.5).
Denoting the number of clients served by an MFI in a defined period by OUTR, land by
LAND, labour by L, capital by K, management skills by GM, and additional loan funds
from savings by D, the production function of a deposit-taking microfinance institution can
be represented as
OUTR = f[LAND, L, K, GM, D]-----------------------------------------------------------------5.16
Equation 5.16 is comparable to equation 5.2 (section 5.3), implying that the determinants of
outreach can be analysed within the framework of a production function.
For a non-depository MFI, D = 0. For reasons given in sub-section 5.3.1, LAND and K are
normally combined, which reduces equation 5.16 to equation 5.17. GM, discussed in
Chapter Four under governance and replaced by GINDEX in Chapter Seven, captures the
influence of an increasingly important role played by institutional structures in
organisational performance (Rutherford, 1996; Kasper and Streit, 1998; Williamson, 1981;
Leibenstein, 1966).
137
OUTR = f[L, AK, GM]----------------------------------------------------------------------------5.17
where AK is K+D + LAND.
The effects of offering savings product for outreach examined in sub-section 4.2.4 is
captured in equation 5.18 by the variable, SP (a dummy variable explained in Chapter
Seven),
OUTR = f[L, AK, GM, SP]------------------------------------------------------------------------5.18
In addition to the determinants of OUTR specified in equation 5.18, Chapter Four identifies
the following determinants of outreach: real effective lending interest rates (RELRD),
average loan size relative to the national per capita income (AvLz)), the unit cost of loans
disbursed (CLD), the dominant product delivery method (DDM, a dummy variable
explained in Chapter Seven), debt-equity ratio (DER), the legal status (LS, a dummy
variable explained in Chapter Seven), and the age of the institution (AGE), all captured in
equation 5.19. Note that all these variables are fully described in Chapter Seven.
OUTR = f[L, AK, GM, SP, RELRD, AvLz, CLD, DDM, DER, LS, AGE]----------------5.19
All the variables in equation 5.19 are defined on L ≥ 0, AK ≥ 0, GM ≥ 0, RELRD ≥ 0,
AvLz ≥ 0, AGE ≥ 0, DER≥ 0, and CLD ≥ 0 are single-valued, continuous and at least twice
differentiable. Factor inputs L and part of AK can be viewed as traditional factors of
production according to the neoclassical production theory (equation 5.2) and are captured
by WL and GOLP respectively (see Chapter Seven).
In the traditional production function L and AK are considered homogenous factor inputs
measured in terms of services provided per unit of time. Where data on input per unit of
time are not available, the inputs are typically measured by the amount utilised or available
in the production process. Labour is typically measured as man-hours employed, sometimes
as the number of employees or labour costs per period (Varian, 1992; Inrtilligator et al.,
138
1996). In this study labour has been measured in terms of salary/wage bill, because it was
difficult to capture data in terms of man-hours.
Capital input is typically measured by net capital stock (net of appreciation) or sometimes
by the gross capital stock and certain direct measures, such as the number of tractors in use
in agriculture. To avoid the complexities involved in the measurement of capital, in this
study GOLP has been used as a proxy for capital or AK (Intrilligator et al., 1996:263).
5.8 Application of the profit function to the sustainability model
Chapter Three (sub-section 3.2.2) examines the relationship between profitability and
sustainability, thereby conceptually laying the framework for estimating the sustainability
model in this study. This section concentrates on identifying the determinants of
sustainability within the framework of a profit function discussed in section 5.4, and also
taking into account the relationship between profitability and sustainability discussed in
sub-section 3.2.2. To do this, equation 3.3 is reproduced below:
Π = P*Q–TC-----------------------------------------------------------------------------------------5.20
where Π, P, Q and TC are as defined before. In the traditional profit model (equation 5.20),
the factors that affect the profit levels are average price (P), output (Q), average price of
inputs (c), and quantity of inputs (X) – See equation 5.12, section 5.4. In the sustainability
model measured by OSS, the determinants of sustainability are shown in equation 5.21
reproduced from equation 4.4 in Chapter Four.
OSS = [[((NSB+NRB*ANT)*AvLz*i)][1-γ]+Z]/[FINCO+OPCO+LLP] -----------------5.21
The variables are as defined before.
Comparing the variables in equations 5.20 and 5.21, as argued in Chapter Three, P can be
equated to appropriately combined i and Z; (NSB+(NRB*ANT))*AvLz can be equated to
Q; and FINCO+OPCO+LLP can be equated to TC. This leaves out the rate of default (γ)
discussed in Chapter Four under repayment rate and the implications for sustainability and
139
outreach. γ is treated as a cost in the sustainability and outreach models (see sub-section
4.2.6).
In addition to the real effective lending interest rates (RELRD), average loan size relative to
the national per capita income (AvLz)), and the unit cost of loans disbursed (CLD), other
determinants of sustainability identified and discussed in Chapter Four are: DDM, DER,
LS, GM and AGE. Thus, together with L, AK and SP, the determinants of sustainability
can be specified as
OSS = f[L, AK, SP, RELRD, AvLz, CLD, DDM, DER, LS, GM, AGE]------------------5.22
All the variables in equation 5.22 are defined on L ≥ 0, AK ≥ 0, GM ≥ 0, RELRD ≥ 0,
AvLz ≥ 0, AGE ≥ 0, DER≥ 0 and CLD ≥ 0, and? are a single-valued, continuous and at
least twice differentiable. Note that in Chapter Seven L is denoted by WL, GM is denoted
by GINDEX, and AK is denoted by GOLP.
5.9 Summary of the determinants of sustainability and outreach, and the hypotheses
Section 4.2 has presented and analysed the determinants of sustainability and outreach
based on the literature surveyed. Up to this section, Chapter Five has examined the
determinants of sustainability and outreach in the context of the theory of firm. Table 5.4
gives a summary of these determinants and the hypotheses.
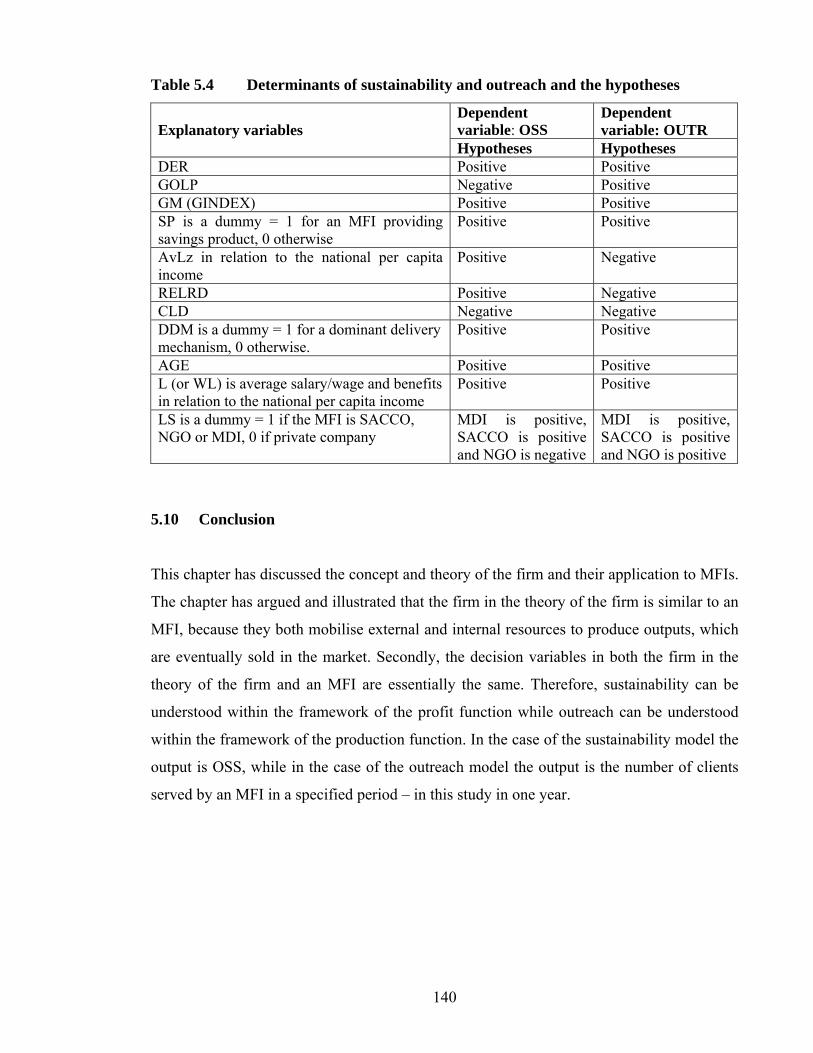
140
Table 5.4 Determinants of sustainability and outreach and the hypotheses
Dependent variable: OSS
Dependent variable: OUTR
Explanatory variables
Hypotheses Hypotheses DER Positive Positive GOLP Negative Positive GM (GINDEX) Positive Positive SP is a dummy = 1 for an MFI providing savings product, 0 otherwise
Positive Positive
AvLz in relation to the national per capita income
Positive Negative
RELRD Positive Negative CLD Negative Negative DDM is a dummy = 1 for a dominant delivery mechanism, 0 otherwise.
Positive Positive
AGE Positive Positive L (or WL) is average salary/wage and benefits in relation to the national per capita income
Positive Positive
LS is a dummy = 1 if the MFI is SACCO, NGO or MDI, 0 if private company
MDI is positive, SACCO is positive and NGO is negative
MDI is positive, SACCO is positive and NGO is positive
5.10 Conclusion
This chapter has discussed the concept and theory of the firm and their application to MFIs.
The chapter has argued and illustrated that the firm in the theory of the firm is similar to an
MFI, because they both mobilise external and internal resources to produce outputs, which
are eventually sold in the market. Secondly, the decision variables in both the firm in the
theory of the firm and an MFI are essentially the same. Therefore, sustainability can be
understood within the framework of the profit function while outreach can be understood
within the framework of the production function. In the case of the sustainability model the
output is OSS, while in the case of the outreach model the output is the number of clients
served by an MFI in a specified period – in this study in one year.
141
CHAPTER SIX: REGULATION OF MICROFINANCE INSTITUTIONS AND
THE EFFECTS ON SUSTAINABILITY AND OUTREACH
6.2 Introduction
The literature indicates that one of the compelling reasons for financial regulation is the
asymmetric distribution of information between the depositors and depository
intermediaries, on the one hand, and the lending institutions and the borrowers, on the other
hand (Staschen, 1999:4; Schmidt and Willardson, 2004). In view of this argument and
given that microfinance activities are both rapidly expanding and seen as a tool for poverty
alleviation, and the development of financial systems in many developing countries, there
have been widespread discussions on whether or not to regulate microfinance institutions
(Ledgerwood, 1999; Staschen, 1999; CGAP, 2000; AMFIU, 2005; Ledgerwood and White,
2006). If there is to be regulation, then when, how and what should be regulated and what
are the implications for sustainability and outreach? Answers to these questions are
important for the regulators, practitioners, clients and the economy as a whole.
In Uganda a legal and regulatory framework, called the MDI Act, 2003, was enacted to
provide a licensing and regulatory framework for MFIs. In addition, and as required by the
MDI Act, 2003, the government of Uganda (GOU) has issued a statutory instruments
supplement (Implementing Regulations) to provide supervisory benchmarks for the
licensed MFIs (Bank of Uganda, 2004). The Act and the Implementing Regulations define
the boundaries within which the microfinance business can be conducted. For example, the
Act and the Implementing Regulations define what constitutes a microfinance business,
how a potential applicant can be licensed, the minimum capital requirement, ongoing
capital requirements, and so forth. An outline of this regulation and other banking laws in
Uganda, and their effects on sustainability and outreach of MFIs from a theoretical and
empirical perspective, are presented and analysed in sub-section 6.4.2.
Generally, three main reasons are considered fundamental for regulating MFIs, namely, 1)
to provide a legal mandate for the institutions to engage in mobilising savings from the
general public for intermediation; 2) to protect depositors; and 3) to ensure the safety and
soundness of the financial system (Rose and Fraser, 1988; Chaves and Gonzalez-Vega,
142
1994, 1995; Ledgerwood, 1999; Falkena and Llewellyn, 1999; Carmichael and
Pomerleano, 2002; Theodore and Loubiere, 2002; AMFIU, 2005; Ledgerwood and White,
2006). As argued in section 6.3, the latter two reasons are not mutually exclusive, as
attainment of one embodies attainment of the other.
However, while regulation of MFIs is considered a necessary intervention to protect
depositors and promote economic growth, it should not limit the capacity of the financial
sector to evolve. That is, the costs of regulation should be weighed against the benefits, so
that it does not turn out to be more costly to regulate than not to regulate. Furthermore,
given the twin long-term goals of MFIs, namely, outreach and sustainability, the question
of the possible effects of regulating MFIs on these goals naturally comes to mind. This
chapter surveys the literature on costs and benefits of regulating MFIs and the possible
effects on their sustainability and outreach.
The chapter is arranged as follows. The concept of regulation and financial regulation are
discussed in section 6.2 to lay a foundation for analysing the benefits and costs of
regulating the financial system as a whole and MFIs in particular (section 6.3). In section
6.4 the instruments for financial regulation of MFIs are presented and their effects on
sustainability and outreach analysed, mainly within the Ugandan context. In sub-sections
6.4.2.1 to 6.4.2.5 the key provisions using the CAMEL framework are first outlined under
A and their possible effects on sustainability and outreach of MFIs are investigated under
B. Note that the S component of the CAMELS is not analysed in the subsequent
discussions, because it has not yet been developed into a framework that would lend itself
to a rigorous assessment. In sub-sections 6.4.2.6 to 6.4.2.8 other key provisions of the MDI
Act, 2003 are outlined under A and their possible effects on sustainability and outreach of
MFIs are investigated under B. Section 6.5 concludes the chapter.
6.2 The concept of financial regulation
Financial regulation, which is the focus of this chapter, is a sub-set of regulation. In this
regard this section first defines regulation as a set of enforceable rules that restricts or
directs the actions of market participants and, as a result, alters the outcomes of those
actions. These rules are binding on the entities and individuals involved. Carmichael and
143
Pomerleano (2002:22) define financial regulation as rules that govern commercial
behaviour in the financial system, while Ledgerwood (1999:20) defines it as a body of
principles, rules, standards and compliance procedures that apply to financial institutions.
Financial regulation can be: i) prudential or preventative, and ii) protective. Chaves and
Gonzalez-Vega (1994:56) define prudential financial regulation as a set of general rules or
legal rules that aim to contribute to the stable and efficient performance of the financial
institutions and markets (see AMFIU, 2005:52). Protective regulations offer protection to
depositors or the intermediaries taking the deposits. Such protection takes the form of a
deposit insurance fund and emergency assistance or bailouts.
6.3 Economic benefits and costs of regulating the financial system with emphasis
on the microfinance institutions
6.3.1 Economic benefits for regulating the financial system
Economists generally agree that the scarcity of resources in relation to the demand for them
can be adequately addressed in perfectly competitive markets. In the financial sector it is
widely acknowledged that the market fails due to one or more of the following reasons: (i)
anti competitive behaviour; (ii) market misconduct; (iii) information asymmetry; and (iv)
systemic instability (Carmichael and Pomerleano, 2002:25).
In addition, Llewellyn (1995, as cited in Jordaan, 1997:31) argues that market
imperfections or failures that would justify regulation are: (i) inadequate depositors'
protection; (ii) under-investment in information by consumers; and (iii) inability of the
depositors to assess the quality of financial products and institutions. While under-
investment in information by consumers leads to information asymmetry, it is also the
result of depositors being resource constrained. This implies that with adequate resources at
the disposal of the depositors, ceteris paribus, the purpose of regulation becomes
redundant.
Chaves and Gonzalez-Vega (1994:56) identify three basic goals for government
intervention in the financial sector: 1) ensure solvency and financial soundness of all
144
intermediaries in order to protect payments system; 2) protection of depositors; and 3)
ensure efficient system performance and competition. Reasons 1 and 2 are embodied, but
the competitive aspect of reason 3 may conflict with the goal of protecting the consumers
and securing the payments system, because competition tends to weed out inefficient
financial institutions, which may jeopardise the deposits in those institutions, thus affecting
the confidence of the depositors in the system.
The discussions of the reasons for financial regulation can be grouped under two theories:
public and private interest, also known as regulatory capture theory (See Jordaan, 1997).
Under the public interest theory, financial regulation is an attempt to create a ‘second best’
market to improve on the stability of the financial system and protect small depositors.
Regulatory capture, on the other hand, results from the interplay of political and economic
interests in the regulated industry (AMFIU, 2005; Jordaan, 1997; Samuelson and Nordhaus,
1996). The theory posits that regulation is the outcome of a struggle between various
interest groups, each of which seeks to ultimately maximise its own economic benefits.
These benefits take various forms including profits that go to the regulated institutions, and
votes and stakes in the regulated firms that go to the regulators or lawmakers.
Thus, while the regulators may have been initially motivated by public interest, over time
they become corrupted or captured, and design regulation that is both in their own interests
and in the interests of the more powerful regulated institutions. While this theory appears
plausible, it is generally agreed that financial regulation is in the interest of the economy or
the public, because of the grave potential consequences that may result from any improper
practices.
6.3.2 Economic benefits of regulating microfinance institutions
Several reasons have been advanced for regulating MFIs. CGAP (2000:1-2) identifies the
following specific objectives for regulating microfinance institutions:
1. The desire for the unlicensed MFIs to take deposits from the public for
intermediation. In the process the MFIs extend deposit facilities such as savings to the
145
rural poor to fill the gap left by the traditional banks (The Microfinance Network,
1997; Van Greuning et al., 1999; CGAP, 1996; Robinson, 2001a). It is argued that the
poor and their enterprises can and do save. All they lack is access to safe and
appropriate savings facilities and instruments (Rutherford, 1999; The Microfinance
Network, 1999; CGAP, 2004:3);
2. Some MFIs, governments and the donor community believe that regulation will
promote and improve the MFI business and their operations through adopting
standards of good practice contained in the regulatory instruments, thereby creating
an environment for the emergence of sustainable MFIs through deposit mobilisation
and prudent lending (Ledgerwood, 1999; Ledgerwood and White, 2006);
3. Because of the nature of their operations many MFIs charge high interest rates that
some authorities think are exploitative. As a result regulatory authorities want to curb
the high interest rates through regulatory means;
4. Where MFIs are already taking deposits, regulatory authorities are interested in
setting up a legal framework to protect the depositors. Similarly, Ledgerwood
(1999:20) and Ledgerwood and White (2006:22) argue that MFIs should be regulated
if and when they mobilise deposits from the public, because individual depositors
cannot be expected to monitor the health of an MFI due to information asymmetry
and inability to invest in information gathering and analysis. In this regard regulation
and supervision of MFIs, like other financial institutions, is viewed as a public good
that should be provided by the state;
5. In some countries, faced with the weaknesses of MFIs and poor coordination within
the industry, authorities have embraced the regulation of MFIs in order to address
these problems through restricting entry into microfinance business;
6. Consistent with Hannig and Bruan’s (2000:8) and Ledgerwood and White’s (2006:22)
arguments, regulatory authorities sometimes react to political interests that motivate
them to regulate microfinance institutions; and
146
7. Finally, arising from the huge and growing demand for financial services offered by
MFIs, and the fact that in developing countries almost all of them rely exclusively on
donor funding, their regulation is widely viewed as a vehicle for raising funding from
commercial sources to be able to cope with the expanding demand for financial
services, while simultaneously ensuring institutional sustainability (see Christen with
Drake, 2002; Ledgerwood and White, 2006).
Also important to note is the question of ownership and governance. Banks are generally
strong because they are required to have clear corporate structures, competent boards of
directors and management teams defined by a relatively high level of academic and other
qualifications as well as experience (GOU, 2003, 2005; BOU, 2004). In addition, there
should be effective internal controls and documented policies and procedures. As much as
the regulatory requirements impose costs on the institutions being regulated, they also
strengthen corporate governance. Based on these reasons, it is generally believed that
regulated MFIs will be strong institutions in the same way that banks are.
Equally significant is the likelihood of banks linking with the regulated MFIs either by
lending to them or through them to the final clients. While there is limited empirical
evidence to back this hypothesis, the increasing competition in the stronghold of the
traditional commercial banks may force them to identify new avenues to expand their
services. Rhyne and Otero (2006:4) and UNESCAP (2006:5) report that the formal banking
sector has started entering the microfinance market and is competing with specialised
MFIs. Regulation of MFIs, thus, offers an opportunity for them to link with banks, which
may lead to reduced costs of funds, increased access to loan funds and increased outreach
(Accion International, 2007:2).
In the context of sustainability and outreach, those arguing in favour of regulating MFIs can
be grouped in two camps: those in support of extending financial services to the low-
income sections of the population (poverty camp), and those in favour of institutional
sustainability (sustainability or institutionalist' camp) (Woller et al., 1999; Mathie, 2002).
Protection of depositors forms part of both the sustainability and the poverty camps.
Savings are considered a source of relatively cheap funds for MFIs, while protection of
savings is considered more important to low-income earners than the wealthier ones,
147
because the marginal value associated with the loss of a unit of savings by a poor person is
higher than the loss of the same unit by a wealthier one (Rutherford, 1999).
For the regulatory authorities the primary concern for regulating the financial system is to
protect small depositors and to ensure that reckless lending does not threaten the stability of
the financial system. Access to financial services by low-income earners is a secondary
issue. In addition, because of the large number of existing MFIs, the majority of which are
relatively small, regulators are more inclined to reduce the cost of regulation by restricting
the number of licensed microfinance operators under their supervision (Hannig and Bruan,
2000; Microfinance Network, 1997, 1995).
Furthermore, hitherto regulators in some developing countries have been more familiar
with conventional banking operations. Because of the operations of MFIs that are more
rural based, the regulators would need to build their capacity in microfinance regulation and
increase the number of personnel if they are to be effective (Hannig and Braun, 2000:13;
Theodore and Loubiere, 2002). With increased operational expenses as a result of increased
and more intense levels of operations, these requirements pose a big challenge to the
regulators. On the other hand, the MFIs and the advocates of MFIs as a tool for poverty
alleviation are more inclined to see MFIs regulated as development finance institutions that
give them the leeway to emphasise outreach as well as sustainability.
Arising from the dichotomous views of the regulators and proponents of MFIs as vehicles
for poverty alleviation, regulators are faced with the challenge of addressing the necessity
of regulating MFIs based on the principles of sustainability and regulating them as
development finance institutions.
In Uganda the regulators have underpinned the need to ensure the safety and soundness of
microfinance operations in the long term as opposed to regulating them as development
finance institutions. This decision has been premised on the belief that financial self-
sufficiency is a pre-requisite for expanding outreach based on experiences of regulated
MFIs such as BancoSol and Caja Los Andes in Bolivia.
148
6.3.3 Economic costs of regulating microfinance institutions
Staschen (1999:4) observes that in every regulation costs are incurred. However, the critical
costs are the additional costs incurred as a result of financial regulation. These costs can be
incurred by the regulators, the regulated MFIs, the regulated industry, the clients of the
MFIs, and/or the economy as a whole. Who finally bears these costs is influenced by the
extent to which the costs can be shifted to other parties. In the following sub-sections, these
costs are discussed.
6.3.3.1 Economic costs of regulating MFIs for the regulators
The costs of regulating MFIs for the regulators arise mainly from: 1) licensing the MFIs; 2)
supervision of the licensed MFIs; and 3) management take-over, closing down the MFI,
and/or liquidation (see AMFIU, 2005:53). Kay and Vickers (1988:14) argue that licensing
and supervision entail regulation of structure and conduct respectively.
1) Economic costs of licensing MFIs (regulation of structure)
It is a regulatory requirement that before an agent undertakes any activity that is being
regulated, that agent must seek and obtain permission from the regulatory authorities. To be
granted such permission, the applicants are usually asked to satisfy prescribed
requirements. For example, to be granted an MDI licence in Uganda, the applicant is
required, among other things, to submit to the regulator the following (Government of
Uganda, 2003:15):
(a) a copy of the memorandum of association and articles of association or other
instruments under which the company is incorporated;
(b) verified official notification of the company’s registered place of business;
(c) the prospective places of operation, indicating that of the head office and branches;
(d) biographical data on each of the founders, proposed directors and officers;
(e) the information which is necessary for assessing the trustworthiness of the
applicant;
149
(f) the information which is necessary for assessing the professional qualifications, as
required for managing the institution, and the proprietors;
(g) a copy of the latest balance sheet of the company or such other suitable evidence of
the resources needed for business operations; and
(h) a feasibility study of the company showing the nature of the planned business,
organisational structure and planned internal monitoring procedures as well as the
strategic vision, mission and objectives of the company.
On receiving the application together with the required documentation, the licensing
authority scrutinises and verifies it to ensure that the applicant satisfies all the conditions
laid down. To execute this, the regulator needs to employ people with the requisite skills. In
some instances the regulator has to carry out intelligence work to verify the information
submitted. Executing these activities incurs costs in terms of time and finance, and to the
extent that the regulator cannot transfer these costs to the applicants, they (costs) have to be
borne by the regulator.
Related to the cost of licensing the MFIs is the cost of publishing the names of companies
authorised to transact the business of a microfinance institution in a given country. In
Uganda, for example, the Central Bank is required, once a year, to publish in a newspaper
circulating in the whole country the names of all the companies authorised to conduct
microfinance business locally (Government of Uganda, 2003:19). This can involve a
significant amount of money.
2. Economic cost of supervision of the licensed MFIs (regulation of conduct)
Financial supervision involves examining, monitoring and directing licensed organisations
to ensure compliance with the regulatory requirements (Chaves and Gonzalez-Vega,
1994:67; AMFIU, 2005:53). Traditionally supervisors use two approaches in the process of
supervising licensed financial institutions: off-site and on-site supervision. Off-site
supervision is done through analysis of the statutory returns submitted by the regulated
financial institutions primarily to determine compliance with the regulatory requirements.
150
To determine compliance with the regulatory requirements, key statutory ratios, namely
capital adequacy ratios (CARs), liquidity ratios, profitability ratios (e.g. ROE and ROA),
credit limits and provisions for loan portfolio, are computed. Other analyses done include
examining the steps designed to mitigate against: (1) strategic risk;30 (2) credit risk;31 (3)
operational risk;32 (4) liquidity risk; and (5) market risk. Some of the most important board
committees required by the regulators to be in place in a financial institution for the
purpose of risk assessment and management are: audit, asset/liability management and
staff. Qualitative indicators are normally verified during on-site supervision.
On-site supervision involves undertaking on-site visits by a team of examiners from the
regulatory authority for on-the-spot observations and verification. Activities undertaken
during such supervision include authenticating the documents submitted to the supervisor
for off-site supervision, establishing whether all the positions in the organisational structure
are filled, assessing whether the reported assets are of the desired quality, etc. While the
process of undertaking the on-site visits varies from one regulatory authority to another, it
is a common practice that, before departing, teams going for on-site supervision have to be
constituted and substantially prepared, especially with respect to gathering the necessary
documents and scrutinising them to obtain clues on the areas that they should concentrate
on while conducting the on-site supervision.
Depending on the size of the institution to be visited, its level of automation, its
performance status and the variety of skills required in a team, a typical team of examiners
can be 3-4 people (Opio et al., 2003). It is often recommended, for example in the BOU,
that on-site supervision should be done in teams to safeguard the integrity of supervisors
and enhance teamwork. The number of days spent in the field also depends on the size of
the institution visited, its level of automation and its status as derived from the off-site
analysis.
30 Including the level of growth and expansion of the institution, and the extent to which investment is diversified. 31 Covering new products and their testing in the market, credit policies and procedures, and credit administration. 32 With an emphasis on internal audit, branch network and internal controls, reconciliation, cash management, and management information systems (MIS).
151
The requirements of the bank supervisors during on-site visits vary from country to
country. Generally, however, they require facilitation in form of vehicles, per diems,
contingency allowances, and in some instances personal, vehicles and equipment insurance.
These often amount to a relatively significant cost to the regulator.
3. Economic cost of management take-over and liquidation of the MFIs
Regulation is basically a three-phased activity: (1) the licensing phase, which may be
equated to the entry phase; (2) the ongoing phase; and (3) the exit phase. Often the focus is
on the first two phases discussed above. In practice there is no economy or sector where
licensed organisations do not collapse. One main reason why a financial institution (and
indeed any other organisation) may collapse is if it is insolvent (Ochieng, 1998:2; Saltzman
and Salinger, 1998).
The MDI Act, 2003 provides that, where the Central Bank considers that an institution is in
an unsound financial condition and is not operating in accordance with sound
administrative and accounting practices and procedures, the Central Bank may take it over
and eventually close it down. This may be described as the exit phase and the regulator
incurs costs in the process. The magnitude of the cost, however, depends on the provisions
of the legislation. In the case of Uganda the cost of management take-over is fully met by
the regulated financial institution. However, the Central Bank may incur costs in terms of
expenses on staff and security required to close down a financial institution.
From the above analysis it can be concluded that the main cost of regulating MFIs for the
regulator comes from supervision. CGAP (2000:6) argues that, while the costs of the
supervisory agency itself tends to be relatively low in the case of banks, supervision of
MFIs is likely to be more expensive, because of their relatively small asset base, large
numbers of low value accounts, high degree of decentralisation and the labour-intensive
nature of the operations. Moreover, for banks the supervisory costs may be transferred to
the clients in the form of additional costs. This may not be the case for MFIs.
In cases where the regulators are not familiar with microfinance operations, to begin to do
so means that the regulators will have to undergo training to know how the MFIs operate
152
and then design an appropriate regulatory and supervisory framework for implementation.
This process may require recruitment of additional staff, additional training and facilitation
with more physical equipment. Besides, the regulators may require improved information
management systems and other necessary internal controls. All of these have financial
implications and could incur substantial direct costs for the regulators.
In Bolivia, for example, the regulators of the MFIs incurred high start-up costs in
establishing an adequate management information system with an internal private network
allowing for real-time reporting from each MFI (Theodore and Loubiere, 2002:261).
Another area of expenditure for the Bolivian regulators was training staff. However, the
ongoing costs are reported to be lower, although data were not available to determine the
level of specific costs, because of the integrated nature of operations. This implies that the
regulators need to be cognisant of additional regulatory costs to be able evaluate the
benefits against the costs of regulation.
6.3.3.2 Economic costs of regulating MFIs for the MFIs
Empirical literature on the direct costs of regulation for the regulated MFIs is very scanty.
This is probably because quantification and attribution of the costs incurred in the process
of financial regulation has proved to be difficult in practice. Nevertheless, there have been
estimates of the costs generally referred to as compliance costs (i.e. the extra costs incurred
by the regulated institutions in the process of complying with the regulations) as well as
costs incurred in the process of preparing to be regulated (Microfinance Network, 1997). In
a liberalised financial sector, these costs are incurred in the form of payment for a licence,
installing and maintaining a management information system (MIS), communication
systems, stationery, personnel, training, installation and maintenance of the physical
infrastructure, report transmission and publications costs.
Ledgerwood and White (2006:459) report that Uganda Microfinance Limited took three
years to prepare to become an MDI, during which period there were intensive preparations,
planning and negotiations. Activities performed included restructuring operations,
formalising policies and procedures, hiring new staff and investing in training, upgrading
systems, redesigning products and negotiating with potential investors.
153
There are also direct costs such as the cost of financing a deposit insurance fund and other
contributions stipulated in the regulations. These costs, however, do not include those
incurred in the process of securing a licence (see sub-section 6.3.3.1(1)), which could be
substantial – so much so that many potential MFIs actually fail to meet them. Based largely
on the experience of Uganda, Ledgerwood and White (2006:xxxiii) report that transforming
to a regulated financial institution entails a considerable amount of financial and human
resources as well as significant commitment from the board and management. However, the
authors hasten to add that these costs can be recovered as a result of a steady flow of lower-
cost funding and higher economies of scale exploited after obtaining a licence. The latter
assertion remains an issue to be empirically tested/verified.
According to the Microfinance Network (1995:32), estimates of the costs of complying
with financial regulations such as disclosure and reporting range from 30 per cent of the
total profits of the MFIs in the United States to 20 per cent of the total operating costs of
the MFIs in Colombia. In Bolivia CGAP (2000:6) reports that complying with the bank
superintendency’s reporting requirements alone costs an amount equal to 5 per cent of the
bank’s portfolio in the bank’s first year of operation, but this declined over the years to 1
per cent. In Uganda, only to get a licence an MDI is required to pay a minimum of US$600
annually. Banks that provide microfinance pay more than US$600 annually for a licence
(Bank of Uganda, 2004).
Non-quantifiable costs of regulation to the regulated financial institutions are mainly
associated with the time consumed in the process of preparing reports for the regulators,
responding to regulators’ queries whenever they arise, preparing for on-site visits and time
spent in meetings with the regulators, and on the possibility of innovation being stifled
(CGAP, 2000). For example, the MFI may be compelled to abandon its original corporate
culture such as flexible operating procedures, informal communication patterns and close-
knit personal relations in favour of formal, standardised methods of work (Ledgerwood and
White, 2006:460). Although it is difficult to attach a monetary value on the time consumed
in complying with the regulatory requirements in terms of opportunity costs and the shift to
standardized methods of operations, it is perceived to be quite substantial.
154
6.3.3.3 Economic costs of regulating MFIs for the microfinance industry, their clients
and the economy
The costs of regulating microfinance institutions for the microfinance industry, their clients
and the economy as a whole is difficult to determine with any precision as they tend to arise
from moral hazard and institutional failure. For example, MFI management may believe
that, if the amount of money lent to a certain type of borrower is less than the prescribed
regulatory limit, then the amount lent is safe. Regulation thus may induce the regulated
institutions to take more risks as long as they avoid violating the prescribed regulatory
benchmarks, leading to a possible reduction in the level of prudence, which in turn may
increase the danger intended to be avoided. In the case of an MFI collapse, it may be a cost
for the microfinance industry and the economy in terms of loss of confidence in the
financial sector. This may be detrimental for savings mobilisation and investment, and
therefore economic growth.
Moral hazard could also be a real problem from the depositors’ perspective. In the absence
of regulation, depositors would have to evaluate the safety of the financial institutions in
which to deposit their funds, but because of regulation the depositors assume that the
regulated institutions are safe. Where a depositors protection fund exits, the depositors may
assume that their funds will be refunded in case of the collapse of the financial institutions
in which they have deposited their funds. While this is a benefit arising from regulation
leading to the confidence people have in the financial institutions, if the depositors put
funds in excess of what can be legally compensated, this may make it easier for badly
managed financial institutions to access funds that they could put at risk. According to
Jordaan (1997), Di Cagno (1990) shows that banks are likely to react to regulations by
increasing the level of risk of their loan portfolios in order to compensate for the costs of
regulation by investing in high-yielding but more risky ventures.
Another set of costs of regulating MFIs for the industry, their clients and the economy
arises from the agents performing fewer transactions than they would normally do in the
absence of regulation and restricted competition (AMFIU, 2005:53). As already argued,
complying with regulatory standards requires additional inputs in terms of time and other
resources. These additional requirements do not only impose restrictions on entry into the
155
industry, but they also imply that the existing institutions have to increase their resource
outlay to maintain or increase their volume of operations. As a result there is bound to be
reduced amount of activity at the MFI level and reduced competition at the industry level if
the MFI cannot increase its resource base. This could be translated into an overall reduction
in the level of expansion and efficiency in the economy.
6.4 Instruments for financial regulation and the possible effects on sustainability
and outreach of microfinance institutions
6.4.3 Instruments for financial regulation in Uganda
Section 6.2 spells out the forms of financial regulation that this study focuses on. These are
usually externally imposed by the state through the enactment of laws and regulations that
are hereafter called instruments. The Parliament of Uganda enacts the financial sector laws
and the responsible ministers issue supplements on statutory instruments detailing the
regulations. In 2003 Parliament enacted the MDI Act, 2003 and the Minister in charge of
the financial sector issued a Statutory Instruments Supplement No. 34, 2004, called
Implementing Regulations.
In general the instruments that provide for licensing financial institutions in Uganda include
the BOU Statute of 1993, the Financial Institutions Act (FIA) of 2004, the MDI Act of
2003, the Uganda Development Bank Act of 1972, the NGO Statute of 1989, the Co-
operatives Act of 1991, Chapter 85 of the Companies Act of 1964, and the Moneylenders
Act of 1952. Commercial banks and credit institutions are licensed under the FIA, 2004 and
the MDIs are licensed under the MDI Act, 2003, all of which are supervised by the BOU
(BOU, 1999). Other MFIs, categorised as Tier 4 MFIs, are not licensed under these laws
and are not supervised by the BOU (BOU, 1999). They are licensed under other
instruments listed above (see Staschen and Akampurira, 2003:2). MFIs licensed under the
MDI Act, 2003 are called MDIs.
156
6.4.2 Possible effects of financial regulation of MFIs on their sustainability and
outreach
Section 6.3 discussed the economic benefits and costs of financial regulation in general
terms. This sub-section, with an emphasis on Uganda’s financial regulation of MFIs,
outlines key provisions and investigates their theoretical effects on sustainability and
outreach. The sub-section also provides a framework for the analysis of empirical findings
on the effects of financial regulation of MFIs on their sustainability and outreach. For ease
of presentation and analysis, the modified CAMEL framework has been adopted, with
some adjustments to accommodate other important provisions that cannot be analysed
under it. CAMEL is an acronym for five measurements of the performance of a financial
institution: Capital adequacy (C), Asset quality (A), Management (M), Earnings (E) and
Liquidity management (L). This framework was originally designed to enable North
American bank regulators to evaluate the financial and managerial soundness of United
States of America commercial lending institutions using key ratios, indicators, and
institutional policies and procedures (Saltzman and Salinger, 1998).
CAMEL subsequently became a framework for regulating commercial banks in many
countries around the world and, in some countries such as Ghana and Uganda,
sensitivity/market risk analysis denoted by S has been added to the CAMEL framework and
it is now abbreviated as CAMELS in these countries. Similar principles to those underlying
the CAMELS framework have been adopted for regulating MDIs in Uganda.
6.4.2.1 Capital adequacy (CA)
A. Capital adequacy requirements
Capital adequacy requirements operate at two levels: 1) minimum capital requirement
(MCR); and 2) capital adequacy ratios (CARs).
MCR, the amount of money that an applicant must have in a specified form, is one of the
preconditions for getting a licence to establish a financial institution. The Basle Core
Principles for Effective Banking Supervision do not prescribe a particular amount, but
157
recommend that banking supervisors must set prudent and appropriate MCRs for all banks
and by implication for all similar financial institutions.
In Uganda banks, credit institutions and MDIs are required to have MCR of Uganda
shillings (UGX) four billion, one billion and 0.5 billion respectively (GOU, 2004, 2003)33.
This MCR should be in the form of: a) notes and coins which are legal tender in Uganda; b)
balances with the Central Bank; c) balances with banks and other financial institutions
licensed to accept deposits in Uganda; d) money at call in Uganda; e) treasury bills issued
by the government and maturing within three months, excluding days of grace; and f) such
other assets as the Central Bank may from time to time approve.
Once an MFI has obtained a licence, it has to adhere to a certain CAR, the level of capital
that must be available in the institution to cover unexpected risk. The CAR determines the
maximum level of debt versus equity that a financial institution can have (Ledgerwood,
1999:23). It is calculated in the form of ratios of core capital (CK) or total capital (TK) to
total risk-weighted assets (TRWA).
The Statutory Instruments Supplement No. 34 of 2004 for MDIs defines CK and TK as:
CK = FEK + SP + RE + NPL – UIFC – ACLO ------------------------------------------------6.1
TK = CK + SK ---------------------------------------------------------------------------------------6.2
where FEK is the shareholders’ equity in the form of issued and fully paid-up share capital,
SP is share premium, RE is retained earnings, NPL standards for net after-tax, current year-
to-date profit, UIFC is any unconsolidated investment in financial companies, ACLO is
accumulated losses, and SK is secondary or supplementary capital (Bank of Uganda, 2004).
The current international capital adequacy standards outlined in the Basle Accord provide a
maximum leverage ratio of core capital (CK) to TRWA for banks of 8 per cent. In Uganda
there are two CARs; one derived by dividing the CK (primary capital) by total TRWA, and
the other derived by dividing TK (primary plus secondary capital) by total TRWA. For an 33 In 2003, the exchange rate between US$ and Uganda Shilling (Ushs) was US$1 to Ushs1,964
158
MDI the CK/TRWA is 15 per cent and TK/TRWA is 20 per cent. This was apparently
arrived at on the basis of the consensus in the literature that CARs for the MFIs should be
higher than for the traditional banking sector, because MFIs have a significantly higher
level of operating costs in relation to the outstanding loan portfolio (Micro-Finance
Network, 1997; Saltzman and Salinger, 1998).
B. Effects of Capital adequacy requirements on sustainability and outreach of
MFIs
The effects of capital adequacy requirements on sustainability and outreach of MFIs can be
assessed at the level of MCR and CARs.
1) At the level of MCR
Holding other requirements constant, an MFI is required to mobilise the MCR before being
issued with a licence. With more equity and the mandate to leverage deposits and other
sources of funds, a licensed MFI may boast a substantial capital base. Besides, and as
argued in section 6.3, a licensed MFI can also provide savings and other financial products
to the poor, thereby encouraging savings mobilisation, capital formation and investment.
With a larger capital base and an expanded product range, the outreach of the MFI can
substantially increase.
However, the increase in outreach resulting from granting loans depends on other factors
that include the primary goal of the MFI and other regulatory requirements such as the level
of CARs, the lending conditions, earnings and information disclosure requirements. Some
of these factors, as further discussed below under asset quality, impose direct and indirect
constraints on the volume and quality of loans that regulated MFIs can extend, and can
actually lead to a reduction instead of an increase in the level of outreach.
Imposing MCR is also important in a number of ways: 1) it provides protection against
risks, allows for absorption of losses from the institution’s own capital, and therefore gives
confidence to investors, lenders, clients and regulators, and ensures financial sector
stability/sustainability (Christen, 1997; Ochieng, 1998; Saltzman and Salinger, 1998); and
159
2) it elicits prudence in institutional governance and operations that enhances sustainability
and protection of deposits.
Regulation of MFIs also aims at making them less donor dependent. Thus MCR, in this
case, is an attempt to make the MFIs self-reliant, which is critical because donations are by
their very nature unpredictable. For predictable development and sustainability, MFIs need
to rely more on their own funds than donations.
On the other hand, imposition of the MCR could result in very few MFIs being licensed,
while those unlicensed have to be restructured or closed down (Government of Uganda,
2003). Although licensing even one MFI is a positive development, if regulation results in
several unlicensed MFIs scaling down their operations or closing down, then outreach is
likely to be reduced, especially in the short run. Licensing few MFIs may also result in
limited competition and efficiency in the microfinance industry, the effects of which could
be high costs of intermediation with negative effects on their sustainability and outreach.
2) At the level of CARs
Regulators are interested in CARs because they are a measure of financial solvency or
sustainability. They also limit the proportion of assets that can be financed by debt and
ensure that organisations mobilise their own funds for investment rather than borrowing. As
a result CARs enhance prudence in management and investment of institutional resources.
On the other hand, CARs constrain lending by attaching risk weights to various assets. For
example, the risk level for loans is 100 per cent. This means that an additional unit of a loan
granted increases TRWA by 100 units. If CK or TK remains constant or decreases due to
an increase in unconsolidated investment in financial companies (see equation 6.1) and/or
mounting losses, the regulated MFI must increase its equity to leave CAR unchanged.
Thus, CARs constrain the value of loans a regulated MFI can grant unless the level of
equity is raised, holding other factors constant. The higher the CARs as in the case of MDIs
in Uganda, the more constraining they are. By constraining lending, CARs constrain
outreach from the perspective of the number of borrowers that can be served.
160
High CARs may also impede deposit mobilisation unless the licensed MFIs have
alternative less risky investment opportunities such as in government papers with
appropriate maturity periods. This arises from the view that savings mobilisation costs
money and, if the cost is to be recovered, then the savings must be profitably invested.
6.4.2.2 Asset quality (AQ)
A. Asset quality requirements
AQ refers primarily to the quality of the institution’s main asset (loan portfolio). Whether
the institution is for profit or not, the criteria for analysis of asset quality are the same.
The analysis of asset quality is normally divided into three areas: (1) portfolio quality,
which includes the portfolio at risk and loan loss rate (loan write-off/write-off policy), (2)
portfolio classification system (aging of loans into, for example, between 1-30 days, 30-60
days, etc.), and (3) other assets. In category (3) the consideration is the productivity of the
fixed assets, the policy of investing in them, and their adequacy in terms of meeting the
needs of staff, clients and the standards stipulated in the regulations.
The MDI Act, 2003 requires that: (1) 1% of the total loan portfolio be placed aside to cater
for general provisions; (2) 25% of the sub-standard loan portfolio34 be placed aside to cater
for the sub-standard loans; (3) 50% of the doubtful loan portfolio35 be placed aside to cater
for the doubtful loans; and (4) 100% of the loan portfolio considered unrecoverable36 be
placed aside to cater for the loans considered unrecoverable. Similar provisions apply for
restructured loans with marginal modifications.
Besides providing for bad loans or arrears, the regulations require deposit-taking
institutions to adequately secure loans by taking adequate collateral, and to register such
collateral with legal authorities in order to have legal mandate over them. The MDI Act,
2003 recognises compulsory savings/or loan insurance as collateral and group-lending as an
important mechanism in providing financial services to low-income earners. 34 A loan portfolio is sub-standard if the principal or interest is due and unpaid for 31-60 days, 35 A loan portfolio is doubtful if the principal or interest is due and unpaid for 61-90 days. 36 A loan portfolio is considered unrecoverable if the principal or interest is due and unpaid for over 90 days.
161
With regard to credit extension, two major limits are imposed: (1) the MDI must not lend
more than 1% of its core capital to an individual borrower; and (2) the MDI must not lend
more than 5% of its core capital to a group of borrowers. The MDI Act, 2003 also requires
that the MDI must not pay a dividend or any other income to its shareholders, unless it has
made adequate provisions against loan losses, and has taken adequate steps to ensure
compliance with capital adequacy conditions.
B. Effects of asset quality requirements on sustainability and outreach of MFIs
Requirements under asset quality may affect the sustainability and outreach of MFIs in a
number of ways. First, the regulatory requirements tend to restrain the regulated financial
institutions from reckless lending and other adverse investment practices. Thus, depending
on the strictness of the requirements, particularly the outreach of MFIs could be adversely
affected. On the other hand, the stricter the regulatory requirements under asset quality, the
better could be the quality of the assets, and therefore the better the microfinance institution
in terms of high standards of good practice and sustainability. Note that the level of loan
repayment is an important indicator of the health of a lending institution. The higher the
repayment rate, the better the institutional performance.
The consensus in the literature appears to be that asset quality requirements should be more
stringent for the MFIs than for traditional commercial banks because of the nature of the
activities financed (Micro-Finance Network, 1997). In this respect, therefore, outreach of
MFIs is likely to be significantly reduced. This situation could be worse, if the operational
procedure for supervising the MFIs’ loan portfolio also takes the same trend as that for
banks whereby a sample of loans is taken for a thorough examination rather than
performing a snap-shot analysis of each loan. Examining a sample of loans could result in a
substantial portion of the MFI portfolio being found highly risky and categorised as
unrecoverable. This would attract higher provisions that would adversely affect profitability
of the MFIs and subsequently their outreach. In addition, strict collateral requirement
means that borrowers without the required collateral cannot access credit, which may
reduce outreach. The MDI Act, 2003 recognises compulsory savings/or loan insurance as
162
collateral and group lending as an important mechanism in providing financial services to
low-income earners , and this is important for enhancing outreach.
Loan aging and provisioning directly affect the profitability of the regulated institutions.
For example, if the MFI has many delinquent loans, some of which might be several
months old, the MFI is required to provide for the sub-standard, the doubtful or the
unrecoverable loans. These provisions are required to be reflected in the profit and loss
statement as expenses, which lead to a reduction in the profitability of the MFI. While this
may call for prudent lending to avoid having delinquent loans, it may affect the image of
the MFI and even scare away clients, who may perceive the MFI as a bad institution.
Credit limits are designed primarily to help the MDIs diversify credit risks and reach many
clients. However, limiting credit to 1% of core capital has a potentially negative effect of
crowding out borrowers who may want more than 1% of the core capital, unless the MFI
can raise its capital base. Moreover, it would be beneficial to the financial institution to
diversify its portfolio between small and relatively large loans, given the negative
correlation between loan size and administrative costs (Hulme and Mosley, 1996).
Tied to asset quality are human resource issues. To maintain high asset quality and ensure
prudent investment, microfinance institutions require competent risk managers. These are
in short supply in the microfinance industry, given that it is a relatively new industry and
those available tend to price their services highly. Thus, the requirement of high asset
quality and prudent investment of resources may lead to a reduced sustainability and
outreach. The MFIs are also required to provide and maintain adequate physical
infrastructure and security. This requirement could lead to some potential MFIs failing to
be licensed. The effects of this have already been discussed.
Finally, there is the issue of paying dividends. It is a prudent practice to tie payment of
dividends to adequate loan provisions and compliance with the regulations, but this could
be a disincentive to purely commercially oriented investors in MFIs (Otero and Chu, 2002).
163
6.4.2.3 Management (M)
A. Management Requirements
The analysis of management in the CAMELS framework covers five broad areas:
governance; human resources; processes, controls and audit; information technology
system; and strategic planning and budgeting (Saltzman and Salinger, 1998). These five
areas can be captured under ownership and governance. Chapter Four provides an
exposition of the concept of governance. Ownership is defined as ownership of equity or
shares in an organisation. For purposes of the MDI Act, 2003, corporate governance covers
the overall environment in which the MDI operates and consists of checks and balances
which promote the healthy balancing of risk and return (Government of Uganda, 2003:27).
In order to promote an effective ownership and governance for licensed MFIs, the MDI
Act, 2003 contains the following regulatory provisions:
• The operations of every institution shall be directed by a board consisting of at least
five directors and no person shall become a director without the approval of the
Central Bank.
• The board of directors of an institution shall be responsible for:
o The institution’s good corporate governance and business performance;
o The institution’s affairs and business operations;
o Ensuring that the institution’s business is conducted in a safe and sound
manner;
o Ensuring and reporting to shareholders at the annual general meeting that
the institution’s internal controls and systems, and management information
systems:
provide reasonable assurance as to the integrity and reliability of the
financial statements;
164
adequately verify, safeguard and maintain accountability of the
assets;
are based on established and written down policies and procedures
and implemented by trained and skilled officers with an appropriate
segregation of duties; and
are continuously monitored, reviewed and updated to ensure that no
material break-down occurs in the functioning of such controls,
procedures and systems.
• The board is responsible for ensuring that a report made and submitted to the
institution by its external auditor is forwarded to the Central Bank within four
months after the end of its financial year.
• An institution shall preserve the corporate accounting and other financial records as
defined in the Act for a period of at least ten years.
• The MFIs must appoint technically qualified and experienced officials to perform
functions and duties prescribed by the regulations.
B. Effects of management requirements on outreach and sustainability of MFIs
As noted in Chapter Four, the current literature has underscored the importance of
corporate governance in institutional building and performance. This explains why several
provisions in the MDI Act, 2003 and FIA, 2004 are on governance. While in modern
institutions governance must not only exist but be effective, the requirements to set up an
effective governance structure can be expensive and a deterrent to actually establishing the
expected institution. To become an MDI in Uganda, for example, the applicant must ensure
that all the above governance provisions are fulfilled. It can be difficult and costly,
especially for the MFIs that are located far away from the capital city, to find the people
with the required qualifications and experience to be board members of an MDI. As a result
only a handful of MFIs located in the capital city or nearby places can be licensed and the
effects of this have been discussed under capital adequacy.
165
Staffing is also another issue of governance. In BancoSol in Bolivia, several new staff with
banking experience, particularly in the areas of operations and accounting, and cashiers had
to be hired. This led to an increase in personnel expenses. Caja Los Andes, also in Bolivia,
had a similar experience when personnel expenses increased substantially because of
additional staff recruited to undertake evaluation of credit risk (Theodore and Loubiere,
2002:255). Given the requirement that the MFIs must appoint technically qualified and
experienced officials to perform functions and duties prescribed by the regulations, the
required official might not only be expensive to employ, but also not easy to find in the
new microfinance industry in Uganda.
On the positive side corporate governance requirements are likely to result in the
strengthening of internal controls in the licensed MFIs. Theodore and Loubiere (2002:254)
report that BancoSol in Bolivia had virtually no internal controls before transformation into
a regulated MFI; the internal audit function had many other operational requirements.
Ledgerwood and White (2006: 459) report that when Uganda Microfinance Union (UMU)
was preparing for transformation to become an MDI, it embarked on restructuring
operations, formalising policies and procedures, hiring new staff and investing in training,
upgrading systems and redesigning products. While these requirements impose costs to the
institutions being regulated or transforming to become regulated, they are important for
effective and efficient institutional structures for better performance and sustainability.
6.4.2.4 Earnings (E)
A. Earnings requirements
In this study earnings are defined as the net income of a company during a specific period.
In the commercial banking sector earnings are assessed using both quantitative and
qualitative measures such as return on equity, return on assets, operational efficiency
measures, and lending rate(s) of interest. The same framework is applied for MDIs. For
example, the earnings performance of the MDIs in Uganda in 2005 was assessed using
ROA and ROE (BOU, 2005:21). Besides, the MDI Act, 2003 and the Implementing
Regulations of 2004 require the MDIs to make a profit.
166
B. Effects of earnings requirements on sustainability and outreach of MFIs
While it is straightforward to assess the relationship between earnings and outreach, it is
not so between earnings and sustainability. However, following the discussions presented
in Chapter Three, sub-section 3.2.2, earnings can be related to a measure of sustainability.
In this respect equation 4.4 of Chapter Four reproduced below with some modification can
be used to assess the effects of the earnings requirements on sustainability and outreach.
FSS = [[((NSB+NRB*ANT)*AvLz*i)][1-γ]+Z]/[FINCO+OPCO+LLP+INDCO+ICS]---6.3
where, except for INDCO and ICS, the rest of the variables are as defined in equation 4.4.
INDCO is in-kind expenses that would be incurred for technical assistance received but not
paid for by the MFI, and ICS is the cost of maintaining the value of equity relative to
inflation and the surplus revenue resulting from subsidised loans.
In Chapter Four (section 4.2) the various ways in which the variables on the right hand side
of equation 6.3, except INDCO and ICS, affect FSS are examined. The effects of INDCO
and ICS on sustainability and outreach of MFIs are similar to those of FINCO, OPCO, LLP
and γ. Notwithstanding the effects of these variables on FSS and outreach, given that the
MDI Act, 2003 and other banking laws require the regulated MFIs to make a profit, the
effects of earnings requirements on both sustainability and outreach are positive. On the
other hand, failure to comply with earnings requirements would lead to the MFI being
closed down, which implies that the effects of earnings requirements on sustainability and
outreach could also be negative. However, it is generally the case that the earnings
requirements affect sustainability and outreach positively.
6.4.2.8 Liquidity management (LM)
A. Liquidity management requirements
Saltzman and Salinger (1998:59) note that “Liquidity is traditionally defined as the ability
to meet obligations as they become due. It is the institution’s ability to accommodate
decreases in funding sources and increases in assets, and to pay expenses at a reasonable
167
cost.” For licensed MFIs the major sources of demand for liquidity are usually applications
for loans, withdrawals by customers, payments of salaries and wages, and purchase of fixed
assets. Liquidity management evaluates the ability of an institution to cope with inflows
and outflows of funds without causing any panic, particularly among depositors. It is
assessed by the movements and composition of asset and liability structures and the cash
flow projections. The MDI Act, 2003 requires MDIs to hold 15 per cent or more of total
deposit liabilities in liquid assets.
B. Effects of liquidity management requirements on sustainability and outreach
of MFIs
Literature on the empirical effects of liquidity management requirements on sustainability
and outreach of MFIs is scanty. However, given that the liquidity held in the licensed MFI
may attract zero returns while attracting a positive cost resulting from deposit mobilisation,
custody and payment of interest, a liquidity management requirement will negatively affect
profitability and thus sustainability. On the other hand, given that low-income clients tend
to engage in short-term transactions, it is important that the MFIs maintain a high level of
liquidity to meet the possible demand, especially from borrowers and depositors, which
should positively affect outreach.
6.4.2.9 Supervision and compliance
A. Supervision and compliance requirements
According to the MDI Act, 2003, the Central Bank is responsible, among other functions,
for continuously supervising the licensed MFIs and their affiliates and associates to ensure
compliance with the provisions of the Act. To fulfil this function the Central Bank uses all
or any of the following methods:
a) Analysis of documents and information supplied by the licensed MFIs as stipulated in
the Act and the relevant regulations (off-site supervision). The documents include:
1. Weekly returns on Liquidity;
168
2. Monthly Portfolio Quality Returns;
3. Monthly Statement of Assets and Liabilities;
4. Monthly Computation of Capital Adequacy;
5. Monthly Statement of Income and Expense;
6. Monthly Schedule of Provisions for Bad Debts;
7. Monthly Statement of Loans extended to Insiders;
8. Monthly Reports on Lending Limits; and
9. Reports on Ownership of Shares.
b) Inspection and analysis of corporate accounting, financial and non-financial records of
the MDI at its premises (on-site supervision) must be conducted at least once a year.
c) Any other lawful means that the Central Bank considers appropriate.
In addition, the MDI Act, 2003 requires licensed MFIs to:
• Within four months after the end of every financial year, submit audited accounts
approved at its annual general meeting together with the auditor’s report and
management letter;
• Prepare and maintain adequate books of account vouchers, securities, records, computer
systems, and relevant other financial and non-financial records;
• Within four months after the end of its financial year, publish in a newspaper
circulating in the whole of Uganda a copy of its audited accounts together with the
auditor’s report;
• Promptly report to the Credit Reference Bureau established by the Central Bank all the
information as prescribed in the Act;
• Have adequate physical infrastructure in the form of buildings, security, counters, a
strong room with a safe, and safety provisions such as fire extinguishers;
• Appoint, with the approval of the Central Bank, an internal auditor and a firm of
accountants to be the external auditors of the institution; and
• Pay an annual license fee of UGX one million, the amount paid by a credit institution.
169
Failure to comply with the regulatory requirements attracts penalties or may result in a
management take-over, which might lead to liquidation.
B. Effects of supervision and compliance requirements on sustainability and outreach
of MFIs
Supervision of MFIs has two broad but conflicting effects on their sustainability and
outreach. On the one hand, supervisory requirements increase the operational costs of the
MFIs, because they have to compile several reports and submit to the supervisor, install
efficient and effective information management systems, employ competent personnel such
as internal auditors and risk managers, publish financial statements in the media, and where
they fail to comply with the regulations, they are fined. In addition, the MFIs must hire
external auditors, keep records and produce financial reports based on international
accounting standards, purchase a licence and put in place the required physical
infrastructure. The sum of all these can be a huge cost to the MFI. With poor
communication networks and power/electricity in the rural areas of developing countries
such as Uganda, MFIs that operate in the rural areas can find supervision very costly.
Furthermore, while disclosure requirements increase transparency, there is the potential
danger that if the information provided is misinterpreted as indicators of poor institutional
performance, it might send a negative signal to both the existing and potential clients, and
cause them to withdraw, leading to both reduced sustainability and outreach.
On the other hand, effective supervision leads to improved quality of the operations of the
supervised MFIs and thus of the industry. The effects of this on the sustainability and
outreach of MFIs could be significantly positive.
Often, though, depending on the country context, the effects of regulation may extend
beyond the regulated institutions as discussed in section 6.3. Documentation, for example,
presents a significant challenge for MFIs, whose clients tend to be mostly illiterate.
Theodore and Loubiere (2002:259) report that paper trails may sometimes not exist for
illiterate applicants and the loan officers have to collect information directly from the
borrowers and construct documentation such as cash flow statements to analyse the
creditworthiness of borrowers. But this may not be acceptable to regulators, who may
170
regard such internally generated documentation as insufficient. This could have a negative
effect on the outreach of licensed MFIs.
Turning to management take-over and closing down of an insolvent MFI, the literature has
argued that putting MFIs on receivership and liquidation may potentially lead to more
widespread negative implications than would be the case with traditional banks (Micro-
Finance Network, 1997). This is because the MFIs deal with low-income earners who have
not been accessing financial services from formal financial institutions for a long time.
Having just been introduced to banking, if the institutions they have been dealing with get
taken over and/or subsequently liquidated, they will naturally withdraw, and it can take
quite a while for such people to be attracted back into the formal financial system. It is also
argued that, because of the large number of the clients involved and the high marginal value
that low-income earners attach to their savings, a collapse of an MFI may have a substantial
effect on the motivation to save and, therefore, reduce outreach.
6.4.2.10 Deposit protection fund (DPF)
A. Deposit protection fund requirements
Deposit protection funds are one of the measures some countries such as Uganda, the
Philippines and the United States of America have put in place to operationalise protective
regulations. This fund is set up to offer protection mainly to small depositors or the
intermediaries taking the deposits. In Uganda an MDI must contribute at least 0.2% of the
average deposit liabilities in its previous financial year to the DPF (Government of Uganda,
2003). In addition, an MDI is required to pay into the DPF all contributions and other
payments stipulated in the governing laws and regulations. An MDI whose overall
performance shows an unsatisfactory or marginal rating shall be required to contribute to
the DPF on a quarterly basis.
171
B. Effects of DPF on sustainability and outreach of MFIs
The implications of DPF on outreach and sustainability of MFIs can be viewed from three
perspectives: (1) moral hazard; (2) actual protection of small depositors; and (3) the actual
contribution to the DPF by the MDIs. The moral hazard perspective has already been
discussed under sub-section 6.3.3.3. If the protection of small depositors enhances
confidence and trust in the licensed MFIs, then it is likely to lead to increased sustainability
and outreach through increased levels of deposits and increased number of clients
respectively. With respect to the contribution to DPF, while it may be a relatively
insignificant amount for larger MFIs, it may be significant for the smaller ones and,
therefore, affect their sustainability and outreach.
6.4.2.8 Other licensing conditions and their effects on sustainability and outreach of MFIs
A. Other licensing conditions
Additional requirements stipulated in the MDI Act, 2003 that also require scrutiny to assess
their effects on sustainability and outreach are outlined below.
1. No person or a group of related persons shall hold more than 30% of the shares of
an institution from the time of the coming into force of this Act, unless such an
institution already existed, in which case other rules apply.
2. An institution must be licensed either as a bank, credit institution or an MDI to
carry on microfinance business (Government of Uganda, 2003:11).
3. An application to carry on a microfinance business must be accompanied by
documents certifying that the institution interested in carrying on the stated business
is a legal company. The applicant is also required to provide the information as set
out in subsection 6.3.3.1 (1). Furthermore, before an institution is granted a licence
to operate as an MDI, it must be a company limited by shares, and these have to
fulfil additional conditions. In Uganda companies are registered under the Company
Act, 1964, which has its own requirements.
172
B. Effects of other licensing conditions on sustainability and outreach of MFIs
Ownership requirements impose restrictions especially on NGOs that have been providing
microfinance and may want to transform into MDIs. Unless they get new investors that
agree with their mission and vision, the transformation of the existing MFIs into MDIs can
be a daunting process. Empirical findings in Latin America indicate that one of the
challenges NGO-MFIs face is to assemble a group of founders-co-owners that meets the
requirements of the banking authorities (Theodore with Loubiere, 2002). Where the NGO-
MFIs and other potential MFIs fail to meet the licensing requirements, only a few MFIs
may be licensed and this could lead to a reduction in outreach.
The transformation process of MFIs is also likely to be more complicated by the fact that
the institutions must exist as shareholding companies before being licensed. CGAP
(2004:3) argues that NGOs, while essential for conducting research and developing new
models, face serious challenges in terms of governance and legal limits on their operations.
Most have not reached a massive scale or independence from their donors. Similarly,
regulators generally believe that unless the shareholders of a financial institution have
placed their capital at risk and the directors take fiduciary responsibility in the MFI, there
will be less incentive from the owners and directors to ensure that the MFI remains in good
health. The majority of the potential MDIs in Uganda are likely to be affected by this
provision and, consequently, very few might actually meet the required conditions for
obtaining a licence. The survey results presented in Chapter Eight show that since the
enactment of the MDI Act, 2003, four MFIs have been licensed as MDIs.
In general, while the ownership requirements are necessary, they are likely to lead to fewer
MFIs being licensed and this is likely to lead to reduced outreach, although there is the
possibility of those being licensed improving their level of sustainability. There is also
likely to be positive industry effects on the unlicensed MFIs arising from the desire to
improve on their operations to obtain a licence.
Experience has shown that registering a private limited company with share capital in
Uganda is not a problem. The problem could be the persons or institutions to register a
173
shareholding company, but not the registration itself. Therefore, the effects of this
requirement on sustainability and outreach of MFIs is minimal.
6.5 Conclusion
This chapter has defined financial regulation as rules that govern commercial behaviour in
the financial system as well as a body of principles, rules, standards and compliance
procedures that apply to financial institutions.
The chapter presents and discusses the framework for evaluating the effects of financial
regulation of MFIs on their sustainability and outreach. While the effects of financial
regulation on sustainability and outreach of MFIs are diverse, the overall hypothesis is that
the potential and actual effect of financial regulation of MFIs on their sustainability and
negative is positive. For example, as a result of regulation a few MFIs may be licensed to
conduct microfinance business, while the rest have to restructure or fold up. In such
situations there is likelihood that overall outreach could be reduced. On the other hand,
regulation may improve sustainability and corporate governance of both licensed and some
unlicensed MFIs because of the prudent and more streamlined operations required by
regulations. On-going requirements such as CARs, asset quality, management, earnings,
liquidity and supervision tend to lead to improved operations of the licensed MFIs,
although they are also likely to reduce their outreach, which could be translated into lower
sustainability in the long term.
Therefore, a decision to regulate or not, when and how should be preceded by an
exhaustive identification and quantification of benefits and costs of regulation as
approached in this chapter. Where the costs are greater than the benefits, regulation is
uncalled for.
174
CHAPTER SEVEN: RESEARCH METHODOLOGY
7.1. Introduction
Chapter One outlined the specific objectives of this study. To realise these objectives
certain specific methods were used. It is important that these methods are documented for
two main reasons: i) to provide a basis for evaluating the extent to which the study in
question is scientific; and ii) for comparative analysis. Conventionally, methods employed
in a study of this kind are covered under methodology (see Paul et al., 2005 for the
definition of methodology). This study has presented and discussed some of the methods
employed in Chapters Three, Four, Five and Six.
In Chapter Three the concept of sustainability and outreach and their measures were
presented and discussed. These are the dependent variables in the sustainability and
outreach models respectively. Chapters Four and Five identify and discuss the explanatory
variables and their measures with regard to sustainability and outreach models as well as
the hypotheses tested. To complete the specification of the analytical framework, Chapter
Six discusses financial regulation and examines the effects of financial regulation of MFIs
on their sustainability and outreach.
The remaining components of the research methodology are presented and discussed in this
chapter except variable selection presented and discussed in Chapter Eight. They include
the specification of the sustainability and outreach models, data description and generation
process, and model selection and estimation. The descriptive statistics and the empirical
results are presented and analysed in Chapter Eight.
The chapter is organised in five sections. Section 7.2 presents the specification of the
econometric equations of sustainability and outreach. Section 7.3 presents the method
employed in estimating sustainability and outreach models. Section 7.4 covers the selection
of MFIs studied. The data, data capture and method of analysis are discussed in section 7.5.
175
7.2 Specification of econometric equations of sustainability and outreach models
7.2.1 Introduction
The theoretical and empirical literature offers limited guidelines on the specific functional
relationship between OSS and its determinants and OUTR and its determinants. However,
as argued and demonstrated in Chapter Five, an MFI can be viewed as a firm whose output
is OSS and the determinants are the inputs into the business (Hulme and Mosley, 1996;
Thompson Jr. and Formby, 1993; Henderson and Quandt, 1984). This perspective allows us
to use the profit function to relate OSS and its determinants and the production function to
relate OUTR and its determinants.
Based on the theory of the firm and empirical applications, production functions are
depicted as non-linear and usually transformed into log-linear functions for easy estimation
using most of the available estimation methods such as Ordinary Least Squares, and the
widely used production function is the Cobb-Douglas with some modifications (Fraser,
2002:39).
Recent applications of the Cobb-Douglas production function have included more variables
on the right hand side, such as raw materials, fuel, land, unskilled labour, skilled labour,
plant and machinery, real money balances, etc, besides labour and capital (Intrilligator et
al., 1996:285; Khan and Ahmad, 1985:336). In addition, the restrictive assumption of
constant returns to scale has also been relaxed to allow either decreasing or increasing
returns to scale. These developments allow for incorporating more variables into the
production function instead of only two traditional factors of production.
7.2.2 Econometric specification of the sustainability model
The measure of sustainability as discussed in Chapter Three is Operational Self-Sufficiency
(OSS). The determinants of OSS identified in Chapters Four and Five and the hypotheses
are:
176
i) Debt-Equity Ratio (DER). It is hypothesised that OSS and DER are positively
related;
ii) Ratio of gross loan portfolio to total assets (GOLP). It is hypothesised that OSS and
GOLP are negatively related;
iii) Effectiveness of governance (GINDEX). It is hypothesised that OSS and GINDEX
are positively related;
iv) Providing savings product (SP). SP = SP1 if the MFI is providing savings product
and = SP0 if not. It is hypothesised that SP1 is positively associated with OSS
compared to SP0;
v) Average loan size divided by the national per capita income (AvLz). It is
hypothesised that OSS and AvLz are positively related;
vi) Real effective lending interest rate (RELRD). It is hypothesised that OSS and
RELRD are positively related;
vii) Unit cost of loans disbursed (CLD). It is hypothesised that OSS and CLD are
negatively related;
viii) Average salaries/wages and benefits divided by the national per capita income (WL).
It is hypothesised that OSS and WL are positively related;
ix) The dominant delivery mechanism (DDM). DDM = DDMg if the dominant delivery
mechanism is group-based and = DDMi if individual-based is dominant. It is
hypothesised that DDMg is positively associated with OSS compared to DDMi;
x) The legal status of an MFI (LS). It is hypothesised that being SACCO and MDI is
positively associated with OSS compared to being a private company (COMP), while
NGO is negatively associated with OSS compared to COMP; and
xi) AGE. It is hypothesised that OSS and AGE are positively related.
Given the above, the OSS equation can be generally specified as
-7.5- AGE) LS, DDM, WL,CLD, RELRD, AvLz, SP, GINDEX, GOLP, (DER, f = OSS
where DDM, SP and LS are dummies, as explained in section 7.5.
177
Following Cobb-Douglas production function, the specific functional form for a
sustainability model is
lnOSSit = lnB + β1lnDERit + β2lnGOLPit + β3lnGINDEXit + β4SPit + β5lnAvLzit + β6lnRELRDit +
β7lnCLDit + β8lnWLit + β9DDMit + β10LSit + β11lnAGEit + uit ------------------------7.6
Variables DER, GOLP, GINDEX, SP, AvLz, RELRD, CLD, WL, DDM, LS and AGE are
as defined above, B is the intercept, and uit ~ IID(0, σ2). In addition, uit is normally
distributed. The elements β1 … β11 are unknown population parameters/coefficients to be
estimated. As to whether equation 7.6 is an FE or an RE model is tested in subsection 7.3.2.
7.2.3 Econometric specification of the outreach model
As discussed in Chapter Three, the measure for outreach (OUTR) used in this study is the
number of clients served by an MFI during a defined period. The determinants identified in
Chapters Four and Five are:
i) Debt-Equity Ratio (DER). It is hypothesised that OUTR and DER are positively
related;
ii) Ratio of gross loan portfolio to total assets (GOLP). It is hypothesised that OUTR
and GOLP are positively related;
iii) Effectiveness of governance (GINDEX). It is hypothesised that OUTR and GINDEX
are positively related;
iv) Providing savings product (SP). SP = SP1 if the MFI is providing savings product
and = SP0 if not. It is hypothesised that SP1 is positively associated with OUTR
compared to SP0;
v) Average loan size divided by the national per capita income (AvLz). It is
hypothesised that OUTR and AvLz are negatively related;
vi) Real effective lending interest rate (RELRD). It is hypothesised that OUTR and
RELRD are positively related;
vii) Unit cost of the disbursed loan value (CLD). It is hypothesised that OUTR and CLD
are negatively related;
178
viii) Average salaries/wages and benefits divided by the national per capita income (WL).
It is hypothesised that OUTR and WL are positively related;
ix) The dominant delivery mechanism (DDM). It is hypothesised that DDMg and OUTR
are positively related compared to DDMi;
x) The legal status of an MFI (LS). It is hypothesised that being SACCO, MDI and
NGO is positively associated with OUTR compared to being a private company
(COMP); and
xi) AGE. It is hypothesised that OUTR and AGE are negatively related.
Given the above, the OUTR equation can be generally specified as
OUTR = f (DER, GOLP, GINDEX, SP, AvLz, RELRD, CLD, WL, DDM, LS, AGE) ---7.7
where DDM, SP and LS are dummies, as explained in section 7.5.
Following the Cobb-Douglas production function, the specific functional form for the
outreach model is
lnOUTRit = lnA + α1lnDERit + α2lnGOLPit + α3GlnGINDEXit + α4SPit +α5lnAvLzit + α6lnRELRDit
+ α7lnCLDit + α8lnWLit + α9DDMit + α10LSit + α 11lnAGEit + uit --------------------7.8
Variables DER, GOLP, GINDEX, SP, AvLz, RELRD, CLD, WL, DDM, LS and AGE are
as defined above, A is the intercept, and is uit ~ IID (0, σ2). In addition, uit is normally
distributed. The elements α1 … α11 are unknown population parameters/coefficients to be
estimated. As to whether equation 7.8 is an FE or an RE model is tested in subsection 7.3.2.
7.3 Selection and estimation of the sustainability and outreach models
7.3.1 Model selection
To determine whether to fit linear models using data in levels or in a transformed form,
equations 7.9, 7.10, 7.11, 7.12, and 7.13 were estimated both for FE and RE models. The
results are reported in Tables 7.1 and 7.2.
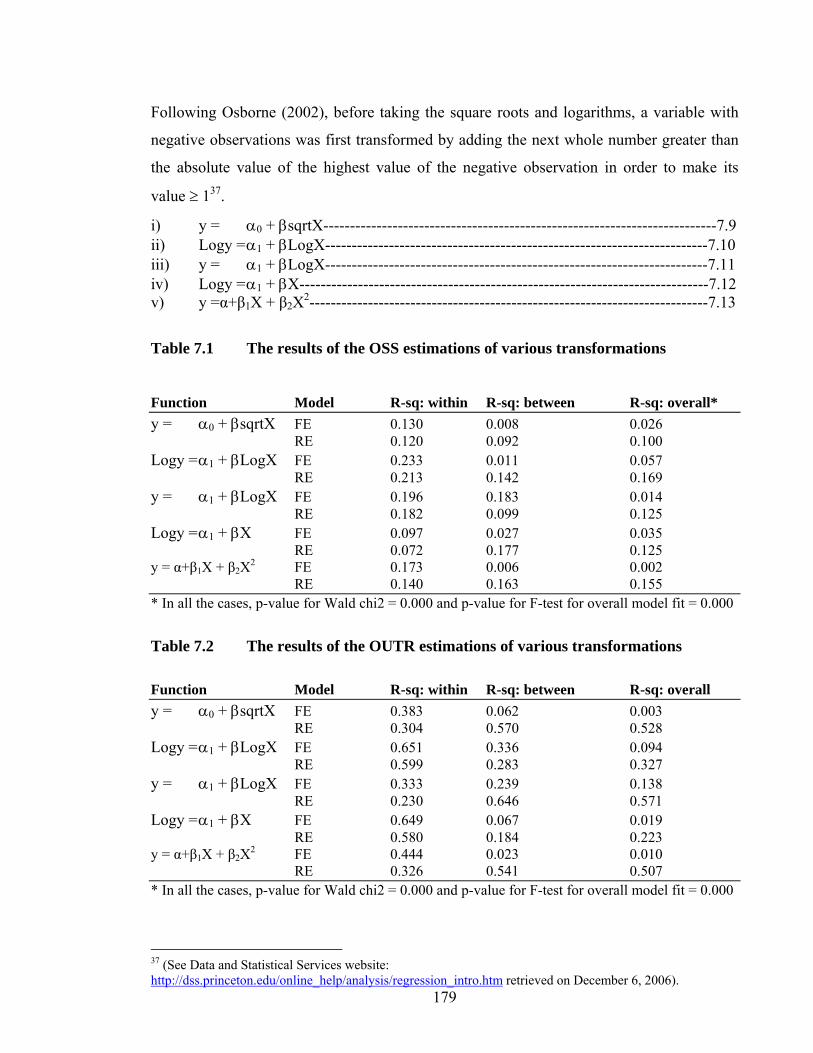
179
Following Osborne (2002), before taking the square roots and logarithms, a variable with
negative observations was first transformed by adding the next whole number greater than
the absolute value of the highest value of the negative observation in order to make its
value ≥ 137.
i) y = α0 + βsqrtX--------------------------------------------------------------------------7.9 ii) Logy = α1 + βLogX------------------------------------------------------------------------7.10 iii) y = α1 + βLogX------------------------------------------------------------------------7.11 iv) Logy = α1 + βX-----------------------------------------------------------------------------7.12 v) y =α+β1X + β2X2---------------------------------------------------------------------------7.13
Table 7.1 The results of the OSS estimations of various transformations
Function Model R-sq: within R-sq: between R-sq: overall* y = α0 + βsqrtX FE 0.130 0.008 0.026 RE 0.120 0.092 0.100 Logy = α1 + βLogX FE 0.233 0.011 0.057 RE 0.213 0.142 0.169 y = α1 + βLogX FE 0.196 0.183 0.014 RE 0.182 0.099 0.125 Logy = α1 + βX FE 0.097 0.027 0.035 RE 0.072 0.177 0.125 y = α+β1X + β2X2 FE 0.173 0.006 0.002 RE 0.140 0.163 0.155 * In all the cases, p-value for Wald chi2 = 0.000 and p-value for F-test for overall model fit = 0.000
Table 7.2 The results of the OUTR estimations of various transformations
Function Model R-sq: within R-sq: between R-sq: overall y = α0 + βsqrtX FE 0.383 0.062 0.003 RE 0.304 0.570 0.528 Logy = α1 + βLogX FE 0.651 0.336 0.094 RE 0.599 0.283 0.327 y = α1 + βLogX FE 0.333 0.239 0.138
RE 0.230 0.646 0.571 Logy = α1 + βX FE 0.649 0.067 0.019 RE 0.580 0.184 0.223 y = α+β1X + β2X2 FE 0.444 0.023 0.010 RE 0.326 0.541 0.507 * In all the cases, p-value for Wald chi2 = 0.000 and p-value for F-test for overall model fit = 0.000
37 (See Data and Statistical Services website: http://dss.princeton.edu/online_help/analysis/regression_intro.htm retrieved on December 6, 2006).
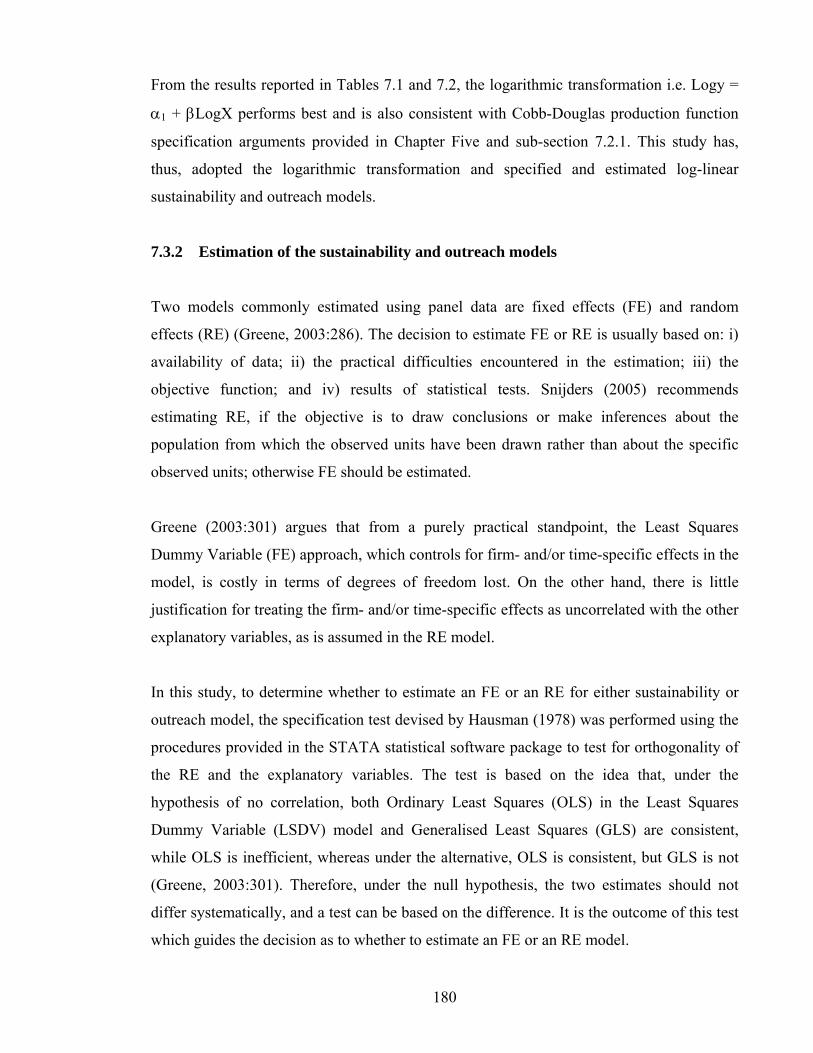
180
From the results reported in Tables 7.1 and 7.2, the logarithmic transformation i.e. Logy =
α1 + βLogX performs best and is also consistent with Cobb-Douglas production function
specification arguments provided in Chapter Five and sub-section 7.2.1. This study has,
thus, adopted the logarithmic transformation and specified and estimated log-linear
sustainability and outreach models.
7.3.2 Estimation of the sustainability and outreach models
Two models commonly estimated using panel data are fixed effects (FE) and random
effects (RE) (Greene, 2003:286). The decision to estimate FE or RE is usually based on: i)
availability of data; ii) the practical difficulties encountered in the estimation; iii) the
objective function; and iv) results of statistical tests. Snijders (2005) recommends
estimating RE, if the objective is to draw conclusions or make inferences about the
population from which the observed units have been drawn rather than about the specific
observed units; otherwise FE should be estimated.
Greene (2003:301) argues that from a purely practical standpoint, the Least Squares
Dummy Variable (FE) approach, which controls for firm- and/or time-specific effects in the
model, is costly in terms of degrees of freedom lost. On the other hand, there is little
justification for treating the firm- and/or time-specific effects as uncorrelated with the other
explanatory variables, as is assumed in the RE model.
In this study, to determine whether to estimate an FE or an RE for either sustainability or
outreach model, the specification test devised by Hausman (1978) was performed using the
procedures provided in the STATA statistical software package to test for orthogonality of
the RE and the explanatory variables. The test is based on the idea that, under the
hypothesis of no correlation, both Ordinary Least Squares (OLS) in the Least Squares
Dummy Variable (LSDV) model and Generalised Least Squares (GLS) are consistent,
while OLS is inefficient, whereas under the alternative, OLS is consistent, but GLS is not
(Greene, 2003:301). Therefore, under the null hypothesis, the two estimates should not
differ systematically, and a test can be based on the difference. It is the outcome of this test
which guides the decision as to whether to estimate an FE or an RE model.
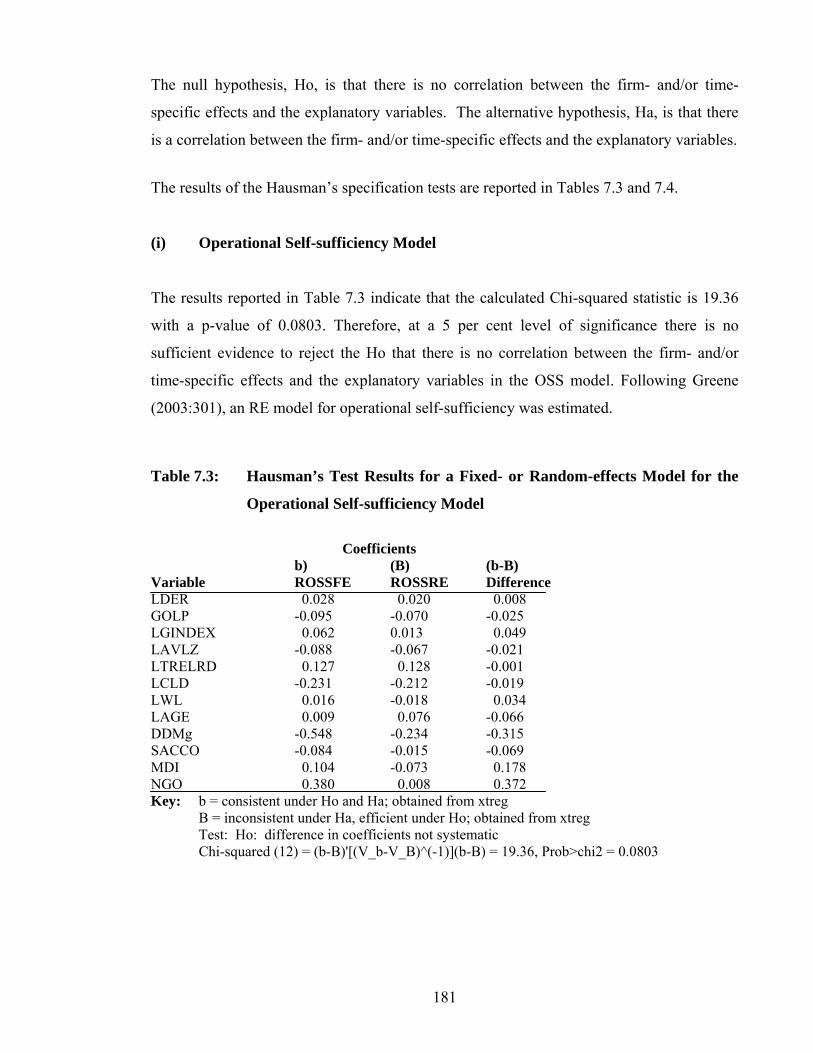
181
The null hypothesis, Ho, is that there is no correlation between the firm- and/or time-
specific effects and the explanatory variables. The alternative hypothesis, Ha, is that there
is a correlation between the firm- and/or time-specific effects and the explanatory variables.
The results of the Hausman’s specification tests are reported in Tables 7.3 and 7.4.
(i) Operational Self-sufficiency Model
The results reported in Table 7.3 indicate that the calculated Chi-squared statistic is 19.36
with a p-value of 0.0803. Therefore, at a 5 per cent level of significance there is no
sufficient evidence to reject the Ho that there is no correlation between the firm- and/or
time-specific effects and the explanatory variables in the OSS model. Following Greene
(2003:301), an RE model for operational self-sufficiency was estimated.
Table 7.3: Hausman’s Test Results for a Fixed- or Random-effects Model for the
Operational Self-sufficiency Model
Coefficients
b) (B) (b-B) Variable ROSSFE ROSSRE Difference LDER 0.028 0.020 0.008 GOLP -0.095 -0.070 -0.025 LGINDEX 0.062 0.013 0.049 LAVLZ -0.088 -0.067 -0.021 LTRELRD 0.127 0.128 -0.001 LCLD -0.231 -0.212 -0.019 LWL 0.016 -0.018 0.034 LAGE 0.009 0.076 -0.066 DDMg -0.548 -0.234 -0.315 SACCO -0.084 -0.015 -0.069 MDI 0.104 -0.073 0.178 NGO 0.380 0.008 0.372 Key: b = consistent under Ho and Ha; obtained from xtreg
B = inconsistent under Ha, efficient under Ho; obtained from xtreg Test: Ho: difference in coefficients not systematic Chi-squared (12) = (b-B)'[(V_b-V_B)^(-1)](b-B) = 19.36, Prob>chi2 = 0.0803
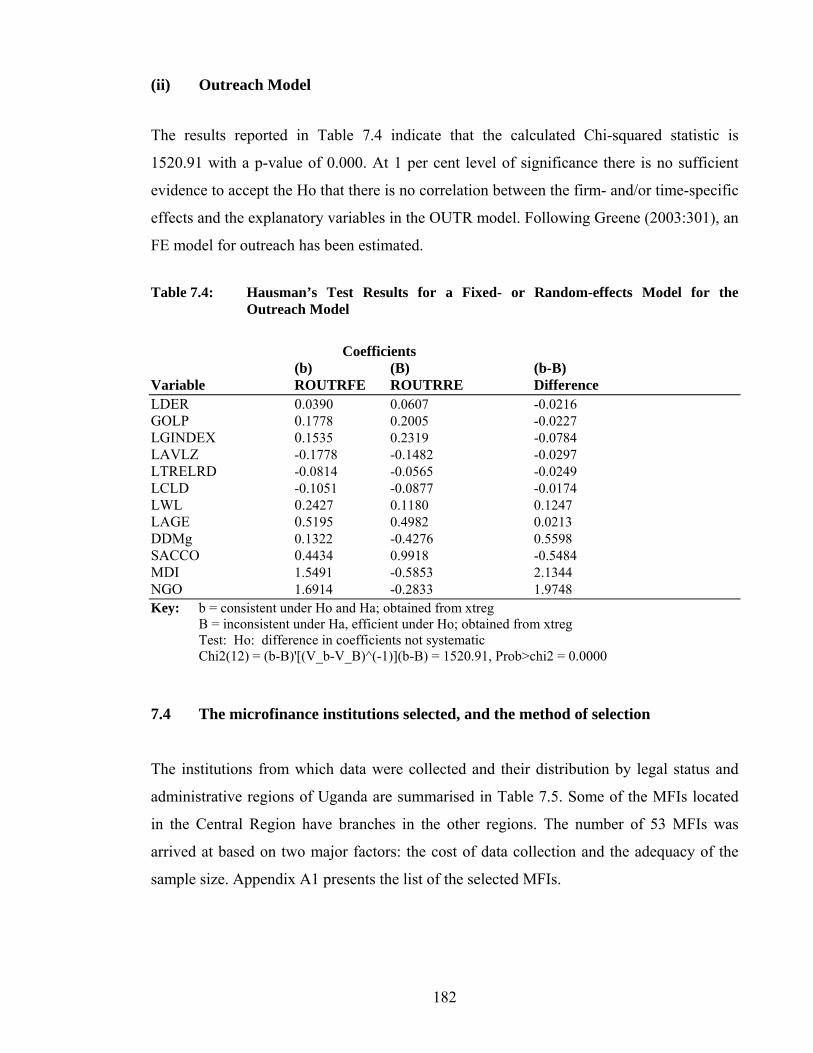
182
(ii) Outreach Model
The results reported in Table 7.4 indicate that the calculated Chi-squared statistic is
1520.91 with a p-value of 0.000. At 1 per cent level of significance there is no sufficient
evidence to accept the Ho that there is no correlation between the firm- and/or time-specific
effects and the explanatory variables in the OUTR model. Following Greene (2003:301), an
FE model for outreach has been estimated.
Table 7.4: Hausman’s Test Results for a Fixed- or Random-effects Model for the Outreach Model
Coefficients (b) (B) (b-B)
Variable ROUTRFE ROUTRRE Difference LDER 0.0390 0.0607 -0.0216 GOLP 0.1778 0.2005 -0.0227 LGINDEX 0.1535 0.2319 -0.0784 LAVLZ -0.1778 -0.1482 -0.0297 LTRELRD -0.0814 -0.0565 -0.0249 LCLD -0.1051 -0.0877 -0.0174 LWL 0.2427 0.1180 0.1247 LAGE 0.5195 0.4982 0.0213 DDMg 0.1322 -0.4276 0.5598 SACCO 0.4434 0.9918 -0.5484 MDI 1.5491 -0.5853 2.1344 NGO 1.6914 -0.2833 1.9748 Key: b = consistent under Ho and Ha; obtained from xtreg
B = inconsistent under Ha, efficient under Ho; obtained from xtreg Test: Ho: difference in coefficients not systematic Chi2(12) = (b-B)'[(V_b-V_B)^(-1)](b-B) = 1520.91, Prob>chi2 = 0.0000
7.4 The microfinance institutions selected, and the method of selection
The institutions from which data were collected and their distribution by legal status and
administrative regions of Uganda are summarised in Table 7.5. Some of the MFIs located
in the Central Region have branches in the other regions. The number of 53 MFIs was
arrived at based on two major factors: the cost of data collection and the adequacy of the
sample size. Appendix A1 presents the list of the selected MFIs.
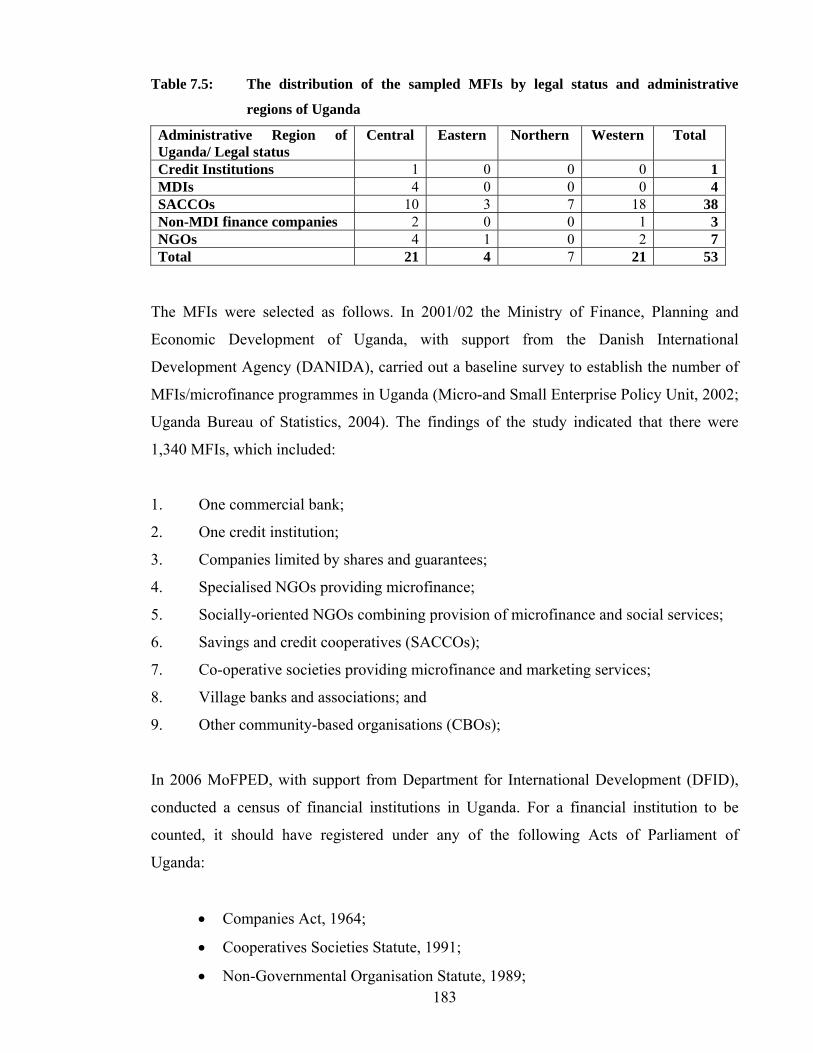
183
Table 7.5: The distribution of the sampled MFIs by legal status and administrative
regions of Uganda
Administrative Region of Uganda/ Legal status
Central Eastern Northern Western Total
Credit Institutions 1 0 0 0 1MDIs 4 0 0 0 4SACCOs 10 3 7 18 38Non-MDI finance companies 2 0 0 1 3NGOs 4 1 0 2 7Total 21 4 7 21 53
The MFIs were selected as follows. In 2001/02 the Ministry of Finance, Planning and
Economic Development of Uganda, with support from the Danish International
Development Agency (DANIDA), carried out a baseline survey to establish the number of
MFIs/microfinance programmes in Uganda (Micro-and Small Enterprise Policy Unit, 2002;
Uganda Bureau of Statistics, 2004). The findings of the study indicated that there were
1,340 MFIs, which included:
1. One commercial bank;
2. One credit institution;
3. Companies limited by shares and guarantees;
4. Specialised NGOs providing microfinance;
5. Socially-oriented NGOs combining provision of microfinance and social services;
6. Savings and credit cooperatives (SACCOs);
7. Co-operative societies providing microfinance and marketing services;
8. Village banks and associations; and
9. Other community-based organisations (CBOs);
In 2006 MoFPED, with support from Department for International Development (DFID),
conducted a census of financial institutions in Uganda. For a financial institution to be
counted, it should have registered under any of the following Acts of Parliament of
Uganda:
• Companies Act, 1964;
• Cooperatives Societies Statute, 1991;
• Non-Governmental Organisation Statute, 1989;
184
• Moneylenders Act, 1952.
The findings indicated that there were 816 financial institutions in Uganda of various legal
status (Ministry of Finance, Planning and Economic Development, 2006).
Based on the findings of the 2001/02 baseline survey and the census of financial
institutions of 2006, a sampling frame was drawn up using the following criteria:
1. The commercial bank was dropped because the focus was on non-bank MFIs;
2. MFIs specialising in providing microfinance services and were counted in the
census of 2006;
3. MFIs keeping basic records such as a cashbook, a general ledger and a clients’
ledger; and
4. MFIs which by the end of December, 2005 had operated for six years and longer.
Using the above criteria, 166 MFIs were listed and this became the sampling frame.
Simple random sampling without replacement was used to select 53 MFIs. This means that
if an MFI had been sampled, but found to be lacking consistent required data, that MFI
would be dropped and excluded from the sampling frame before again randomly picking
another MFI.
Data for assessing the effects of financial regulation of MFIs on their sustainability and
outreach were collected from 31 Tier 4 MFIs (Appendix A2), 12 commercial banks
operating in Uganda (Appendix A3), four BOU regulated MFIs, and the BOU itself.
185
7.5 Data, data capture and the method of analysis
7.5.1 Data and the variables constructed
Panel data were collected from 53 microfinance institutions (MFIs) for a period of six years
(annual) from 2000-2005. The following considerations determined the data types
collected:
i) The measures of dependent variables preferred and adopted;
ii) The measures of the explanatory variables; and
iii) The measures of the effects of financial regulation of MFIs on their
sustainability and outreach.
Two types of data were collected: secondary and primary. Secondary data were collected
from http://www.mixmarket.org, a website for MIX Market, Inc. and the Bank of Uganda
Annual Reports. The primary data were collected from the MFIs sampled, using structured
questionnaires designed and administered by the author of this dissertation, assisted by
research assistants, who were first trained before deployment. A significant number of
MFIs supplied printed data captured by their performance-monitoring tools (PMT) or
audited accounts. For consistency, only data not found on the website of the MIX Market,
Inc. were collected from the MFIs.
i) The dependent variables
Data for constructing OSS were obtained from income statements. The number of clients
was obtained from client registers and portfolio reports.
ii) The explanatory variables and their measures
Data on DER were obtained from the balance sheets and DER is liabilities divided by
equity.
186
Data on GOLP were obtained from the assets side of the balance sheets and it is the ratio of
gross loan portfolio to total assets.
GINDEX was constructed based on 14 principles identified in Chapter Four under the
section on governance to capture the effectiveness of governance (Table 4.1). Data to
construct GINDEX were obtained using a questionnaire administered to the sampled MFIs.
The MFIs were asked to indicate if any of the principles had been instituted and, if so, the
year when it was done. A score (1) was given to each of the principles found to have been
instituted, and the number of years the instituted principle had been in place was used as a
weight. The sum of the weighted scores was obtained for each year to arrive at a GINDEX
(Schreiner et al., 2005).
Data on LS were obtained through interviews with the MFI management. LS is a dummy
which takes value 1 for one of the three kinds of legal status (an MDI, an NGO or a
SACCO) and 0, if the legal status is a private company (COMP).
Data on SP were obtained from the liabilities side of the balance sheets and interviews with
the MFIs. SP takes the value 1 if the MFI provides savings product (SP1) and 0, if does not.
Data on AvLz were obtained from loan portfolio reports, the MIX Market Inc. website, and
Bank of Uganda Reports. AvLz is the value of loans disbursed divided by the number of
loans and the national per capita income.
Data on RELRD were obtained from income statements and Bank of Uganda reports. To
construct RELRD, a total of annual loan and loan-related income was divided by the total
value of the loans disbursed for the respective periods and the relevant annual rate of
inflation subtracted.
Data to construct CLD were obtained from income statements and loan portfolio reports.
CLD is total cost divided by total disbursement.
187
Data on WL were obtained from income statements, management reports, interviews with
the MFIs, and the MIX Market Inc. website. WL is the total annual salaries/wage bill plus
benefits divided by the number of employees and the national income per capita.
Data on DDM were obtained through interviews with the MFIs, who were asked about the
method they considered as the main delivery mechanism. DDM is a dummy which takes
the value 1 if the dominant delivery mechanism is group-based lending, and 0 otherwise.
Data on AGE were obtained through interviews with the MFIs. AGE is measured in years.
iii) The effects of financial regulation of MFIs on their sustainability and outreach
Data collected to assess the effects of financial regulation of MFIs on their sustainability
and outreach were of two categories. The first category was the data used in estimating the
sustainability and outreach models, and these have already been described above. The
second category was data obtained by administering questionnaires to institutions described
under 7.5.1 above; the data were collected between April, 2003 and October, 2006.
7.5.2 Data capture and analysis
The data for estimating sustainability and outreach models were captured in MS Excel,
saved under CSV (Comma delimited), and transferred to STATA statistical software
package for analysis (Hamilton, 2004). Data for evaluating the effects of financial
regulation of MFIs on their sustainability and outreach were captured in MS Excel
computer software and MS Word processor. The analyses have been undertaken at the
following levels.
i) Univariate and bivariate analysis
This level of analysis focuses on the descriptive statistics of the standard variables in the
sustainability and outreach models, i.e. non-dummy variables. Specific descriptive statistics
extracted are the means, medians, quartiles, standard deviations, minimum and maximum
values of the observations, and the numbers of observations. The association between OSS
188
and OUTR has been investigated based on the correlation coefficient. Correlation was also
used to evaluate the relationships between the explanatory variables. The sign and
magnitude of the correlation coefficient indicate the direction and the strength of the
relationship between two or more variables. A correlation coefficient of 1 or –1 implies
perfect or exact relationship between the two correlated variables. In the case of more than
two variables, this is called perfect multi-collinearity or exact relationship among the
variables (Gujarati, 1993:313).
ii) Multivariate analysis
This level of analysis has mainly involved specification, estimation and hypotheses testing
of FE and RE models of sustainability and outreach. The Hausman tests as stated above
were carried out to determine whether to estimate an FE or RE.
iii) Effects of financial regulation of MFIs on sustainability and outreach
The results of the interviews with MFIs have been tabulated in terms of the frequencies of
the responses to the questions asked and comparative analysis conducted.
189
CHAPTER EIGHT: EMPIRICAL ANALYSIS AND DISCUSSIONS
8.1 Introduction
The focus of this study up to Chapter Seven has been on its background, covered in Chapter
One, the economic context within which the study has been undertaken, covered in Chapter
Two, and the literature review and the methodology covered in Chapters Three, Four, Five,
Six and Seven. As presented in Chapter Seven, the study has also involved an estimation of
sustainability and outreach models using data collected from 53 MFIs in Uganda as well as
the evaluation and examination of the effects of financial regulation of MFIs on their
sustainability and outreach using data collected from 31 Tier 4 MFIs, four Bank of Uganda-
regulated MFIs, 12 commercial banks, and the Bank of Uganda itself. The present chapter
is devoted to the analysis and discussions of the empirical findings arising from the
estimated models and the responses of the MFIs, the commercial banks and Bank of
Uganda to the interviews.
The chapter is organized as follows. Section 8.1 is the introduction. Section 8.2 presents
and briefly examines the descriptive statistics. In section 8.3 correlation results are
presented and discussed, while section 8.4 discusses variable selection process, and
presents and discusses the results. The econometric results of the final sustainability and
outreach models estimated are presented and discussed in section 8.5. The empirical results
of the effects of financial regulation of MFIs in Uganda on their sustainability and outreach
are presented and examined in section 8.6. Finally, section 8.7 presents a summary and the
conclusion of the chapter. The overall summary and policy recommendations are presented
in Chapter Nine.
8.3 Descriptive Statistics
Tables 8.1a and 8.1b present descriptive statistics of the dependent variables and the
standard explanatory variables identified in the literature. As shown in Table 8.1a, five
categories of statistics are reported for each of the variables: the mean, the standard
deviation, the minimum and the maximum values of the observations, and the number of
observations in the overall sample.
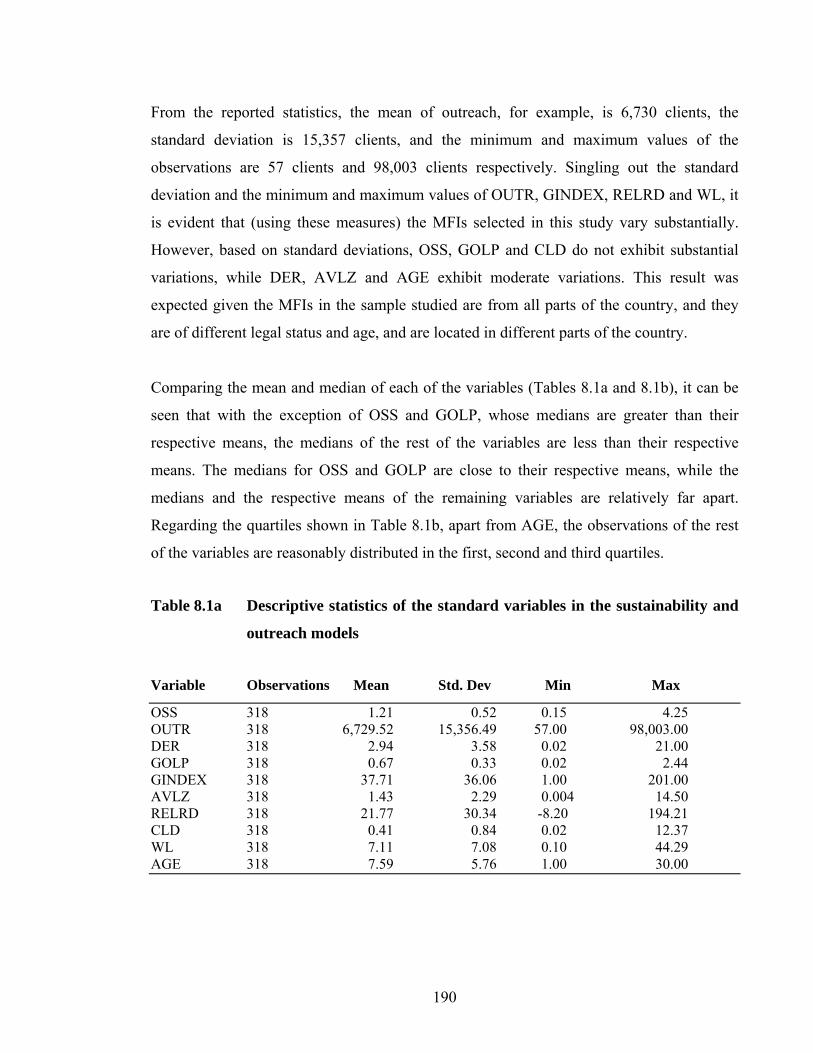
190
From the reported statistics, the mean of outreach, for example, is 6,730 clients, the
standard deviation is 15,357 clients, and the minimum and maximum values of the
observations are 57 clients and 98,003 clients respectively. Singling out the standard
deviation and the minimum and maximum values of OUTR, GINDEX, RELRD and WL, it
is evident that (using these measures) the MFIs selected in this study vary substantially.
However, based on standard deviations, OSS, GOLP and CLD do not exhibit substantial
variations, while DER, AVLZ and AGE exhibit moderate variations. This result was
expected given the MFIs in the sample studied are from all parts of the country, and they
are of different legal status and age, and are located in different parts of the country.
Comparing the mean and median of each of the variables (Tables 8.1a and 8.1b), it can be
seen that with the exception of OSS and GOLP, whose medians are greater than their
respective means, the medians of the rest of the variables are less than their respective
means. The medians for OSS and GOLP are close to their respective means, while the
medians and the respective means of the remaining variables are relatively far apart.
Regarding the quartiles shown in Table 8.1b, apart from AGE, the observations of the rest
of the variables are reasonably distributed in the first, second and third quartiles.
Table 8.1a Descriptive statistics of the standard variables in the sustainability and
outreach models
Variable Observations Mean Std. Dev Min Max
OSS 318 1.21 0.52 0.15 4.25 OUTR 318 6,729.52 15,356.49 57.00 98,003.00 DER 318 2.94 3.58 0.02 21.00 GOLP 318 0.67 0.33 0.02 2.44 GINDEX 318 37.71 36.06 1.00 201.00 AVLZ 318 1.43 2.29 0.004 14.50 RELRD 318 21.77 30.34 -8.20 194.21 CLD 318 0.41 0.84 0.02 12.37 WL 318 7.11 7.08 0.10 44.29 AGE 318 7.59 5.76 1.00 30.00
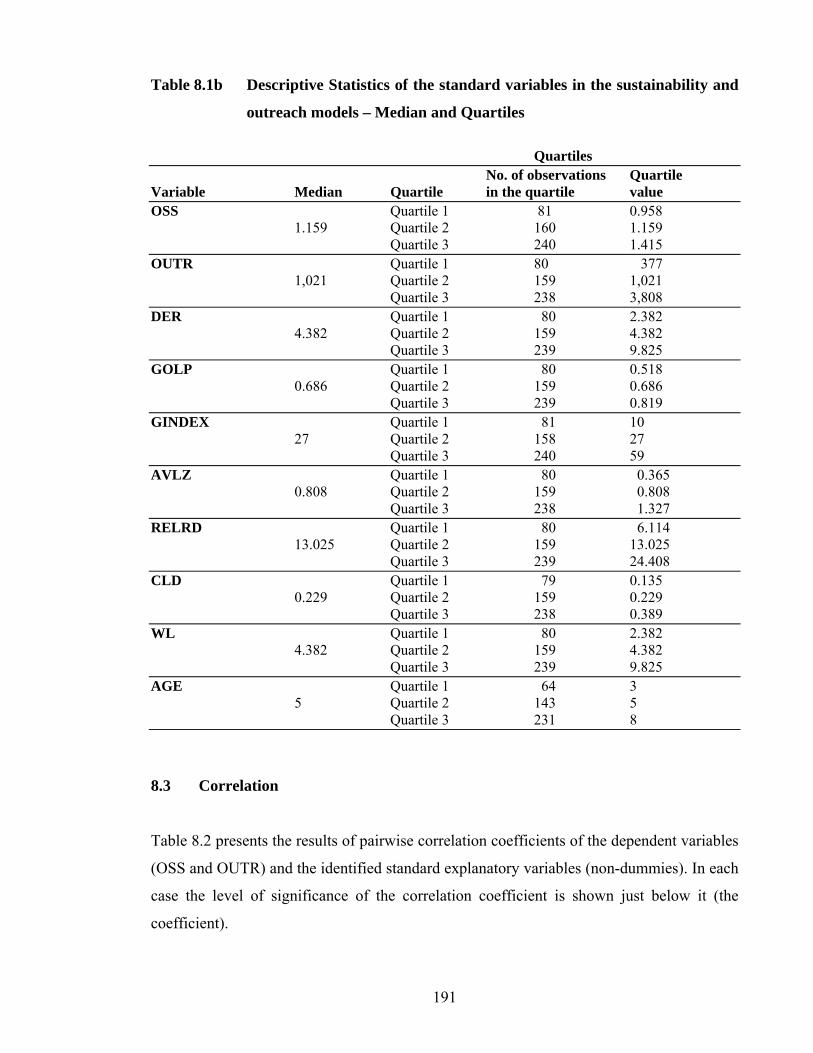
191
Table 8.1b Descriptive Statistics of the standard variables in the sustainability and
outreach models – Median and Quartiles Quartiles No. of observations Quartile Variable Median Quartile in the quartile value OSS Quartile 1 81 0.958
1.159 Quartile 2 160 1.159 Quartile 3 240 1.415 OUTR Quartile 1 80 377 1,021 Quartile 2 159 1,021 Quartile 3 238 3,808 DER Quartile 1 80 2.382 4.382 Quartile 2 159 4.382 Quartile 3 239 9.825 GOLP Quartile 1 80 0.518 0.686 Quartile 2 159 0.686 Quartile 3 239 0.819 GINDEX Quartile 1 81 10 27 Quartile 2 158 27 Quartile 3 240 59 AVLZ Quartile 1 80 0.365 0.808 Quartile 2 159 0.808 Quartile 3 238 1.327 RELRD Quartile 1 80 6.114 13.025 Quartile 2 159 13.025 Quartile 3 239 24.408 CLD Quartile 1 79 0.135 0.229 Quartile 2 159 0.229 Quartile 3 238 0.389 WL Quartile 1 80 2.382 4.382 Quartile 2 159 4.382 Quartile 3 239 9.825 AGE Quartile 1 64 3 5 Quartile 2 143 5 Quartile 3 231 8
8.3 Correlation
Table 8.2 presents the results of pairwise correlation coefficients of the dependent variables
(OSS and OUTR) and the identified standard explanatory variables (non-dummies). In each
case the level of significance of the correlation coefficient is shown just below it (the
coefficient).
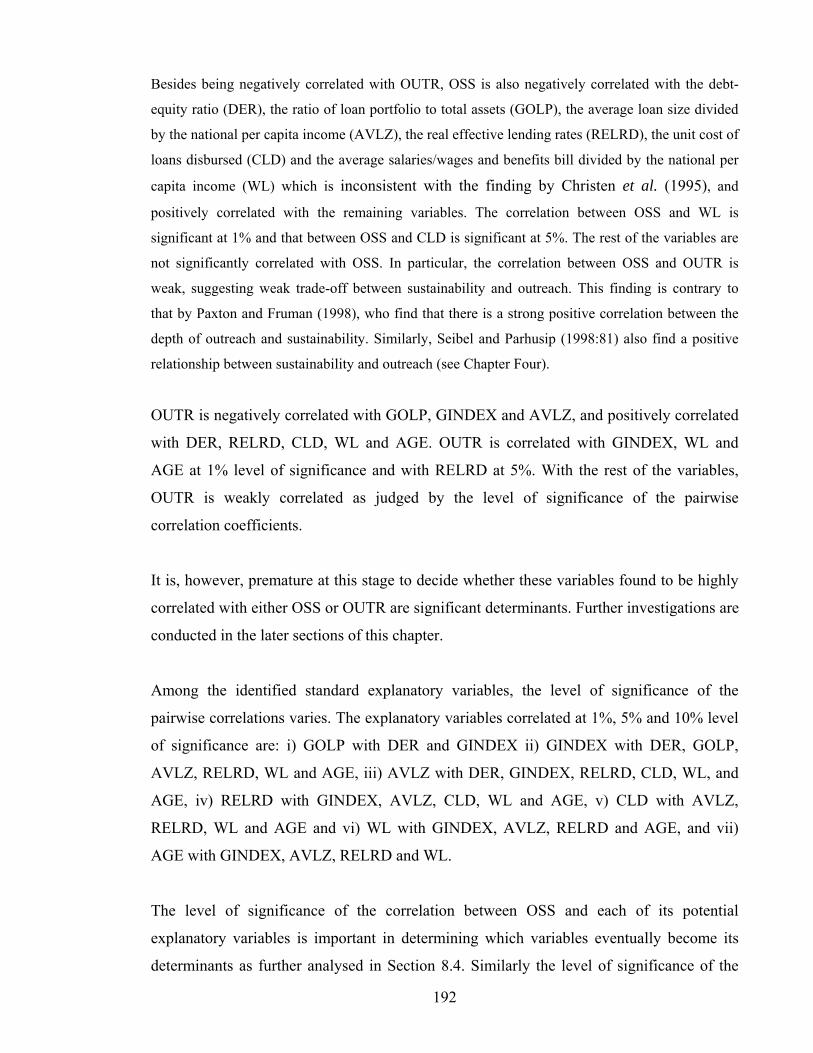
192
Besides being negatively correlated with OUTR, OSS is also negatively correlated with the debt-
equity ratio (DER), the ratio of loan portfolio to total assets (GOLP), the average loan size divided
by the national per capita income (AVLZ), the real effective lending rates (RELRD), the unit cost of
loans disbursed (CLD) and the average salaries/wages and benefits bill divided by the national per
capita income (WL) which is inconsistent with the finding by Christen et al. (1995), and
positively correlated with the remaining variables. The correlation between OSS and WL is
significant at 1% and that between OSS and CLD is significant at 5%. The rest of the variables are
not significantly correlated with OSS. In particular, the correlation between OSS and OUTR is
weak, suggesting weak trade-off between sustainability and outreach. This finding is contrary to
that by Paxton and Fruman (1998), who find that there is a strong positive correlation between the
depth of outreach and sustainability. Similarly, Seibel and Parhusip (1998:81) also find a positive
relationship between sustainability and outreach (see Chapter Four).
OUTR is negatively correlated with GOLP, GINDEX and AVLZ, and positively correlated
with DER, RELRD, CLD, WL and AGE. OUTR is correlated with GINDEX, WL and
AGE at 1% level of significance and with RELRD at 5%. With the rest of the variables,
OUTR is weakly correlated as judged by the level of significance of the pairwise
correlation coefficients.
It is, however, premature at this stage to decide whether these variables found to be highly
correlated with either OSS or OUTR are significant determinants. Further investigations are
conducted in the later sections of this chapter.
Among the identified standard explanatory variables, the level of significance of the
pairwise correlations varies. The explanatory variables correlated at 1%, 5% and 10% level
of significance are: i) GOLP with DER and GINDEX ii) GINDEX with DER, GOLP,
AVLZ, RELRD, WL and AGE, iii) AVLZ with DER, GINDEX, RELRD, CLD, WL, and
AGE, iv) RELRD with GINDEX, AVLZ, CLD, WL and AGE, v) CLD with AVLZ,
RELRD, WL and AGE and vi) WL with GINDEX, AVLZ, RELRD and AGE, and vii)
AGE with GINDEX, AVLZ, RELRD and WL.
The level of significance of the correlation between OSS and each of its potential
explanatory variables is important in determining which variables eventually become its
determinants as further analysed in Section 8.4. Similarly the level of significance of the
193
correlation between OUTR and each of its potential determinants is important in identifying
the determinants of OUTR.
In the case of the explanatory variables, the level of significance of the pairwise correlation
coefficients is an indicator of the strength of the relationship between the variables. It can
be seen that most of the explanatory variables are correlated, except that the pairwise
correlations can be described as weak. A situation of perfect correlation or multi-
collinearity among the explanatory variables poses problems in estimating the relationship
using Ordinary Least Squares (OLS) estimation method, as discussed in Chapter Seven and
section 8.4.
Table 8.2 Pairwise Correlation Coefficients and their Significance Levels Variable OSS OUTR DER GOLP GINDEX AVLZ RELRD CLD WL OSS 1.000 OUTR -0.041
0.468 1.00
DER -0.077 0.171
0.014 0.804
1.000
GOLP -0.069 0.221
-0.002 0.973
-0.204 0.000*
1.000
GINDEX 0.035 0.532
-0.179 0.001*
0.098 0.080***
-0.098 0.080***
1.000
AVLZ -0.054 0.340
-0.083 0.138
-0.121 0.031**
-0.024 0.670
0.347 0.000*
1.000
RELRD -0.003 0.957
0.136 0.015**
-0.086 0.127
0.039 0.491
-0.285 0.000*
0.187 0.000*
1.000
CLD -0.128 0.023**
0.035 0.530
-0.063 0.266
-0.075 0.181
0.028 0.622
-0.132 0.012*
0.288 0.000*
1.00
WL -0.144 0.010*
0.596 0.000*
-0.049 0.387
0.061 0.278
-0.102 0.070***
0.200 0.000*
0.146 0.009*
-0.02 0.68
1.000
AGE 0.007 0.904
0.199 0.000*
0.049 0.382
-0.046 0.412
0.383 0.000*
0.283 0.000*
0.118 0.036**
-0.03 0.50
0.182 0.001*
Key: OSS and OUTR are dependent variables, while the rest are explanatory variables. * means significant at 1% , **means significant at 5% and *** means significant at 10%.
8.4 Variable selection
(i) Operational self-sufficiency Model
The starting point in the choice of the explanatory variables for the OSS model was to
estimate an RE log-linear Generalised Least Squares (GLS) model, (GLS1) (Chang and
Lee, 1977). The results show (Table 8.3) that six explanatory variables are statistically
194
significant at 1-10 per cent level of significance: LTRELRD (log of transformed RELRD),
LCLD, LAVLZ and DDMg (at 1%), LAGE at 5% and LGOLP at 10% (in parentheses are
p-values). With the exception of LAVLZ and DDMg, the coefficients of the other
statistically significant variables have the expected signs. The dummy capturing the effects
of an MFI providing savings product was dropped, because it was highly correlated with
the rest of the explanatory variables.
To further investigate the relevant explanatory variables in the OSS model, especially those
found to be statistically insignificant in GLS1 and/or have unexpected signs, a stepwise
regression method was applied, taking into account the underlying theory of the
determinants of OSS (Chapter Four). Of the three variables: WL, GINDEX and DER, WL
has the highest p-value and was, therefore, excluded when performing GLS2 regression.
This process was conducted until only statistically significant variables were left in the final
regression.
The results of GLS1, GLS2, GLS3, GLS4 and GLS5 regressions are reported in Table 8.3.
In GLS5 the same variables which are statistically significant in GLS1 are still significant,
but with improved level of significance. For example, LGOLP which was significant at
10% in GLS1 is significant at 5% in GLS5, and LAGE which was significant at 5% is
significant at 1%. With the exception of LAVLZ and DMMg, the coefficients of the other
statistically significant variables at 10% have the expected signs. However, the unexpected
signs of the coefficients of LAVLZ and DDMg can be explained by the existing theoretical
arguments (see section 8.6).
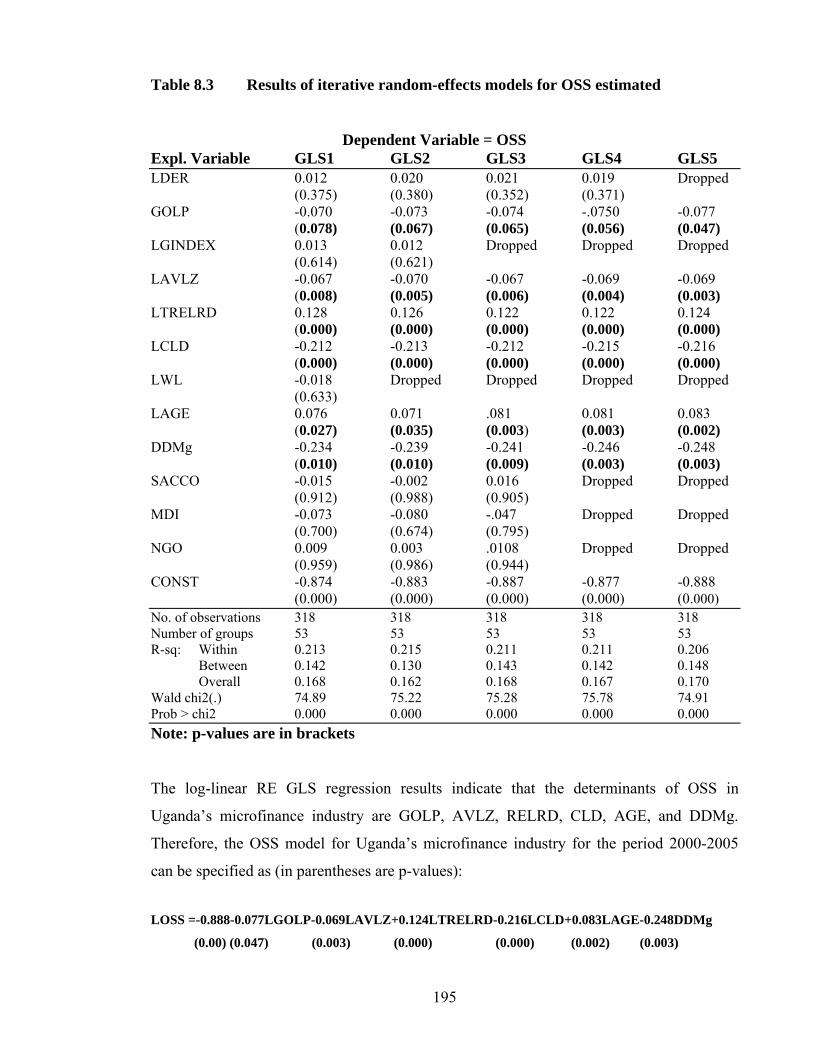
195
Table 8.3 Results of iterative random-effects models for OSS estimated
Dependent Variable = OSS Expl. Variable GLS1 GLS2 GLS3 GLS4 GLS5 LDER 0.012 0.020 0.021 0.019 Dropped
(0.375) (0.380) (0.352) (0.371) GOLP -0.070 -0.073 -0.074 -.0750 -0.077
(0.078) (0.067) (0.065) (0.056) (0.047) LGINDEX 0.013 0.012 Dropped Dropped Dropped
(0.614) (0.621) LAVLZ -0.067 -0.070 -0.067 -0.069 -0.069
(0.008) (0.005) (0.006) (0.004) (0.003) LTRELRD 0.128 0.126 0.122 0.122 0.124
(0.000) (0.000) (0.000) (0.000) (0.000) LCLD -0.212 -0.213 -0.212 -0.215 -0.216
(0.000) (0.000) (0.000) (0.000) (0.000) LWL -0.018 Dropped Dropped Dropped Dropped
(0.633) LAGE 0.076 0.071 .081 0.081 0.083
(0.027) (0.035) (0.003) (0.003) (0.002) DDMg -0.234 -0.239 -0.241 -0.246 -0.248
(0.010) (0.010) (0.009) (0.003) (0.003) SACCO -0.015 -0.002 0.016 Dropped Dropped
(0.912) (0.988) (0.905) MDI -0.073 -0.080 -.047 Dropped Dropped
(0.700) (0.674) (0.795) NGO 0.009 0.003 .0108 Dropped Dropped (0.959) (0.986) (0.944) CONST -0.874 -0.883 -0.887 -0.877 -0.888 (0.000) (0.000) (0.000) (0.000) (0.000) No. of observations 318 318 318 318 318 Number of groups 53 53 53 53 53 R-sq: Within 0.213 0.215 0.211 0.211 0.206
Between 0.142 0.130 0.143 0.142 0.148 Overall 0.168 0.162 0.168 0.167 0.170
Wald chi2(.) 74.89 75.22 75.28 75.78 74.91 Prob > chi2 0.000 0.000 0.000 0.000 0.000 Note: p-values are in brackets
The log-linear RE GLS regression results indicate that the determinants of OSS in
Uganda’s microfinance industry are GOLP, AVLZ, RELRD, CLD, AGE, and DDMg.
Therefore, the OSS model for Uganda’s microfinance industry for the period 2000-2005
can be specified as (in parentheses are p-values):
LOSS =-0.888-0.077LGOLP-0.069LAVLZ+0.124LTRELRD-0.216LCLD+0.083LAGE-0.248DDMg
(0.00) (0.047) (0.003) (0.000) (0.000) (0.002) (0.003)
196
(ii) Outreach Model
As is the case in the OSS model, the starting point in the choice of the explanatory variables
for the OUTR model was to estimate an FE log-linear model (FE1). The results show
(Table 8.4) that seven explanatory variables are statistically significant at 1-10 per cent
level of significance: LGOLP, LGINDEX, LAVLZ, LAGE, and SACCO (at 1%) and
LCLD and LWL at 10% (in parentheses are p-values). The coefficients of all statistically
significant variables at 10% have the expected signs.
To further investigate the relevant explanatory variables in the OUTR model, a stepwise
regression approach taking into account the underlying theory of the determinants of OUTR
was adopted. This procedure was followed until the final model considered to be explaining
outreach of MFIs in Uganda (FE5 in Table 8.4) was arrived at.
The results of FE1, FE2, FE3, FE4 and FE5 regressions are reported in Table 8.4. In FE5,
in addition to the same variables which are statistically significant in FE1 at 10%, DDMg
and MDI which substantially contribute to the variations in OUTR were identified. With
the exception of DDMg and MDI, the coefficients of the other variables have the expected
signs.
The log-linear FE regression results indicate that the determinants of OUTR in Uganda’s
microfinance industry are GOLP, GINDEX, AVLZ, CLD, WL, AGE, DDMg, SACCO and
MDI. Therefore, the OUTR model for Uganda’s microfinance industry for the period 2000-
2005 can be specified as (in parentheses are p-values):
LOUTR = 3.79+0.19LGOLP+0.25LGINDEX-0.15LAVLZ-0.10LCLD+0.11LWL+0.50LAGE)-
(0.00) (0.01) (0.00) (0.00) (0.03) (0.08) (0.00)
0.41DDMg + 0.95SACCO - 0.33MDI
(0.16) (0.00) (0.20)
Table 8.4 Results of iterative fixed-effects models for OUTR estimated
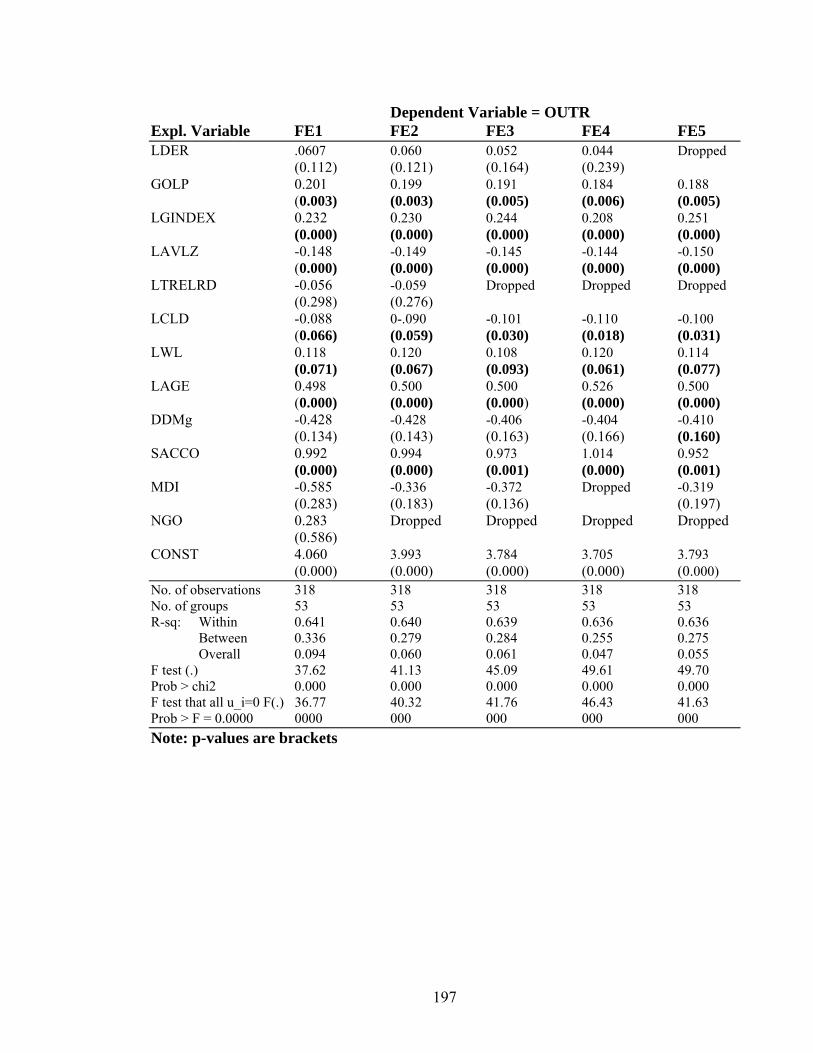
197
Dependent Variable = OUTR Expl. Variable FE1 FE2 FE3 FE4 FE5 LDER .0607 0.060 0.052 0.044 Dropped
(0.112) (0.121) (0.164) (0.239) GOLP 0.201 0.199 0.191 0.184 0.188
(0.003) (0.003) (0.005) (0.006) (0.005) LGINDEX 0.232 0.230 0.244 0.208 0.251
(0.000) (0.000) (0.000) (0.000) (0.000) LAVLZ -0.148 -0.149 -0.145 -0.144 -0.150
(0.000) (0.000) (0.000) (0.000) (0.000) LTRELRD -0.056 -0.059 Dropped Dropped Dropped
(0.298) (0.276) LCLD -0.088 0-.090 -0.101 -0.110 -0.100
(0.066) (0.059) (0.030) (0.018) (0.031) LWL 0.118 0.120 0.108 0.120 0.114
(0.071) (0.067) (0.093) (0.061) (0.077) LAGE 0.498 0.500 0.500 0.526 0.500
(0.000) (0.000) (0.000) (0.000) (0.000) DDMg -0.428 -0.428 -0.406 -0.404 -0.410
(0.134) (0.143) (0.163) (0.166) (0.160) SACCO 0.992 0.994 0.973 1.014 0.952
(0.000) (0.000) (0.001) (0.000) (0.001) MDI -0.585 -0.336 -0.372 Dropped -0.319
(0.283) (0.183) (0.136) (0.197) NGO 0.283 Dropped Dropped Dropped Dropped (0.586) CONST 4.060 3.993 3.784 3.705 3.793 (0.000) (0.000) (0.000) (0.000) (0.000) No. of observations 318 318 318 318 318 No. of groups 53 53 53 53 53 R-sq: Within 0.641 0.640 0.639 0.636 0.636
Between 0.336 0.279 0.284 0.255 0.275 Overall 0.094 0.060 0.061 0.047 0.055
F test (.) 37.62 41.13 45.09 49.61 49.70 Prob > chi2 0.000 0.000 0.000 0.000 0.000 F test that all u_i=0 F(.) 36.77 40.32 41.76 46.43 41.63 Prob > F = 0.0000 0000 000 000 000 000 Note: p-values are brackets
198
8.5 The econometric results and discussion
8.5.1 The econometric results
As can be seen in Table 8.3, OSS of the studied MFIs in Uganda is driven significantly by
the ratio of gross loan portfolio to total assets (GOLP), the average loan size relative to the
national per capita income (AVLZ), the real effective lending rates (RELRD), the unit cost
of loans disbursed (CLD), the age (AGE) of the MFI, and the type of the dominant delivery
mechanism (DDMg). Based on the level of statistical significance, LAVLZ, LTRELRD,
LCLD and DDMg are highly important, while LGOLP and LAGE are moderately
important. Based on the contribution to the proportional change in the variations in OSS,
DDMg is the most important determinant of OSS, followed by LCLD. This implies that for
MFIs to improve their OSS, they must put the emphasis on the identified determinants
starting with DDMg, followed by CLD, both of which negatively affect OSS.
DER, GINDEX, WL, SACCO, MDI and NGO were all found to be both statistically
insignificant and unimportant in terms of their contribution to the variations in OSS. As a
result these variables are not reflected in the OSS equation.
Table 8.4 shows that OUTR of the studied microfinance institutions in Uganda is
significantly driven by the ratio of gross loan portfolio to total assets (GOLP), the level of
effectiveness of governance (GINDEX), the average loan size relative to the national per
capita income (AVLZ), the unit cost of loans disbursed (CLD), the average salary/wage
paid to staff relative to the national per capita income (WL), the age (AGE) of the MFI, and
the MFI being a SACCO. All these are statistically significant at 1%, 5% and 10%.
Because of the level of their contribution to the proportional change in the variations of
OUTR, the dominant delivery mechanism (DDMg) and MDI are also viewed as important
determinants of OUTR. Based on the contribution to the proportional change in the
variations in OUTR, SACCO is the most important determinant of OUTR, followed by the
age of the MFI and then the institution being an MDI. The findings suggest that for OUTR
to be improved, an MFI being a SACCOs is a major determinant.
199
DER and NGO were found to be both statistically insignificant and unimportant in terms of
their contribution to the variations in outreach. As a result these variables are not reflected
in the outreach equation.
8.5.3 Discussion of the econometric results
8.5.2.1 Gross outstanding loan portfolio as a proportion of total assets (GOLP).
It is hypothesised in this study that GOLP is negatively related to sustainability for the
reasons discussed in Chapter Four, one of which is that the more the amount of loans
collected (which means less amount of outstanding loans) the more is the revenue
generated for the MFI. It is positively related to outreach because the less the uncollected
loans (less outstanding loans) the less the number of clients. Furthermore, as argued in
Chapter Four, sub-section 4.2.1.4, a significant amount of literature on microfinance has
placed a lot of emphasis on the sources of funds (measured in this study by DER) and less
on its uses (GOLP) as a major determinant of sustainability and outreach.
The econometric results in this study show that the uses of funds is (both statistically and in
its contribution to the changes in OSS and OUTR) a more important determinant of
sustainability and outreach than sources of funds. It is negatively related with OSS, but
positively related with OUTR. The negative relationship between GOLP and OSS means
that MFIs must recover the disbursed loans, as the greater the loan portfolio or high non-
performing loan portfolio the lower the level of sustainability. The positive relationship
with outreach means that the more money is with the clients, the more people are reached
(assuming loans is the only product offered by the MFI as argued in subsection 4.2.1.4),
and hence the greater the outreach. These findings call for balancing between the strategies
for achieving sustainability objective and those for achieving outreach objective.
8.5.2.2 Governance
The theoretical and empirical analysis of the relationship between governance and
sustainability and governance and outreach is presented in Chapter Four, sub-section 4.2.2.
200
It is hypothesised that effective governance measured in this study by GINDEX is
positively associated with both sustainability and outreach.
In this study the results show that the level of the effectiveness of governance is a key
determinant of outreach, and this could be attributed to the growth in the size of the studied
MFIs which has necessitated instituting key checks and balances in the institutions to
ensure systematic growth. On the other hand, governance is not a key determinant of OSS,
although its level of effectiveness positively affects it. This result is intriguing, but could be
explained by, first, the less emphasis the majority of the MFIs studied could be putting on
sustainability as compared to outreach. Second, by the fact that OSS is not the most
appropriate measure of sustainability as it does not account for all the subsidies to the
MFIs, which could be making it (OSS) less sensitive to governance issues.
8.5.2.3 Average loan size
A lot of debate on the relationship between the loan size and outreach, on the one hand, and
loan size and sustainability, on the other hand, has raged on for a long time (see chapter
four sub-section 4.2.4). In this study it is hypothesised that average loan as a proportion of
the national income per capita is positively associated with sustainability and negatively
associated with outreach.
Empirical evidence from this study shows that average loan size as a proportion of the
national income per capita is negatively related to both sustainability and outreach and also
statistically significant in both models. These findings are interesting and consistent with
arguments that have been advanced by several authors, who posit that there is no conflict
between serving poor clients and being sustainable (see Chapter Four). That is, the smaller
the loan size the more clients an MFI can serve, and that disbursing small loans is not
inconsistent with sustainability, especially in efficient MFIs.
8.5.2.4 Real effective lending interest rates
Chapters Four (sub-section 4.2.5.2) and Five illustrate and provide a survey of literature on
the implications of lending rates for sustainability and outreach of MFIs. As argued in the
201
chapters, holding other factors constant, the price of a product sold positively affects the
profitability or sustainability of the business engaged in the sale of that product, but
negatively affects the demand for the product or the quantity supplied/sold.
Empirical findings from this study show that the real effective lending rate positively
affects sustainability, which is consistent with the maintained hypothesis and is statistically
significant. It is however, not a significant determinant of outreach, partly because the
demand for credit in Uganda, with a large number of the population served by the informal
sector as discussed in Chapter Two, is either inelastic or highly inelastic. In addition, a
number of authors have argued that access to finance is not often constrained by interest
rates, but by other factors such as availability of financial services (Robinson, 2001a).
8.5.2.5 Unit cost of loans disbursed
The basic business equation relating sustainability and costs is π = TR-TC, where π is a
proxy measure for sustainability, TR is total operating revenue generated by the firm, and
TC is total costs incurred in generating TR (see Chapters Three, Four and Five). From this
equation, ceteris paribus, TC is negatively related with sustainability as higher TC is
related to lower π. Empirical findings of this study are, thus, consistent with the maintained
hypothesis in this study that the unit cost of loans disbursed is negatively related with
sustainability and outreach. The findings also indicate that the unit cost of loans disbursed
is negatively related with outreach, which is also consistent with the maintained hypothesis.
In both models the unit cost of loans disbursed is statistically significant at 5 per cent level.
These findings call for efficient operations by MFIs to minimise costs.
8.6.2.6 Delivery mechanisms
The two delivery mechanisms investigated in this study are group- and individual-based
systems (see Chapter Four, sub-section 4.2.8). It is hypothesised that if the dominant
delivery mechanism is group-based, both sustainability and outreach are positively
influenced compared to a case where the individual lending mechanism is dominant. The
empirical results indicate that, as a dominant methodology, the group-based delivery
mechanism is negatively related to both sustainability and outreach compared to the
202
individual-based method. However, the group-based delivery method is statistically
significant in the sustainability model, but not in the outreach model. On the other hand, the
contribution of the group-based delivery mechanism to the proportional variation in OUTR
is substantial compared to the individual-based method, and hence it is recognised as an
important explanatory variable in the outreach model.
These are important empirical findings in that both in the theoretical and empirical
literature there is a lot of debate on group-based versus individual lending methods, with
some camps arguing in favour of one or the other (see Chapter Four). For example, using
regression analysis on a sample of over 83 MFIs, Hulme and Mosley (1996) find that,
contrary to theoretical arguments in favour of group-based lending, the organisation of
borrowers in groups is neither necessary nor sufficient for success. The findings of this
study show that in the case of the MFIs studied for the period 2000-2005, the group-based
delivery mechanism is negatively related to both sustainability and outreach compared to
the individual-based method, which suggests that for the MFIs to be sustainable and reach
more clients they should adopt individual-based delivery mechanism.
8.5.2.7 Age of the institution providing the financial services
Another factor found to be a statistically significant explanatory variable in both
sustainability and outreach models, and also consistent with the maintained hypothesis in
this study that age is positively related to sustainability and outreach. This is further
consistent with the SEEP Network and Calmeadow (1995) arguments that the maturity of
an institution is one of the key factors that influence the level of activities and hence
operational costs. The age of an organisation positively affects its sustainability and
outreach through accumulated experience gained from learning by doing, the development
of operating systems, experience and training of staff, and economies of scale (see Chapter
Four, sub-section 4.2.9 and Pindyck and Rubinfeld, 1998:230).
8.5.2.8 Salaries/Wages
In a study of 11 MFIs (see Chapter Five, section 5.7), Christen et al. (1995) find that the
average wage paid to MFI staff in relation to the national per capita income positively and
203
significantly affects financial viability. The results of this study indicate that the average
wage paid to MFI staff in relation to the national per capita income positively and
significantly affects outreach but not sustainability. The positive association between
average wage paid to MFI staff in relation to the national per capita income and outreach is
consistent with the hypothesis of this study. However, as the findings indicate, higher pay
to staff may not necessarily be translated into the sustainability of the MFI, and here lies the
contradiction between paying higher wages to boost outreach, which may lead to a lower
level of sustainability of the MFI. Hence, the MFIs need to find an optimal balance between
expanding outreach and attaining sustainability to minimise the conflicts between the two.
8.5.2.9 Institutional types
The question of the institutional types and their effects on sustainability has also been a
subject of widespread debate. In this study institutional types investigated are MFIs that are
private companies (COMP), non-governmental organisations (NGOs), savings and co-
operatives (SACCOs) and microfinance deposit-taking institutions (MDIs). The hypothesis
is that being a SACCO or an MDI is positively related with OSS compared to being a
private company (COMP), while being an NGO is negatively related with OSS compared
to being a COMP. With respect to outreach, the hypothesis is that being a SACCO, an MDI
or an NGO is positively related with OUTR compared to being a COMP.
Using COMP as the reference point, the results indicate that institutional types are not
statistically significant in the OSS model and their contributions to the variations in OSS
are negligible. In the OUTR model (sub-section 8.5.1) compared to COMP, SACCOs are
both statistically significant and their contribution to the variations in OUTR is very
important. MDIs, meanwhile, are not statistically significant in the OUTR as well, but their
contribution (32%) to the variations in OUTR is relatively important. The NGOs are neither
statistically significant nor make a substantial contribution to the variations in OUTR. This
study did not establish the reasons for these findings. Further research in this area is
recommended.
204
8.6 Empirical results of the survey on the effects of financial regulation of the
microfinance institutions in Uganda on their sustainability and outreach
This section reports the empirical findings of the effects of financial regulation of MFIs in
Uganda on their sustainability and outreach.
8.6.1 The number of Tier 4 MFIs38 interviewed, whether accepting savings or not
and, if accepting savings, why
Table 8.5 presents the number of Tier 4 MFIs interviewed by legal status, the number
accepting savings and the average number of shareholders, where applicable. The
MFIs/programmes interviewed include four private limited companies (12.9% of all the
MFIs interviewed), 15 non-governmental organisations (NGOs) also registered as
companies limited by guarantee (48.4% of all the MFIs interviewed), 11 SACCOs (35% of
all the MFIs interviewed), and 1 public limited company (3.2% of all the MFIs interviewed)
(see Appendix A2). The findings indicate that 75% of the private limited companies accept
savings and have, on average, 721 shareholders; 86.7% of the NGOs accept savings; all the
SACCOs accept savings and, on average, have 1,198 shareholders; and finally, the limited
public company also accepts savings.
Asked why they take savings, the responses of the MFIs by legal status are reported in
Table 8.6. Most of the MFIs interviewed take savings for lending (51.6%), which is their
main activity, and loan guarantee (51.6%), which is one of the main securities for loans
given out. A few MFIs take savings, which they place as a guarantee when borrowing from
other financial institutions. It was beyond the scope of this study to establish why a few
MFIs pledge savings as security to secure funds from other financial institutions, but this
could be because of a weak linkage between the microfinance industry and the more
established formal financial institutions (see Chapter Two and sub-section 8.6.7).
38 See section 1.1 and sub-section 6.4.1 for the definition of Tier 4 MFIs.
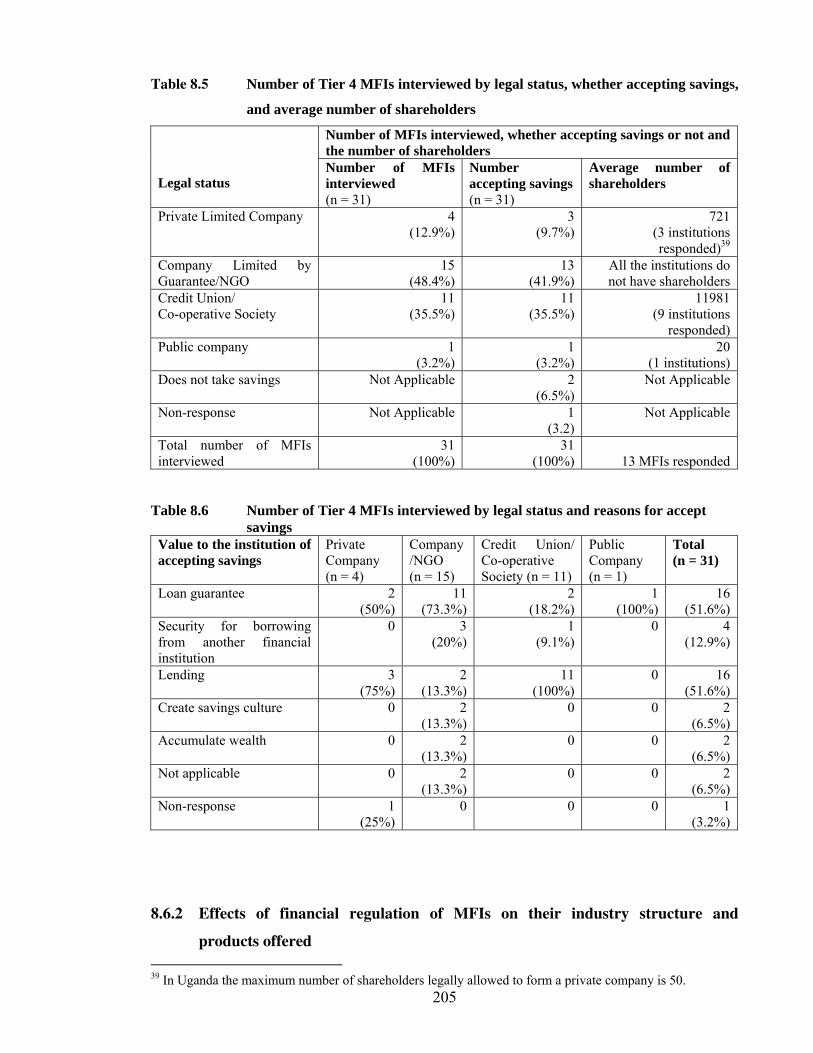
205
Table 8.5 Number of Tier 4 MFIs interviewed by legal status, whether accepting savings,
and average number of shareholders
Number of MFIs interviewed, whether accepting savings or not and the number of shareholders
Legal status
Number of MFIs interviewed (n = 31)
Number accepting savings (n = 31)
Average number of shareholders
Private Limited Company 4 (12.9%)
3 (9.7%)
721 (3 institutions responded)39
Company Limited by Guarantee/NGO
15 (48.4%)
13 (41.9%)
All the institutions do not have shareholders
Credit Union/ Co-operative Society
11 (35.5%)
11 (35.5%)
11981 (9 institutions
responded)Public company 1
(3.2%)1
(3.2%) 20
(1 institutions)Does not take savings Not Applicable 2
(6.5%) Not Applicable
Non-response Not Applicable 1 (3.2)
Not Applicable
Total number of MFIs interviewed
31 (100%)
31 (100%)
13 MFIs responded
Table 8.6 Number of Tier 4 MFIs interviewed by legal status and reasons for accept
savings Value to the institution of accepting savings
Private Company (n = 4)
Company/NGO (n = 15)
Credit Union/ Co-operative Society (n = 11)
Public Company (n = 1)
Total (n = 31)
Loan guarantee 2 (50%)
11 (73.3%)
2 (18.2%)
1 (100%)
16 (51.6%)
Security for borrowing from another financial institution
0 3 (20%)
1 (9.1%)
0 4 (12.9%)
Lending 3 (75%)
2 (13.3%)
11 (100%)
0 16 (51.6%)
Create savings culture 0 2 (13.3%)
0 0 2 (6.5%)
Accumulate wealth 0 2 (13.3%)
0 0 2 (6.5%)
Not applicable 0 2 (13.3%)
0 0 2 (6.5%)
Non-response 1 (25%)
0 0 0 1 (3.2%)
8.6.2 Effects of financial regulation of MFIs on their industry structure and
products offered 39 In Uganda the maximum number of shareholders legally allowed to form a private company is 50.
206
The findings reported in Tables 8.5 and 8.6 are related to financial regulation in two ways.
First, the MDI Act, 2003 and Financial Institutions Act, 2004 permit only financial
institutions licensed under them to take public deposits for intermediation. With the
exception of SACCOs, which are legally allowed to take deposits from their members, the
rest of the institutions covered in the survey were illegally taking savings for intermediation
or other purposes as reported.
Therefore, the immediate effects financial regulation has had on the MFIs interviewed are:
i) some of the institutions which were hitherto mobilising public deposits or savings for
intermediation have had to change their legal status, stop taking deposits or savings for
intermediation or close down. Of the 31 MFIs surveyed, three have merged and formed a
company for providing credit-only services, one divested the microfinance arm from the
parent NGO, three have become SACCOs, four have become MDIs, and two have closed
down; and ii) MFIs have had to restructure the services offered.
The effects on sustainability and outreach of these changes are analysed in the subsequent
parts of this section.
8.6.3 Effects of the MDI Act, 2003 on the legal status of Tier 4 MFIs
To capture the effects of the MDI Act, 2003 on the sustainability and outreach of MFIs
from the perspective of changes in the legal status, Tier 4 MFIs were interviewed to
establish what would happen to their legal status if it did come into force. A follow-up
study that covered three MDIs was also conducted to establish the actual effects on the
sustainability and outreach of the enactment of the MDI Act, 2003.
Table 8.7 presents the results as to whether the MFIs interviewed would register as MDIs
immediately, later or not at all. The results indicate that 13 (41.9%) of the interviewed
MFIs would register immediately under the Act because they saw the requirements as an
incentive, and could meet all of them. However, as of June 30, 2007, only 4 previously Tier
4 MFIs had been registered as MDIs, a number far lower than 13, but reasonable. 17
(54.8%) of the MFIs said they would register later under the MDI Act, 2003, because they
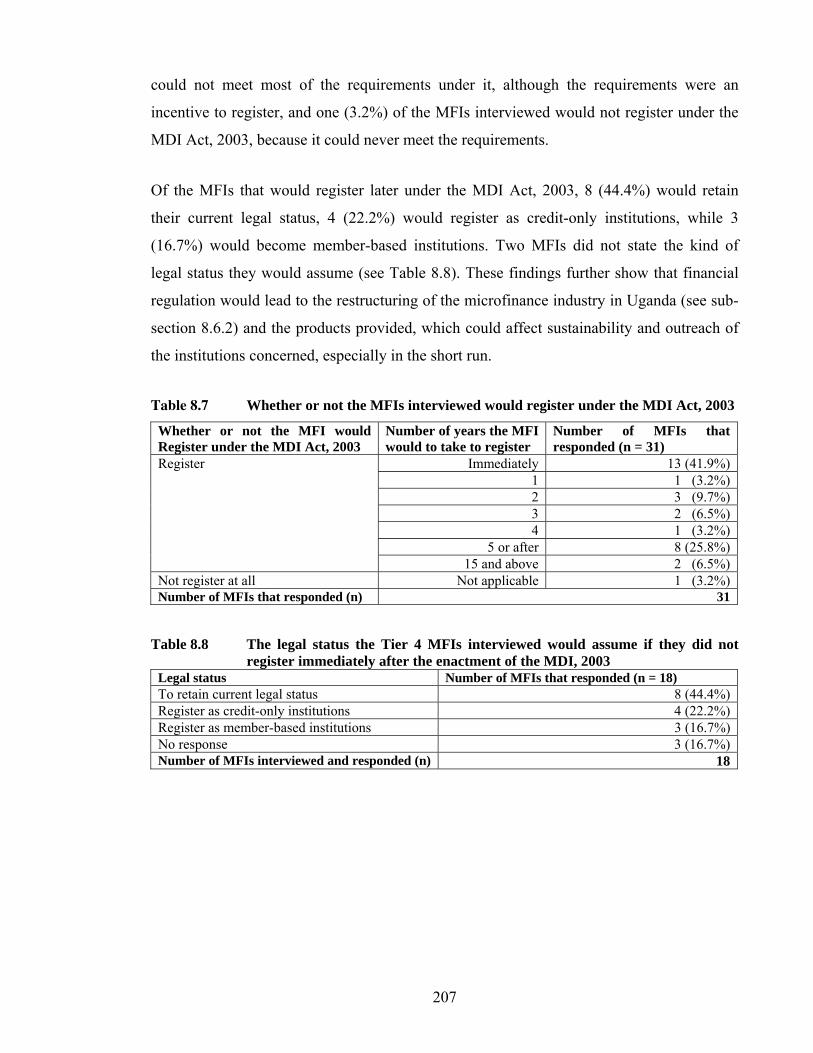
207
could not meet most of the requirements under it, although the requirements were an
incentive to register, and one (3.2%) of the MFIs interviewed would not register under the
MDI Act, 2003, because it could never meet the requirements.
Of the MFIs that would register later under the MDI Act, 2003, 8 (44.4%) would retain
their current legal status, 4 (22.2%) would register as credit-only institutions, while 3
(16.7%) would become member-based institutions. Two MFIs did not state the kind of
legal status they would assume (see Table 8.8). These findings further show that financial
regulation would lead to the restructuring of the microfinance industry in Uganda (see sub-
section 8.6.2) and the products provided, which could affect sustainability and outreach of
the institutions concerned, especially in the short run.
Table 8.7 Whether or not the MFIs interviewed would register under the MDI Act, 2003
Whether or not the MFI would Register under the MDI Act, 2003
Number of years the MFI would to take to register
Number of MFIs that responded (n = 31)
Immediately 13 (41.9%)1 1 (3.2%) 2 3 (9.7%)3 2 (6.5%)4 1 (3.2%)
5 or after 8 (25.8%)
Register
15 and above 2 (6.5%)Not register at all Not applicable 1 (3.2%) Number of MFIs that responded (n) 31
Table 8.8 The legal status the Tier 4 MFIs interviewed would assume if they did not
register immediately after the enactment of the MDI, 2003 Legal status Number of MFIs that responded (n = 18) To retain current legal status 8 (44.4%)Register as credit-only institutions 4 (22.2%)Register as member-based institutions 3 (16.7%)No response 3 (16.7%)Number of MFIs interviewed and responded (n) 18
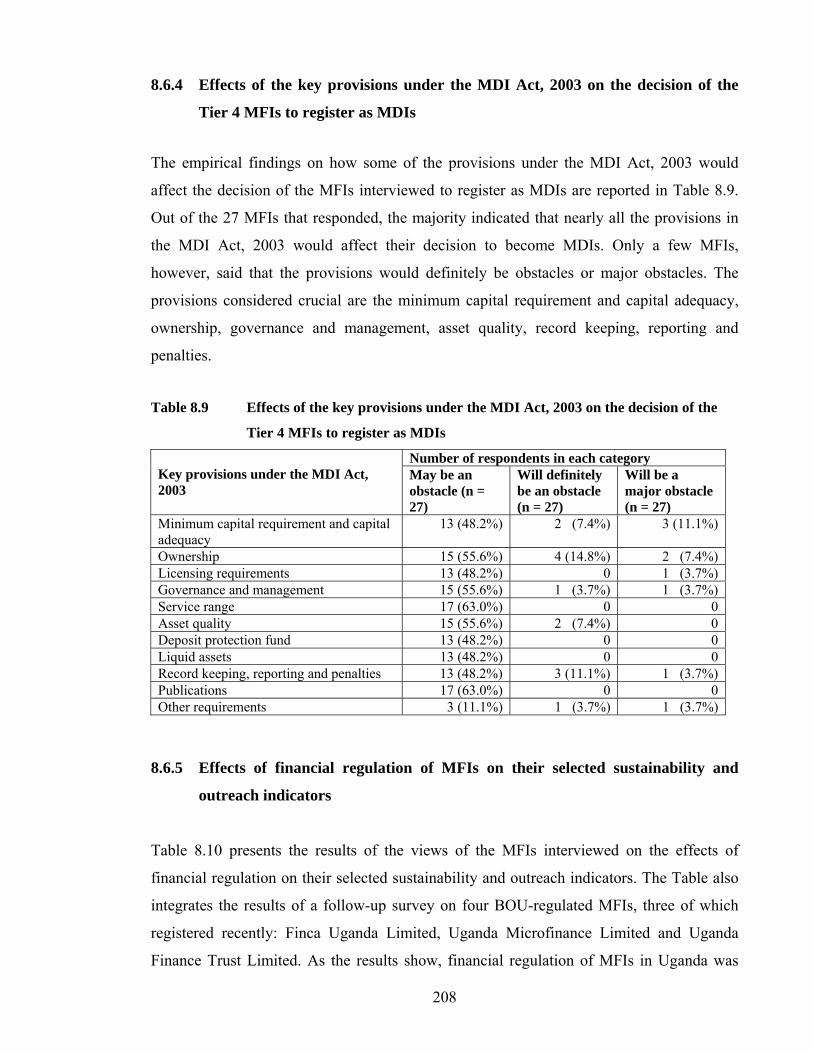
208
8.6.4 Effects of the key provisions under the MDI Act, 2003 on the decision of the
Tier 4 MFIs to register as MDIs
The empirical findings on how some of the provisions under the MDI Act, 2003 would
affect the decision of the MFIs interviewed to register as MDIs are reported in Table 8.9.
Out of the 27 MFIs that responded, the majority indicated that nearly all the provisions in
the MDI Act, 2003 would affect their decision to become MDIs. Only a few MFIs,
however, said that the provisions would definitely be obstacles or major obstacles. The
provisions considered crucial are the minimum capital requirement and capital adequacy,
ownership, governance and management, asset quality, record keeping, reporting and
penalties.
Table 8.9 Effects of the key provisions under the MDI Act, 2003 on the decision of the
Tier 4 MFIs to register as MDIs
Number of respondents in each category Key provisions under the MDI Act, 2003
May be an obstacle (n = 27)
Will definitely be an obstacle (n = 27)
Will be a major obstacle (n = 27)
Minimum capital requirement and capital adequacy
13 (48.2%) 2 (7.4%) 3 (11.1%)
Ownership 15 (55.6%) 4 (14.8%) 2 (7.4%)Licensing requirements 13 (48.2%) 0 1 (3.7%)Governance and management 15 (55.6%) 1 (3.7%) 1 (3.7%)Service range 17 (63.0%) 0 0Asset quality 15 (55.6%) 2 (7.4%) 0Deposit protection fund 13 (48.2%) 0 0Liquid assets 13 (48.2%) 0 0Record keeping, reporting and penalties 13 (48.2%) 3 (11.1%) 1 (3.7%)Publications 17 (63.0%) 0 0Other requirements 3 (11.1%) 1 (3.7%) 1 (3.7%)
8.6.5 Effects of financial regulation of MFIs on their selected sustainability and
outreach indicators
Table 8.10 presents the results of the views of the MFIs interviewed on the effects of
financial regulation on their selected sustainability and outreach indicators. The Table also
integrates the results of a follow-up survey on four BOU-regulated MFIs, three of which
registered recently: Finca Uganda Limited, Uganda Microfinance Limited and Uganda
Finance Trust Limited. As the results show, financial regulation of MFIs in Uganda was
209
being viewed with a lot of optimism. The majority of the MFIs interviewed were of the
view that financial regulation would lead to:
• a reduction in the borrowing rates as the MFIs would access funds from diversified
sources;
• increased number of clients due to increased branch network and geographical
coverage;
• increased profitability resulting from serving more clients and generating more
revenue, although the cost of operations was envisaged to increase as well;
• increased savings volume because more clients were saving with the MFIs;
• more financial services would be provided and be available to low-income earners
because of increased opportunities to innovate;
• more economic activities would be financed; and
• improved operational policies because of the requirements under the MDI Act
and/or the desire to become regulated under the Act.
To test some of the claims made by the Tier 4 MFIs interviewed, four BOU-regulated MFIs
were interviewed. One of the four regulated MFIs was licensed in 2000 and the rest were
licensed in 2004 and 2005. The results of the interview are reported in Table 8.10. All the
four regulated MFIs interviewed reported that their borrowing rates had declined, but
lending rates remained unchanged. Other findings show that the cost of operations,
profitability, savings mobilisation, economic activities financed, sources of funding, branch
network/agencies, more services and innovations, public confidence and trust in the MFI,
and operational policies have gone up or improved. This is consistent with the predictions
from the first survey reported earlier and the theoretical arguments presented in Chapter
Six.
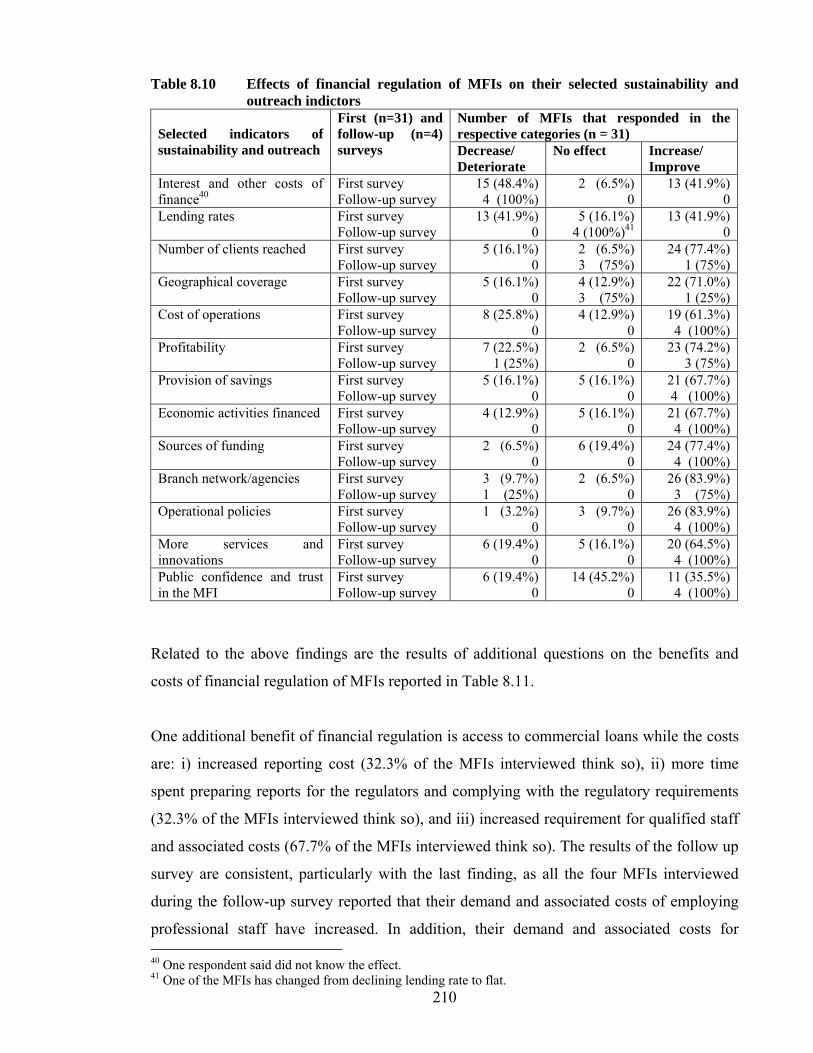
210
Table 8.10 Effects of financial regulation of MFIs on their selected sustainability and outreach indictors
Number of MFIs that responded in the respective categories (n = 31)
Selected indicators of sustainability and outreach
First (n=31) and follow-up (n=4) surveys Decrease/
Deteriorate No effect
Increase/ Improve
Interest and other costs of finance40
First survey Follow-up survey
15 (48.4%) 4 (100%)
2 (6.5%) 0
13 (41.9%) 0
Lending rates First survey Follow-up survey
13 (41.9%) 0
5 (16.1%) 4 (100%)41
13 (41.9%) 0
Number of clients reached First survey Follow-up survey
5 (16.1%) 0
2 (6.5%) 3 (75%)
24 (77.4%) 1 (75%)
Geographical coverage First survey Follow-up survey
5 (16.1%) 0
4 (12.9%) 3 (75%)
22 (71.0%) 1 (25%)
Cost of operations First survey Follow-up survey
8 (25.8%) 0
4 (12.9%) 0
19 (61.3%) 4 (100%)
Profitability First survey Follow-up survey
7 (22.5%) 1 (25%)
2 (6.5%) 0
23 (74.2%) 3 (75%)
Provision of savings First survey Follow-up survey
5 (16.1%) 0
5 (16.1%) 0
21 (67.7%) 4 (100%)
Economic activities financed First survey Follow-up survey
4 (12.9%) 0
5 (16.1%) 0
21 (67.7%) 4 (100%)
Sources of funding First survey Follow-up survey
2 (6.5%) 0
6 (19.4%) 0
24 (77.4%) 4 (100%)
Branch network/agencies First survey Follow-up survey
3 (9.7%) 1 (25%)
2 (6.5%) 0
26 (83.9%) 3 (75%)
Operational policies First survey Follow-up survey
1 (3.2%) 0
3 (9.7%) 0
26 (83.9%) 4 (100%)
More services and innovations
First survey Follow-up survey
6 (19.4%) 0
5 (16.1%) 0
20 (64.5%) 4 (100%)
Public confidence and trust in the MFI
First survey Follow-up survey
6 (19.4%) 0
14 (45.2%) 0
11 (35.5%) 4 (100%)
Related to the above findings are the results of additional questions on the benefits and
costs of financial regulation of MFIs reported in Table 8.11.
One additional benefit of financial regulation is access to commercial loans while the costs
are: i) increased reporting cost (32.3% of the MFIs interviewed think so), ii) more time
spent preparing reports for the regulators and complying with the regulatory requirements
(32.3% of the MFIs interviewed think so), and iii) increased requirement for qualified staff
and associated costs (67.7% of the MFIs interviewed think so). The results of the follow up
survey are consistent, particularly with the last finding, as all the four MFIs interviewed
during the follow-up survey reported that their demand and associated costs of employing
professional staff have increased. In addition, their demand and associated costs for 40 One respondent said did not know the effect. 41 One of the MFIs has changed from declining lending rate to flat.
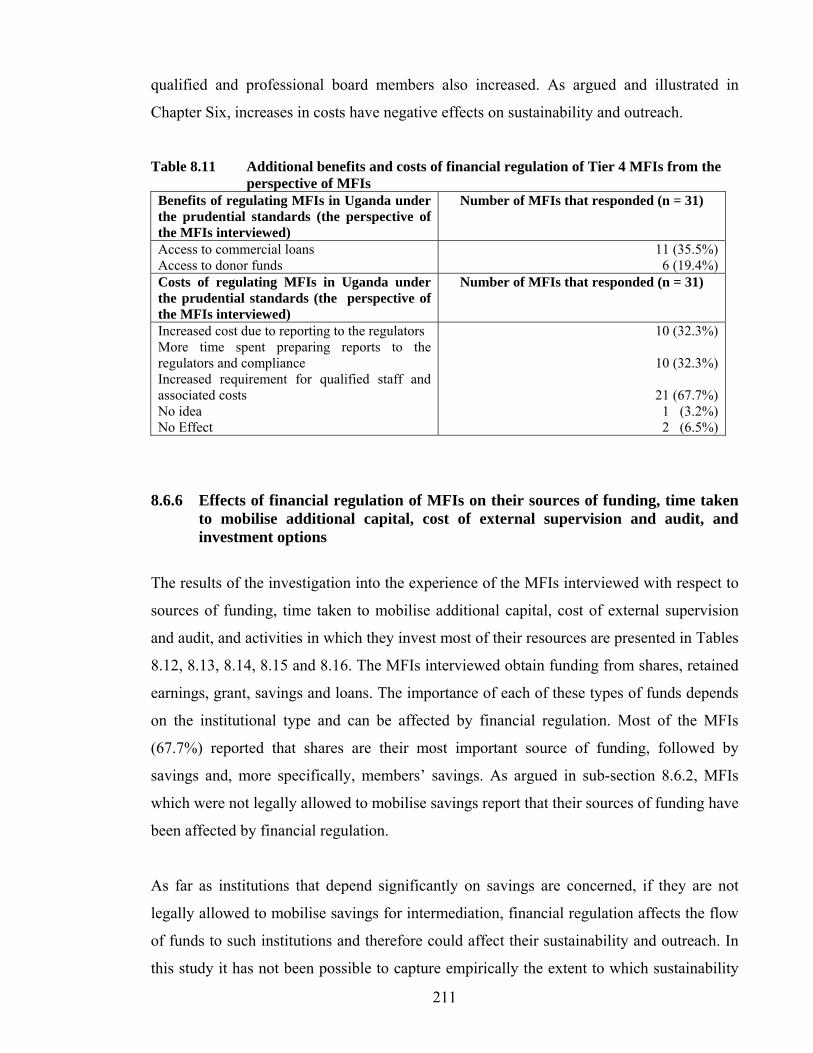
211
qualified and professional board members also increased. As argued and illustrated in
Chapter Six, increases in costs have negative effects on sustainability and outreach.
Table 8.11 Additional benefits and costs of financial regulation of Tier 4 MFIs from the perspective of MFIs
Benefits of regulating MFIs in Uganda under the prudential standards (the perspective of the MFIs interviewed)
Number of MFIs that responded (n = 31)
Access to commercial loans Access to donor funds
11 (35.5%) 6 (19.4%)
Costs of regulating MFIs in Uganda under the prudential standards (the perspective of the MFIs interviewed)
Number of MFIs that responded (n = 31)
Increased cost due to reporting to the regulators More time spent preparing reports to the regulators and compliance Increased requirement for qualified staff and associated costs No idea No Effect
10 (32.3%)
10 (32.3%)
21 (67.7%) 1 (3.2%) 2 (6.5%)
8.6.6 Effects of financial regulation of MFIs on their sources of funding, time taken to mobilise additional capital, cost of external supervision and audit, and investment options
The results of the investigation into the experience of the MFIs interviewed with respect to
sources of funding, time taken to mobilise additional capital, cost of external supervision
and audit, and activities in which they invest most of their resources are presented in Tables
8.12, 8.13, 8.14, 8.15 and 8.16. The MFIs interviewed obtain funding from shares, retained
earnings, grant, savings and loans. The importance of each of these types of funds depends
on the institutional type and can be affected by financial regulation. Most of the MFIs
(67.7%) reported that shares are their most important source of funding, followed by
savings and, more specifically, members’ savings. As argued in sub-section 8.6.2, MFIs
which were not legally allowed to mobilise savings report that their sources of funding have
been affected by financial regulation.
As far as institutions that depend significantly on savings are concerned, if they are not
legally allowed to mobilise savings for intermediation, financial regulation affects the flow
of funds to such institutions and therefore could affect their sustainability and outreach. In
this study it has not been possible to capture empirically the extent to which sustainability
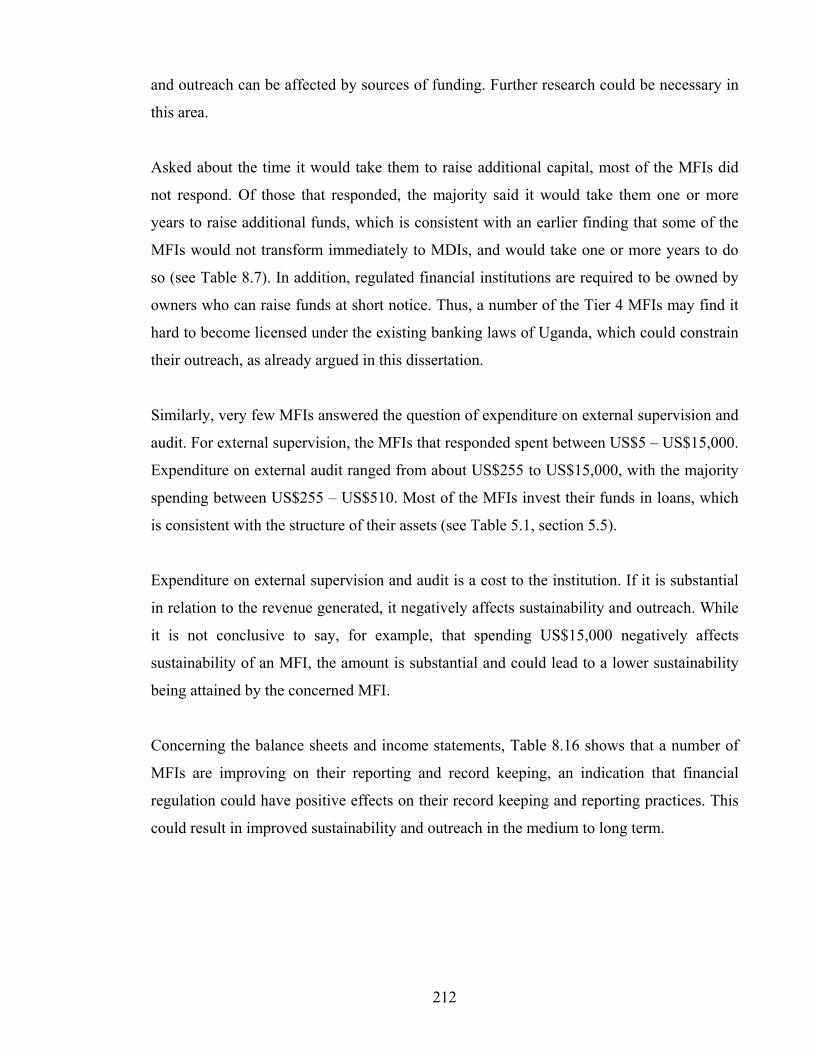
212
and outreach can be affected by sources of funding. Further research could be necessary in
this area.
Asked about the time it would take them to raise additional capital, most of the MFIs did
not respond. Of those that responded, the majority said it would take them one or more
years to raise additional funds, which is consistent with an earlier finding that some of the
MFIs would not transform immediately to MDIs, and would take one or more years to do
so (see Table 8.7). In addition, regulated financial institutions are required to be owned by
owners who can raise funds at short notice. Thus, a number of the Tier 4 MFIs may find it
hard to become licensed under the existing banking laws of Uganda, which could constrain
their outreach, as already argued in this dissertation.
Similarly, very few MFIs answered the question of expenditure on external supervision and
audit. For external supervision, the MFIs that responded spent between US$5 – US$15,000.
Expenditure on external audit ranged from about US$255 to US$15,000, with the majority
spending between US$255 – US$510. Most of the MFIs invest their funds in loans, which
is consistent with the structure of their assets (see Table 5.1, section 5.5).
Expenditure on external supervision and audit is a cost to the institution. If it is substantial
in relation to the revenue generated, it negatively affects sustainability and outreach. While
it is not conclusive to say, for example, that spending US$15,000 negatively affects
sustainability of an MFI, the amount is substantial and could lead to a lower sustainability
being attained by the concerned MFI.
Concerning the balance sheets and income statements, Table 8.16 shows that a number of
MFIs are improving on their reporting and record keeping, an indication that financial
regulation could have positive effects on their record keeping and reporting practices. This
could result in improved sustainability and outreach in the medium to long term.
213
Table 8.12 Sources of funding for the MFIs by the degree of importance (n=31)
Source of funding Not important Moderately important
Important Very Important
Shares 7 (22.5%) 1 (3.2%) 2 (6.5%) 21 (67.7%)Retained earnings/Reserves
1 (3.2%) 6 (19.4% 12 (38.7%) 12 (38.7%)
Grants 3 (9.7%) 13 (41.9%) 3 (9.7%) 12 (38.7%)Member savings 8 (25.8%) 2 (6.5%) 6 (19.4%) 15 (48.4%)Public savings 12 (38.7%) 11 (35.5%) 5 (16.1%) 3 (9.7%)Loans 13 (41.9%) 3 (9.7%) 8 (25.8%) 7 (22.5%)
Table 8.13 The period the MFI would take to mobilise additional capital (n=11)
Period this MFI would take to mobilise additional capital, if requiredLess than 3 months 1-6 months 1 year or more No idea
Number of MFIs 2 2 4 3Proportion of number of MFIs (%)
18.2
18.2
36.4
27.3
Table 8.14 Annual amount paid for external supervision (n=10)
Annual amount paid for external supervision US$15,000 <US$5 <US$51-102 Not applicable
Number of MFIs 1 1 2 6Proportion of number of MFIs (%)
10
10
20
60
Table 8.15 Annual amount paid for external audit (n=16)
Annual amount paid for external audit US$15,000 <US$255 <US$255-510 <US$510-2546 US$2546-5100m
Number of MFIs 1 2 7 3 3Proportion of number of MFIs (%)
6.3
12.5
43.8
18.8
18.8
Table 8.16 Where the MFIs invest their funds and the state of record keeping and
financial statements (n = 31)
Areas of focus Responses and number of MFIs responding Investment options for Tier 4 MFIs • Mainly loans - 27 (87.1%)
• Fixed deposits - 2 (6.5%) Comment on the balance sheets and income statements prepared by the MFIs compared to those required by the Bank of Uganda
• Major difference - 5 (16.1%) • Minor difference –2 (6.5%) • MFIs transforming financial statements to
comply with those required by the Bank of Uganda.-14 (45.2%)
• MFIs using Performance Monitoring Tools (PMT) - 4 (12.9%)
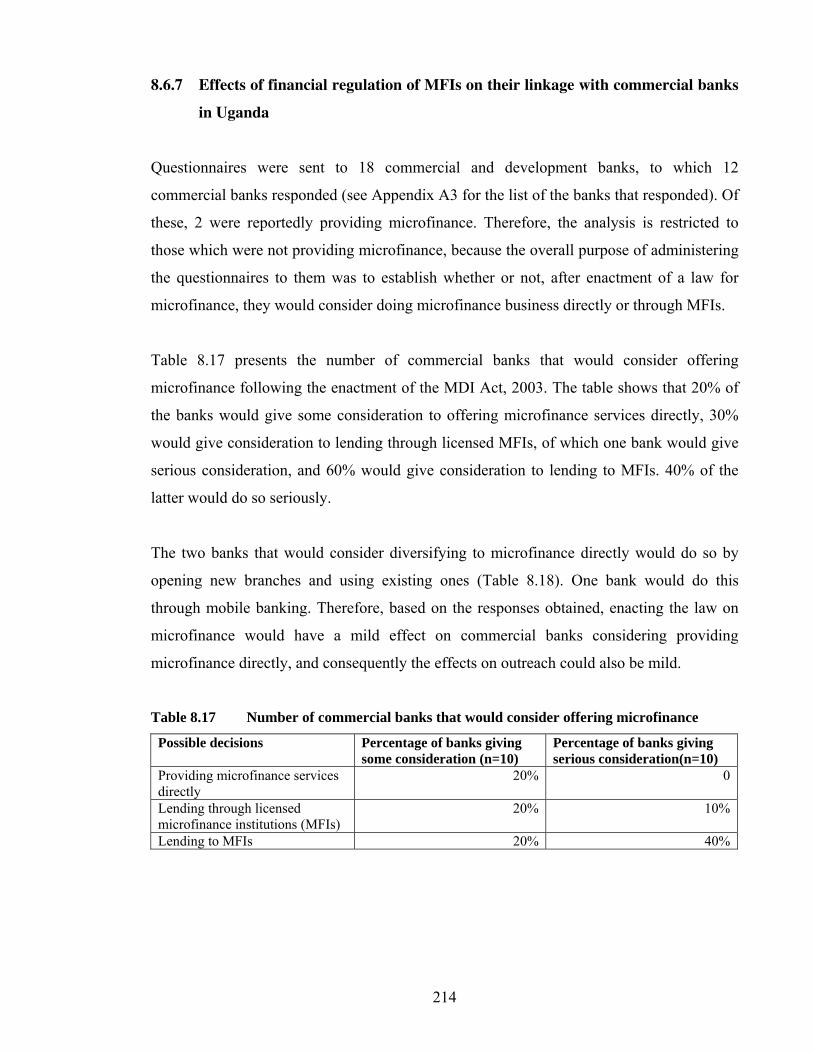
214
8.6.7 Effects of financial regulation of MFIs on their linkage with commercial banks
in Uganda
Questionnaires were sent to 18 commercial and development banks, to which 12
commercial banks responded (see Appendix A3 for the list of the banks that responded). Of
these, 2 were reportedly providing microfinance. Therefore, the analysis is restricted to
those which were not providing microfinance, because the overall purpose of administering
the questionnaires to them was to establish whether or not, after enactment of a law for
microfinance, they would consider doing microfinance business directly or through MFIs.
Table 8.17 presents the number of commercial banks that would consider offering
microfinance following the enactment of the MDI Act, 2003. The table shows that 20% of
the banks would give some consideration to offering microfinance services directly, 30%
would give consideration to lending through licensed MFIs, of which one bank would give
serious consideration, and 60% would give consideration to lending to MFIs. 40% of the
latter would do so seriously.
The two banks that would consider diversifying to microfinance directly would do so by
opening new branches and using existing ones (Table 8.18). One bank would do this
through mobile banking. Therefore, based on the responses obtained, enacting the law on
microfinance would have a mild effect on commercial banks considering providing
microfinance directly, and consequently the effects on outreach could also be mild.
Table 8.17 Number of commercial banks that would consider offering microfinance
Possible decisions Percentage of banks giving some consideration (n=10)
Percentage of banks giving serious consideration(n=10)
Providing microfinance services directly
20% 0
Lending through licensed microfinance institutions (MFIs)
20% 10%
Lending to MFIs 20% 40%
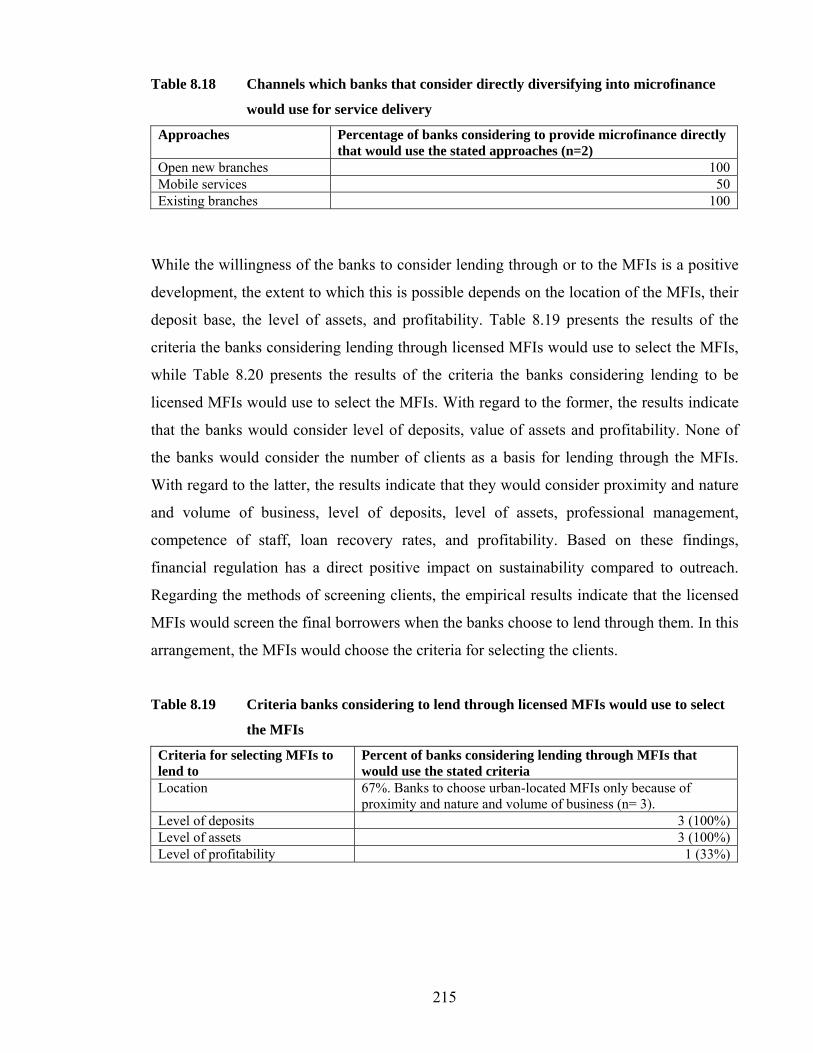
215
Table 8.18 Channels which banks that consider directly diversifying into microfinance
would use for service delivery
Approaches Percentage of banks considering to provide microfinance directly that would use the stated approaches (n=2)
Open new branches 100Mobile services 50Existing branches 100
While the willingness of the banks to consider lending through or to the MFIs is a positive
development, the extent to which this is possible depends on the location of the MFIs, their
deposit base, the level of assets, and profitability. Table 8.19 presents the results of the
criteria the banks considering lending through licensed MFIs would use to select the MFIs,
while Table 8.20 presents the results of the criteria the banks considering lending to be
licensed MFIs would use to select the MFIs. With regard to the former, the results indicate
that the banks would consider level of deposits, value of assets and profitability. None of
the banks would consider the number of clients as a basis for lending through the MFIs.
With regard to the latter, the results indicate that they would consider proximity and nature
and volume of business, level of deposits, level of assets, professional management,
competence of staff, loan recovery rates, and profitability. Based on these findings,
financial regulation has a direct positive impact on sustainability compared to outreach.
Regarding the methods of screening clients, the empirical results indicate that the licensed
MFIs would screen the final borrowers when the banks choose to lend through them. In this
arrangement, the MFIs would choose the criteria for selecting the clients.
Table 8.19 Criteria banks considering to lend through licensed MFIs would use to select
the MFIs
Criteria for selecting MFIs to lend to
Percent of banks considering lending through MFIs that would use the stated criteria
Location 67%. Banks to choose urban-located MFIs only because of proximity and nature and volume of business (n= 3).
Level of deposits 3 (100%)Level of assets 3 (100%)Level of profitability 1 (33%)
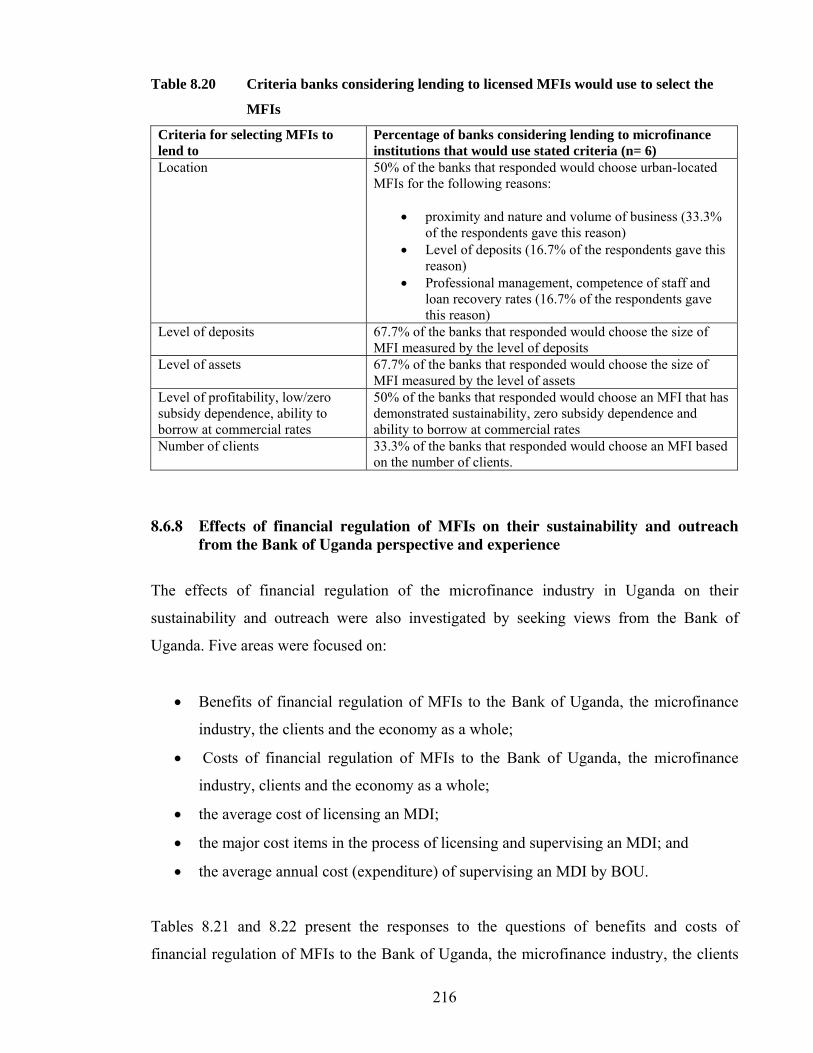
216
Table 8.20 Criteria banks considering lending to licensed MFIs would use to select the
MFIs
Criteria for selecting MFIs to lend to
Percentage of banks considering lending to microfinance institutions that would use stated criteria (n= 6)
Location 50% of the banks that responded would choose urban-located MFIs for the following reasons:
• proximity and nature and volume of business (33.3% of the respondents gave this reason)
• Level of deposits (16.7% of the respondents gave this reason)
• Professional management, competence of staff and loan recovery rates (16.7% of the respondents gave this reason)
Level of deposits 67.7% of the banks that responded would choose the size of MFI measured by the level of deposits
Level of assets 67.7% of the banks that responded would choose the size of MFI measured by the level of assets
Level of profitability, low/zero subsidy dependence, ability to borrow at commercial rates
50% of the banks that responded would choose an MFI that has demonstrated sustainability, zero subsidy dependence and ability to borrow at commercial rates
Number of clients 33.3% of the banks that responded would choose an MFI based on the number of clients.
8.6.8 Effects of financial regulation of MFIs on their sustainability and outreach from the Bank of Uganda perspective and experience
The effects of financial regulation of the microfinance industry in Uganda on their
sustainability and outreach were also investigated by seeking views from the Bank of
Uganda. Five areas were focused on:
• Benefits of financial regulation of MFIs to the Bank of Uganda, the microfinance
industry, the clients and the economy as a whole;
• Costs of financial regulation of MFIs to the Bank of Uganda, the microfinance
industry, clients and the economy as a whole;
• the average cost of licensing an MDI;
• the major cost items in the process of licensing and supervising an MDI; and
• the average annual cost (expenditure) of supervising an MDI by BOU.
Tables 8.21 and 8.22 present the responses to the questions of benefits and costs of
financial regulation of MFIs to the Bank of Uganda, the microfinance industry, the clients
217
and the economy as a whole. As the responses show, from the BOU perspective financial
regulation of MFIs has significant benefits for the BOU, the microfinance industry, the
clients and the economy as a whole. However, the Bank of Uganda was not sure whether
financial regulation of MFIs would lead to reduced lending rates. Regarding compliance
costs, the Bank of Uganda thinks these could sometimes be major.
It is difficult to project average cost of licensing an MDI, but it involves undertaking many
inspection visits that cost money and, therefore, licensing any extra institution is a cost. As
to whether the cost far outweighs the benefits, this is difficult to establish. According to
BOU, an average time taken to grant an MDI or any other financial institution a licence is
12 months. During this time a lot of activities are undertaken and these activities require
substantial resources (Ledgerwood and White, 2006).
The major cost items in the process of licensing and supervising a financial institution
include: inspection, e.g. vehicle maintenance, allowances for inspectors and drivers,
emergency verifications, analysis of returns and communication. For example, the MDI
Act, 2003 requires the BOU to publish every year the number of MDIs licensed and
operating. In 2005 the BOU budgeted for US$3,000 to meet the cost of MDI-related
publications. This was half the budget for commercial banks, which are 15 in number (see
discussions in sub-section 6.3.3.1 in Chapter Six).
The costs reported above exclude salary, other allowances, etc. that are directly or
indirectly incurred in maintaining and developing staff involved in supervision. For
example, on average, it takes up to 30 days for an on-site supervision of an MDI to be
completed. With average size of an on-site supervision team of an MDI reported to be 3,
the amount required to maintain field staff while on on-site supervision can be substantial.
Additional cost of financial regulation is related to training. Besides resources provided by
donors, BOU budgeted US$15,000 for 2005 for the MDI Division for training staff.
Divided by four MDIs, this is US$3,750 per MDI.
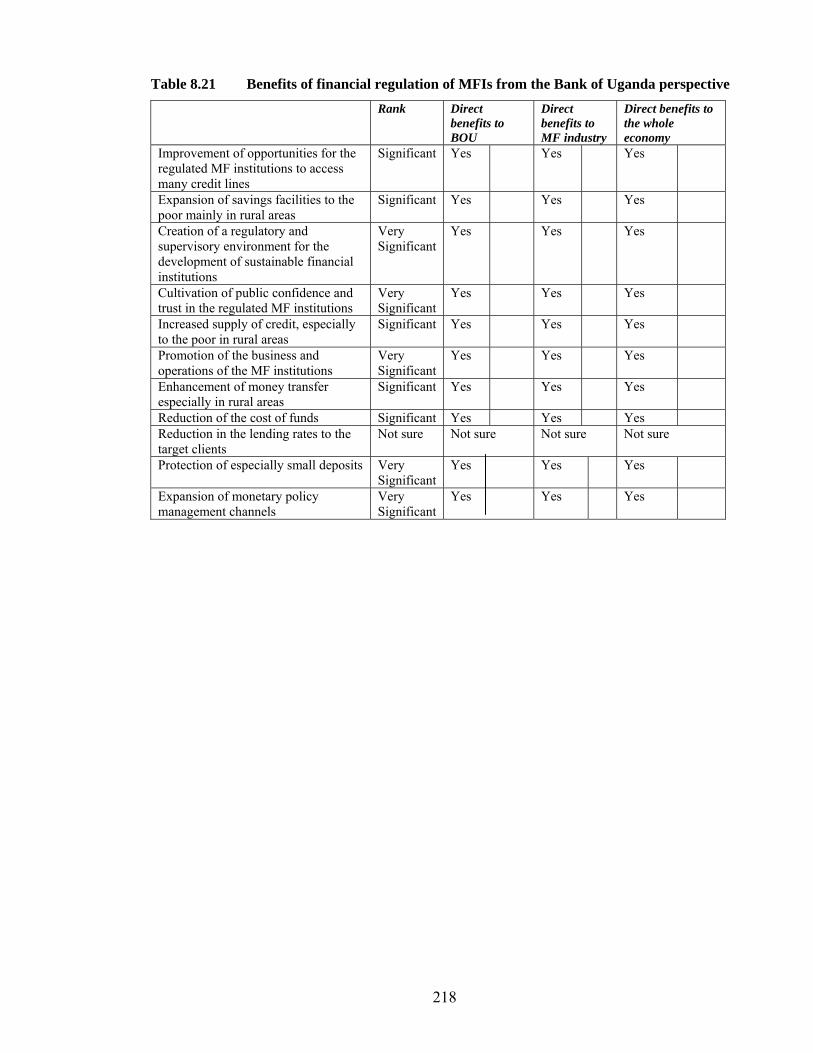
218
Table 8.21 Benefits of financial regulation of MFIs from the Bank of Uganda perspective
Rank Direct benefits to BOU
Direct benefits to MF industry
Direct benefits to the whole economy
Improvement of opportunities for the regulated MF institutions to access many credit lines
Significant Yes Yes Yes
Expansion of savings facilities to the poor mainly in rural areas
Significant Yes Yes Yes
Creation of a regulatory and supervisory environment for the development of sustainable financial institutions
Very Significant
Yes Yes Yes
Cultivation of public confidence and trust in the regulated MF institutions
Very Significant
Yes Yes Yes
Increased supply of credit, especially to the poor in rural areas
Significant Yes Yes Yes
Promotion of the business and operations of the MF institutions
Very Significant
Yes Yes Yes
Enhancement of money transfer especially in rural areas
Significant Yes Yes Yes
Reduction of the cost of funds Significant Yes Yes Yes Reduction in the lending rates to the target clients
Not sure Not sure Not sure Not sure
Protection of especially small deposits Very Significant
Yes Yes Yes
Expansion of monetary policy management channels
Very Significant
Yes Yes Yes

219
Table 8.22 Costs of financial regulation of MFIs from the Bank of Uganda perspective Rank Direct of
costs to BOU
Direct of costs to MF industry
Direct of costs to the whole economy
Limited opportunities to access donor funds by the MFIs
Not cost (NC)
No No No
Limited number of formal financial institutions
NC No No No
Limited savings facilities to the poor, mainly in rural areas
NC No No No
Loss of public confidence and trust in the financial system for institutional failure
NC No No No
Limited opportunities for money transfer in rural areas
NC No No No
Prevalence of use of cash in effecting payments will continue
NC No No No
More compensation for deposits for any institutional failure
NC No No No
Stifling innovative approaches to the microfinance industry
NC No No No
Compliance cost by the regulated MFIs
Can be major No Yes Yes
Increased cost of funds NC No No No High cost of supervision Can be major Yes Yes Yes Increased expenditure on recruiting supervisors, training and retaining them by the BOU
Major Yes No No
Limited monetary policy management channels
NC No No No
Reduced supply of credit, more so to the poor in rural areas
NC No No No
8.7 Summary and conclusion In this chapter the empirical results of the estimated models, namely sustainability and
outreach, as well as the survey results of the effects of financial regulation of MFIs on their
sustainability and outreach, have been presented and discussed.
The results indicate that OSS is driven by GOLP, AVLZ, RELRD, CLD, AGE and DDMg,
statistically significant at 1%, 5% and 10%. Based on statistical significance, AVLZ,
RELRD, and CLD are highly important determinants. Based on the contribution to the
proportional change in the variations in OSS, DDMg is the most important determinant of
OSS. This implies that for MFIs to improve their OSS, they must emphasise the identified
determinants starting with DDMg.
220
OUTR is driven by GOLP, GINDEX, AVLZ, CLD, WL, AGE and SACCO, statistically
significant at 1%, 5% and 10%. Based on the contribution to the proportional change in
OUTR, SACCO is the most important determinant of OUTR. The findings suggest that for
OUTR to be improved, an MFI being a SACCOs is an important factor.
The immediate effects of financial regulation of MFIs are that some MFIs have changed
their legal status, restructured the entire range of services offered, or closed down. These
changes appear to have had negative effects on outreach, but would improve sustainability.
The majority of the MFIs that responded indicated that nearly all the provisions under the
MDI Act, 2003 would affect their decision to become MDIs. The provisions considered
crucial are the minimum capital requirement and capital adequacy, ownership, record
keeping, reporting and penalties.
Regarding the effects of financial regulation on selected indicators of their sustainability
and outreach, the four BOU-regulated MFIs surveyed in a follow-up study reported that
their borrowing rates had declined, but lending rates remained unchanged. The cost of
operations, profitability, savings mobilisation, economic activities financed, sources of
funding, branch network/agencies, more services and innovations, public confidence and
trust in the MFI, and operational policies had also improved. These results suggest that
financial regulation has had positive effects on the sustainability and outreach of MFIs.
The findings indicate that only a few commercial banks are willing to work with the
regulated MFIs, which implies that financial regulation of MFIs may not improve the
linkage between BOU regulated MFIs and commercial banks.
From the BOU perspective, financial regulation of MFIs has significant benefits for the
BOU, the MFIs, the microfinance industry, the clients and the economy as a whole.
However, the BOU was not sure whether financial regulation of MFIs would lead to lower
lending rates. Regarding compliance costs, the BOU thinks these could sometimes be a
major factor. Besides, BOU cites licensing and supervision costs as the major cost item.
221
CHAPTER NINE: SUMMARY OF FINDINGS AND POLICY
RECOMMENDATIONS
9.2 Introduction
This study was motivated by the desire to investigate and establish the determinants of
sustainability and outreach, and the effects of financial regulation on MFIs’ sustainability
and outreach. Microfinance has become a major policy tool for promoting access to
financial services, poverty alleviation and financial systems development. As a result, a
clear understanding of the determinants of sustainability and outreach, and the effects of
financial regulation on MFIs’ sustainability and outreach is important for institution
building and public policy formulation and implementation in order to promote access to
financial services for the majority of low-income earners on a sustainable basis and in a
safe and secure environment. Thus, this study is timely.
After identification of the research problem, the next step in the study was a survey of
literature in four main areas: i) the definitions and measures of sustainability and outreach;
ii) the determinants of sustainability and outreach; iii) a well grounded theoretical basis for
estimating sustainability and outreach models; and iv) the effects of financial regulation of
MFIs on their sustainability and outreach. To put the study into context, Uganda’s
economic and policy environment, with an emphasis on the recent developments in the
economic front, were presented and discussed.
Following Brinkerhoff and Goldsmith (1992) and Mog (2004), sustainability is a question
of self-reliance in the medium to long term without subsidies, and the measure of
sustainability preferred in the study is operational self-sufficiency.
The less restrictive definition of outreach adopted in this study is the extent to which formal
financial services are accessible to the low-income earners and the preferred measure of
outreach is the scale (number of clients served in a defined period).
To provide a background to the analysis of the effects of regulation of MFIs on their
sustainability and outreach, regulation is defined as a set of enforceable rules that restrict or
222
direct the actions of market participants and, as a result, alter the outcomes of those actions.
These rules are binding on the entities and individuals involved. Financial regulation is
defined as a body of principles, rules, standards and compliance procedures that apply and
govern commercial behaviour in the financial system.
Two regression models were estimated using data collected on 53 MFIs in Uganda:
sustainability and outreach. Following the results of Hausman’s tests, a random-effects
model was estimated for sustainability and a fixed-effects model was estimated for
outreach.
The potential and actual effects of financial regulation of MFIs on their sustainability and
outreach were assessed in two ways. First, a dummy variable to capture the effects of
deposit taking was included both in the sustainability and outreach models. The sign of this
dummy variable and its statistical level of significance were examined. Second, survey data
were collected from four distinct groups of respondents: 31 Tier 4 MFIs, four Bank of
Uganda-regulated MFIs, 12 commercial banks, and the Bank of Uganda, and analysed to
determine the effects of financial regulation of MFIs on their sustainability and outreach.
Licensing requirements and CAMEL were used as a basis for evaluation of the effects.
This chapter is intended to summarise the major findings of the study and derive policy
implications to provide an informed contribution into the process of public and institutional
development policy formulation in Uganda and other developing countries.
9.3 Summary of Findings
9.2.1 Uses of funds
The econometric results in this study show that uses of funds are (both statistically and in
terms of the level of contribution to the changes in OSS and OUTR) a more important
determinant of sustainability and outreach than sources of funds. The use of funds
negatively affects OSS, but positively affects OUTR.
223
9.2.2 Governance
The econometric results show that the level of effective governance is a key determinant in
outreach but not in OSS, although the level of effectiveness of governance positively
affects both sustainability and outreach.
9.2.3 Average loan size
Empirical evidence from this study shows that average loan size is negatively related to
both sustainability and outreach and also statistically significant in both models. That is, the
smaller the loan size the more clients an MFI can serve, and disbursing small loans is not
inconsistent with sustainability.
9.2.4 Real effective lending interest rates
Consistent with the widely held view and empirical findings from other studies, real
effective lending rate is a statistically significant determinant of sustainability. It is,
however, not a significant determinant of outreach.
9.2.5 Unit cost of loans disbursed
Unit cost of loans disbursed negatively affects sustainability and outreach, and is
statistically significant. This is consistent with the findings of the recent study by the World
Bank (2007:32) which found high cost of doing business as one of the major constraints to
economic growth in Uganda.
9.2.6 Delivery mechanisms
Compared to individual-based lending methodology, the group-based delivery method is
negatively and statistically significant in the sustainability model.
224
9.2.7 Salaries/Wages
The results of this study indicate that average salaries/wages paid to MFI staff in relation to
the national per capita income positively and significantly affects outreach, but negatively
related to sustainability and not statistically significant.
9.2.8 Institutional types
The results of this study indicate that compared to private companies, no institutional type
is statistically significant in the OSS model and their contributions to the variations in OSS
are also negligible. In the OUTR model, compared to COMP, SACCOs are both
statistically significant and their contribution to the variations in OUTR is very important.
MDIs, meanwhile, are also not statistically significant in the OUTR, but their contribution
(32%) to the variations in OUTR compared to COMP is important. Being a SACCO
positively affects outreach, while being an MDI negatively affects outreach.
9.2.9 Financial regulation of MFIs’ and the effects on sustainability and outreach
One major finding of this study is that the enactment of the MDI Act, 2003 has led to the
restructuring of the microfinance industry. Some of the MFIs have changed their legal
status and restructured their products and operations, while others have closed down.
While the findings are not conclusive with regard to the overall effects of financial
regulation of the MFIs on their sustainability and outreach, in the short run outreach has
been adversely affected by the restructuring and closing down of some of the MFIs. In the
long run financial regulation of MFIs could have a positive effect on sustainability and
outreach through promoting effective governance, the safety and stability of the financial
sector, and institutional sustainability. For the regulator, financial regulation of the MFIs
has definitively increased the costs of licensing and supervision. As to whether the costs are
greater than the benefits is difficult to tell using the available information.
225
9.4 Policy recommendations
9.3.1 Uses of funds
The negative effects of GOLP on OSS imply that MFIs should ensure that, in the first
place, their non-performing loan portfolio is kept to a minimum, and second, they should
endeavour to recover all the disbursed loans, as the greater the unrecovered loan portfolio
the lower the level of sustainability. The establishment of a credit reference bureau as is
provided for under the Financial Institutions Act, 2004 and the MDI Act, 2003 is
recommended for Tier 4 MFIs. This will be important in screening potential defaulters. To
improve outreach in terms of access to loans, MFIs should put more resources into lending
and emphasize allocative efficiency with regard to the outreach objective.
9.3.2 Governance
The MFIs need to strengthen their level of governance in order to expand outreach. Since
sustainability is usually an outcome of a strong governance structure, as the MFIs
strengthen the governance structure to achieve the outreach objective, sustainability will be
achieved simultaneously. Where the MFIs lack internal capacity to improve their
governance, the government will need to design an enabling environment, such as
appropriate policies and laws, to promote effective governance in MFIs. In addition,
improving the governance of MFIs will require the government to support them (the MFIs)
in training their staff and putting in place effective governance structures as currently
proposed by the GOU in the Rural Development Strategy and Rural Financial Services
Strategy for Savings and Credit Cooperatives (SACCOs) (MOFPED, 2007).
9.3.3 Average loan size
As the statistical results indicate, the smaller the loan size the more clients an MFI can
serve, and disbursing small loans is not inconsistent with sustainability. MFIs are therefore
encouraged to increase their outreach by providing relatively small loans. However, this
will require the MFIs to have in place effective governance systems to promote efficiency.
226
9.3.4 Real effective lending interest rates
The MFIs should focus on the real effective lending rates for improved sustainability. This
recommendation calls on the GOU not only to maintain market-based interest rates
policies, but also to continue with the current strategy of keeping inflation rate low through
prudent fiscal and monetary policy management. The proposed intervention in the
microfinance industry through the supply of loans at below market lending interest rates (at
9% for agriculture-related lending and at 13% for trade and commercial-related lending), if
not carefully managed, may undermine the current flourishing microfinance industry
(MOFPED, 2007:17) and therefore, the GOU’s plan to build a sustainable financial system
for poverty reduction. On the other hand, with the current perception by the GOU that the
lending rates, especially in the microfinance industry, are high, the MFIs need to be
innovative and efficient in their operations to ensure that their pricing is competitive. The
GOU also needs to promote consumer education to empower potential clients to identify
efficient and sustainable MFIs, and negotiate for better interest rates.
9.3.5 Unit cost of loans disbursed
The policy implication in this respect is two-fold. From the MFIs side, there is a need for
prudent management, efficiency and innovation to maximize revenue inflows and minimize
costs, but within a competitive framework. From the government side, it is imperative that
appropriate policies, legal regimes and infrastructure be put in place to reduce the cost of
doing business for the MFIs. The high priority placed by the GOU in energy and
infrastructural development as well as information, communication and technology is an
important policy strategy that will benefit all the sectors of the Ugandan economy,
including the microfinance industry (MOFPED, 2007).
9.3.6 Delivery mechanisms
To improve both sustainability and outreach, the MFIs should adopt the individual-based
delivery mechanism. The contribution of the group-based delivery mechanism to the
proportional variation in OUTR is substantial, but negative compared to the individual-
227
based mechanism, which also affirms that MFIs should adopt individual-based delivery
mechanism.
9.3.7 Salaries/Wages
The policy recommendation in this case is that for the MFIs to improve outreach, paying
competitive salaries/wages is crucial as the MFIs need to attract high calibre staff who can
improve their productivity. Increased outreach comes with economies of scale, which
should improve sustainability. However, the MFIs will need to be careful in balancing
payment of competitive salaries/wages for boosting outreach, and achieving sustainability
because the findings of this study indicate that the two objectives could conflict.
9.3.8 Institutional types
Based on the findings of this study, to improve outreach, more SACCOs should be
established compared to private companies. However, it is important to emphasize that
promotion of outreach per se is not consistent with building a sustainable financial system.
Thus, as SACCOs are being promoted, the question of their sustainability needs to be given
very serious attention. The GOU will need to promote SACCOs in such a way that the
emphasis is not on providing loan funds and suppressing lending rates, but on mobilising
local resources and intermediating them on a full-cost recovery basis. External support
should target capacity enhancement to mobilise local resources for intermediation. Where
local resources are inadequate, external resources can be mobilized, but based on sound
business principles.
9.3.9 Designing a regulatory framework for microfinance institutions
The key policy recommendation in this respect is that in order to minimise the cost of
regulation both in the short and long run, it is important to conduct a cost-benefit analysis
before instituting a regulatory system by undertaking a regulatory impact assessment
similar to that proposed under the UK Government's Pensions Bill, 2004 (Taylor, 2004).
Where the cost of financial regulation exceeds its benefits, it is appropriate not to institute
regulation.
228
9.4 Other Research Areas
Drawing from some of the limitations of this study and the assumptions made, such as a
given demand for financial services in Uganda (Chapter Two), the following are
recommended areas for further research.
1. A similar study using FSS or SDI instead of OSS as the dependent variable in the
sustainability model and the depth of outreach as the dependent variable in the
outreach model.
2. A similar study with a much larger sample of MFIs and a longer time period to see
if the findings are different from those of the current study.
3. A study that explicitly factors in the demand factors as determinants of
sustainability and outreach.
4. A study conducted after five or more years following the enactment of the MDI Act,
2003 would provide a clearer picture of the effects of financial regulation of MFIs
on their sustainability and outreach.
229
REFERENCES About Microfinance, Frequently asked Questions. http://www.cgap.org/about/faq05.html
visited on 6 December, 2006. Accion International (2006), “Reflection on Accion’s 45 Years: An Interview with Carlos
Castello, Senior Vice President, International Operations.” Ventures Newsletter of Accion International. Accion International: Boston.
Accion International (2007), “Agents of Change: Microfinance in 10 Years.” Ventures
Newsletter of Accion International. Accion International: Boston. Adams, D. (1978), “Mobilizing Household Savings through Rural Financial Markets.”
Economic Development and Cultural Change 26 (3): 547-560. Adams, D. and J.D. von Pischke (1992), "Micro-Credit Programs: Déjà vu," World
Development 20 (10): 1463-1471. Adams, D. and R. Vogel (1986), “Rural Financial Markets in Low-Income Countries:
Recent Controversies and Lessons.” World Development 14 (4): 477-487. Adams, D.W., Graham, D.H. and Von Pischke, J.D. (1984), Undermining rural
development with cheap credit. Boulder, CO: Westview. Aghion, B.A. (1999), “On the design of a credit agreement with peer monitoring.” Journal
of Development Economics 60: 79-104. Aghion, B.A. and Morduch (2005), The Economics of Microfinance. MIT Press:
Cambridge, Mass: London. Almeyda, G. (2002), “Uganda Microfinance Union: A Case Study.” Research Development
Centre: Cologne University, Germany. AMFIU (2005), Regulating and Strengthening Tier 4 MFIs in Uganda, Background
Studies. AMFIU Plot 4/6 Nkrumah Road: Kampala, Uganda. Answers.com http://www.answers.com/earnings visited on 24/12/2006. Baltagi, B.H. (2005), Econometric Analysis of Panel Data. 3rd edition. John Wiley and
Sons Ltd: London. Balunywa, W. (2002), “A Critical review of the privatisation process in Uganda – 1989-
1999.” The Ugandan Banker, Journal of the Uganda Institute of Bankers 10 (2): 11-23. Uganda Institute of Bankers: Kampala, Uganda.
Bank of Uganda (1970), Banking in Uganda. Bank of Uganda: Kampala, Uganda. March. Bank of Uganda (2004), Implementing Regulations. Bank of Uganda: Kampala, Uganda.
230
Bank of Uganda (2005), “The Annual Supervisory and Regulatory Report.” Issue No. 1, Bank of Uganda: Kampala, Uganda.
Bank of Uganda (various years), “Annual and Quarterly Reports.” Bank of Uganda:
Kampala, Uganda. Bank of Uganda, (1999), “Bank of Uganda Policy on Micro-Finance Regulation.” Bank of
Uganda: Kampala, Uganda. Bannock, G., R.R. Baxter and E. Davis (1993), Dictionary of Economics. 4th edition.
Penguin Group: London. Bannock, G., R.R. Baxter and E. Davis (1998), Dictionary of Economics. 5th edition.
Penguin Group: London. Barres, I. (2006), “Financial Self-Sufficiency (FSS).” The MicroBanking Bulletin 2006,
13: 21-22. Microfinance Information Exchange Market, Inc.: Washington, DC. Bategeka, L. N, (1999), “Uganda’s Achievements and Challenges in the Financial Sector:
Whose Interest Count?” The Ugandan Banker, Journal of the Uganda Institute of Bankers 7 (4): 6-10. Uganda Institute of Bankers: Kampala, Uganda.
Batt, N. and Tang, S.-Y. (1998), “The problem of transaction costs in group-based
microlending: an institutional perspective.” World Development 26(4): 623-637. Baumol, W.J. (1959), Business Behaviour, Value and Growth. Revised edition. Harcourt,
Brace and World Inc. Macmillan: New York. Berenbach, S. and Guzman, D. (1994), “The Solidarity Group Experience Worldwide.” In
The New World of Microenterprise Finance: Building Health Financial Institutions for the Poor. M. Otero and E. Rhyne, eds: 119-139. Kumarian Press: West Hartford. Conn.
Besley, T., Coate, S. and G. Loury (1993), “Economics of Rotating Savings and Credit
Associations.” American Economic Review 83 (4): 792-810. Besley, T., Coate, S. and G. Loury (1993), “Rotating Savings and Credit Associations:
Credit Markets and Efficiency.” Review of Economic Studies 61 (4): 701-719. Bose, P. (1998), “Formal-informal sector interaction in rural credit markets.” Journal of
Development Economics 56: 265-280. Braverman, A. and J.L. Guasch (1986), "Rural Credit Markets and Institutions in
Developing Countries: Lessons for Policy Analysis from Practice and Modern Theory." World Development 14 (10-11): 1253-1265.
Brinkerhoff and Goldsmith (1992), “Promoting the sustainability of development
institutions: A framework for strategy.” World Development 20 (3): 369-383.
231
Buckley, G. (1997): “Microfinance in Africa: Is it Either the Problem or the Solution.” World Development 25 (7): 1081-1093.
Campion, A., Dunn, E. and Arbuckle Jr., G.J. (2002), Creating a Microfinance in Peru:
Accion Communitaria del Peru’s Transformation to Mabanco.” In The Commercialization of Microfinance: Balancing Business and Development. D. Drake and E. Rhyne, eds: 2-20. Kumarian Press. West Hartford.Conn.
Capital Markets Authority (2006), “Annual Report for 2005.” Capital Markets Authority:
Kampala, Uganda.
Carmichael, J. (2006), “Public Sector Governance and the Finance Sector,” The Journal of the Capital Markets Industry 10 (1): 8-11. January-March.
Carmichael, J. and M. Pomerleano (2002), Development and Regulation of Non-Bank
Financial Institutions. World Bank Publications: Washington D.C. Case, K.E. and R.C. Fair (2002), Principles of Economics. 6th edition. Prentice-Hall Inc.:
New Jersey Cella, M. (2003), “The Theory of the Firm and Property Rights.” University of Essex:
Essex. March. CGAP (1996), "Micro-credit Interest Rates." CGAP Occasional Paper No. 1. CGAP
Microfinance Program: Washington D.C. CGAP (1996), "Regulation and Supervision of Micro-finance Institutions: Stabilising a
New Financial Market.” CGAP Focus Note No. 4, CGAP Microfinance Program: Washington D.C. August.
CGAP (1996), “Financial Sustainability, Targeting the Poorest and Income Impact: Are
there Trade offs for Micro-finance Institutions.” CGAP Occasional Paper No. 5. CGAP Microfinance Program: Washington D.C. December.
CGAP (1997), “Effective Governance for Micro-finance Institutions.” CGAP Occasional
Paper No. 7. CGAP Microfinance Program: Washington D.C. March. CGAP (2004), “Annual Report for July 1, 2003 – June 30, 2004,” The World Bank:
Washington DC. CGAP in http://www.cgap.org/about/faq05.html visited on 6 December 2006. CGAP, (2000), “The Rush to Regulate: Legal Frameworks for Microfinance,” CGAP
Microfinance Program: Washington D.C. Chang, H. and C.F. Lee (1977), “Using Pooled Time-Series and Cross-Sectional Data To
Test The Firm and Time Effects in Financial Analysis.” Journal of Financial and Quantitative Analysis: 437-471. September.
232
Chaves, R. and C. Gonzalez-Vega (1994), “Principles of Regulation and Prudential Supervision and Their Relevance for Microenterprise Finance Organizations.” In The New World of Microenterprise Finance: Building Health Financial Institutions for the Poor. M. Otero and E. Rhyne, eds: 76-93. Kumarian Press, Inc.: West Harford.Conn.
Chaves, R.A. and Gonzalez-Vega, C. (1995), “Making the Leap into the Formal Financial
System: Structuring Regulation and Prudential Supervision for Micro-enterprise Finance Organisations.” GEMINI Microenterprise Development Brief 19. USAID: Washington, D.C.
Chaves, R.A. and Gonzalez-Vega, C., (1996), “Design of Successful Rural Financial
Intermediation: Evidence from Indonesia.” World Development 24(1): 65-92. Christen, R., Rhyne, E. and Vogel, R. (1995), “Maximizing the Outreach of
Microenterprise Finance: Analysis of Successful Microfinance Programs.” Program and Operations Assessment Report 10, USAID: Washington, D.C.
Christen, R.P. (1997), “Banking Services for the Poor: Managing for Financial Success.”
ACCION International: Washington, D.C. Christen, R.P., with Drake, D. (2002), “The New Reality of Microfinance.” In The
Commercialization of Microfinance: Balancing Business and Development. D. Drake and E. Rhyne, eds: 2-20. Kumarian Press. West Hartford.Conn.
Chu, M. (2006), “Microfinance: Mobilizing Markets to Fight Poverty, The Latin American
Experience.” A Paper presented at Building Broad-Based Economic Growth Seminar 47th Annual Meeting of Inter-American Development Bank. Belo Horizonte: Brazil. March.
Coase, R. H. (1937), “The Nature of the Firm.” Economica (N.S.) 4: 386-405. Conning, J. (1999), “Outreach, sustainability and leverage in monitored and peer-monitored
lending.” Journal of Development Economics 60: 51-77. Cull, R., Demirguc-Kunt, A. and Morduch, J. (2006), “Financial performance and outreach:
a global analysis of leading microbanks.” Policy Research Working Paper Series 3827. The World Bank: Washington, DC.
Cyert, R.M. and March, J.G. (1963), A Behavioural Theory of the Firm. Prentice-Hall,
Inc. Englewood Cliffs: New Jersey. Darst, G (2001), Smokestack Diplomancy: Cooperation and Conflict in East-West
Environmental Politics. Cambridge, Mass: MIT Press: Massachusetts. Dasgupta, R. and K.D. Rao (2003), “Microfinance in India: Issues, Challenges and Policy
Options.” Savings and Development Quarterly Review 2: 202-233, XXVII.
233
Data and Statistical Services website: http://dss.princeton.edu/online_help/analysis/regression_intro.htm retrieved on December 6, 2006.
De Gregorio and Guidotti (1995), “Financial development and economic growth.” World
Development 23: 433-448. Demsetz, H. (1997), “The Firm in Economic Theory: A Quiet Revolution.” American
Economic Review 2 (87): 426-429. May. Douma, S. and H. Schreuder (1998), Theory of production. 2nd edition. Prentice-Hall Inc.
Englewood Cliffs: New Jersey. Dutta, P.K. (1999), Strategies and Games: Theory and Practice. Cambridge, Mass: MIT
Press: Massachusetts. Economist Intelligence Unit (1999): “Uganda: Country Profile, 1999-2000.” The
Economist Intelligence Unit: 15 Regent Street, London. Edgcomb, E.L. and Cawley, J. (1994), “The Process of Institutional Development:
Assisting Small Enterprise Institutions Become More Effective.” In The New World of Microenterprise Finance: Building Health Financial Institutions for the Poor. M. Otero and E. Rhyne, eds: 76-93. Kumarian Press, Inc.: West Harford.Conn.
Elmore, C., T. Kautz, A. Mukherjee, A. Tudoran and B. Walls (2006), “Kinked
Expectations: How the best of kinked Demand and the Worst of Kinked Demand Challenged Classical Economics.” University of Stanford: Stanford. December.
Falkena, H.B. and D.T. Llewellyn (1999), The Economics of Banking: Target-Instrument
Approach with Special Reference to South Africa. The SA Financial Sector Forum: Rivonia.
Fama, F.E. (1980), “Agency problems and The Theory of the Firm.” Journal of Political
Economy 88: 288-307. Fernando, N.A. (2004), “Microfinance Outreach to the Poorest: A Realistic Objective?”
Asian Development Bank for the Poor. A Quarterly Newsletter of the Focal Point for Microfinance 5 (1). Asian Development Bank: Manila. March.
Fernando, N.A. and Meyer, R.L. (2002), “Finance for the Poor: ASA – The Ford Motor
Model of Microfinance.” Asian Development Bank for the Poor, A Quarterly Newsletter of the Focal Point for Microfinance 3 (2). Asian Development Bank: Manila.
Foss, N.J. (2003), “Cognition and Motivation in the Theory of the Firm: Interaction or
Never the Twain Shall Meet’?” Special issue of Journal des Economistes et des Etudes Humaines. Forthcoming. Department of Management, Politics and Philosophy, Copenhagen Business School: Copenhagen.
234
Foss, N.J., H. Lando and S. Thomsen (1998), “The Theory of the Firm.” The Department of Industrial Economics and Strategy, the Department of Finance of Copenhagen Business School and the Institute of International Business of Aarhus Business School: Copenhagen. August.
Foss, N.L. (1996), “Knowledge-based Approaches to Theory of the Firm: Some Critical
Comments.” Organization Science 7 (5) September. Institute for Operations Research and Management Sciences: Copenhagen.
Fraser, I. (2002), “The Cobb-Douglas Production Function: An Antipodean Defence.”
Economic Issues, Vol. 7 Part 1, March. Free Dictionary website: http://www.thefreedictionary.com/costs visited on 18 December,
2006. Free Dictionary website: http://www.thefreedictionary.com/moral+hazard visited on 29
January, 2007. Fry, M.J. (1995), Money, Interest and Banking in Economic Development. 2nd edition.
Johns Hopkins University Press: London. Ghatak, M. (1999), “Group lending, local information and peer selection.” Journal of
Development Economics 60: 27-50. Ghatak, M. and Guinnane, T.W. (1999), “The Economics of lending with joint liability:
theory and practice.” Journal of Development Economics 60: 195-228. Ghosh, P., Mookherjee, D. and Ray, D. (2000), “Credit Rationing in Developing Countries:
An Over of the Theory.” A Reader in Development Economics. Mookherjee, D. and Ray, D., eds. Blackwell: London.
Gillan, S.L. and Starks, L.T. (2001), “International Investors, Corporate Ownership and
Corporate Governance: Global Perspectives.” TIAA-CREF Institute, New York and Department of Finance: University of Texas.
Gillibrand, M. (2004), “New Frontiers for Corporate Governance in 2004 and Beyond.”
Corporate Journal 4(1). Gine, X. and D.S. Karlan (2006), “Group versus Individual Liability: A Field Experiment
in the Philippines.” Innovations for Poverty Action. World Bank: Washington D.C and Yale University: Texas.
Government of Uganda (1952), Money Lenders Act, 1952. Uganda Printers and Publishing
Corporation: Entebbe, Uganda. Government of Uganda (1964), Companies Act, Chapter 85, 1964. Uganda Printers and
Publishing Corporation: Entebbe, Uganda.
235
Government of Uganda (1972), Uganda Development Bank Act, 1972. Uganda Printers and Publishing Corporation: Entebbe, Uganda.
Government of Uganda (1989), Non-governmental Organisations Statute, 1989. Uganda
Printers and Publishing Corporation: Entebbe, Uganda. Government of Uganda (1991), Co-operatives Societies Statute, 1991. Uganda Printers and
Publishing Corporation: Entebbe, Uganda. Government of Uganda (1993), Bank of Uganda Statute, 1993. Uganda Printers and
Publishing Corporation: Entebbe, Uganda. Government of Uganda (2003), Micro Finance Deposit-Taking Institutions Act, 2003.
Uganda Printing and Publishing Corporation: Entebbe, Uganda. May. Government of Uganda (2004), Financial Institutions Act, 2004. Uganda Printers and
Publishing Corporation: Entebbe, Uganda. Government of Uganda (1997), The Local Governments Act, 1997. Uganda Printers and
Publishing Corporation: Entebbe, Uganda. Greene, H.W. (2003), Econometric Analysis. 5th edition. Pearson Education International.
Upper Saddle River: new Jersey. Gujarati, D. (1993), Essentials of Econometrics. 2nd edition. Irwin McGraw-Hill: Boston. Gurgand, M., Perderson, G. and Yaron, J. 1994, “Outreach and Sustainability of Six Rural
Finance Institutions in Sub-Saharan Africa.” World Bank Discussion Paper No. 248. Washington, D.C.
Hall, R.L. and C.J. Hitch (1939), “Price Theory and Business Behaviour.” Oxford
Economic Papers. University of Oxford: Oxford. Hamilton, C.L. (2004), Statistics with Stata: Updated for Version 8. Books/Cole-
Thomson, Learning: Belmont, CA. Hannig, A. and G. Bruan, (2000), "How to Regulate and Supervise Microfinance: Key
Issues." In How to Regulate and Supervise Microfinance: Key Issues in an International Perspective. Hannig, A and E. Katimbo-Mugwanya, eds. Bank of Uganda/GTZ, Financial Systems Development (FSD) Project: Kampala, Uganda
Hannig, A., P. Van Dijk and T. Schuppius (eds.) (2002), “Agricultural Finance in Uganda-
A Debate on the way forward. The Proceedings of the 5th FSD Annual Dialogue Seminar.” Bank of Uganda – GTZ, Financial Systems Development (FSD) Project: Kampala, Uganda.
Harrod, R.F. (1939), “The Maximization Debates.” Oxford Economic Papers. University
of Oxford: Oxford.
236
Havens, M., R., Henderson, J.S. and Cramer, D.L. (1966), Economics: Principles of Income, Prices and Growth. The Macmillan Company: New York.
Hawkins, C.J. (1979), The Theory of the Firm, Macmillan Studies in Economics.
Macmillan Press Ltd: London. Henderson J.M. and Quandt R.E. (1980), Microeconomic Theory: A Mathematical
Approach. 3rd edition. McGraw-Hill Book Publishing Company: New York. Hoff, K. and J. Stiglitz (1990), “Introduction: Imperfect Information and Rural Credit
Markets – Puzzles and Policy Perspectives.” The World Bank Economic Review 4 (3): 235-250: Washington, D.C.
Hoff, K. and J. Stiglitz (1993a eds.), The Economics of rural organization: Theory,
practice and policy. Oxford University Press: Oxford. Hollis, A. and A. Sweetman (1998), "Micro-credit: What Can we Learn from the Past."
World Development 26 (10): 1875-1891. Holmstrom, B.R. and J. Tirole (1989), The Handbook of Industrial Organization Vol. 1
Chapter 2. MIT Press: Massachusetts. Hulme, D. and Mosley, P., 1996. Finance Against Poverty Vol. 1. Routledge: London. ICGN (1999), “ICGN Statement on Global Corporate Governance Principles.” Adopted in
July, 1999 at Frankfurt. Intrilligator, M., R. Bodkin and C. Hsiao (1996), Econometric Models, Techniques and
Applications. 2nd edition. Prentice-Hall: North Holland. Jackson, G. (2003), “The nature of interest rates and why it’s dangerous to manipulate
them.” http://www.brookesnews.com/033007interest.html visited on July 30, 2007. Jain, S. P. (1996), “Managing credit for the rural poor.” World Development 24(1): 79-89. Jaramogi, O. P. (2002), “Financing the private sector – where are the gaps.” The Monitor
Newspaper. Monitor Publications: Kampala, Uganda. May 24. Jaramogi, O. P. (2002), “Microfinance Outreach – the current situation.” The Monitor
Newspaper. Monitor Publications: Kampala, Uganda. May 11. Jaramogi, O. P. (2002), “Why are interest rates so high – or why is microfinance not always
the answer?” The Monitor Newspaper. Monitor Publications: Kampala, Uganda. May 24.
Jaramogi, O. P. (2004), “Parastatals yet to be privatised in Uganda.” The Monitor
Newspaper. The Monitor Publications: Kampala, Uganda. September, 11
237
Jensen, M.C. (1983), “Organisation Theory and Methodology.” The Accounting Review, 58 (2) 319-339.
Jensen, M.C. and W.H. Meckling (1976), “Theory of the Firm: Managerial Behavior,
Agency Costs and Ownership Structure.” Journal of Financial Economics 3 (4): 305-360.
Jensen, M.K (2003), “On Alternative Theories of Savings.” Journal of Economic
Literature 34:647-661. April. Johnson, S. and B. Rogaly, (1997), Microfinance and Poverty Reduction. Oxfam
Development Guidelines. Oxfam and ActionAid: London Jordaan, M. (1997), “The Regulation of Deposit-Taking Financial Institutions: A
Comparative Analysis of the UK, Germany and South Africa.” A Dissertation presented for a PhD award at the University of Stellenbosch. University of Stellenbosch: Stellenbosch, South Africa.
Joskow, P.L. (2006): “Vertical Integration.” Paper prepared for the American Bar
Association Antitrust Section’s Issues in Competition Law and Policy project. Revised in December. MIT: Massachusetts.
Kalpana, K (2005): “Shifting Trajectories in Microfinance Discourse.” Economic and
Political Weekly Special Articles. December. Kasper, W. and Streit, M.E. (1998), Institutional Economics: Social Order and Public
Policy. Edward Elgar, Cheltenham. Katimbo-Mugwanya, E. (2000), "How to Regulate and Supervise Microfinance: Key
Issues." How to Regulate and Supervise Microfinance: Key Issues in an International Perspective. Hannig, A and E. Katimbo-Mugwanya, eds. Bank of Uganda - GTZ, Financial Systems Development (FSD) Project: Kampala, Uganda
Kay and Vickers (1988), “Regulatory Reform in Britain.” Economic Policy Vol. 7 October. Keller, G. and B. Warrack (2000), Statistics for Management and Economics. 5th edition.
Duxury, Thormson Learning: Pacific Grove, USA. Khan, A.H. and M. Ahmad (1985), “Real Money Balances in the Production Function of
Developing Country.” The Review of Economics and Statistics: 336-340. Kibirango, L. and L. Kasekende (1992), “Economic and Financial Sector Issues.” Uganda
Journal for Institute of Bankers: 29-33. Uganda Institute of Bankers: Kampala, Uganda.
Kiiza, B., M. Omeke and J. Mugisha (2004), “Microfinance Self-Sustainability and
Outreach in Uganda: A Case of Teso Rural Development Trust Limited.” Eastern Africa Journal of Rural Development 20 (1): 34-44.
238
Klein, B. (2002), “Meeting the Challenge: Better Practices in Agricultural Lending to the Poor.” Agricultural Finance in Uganda – a Debate on the way forward. Proceedings of the 5th FSD Annual Dialogue Seminar. FSD Series No. 9, GTZ: Kampala, Uganda.
Kohler, E.L. (1975), Dictionary for Accountants. 5th edition. Prentice-Hall Inc.,
Englewood Cliff: New Jersey. Koutsoyannis, A. (1979), Modern Microeconomics. 2nd edition. The Macmillan Press Ltd:
London. Krahnen, J.P. and R.H. Schmidt (1994), Development Finance as an Institution Building:
New Approaches to Poverty-Oriented Banking. Westview Press: Boulder and Oxford.
Lafourcade, A., Isern, J., Mwangi, P. and Brown M. (2006), “Overview of the Outreach and
Financial Performance of Microfinance Institutions in Africa.” MicroBanking Bulletin. CGAP Microfinance Program: Washington D.C. April.
Ledgerwood, J. (1999), Microfinance Handbook on Sustainable Banking with the Poor:
An Institutional and Financial Perspective. The World Bank: Washington. D.C. Ledgerwood, J. and F. Musana (eds.)(2002), “Accessing Capital by MFIs.” Proceedings
from Workshop held in Kampala, Uganda. Bank of Uganda – GTZ, Financial Systems Development (FSD) Project: Kampala, Uganda.
Ledgerwood, J. and V. White (2006), Transforming Microfinance Institutions: Providing
Full Financial Services to the Poor. The World Bank: Washington, D.C. Ledgerwood, J., D. Burand and G. Braun (2002), “The Ugandan Microfinance Industry;
Prospects for Regulation of MFIs.” The Ugandan Banker, Journal of the Uganda Institute of Bankers 10(4): 21-25. Uganda Institute of Bankers: Kampala, Uganda
Leibenstein, H. (1966), “Allocative Efficiency Vs X-Efficiency.” American Economic
Review 56 (3) 392-415. Levine, R. (2003), “Finance and Growth.” Paper Prepared for the Handbook of Economic
Growth. Carlson School of Management, University of Minnesota and NBER: Minnesota. March.
Lipsey, R.G. (1993), An Introduction to Positive Economics. 7th edition. Oxford
University Press: London. Littlefield, E., J. Morduch and S. Hashemi (2003), “Is Microfinance an Effective Strategy
to Reach the Millennium Development Goals?” CGAP: Washington DC. January. Martimort, D. and T. Verdier (2002), “From Inside the Firm to the Growth Process.”
Journal of Economic Growth 5 (4): 315-340.
239
Mas-Colell, A., M.D. Whinston and J.R. Green (1995), Microeconomic Theory. Oxford University Press: London.
Mathie, A. (2002), “Including the Excluded: Lessons learned from poverty-targeting
strategies used by microfinance providers.” Unpublished Research Report. Coady International Institute: St Francis Xavier University. February.
Maurere, J.G., Shulman, J.M., Ruwe, M.L. and Beclerer, R.C. (1995), Encyclopedia of
Business. Gale Research: Detroit. McKernan, S. (2002), “The Impact of Microcredit Programs on Self-help Employment
Profits: Do Non-credit Program Aspects Matter?” Review of Economics and Statistics 84 (1): 93-115.
Meador, J.W., H.E. Ryan (Jr.) and C.D. Schellhorn (1997), “Product Focus Versus
Diversification: Estimates of X-Efficiency for the US Life Insurance Industry.” Financial Institutions Centre, The Wharton School: University of Pennsyivania. February.
Meyer, R.L., R. Roberts and A. Mugume (2004), “Agricultural Finance in Uganda: The
Way Forward.” FSD Series No. 13, Bank of Uganda – German Technical Co-operation FSD Project: Kampala, Uganda.
Micro- and Small-scale Enterprise Policy Unit (2002), “Government is committed to
support microfinance.” Monitor Publications: Kampala, Uganda. May 24. Micro- and Small-scale Enterprise Policy Unit (2002), “Survey of Microfinance Institutions
in Uganda.” Unpublished Report. Ministry of Finance, Planning and Economic Development: Kampala, Uganda.
MicroBanking Bulletin (2001), Focus: Productivity, Issue No. 6. CGAP Microfinance
Program: Washington D.C. April. Microbanking Bulletin (2006), The Microbanking Bulletin, Issue No. 13 Microfinance
Information Exchange Market, Inc.: Washington D.C. Microfinance Information Exchange Market Inc. (2006), “Benchmarking African
Microfinance 2005.” Microfinance Information Exchange Market, Inc.: Washington D.C. November.
Microfinance Information Exchange, Inc. (2006), “2005 MIX Global 100: MFI League
Tables.” Microfinance Information Exchange Market, Inc.: Washington. D.C. Ministry of Finance, Planning and economic Development (2007), “Budget Speech
2007/08.” Ministry of Finance, Planning and Economic Development: Kampala, Uganda.
240
Ministry of Finance, Planning and economic Development (2001), “Microfinance Policy
Framework: Development of Microfinance and Delivery of Financial Services in Uganda.” Ministry of Finance, Planning and Economic Development: Kampala, Uganda.
Ministry of Finance, Planning and economic Development (2001), “Economic reforms
(Medium-Term Competitive Strategy for the Private Sector, 2000-2005): Making Institutions Support Private Sector Growth.” Government of Uganda Strategic Plan. Ministry of Finance, Planning and Economic Development: Kampala, Uganda.
Ministry of Finance, Planning and Economic Development (2001), Poverty Eradication
Action Plan. Revised edition. Government Printers: Entebbe, Uganda. Ministry of Finance, Planning and Economic Development (2006), “Census of Tier 4
Microfinance Institutions in Uganda. ” Unpublished Report. Ministry of Finance, Planning and Economic Development: Kampala, Uganda.
Ministry of Finance, Planning and Economic Development (2006), Background to the
Budget, 2006/07. Government Printers: Entebbe, Uganda. Mog, M.J. (2004), “Struggling with Sustainability – A Comparative Framework for
Evaluating Sustainable Development Programs.” World Development 32 (12): 2139-2160. December.
Mommartz, R. and Schor, G. (2002), “The Role of Specialized Investors in
Commercialization.” In The Commercialization of Microfinance: Balancing Business and Development. D. Drake and E. Rhyne eds: 75-90. Kumarian Press: West Hartford.Conn.
Mongin, P. (1997), “The Marginalist Controversy.” The Handbook of Economic
Methodology. J. Davis, W. Hands and U. Maki, eds, 558-562. Edward Elgar: London. Morduch, J. (1999), “The Microfinance Promise.” Journal of Development Literature
37(4): 1569-1614. Morduch, J. (1999): “The role of subsidies in microfinance: evidence from Grameen
Bank.” Journal of Development Economics 60:229-248. Musinguzi, P. and P. Smith (2000): “Savings and Borrowing in Rural Uganda.” Savings
and Development Quarterly Review 2: 123-137, XXIV. Navajas, S., J. Conning and R.L. Claudio Gonzalez-Vega (2003), “Lending Technologies,
Competition and Consolidation in the Microfinance Market for Microfinance in Bolivia.” Journal for International Development 15: 747-770.
241
Navajas, S., Schreiner, M., Meyer, R.L., Gonzalez-Vega, C. and Rodriguez-Mega, J. (2000), “Microfinance and the poorest of the poor: theory and evidence from Bolivia.” World Development 28(2): 333-346.
Nelson, R.R. and Winter, S.G. (1982), An Evolutionary Theory of Economic Change.
Harvard University Press: Cambridge. Ochieng, E.O. (1998), “Commercial Bank Failures: Causes and Remedies.” Uganda
Economics Association Public Lecture. International Development Consultants: Kampala, Uganda. November.
OECD Secretariat (1999), “OECD Principles of Governance.” OECD: Paris. Okumu, L.J. and H. Opondo, (2000), “The Structure, Performance and The Role Of Micro-
Financing Institutions (MFIs) In Poverty Reduction: The Case Of Uganda.” Bank of Uganda Staff Papers: Kampala, Uganda.
Opio, A., A. Kamya and M. Aomu (2003), “Interviews the author of this dissertation held
with Mr. Anthony Opio, the Director, Ms Agnes Kamya, the Deputy Director and Mr. Mackay Aomu, Senior Principal Banking Officer of Non-Bank Financial Institutions Department at the Bank of Uganda.” Bank of Uganda: Kampala, Uganda.
Osborne, J. W. (2002), “Notes on the use of data transformations.” Practical Assessment,
Research and Evaluation 8 (6). http://PAREonline.net/getvn.asp? Retrieved on January 16, 2007.
Otero, M. (1994), “The Evolution of Nongovernmental Organizations Toward Financial
Intermediation.” In The New World of Microenterprise Finance: Building Health Financial Institutions for the Poor. M. Otero and E. Rhyne, eds: 94-104. Kumarian Press, Inc.: West Hartford.Conn.
Otero, M. and Chu, M. (2002), “Governance and Ownership of Microfinance Institutions.”
In The Commercialization of Microfinance: Balancing Business and Development D. Drake and E. Rhyne, eds: 220-245. Kumarian Press, Inc.: West Hartford.Conn.
Otero, M. and Rhyne, E. (1994), “Principles and Institutions for Microenterprise Finance.”
In The New World of Microenterprise Finance: Building Health Financial Institutions for the Poor. Maria Otero and Elisabeth Rhyne, eds: 11-26. Kumarian Press, Inc.: West Hartford.Conn.
Pattern and Rosengard (1991), “Progress with profit: The development of rural banking
institutions in Indonesia.” Unpublished Report. San Francisco: International Centre for Economic growth and Harvard Institute for International Development.
Paul, Leedy and Ormrod Eliis Jeane (2005), Practical Research: Planning and Design. 8th
edition. Prentice-Hall: London.
242
Paxton, J. and C. Fruman, (1998), "Savings-First vs Credit-First Microfinance Institutions in Eight African Countries." Microfinance in Africa. S.A. Breth ed. Sasakawa Africa Association: Mexico City.
Paxton, J. Graham, D. and Thraen, C. (2000),”Modeling group-loan repayment behaviour:
new insights from Burkina Faso.” Economic Development and Cultural Change 48(3): 639-655.
PCSU (2000), “The Corporate Governance Policy Framework in Egypt: Special Study.”
USAID Coordinating and Monitoring Services Project: Cairo, Egypt. Penrose, E (1995), The Theory of the Growth of the Firm. Oxford Press: New York. Pindyck, R.S. and D.L. Rubinfeld (1998), Micro-Economics. 4th edition. Prentice-Hall:
London. Private Sector Corporate Governance Trust, Kenya (2002), “Status of Corporate
Governance in East Africa” Capital Markets Authority 5 (4): 18-20. Kampala, Uganda. September - December.
Privatization Unit (2006), “Privatization and Utility Reform Project.” A Statutory Report of
the Privatisation Unit. Privatisation Unit: Kampala, Uganda. October. Reed, L.R. and Befus, D.R. (1994), “The Transformation Lending: Helping
Microenterprises Become Small Businesses.” The New World of Microenterprise Finance: Building Health Financial Institutions for the Poor. Maria Otero and Elisabeth Rhyne eds: 185-204. Kumarian Press, Inc.: West Hartford.Conn.
Rhyne, E. (1994), “A New View of Finance Program Evaluation.” In The New World of
Microenterprise Finance: Building Health Financial Institutions for the Poor. Maria Otero and Elisabeth Rhyne eds: 105-118. Kumarian Press, Inc.: West Hartford.Conn.
Rhyne, E. (1998), “Yin and Yang of Microfinance: Reaching the Poor and Sustainability.”
The Microbanking Bulletin No.2. CGAP Microfinance Program: Washington DC. Rhyne, E. (2002), “Commercialization and Crisis in Bolivian Microfinance.” In The
Commercialization of Microfinance: Balancing Business and Development. Debora Drake and Elisabeth Rhyne, eds: 114-137. Kumarian Press Inc.: West Hartford.Conn.
Rhyne, E. and M. Otero (1992), "Financial services for microenterprise: Principles and
Institutions." World Development 20 (11): 1561-1571. Rhyne, E. and M. Otero (2006), “The Changing Face of Microfinance: Closing the Quality
Gap.” The MicroBanking Bulletin, Issue No. 13 1-7. Microfinance Information Exchange Market, Inc.: Washington. D.C.
243
Robinson, M.S. (1992a), “The Role of Savings in Local Financial Markets: The Indonesian
Experience.” GEMINI Working Paper 33. Development Alternatives: Bethesda, Md. Robinson, M.S. (1994), “Savings Mobilisation and Enterprise Finance: The Indonesian
Experience.” In The New World of Microenterprise Finance: Building Health Financial Institutions for the Poor. M. Otero and E. Rhyne, eds: 27-54. Kumarian Press, Inc.: West Hartford.Conn.
Robinson, M.S. (2001a), The Microfinance Revolution: Sustainable Finance for the
Poor. The World Bank and Open Society Institute: New York. Romer, D. (2006), “Do Firms Maximize? Evidence from Professional Football.” Journal
of Political Economy 2 (114) 340-365. April. Rose, P.S. and D.R. Fraser (1988), Financial Institutions: Understanding and Managing
Financial Services. Business Publications: Plano Tex, USA. Rothschild, K.W. (1947), “Price Theory and Oligopoly.” Economic Journal 57 (227): 299-
320. Rutherford, M. (1993): Institutions in Economics: The Old and New Institutionalism.
Historical perspectives on Modern economics. Cambridge University Press: Cambridge.
Rutherford, S. (1996), “Critical Typology of Financial Services for the Poor.” ActionAid
and Oxfam: London. Rutherford, S. (1999), “The Poor and Their Money: An essay about financial services for
poor people.” Institute of Development Policy and Management: University of Manchester.
Saltzman, S.B. and D. Salinger, (1998), "The Accion International CAMEL Technical
Note." Microenterprise Best Practices Alternatives Inc.: Bethesda. September. Samuelson, P.A. and W.D. Nordhaus (1996), Economics. 14th Edition. McGraw-Hill, Inc.:
New York. Schadwinkel, M. (2000), “Outreach and Sustainability of Microfinance in Uganda: The
Cases of CERUDEB and MED-Net.” FSD Series No. 5, Bank of Uganda – German Technical Co-operation FSD Project: Kampala, Uganda.
Schmidt, J. and N. Willardson (2004), “Banking Regulation: the focus on returns to the
consumer,” Federal Reserve Bank of Minneapolis: Minneapolis. Schoombee, G.A. (1998), “The Financial System Approach to Development Finance:
Origin, Evolution and Prospects.” Development Southern Africa 15(3): 379-398.
244
Schreiner, M. (1999), “Aspects of Outreach: A framework for the Discussion of the Social Benefits of Microfinance.” Working Paper No. 99-3. Center for Social Development, Washingston University in St. Louis.
Schreiner, M. and J. Yaron (1999), “The Subsidy Dependence Index and Recent Attempts
to Adjust it.” Savings and Development 23 (4): 375-405. Schreiner, M., Matul, M., Pawlak,. E and Kline, S. (2005), “The Power of Prizma’s Poverty
Scorecard: Lessons for Microfinance Risk Management.” 6970 Chippewa St. No. 1 W: Saint Louis, USA.
Schreiner, M. and G. Woller (2003), Microenterprise Development Programs in the United
States and in the Developing World.” World Development 31(9): 1567-1580. SEEP Network and Calmeadow (1997), Establishing A Microfinance Industry:
Governance, Best Practices and Access to Capital Markets. Craig Churchill ed. CGAP Microfinance Program: Washington D.C.
SEEP Network and Calmeadow (1995), Financial Ratio Analysis of Microfinance
Institutions. The SEEP Network Pact Publications: New York. SEEP Network and Calmeadow (2000), Learning from Clients: Assessment Tools for
Microfinance Practitioners, Draft Manual. Assessing the Impact of Microenterprise Services (AIMS) and the SEEP Network Publications: New York. January.
SEEP Network and Calmeadow (1997), “Regulation and Supervision of MFIs: experience
from Latin America, Asia and Africa.” Occasional Paper No 1. CGAP Microfinance Program: Washington D.C.
Seibel, H. D. (1996), Financial Systems Development and Microfinance: Viable
Institutions, Appropriate Strategies and Sustainable Financial Services for Microeconomy. Deutsche Gesellschaft fur Technische Zusanmenarbeit (GTZ) GmbH: Cologne.
Seibel, H. D. (2000), “Centenary Rural Development Bank: A Flagship of Rural Bank
Reform in Africa.” Development Research Centre: Cologne University, Germany. Seibel, H.D. and U. Parhusip (1998), “Attaining Outreach with Sustainability: A Case of a
Private Microfinance Institution in Indonesia.” Micro-Credit: Targeting and Sustainability. Institute of Development Studies Bulletin, Back Issues, Sussex: UK.
Sharma, M. and M. Zeller (1999), “Outreach of Group-based Credit Organizations: The
Cases of ASA, BRAC and Proshika in Bangladesh.” World Development 27 (12): 2123-2136.
Sharma, M. and M.Zeller (1997), “Repayment in Group-based Credit Programs in
Bangladesh: An Empirical Analysis.” World Development 25 (10): 1731-1742. October.
245
Shleifer, A. and Vishny, (1997), “A Survey of corporate governance.” Journal of Finance, 52(2): 737-783.
Simpson, G. (2006), “The Theoretical Foundations of Corporate Governance.” Lecture
Notes delivered in Spring 2006. 331 College of Business Administration Building. http://spears.okstate.edu/~simpson/.
Smithin, J. 2005. “The Theory of Interest Rates.” Draft Article, Department of Economics
and the Schulich School of Business: York University Toronto, Canada. August. Snijders, Tom A.B. (2005), “Fixed and Random Effects” B.S. Everitt and D.C. Howell
(eds), Encyclopedia of Statistics in Behavioural Science 2: 664-665. Wiley: Leicester.
Solow, R.M. 1997. “Growth Theory and After.” Lecture to the Memory of Alfred Nobel,
December, Retrieved from http://www.cepa.newschool.edu/het/schools/nobel.htm on 6 December, 2006.
Staschen, S. (1999), Regulation and Supervision of Microfinance Institutions: State of
Knowledge. Eschborn. GTZ: Cologne, Germany. Staschen, S. and Akampurira (2003), “Possible Mechanisms to Regulate Tier 4 MFIs in
Uganda.” Bank of Uganda – GTZ, Financial Systems Development (FSD) Project: Kampala, Uganda.
Steel, W. F., E. Aryeetey, and H. Hettige, and M. Nissanke (1997), “Informal Financial
Markets Under Liberalization in Four African Countries.” World Development 23 (5): 817-830.
Stiglitz, J and A. Weiss (1981), "Credit rationing in markets with imperfect information."
American Economic Review 71: 393-419. Stiglitz, J. (1990): “Peer Monitoring and credit markets.” World Bank Economic Review 4
(3): 351- 366. Oxford University Press: London. Strauss Commission (1996), “Final Report of the Commission of Inquiry into the Provision
of Financial Services.” A report submitted to the Honourable N.R. Mandela, the President of the Republic of South Africa. RP108/1996. ISBN 0-621-17518-8. September.
Strauss Commission (1996), “Interim Report of the Commission of Inquiry into the
Provision of Financial Services.” A report submitted to the Honourable N.R. Mandela, the President of the Republic of South Africa. RP38/1996. ISBN 0-621-26972-7. March.
Taylor, H. (2004), “Regulatory Impact Assessment.” Pensions Bill, 2004, House of Lords.
Department for Works and Pensions for the UK Government. London.
246
Theodore, L. with Loubiere, J.T. (2002), “The Experience of Microfinance Institutions with Regulation and Supervision: Perspectives from Practitioners and a Supervisor.” In The Commercialization of Microfinance: Balancing Business and Development. D. Drake and E. Rhyne, eds: 246-268. Kumarian Press: West Hartford.Conn.
Thomas, R.L. (1993), Introductory Econometrics: Theory and Applications. Longman:
London. Thompson, A.A. Jr. and Formby, J.P. (1993), Economics of the firm: Theory and
Practice. Prentice-Hall Englewood Cliffs: New Jersey. Udry, C (1990), “Credit Markets in Northern Nigeria: Credit as Insurance in a Rural
Economy.” World Bank Economic Review 4 (3): 251- 269. Oxford University Press: London.
Uganda Bureau of Statistics (2002), “Uganda Population and Housing Census.” Provisional
Results. National Census Office, Uganda Bureau of Statistics: Entebbe, Uganda. Uganda Bureau of Statistics (2003), “Micro Finance Institutions Survey Report.”
Unpublished Report. Ministry of Finance, Planning and Economic Development: Kampala, Uganda.
Uganda Bureau of Statistics (2003), “Report on the Uganda Business Register, 2001/2002.”
Uganda Bureau of Statistics: Entebbe, Uganda. Uganda Bureau of Statistics (2006), “Uganda National Household Survey 2005/06: Report
on the Socio-Economic Module.” Uganda Bureau of Statistics: Kampala, Uganda. Uganda Bureau of Statistics (Various years), “Annual Reports.” Uganda Bureau of
Statistics: Kampala, Uganda. UN Economic and Social Commission for Asia and the Pacific (2006), “Microfinance for
Poverty Reduction: Building Inclusive Financial Sectors in Asia and the Pacific.” Development Papers No. 27, UN Economic and Social Commission for Asia and the Pacific: New York.
Vaessen, J. (2001), “Accessibility of Rural Credit in Northern Nicaragua: The Importance
of networks of Information and Recommendation ” Savings and Development Quarterly Review 1: 1-31, XXV.
Valenzuela, L., (2002), “Getting the Recipe Right: The Experience and Challenges of
Commercial Bank Downscalers.” In The Commercialization of Microfinance: Balancing Business and Development. D. Drake and E. Rhyne, eds: 46-74. Kumarian Press: West Hartford.Conn.
247
Van Greuning, H. van; Gallardo, J.S.; Randhawa, Bikk K. (1999), “A Framework for
Regulating Microfinance Institutions.” World Bank Policy Research Working Paper No. 2061. The World Bank: Washington, D.C.
Van Tassel, E. (1999), “Group lending under asymmetric information.” Journal of
Development Economics 60: 3-25 Varian, H.R. (1990), Microeconomics. 2nd edition. W.W. Norton and Company, Inc.: New
York. Varian, H.R. (1992), Microeconomic Analysis. 3rd edition. W.W. Norton and Company,
Inc.: New York Varian, R. (1990), “Monitoring Agents with Other Agents.” Journal of Institutional and
Theoretical Economics 146: 153-174. Verbeek, M. (2004), A Guide to Modern Econometrics. 2nd edition. Wiley: London. Von Pischke, J.D. (1991), Finance at the Frontiers. The World Bank: Washington, D.C. Wallis, K.F. (1979), Topics in Applied Econometrics. 2nd edition. Gray-Mills: London. Web site of MIX Market, Inc. http://www.mixmarket.org. Website of Investorwordss.com: http://www.investorwords .com/1148/cost.html visited on
18 December, 2006. White, V. and Campion, A. (2002), “The Journey from NGO to Regulated MFI.” D. Drake
and E. Rhyne, eds. In The Commercialization of Microfinance: Balancing Business and Development: 22-45. Kumarian Press: West Hartford.Conn.
Wiemaier-Pfister, M. & Steinwand, D. (2003), The Challenge of Sustainable Outreach:
How can Public Banks Contribute to Outreach in Rural Areas – Five Case Studies from Asia. GTZ. Germany.
Wikipedia, The Free Encyclopedia. “Neoclassical Economics.”
http://en.wikipedia.org/wiki/Neoclassical_economics visited on 6 December, 2006 Williamson, O. E. (1963), “Managerial Discretion and Business Behaviour.” American
Economic Review 53: 1032-1057. Williamson, O. E. (1981), “The Modern Corporation; Origins, Evolution, Attributes.”
Journal of Economic Literature XIX: 1537-1568. December. Williamson, O.E. (1985), The Economic Institutions of Capitalism. University Press: New
York. Williamson, O.E. (1986), Economic Organization. University Press: New York.
248
Woller, G.M. and M. Schreiner (2006), “Poverty lending, Financial self-sufficiency and the
six Aspects of Outreach.” SEEP Network Publications: New York. Woller, G.M., C. Dunford and W. Woodworth (1999), “Where to Microfinance?”
International Journal of Economic Development 1 (1) retrieved on December 6, 2006 from http://spaef.com/IJED PUB/vlnl woller.html.
Wood, R. and N. Allen (2000), “A Review of the Privatisation History in the Country.” The
Journal for the Capital Markets Industry. Capital Markets Authority: Kampala, Uganda. March/April.
World Bank (2007), “Uganda: Moving Beyond Recovery: Investment and Behaviour
Change for Growth. Country Economic memorandum: Summary and Recommendations. The World Bank: Washington D.C.
World Bank (1990), “Uganda: Financial Sector Review.” Volume 1: Summary and
Recommendations. Draft Confidential. The World Bank: Washington D.C. World Bank (1993), Uganda: Growing Out of Poverty. The World Bank: Washington, D.C. Yaron, J. (1992), "Successful rural finance institutions," Discussion Paper No. 150, The
World Bank: Washington D.C. Yunus, M (2002), “Grameen Bank II. Designed to Open New Possibilities, Lessons Learned
Over Quarter of A Century.” October. http://www.grameen-info.org/bank/bank2.html retrieved on December 15, 2006.
Yunus, M. (2006), “Grameen Bank at a Glance.” August, 2006. http://www.grameen-
info.org/bank/gbglance.htm retrieved on December 15, 2006. Yunus, M. and A. Jolis (1999), Banker to the Poor: The Autobiography of Muhammad
Yunus, Founder of Grameen Bank. Amazon Publishers: New York. Zeller, M (1994), “Determinants of Credit Rationing: A study of Informal and Formal Credit
groups in Madagascar.” World Development 22 (12): 1895-1907. Zellner, A., J. Kmenta and J. Dreze (1966), “Specification and Estimation of Cobb-Douglas
Production Function Models.” Econometrica 34 (4): 784-795. October.
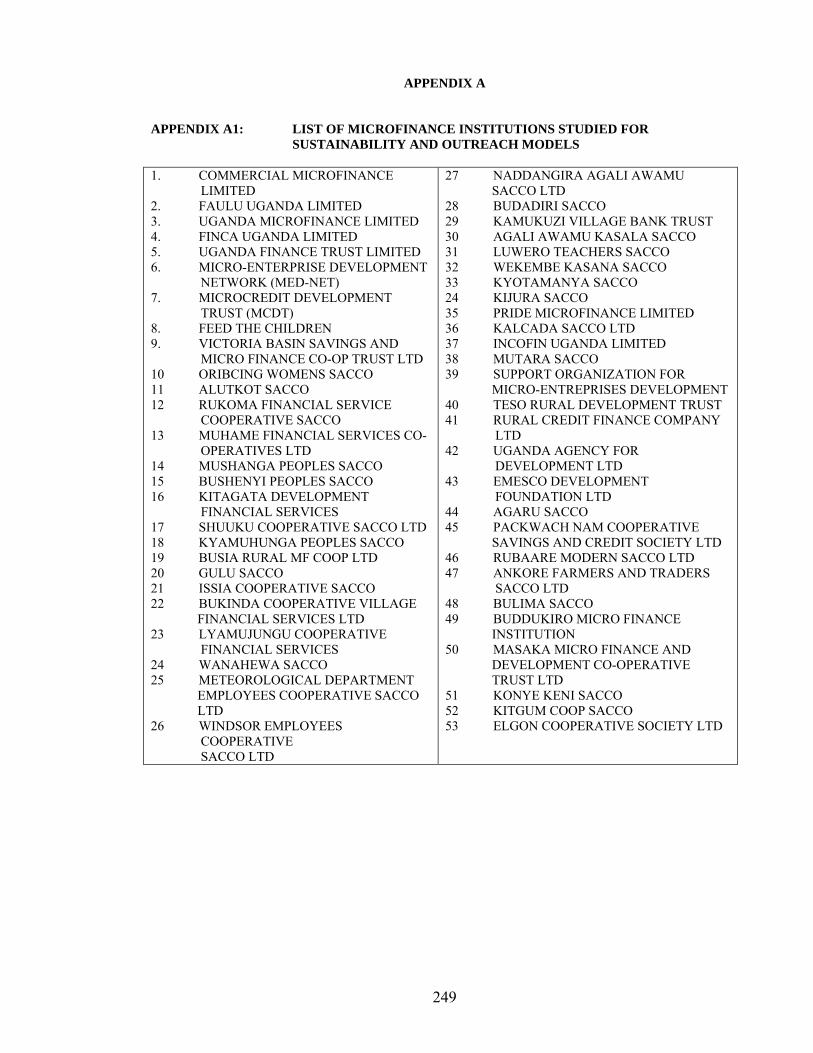
249
APPENDIX A APPENDIX A1: LIST OF MICROFINANCE INSTITUTIONS STUDIED FOR
SUSTAINABILITY AND OUTREACH MODELS 1. COMMERCIAL MICROFINANCE LIMITED 2. FAULU UGANDA LIMITED 3. UGANDA MICROFINANCE LIMITED 4. FINCA UGANDA LIMITED 5. UGANDA FINANCE TRUST LIMITED 6. MICRO-ENTERPRISE DEVELOPMENT NETWORK (MED-NET) 7. MICROCREDIT DEVELOPMENT TRUST (MCDT) 8. FEED THE CHILDREN 9. VICTORIA BASIN SAVINGS AND MICRO FINANCE CO-OP TRUST LTD 10 ORIBCING WOMENS SACCO 11 ALUTKOT SACCO 12 RUKOMA FINANCIAL SERVICE COOPERATIVE SACCO 13 MUHAME FINANCIAL SERVICES CO- OPERATIVES LTD 14 MUSHANGA PEOPLES SACCO 15 BUSHENYI PEOPLES SACCO 16 KITAGATA DEVELOPMENT FINANCIAL SERVICES 17 SHUUKU COOPERATIVE SACCO LTD 18 KYAMUHUNGA PEOPLES SACCO 19 BUSIA RURAL MF COOP LTD 20 GULU SACCO 21 ISSIA COOPERATIVE SACCO 22 BUKINDA COOPERATIVE VILLAGE FINANCIAL SERVICES LTD 23 LYAMUJUNGU COOPERATIVE FINANCIAL SERVICES 24 WANAHEWA SACCO 25 METEOROLOGICAL DEPARTMENT EMPLOYEES COOPERATIVE SACCO LTD 26 WINDSOR EMPLOYEES COOPERATIVE SACCO LTD
27 NADDANGIRA AGALI AWAMU SACCO LTD 28 BUDADIRI SACCO 29 KAMUKUZI VILLAGE BANK TRUST 30 AGALI AWAMU KASALA SACCO 31 LUWERO TEACHERS SACCO 32 WEKEMBE KASANA SACCO 33 KYOTAMANYA SACCO 24 KIJURA SACCO 35 PRIDE MICROFINANCE LIMITED 36 KALCADA SACCO LTD 37 INCOFIN UGANDA LIMITED 38 MUTARA SACCO 39 SUPPORT ORGANIZATION FOR MICRO-ENTREPRISES DEVELOPMENT 40 TESO RURAL DEVELOPMENT TRUST 41 RURAL CREDIT FINANCE COMPANY LTD 42 UGANDA AGENCY FOR DEVELOPMENT LTD 43 EMESCO DEVELOPMENT FOUNDATION LTD 44 AGARU SACCO 45 PACKWACH NAM COOPERATIVE SAVINGS AND CREDIT SOCIETY LTD 46 RUBAARE MODERN SACCO LTD 47 ANKORE FARMERS AND TRADERS SACCO LTD 48 BULIMA SACCO 49 BUDDUKIRO MICRO FINANCE INSTITUTION 50 MASAKA MICRO FINANCE AND DEVELOPMENT CO-OPERATIVE TRUST LTD 51 KONYE KENI SACCO 52 KITGUM COOP SACCO 53 ELGON COOPERATIVE SOCIETY LTD
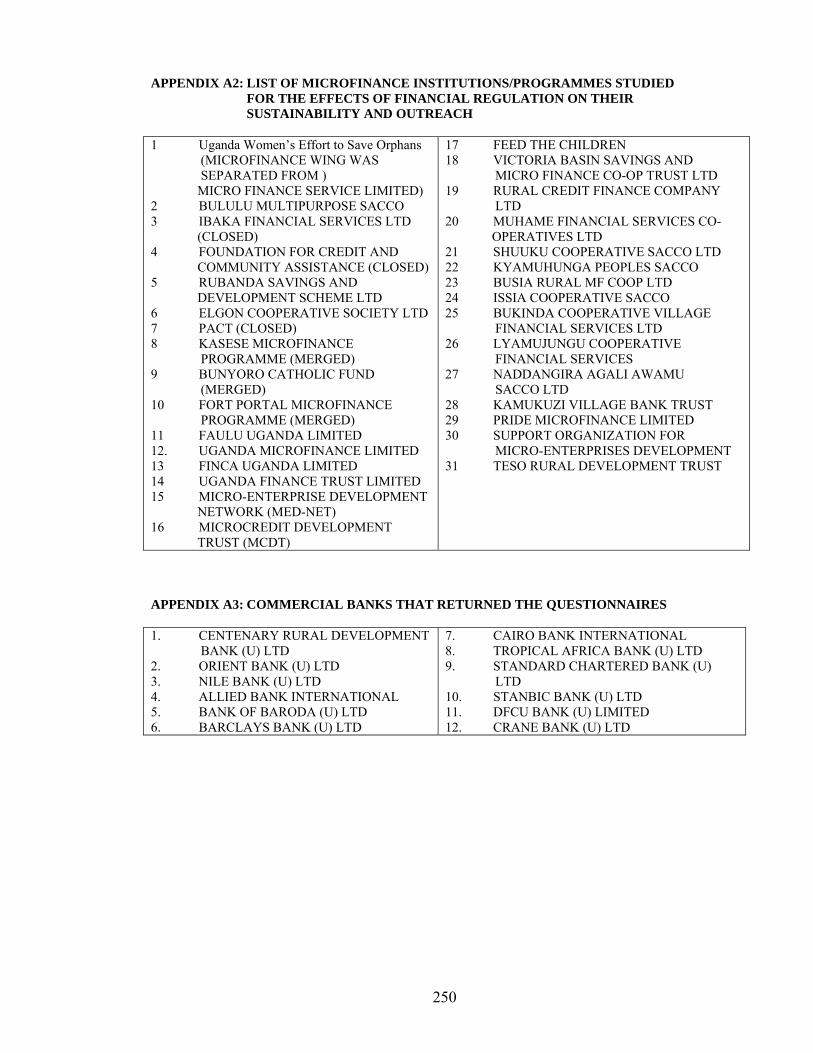
250
APPENDIX A2: LIST OF MICROFINANCE INSTITUTIONS/PROGRAMMES STUDIED FOR THE EFFECTS OF FINANCIAL REGULATION ON THEIR SUSTAINABILITY AND OUTREACH
1 Uganda Women’s Effort to Save Orphans (MICROFINANCE WING WAS SEPARATED FROM ) MICRO FINANCE SERVICE LIMITED) 2 BULULU MULTIPURPOSE SACCO 3 IBAKA FINANCIAL SERVICES LTD (CLOSED) 4 FOUNDATION FOR CREDIT AND COMMUNITY ASSISTANCE (CLOSED) 5 RUBANDA SAVINGS AND DEVELOPMENT SCHEME LTD 6 ELGON COOPERATIVE SOCIETY LTD 7 PACT (CLOSED) 8 KASESE MICROFINANCE PROGRAMME (MERGED) 9 BUNYORO CATHOLIC FUND (MERGED) 10 FORT PORTAL MICROFINANCE PROGRAMME (MERGED) 11 FAULU UGANDA LIMITED 12. UGANDA MICROFINANCE LIMITED 13 FINCA UGANDA LIMITED 14 UGANDA FINANCE TRUST LIMITED 15 MICRO-ENTERPRISE DEVELOPMENT NETWORK (MED-NET) 16 MICROCREDIT DEVELOPMENT TRUST (MCDT)
17 FEED THE CHILDREN 18 VICTORIA BASIN SAVINGS AND MICRO FINANCE CO-OP TRUST LTD 19 RURAL CREDIT FINANCE COMPANY LTD 20 MUHAME FINANCIAL SERVICES CO- OPERATIVES LTD 21 SHUUKU COOPERATIVE SACCO LTD 22 KYAMUHUNGA PEOPLES SACCO 23 BUSIA RURAL MF COOP LTD 24 ISSIA COOPERATIVE SACCO 25 BUKINDA COOPERATIVE VILLAGE FINANCIAL SERVICES LTD 26 LYAMUJUNGU COOPERATIVE FINANCIAL SERVICES 27 NADDANGIRA AGALI AWAMU SACCO LTD 28 KAMUKUZI VILLAGE BANK TRUST 29 PRIDE MICROFINANCE LIMITED 30 SUPPORT ORGANIZATION FOR MICRO-ENTERPRISES DEVELOPMENT 31 TESO RURAL DEVELOPMENT TRUST
APPENDIX A3: COMMERCIAL BANKS THAT RETURNED THE QUESTIONNAIRES 1. CENTENARY RURAL DEVELOPMENT BANK (U) LTD 2. ORIENT BANK (U) LTD 3. NILE BANK (U) LTD 4. ALLIED BANK INTERNATIONAL 5. BANK OF BARODA (U) LTD 6. BARCLAYS BANK (U) LTD
7. CAIRO BANK INTERNATIONAL 8. TROPICAL AFRICA BANK (U) LTD 9. STANDARD CHARTERED BANK (U) LTD 10. STANBIC BANK (U) LTD 11. DFCU BANK (U) LIMITED 12. CRANE BANK (U) LTD
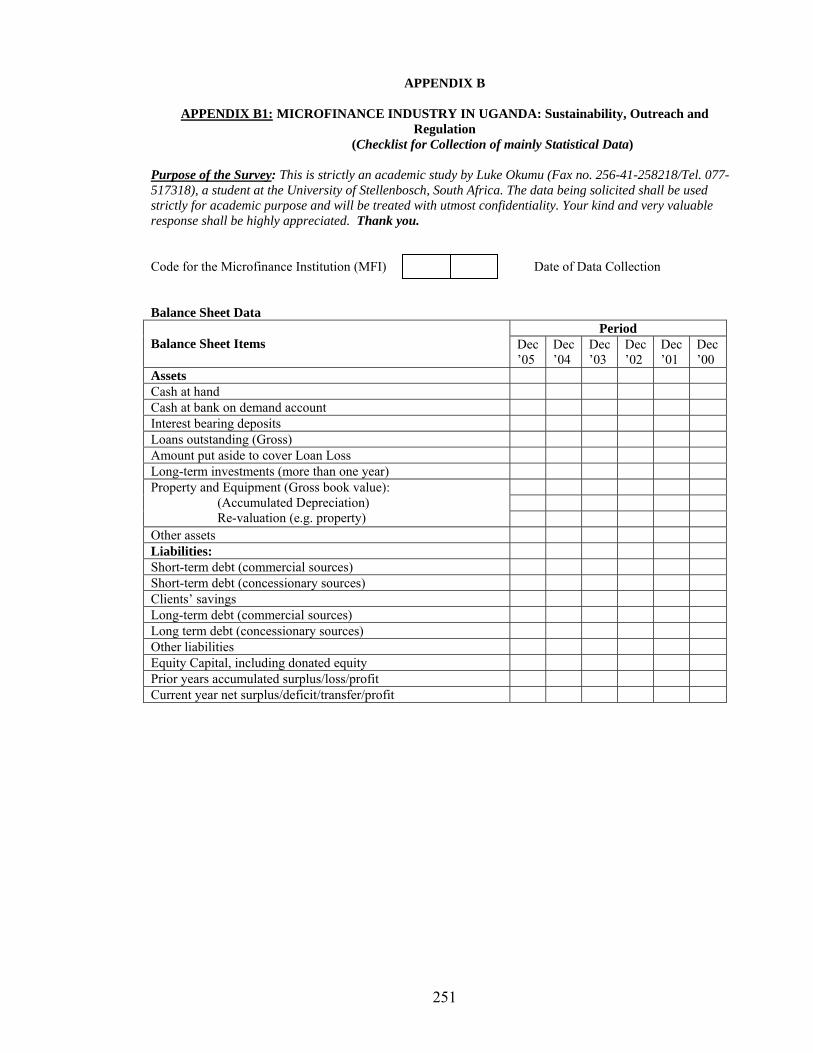
251
APPENDIX B
APPENDIX B1: MICROFINANCE INDUSTRY IN UGANDA: Sustainability, Outreach and Regulation
(Checklist for Collection of mainly Statistical Data) Purpose of the Survey: This is strictly an academic study by Luke Okumu (Fax no. 256-41-258218/Tel. 077-517318), a student at the University of Stellenbosch, South Africa. The data being solicited shall be used strictly for academic purpose and will be treated with utmost confidentiality. Your kind and very valuable response shall be highly appreciated. Thank you. Code for the Microfinance Institution (MFI) Date of Data Collection Balance Sheet Data
Period Balance Sheet Items Dec
’05 Dec’04
Dec’03
Dec’02
Dec’01
Dec’00
Assets Cash at hand Cash at bank on demand account Interest bearing deposits Loans outstanding (Gross) Amount put aside to cover Loan Loss Long-term investments (more than one year)
Property and Equipment (Gross book value): (Accumulated Depreciation) Re-valuation (e.g. property) Other assets Liabilities: Short-term debt (commercial sources) Short-term debt (concessionary sources) Clients’ savings Long-term debt (commercial sources) Long term debt (concessionary sources) Other liabilities Equity Capital, including donated equity Prior years accumulated surplus/loss/profit Current year net surplus/deficit/transfer/profit

252
Income Statement Data Period
Revenue and Expenditure items Dec’05
Dec’04
Dec’03
Dec’02
Dec’01
Dec’00
Interest received on current and past due loans, including loan prepayments
Loan related incomes received on current and past due loans Income received from investments Other operating income received Re-valuation income (from property) Interest paid on loans to the MFI Interest paid on deposits Amount put aside to cover Loan Loss Salaries and benefits Depreciation Legal and audit fees Other expenses Direct Grant Loan Portfolio Data
Period Items Dec’05
Dec’04
Dec’03
Dec’02
Dec’01
Dec’00
Value of loans disbursed during the year – Group lending
Value of loans disbursed during the year – Individual lending
Total value of loans disbursed during the year Number of loans disbursed during the year Outreach and other activities Data
Period Items Dec’05
Dec’04
Dec’03
Dec’02
Dec’01
Dec’00
Number of clients this period Number of borrowers this period Number of savers this period Number of outstanding borrowers this period Number of outstanding loans this period Average number of Loan Officers this period Average number of staff this period Dominant delivery mechanism employed this period Mission of the institution/organisation this period Please, answer Yes or No if the MFI provided the following during the period: Credit Compulsory savings Voluntary savings Money Transfer Other services (specify)
Yes/No Yes/No Yes/No Yes/No
Yes/No Yes/No Yes/No Yes/No
Yes/No Yes/No Yes/No Yes/No
Yes/No Yes/No Yes/No Yes/No
Yes/No Yes/No Yes/No Yes/No
Yes/No Yes/No Yes/No Yes/No
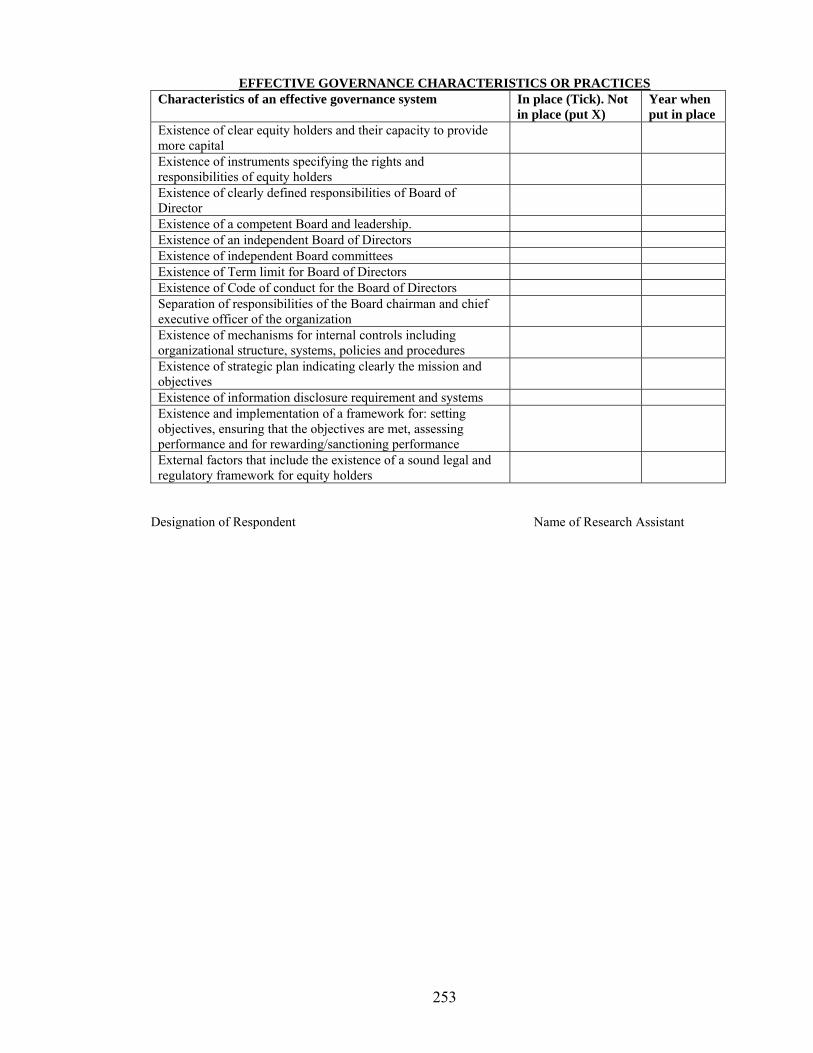
253
EFFECTIVE GOVERNANCE CHARACTERISTICS OR PRACTICES Characteristics of an effective governance system In place (Tick). Not
in place (put X) Year when put in place
Existence of clear equity holders and their capacity to provide more capital
Existence of instruments specifying the rights and responsibilities of equity holders
Existence of clearly defined responsibilities of Board of Director
Existence of a competent Board and leadership. Existence of an independent Board of Directors Existence of independent Board committees Existence of Term limit for Board of Directors Existence of Code of conduct for the Board of Directors Separation of responsibilities of the Board chairman and chief executive officer of the organization
Existence of mechanisms for internal controls including organizational structure, systems, policies and procedures
Existence of strategic plan indicating clearly the mission and objectives
Existence of information disclosure requirement and systems Existence and implementation of a framework for: setting objectives, ensuring that the objectives are met, assessing performance and for rewarding/sanctioning performance
External factors that include the existence of a sound legal and regulatory framework for equity holders
Designation of Respondent Name of Research Assistant
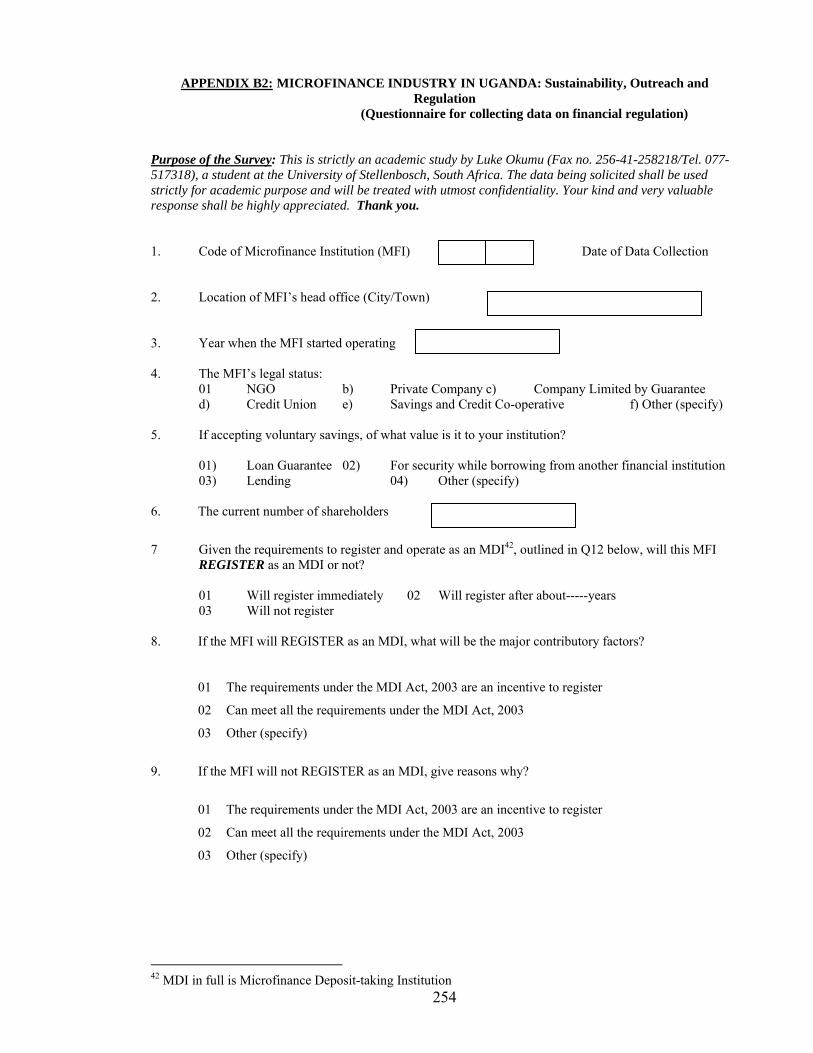
254
APPENDIX B2: MICROFINANCE INDUSTRY IN UGANDA: Sustainability, Outreach and Regulation
(Questionnaire for collecting data on financial regulation) Purpose of the Survey: This is strictly an academic study by Luke Okumu (Fax no. 256-41-258218/Tel. 077-517318), a student at the University of Stellenbosch, South Africa. The data being solicited shall be used strictly for academic purpose and will be treated with utmost confidentiality. Your kind and very valuable response shall be highly appreciated. Thank you. 1. Code of Microfinance Institution (MFI) Date of Data Collection 2. Location of MFI’s head office (City/Town) 3. Year when the MFI started operating 4. The MFI’s legal status:
01 NGO b) Private Company c) Company Limited by Guarantee d) Credit Union e) Savings and Credit Co-operative f) Other (specify)
5. If accepting voluntary savings, of what value is it to your institution?
01) Loan Guarantee 02) For security while borrowing from another financial institution 03) Lending 04) Other (specify)
6. The current number of shareholders
7 Given the requirements to register and operate as an MDI42, outlined in Q12 below, will this MFI
REGISTER as an MDI or not?
01 Will register immediately 02 Will register after about-----years 03 Will not register
8. If the MFI will REGISTER as an MDI, what will be the major contributory factors?
01 The requirements under the MDI Act, 2003 are an incentive to register
02 Can meet all the requirements under the MDI Act, 2003
03 Other (specify)
9. If the MFI will not REGISTER as an MDI, give reasons why?
01 The requirements under the MDI Act, 2003 are an incentive to register
02 Can meet all the requirements under the MDI Act, 2003
03 Other (specify)
42 MDI in full is Microfinance Deposit-taking Institution
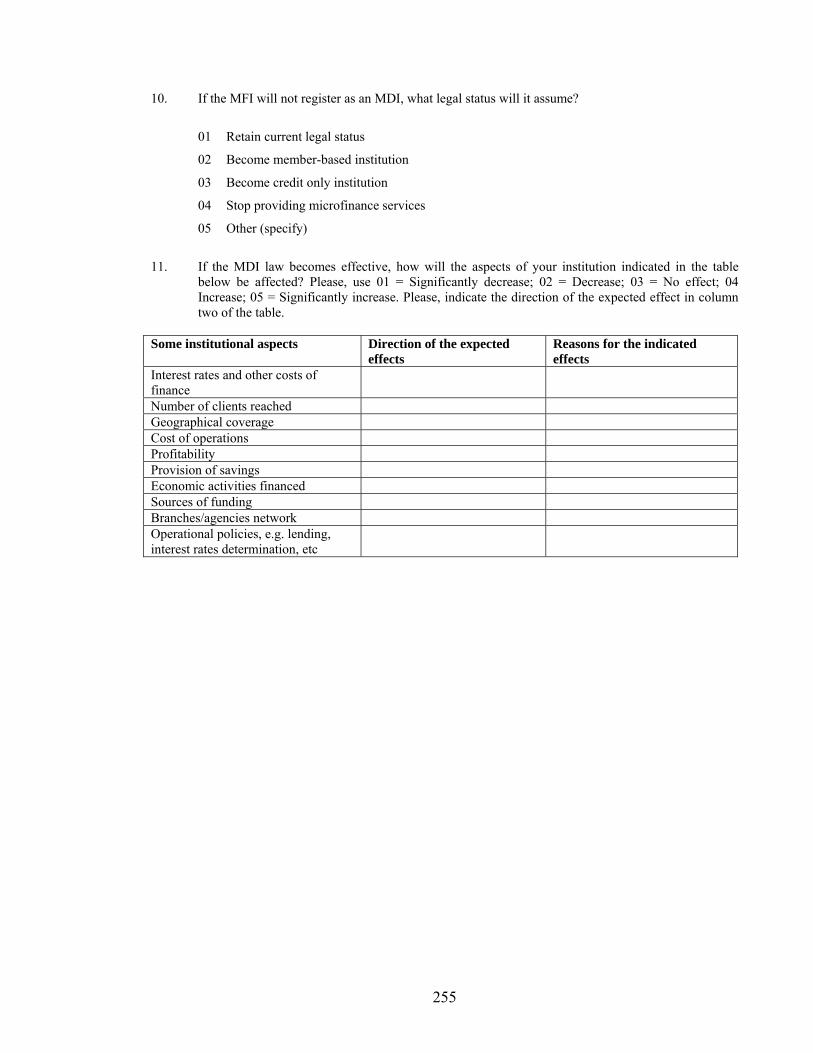
255
10. If the MFI will not register as an MDI, what legal status will it assume?
01 Retain current legal status
02 Become member-based institution
03 Become credit only institution
04 Stop providing microfinance services
05 Other (specify)
11. If the MDI law becomes effective, how will the aspects of your institution indicated in the table
below be affected? Please, use 01 = Significantly decrease; 02 = Decrease; 03 = No effect; 04 Increase; 05 = Significantly increase. Please, indicate the direction of the expected effect in column two of the table.
Some institutional aspects Direction of the expected
effects Reasons for the indicated effects
Interest rates and other costs of finance
Number of clients reached Geographical coverage Cost of operations Profitability Provision of savings Economic activities financed Sources of funding Branches/agencies network Operational policies, e.g. lending, interest rates determination, etc
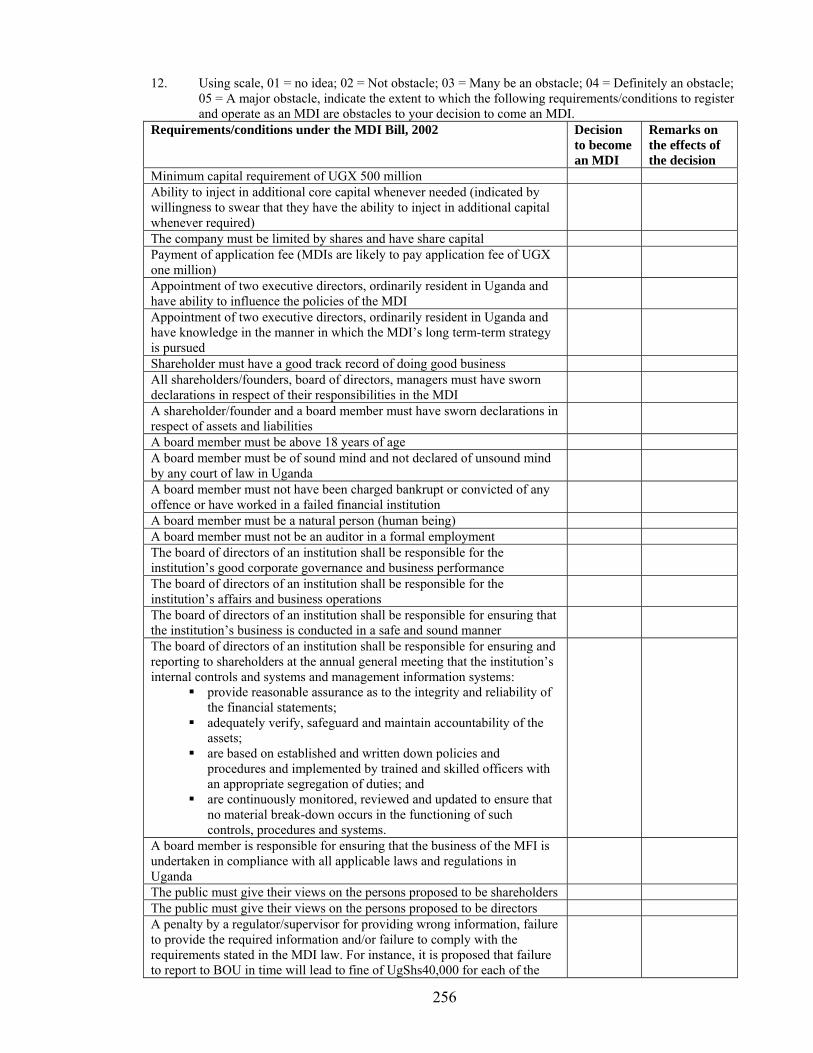
256
12. Using scale, 01 = no idea; 02 = Not obstacle; 03 = Many be an obstacle; 04 = Definitely an obstacle; 05 = A major obstacle, indicate the extent to which the following requirements/conditions to register and operate as an MDI are obstacles to your decision to come an MDI.
Requirements/conditions under the MDI Bill, 2002 Decision to become an MDI
Remarks on the effects of the decision
Minimum capital requirement of UGX 500 million Ability to inject in additional core capital whenever needed (indicated by willingness to swear that they have the ability to inject in additional capital whenever required)
The company must be limited by shares and have share capital Payment of application fee (MDIs are likely to pay application fee of UGX one million)
Appointment of two executive directors, ordinarily resident in Uganda and have ability to influence the policies of the MDI
Appointment of two executive directors, ordinarily resident in Uganda and have knowledge in the manner in which the MDI’s long term-term strategy is pursued
Shareholder must have a good track record of doing good business All shareholders/founders, board of directors, managers must have sworn declarations in respect of their responsibilities in the MDI
A shareholder/founder and a board member must have sworn declarations in respect of assets and liabilities
A board member must be above 18 years of age A board member must be of sound mind and not declared of unsound mind by any court of law in Uganda
A board member must not have been charged bankrupt or convicted of any offence or have worked in a failed financial institution
A board member must be a natural person (human being) A board member must not be an auditor in a formal employment The board of directors of an institution shall be responsible for the institution’s good corporate governance and business performance
The board of directors of an institution shall be responsible for the institution’s affairs and business operations
The board of directors of an institution shall be responsible for ensuring that the institution’s business is conducted in a safe and sound manner
The board of directors of an institution shall be responsible for ensuring and reporting to shareholders at the annual general meeting that the institution’s internal controls and systems and management information systems:
provide reasonable assurance as to the integrity and reliability of the financial statements;
adequately verify, safeguard and maintain accountability of the assets;
are based on established and written down policies and procedures and implemented by trained and skilled officers with an appropriate segregation of duties; and
are continuously monitored, reviewed and updated to ensure that no material break-down occurs in the functioning of such controls, procedures and systems.
A board member is responsible for ensuring that the business of the MFI is undertaken in compliance with all applicable laws and regulations in Uganda
The public must give their views on the persons proposed to be shareholders The public must give their views on the persons proposed to be directors A penalty by a regulator/supervisor for providing wrong information, failure to provide the required information and/or failure to comply with the requirements stated in the MDI law. For instance, it is proposed that failure to report to BOU in time will lead to fine of UgShs40,000 for each of the
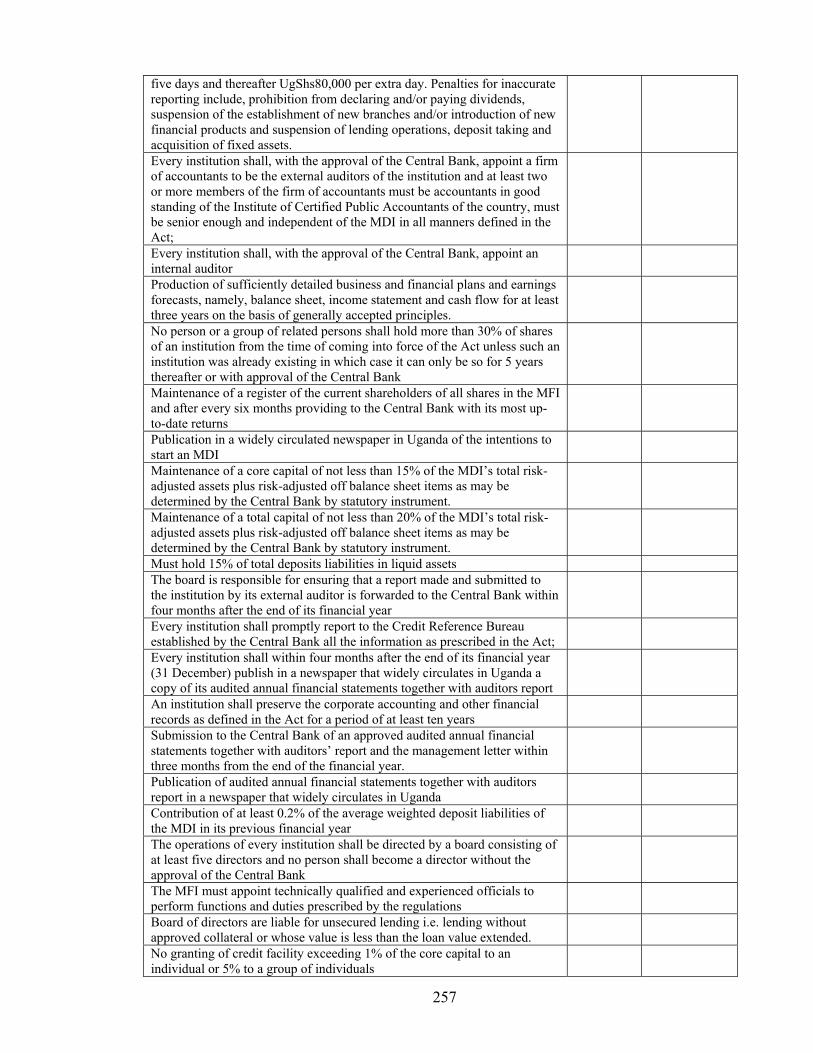
257
five days and thereafter UgShs80,000 per extra day. Penalties for inaccurate reporting include, prohibition from declaring and/or paying dividends, suspension of the establishment of new branches and/or introduction of new financial products and suspension of lending operations, deposit taking and acquisition of fixed assets. Every institution shall, with the approval of the Central Bank, appoint a firm of accountants to be the external auditors of the institution and at least two or more members of the firm of accountants must be accountants in good standing of the Institute of Certified Public Accountants of the country, must be senior enough and independent of the MDI in all manners defined in the Act;
Every institution shall, with the approval of the Central Bank, appoint an internal auditor
Production of sufficiently detailed business and financial plans and earnings forecasts, namely, balance sheet, income statement and cash flow for at least three years on the basis of generally accepted principles.
No person or a group of related persons shall hold more than 30% of shares of an institution from the time of coming into force of the Act unless such an institution was already existing in which case it can only be so for 5 years thereafter or with approval of the Central Bank
Maintenance of a register of the current shareholders of all shares in the MFI and after every six months providing to the Central Bank with its most up-to-date returns
Publication in a widely circulated newspaper in Uganda of the intentions to start an MDI
Maintenance of a core capital of not less than 15% of the MDI’s total risk-adjusted assets plus risk-adjusted off balance sheet items as may be determined by the Central Bank by statutory instrument.
Maintenance of a total capital of not less than 20% of the MDI’s total risk-adjusted assets plus risk-adjusted off balance sheet items as may be determined by the Central Bank by statutory instrument.
Must hold 15% of total deposits liabilities in liquid assets The board is responsible for ensuring that a report made and submitted to the institution by its external auditor is forwarded to the Central Bank within four months after the end of its financial year
Every institution shall promptly report to the Credit Reference Bureau established by the Central Bank all the information as prescribed in the Act;
Every institution shall within four months after the end of its financial year (31 December) publish in a newspaper that widely circulates in Uganda a copy of its audited annual financial statements together with auditors report
An institution shall preserve the corporate accounting and other financial records as defined in the Act for a period of at least ten years
Submission to the Central Bank of an approved audited annual financial statements together with auditors’ report and the management letter within three months from the end of the financial year.
Publication of audited annual financial statements together with auditors report in a newspaper that widely circulates in Uganda
Contribution of at least 0.2% of the average weighted deposit liabilities of the MDI in its previous financial year
The operations of every institution shall be directed by a board consisting of at least five directors and no person shall become a director without the approval of the Central Bank
The MFI must appoint technically qualified and experienced officials to perform functions and duties prescribed by the regulations
Board of directors are liable for unsecured lending i.e. lending without approved collateral or whose value is less than the loan value extended.
No granting of credit facility exceeding 1% of the core capital to an individual or 5% to a group of individuals
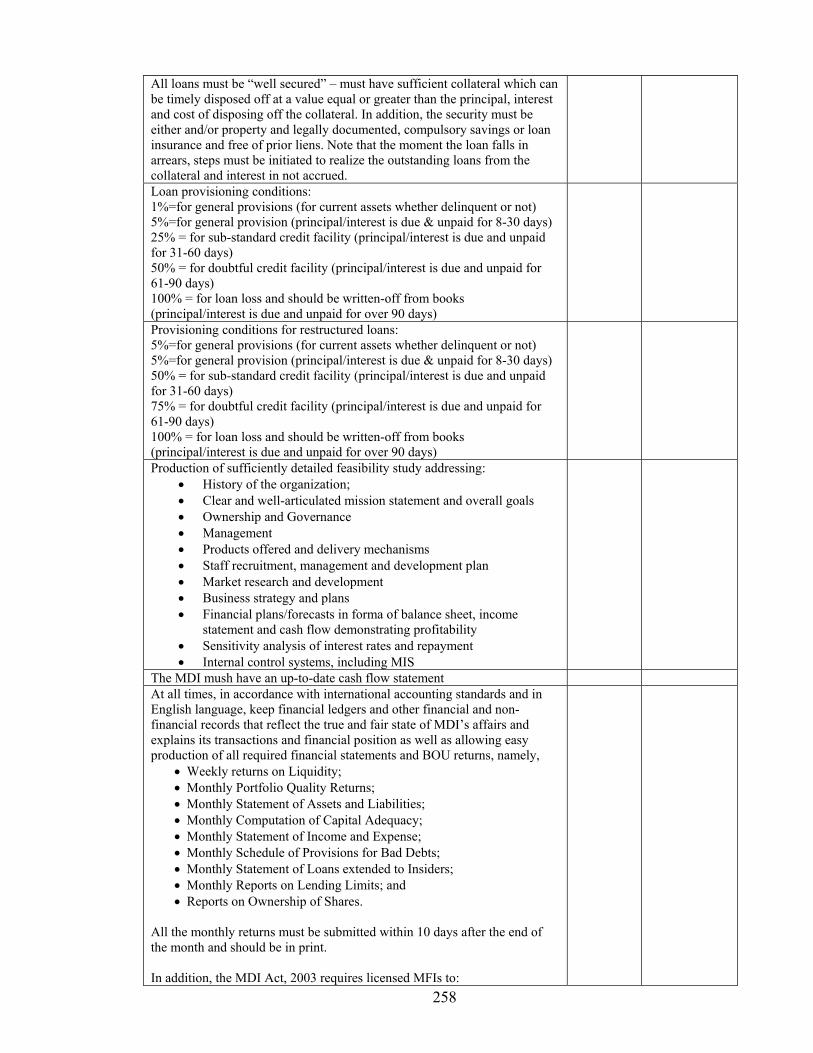
258
All loans must be “well secured” – must have sufficient collateral which can be timely disposed off at a value equal or greater than the principal, interest and cost of disposing off the collateral. In addition, the security must be either and/or property and legally documented, compulsory savings or loan insurance and free of prior liens. Note that the moment the loan falls in arrears, steps must be initiated to realize the outstanding loans from the collateral and interest in not accrued.
Loan provisioning conditions: 1%=for general provisions (for current assets whether delinquent or not) 5%=for general provision (principal/interest is due & unpaid for 8-30 days) 25% = for sub-standard credit facility (principal/interest is due and unpaid for 31-60 days) 50% = for doubtful credit facility (principal/interest is due and unpaid for 61-90 days) 100% = for loan loss and should be written-off from books (principal/interest is due and unpaid for over 90 days)
Provisioning conditions for restructured loans: 5%=for general provisions (for current assets whether delinquent or not) 5%=for general provision (principal/interest is due & unpaid for 8-30 days) 50% = for sub-standard credit facility (principal/interest is due and unpaid for 31-60 days) 75% = for doubtful credit facility (principal/interest is due and unpaid for 61-90 days) 100% = for loan loss and should be written-off from books (principal/interest is due and unpaid for over 90 days)
Production of sufficiently detailed feasibility study addressing: • History of the organization; • Clear and well-articulated mission statement and overall goals • Ownership and Governance • Management • Products offered and delivery mechanisms • Staff recruitment, management and development plan • Market research and development • Business strategy and plans • Financial plans/forecasts in forma of balance sheet, income
statement and cash flow demonstrating profitability • Sensitivity analysis of interest rates and repayment • Internal control systems, including MIS
The MDI mush have an up-to-date cash flow statement At all times, in accordance with international accounting standards and in English language, keep financial ledgers and other financial and non-financial records that reflect the true and fair state of MDI’s affairs and explains its transactions and financial position as well as allowing easy production of all required financial statements and BOU returns, namely,
• Weekly returns on Liquidity; • Monthly Portfolio Quality Returns; • Monthly Statement of Assets and Liabilities; • Monthly Computation of Capital Adequacy; • Monthly Statement of Income and Expense; • Monthly Schedule of Provisions for Bad Debts; • Monthly Statement of Loans extended to Insiders; • Monthly Reports on Lending Limits; and • Reports on Ownership of Shares.
All the monthly returns must be submitted within 10 days after the end of the month and should be in print. In addition, the MDI Act, 2003 requires licensed MFIs to:

259
• Prepare and maintain adequate books of account vouchers, securities, records, computer systems and relevant other financial and non-financial records;
• Have adequate physical infrastructure in the form of buildings, security, counters, a strong room with a safe and safety provisions such as fire extinguishers;
• Pay an annual license fee of UGX one million, the amount paid by a credit institution
• Failure to comply with the regulatory requirements attracts penalties or may result in a management take-over, which might lead to liquidation.
13. What is your estimated cost of writing a feasibility study? UGX ------------------------------ 14 What is your projected cost of making reports to BOU? UGX ------------------------ 15 Using scale 0 = Not important, 1 = Moderately important, 2 = Important, 3 = Most important, list
sources of funding for this MFI and rank them as requested Sources of funding Level of Importance Shares Retained earnings Grant Members savings Public savings Other (Specify) Question Response 16 How much time would this MFI take to raise additional capital if required?
Time in months/Years:
17 How much money did this MFI pay for external audit last financial year? Amount: 18 How much money did this MFI pay for external supervision last financial year?
Amount:
19. In what undertaking does this institution invest its resources e.g. share capital, savings, etc?
01 Mainly loans 02 Only in Loans 03 Fixed deposits 04 Other (specify)
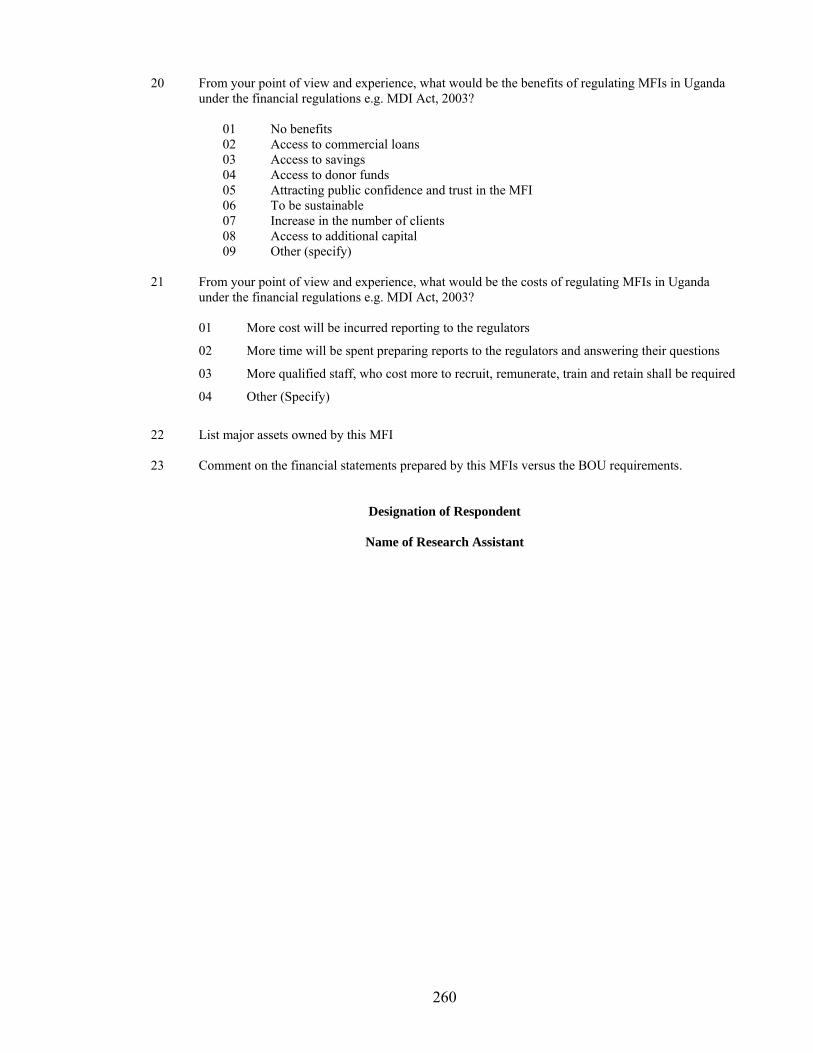
260
20 From your point of view and experience, what would be the benefits of regulating MFIs in Uganda under the financial regulations e.g. MDI Act, 2003?
01 No benefits 02 Access to commercial loans 03 Access to savings 04 Access to donor funds 05 Attracting public confidence and trust in the MFI 06 To be sustainable 07 Increase in the number of clients 08 Access to additional capital 09 Other (specify)
21 From your point of view and experience, what would be the costs of regulating MFIs in Uganda
under the financial regulations e.g. MDI Act, 2003?
01 More cost will be incurred reporting to the regulators
02 More time will be spent preparing reports to the regulators and answering their questions
03 More qualified staff, who cost more to recruit, remunerate, train and retain shall be required
04 Other (Specify)
22 List major assets owned by this MFI 23 Comment on the financial statements prepared by this MFIs versus the BOU requirements.
Designation of Respondent
Name of Research Assistant
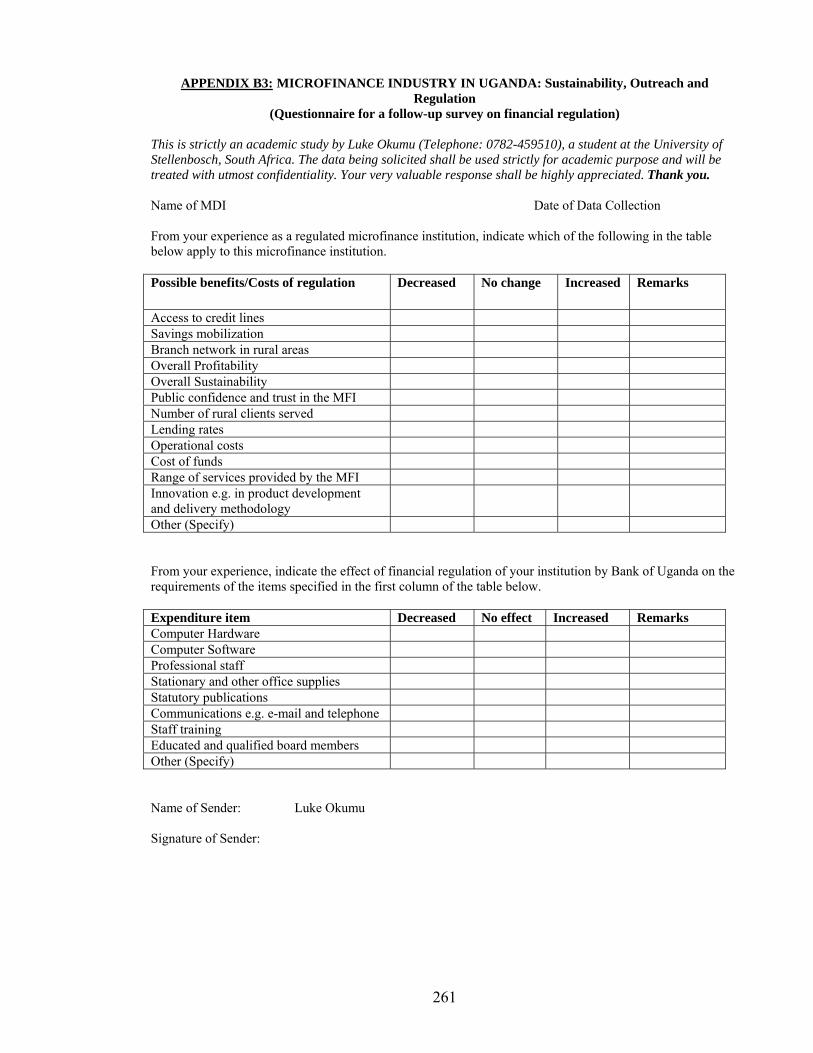
261
APPENDIX B3: MICROFINANCE INDUSTRY IN UGANDA: Sustainability, Outreach and Regulation
(Questionnaire for a follow-up survey on financial regulation) This is strictly an academic study by Luke Okumu (Telephone: 0782-459510), a student at the University of Stellenbosch, South Africa. The data being solicited shall be used strictly for academic purpose and will be treated with utmost confidentiality. Your very valuable response shall be highly appreciated. Thank you. Name of MDI Date of Data Collection From your experience as a regulated microfinance institution, indicate which of the following in the table below apply to this microfinance institution. Possible benefits/Costs of regulation Decreased No change Increased Remarks
Access to credit lines Savings mobilization Branch network in rural areas Overall Profitability Overall Sustainability Public confidence and trust in the MFI Number of rural clients served Lending rates Operational costs Cost of funds Range of services provided by the MFI Innovation e.g. in product development and delivery methodology
Other (Specify) From your experience, indicate the effect of financial regulation of your institution by Bank of Uganda on the requirements of the items specified in the first column of the table below. Expenditure item Decreased No effect Increased Remarks Computer Hardware Computer Software Professional staff Stationary and other office supplies Statutory publications Communications e.g. e-mail and telephone Staff training Educated and qualified board members Other (Specify) Name of Sender: Luke Okumu Signature of Sender:
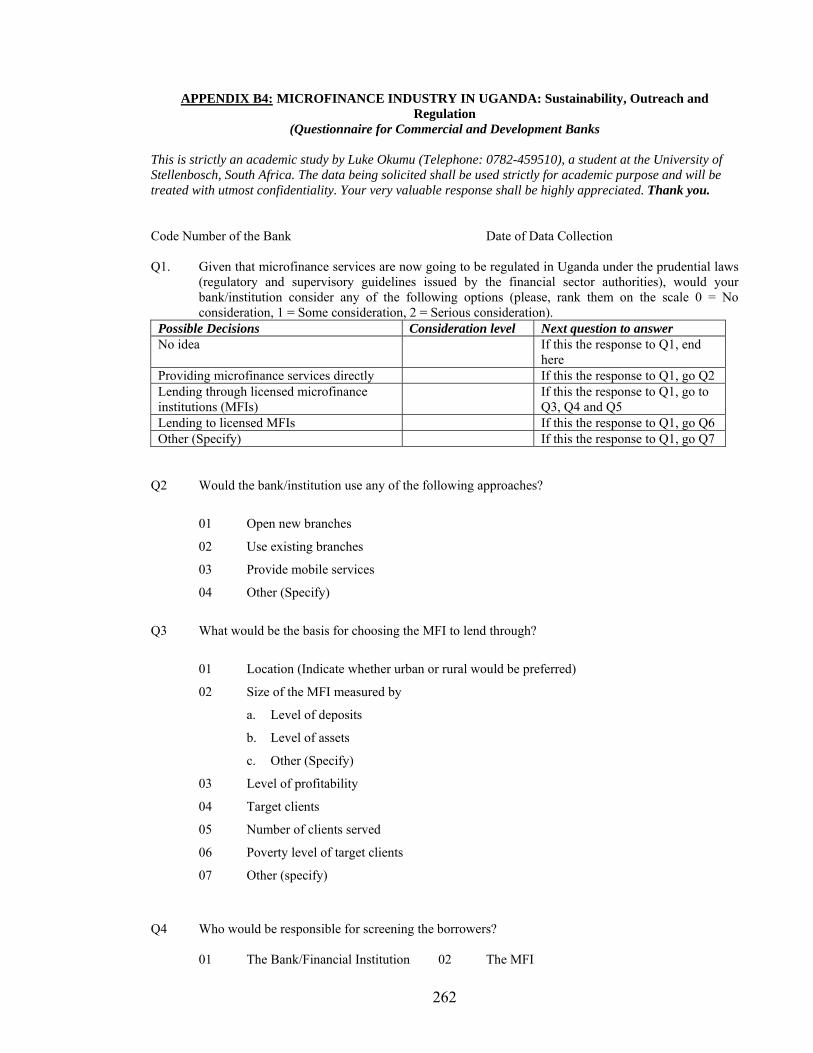
262
APPENDIX B4: MICROFINANCE INDUSTRY IN UGANDA: Sustainability, Outreach and
Regulation (Questionnaire for Commercial and Development Banks
This is strictly an academic study by Luke Okumu (Telephone: 0782-459510), a student at the University of Stellenbosch, South Africa. The data being solicited shall be used strictly for academic purpose and will be treated with utmost confidentiality. Your very valuable response shall be highly appreciated. Thank you. Code Number of the Bank Date of Data Collection
Q1. Given that microfinance services are now going to be regulated in Uganda under the prudential laws (regulatory and supervisory guidelines issued by the financial sector authorities), would your bank/institution consider any of the following options (please, rank them on the scale 0 = No consideration, 1 = Some consideration, 2 = Serious consideration).
Possible Decisions Consideration level Next question to answer No idea If this the response to Q1, end
here Providing microfinance services directly If this the response to Q1, go Q2 Lending through licensed microfinance institutions (MFIs)
If this the response to Q1, go to Q3, Q4 and Q5
Lending to licensed MFIs If this the response to Q1, go Q6 Other (Specify) If this the response to Q1, go Q7
Q2 Would the bank/institution use any of the following approaches?
01 Open new branches
02 Use existing branches
03 Provide mobile services
04 Other (Specify)
Q3 What would be the basis for choosing the MFI to lend through?
01 Location (Indicate whether urban or rural would be preferred)
02 Size of the MFI measured by
a. Level of deposits
b. Level of assets
c. Other (Specify)
03 Level of profitability
04 Target clients
05 Number of clients served
06 Poverty level of target clients
07 Other (specify)
Q4 Who would be responsible for screening the borrowers?
01 The Bank/Financial Institution 02 The MFI
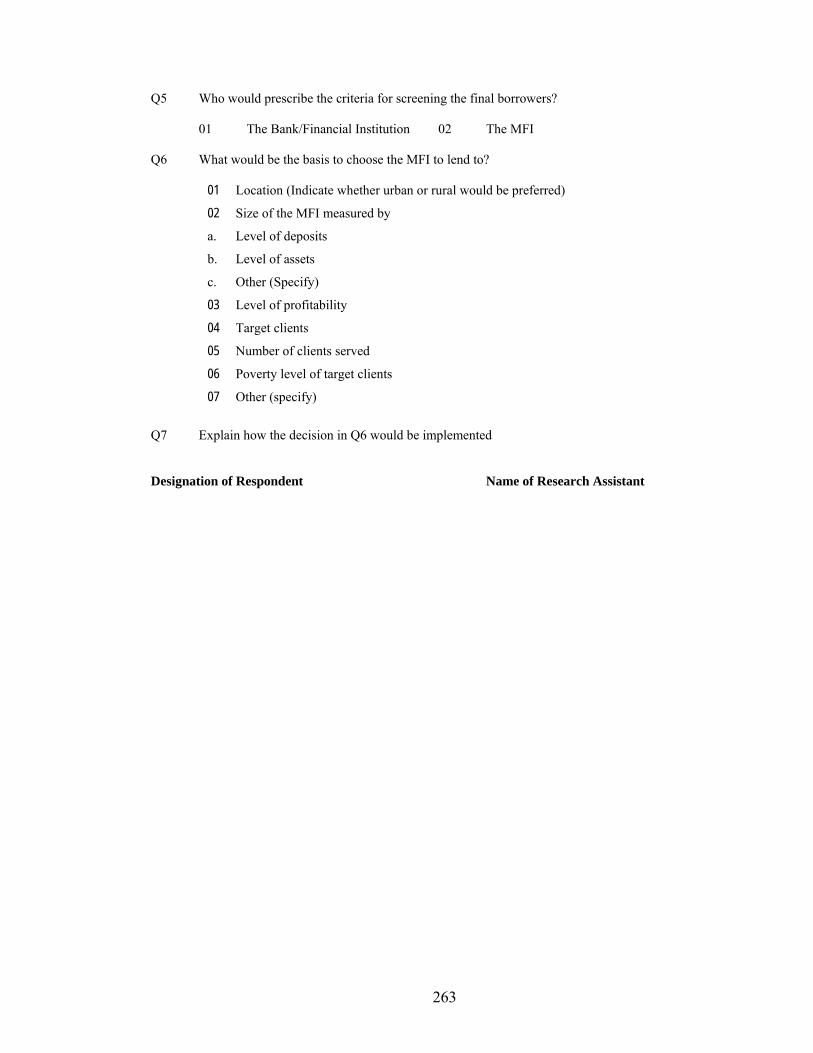
263
Q5 Who would prescribe the criteria for screening the final borrowers?
01 The Bank/Financial Institution 02 The MFI
Q6 What would be the basis to choose the MFI to lend to?
01 Location (Indicate whether urban or rural would be preferred)
02 Size of the MFI measured by
a. Level of deposits
b. Level of assets
c. Other (Specify)
03 Level of profitability
04 Target clients
05 Number of clients served
06 Poverty level of target clients
07 Other (specify)
Q7 Explain how the decision in Q6 would be implemented
Designation of Respondent Name of Research Assistant
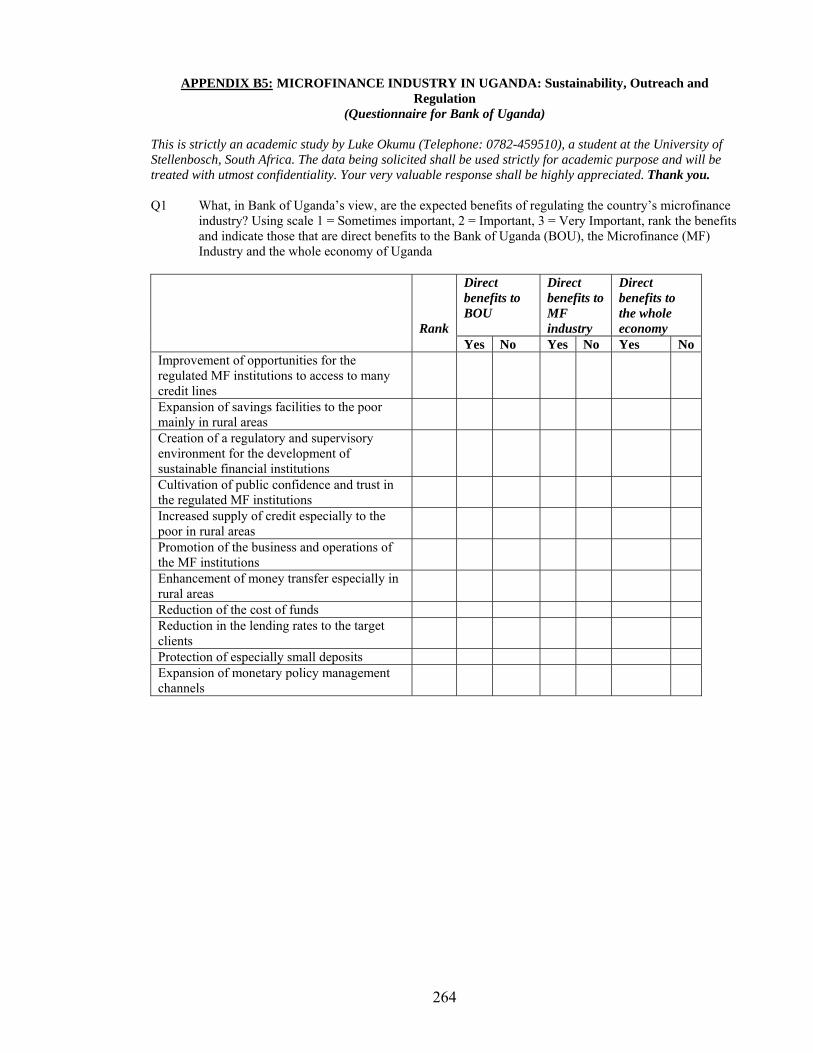
264
APPENDIX B5: MICROFINANCE INDUSTRY IN UGANDA: Sustainability, Outreach and Regulation
(Questionnaire for Bank of Uganda) This is strictly an academic study by Luke Okumu (Telephone: 0782-459510), a student at the University of Stellenbosch, South Africa. The data being solicited shall be used strictly for academic purpose and will be treated with utmost confidentiality. Your very valuable response shall be highly appreciated. Thank you. Q1 What, in Bank of Uganda’s view, are the expected benefits of regulating the country’s microfinance
industry? Using scale 1 = Sometimes important, 2 = Important, 3 = Very Important, rank the benefits and indicate those that are direct benefits to the Bank of Uganda (BOU), the Microfinance (MF) Industry and the whole economy of Uganda
Direct benefits to BOU
Direct benefits to MF industry
Direct benefits to the whole economy
Rank
Yes No Yes No Yes No Improvement of opportunities for the regulated MF institutions to access to many credit lines
Expansion of savings facilities to the poor mainly in rural areas
Creation of a regulatory and supervisory environment for the development of sustainable financial institutions
Cultivation of public confidence and trust in the regulated MF institutions
Increased supply of credit especially to the poor in rural areas
Promotion of the business and operations of the MF institutions
Enhancement of money transfer especially in rural areas
Reduction of the cost of funds Reduction in the lending rates to the target clients
Protection of especially small deposits Expansion of monetary policy management channels
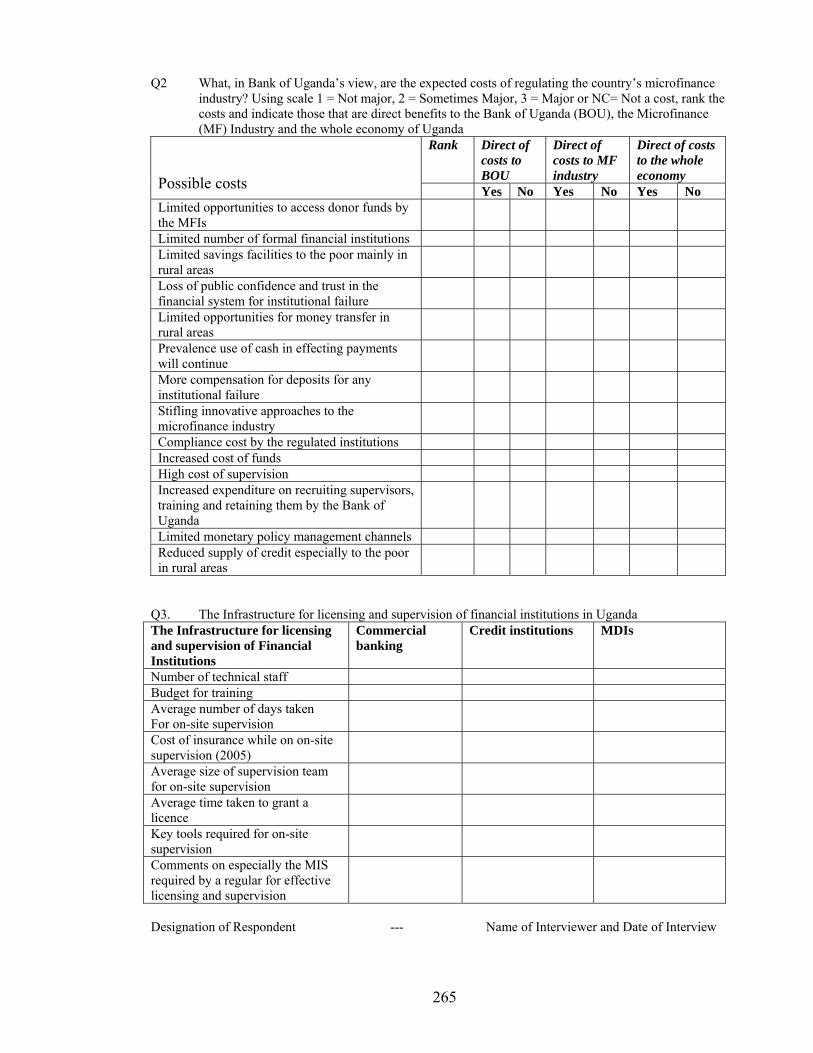
265
Q2 What, in Bank of Uganda’s view, are the expected costs of regulating the country’s microfinance industry? Using scale 1 = Not major, 2 = Sometimes Major, 3 = Major or NC= Not a cost, rank the costs and indicate those that are direct benefits to the Bank of Uganda (BOU), the Microfinance (MF) Industry and the whole economy of Uganda
Rank Direct of costs to BOU
Direct of costs to MF industry
Direct of costs to the whole economy
Possible costs Yes No Yes No Yes No Limited opportunities to access donor funds by the MFIs
Limited number of formal financial institutions Limited savings facilities to the poor mainly in rural areas
Loss of public confidence and trust in the financial system for institutional failure
Limited opportunities for money transfer in rural areas
Prevalence use of cash in effecting payments will continue
More compensation for deposits for any institutional failure
Stifling innovative approaches to the microfinance industry
Compliance cost by the regulated institutions Increased cost of funds High cost of supervision Increased expenditure on recruiting supervisors, training and retaining them by the Bank of Uganda
Limited monetary policy management channels Reduced supply of credit especially to the poor in rural areas
Q3. The Infrastructure for licensing and supervision of financial institutions in Uganda The Infrastructure for licensing and supervision of Financial Institutions
Commercial banking
Credit institutions MDIs
Number of technical staff Budget for training Average number of days taken For on-site supervision
Cost of insurance while on on-site supervision (2005)
Average size of supervision team for on-site supervision
Average time taken to grant a licence
Key tools required for on-site supervision
Comments on especially the MIS required by a regular for effective licensing and supervision
Designation of Respondent --- Name of Interviewer and Date of Interview