the measurement of organizational effectiveness: a …
TRANSCRIPT

LIBRABT YION
NAVAL I'C lOOL MOHTIMT, CALI/ORN1A 83940
NAVY PERSONNEL RESEARCH AND DEVELOPMENT CENTER SAN DIEGO. CALIFORNIA 92152
NPRDC TR 75-1 JULY 1974
THE MEASUREMENT OF ORGANIZATIONAL EFFECTIVENESS: A REVIEW OF RELEVANT RESEARCH AND OPINION
1
John P. Campbell David A. Bownas
Norman G. Peterson Marvin D. Dunnette
APPROVED FOR PUBLIC RELEASE; DISTRIBUTION UNLIMITED

NPRDC TR 75-1 July 1974
THE MEASUREMENT OF ORGANIZATIONAL EFFECTIVENESS: A REVIEW OF RELEVANT RESEARCH AND OPINION
John P. Campbell David A. Bownas
Norman G. Peterson Marvin D. Dunnette
Personnel Decisions, Incorporated Minneapolis, Minnesota
Approved by
James J. Regan Technical Director
Navy Personnel Research and Development Center San Diego, California 92152

UNCLASSIFIED SECURITY CLASSIFICATION OF THIS PAGE (When Data Entered)
REPORT DOCUMENTATION PAGE READ INSTRUCTIONS BEFORE COMPLETING FORM
I. REPORT NUMBER
TR 75-1
2. GOVT ACCESSION NO 3. RECIPIENT'S CATALOG NUMBER
4. TITLE (and Subtitle)
The Measurement of Organizational Effectiveness: A Review of Relevant Research and Opinion
5. TYPE OF REPORT & PERIOD COVERED
Final Technical Report 6. PERFORMING ORG. REPORT NUMBER
7. AUTHOR(s)
John P. Campbell David A. Bownas
Norman G. Peterson Marvin D. Dunnette
8. CONTRACT OR GRANT NUMBERfs.)
N00022-73-C-0023
3. PERc~Ry:SG ORGANIZATION NAME AND ADDRESS
Personnel Decisions, Inc. 821 Marquette Ave., Foshay Tower Minneapolis, Minn. 55042
10. PROGRAM ELEMENT. PROJECT, TASK AREA & WORK UNIT NUMBERS
62755N PF55.521.018.03.01
II. CONTROLLING OFFICE NAME AND ADDRESS
Navy Personnel Research and Development Center San Diego, California 92152
12. REPORT DATE
July 1974 13. NUMBER OF PAGES
300 14. MONITORING AGENCY NAME » ADDRESSfff different horn Controlling Ollice) 15. SECURITY CLASS, (of this report)
UNCLASSIFIED 15«. DECLASSIFI CATION/DOWN GRADING
SCHEDULE
16. DISTRIBUTION STATEMENT (ol this Report)
Approved for Public Release; Distribution Unlimited
17. DISTRIBUTION STATEMENT (ol the abstract entered In Block 20, it different from Report)
18. SUPPLEMENTARY NOTES
19. KEY WORDS (Continue on reverse side if necessary and identify by block number)
Organizational Effectiveness; Effectiveness Measurement; Organizational Theory; Organizational Development; Organization; Cost/Benefit Analysis; Productivity; Efficiency; Satisfaction; Motivation; Morale; Control; Utilization of Environ- ment; Human Resources; and Organizational Research
ASS~PAC"r 'Continue on reverse side If necessary and Identify by block number)
The general topic of defining organization effectiveness is addressed. While no succinct definition is provided, a construct of organizational effectiveness is recognized. Existing theory, research, and practice surrounding the con- struct has been searched and current measurement techniques have been cataloged along with summaries of various theories and models. Alternative methodologi- cal approaches and manifest characteristics of organizations in terms of effec- tiveness are considered. A compilation of independent, dependent, and inter- vening variables is presented. Suggestions are offered for future research in
DD FORM 1 JAN 73 1473 EDITION OF 1 NOV 65 IS OBSOLETE
UNCLASSIFIED SECURITY CLASSIFICATION OF THIS PAGE (When Data Entered)

UNCLASSTFTED SECURITY CLASSIFICATION OF THIS PAOEfWhi Data Entered)
UNCLASSIFIED SECURITY CLASSIFICATION OF THIS PAGEfWTien Data Entered)

FOREWORD
This research was performed in support of exploratory development task area, PF55.521.018, "Organizational Effectiveness". The problem and its relevance to the Navy were drawn from Cosentino, S. and DiGialleonardo, F., "Development of a Naval Organizational Behavior Research Program (Interim Report)", A staff study: Work Unit No. PF39.521.018.02.01, Washington, D. C.: Naval Personnel Research and Development Laboratory, January 1972.
The source of this contract was an unsolicited proposal sub- mitted by Personnel Decisions, Inc. 26 July 1972 to the Naval Per- sonnel Research and Development Laboratory, Washington, D. C. The contract was awarded 22 Nov. 1972 and completed 8 April 1974. The specific problem addressed is the formulation of research recommendations for the Navy in the area of organizational effectiveness. The contract was initially monitored by Mr. H. Ozkaptan who served until disestablish- ment of the Naval Personnel Research and Development Laboratory at which time monitorship was assigned to Mr. S. E. Bowser of this Center who served until the contract was completed.
J. J. Clarkin Commanding Officer

SUttMARY
Problem
The specific problem is a lack of clear understanding of the definition and conceptualization of the term 'organizational effectiveness' and the potenti.i I significance and benefit of any research undertaken to improve organizational effectiveness within the Navy. The immediate task to which the present report responds is the collection and distillation ol related literature and the formulation of research recommendations for the Navy in the area of organizational effectiveness.
Research Objective
It was the stated purpose of this effort to specify designs for an additive series of research studies to comprise a comprehensive program of fundamental research, data acquisition, and information storage for use in learning about the causal effects of organizational intervention and change technology. Given a systematic integration of all research literature in the area of organizational effectiveness, the articulation of principal dimensions of effectiveness and identification of important variables follows. The content of this report is derived largely from a search of existing theory, research, and practice surrounding the constructs of organi- zational effectiveness.
Approach
The literature of organizational effectiveness was reviewed and used as a basis for the report. To search this literature the primary sources' were followed back approximately fifteen to twenty years. Beyond that, reliance was placed upon secondary sources such as books on organi- zational theory and management, administrative and management science, industrial relations, organization theory, and operations research which were searched as thoroughly as possible. The practitioner or general public oriented literature such as Fortune, Business Week, etc., was also surveyed. No constraints were initially placed upon the type of literature to be searched. This resulted in a great deal of reading that proved unproductive but established confidence that nothing of a significant nature had been missed. Available computerized abstracting services were also utilized.
Results
The review of organizational effectiveness is expressed in the following ways. A catalogue was compiled of existing ways in which effectiveness has been measured, noting strengths, weaknesses and gaps in this composite picture. While no succinct definition is provided, a construct of organizational effectiveness is recognized. Existing theory, research, and practice surrounding the construct has been searched and current measurement techniques have been catalogued along with summaries of various theories and models. Alternative methodological approaches have been reviewed. Consideration has been given to ways in which organizational theorists and researchers have defined the construct. A summary and compilation of variables, independent, dependent, and intervening
vii
has been made. The final aspect of the report suggests a program of research that might reasonably be pursued by the Navy during the next eight to ten years to advance the understanding of organizational ef- fectiveness.
Recommendations
It is recommended that future research focus on the following areas:
(1) The analysis and development of Criteria of organizational functioning whether they be systems or goal oriented. (234-236)
(2) Naturalistic observation studies involving both in vivo and retrospective studies of Naval Organizational units. (236-243)
(3) The psychometric evaluation of both existing measures and measures which may be derivable in the future in the area of organi- zational effectiveness. (243-256)
(4) The outlining of systematic research studies on the indepen- dent "levers" that may or may not effect organizational functioning. (256-264)
Additional positive recommendations are in the nature of general support to any studies which may have relevance for understanding more fully the functioning of Naval units and systems.
The remaining recommendations are in the form of what should not be done. The literature survey has suggested certain research and theory directions which should not be followed. For example, empirical multivariate research based on a factor analytical approach to criterion development should be avoided. It is recommended that careful con- sideration be given to previous research before undertaking new research efforts.
viii

TABLE 0 _F C 0 N. T E N T S.
Chapter Page
Report Documentation Page (DD Form 1473) . . . iii
Foreword . . v
Summary '. vii
I. Introduction 1
A. Aims and Objectives 1
B. Search Procedures 2
C. The Literature: Descriptive Characteristics 2
II. Organizational Effectiveness as a Construct 5
A. Two General Models of the Effectiveness Construct ... 5
III. Specific Examples of Goal and System Models of Organizational Effectiveness 9
A. The Industrial/Organizational Psychology "Criterion" Model . 9
B. Cost/Benefit Analysis 11
C. Management by Objectives ]k
D. The Organization Development Model 1^
E. The Likert-ISR Model 22
F. The Operations Research (OR) Model 27
G. Summary of Alternative Models of "Effectiveness" Construct 37
IV. Dependent Variables of Organizational Effectiveness .... 38
A. Introduction 38
B. Specific Dependent Variables 39
1. Overall Effectiveness kO
2. Productivity 50
3- Efficiency 56
ix

(Table of Contents Cont.)
Chapter Page
4. Profit 59
5. Quality 62
6. Accidents 65
7. Growth 67
8. Absenteeism 69
9. Turnover 71
10. Satisfaction 75
11. Motivation 80
12. Morale 83
13. Control '. 86
14. Conflict/Cohesion 93
15. Flexibility/Adaptation 100
16. Goal Consensus 103
17- Role and Norm Congruence 106
18. Managerial Task Skills 110
19- Managerial Interpersonal Skills 114
20. Information Management and Communication 119
21. Readiness 123
22. Utilization of Environment 123
23. Evaluations by External Entities 124
24. Stability 125
25. Internalization of Organizational Goals 125
26. Value of Human Resources 125
(Table of Contents Cont.)
Chapter Page
C. Proposed Measures 126
D. Some Summary Comments 131
V. Methodological Approaches to the Chaos of Dependent Variables ..134
A. Traditional Multivariate Analysis 131*
B. Hierarchial vs. Non-Hierarchical Solutions I38
C. Path Analysis 139
D. Criterion Organization Via Expert Judgment 142
E. Summary of Criterion Analysis Methods 145
VI. Organizational Climate 1 if7
A. Definitions of Organizational Climate 1^7
B. Climate Instruments: Educational Climate ]kS
C. Climate Instruments: Organizational Climate 165
1. Hemphill and Westie Questionnaire 165
2. Survey of Organizations (ISR) ]66
3. Schneider and Bartlett 169
b. Evan 170
5. Modification of Educational Climate Measures . . . 171
6. Payne and Pheysey 173
7- Litwin and Stringer 176
8. House and Rizzo I79
9- Campbell (83
10. Hackman and Lawler 186
D. Summary and Conclusions 186
xi

(Table of Contents Cont.)
Chapter Page
VII. Organizational Structure 192
A. Structural vs. Structuring vs. Climate Characteristics 192
B. Interrelationships Among Structural and Climate Variables - 193
C. The Relationship of Structure to Organizational Effectiveness 199
1. Programmatic Approaches to Structure, Technology, and Effectiveness 199
a. The Aston Group 199
b. Woodward vs. Aston 200
c. Perrow 202
d. Lawrence and Lorsch 203
d. Project Management 206
2. Specific Structural Factors and Organizational Effectiveness 210
a. Organizational Level 210
b. Line-Staff 211
c. Span of Control 211
d. Size 213
e. Shape - Tall vs. Flat 214
f. Role Specialization 215
VIM. Independent Variables 218
IX. Some Conclusions and Implications 223
xii

(Table of Contents Cont.)
Chapter Page
X. Future Research on Organizational Effectiveness in the Navy 228
A. Research Content 228
B. Research Strategies 229
1. Naturalistic Observation 230
2. Psychometric-Multivariate Methodology 231
3- Experimental and Quasi-experimental Methodology . . 232
k. Research Project Suggestions 23H
References * 265
Distribution List 289
xiii

TABLES
Number
1 ALTERNATIVE SETS OF ORGANIZATIONAL EFFECTIVENESS CRITERIA OBTAINED FROM LITERATURE ON ORGANIZATION DEVELOPMENT. . .
ORGANIZATIONAL VARIABLES USED TO DESCRIBE THE STATE OF THE SYSTEM
PERCEIVED DIMENSIONS OF ORGANIZATIONAL CHARACTERISTICS ASSESSED BY THE SURVEY OF ORGANIZATION'S QUESTIONNAIRE (TAYLOR & BOWERS, 1972)
SUMMARY LISTING OF DEPENDENT VARIABLES GLEANED FROM A SURVEY OF THE ORGANIZATIONAL EFFECTIVENESS LITERATURE
Page
17
22
25
39
5 TWENTY-FOUR DIMENSIONS OF ORGANIZATIONAL EFFECTIVENESS, DERIVED FROM A FACTOR ANALYSIS OF RATINGS ON 11** EFFECTIVENESS CRITERIA FOR 283 ORGANIZATIONAL SUBUNITS. CRITERION VARIABLES WERE SELECTED FROM A LIST OF VARIABLES STUDIED IN ORGANIZATION THEORY LITERATURE, AND RATIONALLY DEVELOPED BY THE AUTHORS (FROM MAHONEY & WEITZEL, 1969)
6 TEN DIMENSIONS OF ORGANIZATIONAL EFFECTIVENESS DERIVED FROM PRINCIPAL COMPONENT ANALYSIS AND VARIMAX ROTATION OF SCORES ON 76 PERFORMANCE VARIABLES FOR 75 LIFE INSURANCE AGENCIES. PERFORMANCE MEASURES WERE SELECTED FROM A LIST OF SUCH CRITERIA USED BY PARENT COMPANY TO ASSESS AGENCY EFFECTIVENESS (FROM SEASHORE 6 YUCHTMAN, 1967)
7 COLLEGE MAJOR FIELDS CORRESPONDING TO EACH OF SIX PERSONAL ORIENTATIONS
8 PROPORTIONS OF ACHIEVEMENT TEST VARIANCE RELATED TO ENVIRON- MENTAL AND INDIVIDUAL ABILITY FACTORS .
9 SCALES FROM THE ORGANIZATIONAL CLIMATE DESCRIPTION QUESTION- NAIRE
10 IDEAL LOADINGS OF SIX SCHOOL TYPES ON THREE Q-FACTORS . . .
11 SURVEY OF ORGANIZATIONS EMPIRICAL CLIMATE SCALES
12 AGENCY CLIMATE QUESTIONNAIRE EMPIRICAL SCALES
135
137
156
160
162
163
167
169
XV

(Tables Cont.)
Number Page
13 OCI FIRST ORDER FACTORS SHARED BY THREE DISSIMILAR ORGANIZATIONAL SAMPLES 172
]k BOCI SCALES 174
15 THEORETICAL SCALES FROM THE LITWIN AND STRINGER CLIMATE QUESTIONNAIRE 177
16 OCQ THEORETICAL SCALES 179
17 FACTOR SCALES OF ORGANIZATIONAL PRACTICES AND OUTCOMES ... 181
18 VARIABLES OF ORGANIZATIONAL STRUCTURE 19^
19 DISTRIBUTION OF ORGANIZATION SIZE IN ASTON AND WOODWARD SAMPLES 201
20 PARTIAL LISTING OF POSSIBLE METHODS FOR CHANGING THE EFFECTIVENESS OF ORGANIZATIONS 221
xvi

F K U R E_ S_
Number Page
1 Three of 18 possible causal orderings for three variables . . 140
2 Need and press scales assessed by Stern's CCI 150
3 Al-CCI need-press institutional culture factors, and component need and press dimensions (from Stern, 1970, pp. 205-210) . . 153
A The college and university environment scales 155
5 Tape empirical factor scales 16]
6 GDDQ dimensions 166
7 Definitions of clusters derived by the Ward and Hook hierarchical cluster analysis procedure for the description of the total organization climate 183
8 Definitions of clusters derived by the Ward and Hook hierarchical cluster analysis procedure for the description of work group climate 18*»
9 Consistently appearing climate dimensions 186
10 Connecticut traffic fatalities 260
11 Tie-breaking experiment and regression discontinuity analysis 263
xvii

I. INTRODUCTION
This monograph is concerned with the general question of what is organ- izational effectiveness. By its very nature such a question is incapable of being answered. There is no one thing that can be identified as organizational effectiveness and to seek such an illusory variable would be to incur a great deal of frustration and wasted effort. However, we do feel that there is a set of more specific and proximate questions concerning a construct called organizational effectiveness that can profitaby be pursued, and a number of these are considered throughout this report.
Aims and Objectives
The content of this report is derived largely from a search of existing theory, research, and practice surrounding the construct of organiza- tional effectiveness. Using the literature on effectiveness as our basic data, our general objectives were as follows:
1. To compile a catalogue of the existing ways in which effec- tiveness has been measured and to note the strengths, weak- nesses, and gaps in this composite picture.
2. To summarize various theories or models of organizational effectiveness that attempt to specify the nature and meaning of effectiveness as a construct.
3. To review alternative methodological approaches that have been used to determine empirically the functional relationship among various specific measures of effectiveness.
k. To consider ways in which organization theorists and researchers have attempted to relate the manifest characteristics of organ- izations to their effectiveness. Organization structure is one example of a set of such characteristics.
5. To compile a catalogue of independent variables, vis-a-vis effectiveness as a dependent variable, and to summarize briefly the yield of research data relative to how these independent variables influence various aspects of organizational effec- tiveness .
6. To suggest a program of research that might reasonably be pur- sued by the Navy during the next eight to ten years to advance our understanding of organizational effectiveness and how it might be best changed by more than a random amount.
The above objectives constitute a much broader task than was originally envisioned for the project and the length of the report expanded propor- tionately. However, the expansion seemed necessary if any kind of order was to be distilled from all the bits and pieces.

2.
Search Procedure
To search this literature we followed the primary sources back approxi- mately fifteen to twenty years. Beyond that we relied on secondary sources such as books on organization theory and management or estab- lished literature reviews. Literature in the fields of sociology, psychology, political science, management, administrative and manage- ment science, industrial relations, organization theory, and operations research was searched as thoroughly as we could. We also surveyed the more practitioner or general public oriented literature such as Fortune, Business Week, and the like. Initially, we tried to avoid almost all constraints on the type of literature to be searched. This resulted in a great deal of reading that proved to be of no assistance but heightened confidence that we had not missed any major contributions or failed to see any major "themes" underlying the literature.
The computerized abstracting services from Psychological Abstracts, NTIS, and DOC were also employed using a wide variety of key words (e.g., organization theory, effectiveness, performance, organization analys is).
The Literature: Descriptive Characteristics
To further aid in setting the context, it might be profitable to describe briefly some of the parameters and trends that seem to characterize the organizational effectiveness literature.
1. First of all, most of it is discursive or theoretical in nature and not empirical. In a sense this is a recognition of the difficulty in doing systematic research in a domain where an entire organization is counted as just one degree of freedom. We shall come back to this notion many times, namely that a concern for the study of organizational effectiveness implies that an organization is to be taken as a degree of freedom rather than the individual and the sheer availability of "subjects" becomes a problem. As a result most of the empirical work consisting of case study type investigations and projects using many degrees of freedom quite often become classics in their own time.
2. Before the mid 1950's most of the systematic study of organizational effectiveness was carried on by sociolo- gists, and the primary mode of research was the case study.

Philip 0. Selznick's classic study of the TVA is an example (Selznick, 1966')- Wi11iam Foote Whyte's (19^8) examination of the restaurant industry is another. Blau (1955) and Gouldner (195*0 were other major contributors.
3. March and Simon's (1958) classic analysis of organizations in terms of decision making and choice behavior ushered in the era of psychology and management science and the number of individual research projects increased as did the breadth and scope of theorizing about organizational effectiveness. Also, before the mid r950's specific concerns for organiza- tional effectiveness were blended in with the general liter- ature on organization theory. That is, effectiveness tended to take a back seat to questions of what an organization actually is, how many different kinds there are, how they develop, etc. A seminal point of departure was the 1957 Georgopoulos and Tannenbaum criterion study which set apart the measurement of effectiveness as a distinct topic. Theory and research concerning organizational effectiveness exhibited its greatest growth during the 1960's. If this domain has had a golden era, the 1960's are it. Very recently it has seemed to slow and even undergo a leveling out. At the same time, the nature of the empirical research has seemed to shift from exploratory or "one shot" type studies to more programmatic efforts that are guided by some sort of theory. Two prime examples of the latter are the research conducted by Likert, Seashore, and Bowers at the University of Michigan's Insti- tute for Social Research (Bowers & Seashore, 1966; Likert, 1967; Taylor & Bowers, 1972) and the series of studies produced by the English group at the University of Aston (Pugh, Hickson, Hinings, & Turner, 1968, 1969).
k. While research on organizational effectiveness seemed to be settling down to more interrelated studies based on some sort of conceptual framework, a parallel development has been the rapid rise in behavioral science based organization develop- ment. In general, the field of 0D is not research based but is practitioner oriented and directly concerned with making changes in organizational effectiveness"using a vareity of techniques; and although they often protest to the contrary, 0D specialists do make fairly strong assumptions about what an effective organization should be like. These are discussed a bit later. In contrast to the research enterprise, which
Originally published by the University of California Press, Berkeley and Los Angeles, 19/*9-

k.
seems to be coalescing around a relatively small number of conceptual models, the OD practitioner field has developed a bewildering variety of conceptual and operative models (Burke, 1973; French 6 Bell, 1973; Hornstein, Bunker, Burke, Gines, & Lewicki, 1971).
5. The acronym OD is used primarily to designate organizational change efforts that are associated in some degree with the attitudes and practices of sensitivity training. The total range of techniques for changing organizations that have a behavioral science flavor is, of course, much broader than that. In recent times new developments in management infor- mation systems, operations research, and accounting prac- tices such as human resources accounting have taken on the character of "intervention techniques." The psychologist must now share the spectrum with the computer technologist, systems engineer , and accountant.
6. One final observation about the literature in this area is that there is a perceptible undercurrent of despair that has manifested itself among the research types in recent years. By contrast, many of the OD practitioners seem to be in a state of euphoria. Organizational effectiveness is admittedly a complex topic, and depending on your inner strength, it may look far too complicated to ever be resolved in any systematic way. The research questions of what is organizational effec- tiveness and how is it determined may yet go the way of the timber wolf (an endangered species), or worse yet, the aardvark (an extinct species).

II. ORGANIZATIONAL EFFECTIVENESS AS A CONSTRUCT
As will be seen in the following section, there is perhaps even less reason for entertaining any notion of the criterion (Dunnette, 1963) with regard to organizational performance than with regard to indi- vidual performance. As contrasted to individual performance organi- zational effectiveness criteria can undoubtedly be dimensionalized (I.e., "factored") with regard to an even greater number of facets and the number of situations in which someone would want to combine multiple criterion measures into an overall measure (e.g., Schmidt 6 Kaplan, 1970 seems much less than for criteria of individual perfor- mance.
Perhaps a better way to think of organizational effectiveness is as an underlying construct which has no direct operational definition, but which constitutes a model or theory of what organizational effective- ness is. Certainly this is not unlike the way industrial and organi- zational psychologists have come to conceptualize individual effective- ness (Campbell, Dunnette, Lawler, & Weick, 1970). The functions of such a model would be to identify the kinds of variables we should be measuring and to specify how these variables, or components, of effectiveness are interrelated—or should be interrelated. Hopefully a fully developed construct or model would also tell us to what uses measures of the individual components of effectiveness could be put.
Strictly speaking it is not possible for anyone concerned with the effectiveness of organizations to avoid using it as a construct or to avoid operating via some kind of theory. Without a theory of some sort, even if it has never been made public, it is not possible to say that one organization is more effective than another, or to say that variable X is a measure of organizational effectiveness and variable Y is not, or to plan ways to "change" an organization. Thus, it is incumbent on all those concerned to make their "theories of effective- ness" as explicit as possible.
At this point we would like to examine the major conceptual themes that seem to account for the variety of ways the construct of organizational effectiveness is used in the literature.
Two General Models of the Effectiveness Construct
Based on looking at all this literature, observing an occasional admin- istrator, manager, or military officer, and listening to people talk about organizations, we submit that there appear to be two general points of view, with variations, as to how one should assess organizational

6.
effectiveness. They have been given various lables but the most popular are the goa1 centered view and the natural systems view (e.g., see Ghorpade, 197TT The term "system" is used here in a somewhat different way than it is by industrial or systems engineers or by those who deal with systems theory in a very formal or mathematical sense (e.g., Berrien, 1968).
The goal centered view makes a reasonably explicit assumption that the organization is in the hands of a rational set of decision makers who have a set of goals in mind which they wish to pursue. Further, these goals are few enough in number to be manageable and can be defined well enough to be understood. Given that goals can be thus identified it should be possible to plan the best management strategies for attaining them. Within this orientation the way to assess organizational effec- tiveness would be to develop criterion measures to assess how well the goals are being achieved. There are a number of variations of the goal centered view. The management by objectives tradition (e.g., Odiorne, 1965» 1969) as it is usually practiced tends to fall in this category. The recently renewed movement toward cost/benefit analysis (Rivlin, I97O is an ambitious attempt to assess the actual utility of accomplish- ing specific goals. During the 1960's the attempt to derive overall measures of military readiness (Hayward, I968; Popper & Miller, 19&5) '* yet another variation. These and other examples of this mode) are dis- cussed below.
The natural systems view appears to make the assumption that if an organization is of any size at all the demands placed upon it are so dynamic and so complex that it is not possible to define a small number of organizational goals in any way that is meaningful. Rather, the organization adopts the overall goal of maintaining its viability or existence through time without depleting its environment or otherwise fouling its nest. Thus to assess an organization's effectiveness one should try to find out if an organization is internally consistent within itself, whether its resources are being judiciously distributed over a wide variety of coping mechanisms, whether it's using up its resources faster than it should, and so forth. One implicit assumption that the people with this orientation seem not to always own up to is that to be effective the organization needs some theory or model that specifies the kinds of coping mechanism that must be built and kept lubricated. It cannot prepare itself for literally everything. One clear example of such a natural systems model that incorporates specific a priori notions of what system variables should be assessed is the one developed at the University of Michigan Institute for Social Research by Likert and his associates (Likert, 19&1, 1967). In the beginning the basic systemic variable was the degree to which subordinates parti- cipated in making the decisions which affected them, or to say it another

way, the degree to which supervisors shared their influence. By impli- cation, an organization in which decisions were made participatively was a healthy and capable organization. The list has since been expanded to include communication factors, motivational practices, and the like. The focus in on "people" factors and not on the state of the organization's technology or its physical structure. The current state of the organization is measured via a questionnaire. The most recent formalization of the model and the current measurement instrument is described by Taylor and Bowers (1972) and by Franklin (1973). Other examples of systems models are those outlined by Argyris (196*0, Blake and Mouton (1968) and Katz and Kahn (1966). These and others will also be discussed in more detail below.
One principal point to be made here is that if an organizational con- sultant were to be parachuted to the deck of a ship and asked to assess the effectiveness of that organization, how he would begin the assessment would depend in part on which of these two points of view he had inter- nalized. The goal oriented analyst would immediately seek out the principal power centers or decision makers on board and ask them to state their objectives. If he were worldly wise he would also employ techniques to reveal the actual operative goals of the organization as well as the publically stated ones. For example, the captain's formally stated goal might be to have his ship score high on a specific set of maneuvers. However, his operative goal might be to "look good enough to earn a promotion." The formally stated goals and the operative goals may not be precisely the same. For better or worse, once the consultant had the goals defined he would proceed to develop criterion variables that would measure how well the objectives (of either kind) were being met. The 'validity" of a particular criterion for assessing the degree of attain- ment of a particular goal would be a matter of expert judgment. We should keep in mind that goals are not criteria. One is a desired end state and the other is an operationalized continuum representing the degree to which the desired end state is being met.
If a natural systems oriented analyst were to fall from the sky he would not first ask what the organization was trying to accomplish. Rather he would nose around the ship a lot and ask questions, perhaps about the degree of conflict among work groups, the nature of communications, the level of racial tension, the percentage of billets that were filled by people with the appropriate level of training, what the commanding officer was trading away to get the personnel he wanted, the morale of the officers and crew, and the like. At the outset he would not be con- cerned with the specific tasks the ship was trying to perform but would be concerned with the overall viability and strength of the system. He would have some a priori notions of what the characteristics of a strong system are and he would center his questioning around those. For example,

8.
if he were from the Institute for Social Research he would most likely administer the Survey of Organizations questionnaire (Taylor 6 Bowers, 1972). Supposedly, if the ship turneTout to be a strong and well balanced system, it should be equipped to pursue a wide variety of objectives and meet a wide variety of demands.
If both these analysts take their logical next steps their efforts will tend to parallel each other, if not actually converge. If the goal oriented analyst attempts to diagnose why an organization scores the way it does on the criteria he will soon be led back to system type variables. For example, perhaps the ship did not perform well in maneuvers because of racial tension on board. If the natural systems analyst wonders how various systems characteristics affect task perfor- mance, he very soon will be trying to decide which tasks are the impor- tant ones on which to assess performance. Unfortunately, in real life these second steps are often not taken. The goal oriented analyst tends not to look in the black box and the natural systems oriented analyst does not like to worry about actual task performance unless he's pressed.
We should note in passing that the above dichotomy appears not infre- quently in other forms and other places. It Is very similar to the general notion of process vs. outcome research. Research on the employ- ment interview is an example. For years the emphasis was on the inter- viewer's final judgment and its reliability or validity. Only recently have investigators looked at the process involved in the way the final decision is actually made. The process type studies have tended to show that interviewers have well defined stereotypes of a good applicant that may or may not match the requirements of the job, that negative information is given an inordinate amount of weight, and that the actual decision is made much earlier in the interview than anybody previously realized. There is a strong assumption underlying this research that if interviewers are trained to know their own processes and "improve" them the resulting employment decisions will be "better."

III. SPECIFIC EXAMPLES OF GOAL AND SYSTEM MODELS OF ORGANIZATIONAL EFFECTIVENESS
What we would like to do in this section is discuss briefly each of several examples of both the goal and systems view of the effectiveness construct. The intent is to sample all the major varieties of each kind. That is, we hope we haven't missed any. Some of them are taken out of their original context (e.g., management by objectives); never- theless, we think they all have value in showing how the specific model of effectiveness one adopts can significantly influence the way in which organizational effectiveness is ultimately measured (either by design or by default).
The Industrial/Organizational Psychology "Criterion" Model
In the context of measuring individual performance, the "criterion problem" has a large and honorable niche in the literature of industrial and organizational psychology (e.g., Blum & Naylor, 1968, Ch. 6; Campbell, Dunnette, Lawler, S Weick, 1970; Dunnette, 1966; Schmidt & Kaplan, 1971; Wallace, 1965). At the base of the criterion issue, defined as this literature defines it, is the axiom that a criterion is a measure of the degree to which an individual is contributing to the goals of the organization. Thus, if we were to transport this formulation of effectiveness from the domain of individual effectiveness to that of organizational effectiveness it would be securely within the goal centered view of the construct.
It would be fruitful at this point simply to list the major ingredients of the criterion model with an eye toward their implication for how organizational effectiveness should be assessed. We realize that this is a distillation of many contributions of many people and also that many readers of this report are themselves deeply emersed in the criterion problem and have definite views on the matter. Thus the following list may not seem complete enough to all readers. We apologize at the outset for such oversights.
In our view, the "criterion problem model" seems to incorporate the following features.
1. Overall effectiveness is not one thing but is made up of com- ponent criteria. The criterion was laid to rest some time ago.
2. The specification of the individual component criteria flows from a detailed and systematic job description. That is, the

10.
first step in criteria development is to describe concretely the major tasks the individual is to perform. By implication, the tasks to be described are directed at obtaining a specific set of subgoals that contribute to the organization's overall goals.
3. The empirical relationships among the component criteria should be determined. That is, a fairly large number of individuals should be assessed on each criterion component and multivariate analysis techniques (e.g., factor or cluster analysis) should be used to examine the pattern of relationships among the components. Empirical data should also be used to determine how the pattern changes over time as a function of changes in the individual job holders or of changes in the job or organ- izational content. Empirical analyses should be performed to find out if changes in individual component scores and/or their patterning represents changes in the true scores (reliability) or changes in error scores (unreliability).
k. The way in which individual criterion component scores are combined or otherwise used to make specific decisions (e.g., promotions) is determined by expert judgment.
5. Criterion measures should be a reflection of what the individual actually does. That is, they should represent an assessment of accomplishments that are directly under the individual's control. Variability in criterion scores across individuals or across time should be due to what the individual does, not extraneous influ- ences. For example, criteria for salesman effectiveness which are more a reflection of geographic location than the skill of the salesman are not good criteria.
6. The criterion measures should be reasonably feasible, in terms of the effort and financial costs involved in collecting data on them.
If this model were applied to a consideration of organizational effective- ness, the following features would be suggested. FiVst, we need an organizational job analysis to tell us what the major tasks of the organization are. To accomplish this we might consider the feasibility of using techniques of job analysis such as those described by Blum and Naylor (1968) or Dunnette (1966). The critical incident technique is one example. After some potential criterion measures are developed we must try them out on a large number of organizations so as to examine

II
the psychometric properties of the components. Finally, we need to assure ourselves that the component measures are indeed assessing variables over which the organization has some control. The method of scaled expectations (e.g., Campbell, Dunnette, Arvey, & Hellervik, 1973; Folgi, Hulin, & Blood, 1971; Smith & Kendall, ]3(>k) is one possible technique that can be used.
In sum, the criterion problem model assumes that qualified experts can use one or more of several techniques to infer criterion measures from a description of tasks to be performed. It demands a multivariate analysis of data collected on a large number of observations.
Cost/Benefit Analysis
Although its history as a formalized procedure is rather short, cost/ benefit analysis had traditionally been applied to the evaluation of the relative effectiveness of alternative training programs, alternative methods for developing products, and the like. That is,' it is most often used to measure the relative effectiveness of alternative courses of action toward some goal, not the effectiveness of the entire organization. Nevertheless, it is firmly rooted in the goal oriented model (e.g., see Rivlin, 1971) and conceivably could be used to determine whether an organi- zation was pursuing its goals with methods that were "cost effective." This implies that there are actual alternatives to compare, or that expert judgment could be used to develop an "achievement standard" against which the cost/benefit ratio of an existing course of action could be compared.
Inherent in the cost/benefit model are the notions that the components of both the numerator and the denominator can be reduced to a single com- posite score and that ratio has at least interval scale properties. Since the formal use of cost/benefit analysis to evaluate alternative organizational strategies really got its biggest push in the Department of Defense (e.g., see Hitch, 1965) in the form of the Planning-Programming- Budgeting System (PPBS) we do not feel the need to tell the Navy what it already knows and review the history of PPBS in the DOD. However, the use of PPBS methodology and the cost/benefit model spread to the evaluation of social programs as well as to a wide variety of other programs and these attempts at further application served to highlight more fully the strengths and weaknesses of the model (Rivlin, 1971) -
On the positive side the cost/benefit model has led to a much more analytical and thorough analysis of action strategies. A great deal of effort has been expended toward developing conceptual schemes and measure- ment methods for assessing both the cost side and the benefit side (e.g.,

12.
Chase, 1968; Dorfman, 1965; Glennon, 1972; Mangum, 1967). Much of the analysis has been in the arena of public expenditures on social pro- grams but at least some of it might be translatable to Naval concerns.
One example that might be considered is illustrated by Fansel and Bush (1970), who define and present a method for measuring the effectiveness of a health service organization. In their attempt societal value ques- tions are taken into account, at least partly, and an interval measure of effectiveness is arrived at.
First, they define the effectiveness of a health system in terms of posi- tive changes in the functional history of the target population with which the system is concerned. They speak in relatively broad terms, such as a nationwide system, but their methods could also be applied to a much smaller population.
Then they operationally define health as the degree of function/dysfunction In the population. The function/dysfunction continuum is a set of ordinal states based on a person's ability to carry on his usual daily activities. This ordinal function/dysfunction scale is made into an interval scale by using a paired comparisons scaling technique. Expert judges (public health officials) compared each of the ordinal states to one another, making judgments like "X days in state 1 > Y days in state 2." The weights derived for the ordinal states in this manner create an interval scale of health.
Thus to assess the effectiveness of a health system, the population is measured at T) using the cardinal health scale (called the Health Status Index, HSl), the health system "intervenes" for a period, then measures are taken at 1^- Of course, for large populations problems of control and attribution of cause and effect are difficult, but for relatively smaller samples these could perhaps be overcome. Fansel and Bush present some illustrative data from a small section of a tuberculosis control program.
Another positive feature of cost/benefit analysis, not so often recog- nized, is the reminder that we can perhaps learn something about the relative effectiveness of different strategies or organizational subunits by comparing their marginal rather than the average cost/benefit ratio (Glennon, 1972). For example, the benefits derived from a certain kind of technical school graduate (e.g., type XX) could virtually cease after a certain number (say N) had been produced. What's needed after that are type YY graduates (who could perhaps do more complicated things that were really irrelevant until the type XX's got all the basic problems cleared up). If the average cost/benefit ratio of having all type XX's versus having all type YY's were compared, the type XX school would look

13.
more cost effective. However, if the ratios were compared via a marginal analysis it would be revealed that an effective training organization would switch strategies at a certain point.
The limitations of the cost/benefit model have also been well documented, especially as it relates to determining the effectiveness of social programs (Rivlin, 1970- For example, Hatry (1970) specifically addres- ses the measurement of effectiveness of governmental public programs. Measures of the effectiveness of these programs should reflect the basic, underlying objectives of the programs—the effects they have upon people and the expression of these effects in the appropriate units. He asserts this is not usually the case.
Rather, program effectiveness measures fall into three categories. The first category contains pure cost measures, and does not reflect effec- tiveness at all. The expenditures per pupil in an educational program is an example. A second category is workload measures, such as number of pupils per teacher, and physical standards, such as x hospital beds per 1000 people. Such measures reflect only indirectly, if at all, the effectiveness of programs. Hatry's third category includes those measures that are composites of some kind expressed in terms of one unit of measure, usually dollars. Such measures he terms "hocus-pocus." These are misleading he asserts, and also make and conceal value judg- ments better left to open debate among the citizenry's elected represen- tatives.
To evaluate program effectiveness he suggests not doing any of the above. Rather, a clear specification of the objectives of a program must be done and measures of those objectives in whatever units are appropriate should be used. This results in multiple criteria, and these should not be made commensurable for the sake of creating a single index. Political deci- sions must be left to the political process, long term effects should be considered, and only measurable effects (these include those measured by subjective ratings) should be used.
Hatry's discussion rather neatly illustrates the two basic differences between the 1/0 psychology criterion model and the cost/benefit model. First, the cost/benefit model tries to get all measures of effectiveness combined into one composite while the 1/0 criterion model says it shouldn't be done. Second, the criterion model argues that effectiveness measures should be variables in close proximity to the individual's or organization's behaviors while the cost/benefit model will settle for outcome variables (e.g., average income) that are somewhat more distant and perhaps less under the control of the unit being evaluated.

Mt.
Management by Objectives
Although Odiorne (1965) views management by objectives as a complete system of management planning and control, it could also be viewed in a more restrictive context as a model of organizational effectiveness. The details concerning the practice of management by objectives have been well described elsewhere (e.g., Humble, 1970) as well as its limitations as a management technique (e.g., Carroll & Tosi, 1973) and this material needn't be repeated here.
However, with regard to MBO as a model of organizational effectiveness, it perhaps bears repeating that the measures which the model specifies as the primary criteria of effectiveness are whether or not the organi- zation has accomplished the concrete tasks that were previously identi- fied as necessary. It represents the ultimate in a goal oriented model of effectiveness. Thus, rather than evaluating the organization on a single abstracted continuum such as the cost/benefit ratio or on several criterion continua, that are in some sense abstractions from specific task behaviors (e.g., productivity or profit), MBO says that effective- ness is some aggregation of specific, concrete, observable and quanti- fiable accomplishments and failures. Either an organization accomplishes a specific task that it is supposed to, or it does not.
Some relevant issues revolving around the MBO model are: (a) what group or individual sets the goals for a particular organization or unit; (b) to what extent is it realistically possible to define quantifiable goals for an organization or organizational unit; (c) how should the relative importance of each goal be judged; (d) to what extent is it possible to know whether or not an objective has been "accomplished"; and (e) is the organization willing to commit the necessary time and effort to the MBO procedure?
Assuming some resolution of the above questions can be found, the MBO model yields a definition of effectiveness that is unique to each organization. For a particular time period, each organization must specify in concrete detail the specific things it wishes to accomplish. The relevant measure of effectiveness is then an accounting of which objectives were accomplished and which were not.
The Organization Development Model
The term organizational development, or 0D, means different things to different people. In the most general sense it could refer to any activity designed to effect some kind of change in an organization and

15.
thus would include the efforts of psychologists, economists, industrial engineers, computer technologists, and many others. However, for the purposes of this report we would like to use a delineation similar to that of Bennis (1969) and restrict the term organization development to a class of behavioral science type intervention techniques which owes its historical antecedents to the pioneering work in T-group and sensitivity training at the National Training Laboratories, all of which began about 19^8 (Bradford, Gibb, S Benne, 1964). A central con- cern of such techniques is to provide mechanisms by which organizational members can examine their behavior in the "here-and-now." Team building (French & Bell, 1963), process consultation (Schein, 1969), confronta- tion (Beckhard, 1969), the Managerial Grid (Blake S Mouton, 1969), and laboratory education (Bennis, 1969) are all variations on this basic theme. Intervention techniques such as job enrichment (Ford, 1969) and the Scanlon Plan (Lasieur & Purkett, 1969) do not fall in the same category.
While we have just delineated OD techniques in terms of strategies (independent variables if you will) used to bring about change, researchers and practitioners in the field also have theories, implicit or explicit, regarding the content of the dependent variables in which they are trying to effect changes, and it is to the OD model of effectiveness that we now turn.
While the OD model of organizational effectiveness is not clearly stated by most authors, it is reasonably apparent that OD adopts a systems view, not a goal model. For example, Beckhard (1969) and Bennis (1969) emphasize the systems aspects of OD. Very seldom are effectiveness outcomes mentioned by OD writers, researchers, or prac- titioners. If such things as profit, turnover, and the like are men- tioned at all, it is in a fairly unsystematic and casual way and only after much discussion has been spent on such factors as increased individual openness, better communications, greater individual self- actualization, etc., and other indicators of what is considered to be a healthy system.
Further, in both theory and practice, OD practitioners typically go beyond a general statement of a systems model and seem to have a fairly specific kind of system in mind, which serves as a standard of an "effective" organization. This last statement must be immediately qualified by stating that there is certainly not complete unanimity among organization development specialists regarding the characteristics of this "ideal" system. Contrast, for example, the statement of Tannenbaum and Davis (1970) and Beer and Huse (1972). The former authors place strong emphasis on the use and effectiveness of thera- peutic, interpersonal kinds of interventions and maintain that structural

16.
interventions are less important, especially in the early stages of organization development. The latter authors hold that a clear-cut commitment to a particular kind of OD approach is not necessary for a successful OD program, that structural and interpersonal changes should go almost hand in hand, and that several kinds of system changes (aside from just interpersonal, therapeutic changes) are probably necessary if OD is to succeed. However, there does seem to be a consensus among OD types, rough though it may be, regarding a normative model of man and organization that permits one to depict an OD construct of organizational effectiveness.
Before we get to more specifics it might be well to take note of three overall assumptions that seem to underlie most OD activity. First, rapid and accelerating change is depicted as a fact with which both men and organizations must accept and cope (Bennis, 1969)- The world is seen as changing in a variety of ways at an increasing rate. This implies that old ways of managing and organizing are no longer func- tional. The functional bureaucracy, in particular, is noted as being an outmoded model of organizations. Second, an optimistic point of view is taken toward the nature of man. Man is seen as reaching for growth, seeking self-actualization, and certainly much less in need of supervision in organizations than the conventional wisdom would imply. Almost any article or book dealing with OD will make this statement (Beckhard, 1969; Bennis, 1969; French & Bell, 1973; Margulies & Raia, 1972), but McGregor's statement on Theory X and Theory Y (I960) is still the most familiar and often quoted version. Third, though this is less often made explicit, organizations are viewed as existing primarily, if not solely, for the benefit of the individual members of the organization. French (1972) states, "One value, to which many behavioral scientist-change agents tend to give high priority, is that the needs and aspirations of human beings are the reasons for organized effort in society (p. 35)-"
In addition to these three general values or assumptoins most OD researchers and practitioners operate with some more specific set of organizational characteristics that define a healthy system. Several alternative lists of such characteristics are presented in Table 1. They represent only a sample, but we hope a representative one, of those available.

17.
TABLE 1 ALTERNATIVE SETS OF ORGANIZATIONAL EFFECTIVENESS
CRITERIA OBTAINED FROM LITERATURE ON ORGANIZATION DEVELOPMENT
Dependent Variable Source
1. High trust and support among French (1972) organizational members
2. Confrontation (not avoidance) " of problems
3. Knowledge based on authority as " well as assigned role
k. Open communications "
5. High satisfaction and enthusiasm " for organizational members
6. Frequent synergistic solutions "
7- Presence of group responsibility for planning and implementation "
1. Open, problem solving climate Bennis (1969) pp.. 36-37
2. Role authority supplemented with " authority based on competence
3. Decision-making responsibility is " located close to information sources
kr High trust among persons and groups " throughout organization
5. Competition is relevant to work goals " and collaborative efforts are maximized
6. The reward system recognizes both " achievement of organizational goals (profits or services) and development of people

18.
TABLE 1 (Cont.)
Dependent Variable Source
High sense of ownership of organi- zational objectives throughout work force
Managers manage according to rele- vant objectives rather than according to past practices
1. Organization managers work against goals
2. Form follows function
3. Decisions are made by and near the source of information
h. Reward system rewards all of the f o 1 1 ow i ng . short-term profit 6 productivity . subordinate growth . creation of viable work group
5. Communication is open in all di rection
Beckhard (1969)
6. Conflict and conflict situations treated as problems to be solved
7. High "conflict" over ideas, none over interpersonal difficulties
8. Organization is an open system
9. Values and management strategy place emphasis on maintaining of integrity and uniqueness in an interdependent environment
10. "Action research" is the way of life for the organization, feed- back mechanisms are built in

19.
TABLE 1 (Cont.)
Dependent Variable Source
1. Communication of information is Schein (1965) reliable and valid
2. Internal flexibility and creativity " in accordance with information
3. High integration and commitment " to goals of organization
k. Internal climate is characterized " by support and freedom from threat
French (1972) lists seven such desired end states: an increased level of trust and support among organizational members, confrontation rather than avoidance of problems, authority based on knowledge and skill as well as assigned role, increased openness in lateral, vertical, and diagonal com- munications, increased enthusiasm and satisfaction for organization mem- bers, increased frequency of synergistic solutions to problems (creative solutions in which all parties gain more through cooperation than through conflict), and increased levels of self and group responsibility for planning and implementation. Bennis (1969) lists nine normative goals which overlap French's a great deal but include a bit more specificity.
Taking the assumptions and normative goals outlined above, a picture of the "effective organization," according to OD, begins to emerge. Such an organization will be aware of, open to, and reactive to change. It will be searching for new forms and methods of organizing. It will have an optimistic view of its members, allowing them room to self-actualize and trusting them with the responsibility for their own efforts. It will also seek to insure the satisfaction of its members since that is its reason for existence. To these ends, conflict will be confronted, not avoided, and communication will occur freely and effectively.
Beckhard's (1969) list conveys his belief that most researchers and practitioners possess a strong consensus concerning what a healthy or- ganization is, even though it may differ somewhat from one individual to another. He portrays this consensus by presenting a synthesized list of ten characteristics that define an effective or healthy organ- ization (Beckhard, 1969, PP- 10-11).

20.
1. "The total organization, the significant subparts, and individuals manage their work against goals and plans for achievement of these goals."
2. "Form follows function (the problem, or task, or project determines how the human resources are organized)."
3. "Decisions are made by and near the sources of information regardless of where these sources are located on the organ- ization chart."
k. "The reward system is such that managers and supervisors are rewarded (and punished) comparably for:
short-term profit or production performance, growth and development of their subordinates, creating a viable working group."
5. "Communication laterally and vertically is relatively undistorted. People are generally open and confronting. They share all the relevant facts including feelings."
6. "There is a minimum amount of inappropriate win/lose activities between individuals and groups. Constant effort exists at all levels to treat conflict and conflict situations as problems subject to problem solving methods."
I 7. "There is high 'conflict' (clash of ideas) about tasks and
projects, and relatively little energy spent in clashing over interpersonal difficulties because they have been generally worked through."
8. "The organization and its parts see themselves as interacting with each other and wi th a larger environment. The organi- zation is an 'open system.'"
9. "There is a shared value, and management strategy to support it, of trying to help each person (or unit) in the organiza- tion maintain his (or its) integrity and uniqueness in an interdependent environment."
10. "The organization and its members operate in an 'action- research' way. General practice is to build in feedback mechanisms so that individuals and groups can learn from their own experience."

21
Summary.
From this brief view of what the organizational development view of the effectiveness construct seems to be, perhaps the following summary statements are in order.
1. OD concentrates its efforts on achieving a normative state whose "worth" is accepted on a priori grounds. That is, the OD model assumes that If an organization can achieve the state characterized by a list such as Beckhard's, it will be effective as an organization and will be optimally equipped to carry out its mission(s).
2. Almost all the variables have to do with the human part of an organization, far less with technological or material aspects of the organization.
3- Carrying (2) further, these human variables predominantly have to do with phenomena of intra- and inter-group behavior.
k. Finally, to support its assumptions empirically OD would have to demonstrate several relationships. First, OD specialists must connect their intentions (goals) with their actions (intervention technique) and the results of their actions (measures of the effect of their interventions). Having proved that: (a) they are trying to do as they say and (b) are successful in what they are trying (i.e., have achieved the normative state that is their goal for the organization), they must then prove (c) their success has produced an effective organization. That is, is the organ- ization that achieves the OD normative goal state also an effective organization? OD has largely bypassed the problem of defining and measuring organizational effectiveness by, In effect, assuming it.
Thus we are left with the prospect of a process that may produce effec- tive organizations, but where no one knows how or why, much like our ancestors viewed the production of their descendants. The great amount of superstition surrounding those ancient events was eventually dis- pelled by literally "getting inside" the process, beginning with the illegal examination of cadavers. Perhaps it is time to examine the dead.

22.
The Likert-ISR Model
In somewhat of a class by itself is a systems model of organizational effectiveness that can be attributed to a cohesive group of researchers and practitioners at the University of Michigan. They include Floyd Mann, J. R. P. French, Stan Seashore, Rensis Likert, David Bowers, and others. Since Likert has written the most influential statement of this model (Likert, 1963, 1967), we will label it as his, even though he is not the sole contributor.
Flowing from the classic study by Coch and French (1948), the basic variable defining an effective system is participation in decision making, or shared power. That is, to the extent that individuals can truly participate in making the decisions that will affect them, the organization will be more effectively equipped to accomplish its mis- sion. Over the years, continued research and consulting work at Michigan (e.g., Katz, Maccoby, and Morse, 1950) has added to the list of systemic variables believed to constitute an effective organization.
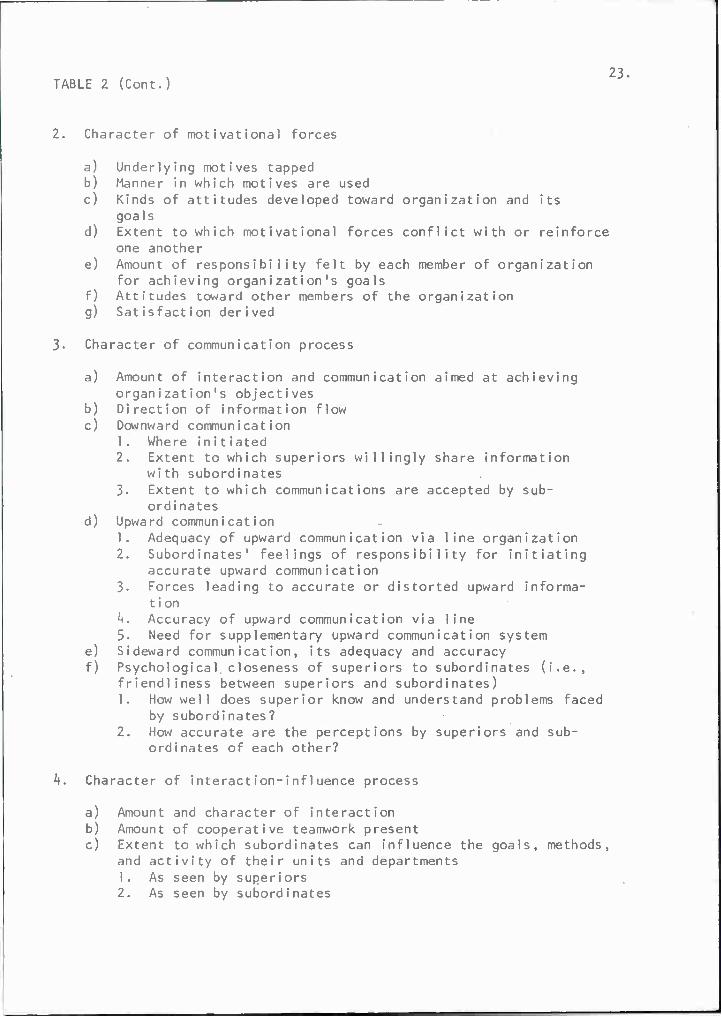
In his 1967 statement, Likert used the term "Systems k" to label what he considered to be the standard for a healthy and effective organiza- tion. The actual state of an organization was assessed via a ques- tionnaire intended to measure the perceptions of organizational mem- bers. The organizational characteristics tapped by this instrument are listed in Table 2.
TABLE 2 ORGANIZATIONAL VARIABLES USED TO DESCRIBE THE STATE OF THE SYSTEM
I. Leadership processes used
a) Extent to which superiors have confidence and trust in sub- ordinates
b) Extent to which subordinates, in turn, have confidence and trust in superiors
c) Extent to which superiors display supportive behavior toward others
d) Extent to which superiors behave so that subordinates feel free to discuss important things about their jobs with their immediate superior
e) Extent to which immediate superior in solving job problems generally tries to get subordinates' ideas and opinions and make constructive use of them
23 TABLE 2 (Cont.)
2. Character of motivational forces
a) Underlying motives tapped b) Manner in which motives are used c) Kinds of attitudes developed toward organization and its
goals d) Extent to which motivational forces conflict with or reinforce
one another e) Amount of responsibility felt by each member of organization
for achieving organization's goals f) Attitudes toward other members of the organization g) Satisfaction derived
3- Character of communication process
a) Amount of interaction and communication aimed at achieving organization's objectives
b) Direction of information flow c) Downward communication
1. Where ini tiated 2. Extent to which superiors willingly share information
with subordinates 3. Extent to which communications are accepted by sub-
ordinates d) Upward communication
1. Adequacy of upward communication via line organization 2. Subordinates' feelings of responsibility for initiating
accurate upward communication 3. Forces leading to accurate or distorted upward informa-
tion h. Accuracy of upward communication via line 5. Need for supplementary upward communication system
e) Sideward communication, its adequacy and accuracy f) Psychological closeness of superiors to subordinates (i.e.,
friendliness between superiors and subordinates) 1. How well does superior know and understand problems faced
by subordinates? 2. How accurate are the perceptions by superiors and sub-
ordinates of each other?
A. Character of interaction-influence process
a) Amount and character of interaction b) Amount of cooperative teamwork present c) Extent to which subordinates can influence the goa1s, methods,
and activity of their units and departments 1 . As seen by superiors 2. As seen by subordinates

2k.
TABLE 2 (Cont.)
d) Amount of actual influence which superiors can exercise over the goals, activity, and methods of their units and depart- ments
e) Extent to which an effective structure exists enabling one part of an organization to exert influence upon other parts
5. Character of decision-making process
a) At what level in organization are decisions formally made? b) How adequate and accurate is the information available for
decision making at the place where the decisions are made? c) To what extent are decision makers aware of problems, par-
ticularly those at lower levels in the organization? d) Extent to which technical and professional knowledge is used
in decision making e) Are decisions made at the best level in the organization as
far as 1. Availability of the most adequate and accurate informa-
tion bearing on the decision 2. The motivational consequences (i.e., does the decision-
making process help to create the necessary motivations in those persons who have to carry out the decision?)
f) To what extent are subordinates involved in decisions related to thei r work?
g) Is decision making based on man-to-man or group pattern of operation? Does it encourage or discourage teamwork?
6. Character of goal setting or ordering
a) Manner in which usually done b) To what extent do the different hierarchical levels tend to
strive for high performance goals? c) Are there forces to accept, resist, or reject goals?
7. Character of control processes
a) At what hierarchical levels in organization does major or primary concern exist with regard to the performance of the control function?
b) How accurate are the measurements and information used to guide and perform the control function, and to what extent do forces exist in the organization to distort and falsify this information?
c) Extent to which the review and control functions are concen- trated
d) Extent to which there is an informal organization present and supporting or opposing goals of formal organization

25.
TABLE 2 (Cont.)
e) Extent to which control data (e.g., accounting, productivity, cost, etc.) are used for self-guidance or group problem solving by managers and nonsupervisory employees, or used by superiors in a punitive, policing manner
8. Performance goals and training
a) Level of performance goals which superiors seek to have organ- ization achieve
b) Extent to which you have been given the kind of management training you desire
c) Adequacy of training resources provided to assist you in train- ing your subordinates
Note.—Likert, Rens is. The human organization: Its management and value. New York: McGraw-Hill, 1967, 197-211.
Further research has led to a different, but not very different, con- ceptualization of an effective organization. It is outlined in Taylor and Bowers (1972) along with a revision of the questionnaire instrument used to assess the state of the organization. The major variables mea- sured by the current version and thus the definition of an effective organization are presented in Table 3.
TABLE 3 PERCEIVED DIMENSIONS OF ORGANIZATIONAL
CHARACTERISTICS ASSESSED BY THE SURVEY OF ORGANIZATION'S QUESTIONNAIRE (TAYLOR S BOWERS, 1972)
1. Climate: perceived total impact upon a work group of the behaviors of superior work groups in terms of:
a) High or low concern for human resources b) Adequacy of communications flow c) Nature of motivation to perform d) Decision-making practices e) Technological readiness and flexibility f) Amount of lower level influence in departmental decisions
2. Supervisor leadership
a) Support: behavior that enhances someone else's feeling of person worth and importance
b) Interaction facilitation: behavior that encourages members of the group to develop close, mutually satisfying relation- ships

26.
TABLE 3 (cont.)
c) Goal emphasis: behavior that stimulates an enthusiasm for meeting the group's goal or achieving excellent performance
d) Work facilitation: behavior that helps achieve goal attain- ment by such activities as scheduling, coordinating, planning, and by providing resources such as tools, materials, and tech- nical knowledge
3« Peer Leadership
a) Support b) Interaction facilitation c) Goal emphasis d) Work faci1i tat ion
h. Interpersonal processes within work groups
a) Confidence and trust among members b) Strong, shared motivation toward goal attainment c) Effective group decision making d) Effective, open communication within the group e) Mutual help and coordinated activity f) Flexibility, adaptability, and creativity g) Job competence through skill upgrading
5. Satisfaction with:
a) Supervisor b) Work group c) Job d) Organization e) Pay f) Past progress within the organization g) Future expected progress within the organization
Performance
a) Volume of work b) Efficiency c) Product quali ty d) Attendance e) Organizational and manpower growth and development f) Human costs (e.g., accident rate, health, stress, grievances)

27-
There is obviously a great deal of similarity between the Michigan characterization of an effective organization and the OD characteri- zation as portrayed by Beckhard's list and many of the same summary statements apply. However, certain differences should also be noted. First, the Michigan group is much more research oriented and has devoted more effort to developing measures of their systems variables and to linking these variables with outcome measures such as profit- ability and turnover. As a result their variables are more con- cretely defined, although some would argue (e.g., Argyris, 1968) that the concreteness is illusory. Second, the Michigan list is not quite so heavily oriented toward interpersonal and self-actualization type variables. Third, as we shall see later the Michigan model is not quite so wedded to T-group related techniques for improving an organ- ization's score on the specified characteristics.
The Operations Research (OR) Model
In some respects this model represents both the goal-centered and the systems view of effectiveness. It has also incorporated much of the work on military "readiness."
Ackoff and Sasieni (1968) describe Operations Research (hereafter called OR) as an applied discipline with three essential character- istics:
1. a system or executive orientation 2. use of interdisciplinary teams 3- application of scientific methods to problems of control.
They define OR as "the application of scientific method by interdis- ciplinary teams to problems involving the control of organized (man- machine) systems so as to provide solutions which best serve the pur- poses of the organization as a whole (p.6)."
It appears that OR, as a discipline, should be concerned with the construct of organizational effectiveness. Certainly any discipline which sets out to provide solutions to organizational problems such that the "whole" organization improves should have some ideas about conceptualizing, measuring, and bringing about improvements in organ- izational effectiveness.
Much of what follows is based on Ackoff and Sasieni's (1968) Funda- mentals of operations research. In this text the authors state that OR's method is to build formalized models of the systems with which the decision makers are concerned. The models which have been developed vary considerably in their mathematical complexity, but they all start from virtually the same rather deceptively simple beginning, to wit:

28.
U = f(Xi,Yj)
where U is the overall utility or value of the system's performance, XI are the variables that can be controlled, Yj are variables (and con- stants) that are not controlled but do affect U, f is the relationship between U and XI and Yj.
OR does not have a model of the firm which allows it to optimize U in the above equation. Instead the OR approach uses ". . . multiple models, each representing a part of the system, [and these are] made to interact with one another so as to obtain approximately optimal solutions to planning problems (p. kkh)."
This tactic of breaking down the overall problem of optimizing organiza- tional effectiveness into optimizing the performance of subsystems as they interact has led to the practical definition of several prototype prob- lems, and Ackoff and Sasieni (1968) present a list. They cite these eight:
1. Al location. The problem of dividing up the available resources among the jobs to be done. The usual objective is to allot an insufficient amount of resources so that total costs are min- imized or total return is maximized.
2. Inventory. The problem is to control the existing and usable, but idle, resources. Again the objective is to control inven- tory so that costs are minimized or profits are maximized.
3. Replacement. The problem is to make efficient decisions about the replacement or maintenance of equipment used by the organ- ization. There are three types of problems: replacement of or maintenance of major capital equipment sometimes used indefinitely but at a steadily increasing cost (with age); replacing equipment in anticipation of complete failure; selecting a preventative maintenance scheme designed to reduce probability of failure.
k. Queuing. This ". . . problem consists of either scheduling arrivals or providing facilities, or both, so as to minimize the sum of the costs of waiting customers and idle facilities (p. 2^9, italics theirs)." Customers are not necessarily people but can be letters requiring signatures, cars needing gasoline, airplanes requiring passengers, etc.

29-
5- Sequencing and coordination. The first problem, sequencing, consists of selecting an appropriate order to service waiting customers (see k above for comments on customers), while the second deals with the amount of effort put into the tasks of a job or product that must be performed in a particular sequence, as well as when these tasks should be scheduled. The objective in coordinating is, of course, to optimize the overall job or project performance. These problems are also sometimes critical path problems. The program evalu- ation and review technique (PERT) is an example of a specific procedure for sequencing and coordinating.
6. Rout ing. This problem occurs when there is a network of some kind, most usually in transportation and communication pro- cesses. The problem consists of choosing a route between two points in the network (from among several possible routes) so that the least cost is incurred. Usually, because of practical limitations, not all alternative routes can be tried, so some other more efficient way of picking this route must be found.
7. Compet i t ive. These kinds of problems occur in situations where relevant variables are controlled by others, whose concerns or interests may conflict with your own. Although not identical to competition, conflict problems also fall under this head- ing. There are three main types of conflict: fights (elim- inate the opponent), games (outwit the opponent), and debates (convince the opponent). Competitive theory has concerned itself mainly with the first two modes of conflict.
8. Search. All of the above problems assume that the relevant information is already in hand or can be obtained. In search problems, the information must be found. In such problems, the actions to be taken are known j_f_only the required in- formation could be obtained. Some common search problems are accounting audits, exploration for mineral deposits, and information storage and retrieval.
Each of these areas has developed modeling techniques and solutions to frequently occurring situations. As noted by Ackoff and Sasieni and others (Caywood, 1970; Engel, 1969), this approach has a number of shortcomings.

30.
Overall then, the OR approach is to study an organization (system), break it down into subsystems, define models for those subsystems, solve these models for optimal performance, and implement the indi- cated procedures. Over the course of the years, recurring problems have led to the definition of standard models as outlined above.
What we would like to do now is sample some specific OR contributions that have special relevance for the conceptualization of organizational effectiveness. This is not to say that the "classic" articles of queuing, allocation, etc., are not pertinent to organizational effec- tiveness. They are, but apply to subsystem optimization primarily. (This will be discussed further in the summary remarks.)
Hayward (1968) has examined the concept of combat effectiveness; that is, the organizational effectiveness of a military organization in a combat situation. His article is primarily conceptual and deals with the nature of such measurement, the qualities it should possess, and how to go about quantifying such a measure. We would like to discuss his argument since it is the only article that deals directly with an effectiveness construct, and thus might serve as a standard.
According to Hayward, a satisfactory measure of combat effectiveness should: (a) order military units in terms of combat effectiveness, (b) have operational significance, (c) incorporate a definition of effectiveness that is intuitively acceptable to those using it. Thus, "it should embody a concept that is in harmony with those called to the mind of a military man by the term 'combat effectiveness.1" To Hayward, the definition of combat effectiveness as the probabi1i ty of success in combat operations meets these requirements.
Hayward denotes combat effectiveness (as defined above) as P(S), and posits the equation:
P(S) = f(X,Z)
where X represents friendly unit capabilities and Z represents the factors of enemy, environment, and the combat mission. (Note the similarity to Ackoff and Sasieni's general equation.) Average combat effectiveness, however, would only be a function of X, friendly unit capabilities. This is probably close to a concept called combat readiness, since the exact enemy, environment, and mission for any particular unit remains unknown for most occasions, and only its own capabilities are known.
The composite set X is usually thought of as being made up of five variables called combat functions: (l) intelligence, (2) firepower, (3) command, control, and communications, (M mobility, and (5) lo- gistic support. Hayward views these as distinct sets of variables.

31.
Finally, Hayward considers the pros and cons of alternative methods of measuring combat effectiveness. Analysis of performance under actual combat conditions is the best way, but impractical. Historical combat records could be analyzed, but are subject to the usual shortcomings of archival data (selective deposit and survival, irrelevance for this purpose, incomplete, etc.) as well as applying only to past combat situations. Rejecting these two approaches, Hayward argues the pre- diction of combat effectiveness using (a) presently existing data, (b) theory, and (c) expert judgment constitute a more feasible and practical approach.
There are three basic approaches to this prediction: (a) intuitive, relying on military judgment alone; (b) war gaming, a more rigorous application of military judgment in clearly specified situations, usually by a simulation technique; and (c) a paper-and-penci1 mixture of empirical data, theoretical analysis, and military judgment aimed at solving the equation outlined above. Hayward favors the last approach.
Regarding the validity of the results of this approach, Hayward notes that, in the absence of an actual combat situation performance check, "the most that can be claimed for any proposed measure of combat effectiveness is not that it is 'correct,1 but that the arguments upon which it is based are clear (i.e., capable of being analyzed and de- bated in a meaningful way), logically consistent, and in general accord with the judgments of military experts (p. 322)." His arguments are well taken and we will have occasion to come back to them.
In much the same vein, but not in a military context, Ansoff and Brandenburg (1971, 1971) present two papers outlining a rational approach aimed at matching the design of an organization to its pur- pose and situation. They present no empirical data on such matches. Furthermore, their discussion is limited to profit-seeking organiza- tions and utilizes a language familiar to the businessman. They do not deal at all with the "informal" organization, saying they ". . . shall assume that accommodations to personalities, styles, and limita- tions in the skills of individuals are made through adjustments in the basic form [of the organization]."
Given these limitations and adjustments the authors first present the criteria an organizational design must meet, and then briefly review some historical organizational forms in light of these criteria. Only their criteria will be presented here.

32.
First, they present an ultimate criterion and three sub-ultimate criteria, all stated in outcome terms. Maximizing return is the ultimate criterion, while the three sub-ultimate criteria are: (a) maximizing near-term performance, (b) achieving long-term growth, and (c) protecting the firm against catastrophic risks.
They present no operational forms for the above since they believe present knowledge does not permit measurement of such criteria. Instead, process criteria must be used to evaluate an organization. Their process criteria are what we have been referring to as sys- temic or state variables. They group these criteria into four categories.
Steady State Efficiency.
Measures of efficiency when the levels of throughput and the nature of throughput remain stable over time.
Operating Responsiveness.
Measures of the abilities of an organization to make quick, efficient changes in levels of throughput.
Strategic Responsiveness.
Measures of the firm's ability to respond to changes in the nature of its throughput (such as caused by obsolescence, technological change, etc.).
Structural Responsiveness.
Measures of the capabilities of an organization to change itself.
Within each of these categories they have 12-20 different measures, stated in logical, not operational, terms (such as economics of scale, synergy, logistic activities located where source resources are available).
The Ansoff and Brandenburg arguments represent some common themes running through much of the OR type literature. In essence, these are that the OR model realizes there are ultimate criteria of organ- izational functioning but since they are so hard to conceptualize and measure, the next best thing is to measure variables that repre- sent the state of the system. Thus the model of organizational effectiveness implicit in the OR approach seems to have both goal oriented and systems oriented elements, although the nature of the state or systems variables felt to be important are considerably different than those posited by the behavioral science 0D orienta- tion.

33.
Many OR theorists and researchers emphasize the role expert judgment must play in defining and measuring organizational effectiveness. A problem arises: should organizational decision makers focus on just one of the system's criteria at a time, or should an attempt be made to take all the criteria into account? This problem is especially acute when a decision must be made about committing future resources. Papers by Chi Ids and Wolfe (1972), Geoffrion, Dyer, and Feinberg (1972), Turban and Metersky (1970, Terry (1963) , and Dean and Mishry (1965) all address this problem in one form or other.
On the whole, their methods specify a procedure something like this:
a) identify appropriate sets of experts b) use these experts to:
1. identify the multiple performance criteria 2. use some scaling procedure to weight this set of
criteria (again employing the expert's judgment) 3- apply a mathematical model to combine the components
of this set or vector of criteria to create a single index
b. in the case where several alternative values are assigned to the multiple criteria, as when evaluating one weapon system against another (Albert, 1963), select that vector which gives the maximum value when the mathematical model is applied.
Most of the variation in such a procedure occurs in the selection of a particular scaling technique and the particular mathematical model used to combine the vector or evaluate alternative vectors of cri- teria (Childs 6 Wolfe, 1972; Geoffrion et a!., 1972; Terry, 1963)- Pacher (1968) presents a good conceptual descriptions of the three major ways of evaluating alternative effectiveness vectors (pp. 238- 239)- However, Eckenrode (19&5) evaluated the efficiency of six methods of collecting expert judgments on the relative value of a set of criteria and concluded there were no significant differences in the final criterion weights derived.
To give the flavor of the specific kinds of variables that have tended to fall within the OR orientation, we offer the following examples.
Kind (1965) applied a discriminant function technique to the problem of personnel assignment in an organization. In King's technique the hyperspace containing personnel measures is partitioned so that the joint probability that each individual will be a success in the job he is assigned is maximized. However, this job success is defined only as a global, dichotomous measure; the value of success of any job is assumed to be independent of the value of success on any other job. Interval scales for all variables are also assumed and one may

3*».
argue with the adequacy or validity of these methods or assumptions. For instance, it is probably not realistic to believe that a global dichotomous measure of job success is adequate for assigning personnel.
Swinth (1971) presents an organizational design for dealing with com- plex and novel problems--such as creating new products. He presents no empirical data but rather a normative model that he asserts will meet this problem. It is essentially a set of organizational "centers" linked to solve a problem, each center performing certain functions such as searching for goals, searching for solutions, etc. A kind of Delphi technique is applied to the centers, and they iterate on a problem until an overall solution is found. Swinth lists these sys- temic characteristics as necessary for his design to work: Partici- pants accept the overall goal, participants are capable in their own areas of responsibility, and are able to communicate efficiently.
Reufli (1971) presents a mathematical model that represents the attempt of one unit of a decentralized organization to alter its goals in response to the behaviors of another unit. If his model adequately represented reality, it could perhaps be used to pre- dict unit behavior in the future by the use of a simulation study. However, no empirical data that evaluates the model's accuracy is presented.
Ritti and Goldner (I969) discuss the problem of conflict in the modern technological corporation. Their ideas are based on a six- year study of a large American corporation (using interview and survey techniques). Briefly, they present an alternative model to the classic manager-professional conflict presented elsewhere. They believe that conflict occurs between functional units that are usually organized along technical (or professional) lines as a result of com- petition over scarce organizational resources. Conflict is thus between different coalitions that each contain both managers and pro- fessionals, rather than between professionals and managers. (These authors are social scientists, not typical OR types.)
Finally, Arrow (196*0 discusses pricing systems as a means of achieving managerial control in an organization, managerial control being the systemic criterion variable of interest. For Arrow, control consists of choosing operating rules and then finding ways of enforcing those rules so that the organization's "objective function" is maximized. His solution, as already mentioned, is an intraorganizational price system:
In the purest form, a price is attached to each com- modity or service produced or consumed by any activity in the organization; if the commodity is sold to, or brought from, other firms, the transfer price has to

35.
be the same as the market price (with some modifications in the case of imperfect competition). The operating rule for the manager of each activity is then to maximize its profit, as computed by valuing its inputs and out- puts at the transfer prices (p. kOk).
Arrow lists four difficulties in the application of this approach: the choice of enforcement rules (really how to punish and reward managers based on their profit measures), the complexity of operating rules (how and at what level to set prices), limits on the theoretical validity of the price system, and the presence of uncertainty (which leads to man- agers adopting "play it safe" strategies and thus not "optimizing").
Summary.
In total, these studies present a mixed bag. However, perhaps the fol- lowing can be offered as a summary.
. Little empirical data is presented, where it is, it is usually an illustration of some hypothesized mathematical model.
. The construct of organization! effectiveness usually is not directly addressed. Rather it is finessed by using a mathematical model of some sort to arbitrarily combine whatever multiple measures of organizational performance are used.
. No systematic programs of research for investigating organiza- tional effectiveness appear. Rather, each new problem or organ- ization encountered is treated anew, except that there appears to be a reasonably common set of procedures for identifying criteria and for determining the relative values for these cri- teria.
. Variables like morale, satisfaction, participatory decision making, managerial skills, size, technology, climate, etc., are not addressed. Instead, only those variables that appear to be directly related to a readily measured outcome criteria and which can be manipulated by management are considered. Furthermore, there appear to be no attempts under way to systematically identify just what these variables might be. It may be that such information does exist, perhaps in a kind of informal professional lore, but it does not exist in the recent journal literature.
. It was also evident from our review that the basic tactic of optimizing subsystem performance with the belief this optimizes overall system performance is not universally acknowledged valid (Hatry, 1970).

36.
. OR methods, as outlined in their texts and journals, are aimed at the control problem of organizations rather than the humanization problems(Äckoff, 1973)- That is, OR attempts to increase the effectiveness with which organizations serve their own purposes rather than the effectiveness with which they serve the purposes of their parts (human beings). This is probably the reason that morale, satisfaction, and the like seldom occur as important variables and why Ansoff and Brandenburg (1971) assume away the "informal" organization when they are theorizing about organiza- tional design. Bennis (1965), when comparing Organization Development to OR, points to this as the crucial difference between these two approaches. OD concentrates on the "people" type variables and OR on the economic and engineering variables. Both fields are right and both are wrong, if that kind of judg- ment is necessary. Beer (1973), an OD type, notes that both realms of variables must be tapped if a truly system-wide inter- vention is to be made in an organization. Indeed, Ackoff and Sasieni devote an entire chapter to "Implementing and Controlling the Solution" which largely addresses the problems encountered when organizational personnel resist OR solutions.
. The general OR point of view is a decision-making, optimizing one, and concerned almost totally with upper-management prob- lems .
. OR gives best results when it handles organizational problems where (a) specific goals representing organizational or opera- tional purposes can be formulated, (b) quantitative effective- ness measures which reflect the operational achievement of these goals exist or can be constructed (Engel, 1969). OR does not work well where the basic goals are not defined and system operation is not understood (Caywood, 1970).
Please keep in mind that these points are not meant as direct criti- cism of OR efforts. Rather, they are meant to show some of the limitations of OR literature for illuminating organizational effec- tiveness as a construct. In contrast, a major OR strength is the ever present emphasis on using fairly rigorous techniques to iden- tify and measure organizational performance measures for each organ- ization encountered, primarily by applying psychological scaling techniques to the judgments of organizational experts.
OR does present a unique combination of the goal and systems approaches to organizational effectiveness. The typical OR approach is to define the goals of an organization, then look at the system set up to attain those goals to determine ways of improving its

37.
operation. This also points up another strength of OR already men- tioned—the heavy involvement of organizational members (in the form of expert judgments collected with fairly rigorous data collection techniques) in the definition and measurement of organizational objectives.
Finally, OR does have an extensive literature dealing with optimal solution of specific problems encountered by organizations (the eight prototype problems mentioned in the first section). This constitutes an effective Intervention technique, and anyone hoping to improve an organization's performance would be well advised to take advantage of these solutions.
Summary of Alternative Models of "Effectiveness" Construct
It is probably not time well spent to make comparative statements about these various models as to which is better or worse for some purpose. They really provide a means for looking at different parts of the effec- tiveness construct and rather than choose among them a more viable objective should be to put them together and use the complimentary in- sights provided by each. Strangely enough it is the systems models that make the clearest pronouncement as to the specific nature of an effective organization. For example, if one were to focus exclusively on the OD model the paramount task would be to develop measures for variables such as those listed by Beckhard (1969). On the other hand, the goal models suggest that the first task of research might be to develop methods for identifying an organization's task goals; and secondly, to develop criterion measures of the degree to which the goals are being achieved. We will have research to suggest along both these 1 ines.

38.
IV. DEPENDENT VARIABLES OF ORGANIZATIONAL EFFECTIVENESS
Introduction
This section attempts to identify and define the specific dependent variables of organizational effectiveness that have been used, or sug- gested for use, in empirical studies of organizational effectiveness and to summarize the relationship of each dependent variable to other variables (dependent or otherwise).
Readers will find named here almost every variable ever mentioned in the literature of organizational behavior science. It was not the intent to achieve an exhaustive review of each variable, but we did attempt to exhaust the information on each variable relative to its role as a dependent variable or organizational effectiveness. Simi- larly, an attempt was made to look only at studies that were in some way empirical, and that used organizations, or work groups, as their primary unit of analysis.
As has been discussed above, the construct of organizational effective- ness can be looked at from many points of view. Consequently, it should come as no surprise that a comprehensive examination of research and theory dealing with the measurement of organizational effectiveness would produce a plethora of variables which are difficult to relate to one another. Nevertheless we have tried to produce a catalogue of such variables if for no other purpose than to have them all amassed in one place. To do this we wrote the label and definition on a separate index card each time anything vaguely resembling a measure of effectiveness was actually used in a research study or suggested by someone as a variable having potential as a measure of effectiveness. We then tried to sort the cards into piles or clusters that were relatively homo- geneous in terms of the definition of the variables. After several sortings and resortings the list in Table k seemed to represent the data best. On subsequent pages each of these variables is defined and elaborated further, and illustrative references are discussed. At the end of the discussion of each variable a chart is presented which sum- marizes each study cited in terms of: (a) the sample used, (b) the operational form(s) of the variable under consideration, (c) the vari- ables it was related to, and (d) the nature of the relationship which was found. However, for some of the variables no empirical studies were found and thus no summary charts appear. Once the complete cata- logue is presented we will have some summary remarks to make about the nature of the list.
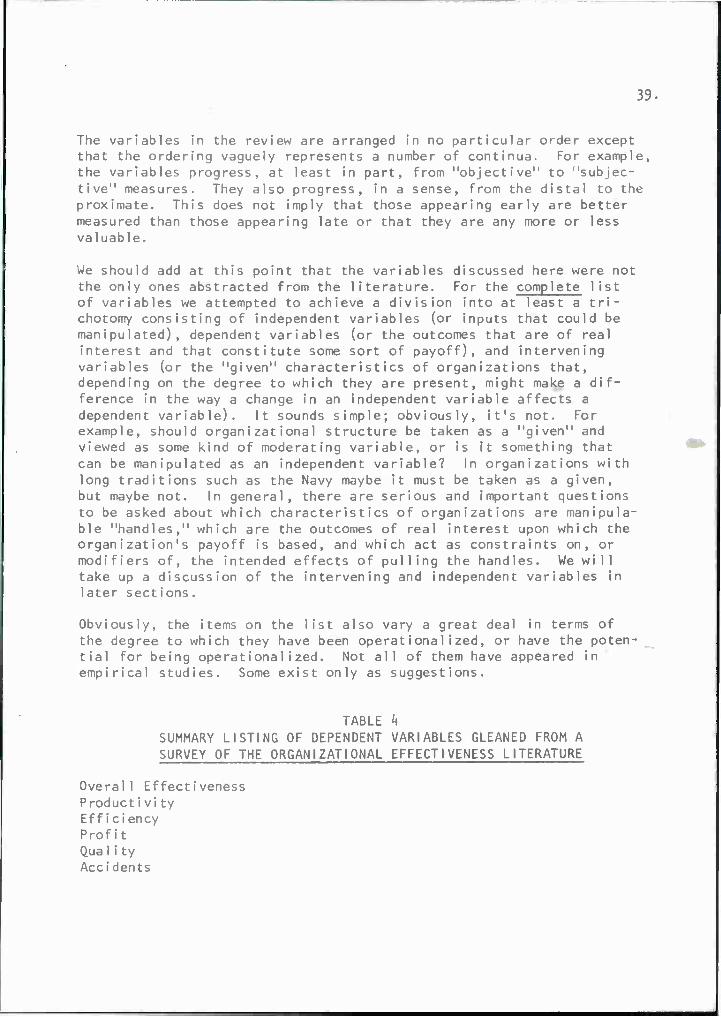
39.
The variables in the review are arranged in no particular order except that the ordering vaguely represents a number of continua. For example, the variables progress, at least in part, from "objective" to "subjec- tive" measures. They also progress, in a sense, from the distal to the proximate. This does not imply that those appearing early are better measured than those appearing late or that they are any more or less valuable.
We should add at this point that the variables discussed here were not the only ones abstracted from the literature. For the complete list of variables we attempted to achieve a division into at least a tri- chotomy consisting of independent variables (or inputs that could be manipulated), dependent variables (or the outcomes that are of real interest and that constitute some sort of payoff), and intervening variables (or the "given" characteristics of organizations that, depending on the degree to which they are present, might make a dif- ference in the way a change in an independent variable affects a dependent variable). It sounds simple; obviously, it's not. For example, should organizational structure be taken as a "given" and viewed as some kind of moderating variable, or is it something that can be manipulated as an independent variable? In organizations with long traditions such as the Navy maybe it must be taken as a given, but maybe not. In general, there are serious and important questions to be asked about which characteristics of organizations are manipula- te "handles," which are the outcomes of real interest upon which the organization's payoff is based, and which act as constraints on, or modifiers of, the intended effects of pulling the handles. We will take up a discussion of the intervening and independent variables in later sections.
Obviously, the items on the list also vary a great deal in terms of the degree to which they have been operationalized, or have the poten- tial for being operationalized. Not all of them have appeared in empirical studies. Some exist only as suggestions.
TABLE h SUMMARY LISTING OF DEPENDENT VARIABLES GLEANED FROM A SURVEY OF THE ORGANIZATIONAL EFFECTIVENESS LITERATURE
Overall Effectiveness Productivi ty Efficiency Profit Qua 1i ty Accidents

40.
TABLE k (Cont.)
Growth Absenteeism i umover Satisfaction Motivation Morale Control Conf1ict/Cohes ion lexibi1ity/Adaptat ion
Goal Consensus Role and Norm Congruence Managerial Task Skills Managerial Interpersonal Skills Information Management and Communication Readiness Utilization of Environment Evaluations by External Entities Stabi1ity Internalization of Organizational Goals Value of Human Resources
Overall Effectiveness
Overall effectiveness is intended to be a general evaluation that takes in as many single criteria as possible and results in a general judg- ment about the effectiveness of the organization, such that a set of organizations could be rank ordered on a single continuum. Overall effectiveness has been measured primarily by two methods. One is the use of archival performance records, either singly or in some combined form. The other is by overall ratings or judgments obtained from per- sons thought to be knowledgeable about the organization.
Perhaps the major determinant of whether a measure is discussed in this section is the intent of the investigator. For example, if a measure of productivity or profit is intended as a measure of overall organiza- tional effectiveness then it is included here.
Archival Performance Measures.
Lieberson and O'Connor (1972) and Grusky (1963, 1964) and Eitzen and Yetman (1972) used records that are obtainable without directly con- sulting or entering the organization being measured. Lieberson and O'Connor consulted Moody's Industrial Manual and Moody's Transportation Manual to obtain sales, net earnings, and profit margins for 167

k\.
companies across a twenty-year period (1946-1965). Grusky used the final league standings of major league baseball teams as a measure of their overall effectiveness, while Eitzen and Yetman used won-lost records of college basketball teams. One potential advantage of using these kinds of records is their relative freedom from bias compared to records controlled and kept only by the individual organization.
Ivancevich and Donnelly (1970) used organization records as a mea- sure of overall effectiveness. These included records of absence (two types), turnover, market potential ratio, number and size of orders, efficiency, direct selling costs, and route density factor. Their sample consisted of 31 sales branches of a marketing organiza- tion.
Bachman, Smith, and Slesinger (1966) used a standard score of dollar productivity as a measure of effectiveness for 36 sales offices.
Smith and Ari (1963-1964), Indik, Georgopoulos, and Seashore (1961), and Georgopoulos (1965) all used a measure of actual time to complete a task or "standard unit of work" compared to an "allowed" time to complete the unit of work as a measure of effectiveness. (All these studies used a sample of delivery organizations.) Work group members' scores were averaged to obtain an organizational (or work group) score.
Hall and Lawler (1970) used the sum of six "objective" variables as a measure of the effectiveness of 22 research and development organi- zations. The six variables were: net change in research and develop- ment budget in the last year, number of new outside contracts, number of new internally funded contracts, percentage of projects meeting their time schedule, number of contracts renewed, and percentage of projects meeting the cost budget.
Ratings of Overall Effectiveness.
Several techniques of obtaining ratings have been used, but all require the use of persons thoroughly familiar with an organization's per- formance to do the ratings.
Nealey and Blood (1968) used a single superior's rating on a four-point Likert scale as a measure of a work unit's effectiveness. Rowland and Scott (1968) also used a single superior's rating, but on two, ten-point Likert scales ("amount of work done" and "quality of work done") as a measure of a unit's overall effectiveness. (Presumably these ratings were summed.)
kl.
Hall and Lawler (1970) had the directors of research and development organizations rate their own units on a six-point scale of "global technical performance." Mahoney and Weitzel (1969) used a single global effectiveness rating by a person one level higher than the unit being rated.
Tannenbaum (1961-1962), Indik, Georgopoulos, and Seashore (1961), and Georgopoulos (1965) all used an average rating as an indicator of organizational effectiveness. In these studies, a number of judges rated each unit on a single Likert scale of overall effectiveness, and their mean rating was taken as the unit's score.
Aram, Morgan, and Esbeck (1971) had three judges separately rate 16 research groups on "overall performance outcomes" using the paired comparison method. They found high enough agreement to feel justified in combining the judges' ratings. Zald (1967-1968) used a forced com- parison ranking procedure on three dimensions (overall efficiency, quality of programming, board of director's strength) to obtain organ- izational effectiveness scores for 37 YMCA organizations. Their rank- ings were made by two persons familiar with the organizations.
Finally, Bowers (1964) obtained a ranking of life insurance agencies in terms of overall effectiveness. This ranking was done by "company officials."
Other Measures.
In a different vein, Friedlander (1966) obtained a factor he called "Group Effectiveness" from a factor analysis of 70 variables. These variables were measured on five-point Likert type items and nine semantic differential items and deal with various work group behaviors (Friedlander's Group Behavior Inventory). This factor deals with small work group behavior only, and its highest loading items were: "the group is an effective problem solving team"; and "group meetings result in creative solutions to problems."
Friedlander and Pickle (1968) attempted to obtain a measure of organ- izational effectiveness by determining the extent to which the needs of five societal "components" that transact with the organization were being satisfied. The five components are: customer, supplier, creditor, community, and government. All components were separately measured with Likert-type questionnaire items or archival data such as credit ratings, membership in local organizations, etc. Friedlander and Pickle found that of the organizations they studied (97 firms, from the retail, service, wholesale, manufacturing, and mineral extraction areas) most were not very successful at concurrently fulfilling the needs of these "components." Also, the intercorrelations among the "need fulfillment" scores for the five societal components were quite low.

«13.
Finally, Hall and Lawler (1970) summed objective performance scores, global technical performance ratings (both described above), and a global administrative performance score to obtain a composite perfor- mance index.
Summary of Overall Effectiveness Measures.
Both organizational records and organizational personnel have been tapped in the effort to get a measure of an organization's overall effective- ness. Since there is no direct method of determining which procedure, the use of archival records or subjective ratings is better, we might hope for a construct validation approach in which, the reliability, con- tent validity, dimensionality, etc., of the variables was extensively examined. However, the amount of such "criterion" research that exists is almost nil and the relevance of these measures is largely by assump- tion. This is unfortunate since both procedures are potentially valu- able and probably tap different sources of variance.
Given that both methods are useful, there is the problem of combining them. First, there is the question of whether these diverse measures should be combined at all, and if they should be, then there is a second problem of how they should be combined. At present there appear to be no easy answers. In fact, if these questions could be definitely answered, the problem of measuring organizational effectiveness would largely be solved, and an adequate theory of organizational effective- ness would likely be at hand. Mahoney and Weitzel's (1969) approach (discussed in more detail in a later section) of combining variables in a multiple regression formula to predict a global effectiveness rating is the clearest attack on this problem in the psychological literature. However, even here, only subjective rating measures were combined, and many of these are not measures of effectiveness, but rather of the predictors of effectiveness.
Summary of Relationship of Effectiveness to Other Variables.
The relationship of effectiveness to other variables is presented in the index of the studies on overall effectiveness. However, the following summary is offered. Measures of overall effectiveness have been found to have no relationship to: team collaboration and consensus (Aram et al., 197TT, three facets of satisfaction (Bowers, 196*0. coercive, expert, and legitimate power bases (Ivancevich S Donnelly, 1970; Nealey & Blood, 1968) , several measures of supervisor traits (considera- tion, initiating structure, intelligence, esteem for subordinates, cog- nitive complexity, and several "needs") (Nealey 6 Blood, 1968; Rowland 6 Scott, 1968).
Measures of effectiveness have been found positively related to: total organizational control or influence (Bachman et al., 1971; Bowers, 1964; Smith & Ari, 1963-1964; Tannenbaum, 1961-1962), all five sources of

44,
supervisory power (Bachman et al., 1971), some sources of supervisory power (Ivancevich & Donnelly, 1970), satisfaction with superiors, managers, and peers (Bachman et al., 1971; Bowers, 1964), a statistical factor tapping "Business Volume" (Bowers, 196*0, participation in organizational training laboratories (Friedlander, 1967), consistency, congruence, and consensus of group norms (Georgopoulos, 1965; Smith & Ari, 1963-1964), the quality of superior-subordinate relationships (Indik et al., 1961), organizational competence, reality-testing, adaptability, integration, and identity (Olmstead, 1972), degree of "upward influence" of the supervisor (Rowland S Scott, 1968), morale (Smith & Ari, 1963-1964), organization size and degree of democratic supervision (Tannenbaum, 1961 -1962).
Measures of effectiveness have been found negatively related to: a statistical factor tapping "Business Costs" (Bowers, 1964), occupa- tional, educational, and hierarchical level of work group members and group size (Friedlander, 1966), and rate of succession of managers (Grusky, 1963-1964; Eitzen 6 Yetman, 1972).
Finally, Mahoney and Weitzel used a multiple regression equation with 24 factors based on questionnaire items to obtain an R of .76 with overall effectiveness (across 283 organizational subunits). In addi- tion, Hall and Lawler (1970), investigating 22 research and development units, found several significant correlations between a number of inter- viewing variables (need satisfaction, quality pressure, time pressure, financial responsibility pressure, and job involvement) and effective- ness. They also found a significant correlation between an independent variable (direct customer responsibility) and effectiveness.

Ove
rall
Eff
ect
ive
ne
ss
So
urc
e
Sam
ple
Ope
ratio
nal
For
m
Rel
ated
To
Re
latio
nsh
ip F
ound
Ara
m,
Mo
rga
n &
Esb
eck
Sci
entis
ts,
engi
neer
s, a
nd
Thre
e e
xpert
s us
ed p
aire
d co
mpariso
n
Pap
er a
nd p
enci
l m
ea-
No
sig
nifi
can
t co
rrela
tions
found.
(19
71
) la
b te
chnic
ians
for
a ru
bber
tech
niq
ue t
o r
ate
the
16 w
ork
gro
up
s su
res
of
team
"co
llab-
ma
nu
fact
ure
r.
16 w
ork
on o
vera
ll perf
orm
ance
. ora
tion"
and
"co
nse
n-
grou
ps.
sus"
, 3
sepa
rate
dim
en
- si
ons.
Bac
hman
, S
mith
&
36 s
ales
off
ice
s, m
ean
N
Sta
nd
ard
sco
res
of
do
llar
pro
du
ctivity
M
easu
res
of
"contr
ol"
. A
lmo
st a
ll co
rre
latio
ns
sig
nifi
can
t at .
05
Sle
sing
er (
1966)
in o
ffic
e = 1
8.
for
the o
ffic
e,
for
offic
es
with c
om
para
ble
pow
er
base
s, a
nd s
atis
- le
vel
or
hig
her.
Leve
ls o
f co
rrela
tion i
n
exp
erience
lev
els.
fa
ctio
n w
ith o
ffic
e
man
ager
. th
e .3
5-.
45 r
ange
.
Bow
ers
(1964)
40 life
ins
uran
ce a
genc
ies.
R
an
kin
g b
y co
mp
an
y offic
ials o
n ba
sis
Sev
en s
tatis
tica
l fa
ctors
'T
ota
l co
ntr
ol"
was
hig
her
in t
he t
op 2
0
of
tota
l perf
orm
ance
. o
f ag
ency
pe
rfo
rma
nce
, 5
face
ts o
f ag
ent
satis
- fa
ctio
n,
"tota
l contr
ol"
, an
d co
ntr
ol
at 4 l
evel
s o
f th
e o
rga
niz
atio
n.
rank
ed a
genc
ies
than t
he b
ottom
20 r
anke
d
agen
cies
. C
ontr
ol
at
one
of
the 4
org
aniz
a-
tional
leve
ls w
as s
ignifi
cantly
co
rre
late
d w
ith
e
ffe
ctiv
en
ess
(.5
9,
p*.
00
1).
Eff
ect
ive
ne
ss
corr
ela
ted -
.44
with "
Bus
ines
s co
sts"
and
.5
3 w
ith "
Busi
ness
vo
lum
e".
All
oth
er
statis
tical
fact
ors
did
no
t si
gnifi
cantly
co
r-
rela
te w
ith e
ffe
ctiv
en
ess
. S
atis
fact
ion w
ith
re
gion
al m
anag
er a
nd f
ello
w a
gent
s co
rrela
ted
si
gnifi
cantly
posi
tively w
ith e
ffect
iveness
(.
53,
.81, r
esp.
, p
<.0
5), t
he o
ther
thre
e
satis
fact
ion f
acet
s d
id n
ot
corr
ela
te s
ignifi
- ca
ntly
.
Frie
dla
nd
«r
(1966)
91 m
embe
rs o
f a
gove
rn-
Sta
tistic
al
fact
or
defin
ed b
y si
x se
mantic
G
roup
mea
n fa
ctor
N
cga
iivo
ly c
orr
ela
ted w
ith o
ccu
pa
tion
al
men
t re
sear
ch a
nd d
eve
lop-
diffe
rential
item
s, d
ea
ling w
ith e
valu
atio
n
scor
es c
orr
ela
ted w
ith
le
vel,
ed
uca
tion
al
leve
l, an
d g
rou
p s
ize.
Thus
ment
org
an
iza
tion
, fr
om
3
of
gro
up m
eetin
gs i
n a
gen
eral
ized
, 4
dem
ogra
phic
variable
s:
larg
er g
rou
ps
with b
ett
er
ed
uca
ted a
nd e
m-
hie
rarc
hic
al
leve
ls. 1
2
"feelin
g"
sens
e.
KR
-20»
.89,
test
re
test
ag
e, t
enure
, o
ccu
pa
tion
al
plo
yed i
ndiv
iduals
eva
luate
d t
heir g
roups'
gr
oups
. r
= .6
4,
(6 m
onth
s).
and
ed
uca
tion
al
leve
l; an
d si
ze o
f gro
up,
and
gro
up h
iera
rchic
al
leve
l.
mee
tings
les
s fa
vora
bly
.
Friedla
nder
(19
66
) 91 m
embe
rs o
f a
gove
rn-
Sta
tistic
al
fact
or
nam
ed "
Gro
up e
ffe
ctiv
e-
Gro
up m
ean
fact
or
Negativ
ely c
orr
ela
ted w
ith o
ccupatio
nal
and
ment
rese
arch
and
de
velo
p-
ness
" defin
ed b
y ni
ne h
igh
ly l
oa
din
g
scor
es c
orr
ela
ted w
ith
e
du
catio
na
l le
vel,
and
with g
rou
p s
ize
and
ment
org
an
iza
tion
, fr
om
3
quest
ionnaire i
tem
s, d
ea
ling w
ith e
valu
a-
4 dem
ogra
phic
va
ria
ble
s:
hie
rarc
hic
al
leve
l. T
hus
larg
e g
rou
ps,
hig
h
hie
rarc
hic
al
leve
ls.
12
tion o
f a
gro
up
s perf
orm
ance
. T
he
age, t
enure
, o
ccu
pa
tion
al
in t
he o
rganiz
atio
n w
ith h
ighly
educa
ted
gr
oups
. q
ue
stio
nn
aire w
as d
evis
ed o
n t
he b
asis o
f an
d e
du
catio
na
l le
vel;
mem
bers
of
hig
her
occ
up
atio
na
l le
vels s
aw
pre
vious
inte
rvie
ws
with o
rganiz
atio
n
and
size
of
gro
up,
and
them
selv
es a
s le
ss e
ffect
ive g
rou
ps.
m
embe
rs,
and
the
ory
. K
R-2
0=
.90
, te
st
gro
up h
iera
rchic
al
leve
l. re
test r
■ .
80,
(six m
onth
s).

Ove
rall
Effect
iveness
(co
nt.)
Sou
rce
Sam
ple
Ope
ratio
nal
For
m
Rel
ated
To
Rel
atio
nshi
p F
ound
Friedla
nder
(1967)
91 m
embe
rs o
f a
gove
rn-
Sta
tistic
al
fact
or
nam
ed "
Gro
up e
ffect
ive-
Pa
rtic
ipa
tion (
or
not) i
n
Com
pare
d 4 "
tre
ate
d"
gro
up
s to
3 c
on
tro
l m
ent
rese
arch
and
deve
lop-
ness
" defin
ed b
y nin
e h
igh
ly l
oa
din
g
org
an
iza
tion
al
train
ing
g
rou
ps
on g
ain
(befo
re-a
fter
desi
gn)
scor
es
ment
org
an
iza
tion
, fr
om
3
quest
ionnaire i
tem
s, d
ea
ling w
ith e
valu
a-
lab
ora
tory
ses
sion
s.
on t
he f
acto
r sc
ores
. T
rea
ted g
rou
ps
show
ed
h
iera
rch
ica
l le
vels
. 1
2 tio
n o
f a
grou
ps p
erf
orm
ance
. T
he
m
ore
gain
, but
final
scor
es w
ere
not
sig
nifi
- gr
oups
. q
ue
stio
nn
aire w
as d
evis
ed o
n t
he b
asis o
f pre
vious
inte
rvie
ws
with o
rga
niz
atio
n
mem
bers
, an
d th
eo
ry.
KR
-2O
.90,
test
re
test r = .
70,
(six m
on
ths)
.
can
tly d
iffe
rent
sinc
e co
ntr
ol
gro
up
s ha
d hig
her
initia
l sc
ores
.
Friedla
nder
& P
ickl
e
Quest
ionnaires
and
The e
xtent
to w
hic
h 5
"co
mp
on
en
ts"
The
fu
lfill
me
nt
of
Corr
ela
tional
anal
ysis r
evea
led
few
sig
nifi
- (1
968)
arc
hiv
al
reco
rds
on 9
7 sm
all
inte
ract
ing w
ith a
n o
rga
niz
atio
n w
ere
"ow
ne
r" a
nd "
em
plo
yee
'
can
t a
sso
cia
tion
s b
etw
ee
n f
ulfill
me
nt
of
busi
ness
es o
f di
vers
e ty
pe
s.
satis
fied o
r fu
lfill
ed,
as s
how
n by
q
ue
stio
nn
aire
s an
d arc
hiv
al
data
. I
nte
rna
l co
nsi
stency
re
liab
ility
coeffic
ients
fo
r th
e fiv
e m
easu
res
wer
e .6
0,
.65, .
77,
.92,
and
.96.
need
s.
the v
ario
us
need
s o
f "c
om
po
ne
nts
" an
d "o
wn
ers
" an
d "e
mp
loye
es"
.
Gru
sky
(19
63
-19
64
) R
ecor
ds o
f m
ajo
r le
ague
T
eam
sta
ndin
g a
t en
d o
f se
ason
. R
ate
of
succ
essi
on o
f C
orr
ela
tion
s o
f ra
te o
f su
cces
sion
and
tea
m
base
ball
team
s fo
r periods
man
ager
s.
won-lost
re
cord
s w
ere
-.40 (
p^0
2)
and
19
21-4
1 an
d 1951-5
8.
-.60 (
p>
i001), f
or
periods
1921
-41
an
d
19
51
-58
, re
sp.
Georg
opolo
us
(1965)
32 s
tatio
ns
of
a re
tail
Ave
rage
wo
rke
r p
rod
uctivity d
ata (
un
its
Mea
sure
s o
f g
rou
p n
orm
s M
easu
res
of
ass
oci
atio
n (
corr
ela
tions
mer
chan
dise
de
live
ry
of
time t
o c
om
ple
te w
ork
com
pare
d t
o
the c
on
sist
en
cy,
congru
- an
d p
hi's
) w
ere
in t
he .
25 t
o .
64 r
ange
org
aniz
atio
n.
a st
an
da
rd), a
vera
ge o
vera
ll perf
orm
ance
en
ce,
and
cons
ensu
s o
f betw
een e
ffect
iveness
and
no
rma
tive
ra
tings
give
n to
the s
tatio
ns
by
seve
ral
sam
e, a
s w
ell
as "
no
rm-
mea
sure
s.
jl/U
JCJ.
»•
i'/e
mem
ber
acr
ive
nss
;'
Hal
l & L
aw
ler
(1970)
Dire
cto
rs a
nd r
esea
rche
rs
A g
lob
al
tech
nic
al
pe
rfo
rma
nce
rstin
go
f S
ever
al m
easu
res, 5
S
ever
al s
ign
ifica
nt
corr
ela
tion
s b
etw
ee
n
in 2
2 R
&D u
nits
eng
aged
ea
ch u
nit b
y th
e d
irect
or
of
tha
t unit;
an
hyp
oth
esi
zed a
s in
ter-
in
dependent-
inte
rvenin
g,
and
inte
rvenin
g-
in a
pp
lied a
nd d
evel
op-
"obje
ctive"
pe
rfo
rma
nce
ra
ting - t
he s
um
veni
ng v
aria
bles
, ne
ed
effect
iveness
mea
sure
s fo
und.
One
sig
nifi
- m
enta
l re
sear
ch.
of
the
follo
win
g s
ix v
aria
bles
- c
hang
e in
sa
tisfa
ctio
n,
qu
alit
y
cant
independent-
effect
iveness
co
rre
latio
n
R&
D b
udget, n
ew i
nsid
e an
d o
uts
ide c
on-
pres
sure
, tim
e p
ress
ure.
(d
irect
cust
om
er
resp
on
sib
ility
with g
lob
al
tract
s, p
erc
en
t o
f pro
ject
s m
ee
ting c
ost
fin
anci
al
resp
on
sib
ility
p
erf
orm
an
ce r
atin
g,
r=.5
7,
p«;1
0).
Job
an
d tim
e s
ched
ules
, num
ber
of
contr
act
s pr
essu
re, jo
b i
nvo
lve
me
n
chal
leng
e, d
irect
cust
om
er
resp
on
sib
ility
. re
ne
we
d;
a co
mp
osi
te i
ndex
usin
g th
e
and 4 h
ypoth
esi
zed a
s in
dependent
bu
dg
et
rese
arch
acc
ount, a
nd
ab
ove
two m
easu
res
plus
a g
lob
al
ratin
g
ind
ep
en
de
nt
varia
ble
s;
qualit
y an
d fin
anci
al
pres
sure - a
ccount
for
of
adm
inis
trativ
e p
erf
orm
ance
. ra
nge
of
pro
ject
s, j
ob
ch
alle
nge,
independent
rese
arch
, b
ud
ge
t a
cco
un
t direct
cust
om
er
resp
ons-
ib
ility
.
most
of
the
sig
nifi
can
t co
rre
latio
ns.

Ove
rall
Eff
ect
ive
ne
ss (
cont.)
Sou
rce
Sam
ple
Opera
tional
Fo
rm
Rel
ated
To
Re
latio
nsh
ip F
ound
Indik
, G
eorg
opoulo
s, &
27
sta
tions
of
a re
tail
Ave
rage
wo
rke
r p
rod
uctivity d
ata
(un
its
Eig
ht
varia
bles
toppin
g
In g
ener
al,
the e
ffect
iveness
and
pro
ductivity
S
eash
ore
(1961)
de
live
ry m
erch
andi
se
of
time t
o c
om
ple
te w
ork
com
pare
d t
o a
su
perior-
subord
inate
sc
ores
wer
e posi
tively c
orr
ela
ted t
o t
he
o
rga
niz
atio
n.
sta
nd
ard
), a
vera
ge o
vera
ll p
erf
orm
an
ce
rela
tion
ship
s o
f co
mm
un
su
perior-
subord
inate
mea
sure
s at
the g
rou
p
ratin
gs
give
n to
the s
tatio
ns
by
seve
ral
ica
tion
, sa
tisfa
ctio
n.
leve
l o
f an
alys
is.
Diffe
rin
g r
esul
ts f
ou
nd a
t ju
dges
. m
utu
al
un
de
rsta
nd
ing
, an
d in
fluence
ove
r opera
tions.
indiv
idual
and
intr
a g
rou
p l
evel
s o
f an
alys
is.
Ivance
vich &
Donnelly
31 s
ales
bra
nche
s o
f a
Eig
ht
arc
hiv
al
mea
sure
s — m
easu
ring
Qu
est
ionnaire t
appin
g
Coe
rciv
e an
d le
giti
ma
te p
ow
er
not
(19
70
) m
ark
etin
g o
rganiz
atio
n.
abse
nce, t
urn
ove
r, c
osts
and
effic
iency
. a
gro
up's
pe
rce
ptio
n o
f co
rrela
ted w
ith a
ny
of
the e
igh
t e
ffe
ctiv
en
ess
(N
= 3
94 i
nd
ivid
ua
ls).
or
ders
, an
d m
ark
et
fact
ors
, ta
ken o
ver
their l
eade
r's a
mo
un
t of
, m
easu
res.
Rew
ard
po
we
r ha
d on
e co
rrela
- a
24-w
eek
pe
rio
d p
rio
r to
and
fo
llow
ing
th
e liv
e p
ow
er
boiu
iiu
l-
tion .
cach
ing s
ign
ificn
nco
at
.06,
cxpuit 3
. a
dm
inis
tra
tion o
f a
leaders
hip
influ
ence
ere
nt, e
xpert
, re
wa
rd.
refe
rent
5, a
nd "
incr
em
en
tal
influence"
6.
qu
est
ion
na
ire
. co
erc
ive &
le
giti
ma
te)
plus
his "
incr
em
enta
l in
fluence
".
How
ever
, th
e h
igh
est r
was
-.3
2.
(exc
used
ab
senc
e an
d in
cre
me
nta
l in
fluence
)
Lie
bers
on & O
'Co
nn
or
167
com
panie
s lis
ted i
n
The s
ales
, net
earn
ings
, an
d p
rofit
Le
ad
ers
hip
cha
nges
Le
ader
ship
acc
ounte
d f
or
6% o
f sa
les, 7
%
(19
72
) M
oody'
s In
dust
rial
Man
ual
mar
gins
fo
r th
e c
ompa
nies
as
liste
d
in t
he t
wo m
anua
ls.
(pre
sident o
f co
mpany
or
cha
irm
an o
f b
oa
rd),
in
du
stry
typ
e,
posi
tion
net
earn
ings
, an
d 14
% p
rofit
ma
rgin
va
rianc
es.
The
se w
ere
sm
all
am
ounts
co
mpare
d t
o i
nd
ust
ry t
ype a
nd c
om
pany
and
Mo
od
y's
Tra
nsp
ort
atio
r M
anua
l ove
r th
e p
eriod
1946-6
5.
of
com
pany
with
in
the
indust
ry.
po
sitio
n v
aria
bles
.
Ma
ho
ne
y &
We
iUe
l M
embe
rs o
f 2
83
org
an
iza
- A r
atin
g o
f th
e
ove
rall
effect
iveness o
f 24
sta
tistic
al
fact
ors
in
R
=.7
6 f
or
all
24 d
imensi
ons, R
«.7
4 f
or
a
(19
69
) tio
na
l su
bu
nits f
rom
a
the su
bu
nit
by
the
subunit
superv
isor's
a
step
wis
e re
gres
sion
su
bset
of
seve
n.
variety
of
kinds
of
org
an
i-
sup
erio
r,
9-p
oin
t Lik
ert
scal
e.
equatio
n (
it w
as t
he
zatio
ns.
d
ep
en
de
nt
variable
).
Nea
ley
& B
loo
d (
19
68
) S
uper
viso
rs a
nd t
heir
F
our
Lik
ert r
atin
gs
of
the
un
its p
er-
V
arious
mea
sure
s o
f T
he L
PC
sco
res
for
seco
nd l
evel s
uper
-
un
its i
n a
ho
spita
l (2
2
form
an
ce b
y th
e u
nit'
s im
me
dia
te
unit s
uper
viso
rs.
LPC
, vi
sors
corr
ela
ted w
ith a
ll fo
ur
perf
orm
ance
imm
ed
iate
su
pe
rvis
ors
. su
pe
rvis
or, o
n s
cale
s o
f p
atie
nt
care
. LB
DQ
, ye
ars
exp
erience
, m
easu
res
of
the
unit.
None o
f th
e o
the
r
8 se
cond
lev
el s
uper
- kn
ow
led
ge o
f p
atie
nts
' nee
ds,
hum
an
W
onderlic I
Q,
este
em
varia
bles
sig
nifi
can
tly c
orr
ela
ted
.
viso
rs)
rela
tion
s an
d g
lob
al
perf
orm
ance
. fo
r im
me
dia
te s
ubord
i-
nate
s, a
nd e
xpert a
nd
leg
itim
ate
po
we
r.

Ove
rall
Effe
ctiv
enes
s (c
ont.)
-
Sou
rce
Sam
ple
Ope
ratio
nal
For
m
Rel
ated
To
Rel
atio
nshi
p F
ound
Olm
stea
d (1
972)
Row
land &
Sco
tt (
1968)
Sm
ith &
Arid
96
4)
Ta
nn
eb
au
m (
1961-1
962)
10 g
roup
s o
f 12
exp
erie
ncec
m
ilita
ry o
ffic
ers
perf
orm
ed
in
an
eig
ht
hour
lon
g
sim
ua
ltio
n o
f co
mp
an
y co
mm
anders
eng
aged
in
in
tern
al
defe
nse
opera
tions.
58 f
irst
lin
e s
uper
viso
rs a
nd
673 s
ub
ord
ina
tes
in t
wo
depart
ments
of
a na
val
am
mu
niti
on d
epot.
Natio
nw
ide d
eliv
ery
o
rga
niz
atio
n,
drive
rs a
nd
supe
rvis
ors, 3
2 s
epar
ate
sta
tion
s w
ith a t
ota
l o
f 1200 e
mpl
oyee
s co
mprise
d
the
sam
ple.
Str
atif
ied r
andom
sam
ple
of
104
of
1000 L
eagu
e o
f W
om
en
's V
ote
rs u
nits
.
Exp
erience
d f
ield g
rade
off
ice
rs u
sed
pre-
es
tabl
ishe
d cr
iteria t
o e
valu
ate
the g
rou
ps
on "
exte
nt
of
mis
sio
n a
ccom
plis
hm
ent"
.
Work
gro
ups
we
re r
ate
d b
y th
ree s
uperiors
ab
ove
the g
roup's s
uper
viso
r, o
n tw
o
10 p
oin
t sc
ales
- a
mo
un
t o
f w
ork
done
an
d qualit
y o
f w
ork
don
e.
Ave
rage
pro
ductivity f
or
a st
atio
n
(ave
rage
of
indiv
idual
pro
ductivity
sc
ores
), s
tatio
n m
em
ber
"Mo
rale
" sc
ores
(on
e q
ue
stio
nn
aire i
tem
).
Ove
rall
effect
iveness
ratin
g o
f ea
ch u
nit
by
29
judg
es f
am
ilia
r w
ith t
he u
nit (
5
poin
t sc
ale)
. A
vera
ge r
atin
g u
sed.
Mea
sure
s o
f fo
ur
com
po
ne
nts
of
Org
aniz
atio
nal
Com
pete
nce
— A
da
pt-
a
bili
ty,
Re
alit
y-te
stin
g,
Inte
gra
tion
, an
d Id
en
tity
derive
d f
rom
Bennis
' and
S
che
in's
wo
rk.
All
mea
sure
s w
ere
de
rive
d
from
ana
lysi
s o
f th
e gro
ups'
co
mm
un
ica
- tio
ns. •
Su
pe
rvis
or
LO
Q s
core
s (c
on
sid
era
tion
) ra
tings
of
sup
erv
iso
rs b
y su
per-
io
rs o
n s
even
sca
les
of
"up
wa
rd i
nflu
ence
", m
ea
sure
s o
f co
gniti
ve c
om-
ple
xity (
Ro
le C
on
stru
ct
Repert
ory
Te
st &
Bar
- ro
n W
elsh
Art S
cale
),
inte
lligence
(P
urdu
e A
dapta
bili
ty T
est
), a
nd
seve
ral
need
s (E
dw
ard
s P
erso
nal
Pre
fere
nce
Sch
edule
).
Mea
sure
s o
f to
tal
am
ou
nt
of
co
ntr
ol, d
e-
gree
of
de
mo
cra
tic
sup
erv
isio
n,
and
att
itu
di-
na
l co
nsen
sus
of
sta
tion
m
embe
rs.
Tota
l co
ntr
ol
and
de-
gree
of
de
mo
cra
tic f
orm
o
f co
ntr
ol
(use
s th
e
"co
ntr
ol
gra
ph
").
Co
rre
latio
ns
be
twe
en e
ffect
iveness
sco
res
and
the c
om
pete
nce
com
ponent
scor
es
we
re: .
96 (
rea
lity
test
ing),
.79 (
ad
ap
t-
abili
ty) .
22 (
inte
gra
tion), a
nd .
58
(identity
).
Co
rre
latio
n b
etw
ee
n e
ffect
ive-
ness
and C
om
pete
nce
( a
co
mp
osi
te o
f th
e
fou
r co
mp
on
en
ts)
was
.68.
Co
rre
latio
ns
we
re c
om
pu
ted
. T
he s
even
sc
ales
of
up
wa
rd i
nflu
ence
we
re a
ll hig
hly
posi
tively
co
rre
late
d w
ith t
he t
wo
effect
- iv
enes
s m
easu
res.
(p<
01), r
ange
of
r's =
.66
to
.92.
Ho
we
ver, n
ote
that
thes
e ar
e all
ratin
gs
by
the s
ame
pers
on (
the t
hre
e s
uper
- io
rs o
ver
the g
roup's s
up
erv
iso
r). N
o o
the
r m
easu
res
corr
ela
ted s
ign
ifica
ntly
with t
he
effect
iveness
mea
sure
s exc
ept
EP
PS
A
ggre
ssio
n (.
40 w
ith Q
ua
lity,
p^0
1).
Pro
duct
ivity
was
sig
nifi
can
tly p
osi
tive
ly
corr
ela
ted w
ith e
very
variable b
ut
dem
o-
cra
tic s
uperv
isio
n (
not
signifi
cant)
. M
ora
le
was
sig
nifi
cantly
posi
tively c
orr
ela
ted t
o
all
mea
sure
s.
(Mo
rale a
nd p
rod
uctivity
co
rrela
ted .
34).
Pa
rtia
l co
rrela
tions
(siz
e part
iale
d o
ut,
si
nce
it c
orr
ela
ted .
55 w
ith e
ffe
ctiv
en
ess
),
wer
e .2
9 a
nd .
31
, fo
r to
tal
co
ntr
ol
and
d
em
ocr
atic
contr
ol, r
esp
ect
ive
ly,
with
e
ffe
ctiv
en
ess
.

Ove
rall
Eff
ectiv
enes
s (c
on
t.)
Sou
rce
Sam
ple
Ope
ratio
nal
For
m
Kei
ated lo
R
elat
ions
hip
Fou
nd
Zald (
1967-1
968)
37 u
nit
s in a
YM
CA i
n m
etro
po
litan
Chi
cago
. U
nit
s w
ere
rate
d b
y tw
o p
erso
ns w
ho
kn
ew t
hei
r o
per
atio
ns
wel
l on
th
ree
phas
es —
"o
vera
ll ef
fici
ency
", "
qu
alit
y o
f p
rog
ram
min
g", a
nd "
bo
ard o
f d
irec
tors
str
eng
th".
U
sed
forc
ed
com
par
iso
n r
anki
ng p
roce
du
re.
Sev
eral d
emo
gra
ph
ic
vari
able
s p
ecu
liar
to
the
geog
raph
ic a
rea
wer
e re
late
d t
o t
he
effe
ctiv
enes
s va
riab
les.
Per
cent
age
of
busi
ness
lea
ders
on
bo
ard
o
f d
irec
tors
, n
um
ber
of
peop
le e
mp
loye
d
in t
he a
rea,
and
exp
ense
s o
f th
e u
nit a
ll co
rrel
ated
po
siti
vely
wit
h t
he t
hre
e ra
tings
of
effe
ctiv
enes
s.
Per
cent
age
of
mid
dle
-man
agem
ent
bo
ard o
f d
irec
tor»
m
embe
rs c
orr
elat
ed n
egat
ivel
y w
ith t
he
ratin
gs.
-E-

50.
Producti vi ty
Productivity has been measured at three levels: individual, group, and total organization and is usually defined as the quantity or volume of the major product or service that the organization provides and is generally measured by using organization records of some sort. Ratings are also employed, and in at least one case, observation of ongoing work was used to obtain a measure of production. Some examples of each of these are as follows.
Organization Records (Archives).
Parker (1963, 1965) and Katzel1, Barrett, and Parker (1961) conducted their research in pharmaceutical warehouses and used units per man- hour (units being items processed in filling orders) for a productivity measure. This figure was computed for an entire warehouse and thus is a measure of a total organization's productivity. Lodahl and Porter (1961) and Rosen (1970) computed work group productivity measures from organization records. The former authors used the monthly percentage of time standards achieved by each work group (their sample consisted of maintenance shop work groups for an airline), standardized for work centers within the shop. Rosen, studying workers in a furniture fac- tory, used mean quantities produced for a work group productivity mea- sure. Kavcic, Rus, and Tannenbaum (1971) used net productivity per worker, average wages per worker, and ratio of organization income to costs (all in dollars) as measures of productivity. Their sample was taken from four manufacturing plants in Yugoslavia. Finally, Marcus (1971), studying welfare case workers, used the proportion of visits made by individual case workers to clients' homes as a measure of producti vi ty.
Whitely and Frost (i960, though not constructing any measures of their own, mentioned the following as measures that have been used to indi- cate the productivity of individual researchers or groups of researchers (in form of sums or means): number of papers published, number of books authored, awards received, positions held in scientific bodies, and editorships held. Box and Cotgrove (1968) employed addresses to scien- tific societies and patents as measures of researcher production, besides published papers.
The Michigan researchers (Bowers, 1964; Seashore & Yuchtman, 1967) de- rived statistical factors based on organization records that purportedly measure productivity. Both studies utilized analysis of 70 or more variables from records obtained from a large number of insurance agen- cies. Three different factors that seemed to tap productivity were

51
found: "Business Volume," defined by policies in force, new sales, renewal premiums, lives insured, and manpower; "Member Productivity," defined primarily by one variable, new business per agent; and "New Member Productivity," defined by production per new agent and ratio of new to old agents. This study will be discussed in some detail in a later section.
Rat ings.
Several studies illustrate the use of subjective measures of produc- tion. Box and Cotgrove (1968) asked scientists to rate "how normal they regarded their research performance in comparison to other sci- entists engaged in similar work." Somewhat similarly, Meltzer and Salter (1962) asked physiologists to report how many papers they had published in the previous three years* This is highly similar to archival records and should, of course, be identical to such measures (mentioned above), if the physiologists reported accurately.
Student O968) and Kavcic, Rus, and Tannenbaum (1971) used ratings by others, not self-ratings, as productivity measures. Student had man- agers of appliance manufacturing plant work groups rate the groups on the extent to which the work group stayed ahead of or on schedule, and/or required additional help to stay on schedule. Kavcic et al. had 17 "experts" rank order four Yugoslavian industrial plants in- terims of their productivity (no definition given to the experts, just the term itself).
Mahoney and Weitzel (1969) had managers at least one step higher than the immediate supervisor of a work group or organizational unit rate the unit on a number of effectiveness indicators. Factor analyses of data obtained from 283 organizational units suggested the existence of a productivity factor. This study will also be discussed in some detail in a later section.
Observation.
Beek (1964) used several observational measures, all converging on percentage of a work cycle (an assembly line was being observed) that was idle or wait time. This is an inverse measure of productivity, of course.
Relationship to Other Variables. The relationship of productivity, however it has been measured, to other variables is generally unclear. Several studies that operationalized productivity and then related it to some other variable are summarized in the index. There appears to be no simple summary of these studies.

52.
Attitudinal variables tapped by perceptual measures sometimes appear to have little relationship to productivity or to be complexly related (Bowers, 1964; Box & Cotgrove, 1968; Lodahl 6 Porter, 1961; Student, 1968). However, Katzell, Barrett, and Parker (1961) found satisfac- tion positively correlated with productivity, and Marcus (1962) found work group cohesion and perceptions of supervisor orientation related to productivity. Kavcic et al. (1971) found several attitudinal vari- ables related to productivity but their N was very low and their re- sults are at best suggestive. Finally, Parker (1963) found significant correlations between productivity and attitudes about recognition and performance instrumentality.
Meltzer and Salter (1962) found no relationship between productivity and organization size while Parker (1963) found a negative relation- ship.
Katzell et al. (1961) found productivity positively related to profit and an efficiency measure (product-value productivity), and Meltzer and Salter found a positive relationship between the funds available to an organization and its productivity.
Seashore and Yuchtman (1967) examined the stability of the scores on their productivity factors over a ten-year period, with mixed results, one factor being unstable, another moderately so, and the third highly stable.
Summary.
Productivity has been measured in many ways and its relationships with several types of other variables have been examined. However, due to the uniqueness of its measurement generalizations are difficult to come by.

Pro
du
ctiv
ity
Sou
rce
Sam
ple
Op
era
tio
na
l F
orm
R
elat
ed T
o R
elat
ions
hip
Fou
nd
Bee
k (1
964)
Ass
embl
y lin
e w
ork
ers,
Lo
sses
in
pro
du
ctio
n t
ime
(du
e to
: N
o o
ther
fo
rmal
Lo
sses
in
pro
du
ctio
n t
ime
wer
e de
crea
sed.
N
=22
6, i
n an
ele
ctro
nic
s w
aiti
ng f
or
mat
eria
l, va
riat
ion
s in
va
riab
les, a
uth
or
pla
nt
in t
he
Net
her
lan
ds.
in
div
idu
als
wo
rk s
peed
s) a
s m
easu
red
by
ob
serv
atio
n o
f th
e as
sem
bly
lines
, ex
pres
sed
as p
erce
ntag
e o
f w
ork
cyc
le
that
is
wai
t ti
me.
inst
itu
ted e
xper
imen
tal
chan
ges
in t
he t
ech
no
- lo
gica
l o
rgan
izat
ion o
f th
e as
sem
bly
line.
Bow
ers, (
1964)
40 l
ife
insu
ranc
e ag
enci
es.
Sta
tist
ical f
acto
r d
eriv
ed f
rom
fac
tor
Est
imat
es b
y ag
ents
of
No
t si
gn
ific
antl
y co
rrel
ated
wit
h "
tota
l an
alys
is o
f 70 a
rchi
val
per
form
ance
"t
ota
l co
ntr
ol"
, co
ntr
ol
con
tro
l",
and
on
ly s
ign
ific
antl
y co
rrel
ated
re
cord
s.
Cal
led "
Bus
ines
s vo
lum
e".
at 4
lev
els
of
the
to c
on
tro
l at
one
of
the
4 le
vels
of
the
a m
easu
re o
f d
olla
r vo
lum
e fo
r th
e o
rgan
izat
ion
, an
d an
o
rgan
izat
ion (
.31
,p<
;05
).
Sig
nif
ican
tly
agen
cy d
uri
ng p
revi
ous
year
s.
over
all
effe
ctiv
enes
s ra
nki
ng b
y co
mp
any
off
icia
ls.
corr
elat
ed w
ith o
vera
ll ef
fect
iven
ess
rank
ing. (
.53, p
«.05
)
Bo
x&
Co
tgro
ve (
19
68
) E
ight
res
earc
h la
bo
rato
ries
T
wo m
easu
res, b
oth
in
div
idu
al i
n n
atu
re
Mea
sure
s o
f "O
rgan
i-
Inte
ract
ive
rela
tio
nsh
ip b
etw
een "
fre
ed
om
".
in c
hem
ical a
nd p
har
ma-
b
ut
sum
med
or
aver
aged
to g
et o
rgan
i- za
tio
nal F
reed
om
" "d
edic
atio
n",
and
sub
ject
ive
pro
du
ctiv
ity.
ce
utic
al i
ndus
trie
s.
zati
on
al s
core
s.
Ob
ject
ive
mea
sure
—
and
"Ded
icat
ion t
o
Bo
th v
aria
bles
wer
e d
irec
tly
rela
ted t
o
nu
mb
er o
f pu
blis
hed
pape
rs,
scie
nti
fic
Sci
ence
".
num
ber
of
pu
blic
atio
ns, b
ut
no
t p
aten
ts.
soci
ety
addr
esse
s, p
aten
ts.
Su
bje
ctiv
e m
easu
re —
ask
ed s
cien
tists "
ho
w n
orm
al
they
reg
arde
d th
eir
rese
arch
per
form
- an
ce i
n co
mp
aris
on t
o
oth
er s
cien
tists
en
gage
d in
sim
ilar
wo
rk".
Kit
zell,
Bar
rett
, &
72 w
hole
sale
war
eho
usi
ng
N
um
ber
of
pro
du
cts
proc
esse
d in
F
ou
r o
ther
mea
sure
s o
f S
ign
ific
antl
y p
osi
tive
ly c
orr
elat
ed w
ith p
rofi
t P
arke
r (1
961)
divi
sion
s in t
he
drug
and
ti
llin
g o
rder
s pa
r m
an h
our
ot
pro
du
ctio
n.
effe
ctiv
enes
s (q
ual
ity.
an
d p
rod
uct
-val
ue
pro
du
ctiv
ity, n
egat
ivel
y p
har
mac
euti
cal
ind
ust
ry.
(Agg
rega
te f
igu
re f
or
an e
nti
re w
are-
p
rofi
t, p
rod
uct
-val
ue
corr
elat
ed w
ith f
ou
r o
f th
e fi
ve s
itu
atio
nal
ho
use)
p
rod
uct
ivit
y, &
tu
rn-
ove
r),
five
situ
atio
nal
va
riab
les, a
nd s
core
s on
a
sati
sfac
tio
n q
ues
tio
n-
nai
re.
vari
able
s (w
hic
h m
ean
t th
at w
areh
ouse
s in
sm
all
tow
ns
wer
e m
ore
pro
du
ctiv
e th
an
larg
e-ci
ty w
areh
ou
ses)
, p
osi
tive
ly c
or-
re
late
d w
ith s
atis
fact
ion
.
Kau
cic, R
us.
&
Fo
ur
man
ufa
ctu
rin
g
Sev
ente
en e
xper
ts r
ank
ord
ered
th
e fo
ur
Qu
esti
on
nai
re m
easu
res
Gen
eral
ly,
posi
tive
rela
tio
nsh
ips
fou
nd
. T
ann
enb
aum (
19
71
) pl
ants
in
Yug
osla
via.
pl
ants
acc
ord
ing t
o t
hei
r p
rod
uct
ivit
y.
of
con
tro
l, p
arti
cip
a-
Sco
res
on p
rod
uct
ivit
y ra
nke
d t
he
pla
nts
an
d us
ed t
hre
e ar
chiv
al r
ecor
ds —
net
pro
- tiv
enes
s, a
nd j
ob m
oti
va-
the
sam
e as
sco
res
on t
he
oth
er m
easu
res
du
ctiv
ity
per
wo
rker
, av
erag
e w
ages
per
ti
on
, in
volv
emen
t an
d
in m
ost
case
s.
Lo
w N
(4) p
reve
nte
d a
ny
wo
rker
, an
d ra
tio o
f in
com
e to
cos
ts —
id
enti
fica
tio
n.
stat
istic
al s
igni
fican
ce t
esti
ng
. al
l in d
olla
r te
rms.
\J
->

Pro
du
ctiv
ity (
cont.)
Sou
rce
Sam
ple
Ope
ratio
nal
For
m
Rel
ated
To
Rel
atio
nshi
p F
ound
Lo
da
hl&
Po
rte
r (1
96
1)
62 g
roup
s o
f sh
op w
ork
ers
M
on
thly p
erce
ntag
e o
f tim
e s
tand
ards
T
he S
uperv
isory A
bili
- V
ariable
s w
ere
co
rre
late
d,
on
ly 8
of
34
at
a m
ain
tenance
bas
e o
f ac
hiev
ed b
y th
e g
roup,
sta
nd
ard
ize
d f
or
ties
and
Deci
sion M
aki
ng
co
rre
latio
ns
wer
e si
gn
ifica
nt
at .
10 l
evel o
r an
airlin
e.
their w
ork
ce
nte
r (
sim
ilar
kinds
of
work
A
pp
roa
ch s
cale
s o
f lo
wer.
In g
ener
al t
he D
MA s
cale
s sc
ores
perf
orm
ed i
n a
cente
r)
Gh
ise
lli's
Se
lf-D
esc
rip
tion
In
ven
tory
, a
mea
sure
of
wo
rk g
rou
p c
ohesi
on,
and
need
for
coopera
tior
with o
the
r g
rou
ps.
wer
e unre
late
d t
o p
rod
uctivity o
f th
e g
rou
p,
wh
ile s
ome
pa
tte
rns
of
the S
up
erv
iso
ry
scal
e w
ere
rela
ted t
o P
rod
uctivity.
Au
tho
rs
con
clu
de t
hat
no s
imp
le e
xpla
na
tion
a
cco
un
ted f
or
the r
ela
tionsh
ips
that
we
re
fou
nd
.
Mar
cus
(1962)
12 w
ork
gro
up
s o
f ca
se-
Pro
port
ion o
f vi
sits
mad
e b
y w
ork
ers
to
M
easu
res
of
cohesi
on
M
ore
cohe
sive
un
its w
ere
les
s pro
duct
ive.
work
ers
in
an u
rban D
ep
t.
the c
lien
ts' h
omes
. (w
ork
ers
na
me
d t
he
ir
and
gro
up
s w
ith "
gro
up-o
riente
d"
sup
erv
iso
rs
of
Welfa
re,
5 ca
sew
orke
rs
5 be
st f
riends
in t
he
w
ere
mor
e p
rod
uct
ive t
ha
n "
pro
ced
ure
- an
d a
superv
isor
per
gro
up
. o
ffic
e a
nd t
he o
ral
inte
ract
ion o
f w
ork
ers
w
as o
bse
rved), a
nd
superv
isor
orienta
tion,
("p
roce
du
re"
or
"gro
up
' oriente
d)'
orie
nte
d"
gro
up
s.
Auth
or
report
s no
q
ua
ntit
ativ
e d
ata
, only c
on
clu
sio
ns.
Meltz
er&
Salte
r (1
962)
Mai
l su
rvey
of
786
S
elf-
report o
f n
um
be
r o
f pa
pers
pu
b-
Six v
aria
ble
s:
freedom
, S
ize
of
org
an
iza
tion n
ot
rela
ted t
o
ph
ysio
log
ists
. lis
hed
in t
he p
revi
ous
3 y
ears
. ch
ance
to d
o g
ood job,
funds
avai
labl
e in o
rg.,
ad
equa
cy o
f fa
cilit
ies,
a
bili
ty,
and
institu
tion
ty
pe —
as
we
ll as
siz
e of
and
leve
ls in th
e o
rga
niz
atio
n.
pro
du
ctivity,
num
bers
of
leve
ls i
s re
late
d
(cu
rvili
ne
ary
).
This l
atter
eff
ect
app
ears o
nly i
n la
rge
org
aniz
a-
tionsj
when s
ize
is c
ontr
olle
d.
All
but
"Fa
cili
tie
s"
of
the o
the
r si
x va
riable
s we
re s
igni
fican
tly r
elat
ed to
pro
duct
ivity
.
Par
ker
(1963)
80 w
areh
ouse
s o
f a
Nu
mb
er
of
item
s pr
oces
sed
pe
r m
an-
Mea
sure
s o
f w
ork
gro
up
S
ign
ifica
nt
corr
ela
tion
s w
ith p
rod
uctivity
pharm
ace
utic
al
com
pany.
hour
of
pro
duct
ion.
attitu
des
(tow
ard
sup
er-
wer
e fo
und f
or
war
ehou
se s
ize, -
.25 (
p<
.05).
N
=1716 w
ork
gro
ups.
vi
sion,
reco
gniti
on,
and
inst
rum
enta
lity
of
per-
fo
rma
nce
), s
up
erv
iso
ry
reco
gn
itio
n,
.25 (
p<
05
), a
nd p
erf
orm
an
ce
inst
rum
enta
lity
.52 (
p<
.01).
behavi
or
(LO
Q), a
nd
si
tuatio
nal
varia
bles
(w
areh
ouse
siz
e, s
ecu
rity
w
age
rate
, unio
niz
atio
n,
and
perc
enta
ge m
ales
).
\J-1 x-
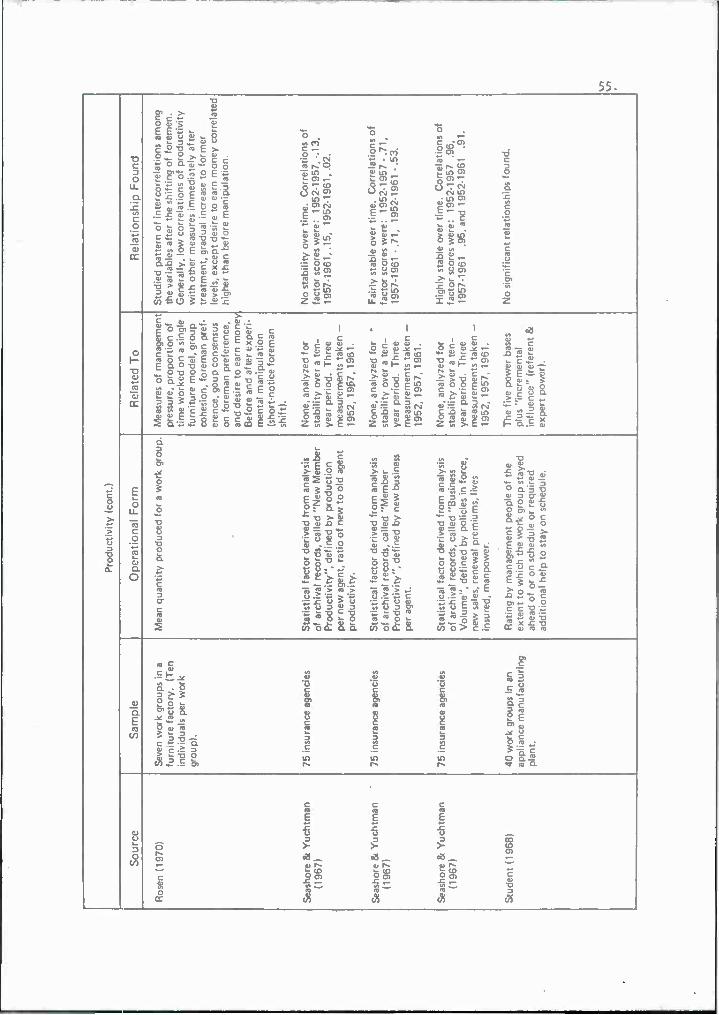
Pro
du
ctiv
ity
(co
nt.
)
Sou
rce
Sam
ple
Ope
ratio
nal
For
m
Rel
ated
To
Re
lati
on
sh
ip F
ou
nd
Ros
en (
19
70
) S
even
wo
rk g
roup
s in a
M
ean
qu
anti
ty p
rod
uce
d f
or
a w
ork
gro
up
. M
easu
res
of
man
agem
ent
Stu
die
d p
atte
rn o
f in
terc
orr
elat
ion
s am
ong
furn
itu
re f
acto
ry.
(Ten
pr
essu
re,
pro
po
rtio
n o
f th
e va
riab
les
afte
r th
e sh
ifti
ng o
f fo
rem
en.
indi
vidu
als
per
wo
rk
tim
e w
ork
ed o
n a
sin
gle
Gen
eral
ly,
low
co
rrel
atio
ns
of p
rod
uct
ivit
y g
rou
p).
fu
rnit
ure
mo
del
, g
rou
p
cohe
sion
, fo
rem
an p
ref-
er
ence
, g
ou
p c
onse
nsus
on
fo
rem
an p
refe
ren
ce,
and
desi
re t
o e
arn
mo
ney
B
efo
re a
nd a
fter
txp
eri
- m
enta
l m
anip
ula
tio
n
(sh
ort
-no
tice
fo
rem
an
shif
t).
wit
h o
ther
mea
sure
s im
med
iate
ly a
fter
tr
eatm
ent, g
radu
al i
ncre
ase
to f
orm
er
leve
ls,
exce
pt
desi
re t
o e
arn
mo
ney
co
rrel
ated
hi
gher
th
an b
efo
re m
anip
ula
tio
n.
Sea
shor
e & Y
uch
tman
75
ins
uran
ce a
genc
ies
Sta
tist
ical
fac
tor
der
ived
fro
m a
naly
sis
No
ne,
an
alyz
ed f
or
No s
tab
ility
ove
r ti
me.
Co
rrel
atio
ns
of
(1967)
of
arch
ival r
ecor
ds,
calle
d "N
ew
Mem
ber
st
abili
ty o
ver
a te
n-
fact
or
scor
es w
ere:
1
95
2-1
95
7,
-.1
3,
Pro
du
ctiv
ity"
, d
efin
ed b
y p
rod
uct
ion
ye
ar p
erio
d.
Th
ree
1957-1
961,.15,
19
52
-19
61
,.0
2.
per
new
ag
ent, r
atio
of
new
to o
ld a
gent
m
easu
rem
ents
tak
en —
p
rod
uct
ivit
y.
1952,1
967,1
961.
Sea
shor
e & Y
uch
tman
75 i
nsur
ance
age
ncie
s S
tati
stic
al f
acto
r de
rive
d fr
om
ana
lysi
s N
on
e, a
nal
yzed
fo
r
* F
airl
y st
able o
ver
tim
e.
Co
rrel
atio
ns
of
(19
67
) o
f ar
chiv
al r
ecor
ds,
calle
d "M
emb
er
stab
ility
ove
r a
ten
- fa
cto
r sc
ores
wer
e:
19
52
-19
57 - .
71,
Pro
du
ctiv
ity"
, d
efin
ed b
y n
ew b
usin
ess
year
per
iod
. T
hre
e 1957-1
961-.
71,
1952-1
961-.
53.
per
agen
t. m
easu
rem
ents
tak
en —
1952,1
957,1
961.
Sea
shor
e & Y
uch
tman
75 i
nsur
ance
age
ncie
s S
tati
stic
al f
acto
r d
eriv
ed f
rom
ana
lysi
s N
on
e, a
nal
yzed
fo
r H
igh
ly s
tabl
e o
ver
tim
e.
Co
rrel
atio
ns
of
(1967)
of
arch
ival r
ecor
ds,
calle
d "B
usin
ess
stab
ility
ove
r a
ten
- fa
cto
r sc
ores
wer
e:
1952-1
957
.96,
V
olu
me",
def
ined
by
polic
ies
in f
orc
e,
year
per
iod
. T
hre
e 19
57-1
961
.
95,
and
1952
-196
1
.91.
ne
w s
ales
, re
new
al p
rem
ium
s, l
ives
m
easu
rem
ents
tak
en —
in
sure
d, m
anp
ow
er.
1952
, 1
95
7,1
96
1.
Stu
den
t (1
96
8)
40 w
ork
gro
ups
in a
n R
atin
g b
y m
anag
emen
t pe
ople
of
the
Th
e fi
ve p
ow
er b
ases
N
o s
ign
ific
ant
rela
tio
nsh
ips
fou
nd
.
appl
ianc
e m
anu
fact
uri
ng
ex
ten
t to
wh
ich t
he
wo
rk g
roup
sta
yed
plus
"in
crem
enta
l p
lan
t.
ahea
d o
f o
r o
n s
ched
ule
or
req
uir
ed
add
itio
nal h
elp t
o s
tay
on s
ched
ule.
in
flu
ence
" (r
efer
ent
&
exp
ert
po
wer
).
U1

56.
Efficiency
Efficiency is usually thought of in terms of a ratio that reflects a comparison of some aspect of unit performance to the costs incurred for that performance. There have been relatively few attempts to operationalize this concept, and all but one of these is a measure taken directly from organization records or a factor derived from such records.
Seashore and Yuchtman (1967) and Bowers (1964) used factor analytic techniques to derive factors that reflect costs and/or efficiency. Seashore and Yuchtman's factors were called "Maintenance Cost," defined by the variables of cost per collection, and cost per $100 of premium; and "Production Cost," defined as cost per sale, cost per $1000 (of insurance face value, I assume), and cost per $100 premium. Bowers' factor was named "Business Costs" and was defined by the var- iables of business unit costs and renewal business costs.
Katzell, Barrett, and Parker (1961) operationalized a variable they called "product-value productivity" by computing the sales dollar value per man hour of production. This figure was an aggregation over individuals and was intended to reflect the efficiency of an entire pharmaceutical warehouse.
Student (1968) broke costs into four categories and then had managers rate work groups on these four categories. The cost categories were: indirect--amount of labor used by a work group in production; mainten- ance—amounts used for maintenance; supply-allowance for supplies; and scrap--amounts for scrap and rework.
Many authors attempt to define efficiency and suggest ways for measur- ing it (Davis 6 Valfer, 1966; Henderson & Dearden, 1966; Katz & Kahn, 1971; Kuin, 1968; Goodman, 1970; Likert, 1967; Likert & Bowers, 1969; McCleod, 1971 ; Thompson, 1967; Whitely & Frost, 1970, but few have actually attempted such measurement. Some of these suggested methods are waste and scrap figures, down time, performance against a schedule, transfer pricing, marginal costs, schedule overruns, and labor produc- tivity. Most of them are archival in nature as were the operational- ized versions actually used in the priviously mentioned research studies.
Relationship to Other Variables.
Efficiency has been found to be negatively correlated with the following variables: total control in an organization, amount of control at specific hierarchical levels, overall effectiveness (Bowers, 1964), and

57.
"urbanization'- measure (Katzell et al., 1961), and "coercive" power (Student, 1968). It has been found positively related to profit (Katzell et al., 1961), expert power, referent power, reward power, and "incremental influence" or expert plus referent power (Student, 1966).
Seashore and Yuchtman investigated the stability of the scores on their factors reflecting costs or efficiency, finding intermediate stability over a ten-year period.
Summary.
Efficiency usually has been measured by archival data and its rela- tionship to other variables has been sparsely Investigated. What has been done yields no conclusive statement.

Effi
cien
cy
So
urc
e
Sam
ple
O
pera
tional
Form
R
ela
ted T
o
Rela
tionsh
ip F
ou
nd
Bow
ers
(1954)
40 I
nsur
ance
Age
ncie
s S
tatis
tical
fact
or
base
d on
arc
hiv
al
Est
imat
es b
y ag
ents
of
The f
act
or
corr
ela
ted -
.55
with "
tota
l re
cord
s, c
alle
d "
Busi
ness
Cost
s".
"to
tal
contr
oi"
, co
ntr
ol
at s
ever
al l
evel
s o
f th
e
wh
ole
org
aniz
atio
n,
and
an o
vera
ll effect
iveness
ra
nki
ng b
y co
mp
an
y O
ffic
ials
.
contr
ol"
, (p
<,0
05), -
.44 w
ith o
vera
ll effect
iveness
ra
nki
ng (
p<
.05), a
nd w
as
also
sig
nifi
cantly
negativ
ely c
orr
ela
ted w
ith
a
mo
un
t o
f co
ntr
ol
at
thre
e o
f fo
ur
leve
ls o
f o
rga
niz
atio
n.
(p<
.05
).
Katz
ell. B
arr
ett,
& P
arke
r 72
who
lesa
le w
are
housi
ng
S
ales
do
llar
valu
e pe
r m
an-h
our
of
Oth
er
org
an
iza
tion
al
Ne
ga
tive
ly r
ela
ted t
o "
urb
an
iza
tio
n",
(1
96
1)
div
isio
ns,
dru
g &
pharm
a-
pro
duct
ion (
ove
r e
ntir
e w
areh
ouse
) p
erf
orm
an
ce m
easu
res:
posi
tively
co
rre
late
d w
ith p
rofit, n
o
ceutic
al
pro
du
cts
pro
fit,
.qu
alit
y,
turn
- ove
r & a
n "u
rbaniz
a-
tion m
ea
sure
."
rela
tion t
o q
ua
lity o
r tu
rno
ver.
Sea
shor
e & Y
uch
tman
75
Ins
uran
ce A
genc
ies
Sta
tistic
al
facto
r ba
sed
on a
rch
iva
l N
on
e,
an
aly
zed f
or
Inte
rmedia
te s
tabili
ty c
orr
ela
tion
s of
(19
67
) re
cord
s, c
alle
d "
Ma
inte
na
nce
Co
st"
sta
bili
ty o
ver
an 1
1 -y
r.
period,
thre
e m
easu
re-
facto
r sc
ores
were
:
1952-1
957 = .
60,
1957-1
961 =
.3
3,
1952-1
961 =
.24.
ments
take
n,
1952,
1957,
1961
. .
Sea
shor
e & Y
uch
tman
75 I
nsur
ance
Age
ncie
s S
tatis
tical
fact
or
base
d on a
rch
iva
l N
on
e,
an
aly
zed f
or
Inte
rmedia
te s
tabili
ty,
corr
ela
tion
s o
f (1
96
7)
reco
rds,
calle
d "
Pro
duct
ion C
ost"
sta
bili
ty o
ver
an 1
1-y
r.
period,
thre
e m
easu
re-
ments
take
n,
1952,
1957
, 1961.
facto
r sc
ores
were
: 1
952-1
957 =
.4
1,
1957-1
961
= .6
1,
1952-1
961
= .3
3.
Stu
dent
(1968)
40 a
pp
lian
ce m
an
ufa
ctu
rin
g
Managem
ent
ratin
gs
of
work
gro
up
F
ive
po
we
r so
urce
s,
Ind
ire
ct
eff
icie
ncy
str
on
gly r
ela
ted t
o
pla
nt
wo
rkg
rou
ps
eff
icie
ncy
in f
ou
r ar
eas:
ind
ire
ct,
ma
inte
n-
(Fre
nch
& R
aven
) re
fere
nt
po
we
r, m
odera
tely t
o e
xpe
rt a
nd
ance
, su
pp
ly,
scra
p.
corr
elat
ions
. re
fere
nt;
Main
tenance
ne
ga
tive
ly r
ela
ted
to
coerc
ive p
ow
er, s
upply p
osi
tively r
ela
ted
to
exp
ert a
nd r
ew
ard p
ow
er, s
crap
posi
tively
re
late
d t
o r
efe
ren
t p
ow
er.
Incr
em
enta
l in
fluence
(exp
ert p
lus
refe
ren
t) r
ela
ted
sc
rap
and
sup
ply e
ffic
iency
.
CD

59,
Profit
Profit is typically thought of as the amount of revenue from sales left after all costs and obligations are met. It is sometimes given further meaning by thinking of it as a return on the investment used in running the organization from the owner's point of view or as a percent return on total sales.
Almost exclusively, profit is measured by archival records. Katzell, Barrett, and Parker (1961) used the ratio of profit to total dollars of sales as a measure of "profitability" (pharmaceutical warehouses comprised their sample). Stagner (1969) computed two kinds of profit measures: profit as a percentage of sales and profit as a percentage of capital (or return on investment). He took his figures from Fortune's data on the top 500 American firms. Lawrence and Lorsch (1967) employed several varieties of profit measures—change in profits over the last five years, change in sales volume over the last five years, and percentage of current sales volume accounted for by products developed within the last five years. The last two measures are actu- ally not profit per se, but are closely related.
Kavcic, Rus, and Tannenbaum (197') employed a unique approach. Rather than using archival records to obtain profit figures, they used a panel of experts to rank order four plants in terms of their "economic suc- cess." These plants were located in Yugoslavia.
Operationalizing the profit variable is largely an accounting task. In most cases, the necessary figures are obtainable in company records and it remains to compute the measure. However, even in the four studies cited here, we can see that several methods of computing profit exist. Also, in the workaday world, profit is not always computed so as to reflect the performance of the organization but to serve some other end, For example, profits are taxable and it may be In the organization's best interest to keep them hidden.
Relationship to Other Variables.
The relationship of profit to other measures Is complex, since it is affected by many factors beyond the organization's control, such as the general state of the economy. Stagner found that scores on four sta- tistical factors (cohesiveness, formality in decision making, decen- tralization, and personalized management) did discriminate significantly (p<.01) between the top and bottom thirds (in terms of profit) of his sample of 109 large firms. Katzell et al., found profit negatively correlated with five measures of the "urbanization" of pharmaceutical

60.
warehouses, but positively correlated with measures of quantity pro- duced, efficiency, and worker satisfaction. They found no relation- ship between profit and quality of work or turnover.
Kavcic et al. found profit positively related to measures of control, participating motivation, involvement, and identification in four Yugoslavian manufacturing plants. However, since N equals only four, these results are best viewed as suggestive.
Finally, the Lawrence and Lorsch results seemed to indicate that organizations with high "differentiation" and high "integration" (that is, diverse subunits to meet diverse environments, but effectively tied together) were effective and had higher profits. However, their study sacrificed methodological rigor to explore new areas, as they themselves readily point out.
Summary.
Profit is usually computed from archival records, though the methods of deriving the index seem to vary considerably. It seems that profit Is positively related to most other measures of organizational well-being. When an organization is making money it appears that all seems well.

Pro
fit
Sou
rce
Sam
ple
Ope
ratio
nal
For
m
Hei
atec
i IO
R
elat
ions
hip
Fou
nd
Kat
ze». B
arre
tt,
& P
arke
r 72
wh
ole
sale
war
eho
usi
ng
N
et p
rofi
t fr
om
sal
es a
s a
rati
o t
o t
ota
l O
ther
org
aniz
atio
nal
S
ign
ific
antl
y n
egat
ivel
y co
rrel
ated
wit
h
(1961)
divi
sion
s, d
rug a
nd p
har
m-
dolla
rs o
f sa
les.
p
erfo
rman
ce m
easu
res:
al
l fi
ve m
easu
res
of
"urb
an
izati
on
" (s
mal
l ac
euti
cal
pro
du
cts.
q
uan
tity
, ef
fici
ency
, q
ual
ity,
tu
rno
ver;
fi
ve m
easu
res
of
"urb
aniz
atio
n",
and
sa
tisf
acti
on
.
tow
n w
areh
ouse
s m
ore
pro
fita
ble
th
an
larg
e cit
y w
areh
ou
ses)
, p
osi
tive
ly c
orr
elat
ed
wit
h q
uan
tity
, ef
fici
ency
(p
rod
uct
-val
ue
pro
du
ctiv
ity)
, n
ot
corr
elat
ed w
ith q
ual
ity
or t
urn
ove
r.
Sig
nif
ican
tly
po
siti
vely
co
r-
rela
ted w
ith s
atis
fact
ion
.
Kav
cic, R
us,
&
Fo
ur
man
ufa
ctu
rin
g p
lant
s R
anki
ngs
of
the
plan
ts b
y 17
"ex
per
ts"
Qu
esti
on
nai
re m
easu
res
Pos
itive
rel
atio
nsh
ips
in a
ll ca
ses, t
ho
ug
h
Tan
nen
bau
m (
19
71
) in
Yu
go
slav
ia,
N r
ange
d in
ter
ms
of
thei
r ec
on
om
ic s
ucce
ss.
of
con
tro
l, p
arti
cip
a-
no s
igni
fican
ce f
igur
es r
epo
rted
(d
ue
to
fro
m 6
50
- 19
95,
pla
nts
tiv
enes
s, a
nd m
oti
vati
on
. lo
w n
, 4
).
man
ufa
ctu
red r
ub
ber
, sh
oes
invo
lvem
ent, i
den
tifi
- w
oo
d p
rod
uct
s (2
).
cati
on
.
Law
ren
ce &
Lor
sch
(19
67
) In
terv
iew
s an
d q
ues
tio
n-
Th
ree
arch
ival m
easu
res,
cha
nge
in
Sev
eral m
easu
res
of
Res
ults
dif
ficu
lt t
o s
um
mar
ize,
bu
t se
em t
o
nair
es o
n 2
16 m
anag
ers.
p
rofi
ts f
or
prev
ious
fiv
e ye
ars, c
hang
e o
rgan
izat
ion
al d
iffe
ren
- in
dic
ate
that
org
aniz
atio
ns
wit
h b
oth
hig
h sc
ient
ists
, an
d en
gine
ers
in s
ales
vo
lum
e fo
r p
revi
ou
s fi
ve
tiat
ion
, in
teg
rati
on
, an
d d
iffe
ren
tiat
ion a
nd h
igh
inte
gra
tio
n w
ere
in s
ix o
rgan
izat
ion
s in t
he
year
s, p
erce
nt
of
curr
ent
sale
s vo
lum
e m
embe
rs g
oal,
tim
e.
mo
st e
ffec
tive
in
the
par
ticu
lar
envi
ron
men
ts
chem
ical i
nd
ust
ry.
acco
un
ted f
or
by
pro
du
cts
dev
elo
ped
an
d in
terp
erso
nal
th
ese
org
aniz
atio
ns
had
. H
ow
ever
, as
th
e w
ith
in t
he
last
fiv
e ye
ars.
Org
aniz
a-
ori
enta
tio
ns,
and
mod
es
auth
ors
stat
e, m
any
met
ho
do
log
ical
ti
on
s w
ere
ran
ked o
n th
ese
indi
ces.
o
f co
nfl
ict
reso
luti
on
. "n
icet
ies"
wer
e ig
nore
d in
thi
s st
ud
y.
Sta
gner (
1969)
109
larg
e fi
rms
liste
d in
P
rofi
ts a
s pe
rcen
tage
of
sale
s an
d p
rofi
ts
Fo
ur
fact
ors
der
ived
fro
rr
Sco
res
on a
ll fo
ur
fact
ors
sig
nif
ican
tly
dis-
F
ort
un
e's
500.
as
per
cent
age
of
cap
ital
. q
ues
tio
nn
aire
dat
a,
com
ple
ted b
y 21
7 ex
ecu
tive
fro
m t
he
109
firm
s.
Fac
tors
wer
e:
cohe
sivc
ness
, fo
rma
lity
in
dec
isio
n-m
akin
g,
dec
entr
aliz
atio
n,
and
pe
rson
aliz
ed m
anag
e-
crim
inat
ed (
p> 0
1) t
op a
nd b
ott
om
th
ird
s fo
r p
rofi
t as
per
cen
t o
f ca
pit
al;
cohe
sive
- ne
ss a
nd d
.m.
form
ality
dis
crim
inat
ed t
op
an
d b
ott
om
th
ird
s fo
r p
rofi
ts a
s p
erce
nt
of
sale
s.
men
t.
c*

62.
Quality
The quality of the primary service or product provided by the organiza- tion may take many operational forms, which are largely determined by the kind of product or service provided by the organization.
Almost all operational measures of quality found in the literature use archival data, specifically the kinds of measures typically thought of as being "quality control." Beek (1964) examined assembly line inspec- tors' charts to determine numbers of short circuits, assembly faults, and soldering faults per 1000 units. Parker (1963, 1965) and Katzell, Barrett, and Parker (1961) used number of errors in filling orders and pricing per 1000 man-hours of production in their work with pharmaceu- tical warehouses. Their measures were aggregate figures, representing either an entire work group or warehouse's quality of work.
Seashore, Indik, and Georgopoulos (i960) in their study of a package delivery organization used a count of non-deliveries over a one month period for a measure of an individual's work quality. For units, they used the mean of the individual's measures.
Student (1968) used a rating of actual vs. anticipated numbers of rejects in an appliance manufacturing plant as a measure of quality.
It appears that much more could be done than has been done to measure quality. All the measures mentioned above are archival in nature, taking advantage of existing records. Likert and Bowers (1969) sug- gest some other possible measures of quality: accuracy, customer returns, complaints, and repeat business. It should also be possible to develop some subjective measures of quality to compliment archival measures, such as ratings of the quality of a unit's work by the unit that receives their product (e.g., airplane pilots evaluating a maintenance unit's work, mechanics the supply department's work, etc.)
Relationship to Other Variables.
Beek found that quality of an assembly line worker's work was related to his work pace, with moderately and regularly paced individuals pro- ducing higher quality than irregular or slow personnel.
Katzell et al . found quality unrelated to quantity of work, profit, or turnover, but negatively related to the degree of "urbanization" of the organization.

63.
Parker found that pricing and order-filling errors correlated positively, and that "initiating structure" of work group foremen was positively correlated with pricing errors (but not order-filling errors). He found size of the organization (warehouse in this case) correlated posi- tively with order-filling errors, but employment security negatively correlated. Thus it appears that close supervision and a large organi- zation are associated with low quality of work.
Seashore et al. found errors (i.e., non-deliveries) negatively correlated with effectiveness, productivity, and accidents and positively correlated with absences.
Student found that his measures of expert power, referent power, and the "incremental influence" of supervisors correlated positively with quality.
Summary.
Quality is measured primarily by making use of existing organizational records (e.g., measuring or counting errors). Most of its relationships to other variables appear to make intuitive sense, at least, which gives one some reason to believe the measures used are accurate reflections of qual1ty.

Qu
alit
y
So
urc
e
Sam
ple
O
pera
tional
Fo
rm
Re
late
d T
o
Re
latio
nsh
ip F
ound
Bee
k (1
964)
Ass
em
bly l
ine w
ork
ers
in
A
ssem
bly l
ine i
nsp
ect
or's
chart
s sh
ow
ing
S
peed
and
regula
rity
T
he m
ediu
m (
in s
peed
of
wo
rkin
g).
an
ele
ctro
nic m
an
ufa
ctu
r-
num
ber
of
short c
ircu
its,
asse
mbl
y o
f w
ork
er's
pace
. re
gula
r w
ork
ers
had
be
tte
r q
ua
lity o
utp
ut
ing
pla
nt.
fa
ults
, an
d so
lde
rin
g f
au
lts p
er
10
0 u
nits
. th
an i
rre
gu
lar, f
ast
orjlo
w w
ork
ers
.
Katz
ell, B
arr
ett
, & P
arke
r 72 w
hole
sale
dru
g
Num
ber
of
err
ors
in f
illin
g o
rde
rs p
er
Thre
e o
ther
effect
ive-
Not
rela
ted t
o t
he o
the
r e
ffe
ctiv
en
ess
(1
961)
war
ehou
ses.
10
00 m
an
-ho
urs
of
work
. ne
ss v
aria
bles
and
a
statis
tical
fact
or
tappin
g "
urb
an
iza
tio
n".
crite
ria (
quantity
, pro
fit, t
urn
ove
r),
ne
ga
tive
ly r
ela
ted t
o "
urb
an
iza
tio
n".
Par
ker
(1963)
80 w
areh
ouse
s o
f a
Nu
mb
er
of
ord
er-
prici
ng e
rrors
and
S
itua
tion
al
and
Prici
ng e
rrors
co
rre
late
d .
28 w
ith o
rder-
pharm
ace
utic
al
com
pany.
num
ber
of
ord
er-
fillin
g e
rrors
per
le
aders
hip m
easu
res.
filli
ng e
rro
rs,
and
.23 w
ith "
initia
ting
10
00 m
an
-ho
urs
pro
duct
ion.
oth
er
effect
iveness
m
easu
res.
str
uctu
re"
of
fore
me
n (
bo
th p
<.0
5).
O
rder-
fillin
g e
rrors
als
o co
rrela
ted .
27 w
ith
w
areh
ouse
siz
e, a
nd -
.24
with e
mplo
yment
secu
rity (
both
p<
05
).
Sea
shor
e, I
ndik &
27
work
unit»
in a
deliv
ery
N
um
ber
of
non-d
eliv
eries
ove
r a
one-
F
our
oth
er
mea
sure
s o
f C
orr
ela
ted t
hese
at
the i
ndiv
idual,
wo
rk
Georg
opoulo
s (1
960)
truck
com
pany.
m
on
th p
erio
d,
for
indiv
iduals
. T
ook
mea
n o
rga
niz
atio
na
l effect
ive-
unit,
& i
ndiv
iduals
with
in w
ork u
nits
lev
els
ind
ivid
ua
l sc
ore
as t
he w
ork
un
it
ness
crite
ria, e
ffect
ivenes;
, o
f analy
sis.
Sig
nifi
can
t, n
egat
ive
corr
ela
- m
easu
re.
pro
du
ctivity,
char
geab
le
acci
dent
s, u
ne
xcu
sed
ab
senc
es.
tion
s fo
un
d b
etw
ee
n e
rrors
and
effect
iveness
, p
rod
uctivity,
and
acc
idents
at
all
leve
ls
exc
ep
t in
div
iduals
with
in u
nits
. A
bsen
ces
wer
e si
gnifi
cantly
posi
tively c
orr
ela
ted a
t tw
o o
f th
ree l
evel
s,
(no
t re
late
d a
t w
ork
unit l
eve
l).
Stud
ent
(196
3)
40 w
ork
gro
up
s in
»n
A r
atin
g o
f a
ctu
al
vi.
äflÜ
elp
ätä
d
Five
sou
rces
o' p
ower
E
xpe
rt a
nd r
efe
ren
t p
ow
er
corr
ela
ted a
bo
ut
ap
plia
nce
ma
nu
fact
urin
g
num
bers
of
reje
cts, t
aki
ng i
nto
acc
ount
(Fre
nch
& R
aven
s .3
1,
and
exp
ert a
nd r
efe
rent
po
we
r (o
r pla
nt.
th
e d
isposi
tion,
am
ou
nt, a
nd k
ind o
f so
urce
s)
incr
em
enta
l in
fluence
) co
rrela
ted .
36 w
ith
re
ject
. qualit
y,
(all
r's s
ignifi
cant
at .
05 l
eve
l)

65.
Accidents
This variable refers to frequency of on-the-job accidents resulting in lost time and has been infrequently included as a measure of effective- ness. We have only two examples.
Student (1968) used the number of reported injuries for a work group divided by the number of men in the work group as a measure of work group accident rate. Seashore, Indik, and Georgopoulos (i960) working with a delivery van organization, used the simple number of accidents over a two-year period as an individual measure, with the mean of the individuals' scores serving as a work unit measure.
Although the biases usually found in archival accident data are well known, we found no attempt in the organizational effectiveness litera- ture which tried to deal systematically with these biases.
Relationship to Other Variables.
Seashore et a). found a negative relationship between accidents and errors (inverse measure of quality of work) with both the work group and the individual as the unit of analysis. Accidents were not related to effectiveness, productivity, or unexcused absences.
Student found a negative correlation between accidents and the "expert" power of supervisors, but no relationship to four other bases of power.
Summary.
This variable is measured straightforwardly from organization records and appears to have little systematic relationship with other variables, but little research exists here.

Acc
ide
nts
c^
Sou
rce
Sam
ple
Ope
ratio
nal
For
m
Rel
ated
To
Rel
atio
nshi
p F
ound
Sea
shor
e, I
ndik
&
Georg
opoulo
s (1
960)
Deliv
ery
tru
ck o
rga
niz
atio
n
27 w
ork
un
its,
97
5
ind
ivid
ua
ls
Stu
dent
(1968)
48
6 e
mplo
yees
in 4
0 w
ork
g
rou
ps
in a
pplia
nce
m
an
ufa
ctu
rin
g p
lant.
Nu
mb
er
of
on-t
he-job a
ccid
ents
fo
r th
e
prev
ious
tw
o y
ears
, b
oth
fo
r in
div
iduals
an
d u
nits
(u
nit
scor
e =
mea
n of
ind
ivid
ua
l sc
ores
in
the
un
it).
Nu
mb
er
of
rep
ort
ed o
n-t
he-job i
nju
ries
for
a w
ork
gro
up d
ivid
ed b
y num
ber
of
men
in
the
work
gro
up
. (W
ork
gro
up's
unit o
f an
alys
is).
Four
oth
er
mea
sure
s o
f o
rga
niz
atio
n e
ffe
ctiv
en
es
crite
ria o
f:
effect
iveness
p
rod
uctivity,
un
exc
use
d
abse
nces
, an
d e
rro
rs.
Mea
sure
s o
f fiv
e s
ourc
es
of
po
we
r (F
ren
ch &
R
aven
five s
ourc
es).
Fo
r co
rrela
tions
with w
ork
un
its a
s unit o
f an
alys
is,
acc
ide
nts
corr
ela
ted s
ignifi
cantly
n
eg
ativ
ely
with e
rrors
(-.
65,
p>.0
5)>
With
in
div
iduals
as
unit o
f an
alys
is,
the s
ame
varia
bles
aga
in c
orr
ela
ted s
ignific
antly
(-
.18
, p».0
5).
For
ind
ivid
ua
ls w
ithin
st
atio
ns,
no s
ign
ifica
nt
corr
ela
tion
s w
ere
fo
und.
Acc
idents
rela
ted n
egativ
ely t
o "
exp
ert
" pow
er,
(r =
-.2
8,
pa.,05)
67.
Growth
Growth can be defined as an increase in such things as manpower, plant facilities, assets, sales, profits, market share, and innovations. It implies a comparison of an organization's present state with its own past state. Only four articles present measures of growth, but several authors discuss or define this concept (Katz £ Kahn, 1966; Kuin, 1968; Likert, 1967; Thompson, 1967).
The Michigan researchers derived statistical factors representing growth. Bowers (1964) presented a factor based on analysis of insurance company records that reflected the growth in dollar volume over the preceding few years, and Seashore and Yuchtman (I967) lable a factor "Manpower Growth" defined by variables measuring increases in manpower and the ratio of that increase to total manpower.
Bowers correlated this factor with measures of control (amount of influ- ence in an organization, totally and at each hierarchical level) and an overall effectiveness ranking. No significant correlations were found. Seashore and Yuchtman did not correlate "Manpower Growth" with any other variables, but did examine the stability of scores on this factor over a ten-year period. They found very low stability coefficients (highest was .22).
Wainer and Rubin (I969) used the annual increase in the logarithm of sales volume between years as a measure of growth. They related this measure to measures of the motivation of the organization's president (organizations were small entrepreneurial firms), and found that the motivational measures were related to growth.
Prien and Ronan (1971) derived a statistical factor from analysis of 38 variables of both archival and subjective types that was defined by two variables—a growth index and amount of average growth rate. They did not relate this to any other variables.
Summary.
Growth has, for the most part, been measured by a statistical factor when it has been made operational. It has been found to be unstable over time (at least in insurance agencies) and unrelated to effectiveness or control (again in insurance agencies). In one instance it has been found related to the motivations of chief executives, but this is cer- tainly a tentative finding.

Gro
wth
So
urc
e
Sam
ple
Op
era
tio
na
l F
orm
R
elat
ed T
o R
ela
tio
ns
hip F
ou
nd
Bow
ers
(1964)
40 i
nsur
ance
age
ncie
s S
tati
stic
al f
acto
r ba
sed
on a
rchi
val
Est
imat
es b
y ag
ents
of
No s
ign
ific
ant
corr
elat
ion
s w
ith a
ny o
f m
easu
res, c
alle
d "B
usin
ess
Gro
wth
".
"'to
tal
co
ntr
ol"
, co
ntr
ol
at f
ou
r le
vels
of
the
org
aniz
atio
n,
and
an
over
all
effe
ctiv
enes
s ra
nki
ng b
y co
mp
any
off
icia
ls.
the
con
tro
l or
eff
ecti
ven
ess
mea
sure
s.
Sea
shor
e & Y
uch
tman
75
ins
uran
ce a
genc
ies
Sta
tist
ical
fac
tor
base
d on
76
arch
ival
N
on
e,
anal
yzed
fo
r L
ow
sta
bili
ty,
high
est
corr
elat
ion a
mo
ng
(1967)
mea
sure
s.
stab
ility
ove
r an
11
- ye
ar p
erio
d.
1952
, 19
57,
1961 m
easu
rem
ents
was
.22
.
Pri
en
& R
on
an (
1971)
107
smal
l m
etal
-wo
rkin
g
Sta
tist
ical f
acto
r d
eriv
ed f
rom
ana
lysi
s N
o a
ttem
pt
mad
e to
fi
rms
of
38 v
aria
bles
mea
suri
ng o
rgan
izat
ion
al
inp
ut
and
ou
tpu
t.
Def
ined
by
two
va
riab
les
- g
row
th i
nd
ex a
nd a
mo
un
t o
f av
erag
e g
row
th r
ate.
Var
iab
les
ente
rin
g
into
th
e an
alys
is w
ere
bo
th a
rchi
val
and
subj
ectiv
e in n
atu
re.
rela
te t
his
to o
ther
va
riab
les.
Wai
ner
& R
ub
in (
1969)
51 s
mal
l, "e
ntr
epre
neu
rial
" In
crea
se i
n lo
gar
ith
m o
f sa
les
volu
me.
T
AT m
oti
vati
on m
ea-
- H
igh
nA
ch a
nd l
ow
nA
ff s
core
s as
soci
ated
fi
rms
mos
t re
cen
t ye
ar ■
nex
t m
ost
rece
nt
year
. su
res
(Fir
m P
resi
dent
s),
nA
ch,
nA
ff,
nP
ow
. w
ith h
igh
gro
wth
rat
e, n
Po
w n
ot
rela
ted
.
CO
69.
Absenteeism
Seashore, Indik, and Georgopoulos (I960) point out that this variable is highly important when an organization has a highly coordinated, rigid, daily schedule where absence, especially unanticipated absence, can severely disrupt the work process. In their study of a nationwide delivery truck organization, they used the number of unexcused absences over a two-year period as a measure of individual absenteeism, and the mean of the individual members' scores for a unit score on absenteeism. Student (1968), studying appliance manufacturing plant workers, used the same work group measure, except that he computed two measures, one for excused and one for unexcused absences.
Seashore et al. found absence unrelated to effectiveness or productivity, and negatively related to errors in work. Student found that excused absences were related negatively to two sources of supervisory power (referent and expert power) but were unrelated to the three other sources. Unexcused absences were not related to any of the sources of powe r.
Summary.
Absenteeism is measured by using organization records, is sometimes split into excused and unexcused absence, and does not seem highly related to other organizational variables. However, little research actually has been done.

Abse
nte
eis
m
Sou
rce
Sam
ple
Ope
ratio
nal
For
m
Rel
ated
To
Rel
atio
nshi
p F
ound
Sea
shor
e, I
nd
ik,
&
Ge
org
op
ou
los
(1960)
Stu
dent
(1968)
Deliv
ery
serv
ice
statio
ns.
27
work
gro
ups,
975
in
div
iduals
.
40 a
pplia
nce
ma
nu
fact
urin
g
pla
nt
wo
rk g
roup
s, 4
86
em
plo
yees.
Num
ber
of
un
exc
use
d a
bsen
ces
for
last
tw
o y
ears
.
Tota
l n
um
be
r o
f ex
cuse
d o
r u
ne
xcu
sed
ab
senc
es f
or
a w
ork
gro
up, d
ivid
ed b
y num
ber
of
mem
bers
of w
ork
gro
up.
Ove
rall
effect
iveness
, P
roductivity,
Acc
ide
nts
, E
rrors
.
Fiv
e so
urce
s o
f p
ow
er
(Rav
en &
Fre
nch
).
Uttle
or
no r
ela
tionsh
ip f
ou
nd
, hig
hest
co
rre
latio
n =
-.1
8 (
p<
,05)
betw
een e
rro
rs
and
abse
nce.
Exc
used
abs
ence
s n
eg
ativ
ely r
ela
ted t
o
refe
rent
and
exp
ert p
ow
er.

71
Turnover
This is usually some measure of the frequency and amount of voluntary terminations and refers to a change in actual personnel within the organization, however that change occurs. All but one of the turnover measures we reviewed are archival, but even with this constraint there are a surprising number of variations.
Grusky (1963, 1964) and Eitzen and Yetman (1972) both used the change in coaches or managers of athletic teams as a measure of turnover, Grusky for major league baseball teams, Eitzen and Yetman for college basketball teams. Both looked at team records over a period of about forty years, and computed the number of coaching or manager changes divided by the total number of years. The analogous activity in the military would be to look at turnover only In the officer corps.
McNeil and Thompson (1970 compute what they call a regeneration rate, which is the change in the ratio of newcomers to veteran members of an organization. Their regeneration index reflects the time elapsing before the ratio of new members to old members reached 1:1 from a cer- tain base period. They illustrated the use of their index on college faculties.
Student (1968) used the number of quits, transfers, and formal bids for jobs in other work groups not involving advancement, all divided by the total number in the work group as a turnover measure. Katzell, Barrett, and Parker (1961) were content to use the additions to a work force per quarter (expressed as a percentage of total number employed) as a turn- over measure.
Finally, Bowers (1964) and Bowers and Seashore (1966) derived a factor in their study of the archival records of insurance companies that reflects turnover and they used two components to measure it: termina- tions + appointments/manpower, and terminations/manpower, both for a one year period. Similarly, Mahoney and Weitzel (1969) found a factor reflecting turnover, but theirs was based on factor analysis of ques- tionnaire ratings, not archival records. They defined their factor as reflecting turnover from inability to do the job.
In examining these measures, it appears that each is getting at a some- what different facet of this seemingly simple, but actually complex variable. Grusky and Eitzen and Yetman are attempting to measure turn- over in highly important, central decision making positions. McNeil and Thompson attempt to get a fix on the rate of change in personnel over

72.
time, Katzell, Barrett, and Parker attempt only to tap additions to the work force, while Student seems to include any and all exits from a work group as well as contemplated exits (that are not promotional) in his turnover measure. Finally, the two factor analytic attempts come up with differing operationalizations.
Relationship to Other Variables.
Turnover has been found unrelated to organiational control (Bowers, 1964), overall effectiveness rankings (Bowers, 1964; Mahoney 6 Weitzel, 1969), leadership (Bowers & Seashore, 1966) quality, profit, satisfaction, and productivity (Katzell et al., 1961), and four sources of supervisory power (Student, 1968). It has been found negatively related to won-lost records of professional and college sports teams (Grusky, 1963, 1964; Eltzen 6 Yetman, 1972), and positively related to one source of super- visory power, referent power (Student, 1968)-

Tu
rno
ver
Sou
rce
Sam
ple
Ope
ratio
nal
For
m
Rel
ated
To
Rel
atio
nshi
p F
ound
Bow
ers
(1964)
40 l
ife
insu
ranc
e ag
enci
es
Sta
tist
ical f
acto
r de
rive
d fr
om
70
E
stim
ates
by
agen
ts o
f N
o s
ign
ific
ant
corr
elat
ion
s w
ith a
ny
of
the
arch
ival r
ecor
ds,
mea
sure
s ch
ange
s in
"t
ota
l co
ntr
ol"
, co
ntr
ol
con
tro
l o
r ef
fect
iven
ess
mea
sure
s fo
un
d.
staf
f in
ter
ms
of
acq
uis
itio
n o
f n
ew m
en
at f
ou
r le
vels
of
the
and
term
inat
ion
s o
f ol
der
staf
f.
org
aniz
atio
n,
and
an
ove
rall
effe
ctiv
enes
s ra
nki
ng b
y co
mp
any
off
icia
ls.
Bow
ers
& S
eash
ore
(1966)
40 l
ife
insu
ranc
e ag
enci
es
Sta
tist
ical
fac
tor
deri
ved
fro
m 7
0 F
ou
r pa
per
and
penc
il N
o c
orr
elat
ion
s si
gn
ific
antl
y d
iffe
ren
t fr
om
ar
chiv
al r
ecor
ds,
mea
sure
s ch
ange
s in
le
ader
ship
mea
sure
s, a
ll ze
ro f
ou
nd
. st
aff
in t
erm
s o
f ac
qu
isit
ion o
f n
ew m
en
take
n a
t tw
o l
evel
s an
d te
rmin
atio
ns
of
old
er s
taff
. (p
eer
and
man
ager
).
Eit
zen &
Yet
man
(1972)
Per
form
ance
rec
ords
of
Nu
mb
er o
f ye
ars
div
ided
by
nu
mb
er o
f W
on - L
ost
rec
ords
of
Coa
chin
g te
nu
re a
nd w
on
-lo
st c
orr
elat
ed
129
colle
ge b
aske
tbal
l co
ach
ing c
hang
es (
aver
age
ten
ure
of
the
team
s o
ver
the
-.24
. F
urt
her
ana
lyse
s le
d to
co
ncl
usi
on
te
ams
for
per
iod 1
930 -
co
ache
s).
year
s (1
930-1
970).
th
at t
her
e w
ere
no b
enef
icia
l sh
ort
ter
m
1970
. ef
fect
s fr
om
a c
oach
ing
chan
ge,
bu
t th
ere
wer
e lo
ng
-ter
m e
ffec
ts.
Gru
sky
(19
63
-19
64
) R
ecor
ds o
f m
ajo
r le
ague
N
um
ber
of
man
ager
ial
chan
ges
div
ided
W
on - L
ost
rec
ords
of
Co
mp
ute
d K
end
all's
tau
fo
r th
e tw
o t
ime
base
ball
team
s fo
r ye
ars
by
tim
e p
erio
d,
or
aver
age
man
ager
ial
the
team
s.
peri
ods
1921
- 1
941,
tau
= -
.40 (
p<
.02).
1921-1
941,
1951-1
958.
ten
ure
. 19
51 - 1
958,
tau
= -
.60 (
p^
.001).
Kat
zell, B
arre
tt.
& P
arke
r 72
who
lesa
le d
rug w
are-
. A
dd
itio
ns
to w
ork
fo
rce
per
qu
arte
r.
Th
ree
oth
er e
ffec
tiven
ess
No
t re
late
d t
o t
he o
ther
eff
ecti
ven
ess
(19
61
) ho
uses
in
the
drug
an
d
expr
esse
d as
per
cent
age
of
tota
l va
riab
les, f
ive
situ
atio
nal
va
riab
les
(qu
alit
y, p
rofi
t, q
uan
tity
),
phar
mac
y in
du
stry
. n
um
ber
em
plo
yed
. va
riab
les, a
nd s
core
s on
a
sati
sfac
tio
n q
ues
tio
n-
nair
e.
nega
tivel
y co
rrel
ated
wit
h w
age
rats
, an
d u
nre
late
d t
o s
atis
fact
ion
,
Mah
on
ey &
Wei
tzel (
1969)
283
org
aniz
atio
nal s
ub-
Sta
tist
ical f
acto
r de
rive
d fr
om
ana
lysi
s o
f R
atin
gs o
f ov
eral
l T
hei
r tu
rno
ver
fact
or
con
trib
ute
d n
eglib
ibly
un
its a
cros
s va
riou
s 11
4 q
ues
tio
nn
aire
ite
ms.
ef
fect
iven
ess
of
the
sub-
to
the
pre
dic
tio
n o
f o
vera
ll ef
fect
iven
ess.
te
chn
olo
gic
al t
ypes
. u
nit
s by
man
ager
s, i
n a
mu
ltip
le r
egre
ssio
n eq
uat
ion
.
Was
one
of
17 f
acto
rs a
cco
un
tin
g f
or
two
p
erce
nt
of
the
vari
ance
of
the
over
all
effe
ctiv
enes
s ra
tings
.
McN
eil
& T
ho
mp
son (
1971)
Fac
ult
y at
tw
o S
ou
ther
n
"Reg
ener
atio
n I
nd
ex", r
efle
ctin
g t
he
No
thin
g,
on
ly i
llust
rati
ve
Uni
vers
ities
. ti
me
elap
sing
bef
ore
th
e ra
tio o
f ne
w
mem
bers
to o
ld r
each
es 1
:1.
data p
rese
nted
.

Tu
rno
ver
(co
nt.
)
Sou
rce
Sam
ple
Ope
ratio
nal
For
m
Rel
ated
To
Rel
atio
nshi
p F
ound
Pri
en
& R
onan
(1971)
107
smal
l m
etal
-wo
rkin
g
firm
s, i
nte
rvie
w d
ata.
Stu
den
t (1
968)
40
wo
rk g
roup
s in
an
appl
ianc
e m
anu
fact
uri
ng
p
lan
t.
Sta
tist
ical f
acto
r th
at p
urp
ort
edly m
ea-
sure
s "s
ucce
ssio
n",
load
ing
vari
able
s w
ere:
Ch
ief
exec
uti
ve i
s fo
un
der
, co
mp
any
has
form
al p
erso
nnel p
rog
ram
, co
mp
any
age,
bre
ak e
ven
po
int
as a
pc
erce
ntag
e o
f ca
pac
ity.
Var
iab
les
ente
rin
g i
nto
ana
lysi
s w
ere
bo
th
arch
ival a
nd s
ubje
ctiv
e in n
atu
re.
Nu
mb
er o
f q
uit
s, t
rans
fers
, an
d fo
rmal
bi
ds f
or
jobs
in
oth
er w
ork
gro
ups
(no
t in
volv
ing
adva
nce
men
t) -
div
ided
by
tota
l n
um
ber
in
the
wo
rk g
rou
p.
No a
ttem
pt
mad
e to
re
late
to o
ther
va
riab
les.
Five
sou
rces
of
po
wer
(F
ren
ch &
Rav
ens
sour
ces)
On
ly r
efer
ent
po
wer
was
rel
ated
to
tu
rno
ver,
(r = .
23,
p<
.05)

75.
Sat isfaction
Satisfaction has been defined many ways (e.g., see Wanous 6 Lawler, 1972) but perhaps the modal view references satisfaction to the achievement or possession of certain outcomes provided by the organi- zation and defines it as an individual's perception of the degree to which he or she has received an equitable amount of the outcome. That is, satisfaction is the degree to which individuals perceive they are equitably rewarded by various aspects of their job situation and the organization to which they belong.
Satisfaction is universally measured by individual self-ratings. Most researchers in the organizational effectiveness literature reviewed here used more than one scale to tap satisfaction. However, Bachman, Smith, and Slesinger (1966) and Meltzer and Salter (1962) used a single scale that asked for a global rating of satisfaction (of the sort, "All in all, how do you feel about your job7", responded to on a five-point Likert scale anchored "very dissatisfied" to "very satisfied").
Guba (I958) used a global rating in addition to ten specific ratings of satisfaction, while several authors (Bowers 6 Seashore, 1966; Aram, Morgan, 6 Esbeck, 1971; Bowers, 196*»; Box 6 Cotgrove, 1968; Katzell, Barrett, & Parker, 1961; Rowland 6 Scott, 1968) have used the multi-facet approach to measuring satisfaction. Generally, the ratings are of the Likert format, though Rowland and Scott used the semantic differential.
In the studies using satisfaction as a measure of organizational effec- tiveness from 5 to 21 separate items were rated in terms of individual satisfaction. Most of the items can be classified as satisfaction with outcomes in the following categories: the work itself, supervision and management, pay, fringe benefits, fellow workers, promotional and growth opportunities. These measures of satisfaction are usually computed for individuals only, and means used for unit or organization satisfaction scores.
At least two questions arise from all of this. First, is it worthwhile to use a multi-facet measure of satisfaction rather than a single, global rating? Second, does it make good sense to use the mean of individual job satisfaction to represent work group or organization sat isfact ion?
Relative to the studies that have used satisfaction as an Indicator of organizational effectiveness, very little empirical consideration has been given to the first question. Aram et al. (1971) considered the problem, but their consideration was limited to one factor analysis of
76.
16 items which yielded four factors. Taylor and Bowers (1972) included a number of satisfaction items in the Survey of Organizations question- naires and seven factors are scored. This is perhaps the only instance In the organizational literature where considerable research data were
brought to bear.
The second question is really asking whether there is enough variance in individual satisfaction that is attributable to organizational characteristics to make it worthwhile to aggregate individual satis- faction and call the composite a measure of organizational functioning. In the ANOVA sense, a significant portion of the variance must be due to differences between organizations. All of it can't be soaked up by differences between individuals. None of the studies we reviewed con- sidered this question directly. However, we will come back to it again in the section on climate and structure when we consider the possibility of having individuals rate not their own satisfaction but their perception of the overall level of satisfaction in the unit or organization.
These measures of satisfaction which we did find being used in the liter- ature have been related to several other organizational and individual variables. Aram et al. (1970 found their four satisfaction dimensions positively related to three dimensions of work group collaboration and consensus. Rowland and Scott (1968) correlated their nine measures of satisfaction with a set of personality measures but found few significant correlations (only nine of 95 correlations were significant at .05 level). The measures they used were the Leadership Opinion Questionnaire, Role Construct Repertory Test, Barron-Welsh Art Scale, Purdue Adaptability Test, Edwards Personal Preference Schedule, and a modified Navy "upward influence" rating form.
Bowers and Seashore (1966) correlated five satisfaction scales (satis- faction with company, fellow agents, job, income, and manager) with four measures of leadership: support, goal emphasis, work facilitation, and Interaction facilitation. These leadership measures were taken for peers and managers. Thus there were kO correlations in all. Thirty of the kO were significant at .05 or better, and all significant correlations were positive (ranged from .31 to .78).
Bowers (1964) related control, the ability to exercise influence within an organization, to several facets of satisfaction. He found that total control (the sum of the amount of control for all hierarchical levels in an organization) was generally positively related to job satisfaction. He also found that satisfaction on two of the five facets was positively related to an overall effectiveness ranking.

77.
Box and Cotgrove (1968) found that "dedication to science" interacted with "organizational freedom" to affect satisfaction. Their sample was composed of research scientists.
Bachman et ai. (1966) using a global estimate of satisfaction, found that satisfaction correlated significantly (p<.01) with 11 other "predictor" variables. Six of these variables tapped the amount of control that office managers and the sales force had over office and individual practices and behavior, while five tapped French and Raven's five power bases.
Guba (1958) found a positive relationship between responses to specific satisfaction items and his morale measurement, but not between a global satisfaction response and morale.
Katzell et al. (i960 found satisfaction positively correlated with quantity of work and profit, but not related to turnover and quality. They also found satisfaction negatively correlated with five situational measures that seemed to reflect the degree of "urbanization" of the area in which the organization was located. (Small-town employees were more satisfied than large city employees.)
Meltzer and Salter (1962) found that members of medium-sized organizations were more satisfied than were members of large or small organizations, while members of organizations with fewer hierarchical levels were more satisfied than members of organizations with more levels.
It appears, then, that satisfaction is related to several organizational variables but not to individual personality variables. Porter 6 Lawler (1965) have previously reviewed the relationship of job satisfaction to several organizational structure variables and found that satisfaction was generally related to these structure variables. Leadership, work group relations, influence or control, and morale, besides the structure variables, seem to be related to job satisfaction as measured by a self- rating.
One curious and disheartening feature of the "job satisfaction as a measure of organizational effectiveness" literature is that it shows so little recognition of the huge literature on job satisfaction that has been built up in the context of the individual as a unit of analysis. For example, the Job Description Index (Smith, Kendall, S Hulin, I969) and the Minnesota Satisfaction Questionnaire (Weiss, Dawis, England, 6 Lofquist~ 1967) are two extremely well researched measures of job satis- faction but they are given scant attention in the "organizational effectiveness" literature.

Sat
isfa
ctio
n
Sou
rce
Sam
ple
Ope
ratio
nal
For
m
Rel
ated
To
Rel
atio
nshi
p F
ound
Ara
m,
Mo
rgan
, &
R
esea
rch
team
s fo
r a
Fac
tor
anal
yzed
a 1
6-it
em q
ues
tio
n-
Sco
res
on t
hre
e d
imen
- A
lmo
st a
ll co
rrel
atio
ns
bet
wee
n t
he
thre
e E
sbec
k (
1971)
rub
ber
man
ufa
ctu
rin
g
nai
re,
cam
e up
wit
h f
ou
r fa
cto
rs o
f sa
tis-
sion
s o
f w
ork
gro
up
di
men
sion
s o
f co
llab
ora
tio
n s
core
s an
d co
mp
any.
To
tal
N *
140
fa
ctio
n: p
rofe
ssio
nalis
m,
job c
on
dit
ion
s.
colla
bo
rati
on a
nd c
on-
the
fou
r fa
cto
rs o
f sa
tisf
acti
on s
core
s in
divi
dual
s.
stat
us o
rien
tati
on
, se
lf-a
ctu
aliz
atio
n.
sens
us,
thes
e w
ere
the
wer
e si
gn
ific
ant
at p
<.0
5.
Ran
ge o
f O
nly i
nd
ivid
ual s
core
s co
mp
ute
d.
ind
ivid
ual
's p
erce
pti
on
s o
f hi
s te
am's
co
llab
or-
at
ion
.
sig
nif
ican
t co
rrel
atio
ns
was
.25
to .
48.
Bac
hman
, S
mit
h &
36
sal
es o
ffic
es,
mea
n N
O
ne t
o f
ive
Lik
ert
resp
onse
to t
he
item
E
leve
n p
red
icto
rs
Sat
isfa
ctio
n c
orr
elat
ed a
t a
p<.
01 w
ith
S
lesi
nger (
1966)
in s
ales
off
ice
= 18
. "A
ll t
hing
s co
nsid
ered
, h
ow
sat
isfie
d ar
e yo
u w
ith t
he
way
yo
ur
off
ice
man
ager
is
do
ing h
is j
ob
?"
An
cho
red v
ery
dis-
sa
tisfie
d to
sat
isfie
d.
deal
ing
wit
h c
on
tro
l o
f in
div
idu
al a
nd u
nit
b
ehav
ior
and
five
p
ow
er b
ases
.
ever
y p
red
icto
r.
Bow
ers
(1964)
40 l
ife
insu
ranc
e ag
enci
es
Qu
esti
on
nai
re i
tem
s ta
pp
ing f
ive
area
s E
stim
ates
by
agen
ts o
f 'T
ota
l c
on
tro
l" c
orr
elat
ed s
ign
ific
antl
y po
si-
of
sati
sfac
tio
n:
com
pan
y, r
egio
nal
"to
tal
co
ntr
ol"
, co
ntr
ol
tive
ly w
ith a
ll fi
ve s
atis
fact
ion f
acet
s (p
<.0
5)
man
ager
, fe
llow
age
nts,
jo
b,
inco
me.
at
fo
ur
leve
ls o
f th
e o
rgan
izat
ion
, an
d an
ov
eral
l ef
fect
iven
ess
ran
kin
g b
y co
mp
any
off
icia
ls.
ove
rall
effe
ctiv
enes
s ra
nki
ng c
orr
elat
ed s
ig-
nif
ican
tly
po
siti
vely
wit
h t
wo o
f fi
ve f
acet
s (r
egio
nal m
anag
er a
nd f
ello
w a
gent
s).
Ten
of
twen
ty c
orr
elat
ion
s b
etw
een t
he s
atis
fact
ion
fa
cets
, an
d co
ntr
ol
at t
he
fou
r o
rgan
izat
ion
al
leve
ls w
ere
sig
nif
ican
t p
osi
tive
. A
ll b
ut
one
wer
e po
sitiv
e o
f th
o In
sig
nif
ican
t r's
.
Bow
ers
& S
eash
ore
(1966)
40 l
ife i
nsur
ance
age
ncie
s Q
ues
tio
nn
aire i
tem
s ta
pp
ing f
ive
area
s F
ou
r pa
per
and
penc
il S
atis
fact
ion w
ith f
ello
w a
gent
s, i
nco
me,
and
o
f sa
tisf
acti
on
: co
mp
any, r
egio
nal
lead
ersh
ip m
easu
res:
m
anag
er w
as g
ener
ally p
osi
tive
ly c
orr
elat
ed
man
ager
, fe
llow
age
nts,
jo
b i
nco
me.
su
pp
ort
, go
al e
mph
asis
, w
ork
fac
ilita
tio
n,
inte
r-
acti
on f
acili
tati
on
, ta
ken a
t pe
er l
evel a
nd
man
ager
lev
el.
to t
he
fou
r le
ader
ship
mea
sure
s at b
oth
pee
r an
d m
anag
er l
evel
, (r
ange
fro
m .
31 t
o .
86
).
Sat
isfa
ctio
n w
ith j
ob a
nd c
om
pan
y w
as
sig
nif
ican
tly,
po
siti
vely
co
rrel
ated
in
on
ly
seve
n o
f th
e 16
co
rrel
atio
ns
wit
h t
he
lead
er-
ship
mea
sure
s, (
rang
e fr
om
.31 t
o .
39
).
Bo
x&
Co
tgro
ve (
1968)
Eig
ht
rese
arch
lab
ora
tori
es
Res
pons
e to
21
item
s co
nce
rnin
g j
ob
M
easu
res
of
"org
aniz
a-
Inte
ract
ive
rela
tio
nsh
ip o
f "f
reed
om
" an
d in c
hem
ical a
nd p
har
ma-
co
nd
itio
ns
on a
5-p
oin
t L
iker
t sc
ale.
ti
on
al f
reed
om
" an
d "d
edic
atio
n"
to s
atis
fact
ion (
high
on
ce
utic
al i
ndus
trie
s.
"ded
icat
ion t
o s
cien
ce".
"d
edic
atio
n", l
ow
on
"fre
edo
m", m
ore
•
likel
y to
be
dis
sati
sfie
d).
co

Sat
isfa
ctio
n (
co
nt.
)
Sou
rce
Sam
ple
Ope
ratio
nal
For
m
Rel
ated
To
Rel
atio
nshi
p F
ound
Gub
a (1
958)
11 h
igh
scho
ols
in s
ubur
- R
atin
gs o
f sa
tisf
acti
on w
ith t
en s
peci
fic
Sco
res
on a
spe
cial
ly
Thos
e w
ho s
core
d h
igh
er o
n t
he
spec
ific
ba
n ar
ea o
f M
idw
est
item
s pl
us o
ne g
loba
l ra
tin
g o
f sa
tisfa
c-
deve
lope
d m
ora
le i
n-
satis
fact
ion
item
s al
so t
end
ed t
o s
core
m
etro
po
lis.
N=
16
8
tio
n.
stru
men
t, t
he
Tea
cher
hi
gher
on
the
mo
rale i
nst
rum
ent, b
ut
no
teac
hers
. B
ehav
ior
Rat
ing S
cale
. d
iffe
ren
ce f
ou
nd f
or
the
glo
bal s
atis
fact
ion
ra
ting.
Kat
zell, B
arre
tt. &
72
who
lesa
le w
areh
ouse
s in
Q
ues
tio
nn
aire
rat
ings
on
10 a
spec
ts o
f M
easu
res
of
qu
anti
ty.
Sat
isfa
ctio
n w
as,
ove
rall,
po
siti
vely c
or-
Par
ker
(1961)
the
drug
and
ph
arm
acy
the
job
, o
f th
e us
ual
sort
: n
atu
re o
f jo
b.
qu
alit
y o
f p
erfo
rman
ce,
rela
ted
wit
h q
uan
tity
and
pro
fit, a
nd n
ot
ind
ust
ry.
pay
, b
enef
its,
sup
ervi
sion
, et
c.
47 i
tem
s p
rofi
t, p
rod
uct
-val
ue
rela
ted
to t
urn
ove
r o
r q
ual
ity.
Sat
isfa
ctio
n
tota
l. p
rod
uct
ivit
y, t
urn
ove
r an
d fi
ve s
itu
atio
nal
m
easu
res:
wo
rk f
orc
e si
ze,
city
siz
e, w
ages
u
nio
niz
atio
n a
nd p
er-
cen
t m
ale.
was
neg
ativ
ely
corr
elat
ed w
ith a
ll fi
ve
situ
atio
nal m
easu
res.
Th
is m
ean
t, c
on
clu
de
the
auth
ors, t
hat
sm
all
tow
n e
mp
loye
es
wer
e m
ore
sat
isfie
d.
Mel
tzer
Si
Sal
ter
(19
62
) N
atio
nw
ide
surv
ey o
f R
espo
nse
on a
5-p
oin
t L
ike
d s
cale t
o.
Org
aniz
atio
nal
var
iabl
es,
Pers
ons
in m
ediu
m-s
ized
org
aniz
atio
ns
or
phys
iolo
gist
s.
N=
78
6.
"All i
n al
l, h
ow
do
yo
u f
eel
abo
ut
you
r o
f si
ze a
nd n
um
ber
of
leve
ls,
and
seve
ral
orga
niza
tions
wit
h f
ew l
evel
s w
ere
mo
re
pres
ent
job
?"
satis
fied
than
oth
ers.
Th
e si
x o
ther
at
titu
din
al a
nd s
itua-
va
riab
les
wer
e al
so s
ign
ific
antl
y re
late
d t
o
tio
nal v
aria
bles
. le
vel
of
sati
sfac
tio
n.
(Ch
i-sq
uar
e te
st)
Ro
wla
nd &
Sco
tt (
1968)
58 f
irst
-lin
e su
per-
R
espo
nses
to s
eman
tic d
iffe
ren
tial
sca
les
Sev
eral m
easu
res
of
the
Ou
t o
f 95 c
orr
elat
ion
s b
etw
een w
ork
gro
up
vi
sors
, 673 s
ub
ord
inat
es,
con
cern
ed w
ith n
ine
dif
fere
nt
aspe
cts
of
gro
up s
uper
viso
rs.
LO
Q
sati
sfac
tio
n s
core
s an
d th
ese
lead
er a
ttri
bu
tes,
at
a n
aval a
mm
un
itio
ns
the
job
. (W
ork
er h
imse
lf,
supe
rvis
or,
two
sc
ores
, ra
tings
of
supe
r-
nine
wer
e si
gn
ific
ant
at t
he
.05
leve
l. S
even
of
dep
ot.
sc
ales
), jo
b,
pay
, b
enef
its,
fel
low
wo
rker
s.
viso
r on
sev
en s
cale
s o
f th
ese
wer
e co
rrel
atio
ns
wit
h t
he
wo
rker
's
gro
wth
op
po
rtu
nit
ies,
wo
rkin
g c
on
dit
ion
s.
"up
war
d i
nfl
uen
ce"
by
his
sup
erio
rs,
mea
sure
s o
f co
gn
itiv
e co
mp
lexi
ty,
inte
llig
ence
and
nee
ds.
(Ro
le C
on
stru
ct R
eper
- to
ry T
est, B
arro
n-W
elsh
A
rt S
cale
, P
urdu
e A
dap
tab
ility
Tes
t, E
d-
war
ds P
erso
nal
Pre
fer-
per
cep
tio
n o
f th
e de
gree
of
succ
ess
of
thei
r su
perv
isor
(on
e o
f th
e tw
o s
uper
viso
r sa
tisfa
ctio
n sc
ales
).
■
ence
Sch
edu
le)

80.
Motivation
In our present context this is the strength of the predispoisiton of an individual to engage in goal"directed action or activity on the job. It is not a feeling of relative contentment with various job outcomes as is satisfaction, but more akin to a feeling of readiness or willing- ness to work at accomplishing the job's goals.
There are few efforts to measure motivation in the organizational effec- tiveness literature. Parker (1965) derived a cluster (the method used is not described) from data on 80 warehouses that he called "work motivation." He describes this cluster as being made up of measures of high productivity, worker beliefs that good work leads to job security, and supervisory recognition. This was an apparent attempt to measure an entire organization's work motivation, and not an individual's motivation level .
Another such effort was Rosen's (1970) attempt to measure what he called "money motivation," or the motivation of a work group to work as a result of incentive wages. His sample consisted of workers in a furniture factory. Their "money motivation" score was the difference between the preference ratings (on a one to seven scale) of the most preferred and least preferred product line relative to the opportunity for making money when working on that line. Rosen interpreted a large difference as showing a high preference for profitable products and thus high "money motivation," while a low difference indicated little concern for possible earnings and thus low money motivation. Rosen correlated this measure with other organizational measures over a period of several weeks before and several times after a short notice shifting of foremen among the work groups. The correlation of "money motivation" with performance increased (from .03 to .75 after 16 weeks) after the shifting of foremen. However, Rosen's study used a very small N (seven work groups) and had no control groups. Consequently, his results must be viewed as tentative. Still, his study is one of the few that actually manipulated an important inde- pendent variable in a real organizational setting.
Finally, Wainer and Rubin (1969) analyzed the Thematic Apperception Test (McClelland, Atkinson, Clark, & Lowell, 1953) responses of 51 presidents of small entrepreneurial firms. They scored the responses on nAch, nAff, and nPow and related the scores to a measure of the organization's growth. Briefly, they found that nAch was positively, nonlinearly related to growth while nAff was negatively, nonlinearly related to growth. nPow scores were not related to growth.

8)
Thus cluster analysis, difference scores on Likert ratings, and TAT responses have been used to measure motivation in the organizational effectiveness literature. The measures have been found to be related to performance and growth, but certainly no clear pattern or process of the effect on or relation of motivation to organizational effec- tiveness has emerged.

Motiv
atio
n
CO
Sou
rce
Sam
ple
Ope
ratio
nal
For
m
Rel
ated
To
Rel
atio
nshi
p F
ound
Par
ker
(1965)
Ros
en (
1970)
Wa
ine
r& R
ubin (
1969)
80 w
ork
gro
ups
in a
dece
ntr
aliz
ed w
are
ho
usi
ng
co
mpany.
Sev
en w
ork
gro
up
s in a
fu
rnitu
re f
act
ory
.
51 s
mal
l e
ntr
ep
ren
eu
ria
l fir
ms.
Fact
or
(or
clust
er) a
naly
sis
of
80
va
riabl
es,
this
is o
ne f
act
or - d
efin
ed b
y m
easu
res
of
high
pro
du
ctiv
ity,
wo
rke
r belie
fs t
hat
good
work
lea
ds t
o job
se
curity
, su
perv
isory r
eco
gn
itio
n.
Diff
ere
nce
be
twe
en t
wo 1
-7 p
oin
t Lik
ert
ra
tings
. M
ost
-pre
ferr
ed —
Lea
st-
pre
ferr
ed p
roduct
lin
e,
in t
erm
s o
f m
oney-
maki
ng o
pport
unity.
TA
T r
espo
nses
of
the f
irm
s, p
resi
de
nts
, in
terp
rete
d f
or
nA
ch,
nA
ff,
nP
ow
sco
res.
No a
tte
mp
t m
ade
to
rela
te t
his
to a
ny
oth
er
variable
s.
Corr
ela
ted w
ith w
ork
g
rou
p p
erf
orm
ance
be-
fo
re a
nd a
fte
r an
exp
er-
im
en
tal
ma
nip
ula
tion —
sh
iftin
g f
ore
me
n o
n
short n
otic
e.
Gro
wth
rat
es o
f fir
ms
ove
r la
st t
wo y
ears
, lo
g (y
ear
- 1) —
log
(y
ear
- 2).
Follo
win
g r
's f
ou
nd o
f m
oney-
motiv
atio
n
and
pe
rfo
rma
nce
. B
efo
re m
an
ipu
latio
n .
03
, im
me
dia
tely
aft
er
.33
. 10
wee
ks a
fter, .
33
, an
d .7
5 a
fte
r 16
wee
ks.
nA
ch c
urv
ilinear
po
sitiv
e.
nA
ff c
urv
ilinear
nega
tive,
nP
ow n
ot
rela
ted
. P
att
ern
an
alys
is a
lso
rep
ort
ed
, b
ut
n's
exc
eedin
gly
sm
all.

83.
Morale
This is an often used variable that is difficult to define or even to understand how organizational theorists and researchers are using it. The modal definition seems to view morale as a predisposition in organization members to put forth extra effort in achieving organi- zational goals and objectives. It includes feelings of commitment and is a group phenomena involving extra effort, goal communality, and feelings of belonging. Groups have some degree of morale while individuals have some degree of motivation (and satisfaction). By implication, morale is inferred from group phenomena.
Most measures of morale are ratings, usually obtained from individuals. Beek (I96A), Kavcic, Rus, and Tannenbaum (1971) and Georgopoulos and Tannenbaum (1957) all use individual ratings, usually in a Likert format. However., in some cases their scales could just as easily be construed as measuring satisfaction. Beek's items ask such questions as, "I like doing my job," "I work in a nice department,'1 and "My work is too tiring.' When morale scores are wanted for a unit, the mean of the individual ratings is usually taken to represent the unit's morale score.
Georgopoulos and Tannenbaum (1957), Hage (1965)> and Price (1967) all suggest or use turnover as a measure of an organization's morale. In addition, Price uses absenteeism as an indicator of morale in his review. These measures may indicate morale indirectly, but there are several other factors that could conceivably influence turnover and absenteeism besides morale. March and Simon (1958) offer a potential list. Further- more, though turnover rate is computed for a whole organization, the actual decision to leave an organization is an individual one. Thus turnover probably better reflects individual phenomena such as satis- faction and motivation, than it does morale, a group phenomena.
Guba's (1958) measure of morale appears to be the best one in the liter- ature surveyed. He constructed a measure of morale by first identifying organizations with high and low morale (superintendents of school dis- tricts nominated high and low morale schools), then interviewing members of those organizations, and, finally, using the analysis of these inter- views to construct a questionnaire instrument to measure morale. He then administered the instrument to all the teachers in the schools, and deleted items that did not differentiate the high morale from the low morale schools. This approach, at least, if not his instrument, seems a worthwhile one. However, as with any other ernpirically keyed instrument, the development of a "theory of morale" would not be greatly aided using this approach unless care was taken to build in a theoritical structure in the instrument.

8k,
Relationship to Other Variables.
Beek (1964) found, in his study of assembly line workers, that workers on small assembly lines with more opportunity for social, interaction had higher morale than workers on longer lines with less opportunity for Interactions.
Guba (1958) found that those teachers who scored in the upper quartile on his morale instrument did not differ on a social desirability scale, but did show more confidence in their principal, feel more effective in specific teaching areas, and felt more satisfied.
Kavcic et al. (1971) confirmed their hypothesis that organizations with more participatory styles of management would have higher morale.
Summary.
Little work has been done, aside from Guba's, on building an instrument to tap morale. And Guba's approach is still basically that of using the mean of individual scores to get a group or organization score. The small amount of research done seems to show that the structure of the work situation, satisfaction with work, perceived effectiveness in one's work, and the character of relationships with superiors are all related to morale. »

Mo
ral«
Sour
ce
Sam
ple
Ope
ratio
nal
Form
R
elat
ed T
o R
elat
ions
hip
Foun
d
Bec
k (1
96
4)
Ass
embl
y lin
e w
ork
ers.
In
div
idu
als
on a
ssem
bly
lines
ans
wer
ed
Typ
e o
f as
sem
bly
line.
S
mal
ler
lines
wit
h m
ore
op
po
rtu
nit
y fo
r N
=26
6, i
n an
ele
ctro
nic
s q
ues
tio
nn
aire
ite
ms
aski
ng s
uch
thin
gs a
s C
om
par
ed s
core
s fo
r so
cial i
nte
ract
ion h
ad t
he
high
est
mo
rale
. p
lan
t in t
he
Net
her
lan
ds.
"1 l
ike
do
ing m
y jo
b",
"1 w
ork
in
a ni
ce
thre
e d
iffe
ren
t ty
pes
of
med
ian
in m
ora
le w
as t
he
"tes
t lin
e"
dep
artm
ent"
, "M
y w
ork
is t
oo
tir
ing
", e
tc.
lines
, va
ryin
g i
n si
ze
whi
ch w
as l
on
ger
, w
ith l
ess
op
po
rtu
nit
y fo
r A
ppea
rs t
o t
ap i
nd
ivid
ual
sat
isfa
ctio
n
(nu
mb
er o
f pe
ople
on
in
tera
ctio
n,
bu
t ha
d so
me
alte
rati
on
s fr
om
m
ore
th
an m
ora
le.
Use
d pe
rcen
tage
of
line)
and
op
po
rtu
nit
y a
"reg
ula
r" l
ine,
th
e "r
egu
lar"
lin
e b
ein
g
favo
rab
le r
espo
nses
of
enti
re a
ssem
bly
for
soci
al i
nte
ract
ion
. lo
wes
t in m
ora
le.
line
as t
he
scor
e.
Gub
a (1
958)
11 s
econ
dary
sch
ools
in
Em
pir
ical
ly k
eyed
qu
esti
on
nai
re w
ith
S
core
s on
a q
ues
tio
n-
Sco
res
in t
he
up
per
and
lo
wer
qu
arti
le o
f su
burb
an C
hica
go a
rea.
ite
ms
dev
elo
ped
fro
m i
nte
rvie
ws
wit
h
nai
re t
app
ing s
atis
fac-
th
e m
ora
le i
nst
rum
ent
did
no
t d
iffe
r o
n
168
teac
hers
par
tici
pat
ed.
40 t
each
ers
in s
choo
ls n
om
inat
ed a
s ti
on
, ef
fect
iven
ess
(of
the
con
form
ity
scal
e, b
ut
the
uppe
rs d
id
havi
ng h
igh
and
low
mo
rale
by
supe
r-
the
ind
ivid
ual
tea
cher
).
show
mo
re c
on
fid
ence
in
the
pri
nci
pal
, in
ten
den
ts.
Cal
led t
he
Tea
cher
an
d co
nfi
den
ce i
n th
e fe
el m
ore
eff
ecti
ve i
n sp
ecifi
c te
ach
ing a
reas
. B
ehav
ior
Rat
ing S
cale
. sc
hool p
rin
cip
al.
Als
o
a m
easu
re o
f co
nfo
rm-
ity
of
resp
onse
s (s
ocia
l d
esir
abili
ty).
and
feel m
ore
sat
isfie
d.
Kav
cic, R
us,
&
Fo
ur
ind
ust
rial p
lan
ts i
n 10
qu
esti
on
nai
re i
tem
s re
spon
ded
to o
n A
uth
ors
pre
dic
ted t
hat
R
esul
ts t
end t
o s
up
po
rt t
he
hyp
oth
esis
, b
ut
Tan
nen
bau
m (
19
71
) Y
ug
osl
avia
, N r
ange
d a
5 p
oin
t L
ike
rt s
cale
, m
easu
ring
jo
b
plan
ts w
ith p
arti
cip
a-
N i
s sm
all
and
auth
ors
po
int
ou
t se
vera
l fr
om
65
0-
1995
in
the
mo
tiva
tio
n a
nd i
nvo
lvem
ent
in t
he
tory
sty
les
of
man
age-
al
tern
ativ
e ex
pla
nat
ion
s.
plan
ts.
Th
ey m
anu-
o
rgan
izat
ion
, w
ith f
igur
e« g
iven
fo
r th
« m
ent
wo
uld
hav
e fa
ctu
red r
ub
ber
, sh
oes.
p
lan
t as
a w
ho
le.
(Per
cen
t re
spon
ding
hi
gher
"m
ora
le"
»c
or«
-
and
wo
od p
rod
uct
s (2
).
abov
e m
edia
n w
as t
he
pla
nt's
sco
re.)
or j
ob m
oti
vati
on a
nd
invo
lvem
ent
for
pla
nt
as a
wh
ole
.
oo

86.
Control
Control refers to the degree of, and distribution of management type control that exists within an organization for influencing and directing the behavior of organization members.
The Control Graph.
There does exist a clearly articulated instrument for the measurement of control. It is the "control graph," originated by Tannenbaum (1961, 1962) and the research concerning this instrument has been collected and reviewed in Tannenbaum (1968). Readers are referred to this volume for extensive treatment of control as these researchers have conceptualized and measured it. We wl11 treat only a part of their research here.
The data for constructing a control graph is obtained from a questionnaire containing items like: "In general, how much influence (pull, say, etc.) do each of the following have about things (e.g., operations, behavior, sales, innovation, etc.) around here?" This is followed by a list of the various hierarchical levels (workers, supervisors, managers, etc.) with Likert scales for the subject's responses. Using these data, a graph is constructed which has hierarchical levels along the abscissa ratings of amount of control exercised by the various levels along the ordinate. Various hypotheses about the relationship of the height and shape of the curve to such things as organizational effectiveness ratings or production records can be made and tested.
A number of studies have related this measure of control, or some variant of it, to several other variables such as: organizational effectiveness ratings (Georgopoulos, 1965; Bowers, 1964), archival productivity data (Bachman et al., 1966; Georgopoulos, 1965; Smith & Ari, 1963, 1964), factor analytically derived factors of organizational performance (Bowers, 1964), morale (Smith S Ari, I963, 1964), satisfaction (Bachman et al., 1966; Bowers, 1964), and organizational size, organizational level, and work group size (Baum et al., 1969).
Generally, total control (the sum of the amounts of control at each hierarchical level in the organization) has been found positively related to effectiveness, productivity, morale, and satisfaction. The degree of positive slope of the control graph (degree of democratic supervision) has been related to fewer variables and has found much less support. Concerning this aspect of control, Tannenbaum (1968) concludes that con- cern with power differentials between organizational ranks and the subse- quent concern with attempts to equalize power across ranks are perhaps misplaced, and such concern would be better directed toward maximizing total control.

87.
Laboratory Measurement of Control
Levine and Katzell (1971) conducted a small laboratory study in which they manipulated amount of control and distribution of control, relating these to measures of performance and satisfaction. The lab groups con- tained only three members each and only two levels of the "control" variables were used. Keeping these criticisms in mind, Levine and Katzell still found the amount of control and, to a lesser extent, dis- tribution of control, to be "potent influences" on their performance and satisfaction measures. They also found interaction effects suggest- ing that a higher amount of control and a balanced distribution of control seemed most conducive to better performance on difficult tasks.
Basis of Control.
A different kind of research has focused on a possible basis of control or influence. Several authors have taken French and Raven's (1968) five power bases as a research tool for investigating the sources of super- visory control. The operational measure is usually a Likert scale response to an item asking a subject about the importance of a specific power base for his compliance with a supervisor's requests. Thus five scores, one for each power base (expert, referent, coercive, reward, and legitimate) and occasionally a sixth are usually obtained (Bachman, Smith, 5 Slesinger, 1966). The sixth score is called "incremental influence" and is the sum of expert and referent power scores. This score is thought to represent the power residing in the person occupy- ing the organizational role, which is over and above the power inherent in the organizational role itself (ivancevlch 6 Donnelly, 1970; Student, 1968).
These five or six scores have been correlated with several measures of organizational performance and effectiveness, satisfaction, turnover, absence, etc. Generally, referent and expert power seem positively related to performance, effectiveness, and satisfaction; and negatively related to turnover and absence, though the evidence is far from con- clusive (Bachman et al., Ivancevich & Donnelly, Student). Coercive and legitimate power seem less strongly related to other organizational phenomena.
Finally, Friedlander (1966) derived a statistical factor he called "leader control" in his study of 91 members of a government research and development organization. This factor describes the extent to which a work group.leader initiates and controls the work group process, primarily through domination of the communication system. He did not relate this factor to any other variables.

88.
Summary.
Most of the work on control has been carried out in a programmatic effort by the Michigan researchers, briefly outlined and summarized above. Since it has some history of research and has exhibited fairly stable results, the control graph appears to be a potentially useful instrument.
The work on the power bases of control is less extensive. However, it might be fruitful in future research to combine the methods used to measure these power bases with the control graph (Bachman et al. did this already to some extent). Such research might begin to shed light on the processes involved in the exercise of control in organizations.

Co
ntr
ol
So
urc
e
Sam
ple
Ope
ratio
nal
For
m
Rel
ated
To
Rel
atio
nshi
p F
ound
Bac
hman
, S
mit
h &
36 s
ales
off
ices
, m
ean
N
Sub
ject
s ra
nk
ord
ered
fiv
e "b
ases
of
Sta
nd
ard
ized
sco
res
of
All f
ive
po
wer
bas
es c
orr
elat
ed s
ign
ific
antl
y S
lesi
nger
(1966)
in o
ffic
e =
18.
po
wer
" (e
xper
t, r
efer
ent, c
oer
cive
. d
olla
r p
rod
uct
ivit
y fo
r w
ith s
atis
fact
ion s
core
s, r
efer
ent
and
rew
ard
, le
git
imat
e) r
egar
din
g t
hei
r th
e o
ffic
e (e
qu
ated
fo
r ex
per
t p
ow
er p
osi
tive
ly,
the
oth
er t
hre
e im
po
rtan
ce a
s a
reas
on f
or
com
ply
ing
ex
per
ien
ce l
evel
), a
nd
neg
ativ
ely,
(r's
wer
e fr
om
.51
to .
75,
wit
h m
anag
er.
an o
vera
ll ra
tin
g o
f sa
tisf
acti
on w
ith t
he
way
th
e m
anag
er d
oes
his
job
.
abso
lute
val
ue)
. O
nly
ref
eren
t, e
xper
t, a
nd
re
war
d p
ow
er c
orr
elat
ed s
ign
ific
antl
y w
ith
p
rod
uct
ivit
y,
.40,
.36
, an
d -.
55 r
esp
ecti
vely
. N
ote
, h
ow
ever
, th
at t
he p
ow
er b
ase
scor
es
are
base
d o
n r
anki
ngs
and
thu
s th
e ne
gativ
e co
rrel
atio
ns
may
be
arti
fact
s, (
du
e to
n
atu
re o
f ra
nki
ng
s).
Bac
hman
, S
mit
h,
&
36 s
ales
off
ices
, m
ean
N
Sal
esm
en r
ated
"m
anag
eria
l" a
nd "
sale
s S
tan
dar
diz
ed s
core
s o
f A
ll co
rrel
atio
ns
wer
e si
gn
ific
ant
at .
05
S
lesi
nger
(1
96
6)
in o
ffic
e ■
18.
forc
e" i
nfl
uen
ce o
ver
ind
ivid
ual
sal
es
do
llar
pro
du
ctiv
ity
for
leve
l ex
cep
t fo
r m
anag
eria
l co
ntr
ol
ove
r be
havi
or a
nd o
ffic
e p
ract
ices
, ea
ch o
n th
e o
ffic
e (e
qu
ated
fo
r o
ffic
e co
rrel
ated
wit
h o
ffic
e p
rod
uct
ivit
y.
a 1
— 5
Lik
ert
sca
le.
Th
e ra
tings
wer
e ex
per
ien
ce l
evel
), a
nd
"To
tal
co
ntr
ol"
co
rrel
ated
hig
her
wit
h
sum
med
fo
r a
"to
tal
co
ntr
ol"
mea
sure
. an
ove
rall
rati
ng o
f sa
tisf
acti
on w
ith t
he
way
th
e m
anag
er d
oes
pro
du
ctiv
ity
and
sati
sfac
tio
n t
han
did
ei
ther
of
the
man
ager
ial
or
sale
s fo
rce
con
tro
l sc
ores
, r's
ran
ged
fro
m .
35 t
o .
88.
his
job
.
Bau
m,
Sor
enso
n, &
b
ran
ch o
ffic
es o
f an
T
he
"co
ntr
ol
gra
ph
".
Su
bje
cts
ind
icat
e O
rgan
izat
ion s
ize
and
P
erce
nt a
gre
emen
t on
co
ntr
ol
bet
wee
n t
he
Pla
ce (
1964)
insu
ranc
e co
mp
any.
th
e am
ou
nt
of
infl
uen
ce o
r co
ntr
ol
exer
cise
d b
y o
rgan
izat
ion
al m
embe
rs o
f ea
ch h
iera
rch
ical
lev
el.
Sco
res
for
tota
l co
ntr
ol,
and
jud
gem
ents
ab
ou
t d
istr
i-
bu
tio
n o
f co
ntr
ol
acro
ss o
rgan
izat
ion
al
leve
ls c
an b
e o
bta
ined
fro
m t
his
bas
ic
data
. A
uth
ors
her
e us
e th
e d
ata
to
ob
tain
"p
erce
nta
ge
agre
emen
t" s
core
s co
nce
rnin
g p
erce
pti
on
s o
f or
gani
za-
tio
nal
co
ntr
ol
(by
thre
e le
vels
of
the
org
aniz
atio
n,
man
agem
ent, n
on-s
uper
- vi
sory m
anag
emen
t, a
nd c
leri
cal)
.
org
aniz
atio
nal l
evel
. th
ree
leve
ls o
f th
e o
rgan
izat
ion
s w
as h
ighe
st
for
med
ium
siz
e o
rgan
izat
ion
s an
d lo
wer
fo
r sm
all
and l
arge
org
aniz
atio
ns.
Ag
ree-
m
ent
on t
he
con
tro
l ex
erci
sed
at e
ach
leve
l is
gre
ates
t fo
r th
e lo
wer
and
up
per
lev
els,
le
ss a
gre
emen
t on
co
ntr
ol
exer
cise
d b
y m
idd
le l
evel
s.
Fin
ally
, m
anag
emen
t an
d cl
eric
al l
evel
s ha
d th
e le
ast
agre
emen
t o
n
per
cep
tio
ns
of
con
tro
l, w
hile
th
e tw
o
man
agem
ent
leve
ls h
ad h
ighe
st a
gre
emen
t.
oo

Contr
ol
(cont.)
Sou
rce
Sam
ple
Ope
ratio
nal
For
m
Rel
ated
To
Rel
atio
nshi
p F
ound
Bow
ers
1196
4)
40 life
ins
uran
ce a
genc
ies
The "
co
ntr
ol
gra
ph
".
See
Bau
m,
Sor
en-
An o
vera
ll effect
iveness
E
ffe
ctiv
en
ess
ra
nki
ng
: T
ota
l co
ntr
ol
was
so
n & P
lace
. U
sed
a "t
ota
l contr
ol"
ra
nki
ng
, se
ven
statis
tical
hig
her
in t
he t
op 2
0 a
genc
ies
than i
n t
he
scor
e, a
nd c
ontr
ol
scor
es f
or
four
fact
ors
of
org
aniz
atio
nal
bo
tto
m 2
0 a
genc
ies, a
nd c
on
tro
l at o
ne o
f diffe
rent
org
aniz
atio
nal
leve
ls.
pe
rfo
rma
nce
, an
d m
ea-
sure
s o
f sa
tisfa
ctio
n i
n
five a
reas
.
the f
our
org
an
iza
tion
al
leve
ls c
orr
ela
ted
si
gnifi
cantly
with e
ffect
iveness
(.5
9,
p«
:00
1).
S
atis
fact
ion
: T
ota
l co
ntr
ol
corr
ela
ted s
ig-
nific
antly p
osi
tively (
p<
05)
with a
ll fiv
e
satis
fact
ion f
acet
s, a
nd 1
0 o
f 20 c
orr
ela
tions
be
twe
en t
he f
ive f
acet
s an
d fo
ur
org
aniz
atio
nal
leve
l co
ntr
ol
scor
es w
ere
sig
nifi
cantly
p
osi
tive
. S
even
fa
cto
rs:
Tota
l co
ntr
ol
cor-
re
late
d s
ignifi
cantly
with t
wo o
f se
ven
fact
ors
(-
.32 w
ith A
ge
ncy
Deve
lopm
ent
and
-.55
w
ith B
usin
ess
Cos
ts), s
ix o
f 28 c
orr
ela
tion
s b
etw
ee
n t
he s
even
fact
ors
and f
ou
r o
rga
ni-
za
tional
leve
l co
ntr
ol
scor
es w
ere
sig
nifi
can
t a
t .0
5.
Th
ree o
f th
ese
wer
e fo
r th
e h
om
e
off
ice l
evel
, an
d on
e ea
ch a
t th
e o
the
r th
ree
le
vels
. T
he f
act
or
of
busi
ness
cos
ts c
orr
ela
ted
si
gnifi
cantly
ne
ga
tive
ly w
ith c
on
tro
l at t
hree
of
the f
ou
r le
vels
. N
o o
ther
facto
r co
rrela
ted
at m
ore
than o
ne l
evel
.
Friedla
nder
(1966)
91
mem
bers
of
a g
ove
rn-
ment
rese
arch
and
de
velo
p-
ment
org
an
iza
tion f
rom
th
ree h
iera
rchic
al
leve
ls,
12 g
roup
s.
Sta
tistic
al
fact
or
defin
ed b
y fiv
e q
uest
ion-
naire
ite
ms.
Des
crib
es t
he e
xtent
to
whic
h t
he l
eade
r in
itiate
s an
d co
ntr
ols
th
e gro
up,
prim
arily t
hro
ug
h d
om
ina
tion
o
f th
e co
mm
un
ica
tion s
yste
m.
Calle
d
"Leader
Contr
ol"
, acc
ounte
d f
or
3.3
per
- ce
nt
varia
nce, K
R-2
0= .
55,
test
-rete
st r
(s
ix m
onth
s) =
.5
1.
Noth
ing.
Georg
opoulo
s (1
96
5)
32 s
tatio
ns
of
a re
tail
A m
easu
re c
alle
d "N
orm
ativ
e M
em
ber
Ave
rage
work
er
pro
- N
orm
ativ
e M
em
be
r A
ctiv
eness
co
rre
late
d
mer
chan
dise
de
live
ry
Act
iveness
", t
apped b
y a
sing
le q
uest
ion-
ductivity (
for
each
si
gn
ifica
ntly
with t
hese
tw
o m
easu
res
org
an
iza
tion
. na
ire i
tem
ask
ing
how m
uch
influ
en
ce,
in g
ener
al,
the
sta
tion m
anag
er,
oth
er
supe
rvis
ors,
or
the
men
hav
e on w
hat
goes
in t
he s
tatio
n. R
espo
nded
to o
n a
sta
tion
) an
d an
ave
rage
o
vera
ll perf
orm
ance
ra
ting.
.52 a
nd .
49
, (p
<.0
1), r
esp
ect
ive
ly.
1 -
5 L
ike
rt s
cale
.

Co
ntr
ol
(co
nt.
)
Sou
rce
Sam
ple
O
per
atio
nal F
orm
R
elat
ed T
o
Rel
atio
nsh
ip F
ou
nd
Ivan
cevi
ch &
Do
nn
elly
31
sal
es b
ranc
hes
of
a L
iker
t ra
tings
of
the
five
po
wer
bas
es (
see
Eig
ht
un
it p
erfo
rman
ce
Co
rrel
ated
wit
h t
he
six
"po
wer"
sco
res
wit
h
(19
70
) m
arke
tin
g o
rgan
izat
ion
B
ach
man
,et
al.a
bo
ve)
plus
"in
crem
enta
l m
easu
res
alm
ost
all
of
the
eig
ht
per
form
ance
mea
sure
s, 1
5 o
f 48
(n
um
ber
of
ind
ivid
ual
s in
flu
ence
", t
he
sum
of
the
exp
ert
and
an a
rchi
val
nat
ure
. w
ere
sig
nif
ican
t at
.05 l
evel
. O
ne
for
rew
ard
. ■
394,
bra
nch
was
un
it
refe
ren
t p
ow
er b
ase
ratin
gs.
Sub
ject
s (M
arke
t p
ote
nti
al r
atio
. th
ree
for
exp
ert
po
wer
, fi
ve f
or
refe
ren
t o
f an
alys
is)
rate
d th
eir
lead
ers
on t
hese
po
wer
bas
es.
size
of
orde
rs,
effi
cien
cy
rati
ng
, co
sts,
ro
ute
den
- si
ty,
excu
sed
and u
n-
excu
sed
abse
nces
, an
d
turn
ove
r)
po
wer
, an
d si
x fo
r "i
ncr
emen
tal
infl
uen
ce".
C
oerc
ive
and
leg
itim
ate
po
wer h
ad n
o si
g-
nif
ican
t co
rrel
atio
ns
wit
h t
he p
erfo
rman
ce
mea
sure
s.
Kav
cic, R
us &
F
ou
r Y
ug
osl
ovi
an m
anu
- T
he
con
tro
l gr
aph
for
"act
ual "
and
O
vera
ll ef
fect
iven
ess
Per
fect
ran
k o
rder
co
rrel
atio
n b
etw
een
T
ann
enb
aum
(1
97
1)
fact
uri
ng p
lant
s.
"id
eal"
co
ntr
ol.
ratin
gs o
f th
e fo
ur
plan
ts.
tota
l co
ntr
ol
and t
he
effe
ctiv
enes
s ra
tin
gs
of
the
fou
r p
lan
ts.
Law
renc
e 8t L
orsc
h (1
967)
216 m
anag
ers,
sci
entis
ts.
Sub
ject
s re
spon
ded
on a
5-p
oin
t L
iker
t T
he
amo
un
t o
f kn
ow
- N
o s
tatis
tics
or
scor
es p
rese
nte
d,
auth
ors
an
d e
ngin
eers
in
six
scal
e to
thi
s q
ues
tio
n:
"Ho
w m
uch
le
dge
req
uir
ed t
o m
ake
verb
ally
rev
iew
th
e ex
ten
t to
wh
ich t
he
org
aniz
atio
ns.
in
flu
ence
or
say
do y
ou f
eel
each
of
the
deci
sion
s ab
ou
t p
rod
- le
vels
wh
ere
infl
uen
ce w
as c
on
cen
trat
ed
leve
ls l
iste
d b
elo
w h
as o
n p
rod
uct
-
ucts (
at e
ach
leve
l).
wer
e al
so t
he
leve
ls w
ith t
he
req
uir
ed k
no
w-
inn
ova
tive
dec
isio
ns?
" le
dge.
Co
ncl
ud
e th
at o
rgan
izat
ion
s hi
gh o
n
"in
teg
rati
on
" m
et t
his
sta
te o
f af
fair
s m
ost
fu
lly
.
Levin
e&
Kat»
IH1971)
'Fo
ur
thre
e-p
erso
n
Am
ou
nt
of
con
tro
l an
d d
istr
ibu
tio
n o
f P
erfo
rman
ce a
nd s
atis
- A
NO
VA
sho
wed
sig
nif
ican
t m
ain e
ffec
ts o
n gr
oups
co
mp
etin
g i
n co
ntr
ol
wer
e se
t at
tw
o l
evel
s ea
ch b
y fa
ctio
n m
easu
res
rele
van
per
form
ance
and
sat
isfa
ctio
n f
or
bo
th a
mo
un
a
lab
ora
tory
sim
ula
- th
e ex
per
imen
tal
man
ipu
lati
on
s.
to t
he l
abor
ator
y ta
sk.
and
dis
trib
uti
on o
f co
ntr
ol.
Inte
ract
ion
ti
on
. ef
fect
s su
gges
ted
that
a h
ighe
r am
ou
nt
of
con
tro
l w
ith a
bal
ance
d d
istr
ibu
tio
n s
eem
ed
mor
e co
nd
uci
ve t
o h
igh
er p
erfo
rman
ce.
Sm
ith &
Ari (
19
63
-19
64
) 32
sta
tio
ns
of
a n
atio
n-
Th
e "c
on
tro
l g
rap
h".
See
Bau
m,
et a
l. A
vera
ge p
rod
uct
ivit
y M
ora
le w
as s
ign
ific
antl
y p
osi
tive
ly c
orr
elat
ed
wid
e re
tail
del
iver
y ab
ove.
Her
e th
e au
tho
rs l
oo
ked a
t d
ata,
sta
tio
n "
mo
rale
" w
ith b
oth
to
tal
con
tro
l an
d de
gree
of
org
aniz
atio
n.
tota
l co
ntr
ol
and
degr
ee o
f d
emo
crat
ic
and n
orm
ativ
e co
n-
dem
ocr
atic
sup
ervi
sion
, w
hile
pro
du
ctiv
ity
supe
rvis
ion
(as
reve
aled
by
the
shap
e o
r ce
nsus
mea
sure
s.
was
so
rela
ted w
ith t
ota
l co
ntr
ol,
bu
t sl
ope
of
the
con
tro
l gr
aph)
. (T
ota
l co
n-
insi
gn
ific
antl
y co
rrel
ated
wit
h d
emo
crat
ic
tro
l an
d sl
ope
corr
elat
ed -
.67,
so
par
tial
su
perv
isio
n.
Gen
eral c
once
nsus
was
pos
- co
rrel
atio
ns
wit
h o
ther
var
iabl
es w
ere
itiv
ely
corr
elat
ed w
ith t
ota
l co
ntr
ol,
no
t ca
lcu
late
d f
or
thes
e tw
o v
aria
ble
s.)
rela
ted t
o d
emo
crat
ic s
uper
visi
on.

Co
ntr
ol
(co
nt.
) M
Sou
rce
Sam
ple
Ope
ratio
nal
For
m
Rel
ated
To
Rel
atio
nshi
p F
ound
Stu
den
t (1
968)
46
8 h
ou
rly
empl
oyee
s in
4
0 w
ork
gro
ups
of
an
app
lian
ce m
anu
fact
uri
ng
p
lan
t.
Wo
rk g
rou
p is
u
nit o
f an
alys
is.
Mea
sure
d th
e fi
ve p
ow
er b
ases
(se
e B
ach
man
, et
al.
abov
e) a
nd "
Incr
emen
tal
Infl
uen
ce"
(Ivan
cevi
ch &
Do
nn
elly
, ab
ove
) b
y a
sing
le r
atin
g f
or
each
po
wer
ba
se.
Wo
rker
s ra
ted e
xten
t to
wh
ich
th
ey c
om
plie
d w
ith t
hei
r su
perv
isor
be-
ca
use
of
this
po
wer
bas
e.
Tan
neb
aum
(1
96
1-1
96
2)
Str
atif
ied r
and
om
sam
ple
of
104
(ou
t o
f 10
00)
Leag
ue o
f W
om
en's
V
ote
rs u
nit
s.
Th
e "c
on
tro
l g
rap
h".
See
Bau
m,
et a
l ab
ove.
Use
d 'T
ota
l C
on
tro
l" s
core
s an
d m
easu
re o
f d
emo
crat
ic c
on
tro
l (p
osi
tive
slo
pe o
f hi
s g
rap
h).
To
tal
con
tro
l an
d de
gree
of
po
siti
ve s
lope
co
rrel
ated
.14
.
Acc
iden
ts,
abse
nces
, tu
rnov
er.,
seve
ral
cost
m
easu
res, p
erfo
rman
ce
agai
nst
sche
dule
, q
ual
ity
and
sugg
estio
ns
sub
mit
ted
.
Org
aniz
atio
nal
eff
ect-
iv
enes
s, a
s m
easu
red
by
exp
ert
ratin
gs (
29 p
er-
sons
at
nat
ion
al h
ead-
q
uar
ters
rat
ed e
ach
org
aniz
atio
n o
n a
scal
e o
of 0
-10
0,
ratin
gs
aver
aged
), an
d by
p
erce
nt
of
qu
esti
on
- na
ires
ret
urn
ed b
efo
re
follo
wu
p (
two m
ea-
sure
s co
rrel
ate
.33)
.
Inte
rco
rrel
ated
fiv
e p
ow
er b
ase
mea
sure
s an
d in
crem
enta
l in
flu
ence
, al
l r's
wer
e p
osi
tive
, 10
of
15 s
ign
ific
ant
at .
05 o
r sm
alle
r p
rob
abili
ty l
evel
. O
nly
exp
ert
po
wer
sig
nif
ican
tly
rela
ted t
o a
ccid
ents
(-
.28,
p<
.05).
Ref
eren
t, e
xper
t p
ow
er a
nd
incr
emen
tal
infl
uen
ce c
orr
elat
ed s
igni
- fi
can
tly
neg
ativ
ely
wit
h e
xcus
ed a
bsen
ces,
al
l o
ther
co
rrel
atio
ns
bet
wee
n p
ow
er b
ases
an
d ex
cuse
d ab
senc
es,
unex
cuse
d ab
senc
es,
and
turn
ove
rs w
ere
insi
gn
ific
ant.
Fo
urt
een
o
f 4
8 c
orr
elat
ion
s b
etw
een t
he
po
wer
bas
es
and
the
rem
ain
ing p
erfo
rman
ce m
easu
res
(ref
er t
o p
revi
ous
colu
mn
) w
ere
sig
nif
ican
t.
Incr
emen
tal
infl
uen
ce a
nd r
efer
ent
po
wer
ea
ch h
ad f
ou
r (o
f si
x to
tal) s
ign
ific
ant
cor-
re
lati
on
s; e
xper
t, r
ewar
d,
and c
oer
cive
po
wer
ea
ch h
ad t
wo s
ign
ific
ant
corr
elat
ion
s (a
gain
o
ut
of
six)
. L
egit
imat
e p
ow
er w
as n
ot
sig
nif
ican
tly
corr
elat
ed w
ith a
ny
of
the
per
form
ance
mea
sure
s.
Par
tial c
orr
elat
ion
s (o
rgan
izat
ion s
ize
par
tial
led o
ut) o
f to
tal
con
tro
l an
d d
egre
e o
f d
emo
crat
ic c
on
tro
l w
ith e
ffec
tive
nes
s w
ere
.29
and
.31,
res
pec
tive
ly.
Par
tial
co
rrel
atio
ns
wit
h t
he
rate
of
retu
rn m
easu
re
was
.2
3 (
po
siti
ve s
lope
, p
<.0
05)
and .
10
(t
ota
l co
ntr
ol,
p<
.15).

93.
Conf 1ict/Cohes ion
This appears to be a bipolar dimension defined at the cohesion end by an organization in which the members like one another, work well together, communicate fully and openly, and coordinate their work efforts. At the other end lies the organization with verbal and phy- sical clashes, poor coordination, and ineffective communication.
Most methods of measuring this variable are subjective. Cohesion is usually assessed by some form of social attractiveness rating, while the methods of measuring conflict have been more varied. There even was one attempt to measure conflict with archival records.
Sociometric Techniques. Lodahl and Porter (1961), studying airline shop workers, measured the cohesiveness of a work group by having the men within a work group write down the names of other work group mem- bers with whom they would prefer to work. Using this data they com- puted a reciprocal choice index (a reciprocal choice being the case when A chooses B and B chooses A). This index was RC/RCmax where RCmax = nxk + 2, where n = number in the group and k = number of choices allowed for each group member. The higher the index, the more cohesive the group. Lodahl and Porter found scores on this index unrelated to a measure of group productivity, except in groups which had a technical necessity for working with other groups. They also related the index to means and standard deviations on the Super- visory Ability and Decision Making Ability scales of GhiseIll's Seif- Description Inventory (Ghisel1i , 1971), finding only a negative cor- relation between cohesion and the standard deviation of the Super- visory Ability scale.
Marcus (1962) employed a similar index. In his study, social case workers were asked to name their five best friends in the office. By determining the proportion of such choices made for workers within their own units, Marcus could then dichotomize units as high or low on cohesion. Marcus found that more cohesive groups were less pro- ductive. Sherif (1957, 1958), in his study of pre-pubescent boys at summer camp also employed a sociometric choice questionnaire, but used it to measure the amount of conflict between members of dif- ferent groups, rather than within group cohesion. He found that intergroup conflict decreased after "superordinate" goals (an attrac- tive goal achievable only by cooperation of two groups) were imposed on conflicting groups.
Rosen (1970) had furniture factor workers rate the desirability or attractiveness of entire work groups, rather than nominating indi- viduals. The workers rated seven groups and each work group's cohesion score was the mean desirability score assigned it by i ts

3k.
members. Rosen found that cohesion correlated positively with group productivity before (r = .69) and several weeks after a short-notice shifting around of the work group's foremen (r = .k~j) , but correlated zero immediately after the shift (note N = 7, however).
Observation.
Both Sherif and Marcus also used independent observation of groups to assess cohesion. Sherif used observation primarily to identify naturally occurring groups while Marcus actually charted the number of times workers spoke to each other during a 24-hour period. Marcus reports that this method gave similar results to those found using the sociometric choice technique (described above).
Questionnai res. Hastings and Hinings (1970) used questionnaire items designed to tap the professional values of accountants in England in an attempt to measure "professional/bureaucrat conflict." They com- pared the responses on six dimensions in an attempt to locate differ- ences between accountants in industry and those not in industry. All six dimensions yielded a coefficient alpha over .70. Generally, for accountants in industry, they found lessened commitment to pro- fessional values which supposedly implies greater conflict for that group.
Fullan (1970) used a mailed questionnaire to measure "worker inte- gration" for a large sample (1491) of Canadian industrial workers. His sample included workers in the printing, automobile, and oil industries. The questionnaire attempted to tap the extent to which the workers perceived themselves as isolated versus linked together through interaction in five different areas: fellow worker rela- tionships, first-line supervisor relationships, labor-management relationships, status structure, and company evaluation. He then compared the three industries on "integration" scores for the five areas. Generally, he found refinery workers most integrated, auto workers the least, and printers in between. His "integration" approximates cohesion, especially for fellow workers and first-line supervisor relationships.
Both Lawrence and Lorsch (1967) and Burke (1970) used a unique method to measure the way groups resolve conflict. They presented 25 aphorisms (examples are "Might overcomes right," "Soft hands win hard hearts") to their subjects (managers in both cases). The man- agers then indicated the extent to which a particular phrase repre- sented a typical way of handling conflict in their organization (Lawrence & Lorsch) or the way he himself or his superior typically handled conflict (Burke). They responded on a five-point scale

95,
anchored from "very typical behavior" to "behavior which never occurs." Lawrence and Lorsch factor analyzed their data, derived three factors, and used scores on these three factors to represent a group's mode of conflict resolution. Their data are claimed to support confrontation as the most effective mode of resolving conflict; but Burke failed to replicate this finding (due to effec- tiveness criterion problems). Burke also found that another mode of conflict resolution, "smoothing over," was related to an indi- vidual's perception of having good and constructive experiences wi th conf1ict.
Factor Analysis of Questionnaire Data.
Aside from Lawrence and Lorsch's effort, Friedlander (1966) and Mahoney and Weitzel (1969) used factor analysis of questionnaire data and found factors that seemed to measure various aspects of conflict/cohesion. Friedlander analyzed 70 items designed to tap interactional dimensions of work groups. His sample con- sisted of 91 members of a government research organization, from three different hierarchical levels. Two factors seem relevant for measuring conflict/cohesion: "intragroup trust vs. intragroup competitiveness," defined at one end by groups in which the members have trust and confidence in each other and defined at the other end by a collection of individuals reluctant to sacrifice their individual personal opinions and ideas for the sake of a working consensus; and "submission to vs. rebellion against leaders," groups at the positive end of this factor tend to submit to the leader while groups at the other end are inclined to rebellion. Both these factors had five items as their definers.
Mahoney and Weitzel's factor analysis of 11^ effectiveness variables across 283 suborganizational units yielded three factors that seem relevant here. Their names and the authors' descriptions are: (1) cohesion, defined as the degree of complaints and grievances, con- flict among cliques within the organization; (2) conflict, defined as the degree of conflict with other organization units about authority or failure to meet responsibilities; and, (3) coordination, defined as the degree to which a unit coordinates and schedules activities with other organizations, utilizes staff assistance.
Archival Records.
Britt and Guile (1972) attempted to measure industrial conflict by using archival data. They wanted to measure three different dimen- sions of conflict—proneness to conflict, extensiveness of conflict, and intensity of conflict. To do this they used different combina- tions of the following four scores: WKRS = number of workers

96.
employed; WS = number of work stoppages from strikes, walkouts, and lockouts; Wl = number of workers involved in work stops; and MDI = number of man-days idle from work stops. Using these basic measures, they derived:
volume of conflict = (MDI i SKRS) 100 proneness to conflict = WS extensiveness of conflict = (Wl 4 WS * WKRS) (1000) intensity of conflict = MDI 4 Wl
Summary.
A number of different populations have been measured in a number of different ways in an attempt to operationalize conflict/cohesion. It appears that sociometric choice techniques are most popular for within group cohesion measures, while questionnaire responses are used to tap larger populations across organizations. On occasion the questionnaires are subjected to factor analysis in an attempt to simplify matters.
These measures are not converging on a single concept of conflict/ cohesion by any means. At least three trends exist: one Is the measurement of small group cohesion in the form of liking one another, liking to work together, etc.; another is the attempt to look at pos- sible conflict across organizational hierarchical levels and organ- izational types; and the last an attempt to isolate ways of resolving conflict between groups.

Co
nfl
ict
— C
ohes
ion
Sou
rce
Sam
ple
Ope
ratio
nal
For
m
Rel
ated
To
Rel
atio
nshi
p F
ound
Bri
« &
Gal
le (
1972)
Arc
hiv
al d
ata
pu
blis
hed
in
Sev
eral f
orm
ula
s m
akin
g u
se o
f In
du
stry
typ
e, a
vera
ge
Rel
atio
ns
to i
nd
ust
ry t
ype
do
ne
pri
mar
ily
vari
ous
Fede
ral
pu
blic
a-
arch
ival r
ecor
ds o
f n
um
ber
of
wo
rker
s u
nio
n s
ize, a
nd d
egre
e fo
r ill
ust
rati
on
, av
erag
e u
nio
n s
ize
was
ti
on
s on
in
du
stri
al t
ype.
em
plo
yed
, n
um
ber
of
wo
rk s
topp
ages
, o
f u
nio
niz
atio
n.
po
siti
vely c
orr
elat
ed w
ith t
wo o
f th
e u
nio
niz
atio
n,
and
wo
rk
nu
mb
er o
f w
ork
ers
invo
lved
in
fou
r fo
rmu
la
scor
es,
degr
ee o
f u
nio
n-
stop
page
s.
wo
rk s
topp
ages
and
nu
mb
er o
f da
ys
idle
fro
m w
ork
sto
ps.
izat
ion w
as p
osi
tive
ly c
orr
elat
ed w
ith
al
l fo
ur.
Pat
h a
naly
sis
also
was
at
tem
pte
d.
Bu
rke
(19
70
) 74
man
ager
s em
plo
yed i
n U
sed
resp
onse
s to
25
apho
rism
s by
th
e C
rite
rio
n m
easu
re
the
engi
neer
ing
dep
artm
ent
man
ager
s to
mea
sure
th
e w
ay t
he
was
in
effe
ctiv
e so
no
o
f a
larg
e co
rpo
rati
on
. m
anag
ers
and
thei
r su
peri
ors
reso
lved
co
nfl
ict
in t
he
org
aniz
atio
n.
rela
tio
nsh
ips
to e
ffec
t-
iven
ess
rep
ort
ed.
Fri
edla
nd
er (
19
66
) 91 m
embe
rs o
f a
gove
rn-
Sta
tist
ical f
acto
r d
eriv
ed f
rom
ana
lysi
s N
o a
ttem
pt
mad
e to
m
ent
rese
arch
org
aniz
a-
of
70 q
ues
tio
nn
aire
ite
ms.
Cal
led
rela
te t
his
to a
ny
oth
er
tio
n,
fro
m t
hre
e o
rgan
i-
"sub
mis
sion
to v
s. r
ebel
lion a
gain
st
vari
able
s.
zati
on
al l
evel
s, 1
2 gr
oups
. le
ader
".
KR - 2
0 = .
52 a
nd t
est-
rete
st
r =
.50
(6 m
on
ths)
.
Fri
edla
nd
er (
19
66
) 91
mem
bers
of
a go
vern
- S
tati
stic
al f
acto
r de
rive
d fr
om
ana
lysi
s C
orr
elat
ed g
rou
p m
ean
Neg
ativ
ely
corr
elat
ed w
ith e
du
cati
on
al l
evel
. m
ent
rese
arch
org
aniz
a-
of
70 q
ues
tio
nn
aire
ite
ms.
Cal
led
fact
or
scor
es w
ith f
ou
r gr
oup
size
, an
d g
rou
p h
iera
rch
ical l
evel
. ti
on
, fr
om
th
ree
orga
ni-
"In
trag
rou
p t
rust
vs. I
ntr
agro
up
d
emo
gra
ph
ic v
aria
bles
: T
hu
s la
rge
grou
ps h
igh
in t
he
org
aniz
atio
n
zati
on
al l
evel
s, 1
2 gr
oups
. co
mp
etit
iven
ess.
" K
R -
20 »
.7
3 a
nd
ag
e, t
enu
re,
occu
pa-
wit
h m
ore
ed
uca
ted m
embe
rs s
aw t
hem
- te
st-r
etes
t r
» .6
8 (
six
mo
nth
s).
tio
nal
and
ed
uca
tio
nal
le
vels
, as
wel
l as
gro
up
ill
s an
d gr
oup
hien
rehl
ca
l le
vel.
selv
es a
s m
ore
co
mp
etit
ive.
Fu
llan (
19
70
) Q
ues
tio
nn
aire
sur
vey
of
Res
pons
es t
o i
tem
s th
at
aske
d th
e ex
ten
t T
ype
of
ind
ust
ry o
r G
ener
ally
, th
e re
fin
ery
wo
rker
s w
ere
mo
st
wo
rker
s in
oil
refi
ner
y.
to w
hic
h t
he
sub
ject
per
ceiv
ed h
imse
lf
tech
no
log
y (s
ee s
ampl
e in
teg
rate
d,
auto
wo
rker
s le
ast
inte
gra
ted
. au
to m
anu
fact
uri
ng a
nd
as i
sola
ted
or
linke
d t
og
eth
er t
hro
ug
h
colu
mn
).
and
the
pri
nte
rs s
core
d b
etw
een t
hose
p
rin
tin
g i
ndus
trie
s in
in
tera
ctio
n,
in f
ive
area
s:
rela
tio
n t
o
two g
roup
s.
x2 f
or
tech
no
log
y ty
pe
and
Can
ada.
fe
llow
wo
rker
s, t
o f
irst
-lin
e su
perv
isor
s,
lab
or-
man
agem
ent
rela
tio
nsh
ips,
sta
tus
stru
ctu
re,
and
eval
uat
ion o
f th
e co
m-
pan
y.
Cal
led
this
deg
ree
of
'Wo
rker
Inte
gra
tio
n".
•
the
five
are
as o
f in
teg
rati
on s
core
s w
ere
all
sig
nif
ican
t p
<;0
01,
U5

Co
nfl
ict
— C
ohes
ion
(co
nt.
)
Sou
rce
Sam
ple
Ope
ratio
nal
For
m
Rel
ated
To
Rel
atio
nshi
p F
ound
Has
tings
& H
inin
gs (
1970)
Qu
esti
on
nai
re s
urve
y o
f Q
ues
tio
nn
aire
ite
ms
tap
pin
g s
ix
Sit
uat
ion
al r
ole
of
the
Acc
ou
nta
nts "
in i
nd
ust
ry"
show
ed l
ess
prof
essi
onal a
cco
un
tan
ts
dim
ensi
ons
o
f pr
ofes
sion
al v
alue
s ac
cou
nta
nt
(wh
eth
er
com
mit
men
t t
o p
rofe
ssio
nal
valu
es
in E
ng
lan
d.
for
acco
un
tan
ts i
n E
ngla
nd.
Thes
e he
wo
rked
"in
ind
us-
on f
ou
r o
f th
e si
x d
imen
sio
ns.
M
ore
sc
ores
use
d to
ass
ess
degr
ee o
f co
nfl
ict
try
" or
no
t, t
hose
in
refi
ned
tes
ts w
ith
in t
he
"in i
nd
ust
ry"
of
prof
essi
onal - b
ure
aucr
at r
oles
. in
du
stry
sho
uld
have
m
ore
con
flic
t.)
sam
ple
wer
e al
so m
ade.
Law
ren
ce &
Lor
sch
(1967)
216
man
ager
s, e
ngin
eers
. S
ubje
cts
resp
onde
d on
a 5
po
int
scal
e R
anki
ng o
f th
e o
rgan
i-
Th
e m
ore
eff
ecti
ve (
pro
fit-
wis
e) o
rgan
i- an
d sc
ient
ists
in
six
ind
icat
ing t
he
degr
ee t
o w
hic
h e
ach
of
zatio
ns o
n p
rofi
t m
ea-
zati
on
s us
ed t
he
con
fro
nta
tio
n m
od
e o
f o
rgan
izat
ion
s, o
per
atin
g
25 a
phor
ism
s de
scri
bed
typ
ical
way
s o
f su
res, b
y o
rth
og
on
al
han
dlin
g c
on
flic
t m
ore
oft
en t
han
th
e in
th
e ch
emic
al
han
dlin
g c
on
flic
t in t
hei
r o
rgan
izat
ion
. m
ean
com
pari
sons
. le
ss e
ffec
tive
org
aniz
atio
ns.
in
du
stry
. F
acto
r an
alys
is y
ield
ed t
hre
e fa
cto
rs
and
fact
or
scor
es w
ere
the
mea
sure
s us
ed.
Lo
da
hl&
Po
rter
(1961)
62 w
ork
gro
ups
at a
S
ubje
cts
wro
te d
ow
n t
he n
ames
of
the
A g
rou
p p
rod
uct
ivit
y C
ohes
ion
scor
es w
ere
un
rela
ted t
o
mai
nte
nan
ce b
ase
of
an
men
in
thei
r g
rou
p w
ith w
ho
m t
hey
m
easu
re r
efle
ctin
g t
he
Pro
du
ctiv
ity,
exc
ept
in g
roup
s w
her
e ai
rlin
e.
(N =
ap
pro
xim
atel
y p
refe
rred
to
wo
rk. U
sing
thi
s, a
uth
ors
ex
ten
t to
wh
ich g
roup
s th
ere
was
a t
ech
nic
al n
eces
sity f
or
nine
per
gro
up
) co
mp
ute
d a
n in
dex
refl
ecti
ng t
he
achi
eved
tim
e st
anda
rds
coo
per
atio
n w
ith o
ther
wo
rk g
roup
s re
cipr
ocal c
hoic
es (
A c
hoos
e B
, B
choo
se
set
for
thei
r w
ork
, as
(c
orr
elat
ion d
ata)
. T
he
stan
dar
d d
evia
- A
) m
ade
by a
wo
rk g
rou
p.
Th
e h
igh
er t
he
wel
l as
sco
res
on t
wo
ti
on o
f th
e S
up
ervi
sory A
bili
ties
SD
I in
dex
, th
e hi
gher
th
e co
hesi
on.
scal
es o
f G
hise
lli's S
elf-
D
escr
ipti
on I
nve
nto
ry
(co
mp
lete
d b
y al
l gr
oup
mem
ber
s).
scal
e sc
ores
wer
e si
gn
ific
antl
y n
egat
ivel
y co
rrel
ated
wit
h c
ohes
ion
(-.2
8,
p<
05
).
Au
tho
rs c
on
clu
ded
th
at n
o si
mp
le
exp
lan
atio
n a
cco
un
ted f
or
the
resu
lts.
Mah
on
ey &
We
it2
el
(1909)
Qu
esti
on
nai
re s
urve
y o
f S
tati
stic
al f
acto
rs d
eriv
ed f
rom
ana
lysi
s A
sin
gle
rati
ng o
f th
e Th
ese
fact
ors
did
no
t ap
pea
r in
th
e se
t o
f pe
rson
nel
in 2
83 o
rgan
i- o
f re
spon
ses
to t
he
qu
esti
on
nai
re i
tem
s un
its o
vera
ll ef
fect
ive-
se
ven
fact
ors
th
at a
cco
un
ted f
or
all
bu
t za
tio
nal
su
b-u
nit
s.
(wh
ich w
ere
dra
wn f
rom
a r
evie
w o
f ne
ss b
y a
supe
rior
of
two p
erce
nt
of
the
vari
ance
of
the
rati
ng
o
rgan
izat
ion
s w
ere
of
prev
ious
lit
erat
ure
of
org
aniz
atio
nal
th
e u
nit
's s
uper
viso
r, i
n p
red
icte
d b
y th
e re
gres
sion
eq
uat
ion
. T
hat
va
riou
s ty
pes.
ef
fect
iven
ess)
. T
hre
e fa
ctor
s se
em t
o
a m
ult
iple
reg
ress
ion
is,
they
co
ntr
ibu
ted h
ard
ly a
nyt
hin
g t
o t
he
refl
ect
con
flic
t-co
hes
ion
, th
ey w
ere
equ
atio
n w
ith 2
1 o
ther
p
red
icti
on o
f ef
fect
iven
ess
(acr
oss
"co
hes
ion
", "
co
nfl
ict"
, an
d "c
oo
rdi-
n
atio
n".
fa
cto
rs.
org
aniz
atio
n t
ypes
).
Mar
cus
(1962)
12 w
ork
gro
ups
in a
n W
orke
rs w
ere
aske
dto
nam
e th
eir
five
bes
t O
rien
tati
on o
f su
per-
M
ore
coh
esiv
e u
nit
s w
ere
less
pro
du
ctiv
e.
urba
n d
epar
tmen
t o
f fr
ien
ds
in t
he
off
ice, u
nits
dic
ho
tom
ized
vi
sors (
"gro
up
" o
r gr
oups
wit
h "
gro
up
-ori
ente
d"
supe
rvis
ors
wel
fare
, fi
ve c
ase-
on
pro
po
rtio
n o
f th
ese
choi
ces
mad
e "p
roce
du
re"
ori
ente
d)
wer
e le
ss c
ohes
ive.
Au
tho
r re
po
rts
no
wo
rker
s an
d a
supe
r-
wit
hin
th
eir
ow
n u
nits
. S
om
e u
nit
s w
ere
and
pro
du
ctiv
ity
of
qu
anti
tati
ve d
ata,
on
ly c
oncl
usio
ns.
viso
r pe
r g
rou
p.
char
ted f
or
nu
mb
er o
f tim
es w
ork
ers
spok
e w
ith o
ne
ano
ther
. B
oth
met
ho
ds
gave
sim
ilar
resu
lts.
grou
p (p
rop
ort
ion o
f vi
sits
mad
e by
wo
rker
s to
clie
nts
' ho
mes
.)
CD

Co
nfl
ict - C
ohes
ion
(co
nt.
)
Sour
ce
Sam
ple
Ope
ratio
nal
Form
R
elat
ed T
o R
elat
ions
hip
Foun
d'
Ros
en (
1970)
Sev
en w
ork
gro
ups
in a
fu
rnit
ure
fac
tory
(ei
gh
t •
ten
mem
ber
s).
Wo
rk g
roup
mem
bers r
anke
d t
he
de-
sira
bili
ty o
r at
trac
tiven
ess
of
all
seve
n w
ork g
roup
s, c
ohes
ion
scor
e fo
r a
wo
rk g
rou
p w
as t
he
mea
n ra
nki
ng o
f a
grou
p by
its m
embe
rs.
Sh
erif (
19
57 - 1
958)
P
re-p
ubes
cent b
oys
at a
su
mm
er c
amp
, as f
ou
nd
in n
atu
rally
occ
urr
ing
gr
oups
.
Use
d so
cio
met
ric
cho
ice
qu
esti
on
nai
res
and
ob
serv
atio
n t
o d
eter
min
e in
ter-
g
rou
p c
on
flic
t, a
dje
ctiv
e ch
eck
lists
o
n i
n-a
nd
-ou
t-o
f g
rou
p p
erso
ns.
Sev
eral m
easu
res:
p
rod
uct
ivit
y, f
ore
men
pr
efer
ence
, g
rou
p
cons
ensu
s on
fo
rem
en
pre
fere
nce
, g
rou
p
mo
ney
-mo
tiva
tio
n,
and
man
agem
ent
pres
sure
.
Th
e im
po
siti
on o
f a
sup
ero
rdin
ate
goal -
a
goal t
hat i
s ve
ry a
t-
trac
tive
bu
t ac
hiev
able
o
nly i
f th
e gr
oups
co
op
erat
e.
Co
rrel
atio
ns
com
pu
ted b
efo
re a
nd a
fter a
n ex
per
imen
tal
man
ipu
lati
on (
sho
rt n
oti
ce
shif
tin
g o
f g
rou
p f
ore
men
).
Gen
eral
ly,
low i
nte
rco
rrel
atio
ns
of
vari
able
s im
med
iate
ly a
fter
man
ipu
lati
on
, g
rad
ual
ly
incr
easi
ng t
o t
he
high l
evel
s fo
un
d b
efo
re
man
ipu
lati
on c
oh
esio
n o
riq
inal
ly c
orr
elat
ed
.69
wit
h g
rou
p p
rod
uct
ivit
y, d
rop
ped
to
ze
ro a
fter
th
e sh
ift, a
nd r
ose
to .
47 a
fter
11
wee
ks.
Aft
er
such
goa
ls w
ere
invo
ked a
nd t
he
grou
ps a
chie
ved
them
, co
nfl
ict
bet
wee
n
the
two g
roup
s de
crea
sed.
(
Incr
ease
d
con
tact
.alo
ne
did n
ot
acco
un
t fo
r th
e de
crea
sed
con
flic
t.)
3

100.
Flexibi1ity/Adaptation (Adaptat ion/Innovation)
This variable refers to the ability of an organization to change its standard operating procedures in response to environmental changes. Many authors have written about this dimension (Benedict, Calder, Callahan, 6 Hornstein, 1967; Burns, 1961; Gomson, 1968; Hall, 1972; Henry, 1968; Humber, I960; Utterback, 1971; Indik, 1970; Bennis, 1971; Price, 1967; Korman, 1970, but relatively few have made attempts to measure it.
Mahoney and Weitzel (1969) and Aiken and Hage (1971) both appeared to converge on the measurement of similar concepts. Mahoney and Weitzel, factor analyzing questionnaire responses, derived two factors called "flexibility," or willingness to try out new ideas and suggestions, readiness to tackle unusual problems; and "initiation," defined as initiation of improvements in work methods and operations. These factors seem to tap something similar to Aiken and Hage's measure of "innovation." They define this as the generat'ion, acceptance, and implementation of new ideas, processes, products, or services for the first time in an organizational setting, and measure it by the number of new programs or services successfully implemented by an organiza- tion over a three-year period. However, it appears that their measure was somewhat more subjective than might be guessed from their defini- tion. The authors interviewed the organization heads (16 health and welfare organizations in a midwest urban center), and made judgments about what constituted an innovation based on these interviews.
Mahoney and Weitzel entered their variables into a multiple regression equation with an overall effectiveness rating as the predicted cri- terion. Based on this, they found that "initiation" was one of seven (out of 2k) factors that produced a .7** multiple correlation with effectiveness. "Flexibility" was not one of these seven factors. (When all 2k factors were entered into the multiple regression equa- tion, an R of .76 was found, only .02 higher than the seven-factor equation.)
Aiken and Hage related their measure of innovation to a number of measures of other organizational factors. Several were statistically significant at a = .05 or better and the actual values were as fol- lows: degree of complexity (number of occupational titles) .59; professionalism (degree of extra organizational political activity) .63; intensity of scheduled and unscheduled communications, .53 and .61, respectively; and formalization of rules and procedures (presence of a rules manual) -.60.

101
Goodman (1970) did not measure the innovation dimension in any direct way, but he presented kd managers with a list of eight organizational criteria, two of which were called "quick reaction capability" and "flexibility of staffing." He then asked the managers to rank these criteria in terms of their importance for organizational design. "Quick reaction." ranked fifth, "flexibility" sixth.
Finally, Olmstead (1972) attempted to operationalize Bennis' (1970 model of an organization in a laboratory simulation study. He postu- lated four components of organizational competence, one of which he called Adaptability, defined as coinciding with the problem solving ability and flexibility of the organization. He measured Adaptability by having the communications among subject groups scored for the pres- ence or absence of a specific process and the quality of performance of that process. A communication was categorized into one of seven ■ processes (sensing, communicating sensed information, decision making, stabilizing, communicating implementations, coping actions, and feed- back) and was scored for adaptability if it fell into one of three: decision making, communicating implementation, and coping actions. Unfortunately, exact scoring details were not given. Olmstead also had an effectiveness score (as evaluated by field grade officers) for the ten groups (N ■ 12 in each group) of Army officers that participated in the study. Adaptability correlated .79 with effec- tiveness as follows: decision making, .78; communicating implemen- tation, .75; coping actions, .70.
Summary.
It appears that this dimension is positively related to overall effec- tiveness, and is thought to be of "middling" importance to managers. Aiken and Hage's data also seem to indicate that flexibility may be negatively related to the degree to which rules and procedures have been formalized.

Fle
xib
ilit
y —
Ad
apta
tio
n
Sou
rce
Sam
ple
Op
era
tio
na
l F
orm
R
elat
ed T
o R
ela
tio
ns
hip
Fo
un
d
Aik
en &
Hag
e (1
97
1)
Inte
rvie
ws
wit
h 5
20 s
taff
N
um
ber
of
new p
rogr
ams
or
serv
ices
S
ever
al o
rgan
izat
ion
al
All
of
the
vari
able
s w
ere
sig
nif
ican
tly
mem
bers
of
16 h
ealt
h a
nd
succ
essf
ully i
mp
lem
ente
d b
y th
e or
gan-
fa
cto
rs:
com
ple
xity
. co
rrel
ated
wit
h f
lexib
ilit
y - a
dap
tati
on
w
elfa
re o
rgan
izat
ion
s in
iz
atio
n d
uri
ng a
th
ree-
year
per
iod —
as
pro
fess
ion
alis
m,
inte
n-
as t
hey
mea
sure i
t.
(p»
.05
) a
mid
wes
t m
etro
po
lis.
det
erm
ined
fro
m i
nte
rvie
w d
ata.
si
ty o
f sc
hedu
le c
om
mu
n
icat
ion
s, i
nte
nsi
ty a
nd
dir
ecti
on o
f un
sche
d-
uled
co
mm
un
icat
ion
s,
form
aliz
atio
n o
f ru
les
and
proc
edur
es,
slac
k re
sour
ces, j
oin
t pr
o-
gram
s, p
erce
nt
size
in
crea
se,
his
tory
of
inn
ova
tio
n.
Go
od
man
(1
97
0)
46 m
anag
ers
Man
ager
s ra
nk o
rder
ed e
igh
t cr
iter
ia i
n te
rms
of
imp
ort
ance
to o
rgan
izat
ion
al
desi
gn.
Tw
o o
f th
ese
wer
e "f
lexib
ilit
y
of
staf
fin
g"
- ab
ility
to a
pp
ly h
um
an
reso
urce
s w
hen
and
whe
re n
eed
ed,
and
"Q
uic
k re
acti
on c
apab
ility
", a
bili
ty t
o
reac
t q
uic
kly
to c
hang
es.
No
thin
g
"Fle
xib
ilit
y o
f st
affi
ng
" w
as r
anke
d s
ixth
, "Q
uic
k re
acti
on
" w
as r
anke
d f
ifth
.
Mah
on
ey &
Wei
tzeM
196
9)
Qu
esti
on
nai
re d
ata.
28
3
Tw
o s
tatis
tical f
acto
rs (
fro
m t
he
ques
- A
rat
ing o
f ov
eral
l V
ario
us
con
fig
ura
tio
ns
of
the
fact
ors
wer
e W
eitz
el,
Mah
on
ey 8
c su
buni
ts o
f o
rgan
izat
ion
s ti
on
nai
re d
ata)
, ca
lled
"Fle
xib
ilit
y"
• ef
fect
iven
ess
for
each
fo
un
d (
in a
ste
p-w
ise
regr
essi
on),
for
Cra
nd
all
(1971)
acro
ss a
var
iety
of
typ
es
will
ing
ly t
ries
ou
t n
ew i
deas
and
su
bu
nit
, as
par
t o
f a
dif
fere
nt
type
s o
f o
rgan
izat
ion
s an
d o
f o
rgan
izat
ion
s.
sugg
estio
ns,
read
y to
tac
kle
unus
ual
mu
ltip
le r
egre
ssio
n d
iffe
ren
t le
vels o
f m
an
ag
em
en
t/'lm
tia
tio
n"
Pro
blem
s, a
nü "
Init
iati
on
" •
init
iate
» eq
uat
ion
. w
as o
ne
of
seve
n fa
cto
rs t
hat
co
ntr
ibu
ted
im
pro
vem
ents
in
wo
rk m
eth
od
s an
d m
uch
to t
he
regr
essi
on e
qu
atio
n,
"fle
x-
op
erat
ion
s.
ibil
ity
" w
as n
ot.
CH
mst
ead
(197
2)
10 g
roup
s o
f 12
mili
tary
M
easu
red
"Ad
ap
tab
ilit
y"
by s
cori
ng t
he
Ove
rall
rati
ng o
f ef
fec-
"A
dap
tib
ilit
y"
corr
elat
ed .
79 w
ith e
ffec
- o
ffic
ers
par
tici
pat
ed i
n an
co
mm
un
icat
ion
s se
nt b
y th
e gr
oups
fo
r tiv
enes
s o
f g
rou
p a
s ev
al
tiven
ess, t
he
proc
esse
s m
akin
g u
p "
adap
t-
eig
ht-
ho
ur
sim
ula
tio
n o
f a
the
pres
ence
of
and
qu
alit
y o
f p
er-
uat
ed b
y ex
per
ien
ced
ib
ilit
y"
corr
elat
ed w
ith e
ffec
tive
nes
s as
b
atta
lion s
taff e
ngag
ed i
n fo
rman
ce o
f th
ree
proc
esse
s:
dec
isio
n-
fiel
d g
rade
off
icer
s fo
llow
s:
deci
sion
mak
ing
, .7
8,
com
mu
ni-
in
tern
al d
efen
sive
act
ivit
y.
mak
ing
, co
mm
un
icat
ing i
mp
lem
enta
tio
n.
usin
g pr
e-es
tabl
ishe
d ca
ting
imp
lem
enta
tio
n,
.75,
cop
ing
an
d co
pin
g a
ctio
ns.
(Met
ho
d o
f sc
orin
g cr
iter
ia.
acti
on
, .
70.
no
t gi
ven
in d
etai
l.)
*

103.
Goal Consensus
This variable refers to the degree to which all individuals perceive the same goals for an organization. This variable is distinct from actual commitment to those goals.
There have been three fairly direct attempts to measure goal con- sensus in organizations and one experimental study that indirectly approaches the measurement of goal consensus. Relative to the latter, Sherif (1957, 1958), in his study of twelve-year-old boys at summer camp, imposed superordinate goals (compelling and highly appealing goals that require the cooperation of two or more groups for their achievement) on groups that were in conflict. The groups' level of conflict lessened after they expended effort toward achiev- ing these goals. While Sherif made no attempt to measure the con- sensus of the groups' perception of the goal or goals they sought, it seems a fairly safe assumption that such consensus existed, since the groups cooperated in attempting to achieve these goals. All this says, and admittedly in an indirect fashion, is that goals which are compelling, highly appealing, and require cooperation for their achievement are probably goals about which consensus can be found or reached.
The three direct attempts to measure npal consensus are those by Simpson and Gulley (1962), Vroom (I960), and Lawrence and Lorsch (1967). Simpson and Gulley mailed a questionnaire to voluntary organizations in which they asked (among other things) how many goals the organization was pursuing. If the organization was pur- suing four goals or less they called the organization "focused," If more than four goals, "diffuse." Their obvious assumption was that the more goals the more diffusion of purpose which in turn might lead to less consensus. This inference is ours, not thei rs.
Vroom (I960) and Lawrence and Lorsch (1967) approached the problem by submitting lists of goal statements (Vroom) or organizational criteria (Lawrence £ Lorsch) to organization members who then ranked these stimuli in order of preference or importance. Vroom had individuals rank goal statements in -order of their own preference and in order of preference as they thought top management would rank the goals. He also had managers rank the statements according to their own preferences. Lawrence and Lorsch had various members (managers, scientists, and engineers) of six organizations choose the three top organizational criteria from a list of ten, and then choose the next three most important. These criteria were sup- posedly related to product and process innovation in an organization.

10*».
Vroom does not report the correlation of subordinate rankings and management rankings, but was concerned instead with attitudes toward the organization and with the accuracy of perceptions of organiza- tional goals and perceived agreement of organizational goals. In fact, he partialed out "real" agreement when he correlated the vari- ables just mentioned. However, he does report that middle and top managements' goal statement rankings correlated .76.
Lawrence and Lorsch label their criterion rankings as the "goal orientation of members" and they were primarily concerned with the relationship of goal orientation to "differentiation" of the various subsystems of an organization. They were more concerned with uncovering a lack of goal consensus and their study was an ambitious attempt to cover many variables, but at some cost in rigor, as they themselves point out.
Summary.
Goal consensus has been primarily measured by a ranking procedure, wherein organization members make their goal preferences known. These lists can then be correlated to see how much consensus exists within the organization across levels, for instance (or within a level).

Goa
l C
onse
nsus
Sou
rce
Sam
ple
Ope
ratio
nal
For
m
Rel
ated
To
R
elat
ions
hip
Fou
nd
Law
ren
ce &
Lor
sch
(1967)
216 m
anag
ers,
sci
entis
ts,
and
engi
neer
s in s
ix
org
aniz
atio
ns.
Sh
erif (
1957-1
958)
Sim
pson
& G
ulle
y (1
96
2)
Nat
ura
lly o
ccu
rin
g g
roup
s o
f bo
ys (
11-1
2 y
rs.
old
) at
a s
um
mer
cam
p.
Mai
l su
rvey
of
211
volu
nta
ry a
ssoc
iatio
ns.
Vro
om
(19
60
) 16
76 e
mp
loye
es i
n la
rge
ind
ust
rial
o
rgan
izat
ion
.
Sub
ject
s ch
ose
the
thre
e m
ost
im
po
rtan
t an
d th
ree
nex
t m
ost
imp
ort
ant
orga
ni-
zati
on
al c
rite
ria
fro
m a
lis
t o
f 10
cri
teri
a se
en a
s re
leva
nt
to p
rod
uct
an
d p
roce
ss
inn
ova
tio
n.
Th
e 10
cri
teri
a fe
ll in
to
thre
e ca
tego
ries
of
"ori
en
tati
on
" — m
ar-
ket, t
ech
nic
al-e
con
om
ic,
scie
nce.
Au
tho
rs i
mpo
sed
sup
ero
rdin
ate
goal
s (c
om
pel
ling
, h
igh
ly a
pp
ealin
g g
oals
re
qu
irin
g c
oo
per
atio
n o
f gr
oups
fo
r th
eir
ach
ieve
men
t) o
n gr
oups
in
con
- fl
ict.
Pre
sum
ably
, co
nsen
sus
was
rea
ched
on
the
se g
oals
.
Cla
ssifi
ed o
rgan
izat
ion
s as
hav
ing
focu
sed
on d
iffu
se g
oals (
focu
sed
= 1-
4 st
ated
goa
ls,
dif
fuse
>4 g
oals
), p
resu
mab
ly
less
goa
l co
nsen
sus
in d
iffu
se g
oal
org
aniz
atio
ns.
Wo
rker
s ra
nke
d g
oal
stat
emen
ts i
n o
rder
o
f th
eir
pre
fere
nce
an
d i
n o
rder
of
pref
eren
ce t
hey
th
ou
gh
t to
p m
anag
e-
men
t w
ou
ld h
ave.
Man
agem
ent
ran
k ed
go
al s
tate
men
ts i
n o
rder
of
thei
r p
refe
ren
ce.
Mem
ber
ship
in
a fu
nc-
ti
on
al s
ubsy
stem
of
the
org
aniz
atio
n,
each
of
wh
ich s
uppo
sedl
y op
erat
es i
n a
dif
fere
nt
envi
ron
men
t an
d w
ou
ld
dem
and d
iffe
ren
t go
al
ori
enta
tio
ns.
Th
e su
b-
syst
ems
wer
e sa
les,
ap
plie
d r
esea
rch,
fu
nd
- am
enta
l re
sear
ch,
pro-
d
uct
ion
.
Gro
up C
on
flic
t.
Deg
ree
of
cen
tral
izat
ion
m
emb
ersh
ip i
nvol
ve-
men
t, a
nd i
nte
rnal
co
mm
un
icat
ion o
f th
e as
soci
atio
ns.
Att
itu
des
to
war
d t
he
org
aniz
atio
n,
and
also
re
late
d r
anki
ngs
to o
ne
ano
ther
fo
r m
idd
le a
nd
top m
anag
emen
t.
Sale
s p
erso
nn
el i
n a
ll si
x o
rgan
izat
ion
s ch
ose
mar
ket
crit
eria
as
mo
st i
mp
ort
ant;
p
rod
uct
ion p
erso
nnel i
n al
l si
x o
rgan
iza-
tio
ns c
hose
tec
hn
ical - e
con
om
ic c
rite
ria;
ap
plie
d r
esea
rch
pers
onne
l in f
ive
orga
ni-
zatio
ns c
hose
tec
hn
ical -
eco
no
mic
, on
e ch
ose
scie
nce;
fu
nd
amen
tal
rese
arch
per
- so
nnel s
plit
eve
nly
, th
ree
chos
e sc
ienc
e,
thre
e ch
ose
tech
nic
al-e
con
om
ic.
Co
nfl
ict
bet
wee
n g
roup
s w
as r
edu
ced a
fter
im
po
siti
on o
f th
e su
per
ord
inat
e go
al a
nd
at
tem
pts
to a
chie
ve i
t b
y co
op
erat
ion w
ere
mad
e.
No
clea
r re
lati
on
ship
s fo
un
d b
ecau
se t
he
auth
ors
incl
ud
ed a
no
ther
dim
ensi
on
, in
ter-
na
l vs
. ex
tern
al o
rien
tati
on
, in
th
e an
alys
is,
clas
sify
ing
org
aniz
atio
ns
as f
ocu
sed - i
nte
r-
nal,
focu
sed
- ext
ern
al,
dif
fuse
d - i
nte
rnal
, d
iffu
sed - e
xter
nal
. T
hey
did
no
t pr
esen
t re
sults
fo
r ju
st f
ocus
ed v
s. d
iffu
se o
rgan
iza-
tio
ns.
(No s
tati
stic
al t
ests
wer
e m
ade
at a
ll be
caus
e th
e sa
mpl
e w
as n
ot
ran
do
m,
on
ly
orde
r o
f m
edia
n s
core
s ex
amin
ed.)
Did
no
t co
rrel
ate
the
wo
rker
and
man
age-
m
ent
goal r
anki
ng
s, b
ut
mid
dle
and
to
p m
an
agem
ent
goal r
anki
ngs
corr
elat
ed .
76.
Fav
or
abili
ty o
f at
titu
de
tow
ard o
rgan
izat
ion c
orr
e la
ted
.28 (
p<^,
01)
wit
h p
erce
ived
ag
reem
ent
of w
ork
er-m
anag
emen
t go
als.
Thos
e w
ith
fa
vora
ble
atti
tud
es m
ore
acc
ura
tely p
erce
ivec
th
ose
org
aniz
atio
nal
goa
ls w
ith w
hic
h t
hey
a-
gree
d th
an t
hey
did
th
ose
wit
h w
hic
h t
hey
.
disa
gree
d. P
arti
al s
up
po
rt f
ou
nd f
or
no
tio
n
that
tho
se w
ith
un
favo
rab
le a
ttit
ud
es w
ou
ld
mor
e ac
cura
tely
per
ceiv
e go
als
wit
h w
hic
h t
he
disa
gree
d th
an t
hose
wit
h w
hic
h t
hey
agr
eed.

106.
Role and Norm Congruence
This variable is seen as the degree to which the members of an organization are in agreement on such things as what kinds of super- visory attitudes are best, performance expectations, morale, role
requirements, etc.
The Michigan researchers (Georgopoulos, 1965; Smith £ Ari, 1963, 1964) have conducted most of the work with this variable, but two other studies are also relevant (Aram, Morgan, & Esbeck, 1971; Friedlander, 1966).
The Michigan group used a questionnaire methodology with their sample of delivery truck organizations in an attempt to get at several para- meters of role and norm congruence, or consistency. Almost always, five-point Likert formats were used for such questions as, "How do you feel about the morale in your station?," "How do the men in your sta- tion feel about the morale?," "To what extent do people in the dif- ferent jobs in your station see eye to eye on things concerning the every- day operations of the station?," etc. Using such items Smith and Ari measured "member uniformity or consensus" by focusing on the relative similarity in item responses. Georgopoulos used similar items to determine: (a) internal normative consistency—or the extent of the similarity between prevai1ing and des i red norms in an organization; (b) normative congruence—or the extent of similarity between the "generalized" and corresponding individual aspects of norms; (c) normative consensus—or the degree of agreement within groups; and (d) normative complementarity—or the extent to which expectations of interacting groups about norms that involve their relationships are similar or complementary.
Usually one to three questions serve as the operational form for the concepts outlined above, and averages of all the individual scores are used as the organization or group scores. The Michigan researchers have usually correlated these measures with measures of productivity and/or ratings of overall organizational performance, generally finding significant positive correlations.
Aram et al. used 18 statements derived from the literature concerning interpersonal relationships on project teams as operational attempts to measure the degree of collaboration and consensus existing in an organization. The subjects, who were scientists, engineers, and lab technicians in a rubber manufacturer's research and development center, allocated five points to two options for each of the 18 statements. One option described a collaborative-consensual orientation while the

107.
other described a coercive-compromise orientation. The total col- laboration-consensus score and several component scores were then correlated with a rating of the research team's effectiveness. No significant correlations were found.
In his factor analytic study (principal components, varimax method on 70 questionnaire variables with 91 subjects from three hierarchical levels of a government research and development organization), Fried- lander identified a factor he called "Role and Idea Conformity," which was defined by three items: (1) others act the role expected of them, (2) divergent ideas are discouraged at meetings, and (3) the chairman (of meetings) is oriented toward production and efficiency. However, the factor accounted for only two percent of the common variance.
Summary.
All attempts to measure this variable were via questionnaires; how- ever, the three studies outlined above seem to each be measuring a somewhat different aspect of this variable. Georgopoulos and Smith and Ari report finding significant positive relationships between their measures and overall effectiveness, while Aram et al. did not. Friedlander did not relate his factor to effectiveness. We might question whether the small number of items researchers have employed as operational forms of their concepts are adequate for the task of measuring those seemingly complex notions.

Rol
e an
d N
orm
Co
ng
ruen
ce
Sou
rce
Sam
ple
Ope
ratio
nal
For
m
Rel
ated
To
Rel
atio
nshi
p F
ound
Ara
m,
Mo
raan
, & E
sbec
k 11
0 sc
ient
ists
, en
gine
ers.
S
ubje
cts
allo
cate
d f
ive
poin
ts b
etw
een a
O
vera
ll w
ork
gro
up
C
orr
elat
ed e
ffec
tive
nes
s an
d co
llab
ora
tio
n -
(1
97
1)
and
lab
tech
nici
ans
at a
"c
olla
bo
rati
ve-c
on
sen
sual
" o
rien
tati
on
p
erfo
rman
ce r
atin
g
cons
ensu
s to
tal
and
com
po
nen
t sc
ores
, no
re
sear
ch c
ente
r o
f a
rub
ber
an
d a
"co
erci
on
-co
mp
rom
ise"
ori
enta
tio
n
by t
hre
e ex
per
ts u
sing
si
gn
ific
ant
corr
elat
ion
s fo
un
d.
man
ufa
ctu
rer.
16 w
ork
fo
r ea
ch o
f 18
sta
tem
ents
dra
wn f
rom
p
aire
d c
om
par
iso
n
grou
ps.
liter
atu
re o
n in
terp
erso
nal r
elat
ion
ship
s on
pro
ject
tea
ms.
Ob
tain
ed a "
colla
bo
ra-
tion-
cons
ensu
s" t
ota
l sc
ore
and
thre
e co
m-
po
nen
t sc
ores
.
tech
niq
ue.
Fri
edla
nd
er (
19
66
) 91 m
embe
rs o
f a
gove
rn-
men
t re
sear
ch o
rgan
izat
ion
fr
om
th
ree
hie
rarc
hic
al
leve
ls.
Sta
tist
ical
fac
tor
deri
ved
fro
m a
naly
sis
of
70 q
ues
tio
nn
aire
ite
ms,
cal
led
"Ro
le
and
Idea
Co
nfo
rmit
y",
def
ined
by
thre
e ite
ms, d
eals
wit
h:
actin
g ro
le e
xpec
ted
o
f o
ne,
dis
cour
agem
ent
of
div
erg
ent
idea
s, a
nd l
eade
r o
rien
tati
on t
ow
ard
p
rod
uct
ion a
nd e
ffic
ien
cy.
Acc
ou
nte
d f
oi
two p
erce
nt
vari
ance
. K
R-2
0 = .
52,
six
mo
nth
tes
t-re
test
= .
51.
No
thin
g.
Geo
rgop
oulo
s (1
965)
32 u
nit
s o
f a
nat
ion
wid
e V
aria
ble
cal
led
"In
tern
al N
orm
ativ
e O
rgan
izat
ion
al e
ffec
t-
Co
mp
ute
d p
hi's
bet
wee
n t
he d
ich
oto
miz
ed
reta
il d
eliv
ery
org
aniz
a-
Co
nsi
sten
cy", m
easu
red
by t
he
corr
ela-
iv
enes
s ra
tings
and
"C
on
sist
ency
" va
riab
le m
easu
res
and t
he
tio
n.
tio
n o
f tw
o q
uest
ions
con
cern
ing
pro
du
ctiv
ity
dat
a.
dic
ho
tom
ized
eff
ectiv
enes
s m
easu
res.
in
flu
ence
pos
sess
ed a
nd "
sho
uld b
e"
dic
ho
tom
ized
sta
tions
P
hi's r
ange
d fr
om .
38 - .
50,
p<
.01).
po
sses
sed
by t
he
stat
ion
man
ager
, o
ther
on
the
se v
aria
bles
su
perv
isor
s, t
he
wo
rker
s.
Sta
tio
ns
wer
e al
so.
rank
ord
ered
and
th
en d
ich
oto
miz
ed o
n th
eir
corr
elat
ion v
alue
s.
(Th
e co
rrel
a-
tio
ns
rang
ed f
rom
-.3
0 t
o .
84
).
Geo
rgop
oulo
s (1
965)
32 u
nit
s o
f a
nat
ion
wid
e V
aria
ble
cal
led "
No
rmat
ive
Co
ng
ruen
ce".
O
rgan
izat
ion
al e
ffec
t-
Co
mp
ute
d p
hi's
bet
wee
n t
wo e
ffec
tive
nes
s re
tail
del
iver
y o
rgan
iza-
m
easu
red
by t
he
corr
elat
ion b
etw
een
iv
enes
s ra
tings
and
m
easu
res
and
the
"co
ng
ruen
ce v
aria
ble
" ti
on
. tw
o q
uest
ions
ab
ou
t m
ora
le
(Ho
w d
o
you f
eel
abo
ut
stat
ion m
oral
e an
d h
ow
d
o t
he
men
fee
l ab
ou
t st
atio
n m
ora
le).
D
ich
oto
miz
ed s
tati
on
s ba
sed
on c
orre
la-
tio
ns
valu
e.
(The
se c
orr
elat
ion
s ra
nged
fr
om
.48
to .
92)
pro
du
ctiv
ity
dat
a,
dic
ho
tom
ized
sta
tio
ns
on t
hese
var
iabl
es
also
.
equa
led
.25
in b
oth
cas
es,
p<
.05.
o
CO

Rol
e an
d N
orm
Con
grue
nce
(co
nt.
)
Sou
rce
Sam
ple
Ope
ratio
nal
For
m
Rel
ated
To
Rel
atio
nshi
p F
ound
Geo
rgo
po
ulo
s (1
965)
Geo
rgo
po
ulo
s(19
65)
32 u
nit
s o
f a
nat
ion
wid
e re
tail
del
iver
y or
gani
za-
tio
n.
32 u
nit
s o
f a
nat
ion
wid
e re
tail
del
iver
y o
rgan
iza-
ti
on
.
Sm
ith &
Ari (
1963-1
964)
32 u
nit
s o
f a
nat
ion
wid
e re
tail
del
iver
y o
rgan
iza-
ti
on
.
Var
iab
le c
alle
d "N
orm
ativ
e C
onse
nsus
",
mea
sure
d by
res
pons
e to
a q
ues
tio
n
aski
ng t
o w
hat
deg
ree
peop
le i
n d
iffe
ren
t jo
bs i
n th
e st
atio
n s
aw e
ye t
o e
ye o
n o
per
atio
nal m
atte
rs.
(5-p
oin
t L
iker
t re
spon
se.)
Var
iab
le c
alle
d "N
orm
ativ
e C
om
ple
men
t-
ari
ty", m
easu
red
by m
ean
stat
ion s
core
s on
th
ree
qu
esti
on
nai
re i
tem
s. (
Exte
nt
to
wh
ich 1
.) w
hat
sup
ervi
sors
exp
ect
is
rig
ht
2.)
supe
rvis
or i
s n
ot
unne
cess
arily
st
rict
3.)
org
aniz
atio
nal p
ress
ures
fo
r p
erfo
rman
ce a
re n
ot
un
reas
on
able
),
5-p
oin
t L
ike
rt S
cale r
espo
nses
.
Var
iab
le c
alle
d M
emb
er U
nif
orm
ity o
r C
onse
nsus
, m
easu
red
by v
ario
us q
uest
ion-
na
ire
item
s on
wo
rk g
rou
p s
tand
ards
, m
emb
er s
up
po
rt o
f o
rgan
izat
ion a
nd
supe
rvis
ory
beh
avio
r, a
nd o
vera
ll co
nsen
sus.
Org
aniz
atio
nal e
ffec
t-
iven
ess
ratin
gs a
nd
pro
du
ctiv
ity
dat
a,
dic
ho
tom
ized
sta
tions
on
the
se v
aria
bles
al
so.
Org
aniz
atio
nal
eff
ect-
iv
enes
s ra
tings
and
p
rod
uct
ivit
y d
ata,
d
ich
oto
miz
ed s
tati
on
s on
the
se v
aria
bles
al
so.
To
tal
con
tro
l an
d po
s-
itiv
e sl
ope
of
a "c
on
- tr
ol
gra
ph
" (d
egre
e o
f d
emo
crat
ic s
uper
- vi
sion
fo
rm)
and
pro
du
ctiv
ity.
Co
rrel
ated
con
sens
us,
effe
ctiv
enes
s,
and
pro
du
ctiv
ity,
r =
.54
bet
wee
n
cons
ensu
s an
d p
rod
uct
ivit
y, .
55 b
etw
een
co
nsen
sus
and
effe
ctiv
enes
s,
(bo
th p
^.0
1)
Co
rrel
ated
th
e th
ree
item
s w
ith t
he
two
ef
fect
iven
ess
mea
sure
s, a
ll r's
sig
nif
ican
t at
.01
, ra
nged
fro
m .
49 t
o .
64.
10 s
epar
ate
cons
ensu
s m
easu
res
wer
e in
ter-
co
rrel
ated
, w
ith g
ener
ally l
ow i
nte
rco
rrel
a-
tio
ns.
To
tal
con
tro
l co
rrel
ated
sig
nif
ican
tly
wit
h f
ive
of
the
10 c
onse
nsus
mea
sure
s,
wh
ile d
egre
e o
f po
sitiv
e sl
ope
had
on
ly
two o
f 10
sig
nif
ican
t co
rrel
atio
ns.
A
com
bin
atio
n o
f th
e 10
con
sens
us m
ea-
sure
s si
gn
ific
antl
y p
osi
tive
ly w
ith t
ota
l co
ntr
ol,
mo
rale
, an
d p
rod
uct
ivit
y.
It
did
no
t co
rrel
ate
wit
h p
ositi
ve s
lope
of
the
con
tro
l g
rap
h.
o

no.
Managerial Task Skills
This variable refers to the overall level of skills the organization's managers, commanding officers, or group leaders possess for performing tasks centered on work to be done, and not the skills employed when interacting with other organizational members.
This aspect of managerial skill has seen relatively little research when compared to managerial interpersonal skills. Two studies using factor analysis have yielded factors that seem to tap this variable. From their analysis of survey questionnaires completed by members of 283 organizational subunits, Mahoney and Weitzel (1969) derived a factor they named "Planning." It was characterized by such things as having operations planned and scheduled to avoid lost time and by devoting little time to minor crises. Seashore and Yuchtman (1967), in their analysis of an insurance company's records, found a factor they named "Management Emphasis." However, it was defined by only one high loading, that for manager's commissions. Seashore and Yuchtman comment that they think it may reflect a manager's emphasis on short-run gains by doing more selling himself, rather than empha- sizing long-run gains by developing his staff.
Bowers and Seashore (1966) used questionnaire items to tap a vari- able they call "work facilitation." They define this as behavior that helps achieve goal attainment by doing such things as sched- uling, coordinating, planning, and providing tools, materials, technical knowledge or other resources. They measured this variable at the "peer" and "manager" level.
Finally, Goodman (1970) asked kd managers to rank "ability to provide good technical supervision" along with seven other criteria of organ- izational effectiveness in terms of importance for organizational design. The managers ranked it fourth.
In addition to the studies mentioned above, two studies used some form of overall ranking or other measure that partially incorporated the "task skill" notion. That is, the studies considered the total performance of the manager. Rosen (1970) had members of seven work groups (ten per group) rank all the foremen (of the groups) on overall preferabi1ity; Kavcic, Rus, and Tannenbaum (1971) had 17 "experts" familiar with four Yugoslavian manufacturing plants rank order the plants in terms of management quality.

11
As already noted, little has been done in the way of operationalizing the measurement of Managerial Task Skills, and what has been done does not appear extremely useful. Perhaps this is due to the small amount of knowledge existing about the tasks that managers actually perform (Campbell, Dunnette, Lawler, 6 Weick, 1970).
Relationship to Other Variables.
Bowers and Seashore found no relationship between their measure of three dimensions of leadership and the criterion factor tapping the managers' task performance.
Kavcic et al. found a perfect rank order correlation between the ranking of management quality and the ranking of overall effective- ness, but recall that N = h here. Lieberson and O'Connor (1972) found that a change in top management leadership accounted only for very small percentages of sales, income, and profit when compared to the variance accounted for by industry type and position of the organization within the industry. Rosen found that work unit per- formance correlated highly with foreman preference before the fore- men were shifted around on short notice, that the correlation dropped to zero shortly after the shift and then reached near pre-shift levels eleven weeks later.
Finally, Seashore and Yuchtman did not relate the "Management Emphasis" factor to any other variables, but examined its stability over a ten-year period, concluding that it had an intermediate level of stabi1i ty.
Summary.
The amount of managerial task skills in an organization have not been inventoried in any systematic way. There has been no real attempt to tap this variable operationally, short of Mahoney and Weitzel's ques- tionnaire that yielded the "Planning" factor. It is true that the familiar instruments of leadership behavior (Leadership Opinion Questionnaire, Leadership Behavior Description Questionnaire) give measures of the amount of structure imposed by leaders, but this is really an interpersonal relationship measure and is dealt with in that section of this report.
It appears from the little evidence available that Managerial Task Skills are probably positively related to organizational effective- ness. One would be surprised if it were otherwise.
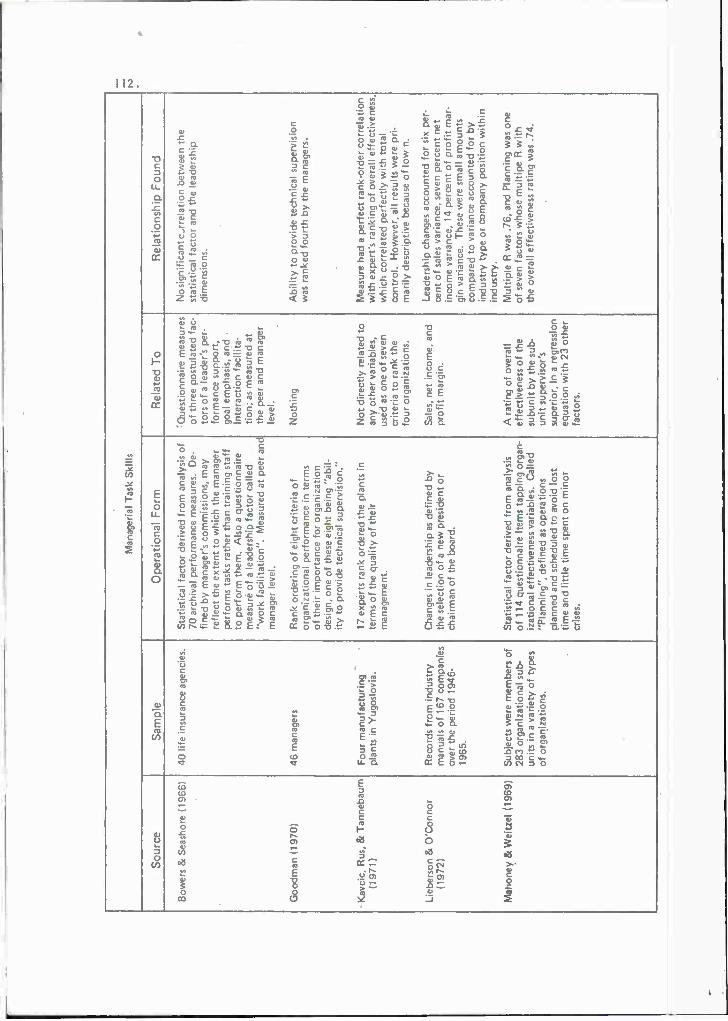
Man
ager
ial
Ta
sk S
kills
Sou
rce
Sam
ple
Ope
ratio
nal
For
m
Rel
ated
To
Rel
atio
nshi
p F
ound
Bow
ers
& S
eash
ore
(1966)
40 l
ife i
nsur
ance
age
ncie
s.
Sta
tistic
al
fact
or
de
rive
d f
rom
ana
lysi
s o
f r Q
ue
stio
nn
aire m
easu
res
Nosig
nific
antc
rrela
tion b
etw
ee
n t
he
70
arc
hiv
al
pe
rfo
rma
nce
mea
sure
s.
De-
o
f th
ree p
ost
ula
ted f
ac-
st
atis
tical
facto
r an
d th
e l
eaders
hip
fin
ed b
y m
anag
er's c
om
mis
sio
ns, m
ay
tors
of
a le
ader
's p
er-
dim
en
sio
ns.
re
flect
the e
xtent
to w
hic
h t
he m
anag
er
form
ance
su
pp
ort
. p
erf
orm
s ta
sks
rath
er
than t
rain
ing s
taff
go
al e
mph
asis
, an
d to
perf
orm
th
em
. A
lso a
quest
ionnaire
in
tera
ctio
n f
aci
lita
- m
easu
re o
f a
lead
ersh
ip f
acto
r ca
lled
tion;
as m
easu
red
at
"work
fa
cili
tatio
n".
Mea
sure
d a
t pe
er a
nti
the p
eer
and
man
ager
m
anag
er l
evel
. le
vel.
Go
od
ma
n (
19
70
) 46 m
anag
ers
Ra
nk
ord
erin
g o
f e
igh
t cr
iteria o
f o
rga
niz
atio
na
l p
erf
orm
an
ce i
n t
erm
s o
f th
eir i
mport
ance
for
org
aniz
atio
n
desi
gn,
one
of
thes
e e
igh
t bein
g "
abil-
ity t
o p
rovi
de t
ech
nic
al
superv
isio
n."
Noth
ing
A
bili
ty t
o p
rovi
de t
ech
nic
al
superv
isio
n
was
ranke
d f
ourt
h b
y th
e m
anag
ers.
Kavc
ic.
Rus
, &
Ta
nn
eb
au
m
Four
ma
nu
fact
urin
g
17 e
xpert
s ra
nk
ord
ere
d t
he p
lan
ts i
n
No
t directly r
ela
ted t
o
Mea
sure
had
a p
erf
ect
ra
nk-
ord
er
corr
ela
tion
(1
97
1)
pla
nts
in Y
ugosl
ovi
a.
term
s o
f th
e q
ua
lity o
f th
eir
a
ny
oth
er
varia
ble
s,
with
exp
ert
's r
an
kin
g o
f ove
rall
effect
iveness
, m
anag
emen
t. us
ed a
s on
e o
f se
ven
crite
ria t
o r
an
k th
e
fou
r org
aniz
atio
ns.
whic
h c
orr
ela
ted p
erf
ect
ly w
ith t
ota
l co
ntr
ol.
Ho
we
ver, a
ll re
sults
were
pri-
marily d
esc
rip
tive b
ecau
se o
f lo
w n
.
Lie
bers
on &
O'C
on
no
r R
ecor
ds fro
m in
du
stry
C
hang
es i
n l
eaders
hip
as
defin
ed b
y S
ales
, net
inco
me
, and
Leaders
hip
cha
nges
acc
ou
nte
d f
or
six
per-
(19
72
) m
anua
ls o
f 16
7 co
mpanie
s th
e se
lect
ion o
f a
new
pre
sid
en
t o
r p
rofit
ma
rgin
. ce
nt o
f sa
les
varia
nce
, se
ven
pe
rce
nt
ne
t
ove
r th
e p
eriod 1
946-
chairm
an o
f th
e b
oa
rd.
inco
me v
aria
nce
, 14
pe
rce
nt of
pro
fit
mar
-
1965.
gin
varia
nce
. T
hese
we
re s
mall
am
ounts
co
mpare
d t
o v
ariance
acc
ou
nte
d f
or
by
ind
ust
ry t
ype o
r co
mpany
posi
tion w
ith
in
indust
ry.
Ma
ho
ne
y & W
eitz
el
(19
69
) S
ubje
cts
wer
e m
embe
rs o
f S
tatis
tica
l fa
cto
r d
erive
d f
rom
ana
lysi
s A
ra
ting o
f ove
rall
Mu
ltip
le R
was
.7
6,
and
Pla
nnin
g w
as o
ne
283 o
rganiz
atio
nal
sub-
o
f 11
4 quest
ionnaire i
tem
s ta
ppin
g o
rgan
- effect
iveness
of
the
o
f se
ven
fact
ors
wh
ose
multi
pe R
with
u
nits
in
a va
riety
of
types
iza
tion
al
effect
iveness
var
iabl
es.
Ca
lled
su
bunit
by
the s
ub-
the o
vera
ll effect
iveness
ratin
g w
as .
74.
of
org
an
iza
tion
s.
"Pla
nnin
g",
de
fine
d a
s o
pe
ratio
ns
pla
nned a
nd s
ched
uled
to a
void l
ost
tim
e a
nd l
ittle t
ime s
pent
on m
inor
un
it s
uperv
isor's
su
pe
rio
r, i
n a
regr
essi
on
equatio
n w
ith 2
3 o
the
r cr
ises
. fa
cto
rs.

Man
ager
ial
Task
Ski
ll» (
con
t.)
Sou
rce
Sam
ple
Ope
ratio
nal
For
m
Rel
ated
To
R
elat
ions
hip
Fou
nd
Ros
en (
1970)
Sev
en w
ork
gro
ups
in a
fu
rnit
ure
fac
tory
. N «
10
in a
wo
rk g
rou
p.
Mea
n ra
nki
ng o
f w
ork
gro
up f
ore
men
by
thei
r gr
oup'
s m
embe
rs,
the
mem
bers
ra
nki
ng t
he
fore
men
in
term
s o
f ov
eral
l p
refe
rab
ility
.
Sea
shor
e & Y
uch
tman
(1
96
7)
75 i
nsur
ance
age
ncie
s S
tati
stic
al f
acto
r d
eriv
ed f
rom
ana
lysi
s o
f ar
chiv
al r
ecor
ds,
calle
d "
Man
agem
ent
Em
ph
asis
".
Sam
e fa
cto
r as
des
crib
ed i
n B
ower
s & S
eash
ore
abov
e.
Six o
ther
var
iabl
es,
per
form
ance
, ti
me
spen
t on
a m
od
el,
cohe
sion
, co
nsen
sus, m
on
ey-m
ot-
iv
atio
n,
man
agem
ent
pres
sure
; al
l m
easu
red
bef
ore
and
aft
er t
he
gro
up f
ore
men
wer
e sh
ifte
d o
n sh
ort
no-
tice
.
No
ne,
an
alyz
ed f
or
stab
ility
ove
r a
10 y
ear
per
iod
.
Th
e in
terc
orr
elat
ion m
atri
ces
wer
e ex
amin
ed a
s th
ey c
hang
ed o
ver
tim
e,
bef
ore
and
aft
er t
he
fore
men
sh
ift.
Of
mos
t in
tere
st,
fore
men
pre
fere
nce
ori
gin
- al
ly c
orr
elat
es .
62 w
ith p
erfo
rman
ce
(bef
ore
fo
rem
en s
hif
t),
dro
pp
ed t
o z
ero
af
ter
the
shif
t, a
nd 1
1 w
eeks
lat
er .
corr
elat
es .
54 w
ith p
erfo
rman
ce.
Co
rrel
ated
fac
tor
scor
es f
rom 1
952, 1
957,
an
d 19
61,
corr
elat
ion
s w
ere:
19
52
-19
57
, .3
6,
19
57
-19
61
. .6
7, a
nd 1
95
2-1
96
1,
.29.
A
uth
ors
cal
led t
his
inte
rmed
iate
sta
bili
ty.

114.
Managerial Interpersonal Skills
This variable refers to the level of skill and efficiency with which the management deals with superiors, subordinates, and peers and includes the extent to which managers give support, facilitate con- structive interaction, and generate enthusiasm for meeting goals and achieving excellent performance. It is meant to include such things as consideration, employee centeredness, etc. We realize that this variable is often used as a "predictor" of other variables. How- ever, within some models of organizational effectiveness (e.g., Likert and OD) it has the character of a systemic variable which is indicative of an organization's health. We wish to concentrate on this latter orientation.
Some fairly common instruments are used to measure this variable such as Fiedler's Least Preferred Co-Worker (LPC) (Lawrence & Lorsch, 1967), the Leadership Opinion Questionnaire (e.g., Oaklander & Fleishman, 1963) and the Leadership Behavior Description Questionnaire (Korman, 1966). Other studies have employed less familiar measures, but still of the questionnaire type.
Bowers and Seashore (1966) used Likert-type questionnaire items in an attempt to measure "support" (behavior enhancing someone else's feel- ing of personal worth and importance), "interaction facilitation" (behavior encouraging members of a group to develop close, mutually satisfying relationships), and "goal emphasis" (behavior stimulating enthusiasm for meeting the group's goals or exhibiting excellent performance). Both peers and managers received scores. Indik, Georgopoulos, and Seashore (1961) used two questionnaire items to tap each of four dimensions of superior-subordinate relationships: openness of communication channels, degree of subordinate satisfac- tion with supervisor's supportive behavior, degree of mutual under- standing between organizational members, and degree of felt influ- ence on organizational operations by subordinates and their super- visors .
Marcus (1962) attempted to measure the orientation of a supervisor with questionnaire items sr.swered by the supervisor's subordi- nates. Orientation was defined as the degree to which a supervisor followed an established procedure. Using the subordinate's responses, Marcus dichotomized the supervisors, with high scorers labeled "procedure-oriented" and low scorers, "group-oriented."
Except possibly for the LPC, LOQ, and LBDQ, little evidence exists about the validity, construct or otherwise, of these measures. Data are usually limited to one study and little detail is given concerning the development of the measures.

15.
Finally, as reported in the section on Managerial Task Skills, several overall measures of managerial skill or managers "as a whole" were discussed (Rose, 1970; Kavcic, Rus, & Tannenbaum, 1971; Lieberson & O'Connor, 1972). Those measures are probably also tap- ping Managerial Interpersonal Skills to some degree.
Relationship to Other Variables.
Bowers and Seashore found that their leadership measures were posi- tively correlated with satisfaction regarding four facets of the job (company, fellow agents, income, and manager). Thirteen of fifty- six correlations between the leadership measures and seven statistical factors of organizational performance were significant.
Indik et al. found their measures of superior-subordinate relation- ships positively related to effectiveness, slightly less so with product i vi ty.
Lawrence and Lorsch related the LPC scores to type of organizational subunit and found that they scored in the following order (high or social orientation scores first, low or task orientation scores last): sales, applied research, fundamental research, and production.
Two studies related Consideration and Initiating Structure to other organizational variables. Oaklander and Fleishman found these vari- ables negatively related to the intraunit stress of work groups in New York City hospitals, but unrelated to interunit stress. Parker found initiating structure positively correlated with order-pricing errors in a sample of pharmaceutical warehouses, but no relationship between consideration and errors. Neither variable was related to product ivi ty.
The studies by Kavcic et al., Lieberson and O'Connor, and Rosen are dealt with in the section on Managerial Task Skills and are not repeated here.
Summary.
Aside from the findings by Indik et al. little evidence exists showing Managerial Interpersonal Skills to be related to other organizational criteria. Since there exists some fairly well known instruments for
tapping this variable, it should be relatively easy to collect addi- tional data, if one had the inclination.

Man
ager
ial
Inte
rpe
rso
na
l S
kills
Sou
rce
Sam
ple
Ope
ratio
nal
For
m
Rel
ated
To
Rel
atio
nshi
p F
ound
Bow
ers
& S
eash
ore
(1966)
40 l
ife i
nsur
ance
age
ncie
s Q
uest
ionnaire i
tem
s ta
ppin
g d
egre
e to
S
even
sta
tistic
al
fact
ors
S
atis
fact
ion w
ith c
om
pany,
fe
llow
age
nts.
w
hic
h l
eade
r gi
ves
"su
pp
ort
," p
rovi
de
s ta
ppin
g o
rganiz
atio
nal
inco
me
, an
d m
anag
er w
ere
, fo
r th
e m
ost
"i
nte
ractio
n f
acili
tation", a
nd p
rovi
des
pe
rfo
rma
nce
, derive
d
pa
rt,
signifi
cantly
posi
tively c
orr
ela
ted w
ith
"g
oal
em
ph
asi
s".
Mea
sure
d at
both
fr
om
fa
cto
r an
alys
is o
f th
e t
hre
e l
ea
de
rsh
ip m
easu
res, b
ut
satis
fac-
"p
eer"
and
"m
an
ag
er"
leve
ls.
70 a
rchiv
al
perf
orm
ance
re
cord
s, a
nd f
ive f
ace
ts
of
satis
fact
ion
.
tion w
ith j
ob h
ad o
nly t
wo (
of
six) s
ignifi
- ca
nt
corr
ela
tions.
Thirte
en o
f 56
corr
ela
- tio
ns
be
twe
en t
he l
eaders
hip m
easu
res
and
perf
orm
ance
mea
sure
s w
ere
sig
nifi
can
t a
t .0
5,
six
of
thes
e w
ere
corr
ela
tion
s w
ith a
fa
ctor
nam
ed "
staff-c
liente
le m
atu
rity
" w
hic
h r
efle
cted t
he a
ge a
nd e
xpe
rie
nce
of
agen
t st
aff a
nd c
liente
le,
hig
h s
core
s on t
he
fa
cto
r re
flect
ing
old
er, e
xperience
d s
taff
an
d cl
ients (
and
hig
her
pre
miu
ms
on p
ol-
ic
ies)
. F
our
of
the s
ign
ifica
nt
corr
ela
tions
we
re w
ith t
he "
Busi
ness
Co
sts"
fa
cto
r,
two w
ith "
Adva
nce
d U
nd
erw
ritin
g", a
nd
on
e w
ith "
Bu
sin
ess
Volu
me".
Ind
ik,
Georg
opoulo
s, &
27
work
un
its o
f a
na
tion
- T
wo q
uest
ionnaire i
tem
s fo
r ea
ch o
f fo
ur
Mea
n p
rod
uctivity o
f T
he e
igh
t quest
ionnaire i
tem
s w
ere
corr
e-
Sea
shor
e (1
96
1)
wid
e r
eta
il d
eliv
ery
org
an-
dim
ensi
ons
of
sup
erio
r-su
bo
rdin
ate
st
atio
n m
em
bers
and
an
late
d w
ith t
he e
ffect
iveness
and
pro
du
ctivity
iza
tion
. re
latio
nsh
ips:
open
ness
of
com
muni-
"o
vera
ll e
ffe
ctiv
en
ess
" m
easu
res.
Bo
th "
op
en
ne
ss"
item
s co
rrela
ted
ca
tion c
hann
els,
deg
ree
of
subord
inate
ra
ting o
f ea
ch s
tatio
n
sig
nifi
can
tly p
osi
tively w
ith e
ffect
iveness
but
satis
fact
ion w
ith s
up
erv
iso
r's s
up
po
rtiv
e
by
six
or
mor
e m
an-
not
pro
du
ctivity;
bo
th "
satisfa
ction"
item
s b
eh
avi
or, d
egre
e o
f m
utu
al
unders
tandin
g
ager
s.
corr
ela
ted s
ignifi
cantly
posi
tively
with
betw
een o
rga
niz
atio
n m
embe
rs,
and
eff
ect
ive
ne
ss,
only
one d
id s
o w
ith p
rod
uct
- de
gree
of
felt i
nflu
en
ce o
n org
aniz
atio
nal
ivity;
the
sam
e p
att
ern
of
corr
ela
tion
s o
pe
ratio
ns
by
sub
ord
ina
tes
and
their
exi
sted f
or
the "
unders
tandin
g"
item
s as
su
periors
. d
id f
or
"satisfa
ction".
Both "
inf
uence
" ite
ms
corr
ela
ted s
ign
ifica
ntly
posi
tively
w
ith e
ffect
iveness
and
pro
du
ctivity.
The
h
igh
est
of
all
thes
e co
rre
latio
ns
was
.4
8.
the
low
est
co
rre
latio
n w
as .
21
(non-
sig
nifi
can
t fo
r N
=2
7).

Man
ager
ial
Inte
rper
sona
l S
kills
(co
nt.)
Sou
rce
Sam
ple
Op
era
tion
al
For
m
Rel
ated
To
R
ela
tionsh
ip F
ound
Kav
cic, R
us,
&
Fou
r m
anuf
actu
ring
plan
ts
17 e
xper
ts r
ank
orde
red
the
plan
ts i
n N
ot
dire
ctly
rel
ated
to
T
his
mea
sure
had
a p
erfe
ct r
ank
orde
r T
anne
nbau
m(
1971
) in Y
ugos
lovi
a.
term
s of
the
qu
alit
y of
their m
anag
e-
any
othe
r va
riabl
es.
corr
elat
ion
with
exp
ert's
ran
king
s o
f m
ent.
used
as
one
of
seve
n cr
iteria
to r
ank
the
fou
r or
gani
zatio
ns.
over
all
effe
ctiv
enes
s, w
hich
cor
rela
ted
perf
ectly
with
tota
l co
ntr
ol.
(How
ever
, al
l re
sults
wer
e p
rim
arily
des
crip
tive
beca
use
of
low
n.)
Law
renc
e & L
orsc
h (1
967)
21
6 m
anag
ers, e
ngin
eers
. A
dmin
iste
red
the
Leas
t P
refe
rred
M
embe
rshi
p of
the
sub-
C
ompu
ted
desc
riptiv
e st
atis
tics, r
an n
o an
d sc
ient
ists
in
six
Cow
orke
r (L
PC
) sc
ale.
je
ct i
n on
e of
four
test
s fo
r m
ean
diffe
renc
es o
f th
e LP
C
orga
niza
tions
. fu
nct
ional
subs
yste
ms
of
the
orga
niza
tion.
(S
ales
, ap
plie
d re
sear
ch,
fund
amen
tal
rese
arch
, p
rod
uct
ion
).
scor
es,
bu
t fo
un
d t
hat
the
subs
yste
ms
gene
rally
sco
red
in t
he f
ollo
win
g o
rder
on
the
LPC (
fro
m h
igh
to low
sco
res,
or
soci
al
to t
ask
orie
nta
tion
) sa
les, a
pplie
d re
sear
ch,
fund
amen
tal
rese
arch
, p
rod
uct
ion
.
Lieb
erso
n & O
'Con
nor
Rec
ords
fro
m i
ndus
try
Cha
nges
in
lead
ersh
ip a
s de
fined
by
the
Sale
s, n
et i
ncom
e, a
nd
Lead
ersh
ip c
hang
es a
ccou
nted
fo
r si
x pe
r-
(197
2)
man
uals
of
167
com
pani
es
sele
ctio
n of
a ne
w p
resi
dent
or
chai
rman
pro
fit m
argi
n.
cent
of
sale
s va
rianc
e, s
even
per
cent
net
ov
er t
he p
erio
d 19
46-1
965.
of
the
boar
d.
inco
me
varia
nce, 1
4 pe
rcen
t of
pro
fit m
ar-
gin
varia
nce.
Thes
e w
ere
smal
l am
ount
s co
mpa
red
to v
aria
nce
acco
unte
d fo
r by
in
dust
ry t
ype o
r co
mpa
ny p
ositi
on w
ithin
in
dust
ry.
Mar
cus
(196
2)
12 w
ork
gro
ups
of
five
Que
stio
nnai
re i
tem
s, a
nsw
ered
by
Mea
sure
s o
f co
hesi
on
case
wor
kers
and
one
w
orke
rs,
conc
erni
ng t
he d
egre
e to
whi
ch
and
grou
p pro
duct
ivity
. su
perv
isor
in
an u
rban
th
eir s
uper
viso
r st
icks
clo
sely t
o e
stab
- de
part
men
t o
f w
elfa
re.
lishe
d pr
oced
ures
or
is w
illin
g t
o m
ake
reas
onab
le e
xcep
tions
to p
roce
dure
s.
Mul
der, R
itsem
a, &
15
offi
cers
in
Dut
ch N
avy
Fac
tor
anal
ysis o
f ra
tings
yie
lded
four
de Jo
ng (
1971
) w
ere
foca
l su
bjec
ts,
but
subo
rdin
ates
and
out
side
ex
pert
s al
so p
artic
ipat
ed.
fact
ors
desc
ribin
g le
ader
ship b
ehav
ior
in a "
cris
is"
situ
atio
n;
thes
e w
ere
indi
- vi
dual p
rom
inen
ce,
soci
al e
mot
iona
l le
ader
ship
, (m
ore
com
mon
ly k
now
n as
C
onsi
dera
tion)
tas
k le
ader
ship (
mor
e co
mm
only k
now
n as I
niti
atin
g S
truc
ture
),
and
reco
gniti
on o
rienta
tion.
The
"pro
m-
inen
ce"
fact
or
had
item
s lik
e:
is d
ecid
ed
in h
is w
ay o
f ac
ting,
giv
es e
vide
nce
of
self-
conf
iden
ce,
show
s st
rong
per
sona
lity,
jo
adin
g on
it.
The
thr
ee h
ighe
st l
oadi
ng
item
s on
the
rec
ogni
tion
orie
nta
tion
fa
ctor
wer
e: l
ikes
to b
e ad
mire
d, is
kee
n on
rec
ogni
tion,
and
lik
es t
o c
ome
in
the
fro
nt
SJ

Man
ager
ial
Inte
rpe
rso
na
l S
kills
(co
nt.)
So
urc
e
Sam
ple
O
pe
ratio
na
l F
orm
R
ela
ted T
o
Rela
tionship F
ound'
Oakl
ander
& F
leis
hm
an
11
8 su
perv
isor
s in
th
ree
S
uper
viso
rs c
om
ple
ted t
he L
eaders
hip
Q
ue
stio
nn
aire m
easu
res
Co
rre
late
d c
on
sid
era
tion a
nd s
tru
ctu
re
(1963)
New
York
City
Ho
spita
ls,
Op
inio
n Q
uest
ionnaire,
obta
ined
o
f in
ter-
unit a
nd i
ntr
a-
with t
he s
tres
s m
easu
res, i
n la
rge
gove
rn-
all
with a
t le
ast
six
Co
nsi
de
ratio
n a
nd I
niti
atin
g
S
truct
ure
unit s
tres
s.
10 i
tem
s,
ment
hosp
ital
and
two s
malle
r, v
olu
nta
ry
sub
ord
ina
tes.
sc
ores
. to
tal, c
om
ple
ted b
y th
e su
pe
rvis
or, s
ix f
or
inte
r-
un
it s
tres
s, f
our
for
intr
a-u
nit
stre
ss.
ho
spita
ls.
Both
C&
S v
.'ere n
egativ
ely
co
rrela
ted t
o i
ntr
a-u
nit
stre
ss (
-.37 &
-.
41,
p<
.01
) an
d unre
late
d t
o i
nte
r-unit
st
ress
in
the
larg
e h
osp
ital.
In
the
Sm
all
ho
spita
ls,
the o
nly
sig
nifi
can
t co
rre
latio
n
was
be
twe
en S
and
inte
r-unit
stre
ss.
-.36
<
p<
05
).
Par
ker
(19
63
) 80
war
ehou
ses
of
a la
rge
Ad
min
iste
red L
ea
de
rsh
ip O
pin
ion
M
easu
res
of
wo
rk g
rou
p
Initia
ting S
truct
ure
corr
ela
ted .
23 (
pc05)
pharm
ace
utic
al
com
pany.
Q
uest
ionnaire,
obta
ined s
core
s on
p
erf
orm
an
ce (
pro
duct
- w
ith o
rder-
prici
ng e
rro
rs,
no s
ign
ifica
nt
work
gro
up N
ave
rage
■ 2
4.
Co
nsi
de
ratio
n a
nd I
niti
atin
g S
tru
ctu
re.
ivity a
nd e
rro
rs).
co
rre
latio
ns
with p
rod
uctivity.
Consi
dera
tior
did
not
corr
ela
te s
ignifi
cantly
.
Ros
en (
1970)
Sev
en w
ork
gro
ups
in a
M
ean
ran
kin
g o
f th
e w
ork
gro
up
S
ix o
ther
varia
ble
s:
The
in
terc
orr
ela
tion m
atr
ice
s w
ere
exa
min
ed
fu
rnitu
re f
act
ory
, N
=1
0
fore
men b
y th
eir g
roup's m
embe
rs,
the
p
erf
orm
an
ce,
time
as t
hey
chan
ged
ove
r tim
e,
usin
g m
easu
res
in a w
ork
gro
up.
mem
bers
ra
nki
ng t
he f
ore
men i
n t
erm
s sp
ent
on a
mo
de
l. ta
ken s
ever
al t
ime
s both
befo
re a
nd a
fte
r o
f ove
rall
pre
fera
bili
ty.
cohesi
on,
cons
ensu
s,
mo
ne
y-m
otiv
atio
n,
and
ma
na
ge
me
nt
pres
sure
. A
ll m
easu
red
befo
re
and
after
the g
rou
p
fore
me
n w
ere
shift
ed
on s
ho
rt n
otic
e.
the f
ore
me
n s
hift.
Of
mo
st i
nte
rest
, fo
re-
men
pre
fere
nce
orig
ina
lly c
orr
ela
tes
.62
with p
erf
orm
an
ce (
befo
re s
hift)
, dro
pped
to
zer
o after
the
shift
, an
d 11 w
eek* l
ate
r co
rrela
tes
.54
with p
erf
orm
ance
.

119.
Information Management and Communication
This variable refers to the collection, analysis, and distribution of information critical to organizational effectiveness. Included is the degree to which: (a) mechanisms for ongoing monitoring of pertinent information are established, (b) some method for filtering biases from collected information is used, (c) a regular and efficient channel of distribution of relevant information to concerned organizational mem- bers is established, and (d) informal communication lines transmit organizationally valuable information.
Three studies employed questionnaires to tap various aspects of this variable. Simpson and Gulley (1962) attempted to obtain information about the extent to which organizations keep their members informed of organizational activities, educate members about organizational objectives, and keep organizational leaders informed of their (member's) opinions. Questions tapping these items appeared on a survey mailed out to 211 voluntary associations. Berkowitz and Bennis (H961) used a questionnaire instrument they called the Per- sonal Contact Check List, which attempts to tap the initiation of frequency of subject matter of importance and satisfaction derived from communication. They gave the questionnaire to 90 nurses in seven out-patient departments of a large metropolitan area and report some interesting descriptive data concerning both the direction of com- munications and the five communications parameters just mentioned. Briefly, they found that all communications are seen as satisfying, initiation and frequency were negatively related to the hierarchical level of the other person, contacts with superiors were seen as more important than contacts with peers or subordinates, and the results on content of communications were too tentative to place much weight on them.
Walton (1963), in a study in which he puts forth a "magnetic" theory of communication, also used a questionnaire approach. He asked 100 employees in a large governmental laboratory to nominate persons with whom they would communicate about items from four content areas. These content areas were the four traits that Walton believed "attracted" communications: (1) authority or assigned, legal right of command; (2) power of personal capacity to influence; (3) exper- tise or knowledge required by the organization; (*») sociability or that quality of character that makes for enjoyable social inter- actions with others. Using these nominations, Walton derived com- munication "centers." He found that three traits gave rise to communication centers--authority, power, and expertise, while the fourth trait, sociability, did not. (This was because 80 percent of his entire sample was nominated as being communicated with

120.
because of this factor.) Walton believes that the persons who are these "magnetic centers" are the real management of the organization. It would be interesting to compare the "magnetic centers" found by Walton's method with the official communication hierarchy of an organizat ion.
Mahoney and Weitzel (1969) in their factor analysis of questionnaire items drawn from organization theory (responded to by members of 283 organizational subunits of various types) derived a factor they named communication. They characterize it as a state of having free flow of work information and communications within the organization. However, this factor did not account for more than a negligible amount of variance and when placed in a stepwise multiple regression equation with other factors to predict an overall effectiveness rating, it did not contribute significantly to the level of pre- diction (Mahoney 6 Weitzel, 1969; Weitzel, Mahoney, & Crandall, 1971).
Goodman (1970) presented kS managers with a list of eight criteria for the design of organizations (origins of the criteria not given), one of which was ease and accuracy of communications. The managers ranked these eight criteria in order of importance for organizational design. Communications was ranked second.
Two nonempirical articles seem worth mentioning. Gibb (1964) des- cribes two polar "approaches" in organizational communication while Fenn and Yankelovich (1972) outline several communication aids or devices that operating organizations either have implemented or perhaps should do so (in their view). Gibb shows that the "persua- sion approach" to communication puts communication in the role of an independent variable, a device to be used to bring about effec- tive operations; while the "problem solving approach" to communica- tions puts communication in the role of a dependent variable, a symptom of the "health" of an organization. It is the latter con- text we are attempting to use here.
Summary.
Several variations of questionnaires have been used to tap communi- cations within an organization, and usually across hierarchical lines. Work that attempts to measure information flow across the organization's outer boundaries is nonexistent in the literature reviewed here. Some of the questionnaire approaches reviewed seem quite useful, and some fusion of Walton's, Berkowitz and Bennis', and perhaps Mahoney and Weitzel's approach might be useful.

121
Almost completely missing is an observational approach to measuring communication patterns and content. Observational techniques in ongoing situations have been used elsewhere (Barker 6 Wright, 1955) and could probably be useful for measuring this variable in an organization. (However, Walton did have his subjects complete a log of their communications over a two-day period.)

Info
rma
tion M
anag
emen
t an
d C
om
munic
atio
n
So
urc
e
Sam
ple
Opera
tional
Fo
rm
Rela
ted T
o
Re
latio
nsh
ip F
ound
Be
rko
witz
& B
enni
s (1
961)
90 n
urse
s w
ork
ing i
n se
ven
Ad
min
iste
red t
he P
erso
nal
Co
nta
ct
The
eff
ect
of
diffe
rent
Initia
tion a
nd f
req
ue
ncy
negativ
ely r
ela
ted
out-
patie
nt
depart
ments
in
Che
ck L
ist, a
quest
ionnaire t
hat
taps
fiv
e
hie
rarc
hic
al
leve
ls o
n
to h
iera
rch
ica
l le
vel
of
oth
er, c
onta
cts
with
a
metr
opolit
an a
rea.
pa
ram
eter
s o
f co
mm
un
ica
tion
: th
e c
om
mu
nic
atio
n
superiors
see
n as
more
im
po
rta
nt
than
in
itia
tio
n,
frequency
, su
bje
ct m
atter.
pa
ram
eter
s. (
That
is,
con
tact
s w
ith p
eers o
r su
bord
inate
s, a
ll im
port
ance
, sa
tisfa
ctio
n.
the
leve
l o
f th
e "o
the
r"
on c
om
munic
atio
n b
y su
bje
ct.)
conta
cts
seen
as
satis
fact
ory
or
very
sa
tisfa
cto
ry,
con
ten
t fin
din
gs
wer
e ve
ry
tenta
tive.
Go
od
ma
n (
1970)
46 m
anag
ers
Man
ager
s ra
nk
ord
ere
d e
ight
crite
ria o
f o
rga
niz
atio
na
l de
sign
in
term
s o
f th
eir
im
port
ance
fo
r org
aniz
atio
nal
desi
gn.
One
o
f th
ese
was
the e
ase
and
acc
ura
cy o
f co
mm
unic
atio
ns.
Noth
ing.
Co
mm
un
ica
tion
s w
as r
anke
d s
econ
d o
ut
of
the e
ight
crite
ria.
Mahoney
& W
eitz
el
(1969)
Mem
bers
of
283 o
rgan
iza-
S
tatis
tica
l fa
ctor
de
rive
d f
rom
ana
lysi
s o
f A
ra
ting o
f th
e o
vera
ll M
ulti
ple F
t =
.76,
but
com
munic
atio
n w
as
tion s
ubunits
fro
m v
arious
114
quest
ionnaire i
tem
s, c
alle
d "C
om
mu
n
effect
iveness
of
the
not
one
of
a su
bset
of
7 o
f th
e 24
ty
pes
of
org
aniz
atio
ns.
. ic
atio
n", d
efin
ed a
s fr
ee f
low
of
work
su
bunit
by t
he s
ub-
dim
ensi
ons
tha
t yi
eld
ed a .
74 R
, th
us
it
info
rmatio
n a
nd c
om
mu
nic
atio
ns
with
in
un
it's
superv
isor's
d
id n
ot
add
muc
h to
the p
redic
tion
th
e o
rga
niz
atio
n.
sup
erio
r, a
long
with
23 o
the
r dim
ensi
ons
in
a m
ulti
ple
reg
ress
ion
equatio
n.
equatio
n.
Sim
pso
n &
Gulle
y (1
96
2)
surv
ey o
f 21
1 T
hre
e q
uest
ionnaire i
tem
s ta
ppin
g
A c
lass
ifica
tion o
f C
om
pu
ted t
he m
edia
n sc
ores
fo
r th
e
volu
nta
ry a
ssoc
iatio
ns.
ed
uca
tion o
f org
aniz
atio
n m
embe
rs a
bo
ut
org
aniz
atio
ns
into fo
ur
org
an
iza
tion
s in
eac
h o
f th
e fo
ur
clas
ses
org
aniz
atio
nal
obje
ctiv
es
kee
pin
g m
embe
rs
clas
ses
on t
he b
asis o
f fo
r "i
nte
rna
l co
mm
un
ica
tion
".
Th
ey
info
rmed o
f org
aniz
atio
n a
ctivity,
and
focu
sed
or
diff
use
d
ran
ked
, in o
rde
r fr
om
hig
h t
o l
ow
media
n
mem
bers
ke
ep
ing l
eade
rs i
nfo
rmed o
f go
als
and
inte
rna
l or
scor
es: d
iffuse
ext
ern
al,
focu
sed
-ext
ern
al.
the
ir a
ctiv
ities.
La
be
lled t
his "
inte
rnal
ext
ern
al
orie
nta
tion
d
iffu
se-in
tern
al,
focu
sed
-in
tern
al.
Th
is
com
mu
nic
atio
n".
o
f th
e o
rga
niz
atio
n.
sup
po
rte
d t
he a
uth
or's
hyp
oth
esi
s th
at
ext
ern
ally
orie
nte
d o
rganiz
atio
ns
enga
ge i
n
mor
e in
tern
al
com
mu
nic
atio
n.
Wa
lton (
1963)
100 e
mp
loye
es
in a
lar
ge
Qu
est
ion
na
ire
s as
king
sub
ject
s to
nom
i-
No
oth
er
varia
bles
. Is
ola
ted "
magnetic
cente
rs"
of
com
muni-
gove
rnm
ent
labora
tory
. na
te p
erso
ns w
ith w
ho
m t
hey
wo
uld
co
mm
unic
ate
about
item
s fa
lling i
nto
four
area
s (t
ha
t a
uth
or
felt i
nflu
en
ced c
om-
munic
atio
n p
att
ern
s):
auth
ority
, pow
er,
exp
ert
ise,
soci
abili
ty.
catio
n,
act
ually
centr
al
pers
ons
thro
ugh
w
hic
h c
om
mu
nic
atio
ns
flow
ed
. T
hese
ce
nter
s w
ere
base
d on t
hre
e o
f th
e f
our
area
s ta
pped o
n t
he q
uest
ionnaire,
all
bu
t so
ciabili
ty.

123.
Readiness
The usual definition of this variable is in terms of an overall judg- ment concerning the probability that the organization could success- fully perform some specified task if asked to do so. Work on measuring this variable has been largely confined to the military.
The Navy previously developed an index to reflect the readiness of its personnel system (Popper & Miller, 1965). The content consisted of a weighted sjm of two personnel reports: the manning levels and rates authorized for a unit, and the actual personnel assigned to the unit. The basic notion involved is the comparison of actual human resources (in terms of numbers of personnel and their skills) to some desired state. Each desired state is given a relative importance weight. This weight is multiplied by the actual state, expressed on a 0 to 1 scale which indicates the degree of fulfillment (0 = none, 1 = com- plete) of the desired state. These products are then summed to give a single readiness index for an organization.
While several problems in the area of reliability, validity, accept- ability, data collection, appropriate unit of analysis, and determina- tion of "desired states" exist in this scheme (Dunnette, Milkovich, 6 Motowidlo, 1973) little empirical work has been done with the method.
Utilization of Environment
This dimension refers to the extent to which the organization suc- cessfully interacts with its environment and acquires scarce, valued resources necessary to its effective operation. For example, it includes the degree to which it acquires a steady supply of manpower and financial resources.
This variable is a favorite of the Michigan school but appears to be almost universally ignored by everyone else. The Michigan researchers (Seashore 6 Yuchtman, 1967; Yuchtman, 1966; Yuchtman 6 Seashore, 1971) theorize that no single measure will adequately represent this variable and have instead concentrated on a multivariate approach to the concept.
Thus it appears that this variable is similar to the variable "overall effectiveness," but approached from a somewhat different viewpoint-- how successful the organization is in gaining and using (without depleting) the environmental resources. Yuchtman (1966) states that one must attempt to look at all such measures "at once" to determine how an organization is doing on this dimension.

\2k.
In our attempt to partial out the total variance of organizational effectiveness, we have placed the various measures of environmental utilization found by Michigan workers into a number of categories.
Evaluations by External Entities
Such evaluations refer to evaluations of the organization or organ- izational unit by those individuals and organizations in its environ- ment with which it interacts. Loyalty to, confidence in, and support given the organization by such groups as suppliers, customers, stock- holders, enforcement agencies, and the general public would fall under this label.
No attempts to operationalize this variable were found. Kuin (1968), Aaker and Day (1972), and Thompson (1967) all discuss the variable and make some suggestions about how it might be measured. Kuin sug- gests opinion polls and the success an organization has in recruitment advertising. Thompson examines the variable in more detail. He pos- tulates four sets of "criteria" that appear to represent it: social reference criteria, criteria visible to important environmental ele- ments, criteria of interest to environmental elements the organiza- tion is dependent on, and expressions of confidence. He suggests methods that might be used to measure the first three. For social reference criteria he suggests such things as market share, level of research expenses, product developments, and increases in student body and faculty quality for educational organizations. For the next two criteria (visible to or of interest to important or sup- porting environmental elements), he suggests such things as growth capacity, ability to benefit employees or customers, keeping expenses at minimum and quality at maximum, public stock quotations, accrediting evaluations, admission and discharge rates (mental hos- pital), student-teacher ratios, dollars spent per pupil, dropout rates (schools), number of publications, research grants received, job offers (universities).
Again, no operational forms have been used for this variable, although some of the measures Thompson suggests have been used to tap other dimensions of effectiveness by other researchers (e.g., number of publications as a measure of productivity).

125.
Stabi1ity
As per Stogdill's (1970 definition, stability refers to the maintenance of structure, function, and resources through time, and more particu- larly through periods of stress (Stogdill, 1971).
Although several authors have addressed the variable of stability con- ceptually (Cadwallader, I960; Caplow, 196A; Stogdill, 1971; Selznick, 19^8), no one has directly attacked the measurement of the variable. Drabek and Haas (1969) in a laboratory simulation study, observed the effects of stress on the structure of a work group, but made no formal measurements of stability. They did conclude that stress causes change in structure and usually at those parts of the system that showed signs of strain before stress was applied.
Internalization of Organizational Goals
This variable is defined as the acceptance or internalization of organizational goals by individuals within that organization. It includes their belief that the organization's goals are right and proper. This is not the extent to which goals are clear or agreed upon by the organization members (goal consensus and goal clarity, respectively). Thus it refers to the acceptance, not the understanding of the organization's goals.
Only one attempt to even indirectly measure internalization of organ- izational goals was found. Simpson and Gulley (1962) surveyed 5^6 members of national voluntary organizations and this questionnaire contained four items attempting to measure membership involvement. These items concerned the extent to which the members actively par- ticipated in the organization's work, promoted cooperation among the members, recruited members, and would "feel a terrible loss" if the organization did not exist. As can be seen, these items are cer- tainly not tapping directly the internalization of ostensible organ- izational goals, but they do seem to be getting at some kind of "with it" feeling regarding the organization.
Value of Human Resources
This variable is a composite criterion, where the components refer to measures of individuals, and it refers to the total value or total worth of the individual members of an organization, in an accounting or balance sheet sense, to the organization. It is another way of combining many of the variables discussed so far but it deals only
with the role that human resources, not other kinds of assets, Dlay in organizational effectiveness.

126.
The advocates of Human Resources Accounting (HRA), building on the ideas of Rens is Likert (1967), have been responsible for most of the efforts in this area. Likert's views can perhaps be summarized in the following way. Organizational effectiveness or productivity is determined by the efforts of the individual members of the organiza- tion. Following the precepts of the ISR systems model, the assump- tion is that the efforts of individuals can be reflected by the measurement of variables like satisfaction, cohesion, and morale; and further, increases in the value of these variables forecasts an increase in organizational performance or effectiveness.
Related to this assumption of the relationship of the individual variables mentioned above and organizational effectiveness, is the notion that the value of organization members can and should be reflected differently than it usually is (Flamholtz, 1971a, 1971b; Lev & Schwartz, 1970- These authors maintain that the value of human resources is consistently underestimated, if not completely ignored, in organizations. They further assume that this practice leads to several adverse effects: (a) When costs must be cut, the effects of such cuts on human resources are ignored causing liquida- tion or depletion of human resources in the form of lowered morale, motivation, and satisfaction and higher turnover and absenteeism. These effects in turn eventually lower organizational production and effectiveness. (b) Planning by managers fails to take into account the present value of human resources or the possible impact of future actions on this resource. (c) Actions to increase the value of human resources or even stem the loss of such resources are impossible without knowledge about the level or trends in changes of the level of such resources.
The common thread running through these points is that human resources are a valuable asset and must be as carefully managed as any other asset. The value of human assets simply must be considered to make sound organizational decisions and maintain or increase organizational effectiveness. Unfortunately, they first must be measured.
Proposed Measures
Precisely how to measure and represent the value of human resources is a problem. Several answers have been proposed, but little empirical work exists.
Pyle (1970) argues that there are two complementary approaches to placing a value on human resources. "The first approach relies upon extending to human resources, accounting concepts and procedures that

127.
are currently employed in the management of physical and financial resources (p. 24-25)." "The second approach to human resource accounting focuses on the development of alternative means for assessing the productive capability of human resources and how this may be changing through time (p. 25)." In this second approach, Pyle is speaking of thre measures of leadership, team skills, and other social-psychological measures including motivation, satisfac- tion, cohesion, and morale.
Relative to the first approach described by Pyle, Flamholtz (1971b, 1972) proposes to use the individual as the unit of analysis, main- taining that aggregate measures can always be formed from individual data if measures of work groups or whole organizations are desired, while it is usually more difficult to disaggregate measures of entire work groups or organizations to obtain individual data. Briefly his model views the individual as a mobile entity, moving through organi- zational roles over time. Since mobility cannot be absolutely pre- dicted his model is a stochastic one. As the individual moves through various roles, he performs services connected with these roles for the organization. The value of the individual to the organization is the sum of the present values of the services he would perform for the organization in these various roles.
Flamholtz then suggests several surrogate or operational measures of an individual's value to an organization (Flamholtz, 1971b, pp. 263- 266). These include acquisition cost, replacement cost, current cost, compensation, and performance measures. These are described below, along with some of their advantages and disadvantages.
Acquisition Cost.
This is the traditional accounting measure for the value of a resource. It is viewed as reflecting the value to the purchaser of the resource at the time of purchase. Its advantages are that it is consistent with conventional accounting use and is reasonably feasible. However, the acquisition costs may have an unknown relationship to current value of a resource.
Replacement Cost.
This is simply the cost incurred in replacing a resource with another that could provide equivalent service.
Current Cost.
This is the current price for a resource bought and sold in an open market. One advantage is that both current and replacement costs seem more relevant for reflecting the present value of an individual than

128.
does the acquisition cost, which reflects historical value. Flamholtz feels these measures are better for internal management use. Current cost reflects a normative value of an individual, while replacement cost represents the unique value of an individual to a single firm. One big disadvantage is that these kinds of measures are more difficult to obtain than the acquisition cost.
Compensation Measures.
These refer to the use of salary or commissions to indicate the value of an individual. Some advantages are that these figures are easily obtainable and have a high face validity. The price the organization is willing to pay for an individual's services would seem to be a valid measure of his organizational value. However, the disadvan- tages are that salary or commissions may not accurately reflect an individual's value because they are partially determined by extraneous factors such as traditional wage structures, organizational compensa- tion policy, presence or absence of unions, etc. Flamholtz also feels that this kind of measure may not accurately reflect the present per- formance or the promotabi1ity of the individual.
Performance Measures.
Such measures refer to the individual's degree of achievement of the responsibilities in his present position and are synonymous with indi- vidual performance criteria. Aside from the normal problems encountered in trying to develop adequate job performance criteria, Flamholtz feels that such measures do not reflect the transferabi1ity (ability to per- form in other roles) or promotabi1ity of an individual. Thus they are not fully reflecting the total value of an individual to the organiza- tion.
Dunnette, Milkovich, and Motowidlo (1973, pp. 27-3A) also discuss and evaluate some of these HRA measures, especially as they apply to the military and they note that salaries and replacement costs are probably less relevant for military use than in private industry.
Other authors have proposed or used other measures of the value of individuals to an organization. Meltzer and Salter (1962), in their survey study of physiologists used: self-ratings of ability to keep up with the field, college grades, years between B.A. degree and Ph.D., and salary relative to age as measures of the ability of physiologists. Such measures could perhaps be construed as reflecting the relative value of an individual to the organization. Whitely and Frost (1971), contemplating research organizations, suggest nine possible measures of the value of organizational members: originality, ability to fol- low through ideas, energy, ability to collaborate with others in the organization, to collaborate with those outside the organization,

129.
extent of formal training, loss to firm if member leaves, experience, and writing ability. Measures such as these fall in the second approach to measuring human resources value that Pyle outlined (using social- psychological measures, see above) and are very much within the systems mode] of organizational effectiveness.
Summary of Proposed Measures.
Dunnette et al. (1973) state that there are two basic approaches to measuring the value of human resources, that of assessing the costs of producing the resources, such as the replacement, acquisition, and current cost methods, and estimation of the present value of future expected performance. Both of these approaches, however, are sub- sumed under Pyle's approach of extending accounting concepts to human resources. Flamholtz's model, operationalized by his "surrogate" measures or by managerial estimations of the present value of future expected performance, seems to exhaust this approach.
Pyle's second approach, the use of social-psychological measures to assess the productive capability or value of human resources is repre- sented by the use of Likert's intervening variables, mentioned above, and by the use of the long lists of other kinds of these measures, also presented above (Likert S Bowers, Meltzer S Salter, Whitely 6 Frost). However, these alternative measures proposed do not seem to fit easily into the approach using regular accounting concepts. For example, how does one convert a measure of an individual's originality into a reolacement cost?
Finally, it should be reiterated that the variables mentioned by Likert as affecting individual productivity, absenteeism and turn- over (i.e., satisfaction, morale, cohesion, and motivation, are viewed by some as a sort of "advance warning" variables. A drop in their value signals an ultimate decrease in organizational effective- ness (and profit), just as a rise signals an increase. Brummet, Flam- holtz, and Pyle (1968) propose that such changes in these variables might be used to forecast earnings, and these predicted earnings could be discounted to determine the present value of the firm's human resources.
Operational Measures of Value of Human Resources.
The Michigan researchers have operationalized human resources accounting systems in an ongoing organization (Pyle, 1970). Pyle's article does not describe in detail how estimates of the value of human resources are arrived at, but it does describe rather well how this information is put into regular accounting systems and utilized by management for

130.
planning purposes. The article's main value is a demonstration that a human resources accounting system apparently can be installed and utilized in an ongoing organization. It is a case study, however, and any conclusions which are drawn must be tentative.
A recent study (Dermer S Siegel, 197*0 focused on the use of social - psychological variables. These authors pointed out that past sug- gestions about using such variables in accounting for human resources ". . . may appear to be only tentative suggestions, [but] there has been considerable effort made to persuade users of accounting data that this approach to producing relevant data is the wave of the future (p. 89)."
Dermer and Siegel first challenged Likert's systems model assertion that ". . . the behavioral health of an organization does determine its performance, and, hence, can be employed in accounting for human resources (p. 90)." Reviewing the available empirical evidence con- cerning the relationships of job satisfaction, motivation, cohesion, individual performance, absenteeism and turnover, they conclude that the relationship of individual performance to state or health variables such as motivation, satisfaction, cohesion may be other than what Likert and his followers believe. They state, "Given their contradictory re- sults, it appears that the exact effect of behavioral variables in determining task performance is still to be established, and, hence, that the role such variables can play in accounting for human resources is very 1imi ted (p. 91)•"
In their experiment, they instituted a Human Resources Accounting system into a business game in which sixty-five MBA students partici- pated over a whole semester. The students received periodic feedback similar to that that would be received by an HRA system in a real organization. There were seven groups with each group competing against the others. The group's performance was measured in terms of sales, earnings, return on investment, and stock price. Questionnaire measures of motivation, satisfaction, effort, and group cohesion were taken six times throughout the game. Some of these questionnaire results were fed back to the students. These results made up the HRA feedback. The subjects also ranked eight organizational objectives when they filled out the questionnaire. Four of these related to the performance measures mentioned already, and four ". . . were related to an understanding of the processes that possibly determine task performance (p. 9*0-"
Lagged, simultaneous, and leading correlations of measures of motiva- tion, satisfaction, group cohesion, and satisfaction with performance were then computed. The results failed to support the views held by Likert and his associates. Few significant correlations were found, with fewer of these being sequenced in the direction assumed by

131
Likert than in the other direction. The authors conclude that their results ". . . should be interpreted as a need for caution rather than as an argument against the future development of HRA systems. To the extent that HRA is limited to advancing better cost accumulation and allocation schemata consistent with traditional practices, it is to be encouraged. Proceeding thusly, the difficulties encountered will be no worse than those already associated with traditional accounting practice. However, as this study has demonstrated, premature excur- sions into behavioral quagmires will do little to advance the contri- bution of accounting to improving organizational effectiveness (p. 97)-'
Summary.
The belief that human resources are important and that it is worthwhile to calculate their value seems to be almost unanimously accepted. Exactly how to calculate this value is not viewed so unanimously. Two basic approaches, the extension of traditional accounting procedures to human resources and the use of state variables specified by a systems model of organizational effectiveness, have been advocated. Little empirical data exists.
Some Summary Comments
Organizational effectiveness as it has been defined and measured in the literature is an extremely untidy construct. When twenty-five separate variables can be identified and most of these variables have several different operational forms, life becomes rather difficult. This sec- tion owes its substantive content to the programmatic efforts of the Michigan researchers, the factor analytic attempts of a few other authors, and many other relatively isolated studies of one or two vari- ables purporting to measure or predict organizational effectiveness. It is impossible to draw any safe conclusions about the interrelation- ships of these twenty-five variables based on the evidence before us. Most lines of research just have not been carried far enough. However, several things seem reasonably obvious about the domain of measures of organizational effectiveness as depicted in the above catalogue.
First, there are simply a lot of them and there have been precious few attempts to weed out the overlap and get down to the core variables; but this may be for good, if not sufficient, reasons. That is, within a particular "model" of the organizational effectiveness construct it is proper to demand such things as internal consistency, completeness, and parsimony for the dependent variables the model outlines. How- ever, different people adhere to different models and there is no cor- rect way to choose among them. Thus when putting together a list from different conceptual points of view, the composite list is almost pre- ordained to look messy. It's something we have to live with, although eventually one must choose sides and decide upon the conceptual domain in which to operate.

132.
Second, the entries in the catalogue vary considerably in terms of their generality/specificity and some may legitimately be subsumed under others. Again,> it is probably possible to deal with this issue only within the context of a specific model of effectiveness. Some alternative methodological approaches to this problem will be discussed in the next section of this report.
Third, they vary considerably in terms of the methods used to operationalize them. Archival records, direct "on-line" recording, retrospective ratings by independent observers, and aggregated self- perceptions have all been used.
Archival measures are used relatively more often in this area of research than in many other areas of psychology. In this review, the variables Accidents, Growth, Absenteeism, Efficiency, Profit, Quality, and Turnover were measured almost exclusively by such measures. Overall Effectiveness and Productivity have been measured by both archival and subjective kinds of measures. As Webb, Campbell, Schwartz, and Sechrest (1966) point out, the advantage of using more than one mode of measuring a variable is the opportunity to determine the method variance in the measurement, thus obtaining a more accurate estimation of the variable's true value, and hopefully more insight about the variable itself. Although this particular area has probably seen much more such research than many others, more systematic use of multiple measurement models would be helpful. Several variables have been measured subjectively only, primarily by Likert-type ratings on a questionnaire or survey. These are Satisfaction, Morale, Motiva- tion, Control, Goal Consensus, Role and Norm Congruence, and Informa- tion Management and Communication. Three other variables have been tapped primarily by subjective methods: Conflict/Cohesion, Managerial Task Skills, and Managerial Interpersonal Skills. Aside from Control, Satisfaction, and Managerial Interpersonal Skills these variables have been measured by methods that seem crude at worst and little researched at best. It appears that investigators sometimes feel that naming of a phenomenon and connecting it to a Likert scale of five to nine points was sufficient to insure adequate measurement. Seldom are reliability measures of any kind reported, though there are exceptions. It would be worthwhile to spend more time and degrees of freedom developing useful measures before using them in investigations.
A fourth general characteristic of these variables is that they vary on a continuum we might call closeness to the real payoff. For example, is morale the continuum on which the real payoffs are made or is it a means to an end? That is, is morale important because it is related to some more distal variable that is the organization's real concern? This is not precisely the same thing as Thorndike's

133.
classic distinctions among immediate, intermediate, and ultimate cri- teria. Morale may indeed be the desired outcome of real interest and we could consider immediate, intermediate, and ultimate ways of mea- suring it. Rather, this distinction really points up several other issues. One is that the decision about which of these are means and which are ends is a value judgment on somebody's part. It is made implicitly or explicitly in organizations every day and cannot be avoided. Second, if the decision is that a particular variable is a means and not an end, is it necessary to demonstrate empirical relationships between that variable and the outcomes of real interest? Or should those relationships be assumed, since the outcomes of real interest are usually so difficult to specify and measure? It is pre- cisely here that the goal model and the natural systems model diverge. Most theorists, researchers, and practitioners who adopt the natural systems point of view appear to accept the basic assumption that the systemic variables contained in their model are significantly related in a causal fashion to accomplishment of a variety of organizational missions. In contrast the goal model demands data.
In the best of all possible worlds it would be nice to have some overall hierarchical map of how the criteria fit together in terms of their generality/specificity and means/end relationships. Almost by definition such a map will be impossible to construct, except perhaps within the confines of a particular model of organizational effectiveness. Within this context a few systematic attempts at criterion organization have been made, and it is to these efforts that we now turn.

134.
V. METHODOLOGICAL APPROACHES TO THE CHAOS OF DEPENDENT VARIABLES
Even a casual browse through the above catalogue begs the question of how one might attempt to determine the more "basic" structure of effectiveness that would allow the hierarchical, functional, and means/end relationships among these variables to be specified. In this section, we would like to consider briefly some alternative means for doing this and, where possible, to illustrate each approach with the major examples provided by the 1 i ter.ature.
Traditional Multivariate Analysis
From the point of view of the industrial/organizational psychology criterion model, one obvious way to attack the problem is with some form of factor or cluster analysis. That is, an investigator could amass a large sample of similar organizations or independent organizational subunits, measure each one on all the variables listed in Table 5, obtain a matrix of empirical similarities (e.g., correlations) for all pairs of variables, and submit the matrix to a factor or cluster analysis. There are a number of variations of the basic factor and cluster analysis models (e.g., Weiss, in press) but a discussion of their differences would not be all that beneficial at present. What is worthy of note is that such an approach demands a large number of observations and reliable measures of each major facet of organizational effectiveness. If such conditions are satisfied then some clues as to the structure of effectiveness and its internal consistency can be obtained. However, we are still left with the often cited gaps which are inherent in the factor analytic approach. First, the picture of the more basic structure can be no better than the original sample of measures. The old adage of, "what comes out must go in" cannot be ignored and we did not encounter in the literature any systematic content sampling plan that tried to insure that a representative sample of criterion facets was being obtained. The problem is compounded when archival measures for such things as productivity are used. We have seen that such measures never seem to be defined the same way across organizations, which creates a number of interpretative problems. Second, if all the organizations or units being measured are not sampled from the same population we can not know the extent to which the factor or cluster solution is equally characteristic of each subpopulation. Third, on the basis of one factor analysis we do not know if the solution is dynamic or static and how much it might change over time (e.g., Ghiselli, 1956). Fourth, a factor or cluster analysis solution also gives no clues as to the relative importance of each factor.
There have been only two systematic attempts that we know of to use this methodology to search for the major factors comprising the dependent or criterion variables of organizational effectiveness. One of these was done at the University of Minnesota Industrial Relations Center by Mahoney,

— 1^= =^
135.
Weitzel, and others (Mahoney, Frost, Crandall, 6 Weitzel, 1972; Mahoney & Weitzel, 1969) and the second is the well known effort by Seashore, Yuchtman, and others at the Institute for Social Research (Seashore 6 Yuchtman, 1967).
The Minnesota study used a questionnaire format to obtain ratings on the effectiveness of 283 departments or subunits sampled from over a dozen different firms. The ratings were made by managers at least one step removed from the direct management of the subunit, and the questionnaires included llA items gleaned from the literature as being potential indica- tors of effectiveness. The correlations among the I\k items were factored and 2k effectiveness factors were labeled and defined. They are listed Jn Table 5.
TABLE 5 TWENTY-FOUR DIMENSIONS OF ORGANIZATIONAL EFFECTIVENESS, DERIVED FROM A FACTOR ANALYSIS OF RATINGS ON ]]k EFFECTIVENESS CRITERIA FOR 283 ORGANIZATIONAL SUBUNITS. CRITERION VARIABLES WERE SELECTED FROM A LIST OF VARIABLES STUDIED IN ORGANIZATION THEORY LITERATURE, AND RATIONALLY DEVELOPED BY THE AUTHORS (FROM MAHONEY & WEITZEL, 1969).
Flexi b i1i ty. Willingly tries out new ideas and suggestions, ready to tackle unusual problems.
Development. Personnel participate in training and development activities; high level of personnel competence and skill.
Cohes ion. Lack of complaints and grievances; conflict among cliques within the organi zation.
Democratic supervision. Subordinate participation in work decisions.
Reliabi1i ty. Meets objectives without necessity of follow-up and checking.
Select ivi ty. Doesn't accept marginal employees rejected by other organ izat ions.
Divers i ty. Wide range of job responsibilities and personnel abilities within the organization.
Delegat ion. High degree of delegation by supervisors.
Bargain ing. Rarely bargains with other organizations for favors and coopera- t ion.
Emphasis on results. Results, output, and performance emphasized, not procedures.

136.
TABLE 5 (Cont.)
Staffing ■ Personnel flexibility among assignments; development for promo- tion from within the organization.
Coord ination. Coordinates and schedules activities with other organizations, utilizes staff assistance.
Decentralizat ion. Work and procedural decisions delegated to lowest levels.
Understanding. Organization philosophy, policy, directives understood and accepted by all.
Conf1ict. Little conflict with other organization units about authority or failure to meet responsibilities.
Personnel planning. Performance not disrupted by personnel absences, turn- over, lost time.
Supervisory support. Supervisors support their subordinates.
Planning. Operations planned and scheduled to avoid lost time; little time spent on minor crises.
Cooperation. Operations scheduled and coordinated with other organizations; rarely fails to meet responsibilities.
Productivi ty-support-ut i1i zation. Efficient performance; mutual support and respect of supervisors and subordinates; utilization of personnel skills and abi1i ties.
Communicat ion. Free flow of work information and communications within the organizat ion.
Turnover. Little turnover from inability to do the job.
Ini tiation. Initiates improvements in work methods and operations.
Supervisory control. Supervisors in control of progress of work.
Note.-From T. A. Mahoney and W. F. Weitzel, Managerial model of organiza- tional effectiveness. Administrative Science Quarterly, 1969, 14, 357-365-
Each subunit was also rated on "overall effectiveness" and a major additional step was to compute a multiple regression equation regressing the 2k factors against the overall rating. The regression analysis was done for different types of subunits, for organizations of different sizes, and for organizations employing different technologies. In general, the factors which account for

37.
greatest variance in the overall effectiveness rating are not the same across the various breakdowns of the total sample of subunits. That is, the composition of overall effectiveness is different for production vs. R&D units, for mass product ion, first unit production, etc.
The effectiveness dimensions identified by the ISR group in a factor analytic study of the performance of 75 insurance agencies are shown in Table 6.
TABLE 6 TEN DIMENSIONS OF ORGANIZATIONAL EFFECTIVENESS DERIVED FROM PRINCIPAL COMPONENT ANALYSIS AND VARIMAX ROTATION OF SCORES ON 76 PERFORMANCE VARIABLES FOR 75 LIFE INSURANCE AGENCIES. PERFORMANCE MEASURES WERE SELECTED FROM A LIST OF SUCH CRITERIA USED BY PARENT COMPANY TO ASSESS AGENCY EFFECTIVENESS (FROM SEASHORE & YUCHTMAN, 1967).
1. Business volume. Expresses different aspects of organization size in respect to manpower and to number and value of policies sold.
2. Production cost. Efficiency of sales, production process; cost per unit of sales volume.
3. New member productivity. Productivity of members having less than 5 years tenure with agency.
k. Youthfulness of members. Relative frequency and productivity of members under 35 years of age.
5. Business mix. A combination of three conceptually unrelated performance indices, interpreted as reflecting the ability of agencies to achieve high overall performance through any of several strategies.
6. Manpower growth. Relative and absolute change in manpower levels.
7. Devotion to management. Sales commissions earned by agency managers, high commissions are interpreted as reflecting high interest in sales and corresponding low interest in management activities.
8. Maintenance cost. Efficiency of administration of manpower, plant, and established customer resources.
9- Member productivity. Average new business volume per agent.
10. Market penetration. Proportion of potential market that is being exploi ted.
Note.-From S. E. Seashore and E. Yuchtman, Factorial analysis of organiza- tional performance. Administrative Science Quarterly, 1967, 12, 377"395.

138.
The basic data for this Michigan study were not questionnaire responses or subjective ratings but consisted of archival records of sales and personnel data. The nature of the business which was studied makesit hard to genera- lize these results but a number of findings are suggestive. For example, relative to the "devotion of management" factor one could ask how much time a squadron commander spends flying vs. managing.
Based on their own data and related experiences, Seashore (1972) has drawn several negative "morals" concerning effectiveness criteria. To wit:
1. If several raters are asked to rank order a number of organizations or organizational subunits in terms of their overall effectiveness the interrater agreement is usually quite low. Unless they are all of extremely like mind, different raters tend to focus on different facets when making their judgments.
2. In the real world criterion measures sometimes correlate negatively when they aren't supposed to.
3. In the real world so-called hard data or "objective" criterion measures usually turn out to be quite "soft". No one needs to be reminded that in almost all cases any number of artifacts and biases operate to water down the fidelity of objective measures such as profit, costs, turnover and retention rates, number of missions flown, etc. There is no refuge in objectivism.
**. In the real world it is probably a mistake to think of effective- ness criterion variables, regardless of how many there are or at what level they are, in terms of continuous and linear functions. For example, higher and higher retention rates may be "good" up to a point and then become "bad". Notice the perspiration that begins to flow when we ponder the implication of the words good and bad.
Hierarchical vs. Non-Hierarchical Solutions
So far we have been considering multivariate analyses of multiple criteria in terms of a non-hierarchical, factor analytic model. We found no research that attempted to determine directly the hierarchical relationship among a representative set of criterion variables.
The relationships among criteria could be hierarchical in perhaps two basic ways. One kind of hierarchical arrangement would be a functional one. That is, the measures at one level are simply composites of measures at some lower level and the basic functional properties of the variables are retained as one goes up the hierarchy. They are simply aggregated into larger and larger "hunks" which then must be given somewhat different (i.e., broader) definitions. In a sense, the arguments over the meaningfulness of a variable

39.
labeled "total performance" (e.g., Dunnette, 1966; Schmidt & Kaplan, 1971) is an argument about whether a two level hierarchical model is appropriate. Mahoney and Weitzel implied such a two level model was appropriate when they sought to determine via regression analysis the functional role of their individual criterion variables in accounting for the variance in the overall performance of a unit.
A second way to look at a hierarchical arrangement is in terms of the cause and effect relationships that exist, if any. For example, we could worry about whether morale is causally related to quality of production, or vice versa. This is a critically important set of considerations since it gets at the heart of the difference between the goal and systems models of organizational effectiveness. If the causal or means/end relationship could be specified, we could go a long way toward reconciling these two points of view.
Short of actual experimentation, naturally occurring or otherwise, there are few methodological tools available to the investigator interested in causality. Nevertheless, multivariate techniques have been applied to the causality question and we would like to discuss them briefly.
Path Analysi s
If the aim of the investigator is to say something about the causal relation- ship among criterion variables in the hopes of teasing out the means/end relationships, one way to proceed is via path analysis. Although the method is not new, the application of path analysis to social science data is a relatively recent occurrence and had not been talked about much before 1966-69 (Duncan, 1966; Heise, 1969; Land, 1969) . Its introduction to social science was primarily a courtesy of the sociologists but its application to psychological research problems has also been advocated (Werts 6 Linn, 1970). A specific example of how path analysis can be used to delve into the rela- tionship among organizational characteristics is provided by Aldrich (1972), Hilton (1972), and Heise (1972) in a special issue of the Admi n istrat ive Science Quarterly. The following brief discussion of path analysis is meant to reflect the issues identified in these latter papers.
In essence, path analysis is a multivariate correlational technique that attempts to test whether a specific prior hypothesis about the direction of relationship between two variables is a reasonable one. The basic statis- tic is the semi partial correlation coefficient and the method is subject to all the constraints which the use of that statistic implies.
To begin, the investigator must have in hand data on at least three variables Even with just three variables there are a large number of causal arrange- ments that are possible. For example, two variables in the set (a) may not be related at all, (b) they may be related but not in a causal way, or

\ko.
(c) they may exhibit a causal relationship that may go one way or the other. If we consider all the possibilities of causal orderings for three variables there are a total of 18. Three of these are shown in Figure 1.
(1) (2)
(3)
1 * h -» X, v2 T «3
FIG. 1. Three of 18 possible causal orderings for three variables,
By convention a straight, solid line, unidimensional arrow signifies a causal relationship between two variables. A curved two headed arrow sig- nifies an association between two variables, but no causal relationship. The magnitude of the hypothesized causal relationship is referred to as a
path coefficient which is the semi partial correlation of the causally prior variable with the "dependent" variable. It is computationally the same as a standardized multiple regression coefficient. For example, the coeffi- cient for the path Xj—> X, in the first example above, is the correlation between Xo and the residual in Xj after the association with X2 is partialed out.
For a path analysis to be useful, certain conditions must be met. First, the investigator must specify what he or she believes the actual arrange- ment of causal relationship to be. Competing "theories" about the linkages could also be specified. Further, the causal model used by the experimenter must match the constraints imposed by the path analysis model. These are:

..T—. lAWI'Ätfü-
141
1. All relationships are linear.
2. The effects of different variables are additive. Interactive effects are not allowed.
3. Residuals for all pairs of variables are uncorrelated. Thus if an unmeasured variable accounts for variance in the residuals of more than one variable in the system, the model is violated.
h. Measurement is on an interval scale.
5. Relationships are recursive. That is, no feedback is assumed to occur and two-way causality is not allowed.
If these conditions are reasonably met then what path analysis does is to permit the investigator to conclude that a specific prior theory (i.e., a specific path arrangement) is either no good or that it is still a reason- able explanation of the data. That is, the data can reject a specific explanation, but in no way can they conclusively support one. Thus the informational content of the method is related to the extent to which clear competing a priori explanations can be formulated and the extent to which data have a chance to reject one or more of them. The power of path analysis is attenuated to the extent that there is measurement error and sampling error in the system and to the extent that competing explanations are not clearly different iated.
The basic procedure is to use the a priori path specifications to predict whether the regression coefficient for a specific path should be zero or significantly greater than zero. Empirical data can then be used to test these predictions. If the competing models being examined are conceptually distinct they will predict a different pattern of zero and non-zero beta coeffic ients.
An example of using path analysis to examine relationships among organiza- tional characteristics is provided by Franklin (1973). Using data accumulated at the Institute of Social Research from 37 research sites, a subset of 184 organizational units from 10 sites was selected. The four variables under study were: (a) organizational climate, (b) managerial leadership style, (c) peer leadership style, and (d) group process charac- teristics. Each of these four variables is a composite of a number of questionnaire items and the raw data consist of perceptions by organization members. The instrument used to collect these data will be discussed in detail in the next chapter. Scores on these four composite variables were obtained at two points in time and from samples of individuals at several hierarchical levels. In addition to path coefficients between two different variables, predictions were then made about the path coefficients between a particular variable measured at two different times, or at two different organizational levels. That is, an attempt was made to predict the causal

142.
relationship across time and across levels as well as among variables. For example, does the organizational climate at level k influence the kind of leadership style employed at level 3, or vice versa?
One can appreciate that considering k variables, 5 levels, and 2 times quickly leads to a complicated set of possible relationships. Neverthe- less, if we want to understand the causal relationships among these variables we have to jump in someplace. Path analysis forces the investi- gator to at least think about all the relevant issues. It's a difficult and sobering experience.
Franklin's prior model concerning these four variables posited that organizational climate influences managerial leadership style which in turn influences peer leadership behavior which in turn influences the nature of group processes. For the data obtained within one organizational level at time one the model received a certain amount of support, although at least one other alternative could not be easily rejected. The data also suggest that organizational climate becomes a more potent determinant of managerial leadership style at lower levels of the organization, and that in turn, the best predictor of organizational climate is organizational climate at a previous time period.
In sum, the Franklin study illustrates many of the virtues and many of the pitfalls of path analysis as it might be applied to an analysis of measures of organizational functioning. It does force the investigator to come to grips with the means/end question, since for the analysis to get off the ground, the investigator's best guess as to the causal ordering must be specified. On the negative side the number of linkages can quickly get out of hand and if the variables in the system are not well defined and reliably measured, the interpretation of the results becomes difficult.
Criterion Organization Via Expert Judgment
So far, the methods we have discussed for examining the functional and means/end relationships among criteria of organizational effectiveness have been empi rical in the sense that a reasonably large sample of organizations or subunits actually had to be measured on each of the variables. Another way to proceed would be to utilize the judgment of experts concerning how the various criteria are functionally or causally related.
There are perhaps three general approaches to the use of expert judgment for this kind of criterion analysis, although few of them have ever been used in the organizational effectiveness context and we have no data to cite. We have labeled these the (1) direct judgment, (2) indirect judgment, and (3) critical incident methods. With all of these methods, the question of who judges is paramount. There is no straightforward answer to this question except to say that in any situation there are probably several groups of individuals who might have different perspectives or expertise to
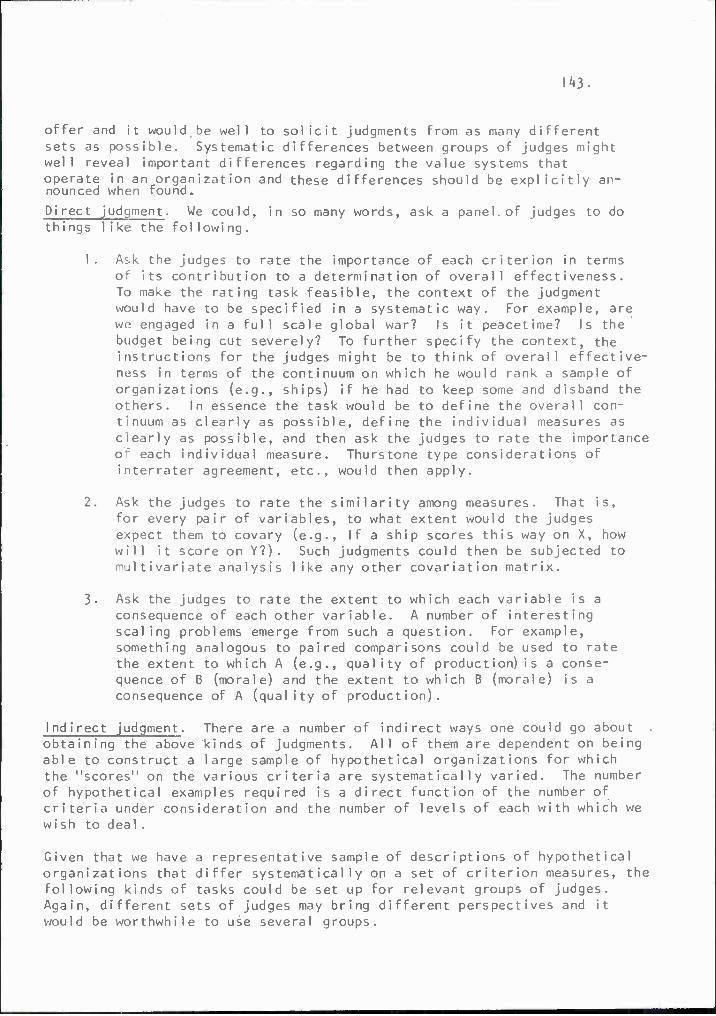
43
offer and it would be well to solicit judgments from as many different sets as possible. Systematic differences between groups of judges might well reveal important differences regarding the value systems that operate in an organization and these differences should be explicitly an- nounced when found.
Direct judgment. We could, in so many words, ask a panel of judges to do things like the following.
1. Ask the judges to rate the importance of each criterion in terms of its contribution to a determination of overall effectiveness. To make the rating task feasible, the context of the judgment would have to be specified in a systematic way. For example, are we engaged in a full scale global war? Is it peacetime? Is the budget being cut severely? To further specify the context, the instructions for the judges might be to think of overall effective- ness in terms of the continuum on which he would rank a sample of organizations (e.g., ships) if he had to keep some and disband the others. In essence the task would be to define the overall con- tinuum as clearly as possible, define the individual measures as clearly as possible, and then ask the judges to rate the importance of each individual measure. Thurstone type considerations of interrater agreement, etc., would then apply.
2. Ask the judges to rate the similarity among measures. That is, for every pair of variables, to what extent would the judges expect them to covary (e.g., If a ship scores this way on X, how will it score on Y?). Such judgments could then be subjected to multivariate analysis like any other covariation matrix.
3. Ask the judges to rate the extent to which each variable is a consequence of each other variable. A number of interesting scaling problems emerge from such a question. For example, something analogous to paired comparisons could be used to rate the extent to which A (e.g., quality of product ion) is a conse- quence of B (morale) and the extent to which B (morale) is a consequence of A (quality of production).
Indirect judgment. There are a number of indirect ways one could go about obtaining the above kinds of judgments. All of them are dependent on being able to construct a large sample of hypothetical organizations for which the "scores" on the various criteria are systematically varied. The number of hypothetical examples required is a direct function of the number of criteria under consideration and the number of levels of each with which we wish to deal.
Given that we have a representative sample of descriptions of hypothetical organizations that differ systematically on a set of criterion measures, the following kinds of tasks could be set up for relevant groups of judges. Again, different sets of judges may bring different perspectives and it would be worthwhile to use several groups.

lMt.
A. One task for the judges would be to have them judge the "similarity" of each pair of organizations using some form of paired comparisons procedure. Multi-dimension scaling procedures (e.g., Shepard, Romney, 6 Nerlove, 1972) could then be imposed on the similarity judgments to determine the number of recognizable "clusters" of organizations that emerged. The characteristics of the organiza- tions in each cluster could then be examined for the purpose of determining the criteria most salient for each cluster. Supposedly, these would be the variables composing a major component of effec- tiveness. If effectiveness is indeed unidimensional (i.e., if it is perceived to be so) then all the organizations should array themselves on a single dimension.
Varying the instructions for the similarity judgment could be a valuable source of information. For example, we think that valuable insights could be gained by asking for judgments in terms of which of two organizations is more effect ive (vis-a-vis some very general or more specific mission statement) and which is more ineffective. The two judgments are probably not symmetrical and it would be valuable to know what criterion variables characterize the asymmetry.
B. A similar procedure could be used if it were possible to assemble a sample of real organizations with which a set of judges would be reasonably familiar. Paired comparisons again could be used to obtain judgments of "similarity", "relative effectiveness", and/or "relative ineffectiveness". A multidimensional scaling model could again be used to recover the major dimensions underlying the judg- ments. Identifying the relevant characteristics of the organizations clustering on each dimension would be a matter for additional research. Notice that in this case the investigator would not be limited to an a priori list of variables (such as discussed in the previous sec- tion) with which to characterize the organizations in each cluster. The characteristics identifying each cluster would be searched for "after the fact". Such a procedure has some obvious advantages and disadvantages. Variables not in the original list, but which are important determinants of the similarity judgments can be identified. However, the investigator also runs the risk of considering certain variables to be more highly characteristic of a cluster than they really are. That is, the investigator may see more distinctions than are actually there.
C. In addition to the question of the dimensionality of organizational effectiveness or organizational ineffectiveness, indirect judgments can also be used to study the relative importance of each effective- ness criterion factor. Recall that Mahoney and Weitzel (1969) did this empirically by first obtaining ratings of real organizational units on overall performance or on a number of specific performance factors. Multiple regression was then used to determine the contri- bution of each component to overall performance. A similar procedure could be used if it were possible to assemble representative descriptions of hypothetical organizations.

\k5.
Again, the value of these kinds of data could be enhanced if a number of meaningful alternative definitions of overall effectiveness could be developed and the procedure repeated for each.
Critical incident methodology. Another judgmental procedure that could be used to help impose some conceptual order among the possible components of organizational effectiveness is the critical incident methodology developed in the context of individual performance (e.g., Campbell, Dunnette, Arvey, & Hellervik, 1973; Smith 6 Kendall, 196M- This procedure is too well known to be discussed in detail but the general procedure might run something like this.
After being familiarized with the procedure, groups of judges would be asked to generate specific examples of something that happened in their organization which caused them to think that the organization was performing in an effective or ineffective manner. This Is analogous to asking for descrip- tions of examples of effective and ineffective job performance on the part of individuals. The usual questions about which set of observers should generate critical incidents and whether the incidents should be recorded as they happen or described in retrospect, apply here as well. Again we would argue that using different sets of observers (e.g., enlisted men, junior grade officers, senior officers, etc.) and different methodologies would be a source of valuable comparative data.
The second step would be to use another set of judges to carry out a quali- tative "cluster analysis" of the incidents (as in Campbell, et al., 1973) in an attempt to identify the major components of effectiveness represented by the incidents. These tentative effectiveness dimensions could then be discussed at length by the relevant parties so as to refine and complete their definitions as thoroughly as possible. To further check on the understandabi 1 ity of the factors, Smith and Kendall's (19&3) retranslation step could be carried out as a next step.
A procedure such as this represents a logical analysis by people in the organization of the specific "bits" of the total domain of organizational effectiveness which were sampled by the critical incident technique. The list of variables produced by this procedure could then be compared to lists of criteria such as that presented in the above catalogue. If there are significant discrepancies, the people in the organization could be questioned further as to what the reasons might be for the lack of critical incidents in a particular area.
Summary of Criterion Analysis Methods
We have discussed a number of ways an investigator could go about trying to impose some order on the plethora of dependent variables that were catalogued in the previous section of this report. We would like to make the following concluding remarks.

146.
In general the methods fall into two general classes, those which require that a large sample of organizations be measured on each variable and those which use expert judgment to impose a logical order. Both methods have their advantages and disadvantages and it would not be in our best interests to label one or the other as more correct. Further they are not always addressed to the same questions and provide somewhat different kinds of information.
The number of instances in which any systematic approach has been used to address the organizational effectiveness problems of (a) criterion dimensionality, (b) relative importance, and/or (c) causal ordering is pitifully small. The fingers of one hand are sufficient to count them.
For the most part, methodological approaches such as those described above make the implicit assumption that the criterion structure which results can be applied across many organizations. This is directly true of the empirical techniques but not quite so true of the judgmental techniques which could sample judges from whatever subset of organization that was desired. However, the management by objectives (MBO) model of organizational effectiveness would reject all such studies of criterion structure. The MBO procedure is firmly rooted in the notion that the effectiveness of an organization is to be judged against the set of specific and concrete objectives that it wants to accomplish, and each organization may have a unique set of objectives.

H7.
VI. ORGANIZATIONAL CLIMATE
There are a number of organizational characteristics that perhaps qualify neither as an independent variable nor as a dependent variable. Rather they are characteristics which give an organization its recognizable form. They are variables which describe the structure of the organization and its processes and which together distinguish it in form from other organi- zations. It is these sorts of variables which have been used by a number of people to develop typologies or taxonomies of organizations (e.g., Blau & Scott, I962; Etzioni, 1961; Hall, 1972; Woodward, 1965).
For our purposes, the two main classes of such variables that are of interest are organizational climate and organizational structure and we will discuss them in turn. The potential role of these variables is as "moderators" or "intervening" variables between the manipulation of an independent variable and the observation of a change in a dependent variable. However, some of the variables included in this section could, in certain contexts, be considered either as independent or dependent variables. For example, the structure of an organization may appear to be a given in one context but in another it is a variable to be manipulated. Also, certain facets of what many investigators refer to as organizational climate, may at times be regarded as a dependent variable, or measure of effectiveness. These issues should become clearer as our discussion progresses.
Definitions of Organizational Climate
Organizational researchers have long discussed the influence of the environ- mental setting on behavior. As the organization whose behavior is being studied becomes more complex, the range of potentially important environ- mental factors increases, and so does the number of alternative ways of arranging these factors. Theories of environmental impact on human behavior vary in the complexity of the relationships that are hypothesized to exist between the environment and behavior.
In the simplest form, researchers assume all people will react uniformly to certain environmental changes. For example, it was proposed early in the Hawthorne studies (Roethlisberger & Dickson, 1939) that lighting and other environmental improvements would lead to improved performance. Actual environment-behavior relationships turned out to be more complex.
An interactive approach (e.g., Sells, 1963) contends that behavioral out- comes are joint functions of the environment and the personality structure of the individual. This viewpoint is best illustrated by the "fit" or "match" hypotheses which propose that performance or satisfaction is a function of the degree of fit between individual needs or abilities and environmental characteristics (e.g., Andrews, 1967; Pace & Stern, 1958).

148.
Finally, a transactional viewpoint (Pervin, 1968) proposes a dynamic reciprocal influence between the individual and those components of his environment which impinge upon his behavior. Thus, both the individual and his environment are changing as a result of a mutual influence, and behavior is a joint function of the two changing elements.
Cutting across these three complexity levels, there have been two major theoretical/methodological traditions for defining climate. Sells (1963) typifies one position in stating that "measurement of situational factors would be based on objective observation of the stimulus situation external to the participatory individual.... [l]f important interaction effects between individual and situational factors are to be studied, the situa- tional measures must be obtained independently of the individual's percep- tion of them (p. 7)." Other authors (Litwin & Stringer, 1968; Taguiri, 1968) explicitly define climate as a perceived phenomenon. According to this model, since it is people's perceptions of the environment which influence their behaviors, the best way to assess the environment is to tap those perceptions directly. The most common strategy is to employ subjective rating scales and to emphasize in the instructions that the rater is to describe his organization as it actually is, not to evaluate it as favorable or unfavorable. The object is to obtain a view of the organization as it is perceived by its members and thus as it impinges upon their behaviors. All too frequently, this position is adopted purely for the simple methodology it affords but it does exist as a valuable theoretical position as well.
The final variable in definitions of climate is the range of factors included in the assessment. In providing an incredibly extensive list of situational variables potentially affecting behavior, Sells (1963) establishes the impracticality of accounting for all environmental factors. Every researcher implicitly or explicitly selects a limited number of climate dimensions to be assessed. One tendency is to restrict climate to human or social variables and omit or treat sepa- ratel_y_character isties of the physical envi ronmept or formal aspects of the organization per se. Thus, Schneider and Bartlett (1968) developed their Agency Climate Questionnaire from items bearing on "the human characteristics of the organization, a combination of what managers do in agencies, what agents do in the agencies, how people are treated, and what kinds of people are in the agency (p. 323)." Although Halpin and Croft (1962) cite nine dimensions of an elementary school environ- ment, including physical plant, student, parent, and teacher charac- teristics, and administrative policies, they limited their climate instrument to social interactions among faculty and staff.
Pugh, Hickson, Hinings, MacDonald, Turner & Lupton (1963) differentiate between climate and structure as environmental elements affecting behavior. Structural factors refer to the extent to which organiza- tional behaviors are prespecified, standardized, structured or imposed on organizational members, and include the degree of formal restrictions

|i»9.
on communications and participation within the organization. The struc- tural characteristics of the organization develop from decisions made by those controlling organizational resources, and depend in part on the size and technology of the organization (e.g., Woodward, 1965)-
Climate is "a molar concept reflecting the content and strength of the prevalent values, norms, attitudes, behavior, and feelings of the members of a social system" (Payne & Pugh, in press). Climate is thus a result of the transaction between individual members, with their idiosyncratic needs, abilities, and goals, and the organizational structure. Both J structure and climate may be assessed either objectively or through ' / member perceptions.
Structure is typically given one of two meanings in the research and theoretical literature. One viewpoint is exemplified by Porter and Lawler (1965), who discuss the effect of such characteristics as size, span of control, and number of hierarchical levels on member performance and satisfaction. This viewpoint might be characterized as a physical component of structure. The alternative, embraced by Pugh et al. above, defines structure as the degree to which member activities are structured or controlled within the organization. Degree of bureaucratization (Hall, 19&3; Weber, 19^7) is a closely related concept and both refer primarily to the amount of behavioral or idealogical structure imposed.
Climate Instruments: Educational Climate
Organizational climate research has been conducted more or less independ- ently in two distinct fields: education, and profit centered business organizations. The major exception is Stern who has developed several parallel cJJjaa-Lg^J/ts truments, three for assessing colleges and high schools and one,(the Organizational C1imate jndexT^for general organizational appli- cations, in addition, Halpin and Croft's (1962) Organizational Climate Descript ion Quest ionnai re, afthough created to measure elementary school climate, is not conceptually restricted to educational settings, and Friedlander and Margulies (1969) have used a slightly modified version of the OCDO in assessing the climate of a business organization.
The measures most frequently used for studying educational environments are Stern's College Characteristics Index, Pace's College and University Environment Scales, Aston and Holland's Environmental Assessment Technique, Pervin's Transactional Analysis of Personality and Environment, and Halpin and Croft's Organizational Climate Description Questionnaire. Perhaps the most extensive is the College Characteristics Index (CCI)(Stern, 1970; Pace & Stern, 1958) which is designed to assess environmental press on 30 of Murray's needs (see Figure 2)-
I

150.
FIGURE 2 NEED AND PRESS SCALES ASSESSED BY STERN'S CCI
1. Aba Abasement-Ass Assurance: self-depreciation versus self-confidence.
2. Ach Achievement: striving for success through personal effort.
3- Ada Adaptabi1i ty-Dfs Defens iveness: acceptance of criticism versus resistance to suggestion.
4. Äff Äff i1iation: group-centered social orientation.
5. Agg Aggression-Bla Blame Avoidance: hostility versus its inhibition.
6. Cha Change-Sam Sameness: flexibility versus routine.
7. Cnj Conjunct ivi ty-Dsj Disjunctivi ty: planfulness versus disorganization,
8. Ctr Counteraction: restriving after failure.
9. Dfr Deference-Rst Restiveness: respect for authority versus rebel 1iousness.
10. Dom Dominance-Tol Toleranee: ascendancy versus forbearance.
11. E/A Ego Achievement: striving for power through social action.
12. Emo Emotionali ty-Plc Placidi ty: expressiveness versus stolidness.
13. Eny Energy-Pas Pass ivi ty: effort versus inertia.
]k. Exh Exhibi tioni sm-Inf Inferiority Avoidance: attention-seeking versus shyness.
15. F/A Fantasied Achievement: daydreams of extraordinary public recogni t ion.
16. Har Harm Avoidance-Rsk Risktaking: fearfulness versus thri11-seeking.
17. Hum Humanities, Social Science: interests in the humanities and the social sciences.
18. Imp Impulsiveness-Del Deliberat ion: impetuousness versus reflection.
19- Nar Narciss ism: vanity.
20. Nur Nurturance: helping others.

151.
21. Obj Object ivi ty-Pro Projectivi ty: objective detachment versus super- stition (Activities Index) or suspicion (Environment Indexes).
22. Ord Order-Dso Disorder: compulsive organization of details versus carelessness.
23. Ply Play-Wrk Work: pleasure seeking versus purposefulness.
2k. Pra Practicalness-Ipr Impracticalness: interest in practical activity versus indifference to tangible personal gain.
25. Ref Reflectiveness: introspective contemplation.
26. Sei Science: interests in the natural sciences.
27. Sen Sensuali ty-Pur Puritanism: interest in sensory and aesthetic experiences versus austerity or self-denial.
28. Sex Sexuali ty-Pru Prud i shness: heterosexual interests versus asceticism.
29. Sup Supplicat ion-Aut Autonomy: dependency versus self-reliance.
30. Und Understand ing: intellectuality.
Note.-From Stern, 1970.
The instrument consists of 30 scales, with 10 items per scale. I terns are statements describing a college environment high in the related press which are rated by students as true or false of their school. Schools can be described either in terms of mean scores on each of the 30 press scales, or in reference to scales derived from factor analysis of individual responses to CCI items. Stern (1970) describes 11 factors generated from a normative sample of 1076 students in 23 schools and colleges:
Aspiration level - expectation that students will set high goals
Intellectual climate - devotion to scholarship in humanities, arts, and social sciences
Student dignity - degree of student autonomy and self determination
Academic climate - emphasis on academic excellence in humanities and physical sciences
Academic achievement - press for high student achievement
Self expression - opportunity to develop leadership ability and self assurance

152.
Group 1ife - incidence of mutually supportive group activities
Academic organization - emphasis on organization and structure in the envi ronment
Social form - press for "proper" social behavior
Play vs. work - party atmosphere
Vocational climate - press for practical and conservative activities
High scores for a college on these dimensions indicate either active pres- sure to behave in the prescribed way, or the opportunity for related activities and hence on implicit press for the dimension.
Stern (1970) presents data indicating large differences in the score pro- files over these 11 factors for six different types of colleges. Independ- ent liberal arts schools are characterized as highly intellectual, denominational schools are socially oriented with low stress on academic achievement, and university liberal arts colleges are principally noted for their emphasis on play rather than work. Business administration schools emphasize practicality over intellectual activities, engineering colleges are high in press for grades and academic aspirations, and teacher's colleges appear to be generally undifferentiated from normative mean data except for a rather low emphasis on grades.
Stern's most informative measure of college environment is the score on a second order CCI factor, Intellectual Climate. This dimension includes positive loadings from the first 6 first order factors and negative loadings for the last two factors. According to Stern, Intellectual Climate defines the quality of staff and facilities, level of achievement standards, oppor- tunity for student self-development and self-responsibility, and an absence of vocationalism. Intellectual Climate scores correlate highly (greater than .70) with Scholastic Aptitude Test verbal scores, National Merit Scholarship Qualifying Test total scores, and percentage of graduates later receiving Ph.D.'s, although the correlation with SAT mathematics scores is relatively low (.3*0- The scale selects a set of small, "exclu- sive", liberal arts colleges with high achievement press and an emphasis on work rather than play. Students at high intellectual climate schools are characterized as holding higher than usual intellectual interests, and lower social and dependency needs. Viewed in the above manner, this vari- able almost begins to take on the appearance of a dependent variable.
Stern also reports another second order factor of Non-intellectual Climate with high factor loadings from factors representing institutional support- iveness and vocational emphasis. The former component may be interpreted as a protectiveness press or philosophy of in loco parentis on the part of the school. Vocational climate is highly related to a play vs. work atmosphere, and is somewhat tangential to the Non-intellectual Climate factor.

153.
In evaluating need-press fit, Stern gives an interpretation to the dif- ference between individual responses to the CCI and responses to the Act iv i ties Index (Al), his personality need measure. Al responses and expected college climate from the CCI were obtained for incoming students and compared with each other, and with mean CCI data for current students. Large differences are taken to indicate potential problems. The stu- dent may be referred for counseling to produce more accurate expectations, may be channeled into special programs more congruent with his needs, or presumably may be advised to transfer. The same model of individual - organizational "fit" would be applicable to almost any organization.
Stern (1970) reports a study by Cohen (1963) in which 12 Al factor scores were intercorrelated with 11 CCI factor scores for 55 institutions and the intercorrelation matrix factor analyzed. The resulting five factors shown in Figure 3 are interpreted as comprising an institutional culture -- a combination of environmental press elements and the influences of the particular types of people who attend the school. These factors represent Stern's most comprehensive definition of educational climate.
FIGURE 3 AI-CCI NEED-PRESS INSTITUTIONAL CULTURE FACTORS, AND
COMPONENT NEED AND PRESS DIMENSIONS (FROM STERN, 1970, PP- 205-210).
I. Expressive culture: Large positive loadings from Expressiveness, Sensuousness, and Friendliness need factors; negative loadings from Applied Interests need dimension, and Vocational Climate press factor. Institutions are aesthetic, gregarious, and non-practical, with high scores in femininity. Low scoring schools are characterized either by high Constraint vs. Expressiveness or by masculinity and appl ied interests.
II. Intellectual culture: Large positive loadings for Intellectual and Achievement related needs, and for Aspiration Level, Academic Cli- mate, Intellectual Climate, Self Expression, and Academic Achieve- ment CCI factors. Negative weight for Vocational Climate. This factor is very similar to the second order CCI factor of Intellec- tual Climate.
III. Protective culture: Large positive loadings for Submissiveness, Orderliness, Sensuousness, and Dependency need factors, and Group Life, Social Form, and Academic Organization press factors. Nega- tive loadings for Audacity and Assertiveness need areas. Protective institutions are characterized by a highly organized, dependent, submissive student body; a large proportion of high scoring schools are denominational women's colleges.
IV. Vocational culture: Large positive loadings from Egoism and Self Assertion need factors, and Vocational press. Schools are

154.
FIGURE 3 (Cont.)
characterized by an emphasis on conservatism and pragmatism, and students who are achievement oriented, socially dominant, and somewhat egocentric.
V. Col 1 eg iate culture: Large positive loadings for Friendliness and Self Assertion need factors, and for Play and Social Form press fac- tors. Negative weights for Student Dignity, Academic Achievement, and Academic Organization. The collegiate institution is oriented toward amusement, especially through social organizations, and pro- vides custodial care for its students, relieving them of personal respons i bi1ity.
The Intellectual and Protective factors correspond fairly well to the two CCI second order factors, while the personality factors apparently seemed to split Expressiveness away from the CCI intellectual dimension, and to separate the Vocational and Collegiate (play) dimensions from each other and from the CCI control factor.
Stern (1970) found that inter-institutional differences were best illus- trated by their differential scoring patterns on these 5 culture dimensions, while individual need-press fit was best assessed on the basis of individ- ual scores on the original 12 Al and 11 CCI dimensions.
Stern's interactive climate model predicts that individuals who have needs that are matched by a strong corresponding environmental press will exhibit better performance and greater satisfaction than students experiencing a poor fit with their environment. The main fault of the need-press model is the low correspondence between empirical structures found for individual need and organizational press measurements. If personality and press configurations are not similar, it is difficult to explain precisely how the two will interact to affect behavior. Stern (1970) presents the results of a factor analysis of 30 need and 30 press scales. Of 12 first level need
and 11 press factors, only two pairs of factors from the two sets appear reasonably comparable, indicating relatively dissimilar factor structures
underlying the two measures. However, this result is not quite as conclusive as it seems, since the second order factors for need and pr-ss scale responses are considerably more similar. Stern's Activi ty Index and the CCI are measuring the same broad areas, but they break them down differently. It is not particularly clear what this implies for the need-press model, except perhaps that only very general predictions can be made for the effect of a given environment on an individual. If a person's more specific per- ceptions of environmental press are arranged differently than his perceptions of his needs, it is difficult to predict his satisfaction in the environment.

155.
Pace's College and University Environment Scales (CUES) (Pace, 1968; Stern, 1970) was developed from the CCI. A factor analysis of institu- tional means on the 30 CCI press scales produced the 5 factors shown in Figure *».
FIGURE k THE COLLEGE AND UNIVERSITY ENVIRONMENT SCALES3
1. Scholarshi p: perceived environmental press for academic achievement; selectivity of the institution; importance of getting acceptable grades.
2. Awareness: perceived press for self expression; artistic orienta- tion; intellectual press.
3. Communi ty: perceived press for social activities; affiliation with faculty and other students.
h. Propr iety: press for social conformity; constraint; deference to tradi tion.
5. Practicali ty: emphasis on vocational ism; applied orientation.
Note.-From Pace, 1968.
a. All scales have 30 True-False descriptive statement items.
I terns were selected to measure these 5 dimensions on the bases of their factor loadings, the apparent relevance of their content for the factor, and their ability to discriminate between schools scoring high and low on the factor scores. The result was a 150 true-false item instrument with 30 items per scale. An item is scored positively if 2/3 of the respondents feel it is true of the school, and scale scores are the numbers of posi- tively scored items.
Only mean institutional data are used, in contrast with the CCI, in which both individual and institutional mean responses are interpreted. Pace (1968) reports different scale profiles for different types of schools: private liberal arts colleges, universities, engineering institutes, denomi- national schools, etc. Pace (1968) also presents some evidence for the generality of his educational climate dimensions by citing other empirical studies which produced factors of similar content. Stern's eleven first order factors, however, accurately reproduce all of Pace's dimensions except the Propriety scale, which is distributed over several CCI factors. In addition, the CCI factor scales permit a much finer breakdown of the perceived environment without greatly taxing the patience of respondents.

156.
In short, CUES scores, despite their slightly different organization, seem to offer little advantage over institutional mean data.on the CCI first order factor scores.
Astin and Holland (1961) created an objective method for describing a college environment, the Environmental Assessment Technique (EAT). Based on Holland's model of vocational preference, the EAT assumes that people entering vocational fields display personality profiles characteristic of those fields. Astin extends this theory to schools by assuming that students enrolling in a major field will tend to have personality charac- teristics similar to those of members of related professions. Thus colleges are characterized by the proportion of students majoring in fields belonging to each of Holland's six professional types. Table 7 defines the six types and lists the major fields classified in each.
TABLE 7 COLLEGE MAJOR FIELDS CORRESPONDING TO EACH OF SIX PERSONAL ORIENTATIONS
Orientation Description
Real istic
Intellectual
Social
Conventional
"masculine, physically strong, unsociable, agressive...prefers concrete to abstract"
"task-oriented, intraceptive, asocial, prefers to think through rather than act out; needs to understand"
"sociable, responsible, feminine ...needs attention...avoids intellectual problem-solving... orally dependent"
"prefers structured numerical and verbal activities and subordinate roles...conforming.
agriculture, agricultural education, physical educa- tion, recreation, indus- trial arts, engineering, forestry, trade and i ndustry
architecture, biological sciences, geography, medi- cal technology, pharmacy, mathematics, philosophy, physical sciences, anthropology
health education, education of exceptional children and mentally retarded, speech correction, education (unclass.), nursing, occupa tional therapy, physical therapy, scholastic philosa social science (general), American civilization, sociology, social work
accounting, secretarial, business and commercial (general and unclass.),
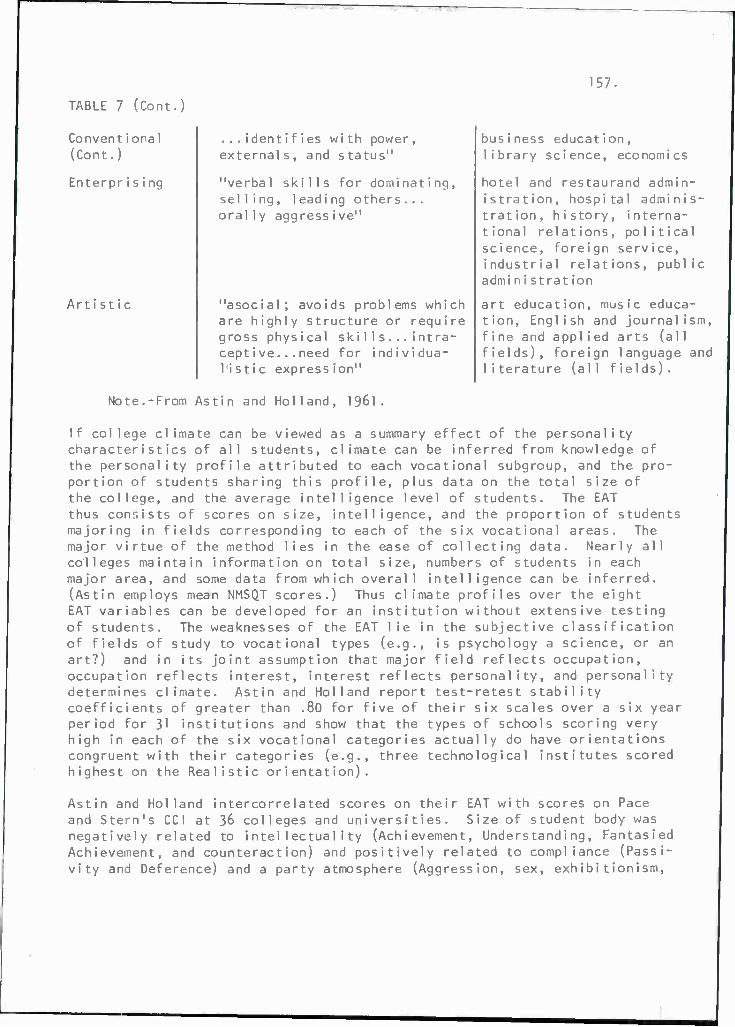
TABLE 7 (Cont.)
Convent ional (Cont.)
Enterpris ing
Arti stic
...identifies with power, externals, and status"
"verbal skills for dominating, selling, leading others... orally aggress ive"
"asocial; avoids problems which are highly structure or require gross physical ski 11s...intra- ceptive...need for individua- listic expression"
157.
business education, library science, economics
hotel and restaurand admin- istration, hospital adminis- tration, history, interna- tional relations, political science, foreign service, industrial relations, public admi ni stration
art education, music educa- tion, English and journalism, fine and applied arts (all fields), foreign language and literature (all fields).
Note.-From Astin and Holland, 1961.
If college climate can be viewed as a summary effect of the personality characteristics of all students, climate can be inferred from knowledge of the personality profile attributed to each vocational subgroup, and the pro- portion of students sharing this profile, plus data on the total size of the college, and the average intelligence level of students. The EAT thus consists of scores on size, intelligence, and the proportion of students majoring in fields corresponding to each of the six vocational areas. The major virtue of the method lies in the ease of collecting data. Nearly all colleges maintain information on total size, numbers of students in each major area, and some data from which overall intelligence can be inferred. (Astin employs mean NMSQT scores.) Thus climate profiles over the eight EAT variables can be developed for an institution without extensive testing of students. The weaknesses of the EAT lie in the subjective classification of fields of study to vocational types (e.g., is psychology a science, or an art?) and in its joint assumption that major field reflects occupation, occupation reflects interest, interest reflects personality, and personality determines climate. Astin and Holland report test-retest stability coefficients of greater than .80 for five of their six scales over a six year period for 31 institutions and show that the types of schools scoring very high in each of the six vocational categories actually do have orientations congruent with their categories (e.g., three technological institutes scored highest on the Realistic orientation).
Astin and Holland intercorrelated scores on their EAT with scores on Pace and Stern's CCI at 36 colleges and universities. Size of student body was negatively related to intellectuality (Achievement, Understanding, Fantasied Achievement, and counteraction) and positively related to compliance (Passi- vity and Deference) and a party atmosphere (Aggression, sex, exhibitionism,
158.
and Pragmatism). This clearly parallels the Collegiate Culture AI-CCI joint factor. NMSQT intelligence scores were strongly related to Stern's AI-CCI on Intellectual Culture and correlated negatively with the voca- tional climate component of the non-intellectual climate factor. Both of these results support Stern's (1970) investigations of the CCI.
Scores for the Realistic orientation scale correlate positively with Pragmatism and negatively with Reflectiveness, Humanities, and Sensuality. This combination of pragmatism and conservatism resembles the Vocational Culture, although negative correlations with Achievement, Dominance, and Ego Achievement somewhat reduce the similarity.
Intellectual orientation correlated negatively with Deference and posi- tively (though fairly low) with Fantasied Achievement, Understanding, and Objectivity. The lack of high correlations with Achievement, Humani- ties, and Counteraction indicates that this scale is not strongly related to the CCI intellectual climate and culture factors.
The EAT Social orientation describes a climate characterized by vanity, attention seeking, and interest in heterosexual interaction, with high correlations with Narcissism, Sex, and Exhibitionism. A negative relationship with Science indicates a dislike for the pure sciences.
The Conventional Orientation demonstrates very little relationship with any CCI scales. Its outstanding features are a notable lack of Achieve- ment motive and a preference for Passivity over energetic activity.
Astin and Holland's Enterprising and Artistic Orientations rather sur- prisingly showed highly similar patterns of correlations across the 30 CCI scales. Both had high positive correlations with Humanism, Sensuality, Reflectiveness, and Harm Avoidance vs. Risk Taking, and negative correla- tions with Pragmatism. It is baffling why the Enterprising scale should correlate as it does with Pragmatism and Harm Avoidance. Astin and Holland suggest that perhaps if business related and especially promo- tional fields were classified as enterprising rather than conventional, an enterprising climate might reflect more pragmatism, aggression, and dominance.
It remains to be shown how the EAT relates to actual student behavior.
Astin (1962) investigated the dimensionality of what might be called the structural aspects of educational institutions. He factor analyzed data from 335 colleges and universities on 33 objective institutional vari- ables in five areas--Institutional Type (e.g., private vs. public; liberal arts, technical or teacher training emphasis), Financial Charac- teristics (e.g., tuition, endowment, scholarship funds), Student Charac- teristics (e.g., % of mates in student body, % of graduate students, and

159.
all eight EAT measures), Faculty Characteristics (e.g., faculty/student ratio, % of faculty holding Ph.D.), and Miscellaneous Characteristics (e.g., library size, variety of curriculum, growth rate). A principal factors analysis yielded six factors which were labeled Affluence, Size, Private vs. Public Control, Masculinity, Homogeneity (range of scores on the six EAT dimensions and variety of curriculum), and Realistic (Techni- cal) emphasis. Subgroups of the schools were factor analyzed separately: private schools, public schools, universities, liberal arts colleges, and men's institutions. Factor content in each of these subgroups was highly similar to the structure for the total sample, except that in all five subgroups analyses an additional factor of Intellectual Orientation or scholarship emerged.
It would be encouraging to discover at least some similarity between the factor structure of Astin's primarily objective "structural" variables and that of the perceptual measures described by Pace (1968) and Stern (1970). Clearly the relationship between perceptual indices like the CCI and its offspring, and more objective environmental measures demands i nvestigat ion.
Astin (1968) tested the relationship of institutional structure variables to academic achievement. The criterion variables were scores on Graduate Record Examination tests of three content areas: Social Sciences, Humani- ties, and Natural Sciences. Subjects were 669 students from 38 universi- ties and liberal arts colleges, for whom data were available on ten personal "input" variables including NMSQT scores, high school grades, highest degree planned, intended career, and intended field of study. Environmental measures of the institutions included:(a) selectivity (mean student ability, reflected by mean NMSQT score of incoming students), (b) per student expenditures on faculty and staff, (c) five measures from the Affluence scale obtained in the previous factor analytic study, and (d) mean perceived competition for grades as rated by students. Astin computed multiple correlations between each of the three criterion area scores and (1) combined student input and college environment variables; (2) student input and college environment variables separately; and (3) each of student input and college environment variables with the other statistically controlled. The results, shown in Table 81 indicate that environmen- tal factors a lore are not strongly related to achievement scores in the humani- ties and physical sciences, and that when individual ability is statis- tically controlled, the environmental measures employed here contribute almost nothing to achievement score variance. These results are due to the fact that student ability and performance can covary both within and across institutions, while institutional structure variables are constant within, and can vary only across schools. Apparently the only favorable effect environmental variables have on school performance is through attracting high quality students to the institution, and these effects disappear when student ability is statistically controlled.

160.
TABLE 8 PROPORTIONS OF ACHIEVEMENT TEST VARIANCE RELATED TO ENVIRONMENTAL AND INDIVIDUAL ABILITY FACTORS
Variance Source
Achievement Test Area
Social Sciences Humani ties
Natural Sciences
Joint individual & environment effects
Individual ability
College environment
Ability independent of environment
Environment independent of ability
• 515
.482
.198
.317
• 033
.486
.430
.106
.380
.056
.530
.496
.104
.426
.034
Note.-Taken from Astin, 1 968.
Pervin's (1967) Transactional Analysis of Personality and Environment (TAPE) requires students to rate each of six concepts (self, student, administration, faculty, college, and ideal college) on 52 semantic differential scales. Pervin contends that behavior (organizational effectiveness?) is a function of the transaction between individuals and their environment, with each influ- encing the other. Analysis of profile patterns over concepts and over scales within and between schools provides information on how various environmental factors interact with individual characteristics to influence performance and satisfaction. Large differences in the ratings of different concepts within a school indicates that stresses are present among the component groups of the college. Such differences, especially between the self rating and other concepts, were found to be negatively correlated with satisfaction (Pervin, 1967). Different types of institutions, in terms of organizational and average member characteristics, can be defined by subgrouping schools on the basis of profile similarity on the six concepts for each, or for all, of the 52 scales. Data provided by Pervin indicate that individual scale test- retest stabilities are low (.4-.5) over a one month interval for a small number of students at a Midwest college. Ratings for self, student and college concepts had one month stability correlations of .6 to .7 for the same sample. Self-college and self-student discrepancy scores, the most relevant for intra-organizational analysis, showed one month test-retest

161
stabilities of .87 and .95 respectively. No data were provided on the reliability of inter-school profile differences.,
A 3-mode factor analysis of responses to the TAPE instrument produced the 13 scale factors listed in Figure 5, some of which appear compatible with dimensions described by Pace (1968) and Stern (1970) as consistently resulting from multivariate analyses of educational climate questionnaires,
FIGURE 5 TAPE EMPIRICAL FACTOR SCALES
1. Impulsivity vs. Inhibition
2. Humane idealism vs. Narcissism
3. Warm vs. Cold
k. Introversion vs. Extroversion
5. Goal directed activity vs. Undirected, unmotivated activi ty
6. Liberal idealism vs. Conservative pragmatism
7. Intellectualism, scholarship vs. Applied interests
8. Optimism vs. Pessimism
9. Convent ional ity
10. Feminine sensitivity vs. Masculine insensitivity
11. Artistic creativity vs. Pragmatism
12. High vs. Low regard for tradition
13- Cosmopolitanism vs. Rural provincialism
Notably, Pervin's Scholarship and idealism vs. practicality directly corres- pond to both CCI and CUES dimensions; Tradition and conventionality parallel Stern's Academic Organization and Pace's propriety factor; Warmth-coldness and introversion-extroversion seem similar to Pace's community; and Sensi- tivity may relate to Pace's Awareness factor. Finally, Pervin's Goal Directed Activity and Impulsivity appear comparable to Stern's Academic Achievement and Self Expression respectively. Thus, unlike Astin's objective measures, different methods of tapping student perceptions appear to produce highly similar environmental dimensions.

162.
The Organizat is a 64 i tern 4-point Liker or principal teachers, and of the "perso has four seal behavior, and pals in their iterative con
ional Climate Description Questionnaire (Halpin £ Croft, 1962) questionnaire tapping the climate of elementary schools by t scale responses to descriptive statements about peer (teacher) behavior. Halpin and Croft focus on the interactions among between principals and teachers as one important determinant
nality" or climate of a school. As shown in Table 9, the OCDQ es tapping teachers' perceptions of typical peer group four scales assessing perceptions of the behavior of princi- interactions with teachers. Scales were derived by an
tent-cluster analysis of 600 items describing the "interpersonal
TABLE 9 SCALES FROM THE ORGANIZATIONAL CLIMATE DESCRIPTION QUESTIONNAIRE
Dimens ions
Number of
i terns
Split half3
reliabi1i ty Inter0
rater correlations
1. Disengagement: group merely "going through the motions"; low involvement
2. Hindrance: performance hindered by petty administrative details
3. Esprit: morale; social & achievement need satisfaction
*». Intimacy: friendly social relations among members
5. Aloofness: high emotional distance from leader
6. Production emphasis: close, directive supervision
7. Thrust: group motivation by leader example & effort
8. Consideration: leader supportiveness
7
9
7
9
6
.73
.68
.75
.60
.26
• 55
M
.59
• 59
.5*»
.61
M
.76
.73
.75
.63
Note.-From Halpin & Croft (1962)
a. Split half reliability with Spearman-Brown corrections, N = 1151 teachers.
b. Correlations between means of odd and even groups of teachers within each school, computed over 7' schools.

163.
events and experiences" of teachers. The analysis produced eight scales showing both reasonable internal consistency and a subjectively meaningful content.
A Q-factor analysis of a matrix of correlations between pairs of 71 schools, over the eight scales, generated three bipolar factors, labeled Authenti- city vs. Hypocrisy in relationships, Social need satisfaction vs. Social control and Group vs. Leader Initiation of leadership acts. Schools having very high or very low loadings on only one of these factors were assumed to epitomize the "types" of school defined by the factors. Halpin and Croft thus derived three pairs of bipolar "types" of schools, each of the six types demonstrating a characteristic profile of scores over the eight initial climate scales. The six types were interpreted as ranging over a continuum of "Openness vs. Closedness", each with a characteristic pattern of internal social behaviors. Characterizations of the six types and their ideal load- ings on the three Q-factors are illustrated in Table 10.
TABLE 10 IDEAL LOADINGS OF SIX SCHOOL TYPES ON THREE Q-FACTORS
School Types
Factors3'6
1 1 1 II1
Open
Autonomous
Control 1ed
Familiar
Paternal
Closed
1.0
-1.0
-1 .0
1 .0
1 .0
-1.0
Factors are Q-factors resulting from a factor analysis of a matrix of intercorrelations of pairs of schools (K=7l) over 7 climate dimensions (N=8). Factors are defined as:
I . II. I I I
Authenticity of leader interactions with group Social control vs. social need satisfaction Group vs. Leader initiation of leadership acts
Blank matrix entries are zeroes.

\6k.
Summary of Educational Climate Measurement
Most climate models relate the interactive effects of perceived or objec- tive global environment on individuals and their behavior. In general, research into the climate of educational organizations has not yet reached the stage where it can specify the nature of these interactive relation- ships. Most users of educational climate instruments to date have focused on determining the dimensions of climate through factor analysis of climate responses, or have attempted to gather normative data on a sufficiently large sample of institutions to permit assessment of the joint effects of climate differences and individual differences on performance and satisfac- tion. Exceptions to this generalization include Pervin's (1967) analysis of satisfaction as a function of individual-col lege fit, and the extensive work of Stern (1970) in both educational and noneducational areas.
Pace's (1968) discussion of consistently discovered dimensions of college environments are supported by Pervin's (1967) factor analysis of his semantic differential scales, and the consistency of several of these dimensions over a variety of scaling techniques lends strong support to their importance as central dimensions of educational institutions.
Astin's EAT, while attractive in its objectivity and ease of data collec- tion, somehow seems too simple to be valid. Its many assumptions, and its somewhat blithe categorization of personalities on the basis of major field selection render it somewhat suspicious, and even Astin and Holland admit the fool hardiness of inferring overall college intelligence levels, as they do, from the high school test scores of as few as 15 or 20 students Use of empirically derived scales, such as the CUES, the factor scales of the CCI and Pervin's TAPE technique, seems more justifiable, especially since a variety of studies have uncovered at least some apparently common dimensions. At the present, then, some assessment of student perceptions of Stern's 11 CCI factors, or Pervin's 13 TAPE factors will likely provide the most meaningful information on the nature of college environments, and the influences of those environments on the behavior of individual students.
Halpin and Croft's OCDQ, which assesses a limited portion of a slightly different educational setting, has proved at least somewhat amenable to adaptation for the study of other kinds of organizations (Friedlander & Margulies, 1969). Give the narrow focus of the OCDQ, a low correlation of its subscales with those of other educational assessment devices is not surprising. In general, it seems more appropriate to consider the OCDQ as a measure of organizational interpersonal behavior, originally applied in an educational setting, rather than as an instrument intrinsi- cally focusing only on educational environments.
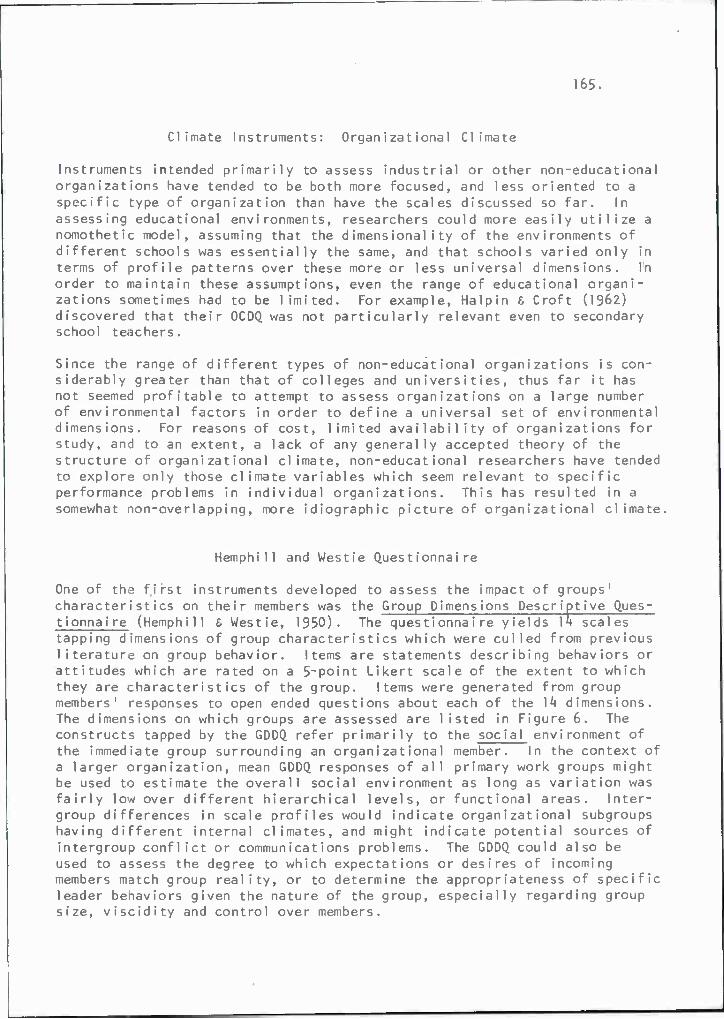
165.
Climate Instruments: Organizational Climate
Instruments intended primarily to assess industrial or other non-educational organizations have tended to be both more focused, and less oriented to a specific type of organization than have the scales discussed so far. In assessing educational environments, researchers could more easily utilize a nomothetic model, assuming that the dimensionality of the environments of different schools was essentially the same, and that schools varied only in terms of profile patterns over these more or less universal dimensions. Iln order to maintain these assumptions, even the range of educational organi- zations sometimes had to be limited. For example, Halpin 6 Croft (1962) discovered that their OCDQ was not particularly relevant even to secondary school teachers.
Since the range of different types of non-educational organizations is con- siderably greater than that of colleges and universities, thus far it has not seemed profitable to attempt to assess organizations on a large number of environmental factors in order to define a universal set of environmental dimensions. For reasons of cost, limited availability of organizations for study, and to an extent, a lack of any generally accepted theory of the structure of organizational climate, non-educational researchers have tended to explore only those climate variables which seem relevant to specific performance problems in individual organizations. This has resulted in a somewhat non-overlapping, more idiographic picture of organizational climate,
Hemphill and Westie Questionnaire
One of the first instruments developed to assess the impact of groups' characteristics on their members was the Group Dimensions Descriptive Ques- tionnai re (Hemphill & Westie, 1950). The questionnaire yields 1H scales tapping dimensions of group characteristics which were culled from previous literature on group behavior. I terns are statements describing behaviors or attitudes which are rated on a 5"point Likert scale of the extent to which they are characteristics of the group. I terns were generated from group members' responses to open ended questions about each of the 14 dimensions. The dimensions on which groups are assessed are listed in Figure 6. The constructs tapped by the GDDQ refer primarily to the social environment of the immediate group surrounding an organizational member. In the context of a larger organization, mean GDDQ responses of all primary work groups might be used to estimate the overall social environment as long as variation was fairly low over different hierarchical levels, or functional areas. Inter- group differences in scale profiles would indicate organizational subgroups having different internal climates, and might indicate potential sources of intergroup conflict or communications problems. The GDDQ could also be used to assess the degree to which expectations or desires of incoming members match group reality, or to determine the appropriateness of specific leader behaviors given the nature of the group, especially regarding group size, viscidity and control over members.

166.
FIGURE 6 GDDQ DIMENSIONS
1. Autonomy: Degree to which the group is independent of other groups; self-determination of group activities.
2. Control: Degree of group regulation of member behavior.
3. Flexibi1ity: Extent to which group activities are free from constraint by custom, tradition, written rules, or unwritten codes.
k. Hedonic Tone: Amount of pleasure afforded by membership.
5. Homogenei ty: Degree of uniformity regarding the age, sex, race, social class, interests, attitudes, and habits of members.
6. Intimacy: Closeness of acquaintanceship; familiarity with personal details of each other's lives.
7. Participation: Proportion of time spent in group activities.
8. Permeabi1i ty: Openness of group to new members.
9- Polarization: Degree to which group goal is unitary, and explicit to a 11 members.
10. Potency: Centrality of group membership in the lives of the members.
11. Size: Number of members.
12. Stabi1i ty: Resistance to structural changes over time; rate of turnover.
13. Strati fication: Differentiation of internal status hierarchy.
14. Viscidi ty: Cohesiveness; absence of dissension and conflict; degree to which all members function as a unit.
Survey of Organizations (ISR)
Similar to the GDDQ in its focus on the group as the primary source of influ- ence in an organization is the work by Likert (1967) and the Survey of Organi- zations (Taylor & Bowers, 1972) of the University of Michigan's Institute for Social Research. The Survey of Organizations is a standardized questionnaire intended to discover organizational barriers to improving overall performance. As was noted in a previous section, a portion of the questionnaire is devoted to items intended to assess organizational climate. Likert (1967) theorizes

167.
that performance and satisfaction are the results of leadership behaviors and of organizational climate, with the effects of these variables mediated by peer leadership influences and group processes. A partial test of some of the causal statements (Franklin, 1973) was reported in a previous sec- tion. Climate is conceived as the perceived total impact upon a work group of the constraints, policies, and evolving demands of other superior work groups in the organizational hierarchy. It was originally hypothesized that these imposed constraints would affect the nature of motivational forces, and communications, coordination, decision making, goal setting, and control and influence processes within and between work groups. I terns tapping these areas comprise the climate scale of the survey. A cluster analysis of data from 1448 work groups revealed six interrelated clusters of items in the climate scale, four clusters which appeared in an earlier analysis on a smaller sample, and two clusters which have yet to be replicated, and hence are considered tentative experimental scales. Empirical cluster scales are presented in Table 11. Responses are summed over scales to derive a total climate score for each work group.
TABLE 11 SURVEY OF ORGANIZATIONS EMPIRICAL CLIMATE SCALES
Internal Sea 1e 1 terns Consistency
1 . Human Resources Primacy: Concern for welfare & happiness of workers 3 .80
2. Communications Flow: Freedom of flow of task relevant information within & between groups 3 .78
3. Motivational Conditions: Presence & nature of organizational factors eliciting effort 3 .80
k. Decision Making Practices: Decision making characterized by delegation £ participation vs. centrali zat ion 4 .79
5. Technological Readiness3: Quality 6 innovativeness or work methods & equipment 2 .58
6. Lower Level Influence3: Amount of influence possessed by workers and first level supervisors 2 • 70
Tentative, experimental scale

X
168.
Cross lag correlations were computed between overall climate scale and various dependent variables over time intervals varying from six months to two years. Climate correlates high positive with satisfaction, as measured by the Survey of Organizations questionnaire: two survey adminis- trations yielded concurrent correlations of .78 and .88, and the cross lag correlation between climate and satisfaction over a six month interval was .78. All values are significant at p < .01. The difference between the climate-sat i sfact ion and the satisfaction-climate correlations over th&. sIx month interval is also highly significant providing some support for a model of favorable cTimate as a precondition to satisfaction.
The relationship between climate and performance criteria is more equivocal. Taylor and Bowers administered their survey once, and gathered performance data on a number of variables over a period of 6 to 18 months. They then computed correlations between their survey variables and the organizational performance variables at various time intervals. Results are reported for each firm, and for each six month performance data collection interval, in terms of the percentage of correlations that are significant, and mean value of significant correlations. The former is generally the more informative index, although a mean significant correlation near zero indicates at least two significant correlations with opposite signs during a single data interval. Such results are difficult to handle in any model.
In general, more than 20% of correlations are significant between concurrent measures of climate and cost data, absence rate, time lost due to sickness and minor injuries, and grievances. Predictive relationships between cl imaje measures and performance data collected 12 or 18 months later are either low or__i neons is tent across different organizations. No clear causal link exist? between climate and subsequent performance^ Nonsignificant concurrent correlations we r e~oBTa i ned between ""cTTmäte-irTd product quality, turnover, or disabling injuries.
These performance results, taken together with the high correlation between climate and survey satisfaction measures, seem to indicate that the ISR climate scale serves as a concurrent index of satisfaction and its behavioral indicators (cost data, absenteeism), but not of actual performance variables (e.g., product quality). Climate has so far predicted little except sub- sequently rated satisfaction.
In sum, the apparent lack of heterogenei ty_of r.l imate subscales (scale intercorrelations range from .k\ to .78. with a median value of .64), the high correlation with rated satisfaction, and the low relationship with nonsati sfact ion criterion measures Implies that the ISR climate scalejjüghj: possibly be interpreted as a homogeneous measure of worker satisfactlonT

169,
Schneider and Bartlett
Schneider and Bartlett (1968) developed an insurance Agency Climate Questionnaire (ACQ) to permit quantitative assessment of the social environment of insurance agencies. The instrument was derived from a factor analysis of 299 social climate items generating six factor scales tapped by 80 Likert type items. The scales are listed in Table 12.
TABLE 12 AGENCY CLIMATE QUESTIONNAIRE EMPIRICAL SCALES
Scale 1 terns Rel a
tabi1i ty
1. Managerial Supportiveness 15 .90
2. Managerial Structure (Emphasis on performance) 15 .65
3. Concern for New Employees 13 .59
k. Intra Agency Conflict 11 .76
5. Agent Independence 11 .52
6. General Satisfaction 15 .7*
Scale average item intercorrelations, with Spearman-Brown corrections, for 386 agents.
Schneider's major contribution to the study of climate is his discovery (Schneider 6 Bartlett, 1970) that different hierarchical levels within agencies perceive agency climate differently. Schneider and Bartlett (1970) found very low correlations between responses of managers and agents to the same climate scales. They did conclude, however, that there is reasonably consensus within hierarchical levels, although here, too, the highest average interrater correlation for any scale was .26, and only two scales, General Satisfaction and Structure, convincingly demonstrated discriminant validity within levels.
Schneider hopes to show that the performance of new agents is related to any of three agent-environment "fit" models: The match between new agent climate

170.
preferences and expectations, the match between new agent preferences and actual agency climate as perceived by current agents, and the match between new agent expectations and actual cl imate. Thus far Schneider (1972) has found that new agent preferences are unrealistically high, that even new agent expectations are slightly higher than manager perceptions, and that old agent perceptions of actual climate are considerably lower than their managers' ratings. The mean correlation over six scales between new agents' expectations and old agents' perceptions is marginally significant, though very small (r =.17, p < .10), leading Schneider optimistically to hypothe- size some mechanism producing a match between expectations and the reality of the organization entered. Computing the correlation between climate expectations and actual climate of agencies not entered, would determine whether this "mechanism" is merely a generalized stereotype of insurance agencies, rather than some process by which new agents somehow sort them- selves into compatible work environments. In any case, a mean correlation of .17 is not very strong evidence for an important relationship between new and old agents' opinions. Perhaps a more meaningful model of new agent behavior postulates two stages for the employment process. Agents initially go to agencies in which the pattern and elevation of the climate perceptions of the recruiting member (usually the manager) are most similar to those of the prospective agent. After the contract is signed, tenure and performance might be more closely related to the discrepancy between expected and actual climate as measured by elevation and pattern differences between new agent expectations and old agent perceptions. The first part of such a model would definitely be compatible with the data Schneider presents,
Schneider and Dachler (1972) present a wide conception of climate as a joint function of employee perceptions, and the perceptions of the organization by non-members who are important to the employee. Thus, the attitudes of family and friends affect the global perceptions of the organization by its members. In this conceptualization, climate is viewed as an index of the instrumentality of the organization for members' personal goals. If the organization is perceived by the member or his relevant others as leading to favorable personal outcomes, the global organization perception (i.e., climate), is favorable, and the member will feel motivated to remain and participate actively in the organization. The validity of this motivational climate model has yet to be tested.
Evan
Evan (1968) also presents a model of climate perceived by non-members of the organization. In his view, non-members' perceptions of the "essential attributes of character" of an organization will affect their willingness to deal with the organization as suppliers or consumers, and thus directly impinge upon the organization. Evan's too is a theoretical paper, and no studies have yet been published dealing with the climate perceptions of non-members.

171
Modification of Educational Climate Measures
As was mentioned earlier, Halpin and Croft's Organizational Climate Descrip- tion Questionnaire, although developed for use in elementary schools, assesses factors relevant to any organization (see Table 3)- Friedlander and Margul ies (1969), using a slightly reworded version of the OCDQ, attempted to assess the relationship between the 8 OCDQ dimensions and worker satisfaction with three work factors: interpersonal relationships, involvement in the task, and opportunity for advancement. The sample consisted of 95 employees (91 parts makers and assemblers and k supervisors) from k departments of an electronics firm. The authors found that two OCDQ scales, Aloofness and Pro- duction Emphasis, did not correlate with any of the three satisfaction measures, while the other six scales all correlated significantly with all the satisfaction areas. A stepwise multiple regression of each satisfaction measure on to the 8 OCDQ dimensions indicated that two dimensions, Thrust and Hindrance, were central to satisfaction with all three job factors. In addi- tion, Esprit was an important component of social need satisfaction, and Intimacy was related to satisfaction with advancement opportunity. However, the sample size is not large, and without cross validation it may be dangerous to interpret the differential contributions of the various climate factors to satisfaction. Friedlander and Margulies also divided their subjects into groups rating high and low importance for each of their three satisfaction measures, and computed a separate multiple correlation for each of the two groups on each variable. They report large regression weights for Thrust, Intimacy, and low Hindrance in the high importance group, and low Esprit and low Disengagement for the low importance group on all three satisfaction measures Unfortunately, they neglect to reproduce the regression weights themselves, and surprisingly, they fail to report the value of the multiple correlations, con- trolling for importance of the satisfaction areas. One can only assume that these correlations were no higher than the uncontrolled multiple correlation between climate and satisfaction, but the actual values of these correlations would be extremely valuable to assess a worker-environment-fit climate model.
Friedlander and Greenberg (1971) investigated the relationships between peer and supervisory supportiveness and job performance for a group of 22 "hard core unemployed". These workers'-rated perceptions on three "supportiveness" scales were significantly lower than their supervisors' ratings (p < .01). Workers' ratings on all three scales correlated significantly (p < .05) with supervisors' ratings of worker competence, congeniality, and conscientiousness; worker ratings of supervisory support correlated with supervisor ratings on effort and intelligence. Unfortunately, Friedlander and Greenberg fail to report the correlation, if any, with their only objective criterion, job tenure. This is especially disappointing because they did interrelate tenure with their other dependent variables, and found negative correlations between length of tenure and aH_ of their supervisory ratings of performance. Super- visor ratings of reliability (regular attendance) correlates -.60 (p < .01) with tenure. Friedlander and Greenberg are unable to explain these consistent negative correlations with tenure, which casts some doubt on the validity of the supervisory ratings and the .study in general.

172.
The Organizationa1 Climate Index (OCI) was developed by Stern (1970) as a generalized instrument to assess the need-press characteristics of any organization. The OCI, like the College Characteristics Index, consists of 30 10-item scales measuring environmental press on 30 of Murray's needs (see Figure 2). Data were collected on the OCI for three dissimilar samples: 931 teachers in kk elementary, junior high, and high schools in Syracuse, New York; 2505 Peace Corps trainees in 63 separate units in the U.S.; and 223 industrial workers (white and blue collar levels) in three remote locations (Alaska, the Near East, and an isolated location in the continental U.S.). Within the school and Peace Corps samples, each of the 30 scales significantly (p < .01) discriminated among the kk schools and the 63 units respectively. For the industrial sample, 2/3 of the scales differentiated among the three work sites (p < .05). The scales also differentiated among the three different types of organization. Schools were rated high in their press for adaptability, sociability, energy, social action, and reflectiveness. The industrial sample emphasized sociability and pragmatism. Separate factor analyses of the three sets of data each yielded six factors. All three samples showed factors of Intellectual Climate, Orderliness, Impulse Control, and Supportiveness (see Table 13).
TABLE 13 OCI FIRST ORDER FACTORS SHARED BY
THREE DISSIMILAR ORGANIZATIONAL SAMPLES
Factors High Loading OCI Scales
Intellectual Climate Humani ties Reflectiveness Science Ego Achievement Fantasied Achievement Sensuali ty Understanding
Orderliness Order Adaptabi1i ty Conjunctivi ty Harm Avoidance Narcissism
Impulse Control Blame Avoidance vs. Aggression Counteraction (negative) Deference Placidity vs. Emotionality Deliberation vs. Impulsiveness Work vs. Play Prudishness vs. Sexuality

173.
TABLE 13 (Cont.)
Factors High Loading OC1 Scales
Supportiveness Assurance vs. Abasement Tolerance vs. Dominance Objectivity vs. Projectivity Affi1iation Conjunctivi ty Harm Avoidance Supplication
All three samples demonstrated identical second order features of Develop- ment Press and Control Press. Development Press represents an environmental emphasis on intelligent and organized pursuit of organizational goals in a supportive atmosphere. Control Press is an emphasis on self control over behaviors perceived as improper or harmful to the organization. It is unclear whether Stern's respondents were describing pressures from the offi- cial organization, their peers, or both, and which press was emphasized when official and peer pressures were divergent. Such differences may explain why, in the school sample, the Intellectual factor and an Achievement factor loaded on the Development second order factor, and their inverses (Non- achievement and Non-intellectual Climate) on the control factor. These might represent simultaneous administration press for intellectual climate and high achievement standards, and peer pressure against looking good at the expense of fellow teachers. A study investigating the differences in press from different sources might be informative under the need-press model
Payne and Pheysey
Payne and Pheysey (1971), reasoning that there is no obvious reason for organizational climate to be structured in the same way as individual per- sonality, sought to reorganize the 300 OCI items to help investigate the relationships among organizational structure, climate, and performance (Pugh et a)., 1963). Payne and Pheysey subjectively classified 25^ of the 300 OCI items into 2k content categories. A sample of 120 managers from 100 firms responded to these scales, and an item analysis retained 192 items in 2h scales, titled the Business Organization Climate Index (B0CI). The scales and their reliabilities are listed in Table ]k.

174.
TABLE 14 BOCI SCALES
Number of Split-half
Seale Title i terns reliabi1i ty
Authority scales
Leader's Psychological Distance 8 0.64
Questioning Authority 7 0.76
Egali tarianism 6 0.82
Management Concern for Employee Involvement 10 0.88
Restraint scales
Open Mindedness 8 0.82
Emotional Control 7 0.64
Physical Caution 4 0.58
Work interest scales
Practical Orientation 6 0.72
Future Orientation 6 0.86
Scientific and Technical Orientation 8 0.88
Intellectual Orientation 11 0.46
Job Challenge 11 0.66
Task Orientation 8 0.84
Industriousness 14 0.86

TABLE ]k (Cont.)
175.
Personal relations scales
Al truism
SociabiIi ty
Interpersonal Aggression
Homogenei ty
Routine Scales
Rules Orientation
Administrative Efficiency
Convent ionali ty
Readiness to Innovate
Variety in Physical Environment
Community scales
Orientation to Wider Community
TOTAL
7
10
6
k
6
9
10
9
5
12
92
0.62
0.92
0.78
0.26
0.72
0.78
0.82
0.80
0.60
0.72
High and low level managers in each of two British firms responded to the B0CI and, contrary to Schneider and Bartlett's (1970) findings in U.S. insurance agencies, no hierarchical differences in climate perceptions appeared. Although Payne and Pheysey's samples are all managerial personnel, while Schneider compared managers with sales employees, it is unclear that this accounts for the different results. Further research into the causes and implications of intraorganizational differences in climate perceptions ?s of great importance. Payne and Pheysey also found no differences in the climate perceptions of line and staff managers within firms, justifying the use of mean data as an estimate of overall organizational climate.
A factor analysis of responses by the two managerial samples to the 2k climate scales yielded five factors. Payne and Pheysey describe the first

176.
general factor as Organizational Progressiveness, loaded most heavily by Intellectual Orientation, Future Orientation, Management Concern for Employee Involvement, Task Orientation, and Scientific-Technical Orientation. The second factor is Normative Control, loaded by Rules Orientation, Leader's psychological distance, Conventionality, Emotional control, and Closed- mindedness. The similarity of these two factors to Stern's (1970) second order factors of Development and Control Press is obvious. Payne and Pheysey do not interpret their third factor, but it is heavily loaded by Readiness to innovate (.50), Homogeneity (-.73). Interpersonal aggression (.35), Egal i- tarianism (-.33), and Job challenge (.32). These loadings can be interpreted as defining an Individualistic creativity vs. Conforming homogeneity factor, and would again represent a peer-press dimension, in contrast to the primarily official organizational press underlying the first two factors.
Payne and Pheysey compared the climates of three organizations selected for their differences in structural and context variables. Firms A and B were of similar size and technology type, but the work activities of Firm A were much more highly structured than those of Firm B. Firm C, like Firm A, was highly structured, but had nearly 10 times as many employees as Firm A, and operated in a mass rather than batch production mode. N's were 50 managerial personnel from A, 22 from B, and 21 from C.
Firm A was predictably more pragmatic and more structured than Firm B, scoring significantly higher on all 7 Work Interest Scales (see Table 14), and on k of 5 Routine scales. Firm A was lower in Altruism and on Orientation to the Community. Paradoxically, Firm A scored significantly lower than Firm B in Leader's Psychological Distance, and higher in amount of Questioning of Authority. In terms of the factors derived from the scale responses, Firm A is significantly higher in Organizational Progressiveness (a pragmatic- performance dimension), but not in Control or in Independence vs. Conformity. The overall picture of Firm A shows a highly structured, centralized, efficient, and task centered firm, in which superiors and subordinates enjoy reasonably close contact including some open conflict if managers disagree with their superiors' directives.
The climate perceptions of managers in Firm C, the large, structured organi- zation, are surprisingly similar to those of Firm B. Firm A is again sig- nificantly higher on the Work Interest Scales and the Routine Scales, and lower in Leader's Psychological Distance. From these results it seems safe to conclude that managerial climate, at least as measured by the BOCI , is not necessarily related to size and structuring factors, but perhaps involves more nebulous social variables such as a tradition of managerial paternalism, rather than a more mechanistic management.
Li twin and Stringer - ,^
Litwin and Stringer (1968) describe the development of a climate scale based on Atkinson's need-motivation theory. According to Atkinson's model, the motivation to perform a given behavior is a joint function of the strength
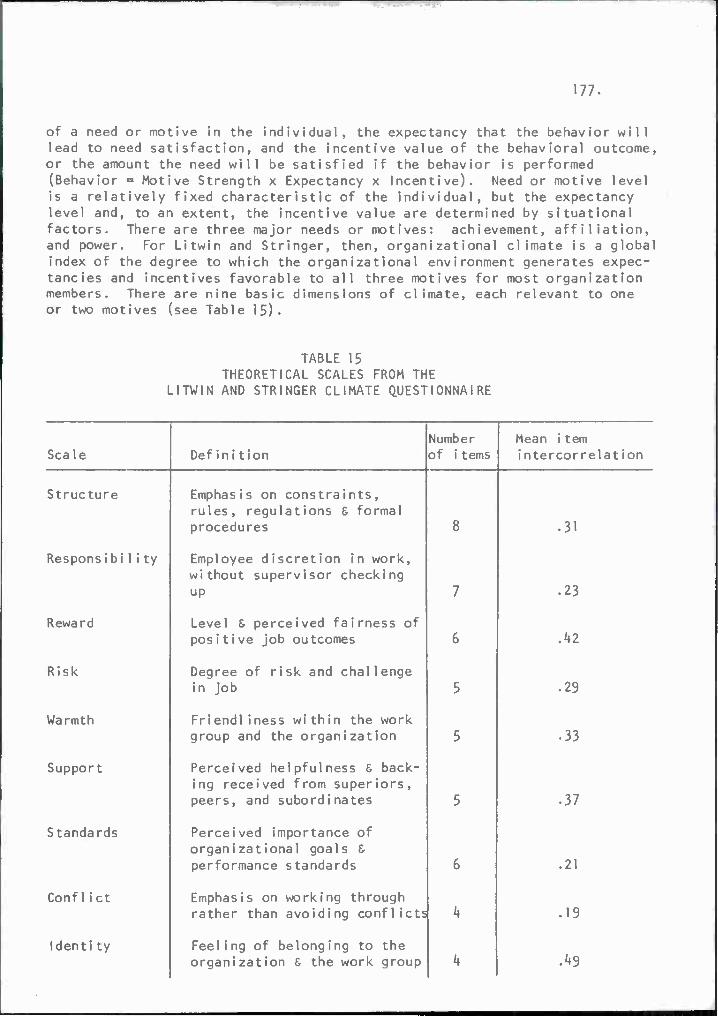
177.
of a need or motive in the individual, the expectancy that the behavior will lead to need satisfaction, and the incentive value of the behavioral outcome, or the amount the need will be satisfied if the behavior is performed (Behavior = Motive Strength x Expectancy x Incentive). Need or motive level is a relatively fixed characteristic of the individual, but the expectancy level and, to an extent, the incentive value are determined by situational factors. There are three major needs or motives: achievement, affiliation, and power. For Litwin and Stringer, then, organizational climate is a global index of the degree to which the organizational environment generates expec- tancies and incentives favorable to all three motives for most organization members. There are nine basic dimensions of climate, each relevant to one or two motives (see Table 15).
TABLE 15 THEORETICAL SCALES FROM THE
LITWIN AND STRINGER CLIMATE QUESTIONNAIRE
Scale Def ini tion Number of i terns
Mean i tern intercorrelation
Structure Emphasis on constraints, rules, regulations 6 formal procedures 8 .31
Responsibi1i ty Employee discretion in work, without supervisor checking up 7 .23
Reward Level & perceived fairness of positive job outcomes 6 .42
Risk Degree of risk and challenge in job 5 • 29
Warmth Friendliness within the work group and the organization 5 .33
Support Perceived helpfulness & back- ing received from superiors, peers, and subordinates 5 .37
Standards Perceived importance of organizational goals & performance standards 6 .21
Conf1ict Emphasis on working through rather than avoiding conflicts k .19
Identi ty Feeling of belonging to the organization & the work group k .h3

178,
These dimensions are tapped by 50 items, rated on a '»-point Likert scale from "Definitely Agree" to "Definitely Disagree". To the extent that the pattern of organizational climate scores matches the need structure of organization members, employees will experience a relatively high product of motive strength, expectancy, and incentive, and will therefore be highly motivated to perform. The Li twin and Stringer model thus relates perfor- mance to the degree of fit between personal need structure and organiza- tional climate. To the extent that all organizational members possess all needs, an emphasis on achievement rather than power or affiliation should result in greater productivity.
In a study of the effects of leadership style on perceived climate, Litwin and Stringer manipulated leadership behaviors in three simulated organiza- tions of 15 members, matched for age, experience, and initial need levels on the three Atkinson motives. The three leaders were to establish organi- zational norms to arouse, respectively, motives for power, affiliation, and achievement. The power oriented leader emphasized formal procedures, rule- following, order, and following formal communications channels. The affiliation oriented leader emphasized informality, warmth, noncontingent reward, no punishment, high cooperation, and conflict avoidance. The achievement group leader emphasized informal procedures, but high performance standards, individual performance-contingent rewards, risk-taking, involve- ment, and acceptance of task-related conflict. The results showed the power oriented organization rated higher than the others on the Structure and Con- flict climate scales; the affiliation oriented group higher on the Reward and Warmth scales; and the achievement oriented group higher in Responsibility and Risk. All six of these scales produced significant (p < .05) differences among the three firms. Members of the power oriented firm were less satis- fied and less innovative in their performance than the members of the other two groups, and the achievement oriented group members displayed greater productivi ty.
Litwin and Stringer also present two organizational case studies in which climate scores are related to performance and satisfaction indices. First, in the service office of a public utility company a combination of high worker need for achievement, and low company climate in the Responsibility, Risk, Identity, and Warmth dimensions was related to high turnover and expressed dissatisfaction. In the second study, differences on the Responsi- bility, Risk, Reward, Warmth, and Identity climate scales between two otherwise similar production plants were related to performance standing relative to competing firms. The performance data for these "studies" are qualitative and subjective and the results should be accepted cautiously. The simulation study, while providing supporting quantitative results, has limited general izabi1ity without some impressive inferential leaps.
The Litwin and Stringer scales, like those of the Survey of Organizations, are highly intercorrelated (scale intercorrelations range from .18 to .69 for the nine scales) and scales are not terribly homogeneous (the highest

179.
scale mean item intercorrelat ion is .49 for four Identity items). The Struc- ture, Risk, Standards, and Conflict scales appear to be relatively independent, while some commonality seems to run through the Responsibility, Reward, Warmth, Support, and Identity dimensions.
In spite of these imperfect scaling properties, the Litwln and Stringer climate scales represent an attempt to measure a priori dimensions of the environment and to relate them to an existing theory of behavior in organizations. Such attempts are worthwhile and will provide more immediately useful information relevant to the theory in question than will an ad hoc, shotgun empiricist approach to climate exploration. The favorable results of the simulation and case studies at least warrant a further, more rigorous testing of the instru- ment, possibly leading to new scale refinements.
House and Rizzo
House and Rizzo (1972a, 1972b) generated and tested a hypothetical model of the relationship among various environmental features of a manufacturing organization, its effectiveness, and the satisfaction and perceived stress felt by its members. All data were derived from questionnaire responses by 200 salaried employees of the organization. House and Rizzo's original set of measures consisted of a 19~scale Organizational Climate Questionnaire (see Table 16), plus scales measuring Role Conflict and Role Ambiguity (Rizzo, House, 6 Lirtzman, 1970), ratings of job induced anxiety, reports of the
TABLE 16 OCQ THEORETICAL SCALES
Number Sea les of i terns Reliabilitya
1 . Conflict and inconsistency 6 .86
2. Decision timeliness 5 .73
3- Emphasis on analytical decision methods 3 .61
k. Emphasis on employee skill development k • 75
5- Formal ization 8 .83
6. Goal consensus and clarity 2 .V*
7. Communications adequacy 7 .78

i80.
TABLE 16 (Cont.)
8. Information distortion and suppression 3 .61
9. Job pressure 2 .28
10. Adequacy of planning 5 .81
11. Smoothness of horizontal communication 6 .79
12. Selection on ability and performance 8 .80
13- Tolerance of error l» • 71
14. Top management receptiveness to ideas 2 .58
15. Upward information demands 3 .Ik
16. Adherence to chain of command 3 M
17. Work flow coordination 3 .6k
18. Adaptability to change k .48
19. Adequacy of authority k • 73
Note.-Taken from House and Rizzo, 1972a.
a. Kuder-Richardson reliabilities.
likelihood of leaving the organization, and satisfaction with job, pay, pro- motion, autonomy, security, recognition, and social aspects. The climate measure consisted of 82 descriptive statements rated for their applicability to the organization on a 7~point Likert scale. Responses to all these measures were factor analyzed (House £ Rizzo, 1972b), producing seven factors of organizational practices, and their effects. While all these factors reflect perceptions of the work environment, the Anxiety, Propensity to Leave, and perhaps the Satisfaction dimensions are more clearly the perceived results of other environmental characteristics, and hence are treated as dependent variables. Formal ization and Supportiveness are viewed as independent variables, and Role Perceptions are interpreted as mediating the effects of Formalization and Support on the dependent variables. The role of "Perceived Effectiveness" is less clear. House and Rizzo treat it as a fourth dependent variable class, but it could well be treated as a causal variable. Its content involves subjects such as secretive handling of information, quality

18)
TABLE 17 FACTOR SCALES OF ORGANIZATIONAL PRACTICES AND OUTCOMES
Number Factors High Loading Scales of i terns Reliabilitya
Role Perceptions Role Conf1ict 8 .82
Role Ambigui ty 6 .78
Formal izat ion Initiating Structure 6 .65 Pract ices
Formali zat ion 8 .82
Planning Adequacy0 5 .79
Horizontal Communications0 6 .82
Selection on Ability0 8 .87
Adherence to Chain of Command 3 .65
Supportive Supervisory Supportiveness 9 .85 Leadership Practices Emphasis on Employee Development0 k .82
Tolerance of Error0 k .70
Perceived Decision Timeliness0 5 .79 Organizational Effectiveness Information Distribution 6
Suppression 3 .58
Work Flow Coordination 3 .75
Adaptability to Change k .59
Sati sfaction Advancement Opportunity 3 .83
Autonomy 3 .82
Intrinsic Job Satisfaction 3 .92

182.
TABLE 17 (Cont.)
Sat isfaction (Cont.)
Securi ty
Pay
2
5
• 70
.86
Recogni t ion k .85
Social Environment 5 .78
Adequacy of Authority k •73
Anxiety-Stress Job Induced 7 .83
Somatic Tension 5 .76
General Fatigue 5 .72
Propensi ty to Leave
Likelihood of Leaving 2 --
Note.-Taken from House and Rizzo, 1972b.
a. Kuder-Richardson reliabilities.
b. Developed from Leadership Behavior Description Questionnaire items (Stogdill, 1965).
c. From Organization Climate Questionnaire.
and quantity t ially ri sky described by relates to t good rather Effect ivenes three depend tions, howev variables, a
of feedback, openness to change, and willingness to make poten- decisions. This is very similar to an empirical climate scale Campbell and Beaty (1971) as Openness vs. Defensiveness, which
he "degree to which people try to cover their mistakes and look than communicate freely and cooperate". As such, "Perceived s" could also be expected to have an effect on the remaining ent variables, mediated by role conflict and ambiguity. No correla- er, are reported between effectiveness and the other dependent nd this interpretation can only be considered as an hypothesis.
House and Rizzo found no important relationships between either independent dimension and anxiety, and only low correlations with propensity to leave. For both sets of independent variables, fairly high relationships (median corre- lations in the upper .30's or lower .40's) were obtained with perceived

183.
effectiveness, and moderate correlations (medians in the upper .20's) were found for satisfaction ratings. These median values are significant at the .01 level or better. The independent variables and the Role Perceptions dimension correlate about equally with perceived effectiveness, but Role Ambiguity correlated much higher with the satisfaction measures than did the other variables.
In sum, House and Rizzo found first that measures of organizational formal i- zation and supportiveness correlate fairly highly with similar measures of perceived effectiveness, and that some of this correlation was due to the clarity of role perceptions. Second, they found that role clarity correlates much more highly with employee satisfaction than do organizational or super- visory practices. Finally, they found that none of the variables measured relate very highly to the slightly more behaviorally anchored criteria of perceived physical stress and likelihood of leaving the organization.
Campbel1
In a review of the literature related to organizational climate, Campbell, Dunnette, Lawler, and Weick (1970) cite four dimensions of climate that appear consistently across studies: Structure imposed on the work, individual autonomy and accountability, reward levels, and consideration, warmth, or supportiveness. In an attempt to broaden the range of environmental factors to be assessed, Campbell and his associates used an a priori "model" of climate containing 21 dimensions to generate 110 Likert type items, 5 items per dimen- sion (Campbell & Beaty, 1971). Using these items, 300 employees in an industrial plant described both their immediate work group and the total organization and the responses were cluster analyzed, producing 10 dimensions of perceived organizational environment, and 13 work group dimensions. Raw cluster scale scores and supervisor-subordinate discrepancy scores for each work group were correlated with ratings of work group and supervisor
FIGURE 7 DEFINITIONS OF CLUSTERS DERIVED BY THE WARD AND HOOK HIERARCHICAL CLUSTER ANALYSIS PROCEDURE FOR THE DESCRIPTION OF THE TOTAL ORGANIZATION CLIMATE
1. Task Structure. The degree to which the methods used to accompl ish tasks are spelled out by the organization.
2. Reward/Performance Relationship. Reflects the degree to which the grant- ing of additional rewards such as promotions and salary increases are based on performance and merit rather than other considerations such as seniority, favoritism, etc.
3. Decision Centralization. The extent to which decision making is reserved for top management.
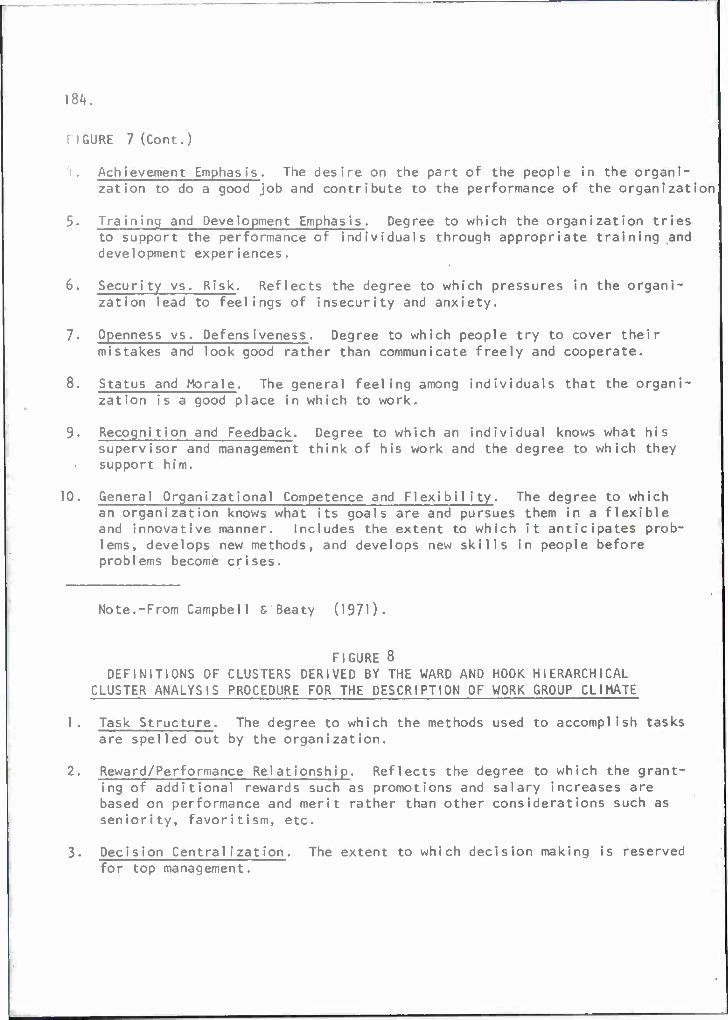
184.
FIGURE 7 (Cont.)
i. Achievement Emphasis. The desire on the part of the people in the organi- zation to do a good job and contribute to the performance of the organization
5. Training and Development Emphasis. Degree to which the organization tries to support the performance of individuals through appropriate training and development experiences.
6. Security vs. Risk. Reflects the degree to which pressures in the organi- zation lead to feelings of insecurity and anxiety.
7. Openness vs. Defensiveness. Degree to which people try to cover their mistakes and look good rather than communicate freely and cooperate.
8. Status and Morale. The general feeling among individuals that the organi- zation is a good place in which to work.
9. Recognition and Feedback. Degree to which an individual knows what his supervisor and management think of his work and the degree to which they support him.
10. General Organizational Competence and Flexibility. The degree to which an organization knows what its goals are and pursues them in a flexible and innovative manner. Includes the extent to which it anticipates prob- lems, develops new methods, and develops new skills in people before problems become crises.
Note.-From Campbell & Beaty (1971).
FIGURE 8 DEFINITIONS OF CLUSTERS DERIVED BY THE WARD AND HOOK HIERARCHICAL
CLUSTER ANALYSIS PROCEDURE FOR THE DESCRIPTION OF WORK GROUP CLIMATE
1. Task Structure. The degree to which the methods used to accomplish tasks are spelled out by the organization.
2. Reward/Performance Relationship. Reflects the degree to which the grant- ing of additional rewards such as promotions and salary increases are based on performance and merit rather than other considerations such as seniority, favoritism, etc.
3. Decision Centralization. The extent to which decision making is reserved for top management.

185.
FIGURE 8 (Cont.)
k. Achievement Emphasis. The desire on the part of the people in the organi- zation to do a good job and contribute to the performance of the organization.
5. Training and Development Emphasis. Degree to which the organization tries to support the performance of individuals through appropriate training and development experiences.
6. Security vs. Risk. Reflects the degree to which pressures in the organi- zation lead to feelings of insecurity and anxiety.
7. Openness vs. Defensiveness. Degree to which people try to cover their mistakes and look good rather than communicate freely and cooperate.
8. Work Group Reputation. Reflects the status and reputation of the individual 's work group as compared to other work groups.
9. Satisfaction and Morale. Reflects the general level of morale in the group.
10. Support iveness. Degree to which the supervisory and other group members generate a supportive and friendly atmosphere.
11. Initial Job Orientation. Degree to which individuals are informed as to, what to expect when they first start on the job.
12. Problem Solving Ability. Extent to which the work group can anticipate and solve problems related to group functioning.
13. Concern for Excellence. Degree to which the group is concerned with improving individual performance and being flexible, innovative, and competent.
Note.-From Campbell S Beaty (1971).
performance. The results indicate that raw and discrepancy scores on Achieve- ment Emphasis, Security vs. Risk, Training Emphasis, Supportiveness, and Status or Reputation are significantly related (r's ranging from .35".50) to performance ratings. The relationships are somewhat stronger for work group than for plant climate descriptions, especially in the case of discrepancy scores.

186.
Hackman and Lawler
Hackman and Lawler (1970 investigated the relationships among four job characteristics, employee satisfaction, and employee desires for achieve- ment, autonomy, growth, responsibility, variety and involvement in their work. The job characteristics were Variety, Autonomy, Task Identity, or ability to identify with the finished product, and Feedback. These were measured by Turner and Lawrence's (1965) Requisite Task Attribute Index. Hackman and Lawler found that self-ratings of motivation, satisfaction and involvement were significantly correlated with all four job dimensions, although correlations with Task Identity were fairly low (<_ .20). Super- visors' ratings of worker effectiveness correlated .20 and .26 respectively with perceived Variety and Autonomy of the work. Absenteeism correlated -.22 with Task Identity. Hackman and Lawler tested a person-environment fit hypothesis by computing correlations between the k job dimensions and the k dependent variables separately for employees with very high and with very low desires for higher-order need satisfaction. They found that employees in the top third of the need-strength distribution had higher correlations between job attitude (motivation, satisfaction, and involve- ment) and two job dimensions (Variety and Autonomy) but this was not true for actual performance or absenteeism. Task Identity and Feedback correla- tions with dependent variables were not moderated by need strength.
Summary and Conclusions
/ In light of all this research, what can be said about organizational climate? First, multivariate analyses of various climate instruments have consistently indicated the importance of a number of dimensions of perceived environments. These are listed in Figure 9, along with the studies and empirical dimensions supporting them.
FIGURE 9 CONSISTENTLY APPEARING CLIMATE DIMENSIONS
I. Autonomy: 1) Litwin 6 Stringer (1968) Responsibility 2) Halpin & Croft (1962) (inverse of) Hindrance 3) Schneider & Bartlett (1968) Agent Autonomy h) Hackman & Lawler (1971) Autonomy
I I. Structure: 1) Stern (1970) OCI Orderliness 2) Payne & Pheysey (1970 B0CI Routine scales 3) Litwin & Stringer (1968) Structure k) Halpin & Croft (1962) Production Emphasis 5) Schneider & Bartlett (1968) Managerial Structure 6) House & Rizzo (1972b) Formalization 7) Campbell & Beaty (1970 Structure

187.
FIGURE 9 (Cont.)
III. Reward Orientation: 1) Li twin S Stringer (1968) Reward 2) Schneider & Bartlett (1968) General Satisfaction 3) Campbell & Beaty (1971) Reward Performance Relationship k) Taylor & Bowers (1972) Motivational Conditions
IV. Consideration and Support: 1) Stern (1970) OCI Supportiveness-Personal Dignity 2) Payne 6 Pheysey (1971) BOCI Authority & Personal Relations
seal es
3) Taylor & Bowers (1972) Human Resources Primacy k) Litwin 6 Stringer (1968) Support and Warmth 5) Halpin 6 Croft (1962) Consideration and Intimacy 6) Schneider 6 Bartlett (1968) Managerial Support 7) House 6 Rizzo (1972b) Supportive Practices 8) Campbell 6 Beaty (1971) Supportiveness
V. Cooperation vs. Conflict: 1) Payne 6 Pheysey (1971) BOCI Conflict vs. Cohesiveness 2) Litwin & Stringer (1968) Conflict 3) Schneider & Bartlett (1968) Intraagency Conflict
VI. Intelligence and Ability: 1) Stern (1970) OCI Intellectual Orientation; Organizational
Effectiveness 2) Payne 6 Pheysey (1971) BOCI Progressiveness factor 3) Taylor & Bowers (1972) Technological Readiness k) Campbell & Beaty (1971) Competence and Ability
VII. Achievement Emphasis: 1) Stern (1970) OCI Achievement Standards 2) Litwin 6 Stringer (1968) Standards 3) Campbell 6 Beaty (1971) Achievement Emphasis
VIII. Openness vs. Defensiveness 1) Taylor 6 Bowers (1972) Communications Flow 2) House & Rizzo (1972b) Effectiveness and Role Perceptions
I neons istency 3) Campbell & Beaty (1970 Openness vs. Defensiveness
IX. Risk Taking 1) Litwin & Stringer (1968) Risk 2) Campbell & Beaty (1970 Security vs. Risk
X. Participation vs. Decision Centralization 1) Taylor 6 Bowers (1972) Decision Making Practices and Lower
Level Influence 2) Campbell & Beaty (1970 Decision Centralization

*l
188.
FIGURE 9 (Cont.)
XI. Training Emphasis 1) Schneider 6 Bartlett (1968) New Agent Concern 2) Campbell 6 Beaty (1971) Training Emphasis
There are certain weaknesses inherent in this summation. First, the Litwin and Stringer (1968) scales were generated a priori to assess variables rele- vant to Atkinson's need theory. While they presented some support for the theory, and were able to discriminate among simulated firms with different motive orientations, it is not clear that some dimensional analysis would not produce a considerably different substantive structure than the nine- dimension a priori configuration. This, however, may not present much of a problem, since, with the exception of one empirical dimension (Risk taking), at least two empirical scales have provided some support for each factor listed. The Campbell scales especially presented respondents with a large number of items generated from a large number of a priori dimensions but allowed the cluster analysis to reproduce more faithfully the complex of factors actually underlying employee perceptions of the work organization.
A more basic weakness lies in the almost exclusive use of perceptual climate data, and a heavy reliance on summated rating (Likert-type) scales. Stern's arid Payne and Pheysey's true-false scales provide cross method validity for some empirical dimensions, and Pervin's (1967) finding of semantic differen- tial factors similar to other educational climate dimensions further allevi- ates fears of a method related climate structure. Pugh, Hickson, Hinings, 6 Turner (1968) provide the only available multivariate analysis of an objec- tive measure of climate-related variables. Their factor analysis of five indices of organizational structural variables produced four factors; two of which, Structuring of Activities and Concentration of Authority, appear similar to two of the empirically derived perceived dimensions (Structure and Decision Centralization). As reported earlier, however, Payne and Pheysey's (1971) BOCI was unable to differentiate between two firms (a small unstructured firm and a large highly structured firm) selected for their differences on these objective structural dimensions. Thus, little support is provided for a convergence of results from the two data collection methods
In general, however, the relationship between perceptual and objective measures of the organizational environment is unexplored, and little is known of how the latter impinge on actual behavior in organizations.
What relationships between climate and other variables have been explored, and what results have been obtained? Relationships between climate and measures of satisfaction (including absenteeism and turnover), productivity, and work quality have been tested. Significant positive correlations have consistently been reported between various climate dimensions and reported

189.
satisfaction. Unfortunately, due to the diversity of climate dimensions employed, and due to a tendency to employ global climate indices (summed over scales), it is difficult to assess reliably the contributions of specific dimensions to satisfaction. Friedlander and Margulies (1969) found high correlations between satisfaction and Halpin and Croft's dimen- sions of Esprit (morale), negative Hindrance (focus on details, which we have included in Autonomy), and Thrust (group motivation through leader example). Significant correlations of climate with satisfaction (.30's) are reported by Hackman and Lawler (1971) for Task Variety, Autonomy, and Feedback, and moderate (.20's) relationships were found for Task Identity (ability to identify a piece of work as one's own) and Social Relationships. House and Rizzo (1972b) report moderate correlations between satisfaction and Supportiveness and Formalization (Structure), (median r's .23, and .25 respectively). Pritchard and Karasick (1973) employing some of Campbell's a priori cl imate dimensions found 10 of 11 scales significantly correlated with individual satisfaction ratings, notably: Reward level (r ■ .66), Achievement Emphasis (r = .65), Supportiveness (r * .52), Social Relations (r ■ .51), and Reward-performance contingency (r = .50). Autonomy, Social Relationships, and Supportiveness seem to recur as dimensions relevant to satisfaction, although, again, only two studies (Campbell S Beaty, 1971; Pritchard 6 Karasick, 1973) even tested for a Rewards-Satisfaction relation. Hackman and Lawler (1971) did, and Pritchard and Karasick (1973) did not find needs interacting with climate to influence satisfaction.
Performance-climate relationships are more tenuous. Taylor and Bowers (1972) found negative relationships between their global climate index and production costs, but no climate relationship for product quality. Friedlander and Greenberg (1970 report positive correlations between Supportiveness and supervisor ratings of employee ability and performance, but supervisors' ratings are probably confounded with supervisors' supportive- ness, and no objective performance criteria were included in the analysis. Hackman and Lawler (1971) obtained correlations of .20 and .26 respectively between supervisor ratings of performance and Task Variety and Autonomy. Pritchard and Karasick (1973) found low correlations (.25) between individual workers' performance ratings and Achievement Emphasis and Reward Level, but the performance ratings were made by two "expert management consultants" from outside the firm, and involved only 19 workers. Neither Hackman and Lawler nor Pritchard and Karasick found a need strength-climate interaction for performance, implying that the person-environment fit model was not operating in these data. Campbell and Beaty (1971) found that employee ratings of Decision Delegation vs. Centralization, Openness vs. Defensiveness, and Recognition and Feedback correlated positively with rated work group performance. Employee perceptions of Work Group Reputation correlated nega- tively wi th performance. Supervisors' ratings of Achievement Emphasis, Security vs. Risk, Openness, Organizational Morale, Recognition, Training Emphasis and Supportiveness correlated positively with work group performance rat ings.

190.
Finally, in a laboratory experiment using simulated organizations, Litwin and Stringer (1968) found that leader behaviors producing a press for achievement resulted in greater productivity and innovation than did press for power or affiliation. Another laboratory experiment which tried to study the effects of climate on individual performance is reported in elabo- rate detail by Frederiksen, Jensen, Beaton, and Bloxom (1972). Middle managers employed by the State of California worked through an ln-basket test designed to simulate the job of the field service division of the Department of Commerce. Four treatment combinations designed to create differences in climate were arranged in a 2 by 2 design. One treatment dichotomy had to do with the general prevalence of "rules and regulations". Half the subjects were informed via instructions and ln-basket materials that the Department of Commerce encouraged new ideas, innovation, and crea- tive problem solving. They were told that rules existed but that they could be broken if they got in the way. The other half were told that a very sub- stantial set of rules and regulations had been built up over the years and had proved very valuable and that they were not to be violated except under extreme circumstances. The second treatment factor was concerned with the closeness of supervision, and the subjects were told either that the organi- zation preferred a subordinates' work to be closely monitored or that sub- ordinates should be allowed to work out details for themselves.
The ln-basket can be scored on a large number of indices (e.g., explains action to peers, postpones decision, involves subordinates, and takes final action). Sixty of these initial scores were reduced to a small number of first-order factors, and a major dependent variable in this particular study was a second-order factor labeled "productivity", or the sheer amount of work accomplished. The subjects also provided a large amount of test and bio- graphical data which served as 21 different predictor variables. In general, it was found that predictability was higher under the innovative climate.
Frederiksen also found that performance was more predictable for subjects who worked in a consistent climate (innovation + loose supervision or rules + close supervision) than for those who had to operate in an inconsistent environment (innovation + close supervision or rules + loose supervision).
In further analyses it was demonstrated that inconsistent climates also have a negative effect on productivity. Specifically, those subjects who were placed in a climate that encouraged innovation and was at the same time characterized by detailed supervision worked at a substantially reduced level of output. Digging still deeper in the data, Frederiksen et al. were able to show that subjects employed different work methods under different climate conditions. For example, in the ln-basket under the climate conditions permitting more freedom, administrators dealt more directly with peers, while in the restrictive climates, they tended to work through more formal channels.
Integration of all these results is stymied by a low correspondence among both the climate dimensions assessed, and the performance measures used. We are still not to the poiit where we can conclude that distinct facets of

191.
organizational climate can be reliably measured with significant discrimi- nate validity and measures of organizational climate add a large amount of explanatory variance over and above that provided by a general measure of job satisfaction. However, the current scene is promising enough to recommend that research continue. There appears to be a growing convergence relative to taxonomies of climate facets. The individual/environment fit hypotheses remains intriguing; and both the correlational field study by Campbell and Beaty (1970 and the laboratory studies of Litwin and Stringer (1968) and Frederiksen et al. (1972) suggest that organizational climate may yet prove to be an intervening variable that can be used to explain certain aspects of organizational performance and effectiveness.

192.
VII. ORGANIZATIONAL STRUCTURE
Properties of an organization pertaining to its structure constitute the second major class of variables that we have chosen tentatively to label as one of the "givens". The literature surrounding organizational structure is also huge and we do not intend to deal with all of it. Again, however, our goal is to be exhaustive in terms of what's known about the relationship of structure to effectiveness.
Structural vs. Structuring vs. Climate Characteristics
Much of the existing literature on organizational structure deals with the organizational attributes specified by Weber (19^7) as defining bureaucracy. For example, Hall (1962) investigates such organizational properties as specialization, centralization, standardization, and formalization. However, these properties are measured through the perceptions of organizational mem- bers and thus can perhaps be thought of as aspects of an organization's climate, rather than its structure. While Hall's work clearly conforms to our definition of climate assessment, other organizational investigators have mixed a concern for organizational climate with a concern for the actual structure of the organization and referred to the whole thing as "structure". It's a bit confusing at times to distinguish between these two possible uses of the terms organizational structure. We offer the alternative terms of "structuring" and "structural" characteristics of an organization.
"Structuring" refers to those behaviors or activities occurring within an organization which restrict the range of behaviors open to role incumbents. Examples of organizational structuring are the degree to which decision making is centralized or dispersed in the organization, or the degree to which members' behavior is prescribed by a set of formal or informal standards or procedures.
Contrasted with these structuring behaviors within the organization are its "structural" qualities--the physical characteristics of the organization— (e.g., its size, shape, number of management levels, etc.) which define the context within which role behavior occurs, and which might influence the nature of this behavior.
Most investigators and theorists assume that structural factors strongly influence climate, and interact with the nature of the organizational tasks, technology, environment, etc., to affect performance.
The major differences between investigations of structuring and those of climate are matters of focus rather than methodology. Climate investigators assess the characteristics of an organization or subunit, either through member perceptions or by other presumably more objective methods (e.g., Astin

193.
£ Holland, 1961), and then, typically, attempt to relate organizational characteristics to individual member behaviors. Thus, the typical "climate" approach typically regards the individual as the unit of analysis, and con- siders the organization to comprise the relevant environment within which to predict behavior.
Investigators of structuring likewise assess their dimensions through per- ceptions (e.g., Hall, 1962), "objective" measures (e.g., Pugh, Hickson, Hinings, MacDonald, Turner, & Lupton, 1963), or a combination of the two (e.g., Aiken & Hage, 1966, 1968; Hage & Aiken, 1967a). The typical struc- ture theorist is, however, a sociologist, rather than a psychologist, and the organization is the principal object of interest. Levels or patterns of structuring characteristics are used either singly, or in terms of inter- action with the organization's goals, historical background, structural configuration, etc., to predict total organizational performance.
Few studies have been made contrasting structural and climate measures (exceptions are Payne & Mansfield, 1973; Payne & Pheysey, 1971; Pheysey, Payne, & Pugh, 1971). On the other hand, a reasonable mass of literature exists relating structural to structuring variables.
It is not always easy to classify the variables of some researchers into our structural/structuring/climate framework, largely because the variables employed are often composites of both structural and perceived climate items. Nevertheless, we shall plow ahead and try to summarize what is known about the relationship of the two types of structure variables to organiza- tional effectiveness.
Interrelationships Among Structural and Climate Variables
To understand fully the effects of organization structure characteristics on effectiveness, it is first necessary to explicate the interrelationships among the different attributes themselves. The variables which have most frequently been studied under the label of organizational structure are listed and defined in Table 18, where they have been divided into our climate- structure (or structuring-structural) categories.
Not all these variables have been tested for interrelationships with all others and some pairs that have been tested have produced quite inconsistent results, over different studies, organizational settings, and operationali- zations. Thus, for example, three researchers have investigated the corre- lation between organization size and the proportion of employees who are support personnel (e.g., staff, clerical, or administrative) rather than work flow personnel. Of the three correlations, one was significantly positive, one negative, and one zero. In this section we shall report on those rela- tionships which have appeared to be reasonably consistent over at least two studies.

)3k.
One set of highly interrelated organizational variables comes from the work of Pugh, Payne, and others in the Aston series of studies. Investigations in five different samples of organizationa (Child, 1972b; Hinings & Lee, 1971; Payne & Mansfield, 1973; Pugh, Hickson, Hinings & Turner, 1968, 1969) have strongly indicated high positive correlations among the variables organi zation size, total number of different specialties, vertical span, formal i- zation,and standardization. Pugh et al. (1968, 1969) found that the highly intercorrelated measures of specialization, vertical span, formaliza- tion, and standardization formed a single principal components factor which correlated strongly with organization size.
TABLE 18 VARIABLES OF ORGANIZATIONAL STRUCTURE
Structural Variables Defi ni t ion
1. Number of specialties Number of different occupational titles or different functional activities pursued within an organization.
2. Size
3. Vertical span
Number of organization members.
Organizational height; number of hierarchical levels.
4. Hierarchical level Level of respondent in organization hierarchy.
5. Span of control
6. Shape (tall vs. flat)
Number of subordinates supervised by a single superior. Variously operation- al ized as number of direct subordinates, total number of hierarchical subordinates, or total number of members divided by total number of supervisory personnel.
Concurrent consideration of vertical span and width of organization at its base. Tall organizations, regardless of total size, have many levels relative to the width of their bases.
7- Line vs. Staff membership a) Line staff identification of respondent.
b) Proportion of organization members who are staff (supportive, administrative, clerical) vs.- line (direct production, or production supervisory) personnel.

TABLE 18 (Cont.)
195.
Structuring Variables
1. Formalization
2. Standardization
Decision centralization vs. participativeness
Impersonali ty
5. Routineness of work
6. Professlonalization
Definition
Either ratings of the degree to which appropriate behavior is prescribed in writing, or an actual count of the number of rules existing in similar organizations. No studies are available giving correlations between these two operationalizations.
Degree to which member behavior is prescribed or otherwise limited, either formally or informally.
Degree to which decisions are made by persons at the top of the organization hierarchy vs. participation by all members in decision making.
Degree to which organization members are "objectified" or treated as mechani- cal role occupants, rather than as ind ividuals.
Degree of repetitiveness or "sameness" vs. variety perceived in one's work.
A complex variable, variously measured by amount of training, and identification with an independent professional body, and implying both expert knowledge or ability, and internalization of ethical norms.
Hinings and Lee (1971), Child (1972b), and Payne and Mansfield (1973) all report strong positive interrelationships among these Aston measures and a negative correlation between decision centralization and specialization, and a negative correlation between centralization and size. In addition, Hinings and Lee (1971) and Child (1972b) found negative correlations between reported centralization and formalization, and between centralization and standardization. Child suggests that Pugh et al.'s (1968) failure to obtain the latter two correlations was an artifact of his sample of organizations. Pugh et al.'s sample included a large proportion of subsidiary factories in which the plant manager, while possessing considerable authority within his own unit, nevertheless was fairly low in the total organizational hierarchy.

196.
Pugh et al. described such managers as overseeing a total organization rather than a "workflow subunit". Child contends that this artificially inflated the centralization scores for these subsidiary organizations, masking the correlations with standardization and formalization. Child's (1972b) sample included no branch organizations, and Hinings and Lee's (1971) organizations were all subsidiaries, and thus this factor of depend- ency was not varying to confound the relationship of centralization to other structure factors. At this point, it seems reasonable to conclude that centralization correlates negatively with specialization, standardization and formal ization, with the cluster representing a bipolar set of alterna- tive control strategies. Organization members can be controlled either by restricting decision making power to a few central administrators, or by standardizing behavior, formally or informally, and permitting individuals to exercise discretion within the limits set by standard policy. Speciali- zation and size imply a complexity exceeding the capacity of the centralized decision maker, and hence require decentralization. On the other hand, formalized or informal standards are likely to be used in restricting dis- cretion in large or highly specialized organizations.
Many of these findings have been duplicated by other investigators, using different measures in organizations differing from the Aston group's primar- ily Industrial business firms.
Hall, Haas, and Johnson (1967) investigated the relationship of size to various structure variables in 75 divergent organizations, and found size related to specialization, formal ization, and vertical span. Anderson and Warkov (1961) in a study of kS Veterans Administration hospitals found size related to "complexity", a dichotomized measure of the number of functions performed by the hospitals. Blau, Heydebrand, and Stauffer (1966) found the size of 156 public personnel agencies related to the number of organiza- tional specialties, but Blau et al. found no relationships between size and centralization. The Aston investigators have consistently found strong negative correlations here.
Samuel and Mannheim (1970) found size related to formalization, but not to specialization. Samuel and Manheim's specialization measure was confounded with required training, or professional ization and perhaps this partially explains their failure to find a relationship with size.
Other studies offer little clarification of the relation between centraliza- tion and the other variables studied by the Aston investigators. Contrary to the Aston group's consistent report of negative correlations between centralization and specialization, Hage and Aiken (1967a) found no_ relation- ship between these two variables. Where Aston investigators have found zero or negative relationships between standardization and centralization, Hall (1963) reports a positive correlation. Similarly, Hall (1963) found centrali- zation positively related to his measure of specialization, again in contrast to Aston's negative or zero findings. Hall, however, does provide some

197.
support for a positive correlation between standardization and specializa- tion, and between specialization and formalization.
All of Hall's measures are derived from ratings by organizational members. Although the relationship between such perceptual (pi imate) measures and their more objective alternatives has not yet been systematically explored, perhaps an indication of the differences between the two methods will arise from comparing Hall's specialization and formalization rating scales with similar scales derived from organizational records by the Aston investigators, Hall's specialization ratings and various objective measures of specializa- tion were both compared with three other variables, rated formalization, centralization, and standardization. Both perceived and objective speciali- zation correlated positively with standardization and zero with formalization, Objective specialization correlated primarily negatively with centralization, while Hall's rated specialization correlated positively with centralization. Rated and objective formalization were tested for relationships with four common variables: number of specialties, centralization, standardization, and routineness of work. None of the resulting pairs of correlations were in the same direction, all four changing from positive or negative to zero in going from objective to perceptual measures.
A second cluster of interrelated structure variables has been supported by the research of a number of investigators, but especially Hall (1962, 1963), Hage and Aiken (1967a, 1969), Child (1973), and Payne and Mansfield (1973). The variables in this cluster include the hierarchical level of the respond- ent, centralization, impersonality, and the routineness of work.
Both Hall (1962) and Bonjean and Grimes (1970) found that hierarchical level correlated negatively with ratings of standardization, centralization, and impersonality within the organization. Payne and Mansfield (1973) also report negative correlations for hierarchical level with centralization and with impersonality. In a study by Blankenship and Miles (1968), higher level managers reported a greater tendency to consult with their own sub- ordinates in making decisions, indicating again, a negative correlation between centralization and organization level.
Hall (1963) found impersonality correlated positively with centralization. Similarly, both Hage and Aiken (1969) and Child (1973) report positive corre- lations between centralization and rated routineness. This cluster appears to have some substantive commonality, reflecting a perception of imperson- ality and routineness in situations where members are permitted little dis- cretion in a standardized organization with a centralized decision making process. Predictably, members in higher levels perceive fewer constraints on their behavior, and feel more personally involved in their work.
The third cluster of interrelated structure variables which emerges from the literature has less support. Two studies have indicated a negative correlation between the degree of professionalization of the work force, and the typical span of control of an organization or subunit. The major
198.
finding of Blau et al. (1966) was a strong positive relationship between the proportion of personnel in 156 public personnel agencies who were required to possess college degrees in specified areas, and the ratio of managers to nonsupervisory personnel. Blau et al. hypothesized that this reflects a need to facilitate communications between professionals and managers, and among professionals in different areas of specialization. The sequential filtering of communications across levels of a tall, narrow hierarchy permits the professional-scientist 's technical terminology to be translated into a language more meaningful to an administrator, and allows general administra- tive directives to be translated into specific technical recommendations for the professional. Presumably, the more esoteric the profession, the taller the hierarchy needed to mediate interactions with nonprofessionals, or with professionals in other fields.
Udell (1967) provides some support for such an hypothesis. He correlated supervisors' spans of controls with the experience and education levels of their subordinates, and found that subordinate experience correlated posi- tively, and education negatively with span of control. The correlation with experience suggests that knowledgeable employees need less supervision, but a different process appears to be at work in the case of education. One plausible explanation is Blau's hypothesis of the need for a narrow hierarchi- cal chain to mediate professionals' communications with the rest of the organizat ion.
In summary, three relatively independent clusters of interrelated structural and structuring variables have appeared in the organization literature to date.
First, extensive support exists for a strong positive relationship among specialization, size, vertical span, formalization, and standardization. This cluster appears to reflect a need for more impersonal control over member behavior as the organization grows larger, taller, and more function- ally complex. Decision centralization may be negatively related to the cluster, as an alternative control strategy in smaller, simpler organizations, but this relationship is less well supported.
Second, centralization, impersonality, and routineness are positively inter- related, and are all negatively related to the hierarchical level of the respondent. This cluster reflects a perception of routineness and lack of personal involvement among lower level members of highly centralized organi- zations, and a perception of increasing involvement and variation in work as one climbs the hierarchical ladder.
The third cluster is defined by a negative relationship between the degree of professionalization and span of control. It is hypothesized that highly professional employees require a long hierarchical chain of command to mediate communications with less specialized management personnel, and with other professionals in different fields. Non-professional employees typically enjoy larger control spans as they increase in competence.

199.
The Relationship of Structure to Organizational Effectiveness
Even though there is a large literature associated with organization struc- ture we should again point out that only a small percentage of it deals with the influence of elements of structure on effectiveness. It is a frustrating experience to attempt to separate this portion from the total. What we have done is to approach the topic from two different directions. First, we would like to discuss the major programmatic approaches. That is, the discussion will be focused around a group of researchers or theorists pursuing a particu- lar approach. Second, we would like to follow the original Porter and Lawler (1965) categorization and discuss some recent findings variable by variable.
Programmatic Approaches to Structure, Technology, and Effectiveness
The Aston Group
The program of organizational research being carried out by the Aston group in England (Aldrich, 1972; Child, 1972a, 1972b, 1973; Child S Mansfield, 1973; Hickson, Pugh, 6 Pheysey, 1969; Hinings & Lee, 1971; Inkson, Pugh, & Hickson, 1970; Payne 6 Mansfield, 1973; Payne £ Pheysey, 1971; Pheysey, Payne 6 Pugh, 1971; Pugh, Hickson, 6 Hinings, 1969; Pugh, Hickson, Hinings, MacDonald, Turner, 6 Lupton, 1963; Pugh, Hickson, Hinings, & Turner, 1968, 1969) is intended to investigate the effects of environmental and organiza- tional characteristics on performance at the individual, group, and organiza- tional levels. Their most significant contribution to date is an analysis of the dimensions underlying organizational structure, and the environmental contexts of organizations (Pugh, Hickson, Hinings, & Turner, 1968, 1969) -
Nearly all of the Aston structure scales were derived factor analytically and contain both structural and structuring data (Pugh, Hickson, Hinings, S Turner, I968). Even the centralization scale which after successive analyses emerges as purely a structuring dimension, uses only the perceptions of the top organization executive to estimate decision centralization. Considering the inter-level differences in climate perceptions found by Hall (1962) and Schneider and Bartlett (1970), the comparability of the Aston centralization measure with other perceptual indices of centralization is dubious.
As yet, published studies using the Aston measures have not reported a systematic investigation of relationships with effectiveness variables. Child (1973), however, does report some correlations between the Aston structure factors and several organizational outcomes for a group of high level executives in 78 British firms. He found a positive correlation between perceived intra-organizational conflict and the Aston "structuring of activities" dimension, which is a derjved factor score made up of the individual structuring components of specialization, standardization and formalization, and by the structural characteristic labeled vertical span

200.
(i.e., the number of hierarchical levels). Child also found a negative cor- relation between the Aston centralization factor (a structuring variable) and executives' attitudes toward innovation or nonconformity; and a negative relationship between perceived routineness (structuring) and perceived inno- vation and nonconformity.
Pheysey, Payne, and Pugh (1971) report some data indicating that contrary to expectations, the members of a highly structured and centralized firm had higher ratings on several satisfaction measures than did members of a less structured organization of the same size. The limited sample (N = 2 organizations) prevents a meaningful interpretation of this result, however, as other than a simple case study of limited generalizability.
Woodward vs. Aston
Woodward (1965) contends that technological factors largely determine which structural patterns will appear in an organization and strongly influence the attempt to classify manufacturing organizations on the basis of impor- tant technological differences. Woodward assessed technology in terms of 11 categories of production methods. Nine of these categories seemed to form a loose continuum ranging from custom crafting of individual pieces, to assembly of large custom pieces, to intermittent or batch production, to continuous or mass production of identical units, to intermittent and con- tinuous flow production of fluid or granular output. Woodward trichotomized this 9 category distribution into (a) unit and small batch systems, (b) large batch and mass systems, and (c) process systems. The two left- over categories consisted of combinations systems. One of them entailed a situation where parts were batch produced but then custom assembled, and the other was a situation where substances were process produced and then packaged or bottled by mass or batch techniques.
The outstanding feature of the 9~category continuum is the apparent increase in the technical complexity of production methods from unit to mass to pro- cess systems. The scale seemed to form a developmental sequence as well, since nearly all observed technical changes were in the direction of greater technical complexity (Woodward, 1965, p. ^7)•
In a study of 100 British firms, Woodward found that as the technical com- plexity of the operations performed on raw materials increased, certain structural characteristics varied in a predictable manner. Thus, as the complexity of operations increased from unit, to mass, to process production systems, the number of hierarchical levels and the ratio of white collar to blue collar workers increased, while the average span of control, and the ratio of line to staff workers decreased. The pattern is one of increasing specialization, and professionalization, and the finding of taller organizations with a smaller average span of control is consistent with Blau, Heydebrand, and Stauffer's (1966) data. Woodward also found

201
that some structural and climate factors were curviIinearly related to technical complexity. First level supervisors' span of control, emphasis on formal, written communications, and the degree of distinction maintained between "line" and "staff" functions were all higher for the middle range of complexity (Woodward's large batch and mass production firms) than for the extremes (unit and process firms). The ratio of skilled to unskilled workers, and the use of "organic" vs. "mechanistic" management practices (Burns S Stalker, 1961) are higher at the extremes of the distribution. Here the picture is one of highly skilled workers (either craftsmen or pro- fessionals) at the extremes, requiring little supervision, and unskilled workers in closely supervised highly structured jobs at the middle of the complexity distribution.
Significantly, no_ relationship appeared between level of technical complexity and organization size. This may be due to the extreme positive skewness of the distribution of Woodward's organizations on size (see Table 19) and is inconsistent with data reported by Hickson, Pugh, and Pheysey (1969).
TABLE 19 DISTRIBUTION OF ORGANIZATION SIZE IN ASTON AND WOODWARD SAMPLES
Sample
Size
100-250 250-500 500-2000 > 2000
No. * No. * No. * No. *
Aston 0 0 16 35* 16 35* \k 30*
Woodward 35 38* 22-25 25* 21-26 25* 9-11 12*
Range: Aston 250-25,000 Woodward 100-40,000
Woodward's most important finding was an apparent relationship between struc- ture and organizational effectiveness. Although technical complexity per se showed no systematic covariation with performance, it did, as we have seen, correlate with certain structural characteristics, and these structural fac- tors are related to performance for each level or category of complexity.

202.
Within each of the three complexity levels, firms rated as above average in success clustered around the median values on the structural variables, while less successful firms tended to score somewhat above or below the median. Thus highly successful unit and small batch firms had first line spans of control ranging from 20 to kO, while less successful firms had first level control spans of less than 20 or greater than kO. For large batch and mass firms, foremen in successful firms had kO to 60 immediate subordinates, while for less successful firms, the corresponding figures were, again, more extreme. Woodward reports similar trends for the number of hierarchical levels, for the proportional cost of labor, and for all the labor ratios (line to staff, white collar to blue collar, etc.).
Confidence in these results is tempered by Woodward's omission of actual data for any variables except first line span of control. Also, the "successful" and "unsuccessful" firms which are differentiated represent only about the top and bottom fifths of the performance distribution. The fit between structure and technology is able to distinguish very successful from very unsuccessful firms, but apparently is less efficient in separating either group from the middle 60% of the distribution. Perhaps we can pre- dict the degree of technology-structure match from performance data, but evidence is lacking that accurate predictions can be made in the opposite, more important direction.
This last conclusion is echoed by Child (1972a) who argues that technologi- cal factors set at most rather weak constraints on structure, and that the perceptions and preferences of important organizational decision makers will play a far more important role in determining an organization's structure than will technology.
Hickson, Pugh, and Pheysey (1969) using a different sample of firms, and slightly different operationalizations of structural variables from Woodward's, were unable to replicate her technology-structure correlations and thus cast doubt on the validity of her technology-structure-effectiveness relationships. The differences in the structural indices, and minor changes in the complexity measure used may account for Hickson et al.'s negative results, although such a lack of robustness is not promising for a pervasive effect of technology and structure on performance. Hickson et al. did find a sizable correlation (.k~l, p. <.0l) between technological complexity (Hickson et al. called it continuity of production) and organizational size, with larger firms more likely to employ continuous flow mass or process tech- nologies, rather than unit or batch systems with intermittent runs. Hickson et al., unfortunately, do not provide effectiveness data, so it is impos- sible to assess the effects, if any, of technology and structure on per- formance in their sample.
Per row
Perrow (1967) also attempted to relate technological variables to the amount and type of behavioral structuring occurring in an organization. He arranged

203;
technologies on a continuum from those typically encountering routine events to those facing unpredictable variations in the course of produc- tion. Routineness is determined largely by the stability and understand- ability of the raw materials used. This routineness dimension is hypothesized to be linearly and inversely related to the amount of structuring employed in an organization. Operationally, using Perrow's framework, one should tend to find centralized structural configurations, with large first level spans of control and a sharp split between line and staff at the routine end of the scale. At the nonroutine extreme of the distribution, a decentralized structure should prevail with highly skilled and relatively autonomous personnel. Also, a complex coordinating struc- ture should exist to facilitate communications between narrowly focused specialities. The primary difference between Woodward's and Perrow's con- figurations is that Woodward distinguishes between crafts and professions within the nonroutine category. These groups are not differentiated by the variables showing curvilinear relationships with Woodward's complexity scale. However, the number of hierarchical levels, average span of control, and ratio of workflow to nonworkflow personnel do separate unit from process technological systems, and hence pull apart two groups that are confounded by Perrow's model. The major strength of Perrow's framework is its ability to account for the structuring characteristics of service and other non-industrial organizations, though Perrow has yet to demonstrate the empirical validity of his model's predictions for any organizational samples.
Although Perrow reviews several studies, including Woodward's, whose data are compatible with his model, his arguments are not convincing in the domain of manufacturing organizations. Here, as we have seen, Woodward's model is able to discriminate more finely among alternative technologies.
Perrow's framework, like Woodward's model, proposes that organizational effectiveness is related to the degree of fit between technology and struc- ture. According to Perrow, structures inappropriate to technology produce "strong strains" in the organization which presumably impair performance. Perrow presents no data for organizations classified according to his frame- work, although he cites numerous studies whose results do not contradict his model. He does, however, admit the difficulty of operationalizing several of his constructs. In short, it very much remains to be seen whether Perrow's framework can offer even as much explanatory value as Woodward's at least operationalizable technological typology. Its ultimate worth can only be tested on an a priori investigation of several divergent real-life organizations.
Lawrence and Lorsch
Lawrence and Lorsch's (1967) environmental contingency theory is similar to Woodward's technology-structure model, save that the focus is

204.
on the subunit rather than on the total organization. The environmental contingency theory predicts a relationship between organizational effective- ness, and certain patterns among several other variables, including some measures of structure. However, it is again difficult to single out any simple relationships between specific structural or structuring variables and performance, given the complex nature of the constructs in the contin- gency model. Lawrence and Lorsch describe the influence of environmental factors on an organization from a natural systems viewpoint. They contend that since organizations are required to interact with a diversity of rela- tively independent agents in their environments, members' limited capacities for dealing effectively with more than a few such environmental entities require the organization to specialize or differentiate, so that each functional subunit can focus more effectively on its own relevant sub- environment. However, according to Lawrence and Lorsch, the structure and climate of the subunit are determined, at least to a degree, by the nature of its subenvironment, so that units facing different subenvironments will develop dissimilar structural and behavioral characteristics which may impede communication and coordination between these subunits.
Lawrence and Lorsch (1967) present evidence that organizational units facing subenvironments which differ in (a) the degree of uncertainty of information obtained from the environment, (b) the length of time required to provide feedback on the result of organizational behavior, and (c) the rate of change in the environment, have more difficulty coordinating their activities than do subunits facing similar environments. In general, the amount of differentiation requi red in a firm is a function of the differences in the orientations of the subenvironments with which the organization must deal. Thus for organizations which face complex environments (e.g., the clothing industry has a relatively stable production technology, but a fast- changing design market) a high degree of departmental differentiation is a prerequisite to success. The effectiveness of an organization is a joint function of 1) the match between environmental uncertainty and internal differentiation, and 2) the skill with which integrative departments coordi- nate the activities of the diverse subunits. Lawrence and Lorsch assess the degree of differentiation by the difference between subunit profiles over four attributes: structure; task vs. social orientation; short, medium, or long range time orientation; and primary goal orientation (production, distribution, information generation, etc.). The "structure" dimension includes both structural (span of control, number of hierarchical levels to a manager superordinate over both subunits) and structuring (rated specificity of performance review; importance of formal rules) variables. Task vs. social orientation is a purely structuring or climate measure, and the other two dimensions, time orientation and goal orientation, don't appear relevant to either structure or climate. The relationship between organizational structure and an index of subunit differences between patterns of scores over these variables is not obvious, and yet it makes intuitive sense that the amount of differentiation among organizational subunits should be related to the shape, size, and horizontal division of an organization.

205.
The exact nature of these relationships, and the effect of specific struc- tural factors on performance as mediated by differentiation are as yet unexplored.
Weick (1969) and Thompson (1967, Chapter 6) also propose that organiza- tional decentralization and unit autonomy are related to the degree of indeterminateness of the environment. Thompson, like Lawrence and Lorsch, invokes a concept of the degree of interdependence, or requisite integra- tion, between differentiated functional areas. The greater the interdepend- ence, the greater the need for coordination between the subunits, and hence the greater the pressure for an effective integrative function.
Child (1972a) points up two "weaknesses" of the environmental contingency theory of organization structure and performance. The first is that theorists such as Lawrence and Lorsch tend to emphasize the impact of the environment on structure to the exclusion of other factors, and that they tend to assume implicitly that the range of viable structures is relatively limited for a given environment. Child feels that while environmental factors may tend to favor a certain set of alternative structures, this set is sufficiently large that organizational decision makers will have a fair degree of latitude in setting organizational policy. Environmental con- straints on structure, while present, are presumed to be relatively weak.
Child also criticizes the failure of environmental theorists to differen- tiate between environmental factors, and the perception and interpretation of these factors by organizational decision makers.
It is Child's contention that organizational structure is determined by neither environment nor technology directly, but by decisions made by powerful organization members, based on their personal preferences for structure, and based on their perceptions and evaluations of the desires of powerful environmental elements. Child hypothesizes that structure per se has only a limited effect on performance, and that unless managers mistakenly perceive a stronger relationship than actually exists, organi- zation structure will be determined by preferences (e.g., a desire for greater personal control) or cost factors, rather than by environmental factors. In support of his hypotheses, Chi Id cites the occurrence of structurally divergent but otherwise similar organizations with no apparent performance differences.
It is possible, however, that fallible managerial perceptions are merely the mechanisms through which the environmental contingency model operates. It is important to note that Lawrence and Lorsch's (1967) data are based upon managers' ratings, not objective environmental measures. Thus, the relationships they report among environmental variables, structure factors, and performance dp_ reflect the perceptions and evaluations of organization decision makers, and Lawrence and Lorsch's results indicate that, at least within their sample of organizations, certain organizational characteristics

206.
(including some structure variables) are related to performance. If managers seek to maximize performance, they may be compelled to move, through trial and error, to match structure with environment in a manner consistent with the environmental contingency model. Within the Lawrence and Lorsch sample, differently structured organizations exhibited di f- ferent performance levels, and these differences were consistent with their model. Acceptance of the environmental contingency theory will depend on the ability of Lawrence and Lorsch, and other researchers, to replicate these initial results.
Project Management
Two alternatives to classical bureaucratic structure are project manage- ment and a related form, the matrix organization. In no sense do they view organization structure as an immutable given. Arising from the application of systems theory concepts to organizational control, project organization recognizes the high degree of interdependence of various organizational functions in developing and manufacturing complex products. Stewart (1965) lists at least three prerequisite conditions necessary to justify project organization. According to Stewart, when time constraints are stringent, when the project requires joint involvement from a variety of functional areas, or when the novelty of the project precludes falling back on traditional procedures for planning, development, and production, a classical hierarchical arrangement of roles will be inefficient in mediating conflicts among subunits. For such cases, several authors (Cleland, 1964; Kast 6 Rosenzweig, 1970; Stewart, 1965) have advocated organizing around the problem, rather than around functions. In its pure form, project organization involves a single project manager whose sole responsibility is to ensure project completion within time, quality, and cost specifications. Subordinate to the project manager is a project team, consisting of specialists from all functional areas involved in the project, formally assigned to the team for the duration of the project. This form offers several advantages over traditional organization. First, there is a single project manager responsible for the successful accom- plishment of project goals. His visibility and central ity facilitate project-relevant communications within the organization, and with outside contractors and consumers. Second, the assignment of personnel directly to the project encourages identification with the task, rather than with functional divisions within the organization, and thus motivates coopera- tion rather than competition among different specialties within a project. Third, the direct association of the various functional specialties involved in the project permits earlier perception and resolution of interfunctional conflicts, again facilitated by an orientation toward task accomplishment rather than departmental chauvinism.
It seems relatively obvious that a firm organized solely around transitory projects would lack the stability and continuity to coordinate activities

207.
over several concurrent and sequential projects. When project management is applied within the context of an existing functionally differentiated structure the combination is referred to as matrix organization. The functional division or department provides a common and ongoing base for the performance evaluation, training, coordination, and reassignment of division members. Much actual production activity is performed by rank and file workers under the direct supervision of the functional department manager, rather than the project manager. In a matrix organization, the project team, composed of members of all affected departments, develops fairly exact specifications for all product components, and sets deadlines for completing each stage. The functional department heads are responsible for meeting these production specifications but have complete freedom in selecting production methods. The degree of involvement of functional subunit personnel will vary depending on the nature of the project. A planning project requires little involvement from departmentally based rank and file workers, while a product development project would involve operatives as well as project team members.
Power and responsibility are shared in a matrix organization by the project manager and the functional manager, and to a large extent, the effective- ness of a project manager depends on his ability to interact successfully with a number of permanent functional managers who may resent and resist his authority. Cleland (1964) suggests that personal factors such as persuasive abilities may contribute more to a project manager's power than formal authority.
Stewart (.1965) discusses three common threats to successfully implementing project management. First, insufficiently specifying the rights, responsi- bilities, and authority of the project manager relative to the ongoing organization managers inhibits his ability to mediate effectively in con- flicts between departments. Project organization is most efficient in situations where task uncertainties require rapid decisions based on typically incomplete information. Ambiguities surrounding a project manager's decision-making authority undermine the support he requires from permanent functional managers. A second threat to project management is precisely this requirement of quick decisions based on relatively little information. Decision delays typically produce enormous production costs given the high degree of interdependence among subtasks and the expense of deadline overruns. Time, production cost, and product quality are the three major parameters of project performance and the project manager must be capable of making incisive and accurate decisions involving tradeoffs among these criteria. A third factor frequently contributing to a project's demise is related to the project manager's relatively ambiguous position in the organizational power structure. An inopportune intervention, or a lack of attention, by top management can undermine a project manager's tenuous authority, and hamper the project's performance.

208.
For purposes of general enlightenment a project or matrix organization could be contrasted with a more classically structured organization on most of the dimensions of structure and climate listed in previous tables. Some speculations about how the comparisons might turn out are as follow.
Given the level of problem complexity and unfami1iarity required before a project organization is justified, most project teams are composed of fairly high level white collar or professional people employed in diver- gent specialties. Although pure project organization is intended to pro- mote rapid communication among different disciplines without recourse to an extended hierarchical system, the stable functional differentiation of a matrix organization will probably prevent any reduction in the size of the administrative and clerical components of the organization. "Line" and "staff" roles in a matrix organization are shifted, with the cross- functional project team performing a horizontal task oriented or "line" function, and the vertically arranged functional divisions offering pri- marily supportive "staff" services. The impact of project organization on organization shape (tall vs. flat), typical span of control, and vertical span (number of hierarchical levels) is unclear, although again a matrix organization may be viewed as a traditional hierarchical structure with interdepartmental project teams superimposed.
Regarding structuring variables, we would expect professionalization to be higher, and formal ization, decision centralization, standardization, routineness, and probably impersonality to be lower in a project or matrix organization than in a classically structured organization. Low formali- zation, standardization, and routineness, and high professionalization are similar to the criteria specified by Stewart as indicating a need for a project oriented structure.
Regarding organizational climate, one might expect interesting differences between project oriented and traditionally organized firms in the dimen- sions of cooperation vs. conflict, and openness vs. defensiveness. We would expect greater interdivisional cooperation and openness within pro- jects, as team members focus on their common task rather than their com- petitive organizational positions. Alternatively, some conflict and defensiveness are expected between project managers and functional managers, since the latter still maintain a more competitive attitude, and will likely feel a need to protect their power domains from unwarranted inter- vention by the project manager.
On the basis of these structure and climate differences and from the assump- tions and projections of matrix management proponents, what benefits might be expected to be derived from an orientation toward projects rather than functions? First, we might expect project management to be more efficient than traditional structures in limited run, highly complex, unfamiliar projects with potentially high development and production costs. If iden- tification of team members is successfully shifted from functional roles to the project task itself, we would expect more interdisciplinary

209.
cooperation within teams, and greater individual satisfaction with success- ful task accomplishment in project organizations. Second, we would expect some conflict and defensiveness to arise in relationships between project managers and functional department heads, but it is doubtful that the negative effects of such conflict would override the benefits of intra- project cooperation. Third, various climate studies suggest that reduc- tions in the degree of structuring of member behaviors should lead to greater team member satisfaction under the project structure. Fourth, the weak link in project organization is the project manager. Given his cen- tral role in coordinating the planning and production activities of a wide range of technical specialists, his technical knowledge, interpersonal skills, and organizing abilities must be extensive. He must command suf- ficient respect within the organization to elicit the cooperation of existing executives whose personal and departmental interests may run counter to those of the project. Since the project manager must devote full time to the project his role cannot be filled from any executive position vital to the organization, and candidates typically come from middle management levels, with little experience in coordinating a range of differentiated functions. Until experience has developed a pool of proven potential managers, no clear guidelines exist for selecting project leaders.
In sum, if proficient managers can be found, project and matrix management appear to hold considerable promise in facilitating task-related communi- cations, and in aligning members' goals more closely with those of the organization as a whole, rather than with a functional subunit.
In organizations, such as those in the aerospace industry, which face demands for limited runs of highly specialized equipment in a rapidly changing technology, project and matrix organizations have seemingly proved highly effective (Johnson, Kast, & Rosenzweig, 1967, ch. 7).
We found no empirical studies comparing the performance of project and traditional organization structures. One study (Goodman, 1970) did, however, assess the organization design preferences of 23 project managers, and 23 organization general managers in 22 project and 2k matrix defense production organizations. Goodman found, perhaps predictably, that project managers preferred project designs, and general managers preferred matrix designs for large (in terms of size of contract) research and development projects. Interestingly, the general managers reported giving much more consideration, in making their preference decisions, to the flexibility of staffing possible in a matrix organization, where a single functional manager evaluates and remains familiar with the per- formance of all his subordinates. The general and project managers were asked to rank three organizational designs, project, matrix, and tradi- tional or line-staff, on eight criteria: clear location of responsibility, quality of communications, cost control, adequacy of supervision, staffing flexibility, adaptability, ability to evaluate personnel, and

210.
ability to provide members a clear promotion path. A summary of the rank- ings overall criteria indicated project managers perceived project organi- zations as potentially most effective, followed by matrix and finally line-staff organizations. General managers' summary ranking showed no significant differences in perceived effectiveness for the three organiza- tion types, although the rank order was the same as the project managers'.
In unstructured interviews on the alternative organization forms, Goodman's managers agreed that a line-staff design was best for an organization with a single, or stable product. Matrix design was judged best if a diversity of products demands both specialization and coordination. And project design was preferred for an organization facing a few very large projects. One factor deemed to be of importance in selecting an organization design involved the abilities and personalities of the personnel, again pointing up the crucial role of the personal attributes of the project manager in determining the effectiveness of project or matrix organizations.
Specific Structural Factors and Organizational Effectiveness
The most lucid and comprehensive variable by variable assessment of the effects of these structural factors on organizational outcomes is a review by Porter and Lawler (1965) relating organization structure to members' attitudes and behavior. We shall briefly review their findings for several structural variables, and attempt to bring the review up to date by citing relevant research published since 196*».
Organizational Level
Investigating the effects of the hierarchical level of the respondent in the organization, Porter and Lawler found evidence of a consistent increase in satisfaction from non-managerial to managerial positions, and from low to high level management. This conclusion is supported by Bonjean and Grimes (1970) who studied alienation in samples of salaried and hourly personnel in two industrial plants. Alienation was assessed in terms of perceptions of powerlessness; lack of influence over important social groups; normlessness, or failure to perceive clear and consistent norms; and job activities inconsistent with one's self-concept. Bonjean and Grimes found that higher level, salaried personnel perceived less aliena- tion on all scales than rank and file employees from the same firms.
Ronan and Prien (1973) performed a correlational study of structural and performance variables. They found that the ratio of hourly to salary paid employees, an index of low vs. high organization level, correlated posi- tively with the frequency of infirmary calls, group insurance claims, sick leaves, absences, grievances, and disciplinary actions taken against employees. These findings would seem to imply a greater health risk for

211.
blue collar employees together with greater work avoidance behavior. The discipline and grievance correlations probably reflect the greater likeli- hood of formal grievance and disciplinary mechanisms for unionized blue collar workers than for salaried personnel.
Herman and Hulin (1972) performed a discriminant function analysis to determine what satisfaction factors differentiated among nonsupervisory, first level supervisory, and managerial employees. Rank and file employees tended to be less satisfied with the organization in general, than the two supervisory groups. First level supervisors, while high in general satis- faction, were less satisfied with line-staff relationships and with the quality of supportive (staff) services than were higher level supervisors. These patterns support Porter and Lawler's conclusion of consistently greater satisfaction in higher organizational levels.
In a series of studies to determine what job factors contribute to worker satisfaction, Blood and Hulin (1967; Hulin & Blood, 1968) found that white collar and blue collar workers reacted differently to such job character- istics as responsibility and autonomy. While white collar employees tended to respond favorably to attempts at job enrichment, those blue collar workers whom Blood and Hulin termed "alienated from middle class norms" reported greater satisfaction with simple noninvolving jobs. Thus, hierarchical level appears to be related not only to actual satisfaction, but to values or preferences for satisfiers as well.
Line-Staff
Porter and Lawler found some consistent differences in the attitudes and behaviors of line and staff personnel. Line workers were more satisfied than staff members, presumably because of the coincidence of high training and ability and low authority in staff personnel. Two studies reviewed by Porter and Lawler related line vs. staff positions to performance variables. One showed a turnover rate for staff personnel of 2-*» times that of line managers. The other reports staff managers are more informed of intra- organizational events, presumably because of their greater mobility.
Herman and Hulin (1972) found that staff members without supervisory responsibility had lower overall satisfaction, and were less satisfied with supervisor-subordinate relations than line personnel. They were, however, more satisfied with line-staff relationships than were line personnel.
Span of Control
Porter and Lawler found no studies providing data on the relationship between span of control and employee attitudes. The major writer on the subject (Worthy, 1950) contends that large spans of control preclude close supervision, and thus should enhance autonomy and satisfaction. Some

212.
support for this position is offered by Blankenship and Miles (1968) who found that managerial span of control was directly related to perceived reliance on subordinates to initiate and contribute to organizational decision making. Blau and his associates (Blau, 1968; Blau, Heydebrand, S Stauffer, 1968; Meyer, 1968) conclude precisely the opposite; they found that span of control was negatively related to the expertise, and presumably to the autonomy of the work force. Their data suggest that professional personnel, while requiring little supervision, need an exten- sive communications network to facilitate interaction with other profes- sionals and with management. A tall hierarchy, becoming less profession- ally specialized and more management oriented as it nears the top, would permit the interaction and coordination of different professional disciplines. The greater the number of specialties, the greater the intensity of specialization, and the larger the differences between specialties, the higher the management structure necessary to mediate between the two most disparate professions. Blau, then, contends that a large span of control is related to centralized decision making rather than autonomy. He feels that decisions and orders can be easily trans- mitted downward through a few wide hierarchical levels, while the tall narrow structures he found in professional organizations impede a rapid downward flow of directives. This contention, however, is again contra- dicted by the results of Blankenship and Miles (1968), and by Pugh et al. (1968) who found decision centralization negatively related to the average work flow span of control. The dilemma can perhaps be resolved by posing different processes affecting the structure of professional and non- professional departments and organizations. Within professionalized organizations with self-motivated members, we would expect a tall and narrow hierarchy to facilitate communeiat ions, but not to control behavior. The existence of such a structure should be related to satis- faction among professionals. In non-professional organizations, with behavior controlled externally by fragmented, simplified jobs, and close supervision, we would expect a more classical configuration, with rela- tively narrow control spans, and workers preferring wider spans and greater autonomy from supervision. Such a dual process is indicated in a study by Udell (1967). He found that while employees' education level (professionalization) was negatively related to span of control, the experience of primarily nonprofessional members, and supervisory percep- tions of members' ability were positively related to control span. This is consistent with an increasing control span for nonprofessionals with increasing competence.
Porter and Lawler cite Woodward (1958) as the only study relating span of control to performance. Recall that Woodward classified firms as unit, mass, or process technical systems, and that within each category, high producing firms scored near the median value for first level span of control, while low scoring firms fell at the extremes of the distribu- tion. Although she presented no data, Woodward (1965) reported similar
2This bears an obvious relation to Lawrence and Lorsch|s (1967) concept of a formal integrative function, mediating between differentiated
specialties.

213.
relationships for the chief executive's span of control, and for the super- visor: subordinate ratio, or (inverse) overall span of control. Recall also that Woodward was only able to discriminate between the top and bottom fifths of the performance distribution, presumably with little predictive efficiency in the middle performance range.
Ronan and Prien (1973) found no_ relationship between departmental span of control and production costs, turnover, time lost for accidents, injury or sickness, absenteeism, tardiness, grievances, or disciplinary actions.
Any relationships among control span, satisfaction, and performance may be contingent upon other variables such as hierarchical level or professional- ization. Woodward (1965) for example, found that control spans of execu- tives, managers, and first line supervisors varied greatly in their relationships with her technological complexity measure. Average span of control (ratio of total personnel to supervisory personnel) and span of control of middle level managers were both negatively related to technical complexity. Chief executives' span of control, on the other hand, was positively related to technical complexity, and first level supervisory control span had a curvilinear relationship, with unit and process organi- zations exhibiting a small span, and mass production firms showing a large first level control span. Given even Woodward's weak relationship of these structural variables to performance, it seems clear that span of control has no simple relation with organizational effectiveness, in terms of either satisfaction, or other more production oriented variables.
Si ze
Porter and Lawler attempted to differentiate between the effects of total organization size and subunit size on organizational outcomes. While this appears to be a reasonable distinction, the value seems lost in Porter and Lawler's application. They define a subunit as, "any grouping of the members of a business organization that systematically excludes part of the membership of that organization", including "primary work groups and factories (in multifactory companies)". This definition results in some "subunits" (entire factories) with far more members than some total organizations. A better concept of total organization is as much of the firm as a worker comes in contact with, or is aware of, in a typical work day. "Subunit" must be defined in terms either of a work group, or unit in which primary personal interaction among most members is typical, or of some organizational subdivision with which the member identifies closely, but existing within a more or less contiguous total organization.
Porter and Lawler's review of both subunits and total organizations indi- cates a consistent negative relationship between organization size and satisfaction for blue collar workers. The only study presented for managerial workers indicates that satisfaction is related to an interaction

214.
between size and managerial level--lower level managers were more satisfied in small than in large firms, while higher level managers in large organiza- tions were more satisfied than those in small firms.
With respect to behavioral outcomes of size, Porter and Lawler found con- sistent evidence of a positive correlation between organization size and absenteeism, turnover, and number of labor disputes for blue collar workers. Inconsistent relationships were reported for accident rates and productivity. Size and accident rate seemed positively related in the absence of a formal safety program. Productivity does not seem to be consistently dependent upon either organization or subunit size.
Ronan and Prien (1973) found that organization size correlated only with the rate of turnover in salaried personnel. No relationship was found for costs, earnings, accidents and injuries, tardiness and absenteeism, grievance rate, disciplinary actions, or hourly personnel turnover.
Child (1973) found organization size unrelated to either reported innovative- ness, or perceived conflict in 78 British firms.
Blau et al. (1966) reported an interaction between size and specialization in predicting costs in 250 public health organizations. Large agencies with few distinct occupational specialties had lower average labor costs than did small nonspecial ized agencies. Costs in agencies that were highly differen- tiated internally did not vary as a function of size. Thus, only non- specialized firms showed a return to scale as a result of increased size. Blau et al. hypothesize that a highly differentiated organization must either remain small or else maintain a much larger coordinating, administrative component than most of these agencies possessed. In agencies where a rela- tively large proportion of personnel were clerical (coordinating) workers, both differentiated and undifferentiated organizations showed lower costs with increasing size.
Shape - Tal 1 vs. Flat
Porter and Lawler found only a few studies with data bearing on the joint effects of organizational height and width. Two studies showed that organization shape interacted with organizational size to determine satis- faction: low, flat structures yielded greater satisfaction in small firms (fewer than 5000 members) and tall, narrow structures produced greater satisfaction in large firms.
Carpenter (1971) found that teachers in low, flat-structured public school systems reported greater satisfaction with prestige, autonomy, and decision making responsibility than did teachers in tall narrow organizations. No differences were found for the satisfaction of security or personal growth needs.

215.
Porter and Lawler cite one study relating organization shape to the publi- cation rates of physiologists. Over all the firms, no relationship was found, but scientists in large tall organizations published more papers than those in large flat firms. This may, again, be compared with Blau et al.'s (1966) findings of greater cost-efficiency when high professional ism coincided with a tall hierarchical structure.
Role Speciali zation
One structural attribute which was not included in Porter and Lawler's review is the degree of specialization in an organization. As a rated, perceptual variable, this characteristic could reflect a climate dimension of task specificity, but measured by an actual count of the number of distinct formal positions or activities undertaken in an organization, specialization represents a structural characteristic, and would be espe- cially related to the breadth of the organization at its base. As is the case with span of control, we would expect the theoretical and practical implications of different degrees of specialization to differ at different organizational levels, and over various degrees of professionalization. The fragmentation of jobs into minute, repetitive tasks for blue collar workers might have different implications for performance and satisfaction than would the differentiation among various professional disciplines.
Hage and Aiken (1967b) found that the number of occupational specialties was positively related to the amount of program change, or innovation, in 16 social welfare organizations. The personnel tested all were profes- sional staff members.
As we discussed earlier, Blau, Heydebrand, and Stauffer (1966) found that in small but not in large public health organizations, a large number of specialties was associated with lower costs.
Child (1973) found specialization to be related to conflict within 78 business organizations. This finding should be considered in light of Lawrence and Lorsch's (1967) contention that differentiation or inter- departmental conflict is necessary for high productivity. Given a high level of conflict, the effectiveness of the organization should depend on the ability of integrating subunits to mediate between the various special ties.
Summary
Several factors seem to play an important role in determining the expected relationship between structural variables and organization outcomes. These include the type of organization (e.g., Woodward's technology/structure fit hypothesis applies only to some types of manufacturing organizations), the organizational level of the target group or subunit (e.g., Porter and

216.
Lawler's different results in size-satisfaction relationships for different levels), and the degree of professionalization of the work force. Thus, we would like to focus our summary around these three factors.
First, regarding a summary of the results of studies on blue collar workers in industrial manufacturing organizations, it is apparent that the two organization characteristics most influencing our dependent variables are organization size and the hierarchical level of the respondent. Size was consistently found to be related positively to absences, turnover, and labor disputes, and negatively to worker satisfaction.
Blue collar vs. white collar membership is negatively related to satisfac- tion, and positively related to worker alienation, absenteeism, and possibly health hazards. There is some evidence for different job outcome preferences between blue and white collar workers, apparently related to a tendency for blue collar workers to reject some middle class achievement norms. Span of control was shown to be related weekly or not at all to performance and satisfaction variables in blue collar samples.
A second subsample within which structural and effectiveness variables have been related consists of white collar personnel in industrial organizations. Here research indicates higher satisfaction and lower turnover for line than for staff employees.
Size seems to interact with other variables in its effects on managerial outcomes. Porter and Lawler report that managerial satisfaction is related to both size and hierarchical level, with top executives preferring large organizations, and lower level managers preferring smaller firms. Like- wise, managers in large firms preferred tall, narrow configurations, while those in relatively small organizations reported greater satisfaction if the firms had low, flat structures. Professionals in large tall organi- zations published more than those in large flat organizations, but there were no shape effects on performance for medium or small firms.
The third sample type involves primarily white collar professional people in service organizations. Here, size, professionalization, and specializa- tion were found to be complexly related to costs and to innovation. Increased size was related to lower relative costs if specialization and professional i zation were low, o_r if the organization possessed a large com- ponent of administrative, coordinating personnel. The number of job specialties was positively related to the rate of innovation, and to perceived conflict. Specialization correlated negatively with costs in small organizations, and in large organizations with a large administrative component. Finally, teachers reported lower satisfaction with prestige and autonomy in tall than in flat organizations.
In general, structural factors, like climate dimensions, appear to influence satisfaction and satisfaction related behaviors (absenteeism,

217.
turnover) far more heavily than they do productivity variables, especially for blue collar workers. Organizational structural components can make rank and file members happy or unhappy but they don't seem to motivate them to work harder or to restrict production. The effect of structure on per- formance may be higher among professional personnel, where, as we have seen, a tall narrow structure seems to facilitate productivity if it is concerned with communication rather than control.

218.
VIII. INDEPENDENT VARIABLES
As we have already become all too aware, identifying variables that we can label as dependent, independent, or something in between, vis-a-vis organizational functioning, is not particularly easy. What's one investigator's dependent variable is another investigator's independent variable. For example, in the study of organizations, measures of job satisfaction have played as many different explanatory roles as the scientific method has so far invented. Thus when we ask whether a par- ticular characteristic plays the role of a dependent or an independent variable perhaps the only sensible answer is that "it depends".
One major factor upon which the distinction depends is the value system and the theory of effectiveness of the organization and/or the investigator, The moral here is clear. Both the organization and the investigator should know their value systems and differences between them should be recognized and dealt with in some fashion.
Aside from the value distinctions, however, there is a class of variables that historically have been treated as things to manipulate in hopes of producing a change in something else. They constitute recognizable handles to pull or dials to turn; as for example, the methods used to select new members for the organization, methods of payment, or various training or organization development methods. But even here the distinc- tions are not always clear cut. Within a particular value system, some methods of payment or some methods of selection (e.g., using or not using psychological tests) may be viewed as more desirable than others and to use the highly valued methods is to be viewed as an effective organi zat ion.
In spite of the definitional difficulties, we do wish to comment very briefly on methods that might possibly be used to effect changes in organizational functioning.
This category contains what is probably the bulk of the literature in industrial and organizational psychology and although tempting (sic), we do not wish to recount all of it. One thing that should be pointed out is that most of the research on these various "handles" has focused on individual behavior or performance as an independent variable. There are very few studies which have used organizational units as degrees of freedom, as for example in comparing various selection strategies or training methods, and these are so well known that we needn't burden the reader with a great deal of detail. Again, the work done at Michigan by the ISR group is the most notable exception and the principal independent variables which Likert, Bowers, and Seashore have used are primarily managerial interpersonal skills, communication methods, and participation in decision making. In their cross sectional studies of package delivery outlets (Georgopoulos & Tannenbaum, 1957) and insurance offices (Bowers

219.
& Seashore, 1966) and in the longitudinal case study at Harwood Industries (Marrow, Bowers, & Seashore, 1967), these variables have tentatively been, shown to have generally positive relationships with various measures of organizational effectiveness.
Beyond this there is not a great deal of organizational research that can be differentiated from individual research, which is too bad since many of these variables have been shown to be related to individual performance. The people who call themselves OD practitioners do indeed manipulate some of these variables in hopes of producing changes on some organizational dependent variables, but they tend to collect very little research data. The exceptions to this generalization are a relatively small number of data based studies such as that done by Blake, Mouton, Barnes, and Greiner (1964).
One thing that might be useful is to look at the list of independent variables with an eye towards the kinds of mechanisms by which they might exercise their effects. A list of such mechanisms might appear something as follows:
1. The aim could be to influence a unit or organization's choice of tasks or problems on which to work and the degree of effort expended once the choice is made. This is a so-called "motiva- tional" consideration and involves task choice and task effort. Reward systems, job enrichment, and "team development" are methods of changing organizational functioning that appear to utilize, or attempt to utilize, this mechanism.
2. The aim might be to increase an organization's understanding of the task to be performed or problem to be solved. Insti- tuting a computer assisted management information system or a management by objectives control procedure would seem to focus on this mechanism.
3. Another possible mechanism is to increase the organization's basic underlying aptitudes (e.g., select more competent people) for the task involved.
k. Another is to increase its specific task skills through some kind of training.
5. Finally, a change in the equipment or technology required for the task might be a way to increase organizational effectiveness.
It might be of interest to juxtapose this basic set of mechanisms against a simple listing of all the different methods that have been used to change individual or organizational effectiveness, at least to some degree. This list appears as Table 20 and is everything we could come up with, based on the current literature review plus others we have done.
220.
Considering such a juxtaposition of underlying mechanisms against specific techniques poses some interesting questions about how various independent variables work. For example, does participation work because it influences choice and effort (motivation input) or because it leads to better utiliza- tion of information (a cognitive input)?
The moral here is that the more we understand about the processes involved the better off we are. However, researchers have not often looked inside the black box. There is a wealth of data concerning the correlations of these various independent variables with selected dependent variables but the processes involved are seldom examined systematically. Further, as was mentioned above, almost all these black box correlations have been computed using individuals, not organizations, as degrees of freedom. With regard to both individual and organizational functioning we think it would be well worthwhile for researchers to move toward more process type i nvestigations.

221
TABLE 20 PARTIAL LISTING OF POSSIBLE METHODS FOR
CHANGING THE EFFECTIVENESS OF ORGANIZATIONS
Personnel selection
Personnel classification
Career assessment and career planning
Individual training
Orientation training Ski 1 Is training Managerial and leadership training Human relations training Training to enhance the achievement need (nAch)
Individual counseling
Changes in promotional criteria
Incentive, or contingent, pay
Cafeteria pay plans
Scanlon plan
Behavior modification
Flexible scheduling
Job enlargement
Job enrichment
Participation in decision making
Organization development methods (behavioral science based)
Survey-feedback Interview-feedback Problem solving meetings (temporary task forces) Laboratory training Confrontation Process observation and feedback Managerial grid Team development Intergroup laboratory

222.
TABLE 20 (Cont.)
Management by objectives
Changes in organizational structure
Changes in functional arrangements (e.g., definitions of task responsibilities)
Changes in managerial controls (e.g., human resources accounting) Matrix management
Changes in organizational processes
Management information systems Operations research and analysis Communication practices Manpower planning techniques
Advances in technology
223
SOME CONCLUSIONS AND IMPLICATIONS
This has been a long and rather tedious trip through the literature pertaining to organizational effectiveness. It became considerably broader in scope than our original intent and it no doubt could be broader still. In general, we certainly did not expect to find any clearly delineated theories of organizational effectiveness or a well worked out system for operationalizing and measuring a well-defined set of facets that together made up the whole or organizational effec- tiveness. However, we were a bit unprepared for the lack of systematic thinking about the nature of the problem and the magnitude of the fragmentation concerning ways to measure organizational effectiveness. We did expect to find at least a few examples of innovative or provoca- tive research that would clearly point to a useful direction that future research could take. There really were no such milestones. The criterion problem vis-a-vis organizational performance has simply not been given the same kind of systematic attention that it has with regard to individual performance.
What we hope we have done is both to reflect the state of the art as it exists and to impose at least the beginnings of a conceptual framework that can provide a means for thinking about the problem. If we have been successful then the reader should be able to place the theories and practices of MBO, OR, and OD types and the research of organizational sociologists and organizational psychologists in some sort of interpretive framework.
When we do this ourselves, we think it leads to a certain set of conclusions about the current nature and measurement of organizational effectiveness that can be used as a backdrop against which to suggest future research activities. Thus, we offer the following conclusions based on our review of the literature. A subsequent chapter will con- sider in more detail the direction that future research should take.
A. The distinction between the goal-oriented and systems-oriented view of organizational effectiveness is a meaningful one and suggests very different behaviors on the part of the researcher or practioner. However, we do not view them as necessarily con- flicting points of view. They are complementary rather than conflicting and both can be used to advantage. For an organization to understand or seek to change its effectiveness it must be able to specify both the tasks it is trying to accomplish and the processes that are involved in accomplishing them. Both sets of questions can only be answered by the informed judgments of the relevant portions. Conceivably, the link between system or "state" variables and the degree to which important tasks or goals are achieved could be translated into a question. However, it is a very difficult one

221».
to answer. Even the researchers at ISR have not been able to do so in any satisfactory fashion. They have the largest data base and the clearest model so far accumulated. Rather the dual ques- tions of what tasks suborganizations should be trying to accomplish and what state variables reflect a "desirable" system can only be answered through the judicious use of informed judgment. Thus, a judgmental or scaling approach to the definition and assessment of organizational effectiveness should receive far more attention than it has. Such an approach would also help to reveal the crucial conflicts in values within an organization relative to how organizational effectiveness should be defined and measured, identifying and defining the nature of these value differences is perhaps where research or organizational effectiveness should really start. We will have more to say about this in the next chapter.
B. Attempting to map out the empirical relationships among some set of independent, intervening, and dependent variables with the aim of achieving an overall understanding of how organizations work is probably a futile undertaking. Our present technology does not permit it. We simply cannot acquire the necessary degrees of freedom to investigate very many interactive relationships or even to pursue multivariate analyses of any complexity. It most likely is not possible to use empirical multivariate techniques to investi- gate the dimensionality of organizational effectiveness. Somehow the mess created by accepting the simple-minded fact that organiza- tions are complex must be bypassed.
C. Related to the above is our conclusion that since it probably is more difficult to find homogeneous sets of organizations than homo- geneous sets of jobs, it may not be profitable to use a goal-oriented model to impose a similar "structure" of effectiveness across organ- izations. That is, even if it were possible, it may not be wise to factor analyze data on criterion components collected from a large number of organizations and thereby imply that the factor structure has a similar meaning for each organization. However, this con- clusion may not be quite so applicable to organizations like the Navy where there are large numbers of homogeneous units.
D. Generally speaking, the notion of overall organizational effective- ness cannot be given a substantive definition. It simply has too many parts that lose their meaning when they are added together. It is possible, of course, to ask observers to rank order organ- izations on one continuum without asking them to specify the nature of the continuum, but the degree of agreement will vary depending on the degree to which observers are focusing on the same facets in the same way, and if we don't examine those dynamics we haven't advanced our state of knowledge very far. One way of getting at

225.
these dynamics would be to specify a specific set of tasks the organization must perform, and for each task the raters could rate the potential effectiveness of each organization, or they could rate the importance of a particular component of effectiveness for accomplishing the task. To the extent that the raters are knowledgeable and the tasks representative, a great deal could be learned about the joint function of individual effectiveness components under specified conditions.
E. Within a particular "model" of organizational effectiveness, it might be profitable to think of the "components" of effectiveness even though empirical multivariate methods are not a feasible means for deriving the underlying structure of such components. It seems obvious from looking at the history of this problem that any serious taxonomic efforts must proceed within a relatively homogeneous value system.
F. Since it is not possible to study organizational effectiveness intelligently unless certain questions pertaining to the organ- ication's or investigator's values are settled first, it would be well worthwhile to focus a good deal of research on the value questions themselves. For example, is personal job satisfaction something to be valued for its own sake? Is high efficiency really a highly desirable end state?
G. If the more important value questions can be settled, then we think it is possible to begin developing a taxonomy of dependent variables that reflect the "health" or viability of the organiza- tion. However, the measure of the variables in this list should not be developed from existing archival records. Such measures have never seemed to be very useful for anything. The instrumentation should be developed independently, with inputs from all affected parties, and should be imbedded in a consistent reward structure. That is, the reward system in the organization (formal and informal) should reward using the measurement system with as much fidelity as possible.
H. Related to the above, we are persuaded that the organization develop- ment literature, including the Michigan-ISR work, in conjunction with the literature on the measurement of organizational climate provides a broad base from which to start building well-defined measures of an organization's state or health. We are not saying that such measures already exist. However, a good deal of the developmental work has been done and a number of blind alleys have been identified and they can be discarded. We can profitably build on thi s prior work.

226.
A disclaimer one often hears about whether a particular relation- ship between an independent and dependent variable will be observed is that it'depends on the situation," meaning that organizations are different and what might be true in one will not be true in another. As a response, a number of people have offered up taxonomies of organizations which supposedly outline the basic differences that must be taken into account. In terms of advancing our understanding of organizational effectiveness, this too has been a futile under- taking. Other kinds of intervening variable research are still in their infancy. For example, the empirical work on organizational structure reviewed in Chapter VII has not really gotten very far as yet.
A neglected area of research has been the effects on the organization of significant changes in the kinds of people that are entering it. The entire domain of organizational effectiveness research and organ- izational change has a very environmentalistic point of view. This is an unfortunate state of affairs for organizations which are about to undergo massive changes in the way they recruit and select new members.
The most fruitful research has not been that which tries to con- ceptualize sampling error and use the organization as a degree of freedom in the same way we do for individuals. Rather, an idealized picture of what appears to be more useful research would be some- thing like the following.
. Drop back to individuals or work groups as degrees of freedom.
. Focus on dependent variables that you are willing to assume have an important link to overall organizational functioning.
. Include as part of the research program a systematic look at the process involved. That is, instead of demonstrating only that a program of job enrichment resulted in higher retention rates for skilled personnel, get inside the organization and try to find out precisely how the various elements of the job enrichment program affected the people involved. If the dynamics could be illuminated we should be in a much better position to predict whether a particular relationship will generalize. In general, we think it would be much more fruit- ful to identify the process parameters in a particular inde- pendent variable-dependent variable relationship and then see whether these are present in some other organization than it is to build a taxonomy of organizations and then decide if these organizational parameters have anything to do with whether a particular independent variable will work.

227.
To sum up, we think we have identified certain directions suggested by previous research and theory that should not be followed. For example, empirical multivariate research based on a factor analytical approach to criterion development probably should be avoided. Developing tax- onomies of organizations should be avoided. We also think we have identified some avenues that future research could profitably follow, and it is to an elaboration of these suggestions that we now turn.

228.
FUTURE RESEARCH ON ORGANIZATIONAL EFFECTIVENESS IN THE NAVY
Research Content
The foregoing review of research on organizational effectiveness suggests that Naval research might usefully proceed in at least three broad but relatively indpendent substantive areas. Two relate to the discovery of or development of indicators of organizational effectiveness. They correspond essentially to the distinction we've made between the goal and systems models of organizational functioning. We've argued that these models speak to different aspects of the overall research problem and that they should not, therefore, be viewed as competitors. Each in its own right can be a useful basis for building a better understanding of effectiveness or for developing useful measures of organizational effec- tiveness. In essence, studies may be undertaken within each orientation that focus on the dependent variable side and will constitute frontal assaults on the criterion problem. The third general area receiving extensive emphasis from our literature review involves the means to be used in bringing about change in organizational effectiveness. That is, which handles should be pulled and how should they be pulled? Methods of Organizational Development (OD) have not been our main concern in this report, but research needs to be done in such areas, nonetheless. How- ever, two preliminary points need to be kept in mind as we consider research related to the effects of various independent variables. First, most of the research proposed on the following pages is meant to be con- stituted of a multi-method approach relative to organizational effective- ness in Naval organizations. Different types of criterion analyses may demand and come to constitute, in themselves, substantial organizational development efforts. For example, a great deal of research on individual performance (e.g., Locke, 1968; Meyer, Kay 6 French, 19&5) suggests that an understanding of the specific goals of an activity, frequent feedback concerning progress toward goals, and good communication between job incumbents and their superiors lead to better performance. Thus, the mere fact of learning about an 'organization's goals--certainly any large- scale programmatic effort in that direction--should impact on that organ- ization's "OD efforts," as such knowledge is, in turn, used to develop techniques of systems control for use in monitoring regularly the "state of the system." All we really are trying to say here is that criterion development j_s_ organizational development, at least within this context. Our second preliminary point is that once measures of organizational effectiveness have been developed, or at least decided upon, carrying out field experiments designed to compare differences produced by man- ipulating various independent variables is at best difficult, and at worst, impossible. It may simply not be possible to mount full-scale experiments using organizational units as degrees of freedom, randomly dividing them into experimental and control groups, and conducting elegant experimentally precise analyses to derive generalizable conclusions.

229.
Some persons might argue that a fourth substantive area is in great need of additional research, namely, the development of taxonomies of organizations and/or of organizational situations. Their rationale in favor of developing further taxonomies usually rests on the belief that the most important part of any answer to the question of how organizational effectiveness can be measured or how it should be changed is the phrase, "It depends ... on what kind of organization you're talking about." Strictly speaking, such a response is fully legitimate and most certainly reflects an underlying desire for more ultimate explanatory concepts. However, it has been and continues to be our contention that our present technology is not yet ready to cope with the complexity that such taxonomic efforts may require. Thus, we by- pass, for the time being at least, some of the difficulties created by inter- organizational differences, recognizing that they are indeed complex but offering no firm new or different suggestions for research on organizational taxonomies.
To summarize, the substance of our suggestions for research to be done in the years ahead focuses quite heavily on the analysis and development of criteria of organizational functioning whether they be systems or goal oriented. Only secondarily do we seek to outline systematic research studies on the independent "levers" that may or may not affect organizational functioning, though we urge the reader to note that any study of organizations can and usually does offer opportunities for observing, even though indirectly, their effects on the dependent variables of organizational functioning. Finally, we do not presume, at this time, to offer further taxonomic approaches to those already tried out, though we sincerely support any systematic effort the Navy might undertake in an effort to replicate studies that may have relevance for understanding more fully the functioning of Naval units and systems.
Research Strategies
In a bit of whimsy a few years ago, Dunnette (1970) suggested that the entire structure of scientific enterprise might be understood and described quite simply merely by referring to eleven verbs:
Observe Record Compare Classify Count Speculate Vary Refute Persist Communicate Verify

230.
These eleven action words offer a stepping off place for organizing our sugges- tions for research related to the substance and content of organizational effec- t iveness.
In setting out to study the Naval organization(s), a strong implication exists that persons are curious and that this curiosity will provide the impetus for observing and recording what is going on organizationally in the Navy. At a first (or lowest) level of abstraction, therefore, we outline several strategies for observing directly or for gathering and recording others' observations about Navy practices and outcomes. We believe such information may be rich in its yield of knowledge about the goals, processes, and independent variables of organizing the Naval organization.
At a second level of abstraction, with records and systematic accounts of vari- ables and potential variables available, the scientific study of the Naval organization will seek to establish some parsimony through comparing, classify- ing, counting, and interrelating the variables under study. Statistical and psychometric (including multivariate) investigations are suggested which seem to flow readily from the observations and records of earlier investigations.
As psychometric results become available, the scientist's curiosity is likely to be whetted anew. But, as we have suggested, he may be in for a tough time if he hopes to continue his studies in field instead of controlled laboratory settings. Thus, at a third (or highest) level of abstraction, his curiosity will often lead him to speculate about the underlying regularities he has detected and how they come about. He seeks to develop explanatory models or theories about the likelihood of various causal sequences or nomologic relation- ships among his variables. From psychometrics, therefore, the possibility of certain experimental and quasi-experimental investigations - in both field and laboratory - are suggested for the possible future investigation of Naval organi- zational effectiveness cause and effect relationships in the years ahead.
The remaining three verbs listed by Dunnette - persist, communicate, verify - speak more to the needs for rigor, community of scientific interaction, and replication of investigations than to the actual procedures of research investi- gation. Thus, in our research suggestions, we simply assume the existence of these "scientific" values as givens and shall offer no further reflections upon them. However, each of the other levels of investigation deserves some brief further comment before we plunge into specific research suggestions.
Naturalistic Observation
Observations and records of what is happening within an organizational context take many forms. At one extreme, lay (non-scientific) observations can easily be made and reported by sailors who live and work within the Naval organization. But their reports are likely to be casual, unsystematic, incidental, and incom- plete. In contrast, a scientific observer may also live in the Naval organiza- tion. His observations and records will be more systematic; they will either

231.
be exhaustive (recording each detail) or representatively sampled; they will be purposive instead of incidental or casual. But scientists will differ one from another in the extent to which they make themselves known as "out- siders" (obtrusive vs. unobtrusive), in the nature of records kept (film, diary accounts, structured categorizations for recording events, etc., etc.), and the degree to which they simply describe what is going on vs. seeking to interpret their observations in the context of prior expectations or hypothe- ses. The foregoing forms of observation are examples of observations made in vivo (i.e., observing and recording take place at the same point in time as the time when the behavior itself is unfolding).
A different form of observation is that which may best be termed retrospective, Again, at the one extreme, retrospective reports may take the form of an unsystematic and basically unstructured verbal account of something that has taken place at some time in the past. Increasingly systematic approaches may include such techniques as observers filling in rating forms or check lists responding to questions from trained interviewers using either no structure, loosely structured, or highly structured questionnaires (such as public opinion and attitude surveys), or responding to rather focused questions but in an essentially anecdotal or story telling manner. The latter approach essentially is the method employed in critical incidents methodology which, as we shall see shortly, seems to offer a number of promising possibilities for research on organizational effectiveness. Though memory may act to dis- tort observations and reports, methods of retrospective observation have one highly important advantage. Instead of offering information about just a rather short time span (as is almost always the case for in vivo observation), retrospective accounts can be called forth from a very wide range of prior experiences and over much more extensive spans of time.
Psychometric-Multivariate Methodology
Obviously no need exists for the readers of this monograph to be indulged by a course in statistics, correlational methodology, or factor analysis. For our purposes, it is important only to note that multivariate methodology, in its purest form, is usually an effort to examine a number of variables by measuring their co-variatiop in the real world. Now, the definitions of what constitutes the so-called real world may differ. In some rare instances (as in the Seashore insurance agency study described previously), measures may be taken of a number of variables in vivo (i.e., while the people and the organi- zations are really behaving in their day-to-day ways). More commonly, perhaps, the "real world" is constituted of a series of measures (usually paper and pencil) taken on persons as they describe their perceptions of what goes on back in their real worlds. The most crucial point of the Psychometric- multivariate-differential approach, probably, is that a great effort is made to tap as many of the variables of interest as possible, allowing each hope- fully to range over its entire "real world" range, as opposed to restricting the numbers of variables to be studied or the ranges over which they are

232,
measured. As such, psychometric studies may frequently be merely parametric, normative, descriptive, or, at best, taxonomic. Rarely, are they based initially on deductions derived from strong theories or models (though they may be), and rarely do causal statements flow correctly from their outcomes.
Experimental and Quasi-experimental Methodology
A more certain methodology for deriving causal conclusions is experimental methodology. Experimental designs differ, first, in their degree of replica- bility. The well known experimental group-control group design, when "staged" in a laboratory setting and when fully described is fully replicable. In contrast, an equally tightly designed experiment even with random assignment of persons to control and experimental group situations, if conducted in a real operational setting will often not be fully replicable, particularly when used to "evaluate" one or more intervention techniques (such as a new training, counseling, or survey feedback program) that will not likely be repeated in unmodified form at any future date. Finally, a respectable but far from replicable approach, depending heavily on the special observational, creative, and reporting powers of a particular experimenter, is the clinical- experimental approach. In our opinion, a classic example of clinical- experimental methodology is the development by Piaget of his theory of cogni- tive human development. In a similar sense, Freud might be termed a theore- tician who depended heavily upon clinical-experimental evidence for the full development of his theories of human personality. At the level of program evaluation in areas related to organizational effectiveness, the clinical- experimental approach carries different labels, verging more closely, perhaps, on various modes of observation similar to those already commented upon pre- viously. Useful reviews of the merits and demerits of clinical procedures applied experimentally to program evaluations are provided by Becker (1958) and by Glaser and Backer (1972; 1973)- The crucial point, of course, is that causal inferences derived from such procedures depend heavily upon the special clinical talents and observational accuracy of the experimental clinician who is reporting the account of his procedures and results. Others, opera- ting within the same clinical case setting, will, at best, encounter diffi- culties repeating the clinical-experimental procedures reported by that experimental clinician; or, at worst, derive quite different causal inferences from the results obtained. Though perhaps not widely regarded as such, the Hawthorne studies, particularly the various interpretations of results derived from them, are probably best classified as a series of clinical experimental investigations.
Again, no need exists for readers of this monograph to be offered a treatise on experimental and quasi-experimental designs. But mention should be made of a few key statements made by outstanding methodologists, for those readers who wish to examine the relative efficacy of such approaches in some greater depth. These include statements by Campbell and Stanley (1966), Campbell (1969), Bond (1973), Salasin and Campbell (1973), and Cook and Campbell (in press).

233-
A second and somewhat more obvious way in which experiments differ from each other is their locus, and this relates, in turn, to the degree of realism experienced by the persons who are serving as subjects in the experiment. The usual location, of course, for the conduct of experiments has been a laboratory setting. Realism suffers in many ways ranging from the subjects (college students vs. workers), the variables dealt with, the range over which the variables are examined; and, most particularly, the demand character- istics of the experimental vs. real world setting. In contrast, experiments conducted in real world settings must often sacrifice such things as control of variables (both their number and measurement) and random assignment .of subjects in favor of greater realism. Even in real settings, however, it is rare indeed for the "subjects" to be unaware of the fact of experimentation; thus demand characteristics and the pervasive "Hawthorne Effect" may affect the results obtained and their interpretation. Campbell (Salasin and Campbell, 1973) argues strongly, however, for the very great feasibility of carrying out unobtrusive, fully experimental evaluations of programs that are in short supply, and this argument seems to us to apply with special force tb the possibility of studying the independent variables of organizational effective- ness in the Navy. In short, when a program (say, for example, a survey feed- back technique) is to be implemented, there is no need to introduce it across the board. Instead, Naval units might be divided randomly (within certain meaningful strata) and the program introduced to only the experimental sub- set, dependent measures audited across both sets of units are preliminary conclusions drawn by contrasting the measures. Moreover, additional useful information would then be obtained from a time series analysis (See Bond, 1973) of the dependent measures as the program is then introduced into the sub-set of units initially used for "control" group purposes.
In fact, Campbell is very much in favor of pushing strongly for the use of full experimental designs and seeking to avoid the loss in clarity of infer- ence resulting from quasi-experimental designs, though he does still regard the "regression-discontinuity design" and the "interrupted time series with comparison series" as being among the most powerful quasi-designs - clearly superior to most of the other quasi-designs.
To summarize, strategies for research on and about organizational effective- ness in the Navy have been discussed according to methods of Naturalistic Observation (in vivo and retrospective), Psychometric-Multivariate-Differential , and Experimental and Quasi-Experimental. The experimental methodologies, we should remember, almost always imply some theory or model that is to be evalu- ated or tested. Simply planning to introduce a new organizational program in the Navy must be derived, usually explicitly and most certainly implicitly, some model or theory that relates the parameters of that program to expected organizational outcomes (goals) or processes. Thus experimentation is the methodology of choice if these assumptions flowing from such models or theories are to be evaluated in any causal sense. It is sad, therefore, that experimentation in the field is (or, at least, has been assumed to be) so difficult. But through suggesting a few possible approaches involving field

234.
and laboratory studies using both experimental and quasi-experimental designs, we hope to provide Navy behavioral science researchers with at least some food for thought.
Research Project Suggestions
We offer here a series of approaches to be considered for studying the con- struct of organizational effectiveness in the Navy. We see this listing of different studies, at this stage, as being closer to a grocery list than to a road map. We are not sure of the best sequence for undertaking these studies and, therefore, we do not offer them within an additive framework, though we would hope that programmatic planning of organizational research in the Navy may profitably begin with these suggestions as starting points, organize them meaningfully, and derive a systemic approach for carrying them out. As is apparent, our "grocery list" is coarsely clustered within the research strategies we have just discussed. If any sequence at all is sug- gested by our review of the literature and by our thinking about it, it would be one which moves in some planned way from the lower levels of abstraction involving observation, enumeration, and the investigation of the psychometric properties of variables to the higher levels of abstraction involving the investigation of linkages and causal interactions between independent and dependent variables. A critically important way-station connecting research studies at these different levels of abstraction must, of necessity, be a Naval model of organizational effectiveness. We suggest, therefore, that early research activities be undertaken with a view toward elaborating such a model and that its form and content should be used as a basis for designing later research activities to test it, disconfirm aspects of it, modify it; and, ultimately to develop in a formal way a fully elaborated theory of organizational effectiveness in the Navy.
1. The need for a Naval model of effectiveness. As mentioned immedi- ately above and as suggested at various other points throughout this mono- graph, research directions in the area of organizational effectiveness are destined to be diffuse, scattered, and poorly focused until a model of effect- iveness is available to provide the required focusing efforts. Naturally, we abhor the thought of merely slapping a model together or just "pulling one off the shelf"; premature model building or theorizing can and has (as we have seen) led researchers down a number of blind alleys. Nonetheless, we believe strongly that the Navy's first order of business should be to use all rational and empirical means at its disposal in an attempt to develop and articulate in some detail the nature of the effectiveness model it wants to use. We realize that there already exist a certain amount of folklore on the one hand and formal written mission statements on the other that speak to what an effective Navy should be like. However, we think the development of a "Naval Model" should go beyond these points in several respects. To wit:
?. The Naval Model should deal with the question of whether it wants to be goal oriented or systems oriented. We

235.
believe that the most useful model must incorporate both orientations.
ii. On the systems side the model should seek to identify and define reasonably completely the "state" variables that are regarded as important, and if possible, their relative importance. For example, should something akin to degree of job satisfaction or job "alienation" be included? After decisions about the nature of "state" variables to be included have been made, their meanings must be specified and, most importantly, indicators decided upon or developed to measure them. Obviously, such developments are dependent upon research data, and a number of the studies suggested on subsequent pages bear on this issue. However, even before such data become available, we think that a good deal of a priori head knocking could go on in the form of problem solving conferences convened to consider just these issues.
iii. On the goal side, the model must deal with the question of whether or not it is possible to describe in some detail the goals that Naval organizations should be trying to accomplish. For reasons argued in previous chapters, we do not think it is possible to develop a general goal statement in such a way that the same statement could be applied to the development of cri- terion measures in all subunits of the total Naval organization. For example, the Navy could decide, in general terms, on the degree to which it wants (or does not want) to serve as an "employer of last resort" for the nation's labor force. However, the ways in which individual subunits might contribute such an overall goal would be different. Their goal statements must be integrated with the overall goal, but the content of the specific subunit goals will differ.
Also on the goal side of the Navy Model we think It would be more useful if the model specified methods that should be used to develop goals for specific sub- units and the methods that should be used to integrate the specific unit goals with overall Navy goals. In a sense, we are opting for some variant of the MBO approach as a methodological component of the Naval Model as it is expressed in policies and practices. Obviously, activities of this sort are already being implemented to varying degrees in different parts of the Navy. We believe it will be fruitful to consider carefully how such methods may be incorporated more uniformly.

236.
iv. Initial efforts to formulate the model should be as specific as possible about the methods that should be used to assess the systems or state characteristics and the methods that should be used to determine the goals for a particular unit for a particular time period. That is, they must be given a certain amount of operational meaning to prevent misunderstandings as to what is actually being advocated. For example, turnover, job satisfaction, etc., can have different meanings depending on how they are measured. Only if the Naval Model seeks to be fairly specific along these lines will it be able both to tease out the disagree- ments people in the organization have and to provide clear guidance as to what's meant by effectiveness.
Three primary functions of a Naval Model of effective- ness wi11, therefore, be to:
Guide additional research on the development of effectiveness measures.
Provide guidance for the kinds of organizational development and change programs that should offer the best payoffs.
Serve to focus future discussion amongst relevant decision makers as to what an effective Navy should be 1i ke.
Thus while new research data would be used to modify and refine the Model, it is perhaps just as important to use whatever informal opinion is available at the outset to articulate a working model as clearly as possible. What we are advocating here is a certain amount of effort to be devoted at the beginning of any research program to the development and articulation of an admittedly incomplete but useful working model to guide even the earlier research efforts.
2. Naturalistic observation studies. We begin our grocery list of possible research activities with a sampling of studies involving the natural istic observation, both in vivo and retrospective, both incumbent and scientist-observer, of Naval organizational units.
a. On s i te■ Systematic records need to be made of what goes on within organizations. On site observations and records of managerial behavior have been made by Carlson (1951), Burns (1957), Dubin 6 Spray (196M, Home and Lupton (1965), and Stewart (1967). An extensive

237.
technology has also been developed and perfected by Professor Sykes and his colleagues for recording the elements involved in police- citizen encounters. We are not presently aware of similar recording methodologies which focus on the behavior patterns of entire organi- zations or of subunits of organizations. We suggest, however, that systematic observations are needed and that they are a first step toward defining both the goals and the processes of Naval organiza- tional units.
I. Objectives. Such studies would have the following objectives.
. development of descriptive protocols of Naval organizations in process;
. development of a coding methodology for recording organizational "episodes" and their descriptions;
. development of first steps toward identifying key processes linking organizational units and individ- uals; and
. development of inferences about the goals and out- comes most likely to be common to specific units and/or general across many organizational units.
ii. Procedure. Procedures which might be used in such research include the following:
. Knowledgeable enlisted men and officers serving in various types of organizational units could be asked to keep rather detailed "organizational anecdote files". In essence, they would be asked to record detailed accounts of uni t behaviors which they perceived to be either good or bad. At first, the definition of "goodness" would need to be left up to eachof the incumbent observer- recorder, the only constraint being that he describe things that had happened that involved a total unit activity rather than merely individual behaviors and actions.
. Analysis of protocols such as those obtained above would aid greatly toward defining more fully the nature of high frequency and high importance orga- nizational occurrences within the Navy. Behavioral scientists could then begin "living in" different organizational settings to observe and record similar protocols.

238.
. As more information is obtained using the quasi- systematic procedures outlined above, inferences may be drawn, tentatively at first, but more definitely as more data are accumulated about the varieties of goals implicit in the behaviors of various units and the processes by which various organizational units and actors may be linked to achieve such goals.
. Inferences about goals and processes could then be formulated more explicitly in'the form of coding methodology to standardize the recording of organizational episodes, and these methodolo- gies could be applied both by additional Naval expert observers (enlisted men and officers) in different settings and by behavioral scientists working in those same settings.
iii. Implicat ions. Admittedly, these suggestions for making on site observations of "organizational episodes" hardly look like research. We cannot emphasize too strongly, however, how sadly lacking the literature of organizational effectiveness is in terms of just this sort of observational material. Most great steps forward in science have only been possible because some "toiler in the vineyard" first provided the raw material on which to base the crude beginnings of an organized measurement and experi- menting system. In essence, we are suggesting that these observations may be one first step toward developing such "raw stuff" of organizational effec- tiveness in the Navy. Related, but somewhat more abstracted approaches to the development of such materials are suggested in additional studies below.
b. Training in the self-analysis of goals. As should be abundantly clear by now, we are persuaded that the process of goal identification and goal specification is an extremely important activity, both cogni- tively and motivationally, for organizations. Such goal specification has implications for both the dependent and the independent variable sides of the effectiveness equation. Within a goal oriented model of organizational effectiveness, the only way to develop criterion measures of effectiveness is to first determine the goals which the organization is pursuing. In addition, the very act of goal identification provides guidance for the organization as to how it should be structuring its efforts. Thus the process of goal identification and specification might also be an independent variable, or a "handle" with which organi- zational effectiveness can be changed.

239.
i. Objectives. The overall objectives of this sort of approach would be:
. develop alternative procedures for Naval organiza- tions to use to analyze their own goals;
. train samples of officers in each of the procedures;
. compare the usefulness of each procedure "in the field".
ii. Procedure. Basic assumptions on which this type of study would be based are that goal analysis is a rela- tively continuous process and that the people in the organization, not some outside consultant, should possess the means for making the analysis. The people in the organization should recognize the importance of such analysis, they should view it as a part of their responsibility, and they should have a variety of skills available for performing this function. There are at least three different procedures that officers could use to conduct a goal analysis:
. They could ask different groups in their organiza- tions to provide samples of critical incidents of what they considered to be effective and ineffective performance on the part of the organization. The goals perceived by each group could then be inferred from the sample of incidents. This would necessitate that the officers be trained in critical incident methodology. The training content would also have to include an explanation of the rationale for using this procedure (e.g., the notion of inferring goals from behavior when people are unable to articulate what they want to do), training in explaining it to others, and some actual practice in its use.
. A second approach is to ask officers to hold a series of group meetings with their subordinates in order to articulate goals directly. We think this would require considerably more skill on the part of the officer and administrator and may present a more difficult training task. All the attendant problems of group leadership and group problem solving come into play. However, in the end it may be that such a procedure would be the most "satisfying" to the participants and would be the one which would lead to most goal agreement.

240.
. A third alternative would be to teach officers and their staffs to become participant observers and actually collect observations of the behavior of the organization's decision makers. Procedures such as the ones suggested could be tried out among groups of officers in terms of:
the ease with which they can be taught to use it;
the ease with which they can use the technique with their subordinates;
the degree to which the officer feels it is an effective tool for him to use; and,
satisfaction of the subordinates with the procedure.
iii. Implications. We have argued in previous chapters that to use goals as a basis for determining performance criteria or for guiding the activities of an organization, there must exist some means for determining the specific goals of a specific organizational subunit. That is, general goal statements composed at some high level in the organization will not prove useful at lower levels. Thus individuals at those lower levels must have some available means for analyzing the goals of their own unit. If effective methods for conducting such an analysis were worked out it would make the guidance and evaluation function of goal setting much eas ier.
c. Development of dimensions of organizational effectiveness through critical incidents methodology. It's no secret that individ- uals in organizations often have difficulty articulating both the general and specific goals of the organization as well as the underlying dimensionality of effectiveness within or across organizations. Discus- sions of goals which begin on the general end and try to work toward the specifics usually get nowhere. In contrast, the critical incident approach is designed to begin by sampling specifics and to work back- wards toward the more general and the more homogeneous.
Such an approach makes very reasonable assumptions. First, goals are being pursued even if they can't be articulated clearly. Second, goals and aspects of organizational effectiveness are manifested in behavior of individuals, groups, or organizations. Third, persons who have been working in Naval organizations can think back over a rich array of experiences and describe specific instances of when organiza- tions they've been a part of have "behaved" in effective and/or ineffective ways. Recently, these assumptions and the methodology for

241
developing dimensions were tested operationally by using the critical incidents methodology to discover and develop measuring scales for evaluating organizational morale of Army units. The dimensions dis- covered in this way are listed below (each was, of course, defined and anchored firmly with the behavioral descriptions making it up):
Pride in Country, Army and Unit
Superior-Subordinate Relations
Performance and Effort
Community Relations
Reactions to Adversity
Teamwork and Cooperation
Discipline and Military Appearance
i. Objectives. The aims and objectives of this study would be as follows:
. to identify the operating goals in a variety of Naval uni ts;
. to identify similarities and differences in operating goals for different groups of personnel within the same organizational unit; and
. to develop a manageable set of criterion measures for assessing goal achievement and/or organizational unit effectiveness over a wide variety of organizational units.
ii. Procedure. The procedure proposed here is intended to represent a series of studies, of the same type, to be conducted in many different organizational units. At a minimum, it would be desirable to sample at least two units each from at least six different types of organi- zational units.
. For each unit under consideration, at least three pairs of groups of observers should be chosen. For example, on a ship, the groups could be composed of enlisted men, junior officers, and senior officers. Each group should contain from 10-20 people. Each

242,
group would meet in a small group workshop format. After some discussion of the breadth of the organi- zational effectiveness construct and the difficulties involved in measuring it, the critical incident methodology would be explained in some detail. Each participant would then be asked to write a descrip- tion of at least 5 events that to him represented effective organizational performance and at least 5 events that represented ineffective organizational performance.
The incidents contributed by each group would then be content analyzed and clustered by a 3 or k man panel of research personnel and operating personnel. The result would be a tentative cluster analysis of the critical incidents which would constitute a "first cut" at defining factors of effectiveness as a specific group sees it.
The third step would be to meet again with the groups to consider results of the tentative cluster analysis. The purpose of the ensuing discussion would be to con- sider (a) whether or not the tentative clusters make organizational sense; (b) whether or not important factors have been left out; and, (c) whether or not any of the tentative clusters overlap to such a great degree as to be conceptually indistinct. To the extent that factors which the groups feel are important remain under-represented by critical incidents, the group will be asked to write more to fill in the gaps.
The fourth step would be to carry out the retranslation step as described in Smith and Kendall (1963) and Dunnette (1966). Since a pair of groups was originally selected from each organizational level, each group would retranslate the incidents written by the other, Besides matching incidents to dimensions, the judges should also be asked to scale the importance of each incident for defining the dimension. In essence, this is asking the judge to produce a "factor loading" for each incident. At the conclusion of this step in the procedure there would be data available as to (a) how reliably incidents could be classified into dimensions; (b) how closely each incident represents the core of the factor; and, (c) the degree to which judges agree on the scaled factor loading.

2^3.
iii. Imp!ications. The major advantage of such a retrospec- tive approach has already been specified. The approach draws on the vast observational experience represented by Naval personnel over their entire Naval careers. As such, the likelihood of more fully exhausting the total domain of facets of organizational effectiveness is much greater than the series of in vivo observations proposed in 2a above. Thus, the procedures spelled out here would provide a great deal of information about the operative goals of Naval units and the degree of agree- ment about those goals among different organizational members. Currently, such data are presumed through con- jecture only. With information suggested here, Naval management could consider whether the goals upon which individual units are operating are consistent with overall Naval policy and whether discrepancies that appear have positive or negative utility. Data produced by such study should also provide considerable guidance for how to construct criterion measures of goal achieve- ment and Naval Organizational Effectiveness.
3. Psychometric-multivariate-differential studi es. The second cluster of items on our grocery list of studies involves the psychometric evaluation of both existing measures and measures which may be derivable from the studies described above.
a. Investigation of organization "health" via multi-construct, multi-method analyses. Measuring the "state of the system" is viewed by many researchers and practitioners as an important part of any attempt to determine organizational effectiveness. As evidenced by the current review, the enterprise we labeled as organizat ional development (OD) has made a number of suggestions about what state variables describe healthy or effective organizations, but agreement about the best measures of them is far from complete. Researchers interested in "organizational climate" have developed a plethora of measures but have in turn made few value judgments and offered little theory as to what "scores" constitute a state of organizational effec- tiveness. The Likert-ISR model is perhaps the only systematic research effort that has tried to do both. However, the Survey of Organizations can be faulted on the grounds that it does not possess a great deal of discriminate validity.
It is also relevant to note that none of the questionnaire measures of organizational state characteristics were constructed using Navy data, and their "carry-over" to the Navy may be questioned.
We should also note that if a decision is made that the "state of the system" should be monitored regularly, and we think such a decision

244.
would be sound, the Navy would have to have in its possession, measures of system variables that exhibited considerable construct validity. One such monitoring system does exist in the private sector (Smith, 1973); the Sears organization has come to accept the construct validity of the questionnaire measure and is more than willing to take decisive action on the basis of the data they produce.
Generating construct validity for questionnaire measures of organizational system characteristics is not an easy task, and Guion (1973) has agreed that, with regard to measures of organizational climate, it has not yet been done to a satisfactory degree.
This difficulty is magnified by the general lack of clear conceptualization or what constructs are actually under investigation. That is, even on a con- ceptual level there is very little convergent and discriminate validity. For example, what are the conceptual relationships among job satisfaction factors, organizational climate factors, and job alienation factors? No one has yet offered any very straightforward conceptual statement.
Nonetheless, there is reason to be optimistic that the plethora of instruments and indicators can, with the methodology suggested below, be reduced to fewer, more statistically sound and conceptually meaningful constructs. In fact, preliminary results of using many different "indicator" instruments in one very large organization suggests that discriminate validity across methods of measuring different types of i ndividual responses to organizational circum- stances can be "teased out". Below, for example, is the multi-construct- multi-method matrix showing results with a number of self report measures of motivation, morale, and different facets of satisfaction.
Multiconstruct - Multimethod Matrix
Mot.
1. Motivation (4 methods)
2. Overall Satisfaction (4 methods)
3. Satisfaction with the Job (5 methods)
4. Satisfaction with Superiors (3 methods)
5. Satisfaction with Co- workers (3 methods)
6. Satisfaction with Pay (4 methods)
Gen. Sat
Job Sat
Sat. Sup.
Sat. Cowork.
Sat, Pay
45
37
40
29
19
15
64
53
41
26
41
66
37
27
30
58
34
22
44
16 44

245,
The indices in the diagonals of the matrix are mean within construct correla- tions and the off-diagonal indices are mean correlations between scales or items representing different constructs.
i. Object ives. It is the aim of this particular study then, to sift through the available measures of systematic variables, weed out the obvious overlap, fill in the gaps where the available measures do not cover variables sug- gested as being important by various models, and submit the total item pool to extensive convergent and discrimi- nant analysis on Navy samples. The first product would be a comprehensive instrument that would represent the "purest" and the most complete factor structure that it is possible to achieve for Naval organizations. The measures for each factor should possess high reliability and substantial construct validity. The instrument should be applicable (perhaps in modular form) to a wide variety of organizational subunits, it should be perceived as legitimate by the users, and it should be economically feasible to administer it on regular occasions.
ii. Procedure. We should preface our remarks by assuming that there is at least some agreement within the Navy that the Naval Model of effectiveness should include indicators of one or more "state" characteristics. If this assumption is reasonable, then we believe the following procedure would be appropriate:
. The first step would be to assemble all the available measures that might be potentially useful and consider their similarities and differences, item by item. The material reviewed in Chapter V suggests that the follow- ing questionnaire measures of organization climate should be considered.
Group Dimensions Descriptive Questionnaire (Hemphill 6 Westie)
Survey of Organizations (Taylor & Bowers)
Agency Climate Questionnaire (Schneider 6 Bartlett)
Business Organizational Climate Index (Payne & Pheysey)
Litwin and Stringer Climate Questionnaire
House and Rizzo Questionnaire
Campbell and Beaty Questionnaire

246.
In addition to the climate measures, measures of job satisfaction and individual need fulfillment and work alienation should be considered. The most relevant would be:
Minnesota Satisfaction Questionnaire
Cornel] Job Description Index
Brayfield Rothe Job Satisfaction Scale
Other potential candidates that are already operationalized:
Porter and Smith's measure of Commitment
The Guion and Landy "motivation" questionnaire
The Lodahl measure of job involvement
A special category to be considered, perhaps just because of the publicity it has received, are perceptual measures of job alienation, or the "quality of working life" (Shepard & Herrick, 1972; Work in America, 1972; Senate Hearings on Worker Alienation, 1972; Seeman, 1959, 1971). There are a number of different definitions of work aliena- tion and a number of different operationalizations of the construct, and the two do not always match well. For example, even though the definition sounds different, the items used to measure alienation are often indistinguish- able from those used to measure job satisfaction as indus- trial psychologists have typically thought of it. However, to insure that no important perceptual factors are missed, we suggest that the following measures of "alienation" also be included in the item.pool.
The Pearl in alienation from work scale (Pearl in, 1962)
1 Powerlessness at work (Shepard, 1972)
Self estrangement from work (Kirsch S Lengermann, 1972)
Work alienation index (Seeman, 1967)
Shepard and Herrick alienation index (Shepard & Herrick, 1972)
The next step would be to consider carefully the array of potential indicators of system effectiveness that are

2hl.
portrayed in Table 1 in Chapter III and in Table k in Chapter IV. Many of these are already being tapped by the available measures, but some are not. For example, no operationalized measures exist for things like role and norm congruence and the degree to which there is specific goal consensus among relevant organizational measures. For unoperational- ized variables which are nevertheless thought to be potentially important, new items will have to be wr i tten.
. By careful sifting it should be possible to reduce the total bulk of measures to a pool of 250-300 items. These items must then be administered to samples of Naval personnel in a wide variety of units and from several organizational levels. It would be beneficial to think in terms of a total sample of 5,000 or more. The sample would have to be split into a developmental group and two hold out or cross validation groups.
The data from the developmental group would be used for the following operations.
1) Homogeneous factors or clusters of the items with- in each format would be tentatively identified via empirical clusters or factor analysis.
2) I terns with no significant factor loadings and items exhibiting no variance (either across units or across people -- whatever is appropriate) would be discarded. For example, organizational climate items yielding no between unit variance should be d iscarded.
iii. Implications. The usefulness of this study for further analytical procedures related to Naval organizational effec- tiveness is great. The major outcome is a yield of a few, relatively short, but "pure" construct measures of organiza- tional attributes. As such, the measures could then be available for use in conducting a continuing "audit" of the state characteristics of Naval units and subunits as they may vary over time.
b. An application of multi-dimensional scaling. With regard to criterion development, previous research suggests that (a) using organi- zations as degrees of freedom, (b) measuring each organization on a large number of component criterion variables, and (c) factor analyzing the covariation among the components is not a particularly fruitful way

248.
to proceed, particularly if there are not a large number of homogeneous organizations on which to collect data and there is no clear model to specify the criterion components that might be important. However, it is also true that decision makers frequently make judgments as to whether one organization or organizational unit is "better" than another. It should be possible to work backward from such global judgments in an attempt to uncover the ingredients that go into the global judgment. Two kinds of such ingredients are the tasks or objectives the decision makers think an organization should be pursuing and the organizational characteristics (i.e., our "state" variables) which he thinks lead to the accomplishment of the goals.
i. Objectives. The objectives of this series of studies would be:
. To use multi dimensional scaling methodology to "recover" the factors which relevant sets of decision makers use to judge whether or not an organizational unit under their jurisdiction is "effective".
. To determine how the content of the factors Naval deci- sion makers take into account might differ as a function of the organizational position of the decision maker and the overall "set" or objectives under which he is trying to decide upon a rank ordering of units in terms of their effect iveness.
i i. Procedure.
. Several relevant groups of decision makers should first be identified. It would be best if there were at least 15 judges in each group (e.g., the top echelons of a headquarter's staff or the senior command of a ship) and that each judge in a particular group have some familiar- ity with a large sample of organizational units. It would be best if each judge actually had important decision making responsibilities with regard to the organizational units under consideration.
. Each decision maker in a particular group would then be asked to judge the relative overall "effectiveness" of the organizational units in the sample. Depending on the seal ing model to be imposed (cf Shepard, Romny S Nerlove, 1972) the task usually will take one of two forms. Either a paired comparisons procedure can be used and the judge simply indicates which of each pair he thinks is more effective, or the judge uses a numerical scale to rate the relative "similarity" of each pair of organizational units in terms of their overall effectiveness.

2*»9.
. A multi dimensional scaling model can then be applied to this set of judgments to determine the number of "factors" required to explain the pattern of judgments. If effectiveness is indeed unidimensional, only one factor will be recovered. If it isn't and there are two or more relatively distinct facets of effectiveness that contribute to the judgments then the organizational units in the sample will be differentially arrayed on the factors.
. As pointed out in Chapter IV, defining the factors then becomes an ad hoc procedure in which systematic ques- tioning of the original judges or other means are used in an attempt to distinguish the characteristics of the organizational units that define each factor. Strictly speaking, these characteristics should then be cross validated to see if they can again identify the units defining each factor in a second set of judgments.
. The above procedure should be repeated with the judges under varying instructional sets. Four possibilities are: (1) peacetime-full employment economy, (2) limited war, (3) full scale war, (k) Naval budget about to be cut 10%. The most useful instructional sets to use in this series of studies should be a function of opinions of the most relevant Naval experts. That is, given the fact we can ask each judge for three judgments, which 3 sets of instructions would provide the most information, in the opinion of knowledgeable Navy personnel.
iii. Implications■ A study such as this would be one indirect method (but not the only method) for determining the factors which comprise real decision makers' definitions of the organi- zational effectiveness of Naval units when realistic type decisions are called for. If the study were repeated for different sets of decision makers and different task situations, we would begin to get a much clearer picture of the multi dimen- sionality of organizational effectiveness in specific situations,
A study similar to the one described here is currently under way. Its basic elements and some of the early results obtained are described briefly below in order to give the reader a fla- vor of how one may begin with judgments of experts and move to quantitative indicators of unit status.
c. Development of an index of organizational status. Borman and Dunnette (197*0 describe the application of quantifying methods to judg- ments derived from 23 Naval officers as a first step toward identifying and weighting key components to comprise a Naval Personnel Status Index. A description of their methodology is given here simply to provide a paradigm that should be applicable to the development of more comprehen- sive measures of organizational effectiveness or status.

250.
i. Object ives
. to develop a status index with the following properties:
capable of being expressed as a single number but retaining the identity of its significant compo- nent indicators for possible diagnostic purposes;
interpretable in an evaluative sense;
made up of components with sufficient ease of accessibility to insure a high degree of timeliness;
useful as a means of "evaluating" the relative impact of changes in personnel practices and policies or of behavioral research interventions; and,
be credible and reasonably free from danger of loss of credibility through gun decking.
ii. Procedure. The first step in selecting components for an NPSI is to generate a list of potentially useful component measures. To accomplish this, a two-day workshop was designed to generate such a list. Approximately 23 Naval officers attending the Navy Postgraduate School in Monterey, California participated in the workshop sessions. In addition, a small group of instructors at the Postgraduate School attended some or all of the sessions. The workshop group contained officers with shipboard experience in small patrol vessels, destroyers, cruisers, and carriers.
The group's experience level was high in terms of knowledge about a wide variety of potential NPSI component measures. Most officers were quite familiar with such data systems as NEC and 3M. Also, most participants were knowledgeable about the configuration of a variety of Bureau of Naval Personnel data potentially valuable for an NPSI composite. Finally, all officers knew a considerable amount about data routinely kept aboard individual ships; and, they had a good feel for possible ways to combine existing data to yield useful com- ponent measures.
Participants were divided into two subgroups to generate ideas for potential component measures. Officers in one of the sub- groups were encouraged to recall ships they had been assigned to or were familiar with and then to think about the status of that ship's personnel subsystem. Then, these officers were

251.
asked to record the cues, led them to assess the per way they did. This method 20-30 components potential ment. The leader of the o his officers generate pote directly. Thus, officers component measure ideas di group. Then, each suggest tually accepted, rejected, members. This procedure a for NPSI components.
information, or factors which sonnel status of that ship the resulted in the generation of
ly applicable to NPSI measure- ther subgroup requested that ntial NPSI component measures in this subgroup introduced rectly to others in the sub- ion was discussed and even- or refined by other group
1 so resulted in 20-30 ideas
The two leaders then pooled the ideas they had received from their groups. There was considerable overlap between the two groups' output in terms of the kinds of components suggested and even the actual measures proposed for each component. The pooling operation yielded the 29 measures or areas shown below.
1. (REENLIST) 2. (MAST) 3. (R/NR)
*». (Q/NQ)
5. (UAR) 6. (REENLIST-FT) 7. (TURNOVER) 8. (COURT) 9. (MANNING NEC)
10. (PASS RATE)
11. (REC/ELIGIBLE)
12. (COURSES)
13. (GROUP)
11». (SICK RATE)
15. (SACK TIME)
16. (MORALE)
Reenlistment rate Non-judicial punishment rate Ratio of rated to non-rated
personnel Ratio of qualified to non-qualified
personnel Unauthorized absence rate First tour reenlistment rate Long-term stability of personnel Court martial rate Manning level ratio--describing the
proportion of billets manned by qualified persons according to the NEC data system
Percent of persons taking rating exams who pass
Percent of persons who are eligible by longevity who are recommended for rating
Rate of correspondence course pa r t i c i pa t i on
Rate of participation in group activi ties
Number of times per man per ship per month sick call reports
Percent time spent sleeping while off duty
Rating of crew morale by top officers

252,
17.
18.
19. 20. 21. 22.
23.
2k.
26.
27.
28.
29.
(PERS CAPABILITY)
(LEADERSHIP)
(FOOD) (DRUGS) (ADMAT) (DISCHARGE)
(GRIEVANCE)
(MAINTENANCE)
25. (TRAINED)
Overall rating of personnel capa- bility by top officers
Perceived leadership effectiveness by crew members
Food and personal services evaluation Reported drug usage Overall Admat inspection grade Discharges other than honorable
(including reference to special BuPers Code)
Grievances directed to others outside of command (e.g., Congress)
Percentage of maintenance act ions deferred due to insufficient manning or expertise (from 3M data system)
Percent of required training completed by officers
Requests for transfer/man/unit time Satisfaction with present assignment
(as measured by confidential ques- tionnaire to sample of officers and enli sted)
Satisfaction with shipmates (as measured by confidential questionnaire to sample of officers and enlisted)
GCT + ARI + Educational Level + Mean Semi-Annual Evaluation (all scores standardized) for all or for a sample of enlisted persons averaged across the unit
These 29 components were named and listed in preparation for the next day's rating session. The second day of the workshop was devoted to two rating tasks. First, officer participants were asked to evaluate each component on five criteria of importance and utility for use in the status composite. The five criteria were: Importance; Reliability; Accessibility; General izabi1ity; and "Fudgeabi1ity". The purpose of obtaining these criterion ratings was to assess officers' perceptions of the "goodness" of each component. These opinions of component quality on a number of criteria enabled us to identify several components which showed greatest promise for contributing to an overall composite.
The second rating task required each officer to respond to one of two formats designed to estimate the intercorrelations among component measures. That is, instead of obtaining the empirical relationships among components by actually obtaining measures from a large number of ships and then computing their intercor- relations, officers were asked to provide estimates of these
(TRANSFER) ' (SAT-PA)
(SAT-SM)
(ENLIST-FIT)

253
intercorrelations. One of the formats required raters to picture a ship which stood extremely favorably along a particular component (1 of the 29)- The rater was then asked to rate from I (extremely unfavorable) to 9 (extremely favorable) the probable standing of that ship along the other 28 components. The other format was identical except that the rater was asked to picture a ship which stood extremely unfavorably on a particular component.
This rating task provided a relatively uncomplicated method for obtaining each rater's estimate of the relationships among components. Furthermore, estimates were received from a number of officers independently and from two separate rating formats.
Criterion ratings were examined for the total list of 29 components and the \h most promising were chosen for further investigation. In addition, the estimated correlations among all components were arranged in matrix form. Crude estimates of inter-rater agreement with respect to the independent rater estimates of the relationships were computed. The overall intra-class coefficient of agreement proved to be .63.
As an extremely tentative step toward exploring the possible dimensionality of the measurable personnel status domain, the correlation matrix generated by the estimates of the relationships among components was factored. For this analy- sis, only those 14 components to be investigated further were used. A principal components factor analysis was performed and the first five factors rotated using the varimax criterion, Although we must keep in mind the source of the original "cor- relations" on which this analysis is based, the results do suggest very meaningful clusters of components.
Factors
I - Fitness and Readiness of Individuals II - Discipline
III - Crew Member Attitude Toward Officers and the Navy IV - Free Time Activities V - Manning Level
Again, it must be emphasized that these factor analysis results are based on data from a correlation matrix generated in a very unusual manner. Yet, the results do suggest that it may be meaningful and useful to represent a status con- struct in terms of multiple dimensions of the type appearing above.

254.
One hundred ships differing on the \k components have now been generated by computer and will now be presented to panels of Naval experts for overall judgments of each "ship's" personnel status. An example showing four of the ships so generated is given on the following page.
In general, the data analysis will involve computing multiple regression equations for each officer in the rater group. Each equation will represent that rater's policy related to assessing the personnel status of ships. Then, we will use JAN (Christal, 1963; 1968; Naylor and Wherry, 1965) and perhaps the pm statistic to assess the similarity in raters' policies. Other analyses will be performed as necessary to develop inferences about the nature of the officer groups' com- posite policy, and about the importance of each component in Naval officers' minds for determining the state of the personnel subsystem aboard ships.
iii. Implications. We believe the procedures described above have a direct "carry-over" for the development of broader indexing procedures for total organizational effectiveness measures in the Navy and various Naval subunits. Obviously the steps mentioned to this point do not yield the finished product; however, additional steps to validate the final indexing procedures are suggested in the Borman & Dunnette (197*0 report. The reader is referred to that report for these suggestions.
d. Multivariate and policy capturing analyses of measures developed from naturalistic observation studies in 2. We do not suggest here any set of studies differing methodologically from 3a, 3b, and 3c above. However, the input of variables may differ and they may be more directly relevant to process parameters than to the more heavily goal oriented variables we have discussed so far.
i. Objectives. The purposes are:
. to examine protocols of organizational episodes gathered in 2a, the goals derived in 2b, and the critical incidents and dimensions derived in 2c for common elements and for areas not presently sampled by existing measures.
. where necessary, to develop and examine psychometrically measures and/or new reporting systems to tap elements pinpointed above.
. to determine the convergent and discriminant validities of the measures and/or reporting systems so developed.

SHIP NUMBER 001 (NO) D COMPONENT SCORES
REENLIST-FT 3 1" UAR
l««*«4 |
• «»3 |
REENLIST »«««4 |
ENLIST-FIT ««««4 |
TURNOVER «»««««5 |
LEADERSHIP «»»3 |
SAT-PA ***3 1
MAST ! ««2 |
MANNING-NEC 1 ««««4 |
COURSES I «»«3 |
DISCHARGE I »*ft«»5 |
MAINTENANCE 1 «•««4 • |
PASS RATE I 4>*««4 |
SACK TIME I •1 1
SHIP NUMBER 003 (NO) > COMPONENT SCOPES
REENLIST-FT >
MAINTENANCE
«««»««««•9 |
«»•««««7 |
REENLIST oo«oo««o«q |
COURSES •«»«»««««9 |
PASS RATE ae«ee*«7 |
MANNING-NEC ««»««5 |
SAT-PA ««««««6 |
MAST *»*3 «
LEADERSHIP «*«»**««8 |
SACK TIME o««»#««»»9 |
TURNOVER O«ftft0«««Q |
DISCHARGE «•««««5 1
UAR «««««5 |
ENLIST-FIT e«««»»»«g |
SHIP NUMBER 002 (NP) 255- COMPONENT SCORES
MAINTENANCE
REENLIST
ENLIST-FIT
SACK TIME
MANNING-NEC
DISCHARGE
MAST
TURNOVER
PASS RATE
UAR
COURSES
LEADERSHIP
REENLIST-FT
SAT-PA
»«»»4
• «»3
«•2
«««««5
«*«3
»1
«1
»1
°\ «••««««7
«••3
««»««5
SHIP NUMBER 004 <NR COMPONENT SCOPES
MANNING-NEC
REENLIST-FT
UAR
DISCHARGE
COURSES
SACK TIME
MAST
ENLIST-FIT
LEADERSHIP
REENLIST
MAINTENANCE
PASS RATE
TURNOVER
SAT-PA
o*«««5
««••»5
««»«»5
••••«•««8
0««««5
««««««««ft
«»»«««6
•*«««««7
»««««»»«8
««»««««««9
«««««5
««««««6

256.
ii. Procedures. The procedures for accomplishing the above objectives would include essentially the same analytical steps as those already described in 3a, 3b, and 3c. In other words, these "new" measures would be examined via multi-method, multi-construct analyses, and multi- dimensional and policy capturing procedures as described previously. When some subset of measures has been suf- ficiently "purified" and made reasonably accessible for continuing data collection, policy capturing and multi- dimensional scaling can, of course, be applied to real data gathered from Naval units instead of providing so- called mockups as mentioned in 3c
k. Experimental and quasi-experimental investigations. The "lever" side of organizational effectiveness; that is, learning what and how organizational actions or interventions may affect the nature of outcomes (goals) and/or the nature of organizational processes is most likely to be learned with greatest precision by conducting experimental investiga- tions. In the classic experimental paradigm, one first establishes the dependent and independent variables of interest and decides how they are to be measured or varied. Subjects are then chosen randomly from some larger and defined population and assigned by random means to two or more subgroups. Different "treatments"--representing different aspects of one or more of the independent variables — are then applied to the various groups while one or more groups remain "untreated"; that is, they serve as "controls" for the experimental procedure. Judiciously timed measure- ment of the dependent variable across the several groups and analysis of differences among the measurements yield inferences about the causal effects of different levels of the independent variable on the dependent variable.
Though elegant in conception, the above paradigm is exceedingly difficult to apply in actual field settings because of the experimental requirements for random selection and assignment of subjects and because of the likelihood of any other number of uncontrolled and unplanned "interventions" occurring differentially across groups to obfuscate the interpretation of results. The usual solution has been to "stage" laboratory experiments where things can be controlled much more fully. Such laboratory studies have proved exceedingly fruitful in helping to define parameters to be studied and in aiding, thereby, the development of theory. In particular, laboratory studies and simulations have proved useful in the area of equipment design and in answering human factors questions. However, "removal" of persons to a laboratory setting for studying organizational effectiveness is some- what more risky because the generalization of findings back to field set- tings will usually seem tenuous at best. The goals and processes of an

257-
organization of persons working in a laboratory may differ quite substan- tially from the goals and processes of organizational units in the real Navy. Clever simulations and care in generalizing can, of course, still yield good information, and we suggest an approach below that Naval re- searchers may wish to undertake.
However, in the field settings of the Navy, a better alternative will usually be one of being on the alert constantly for the opportunities to carry out quasi-experimental investigations. Of the several approaches mentioned by Campbell and Stanley (1963), Cook and Campbell (in press) and Campbell (1969), two seem most likely to yield good information for understanding different facets of organizational effectiveness in the Navy. These designs are the "interrupted time series design" and the "regression discontinuity design1" these two designs and some possible approaches with them also are discussed in regard to their possible use in the Navy on the pages that follow.
First, we wish to remind the reader that the dependent variables of interest, their measures, and their psychometric qualities will for the most part have been derived from studies already suggested under Sec- tions 2 and 3 above. In particular, to the extent that dimensions of organizational effectiveness in the Navy have been defined and various indexing procedures derived for measuring them on a continuing basis, these will serve admirably as the dependent variables to be analyzed via the experimental and quasi-experimental procedures suggested below.
a. Contrived organization studies. The idea of using contrived organizations may, at first blush, seem too "wild" to consider seri- ously. But we believe the potential for increased understanding of organizational effectiveness may be great; therefore, we outline here the broad sketch of an idea and will depend upon those who are in positions of policy decision making responsibility to consider the practical and fiscal difficulties of undertaking such experiments wi thin the Navy.
i. Objectives. The objectives of this research suggestion are many, but basically they revolve around the following rather broadly stated purposes:
. To establish long-term operational Naval units for the sole purpose of studying experimentally different aspects of organizational effectiveness;
. To evaluate dependent measures of organizational effective- ness (developed from 2. and 3. above) within the context of the Naval model mentioned in 1. but with the special advan- tages to be derived from working within a research setting which is less subject to unplanned interventions; and,

258.
. To study the variation and change in dependent measure as functions of independent variables or interventions that would be applied within the paradigm of the full experimental design methodology so that causal state- ments and tests of the Naval model may be appropriately made.
ii. Procedure. Basically the idea is to establish an actual operational "arm" (NAVORGEFF) of the Navy which would exist solely for the purpose of carrying out research studies on organizational effectiveness. The duty assignments of per- sons assigned to NAVORGEFF would not be unique. In fact, those duty assignments with special importance or which are of particular relevance to representing the functioning of the Navy would be chosen. In other words, we are not sug- gesting that the sole function of persons assigned to NAVORGEFF would be to serve as "guinea pigs" for this re- search program. In fact, they would be performing their usual functions according to their training and billet assignments. They would, however, be "protected" from the unplanned interventions of circumstance and could, there- fore, be expected to yield firm conclusions about the impact of planned interventions on organizational effective- ness. Obviously, we are hard put to specify the exact com- plement of manpower to be assigned to NAVORGEFF, but we would hope that once it is fully manned, it would consist of approximately 500 separate organizational units of from 3 to 20 persons each for a total complement in the neighbor- hood of ^,500 to 5,500 persons. It is anticipated that this be a permanent part of the Navy and that various units may be assigned to it or moved out of it as may be required by research activities and research questions.
Campbell (1969) has discussed the "experimenting society" and the concept of the "experimental administrator." In effect, we are suggesting an "experimenting Navy" commanded, if you will, by an "experimental admiral."
After the new organization had been operational for a suf- ficient period of time (say 18 months to two years), many of the studies already outlined above—especially 2a., 2c, 3c, and 3d. would be applied to the units of NAVORGEFF. The hope, of course, would be that this "experimenting Navy" through steps of naturalistic observation, critical incidents methodology, and policy capturing strategies, would yield results essentially equivalent, but in microcosm, to the results derived from the data gathering processes, in

259.
the other operating units of the Navy. If so, we would gain greatly increased confidence about the utility of using NAVORGEFF for studying experimentally the effects of changes and organizational interventions on dependent variables of consequence and its utility also for testing various elements of the Naval model of theory of organizational effectiveness mentioned in 1. above.
At that time (i.e., after the dependent variables had been developed and determined to be generalizable to NAVORGEFF and interchangeable with the Navy-in-general), experimental interventions of interest would be introduced randomly within subunits of NAVORGEFF. We cannot specify the nature of such interventions .here for they would, of necessity, be determined, in part, by the Naval model of organizational effectiveness and, in part, by procedures, policies, practices and the state of behavior science knowledge three to five years from now. Merely as suggestions, we would assume that such matters as organizational climate, leadership style, and many different OD-type interventions might be investigated (much in the vein of the Li twin-Stringer and Frederiksen studies which already have been reviewed).
iii. Implications. Though ambitious and "blue skies," the impli- cations of such an experimental total push effort as this are so great as to defy enumeration. Quite simply, the approach—over a span of perhaps ten to fifteen years of operation--would do more to define the parameters of organi- zational effectiveness than anything that we can envision. In a very important way, the implications of such a program of research are as great for the Navy and for behavioral science in general as the brilliant series of long-term longitudinal research efforts of The Management Progress Study3 have been for the study of managerial effectiveness and its correlates.
b. Natural experiments using interrupted time series. In working with intact organizational groups as the unit of analysis, experimental manipulations are often difficult or impossible because a change or "reform" is usually put into effect across the board rather than for subsets of individuals within the organization. Within any particular organization experiencing the change, therefore, the only comparison base for the dependent variable(s) is its record for a period of time prior to the intervention. The interrupted time series is a quasi- experimental design which depends on the careful analysis of the records
3 Bray, D. W., Campbell, R. J., & Grant, D. L. Formative years in business: A long-term AT&T study of managerial lives. New York: Wiley-Interscience, 197A.

260.
of the "state" measures of the organization before and after a change is instituted. An example of such a record is shown below as Figure 10 from Campbel1 (1969)•
FIG. 10. Connecticut traffic fatalities. [The so-called "treatment" in the chart above was in the form of a severe and sudden crackdown on speeding violations in the state of Connecticut. A similar, though much larger, natural experiment is occurring currently in this country in the form of reduced speed laws due to the energy crisis. Early indications are that traffic fatalities have de- clined—though, as with nearly all quasi-experimental studies, results are difficult to interpret directly as being due only to reduced speeds. The actual number of miles driven may also have been curtailed; the locus of driving patterns (e.g., urban vs. rural) may have changed; and, more small cars may be in use (which, if true, would confound the results due to the larger fatality rates com- mon to small car accidents as compared with those involving large cars). Even so, the interrupted time series can be a powerful design for deriving causal inferences when it is applied and analyzed by clever and knowledgeable inves- t i gators.]

261.
i. Objectives. The purposes of this approach are simply:
. to examine Naval records of dependent variables before and after organizational changes are instituted in order
. to derive or at least come a step closer to causal inferences about the effects of the independent vari- ables (the changes) on the dependent variables.
i i. Procedure.
. First, of course, it is necessary that Naval units utilize in a systematic and continuing way some, if not all, of the dependent indicators or "state of the system" variables discovered and developed as a result of the research sug- gestions in 2. and 3- above.
. Second, it is equally important that careful records be maintained of changes within Naval units which reflect in any way the kinds of independent variables we have dis- cussed previously in our review of the literature. Or, for that matter, it is also important to keep track of changes that, at the time of their initiation, were believed or justified by policy makers in the name of expected effects on the unit's organizational effective- ness .
. Analysis of these sets of records would then be carried out in the manner described by Campbell (1969); essen- tially the analysis simply takes the form of pre-post comparisons on the dependent measures. Readers of the present monograph are urged to reread Campbell's seminal article. We mention here only a few of the more important "cautions" he mentions in relation to the appropriate interpretation of such interrupted time series informa- tion: (a) It is important that the time series be studied over an extended period of time in order to be able to rule out effects due to maturational changes in the system or due to regression effects (effects that only "seem" to show improvement because the initiation of the change or intervention may have been a cosymptom of the treated group's condition--in other words, certain units receive OD "treatments" because they appear "sicker" to begin with); (b) It is important to be certain that the measuring system is the same throughout the analysis of the extended time series (for example, occasionally an integral part of a change is a change in the nature of the

262,
record keeping system—e.g., the collection of crime statistics.); (c) Multiple measures should be accumulated and studied to examine the possibility of unwanted side effects occurring; (d) Gradual changes should not be a subject for study because it is too difficult to fix properly the actual point in time for the pre-post com- parison; thus, the changes should be the result of abrupt and decisive actions rather than the gradual or piecemeal institution of interventions or "reforms"; and, (e) All Naval units should be examined to discover similar ones to those in which changes were instituted, and these may then constitute comparison units--natural occurring con- trol groups, as it were. [In fact, it will be remembered that several states passed 55 m.p.h. laws late in 1973 before the institution federally induced lower speed limits. This provided a number of states for use as un- treated comparison units. Statistics publicized at the time were interpreted as showing reduced fatality rates in those states which imposed the earlier laws directed at reduced speeds.]
iii. Implications. The implications need not be specified in any singular way. Quite simply, they involve the better under- standing of the causal consequences of the "lever" or inde- pendent variable side of the organizational effectiveness equation.
c. Natural experiments using regression discontinuity design. When some administrative basis is being employed for selecting organ- izational units to receive or not receive a "reform" or treatment, units scoring at or very near to the region of the cutting score should be randomly selected for the treatment. A graphic illustra- tion of this particular design is shown below modified from Figure 11 in Campbell's 1969 article:

c
g > 0)
<
0 03
ko
30
20
10 -
263.
Persons chosen randomly to receive a scholarship award.
Persons not chosen to receive the scholarship award.
70 ' So 90 l'ÖÖ 110 120 130 HO Diagnostic Scores on which award decided
50
FIG. 11. Tie-breaking experiment and regression dis- continuity analysis. [The above chart illustrates the fact of a fairly substantial relationship between status on the Diagnostic Scores and later achievement. However, it also shows that granting a scholarship award to a random subset of persons scoring at or above the Diagnostic Score of 105 was accompanied by an apparent substantial boost in the level of achieve-, ment attained by those persons.]
i. Objectives. The purposes of this approach are the same as those specified for the interrupted time series analyses with the additional purpose, however.
. To examine systematically the potential organization effectiveness effects of those organizational programs which may be in short supply or which may be too costly for Navy-wide implementation in order to provide a more informed data base for deciding in favor of or against wider implementation.
ii. Procedures. We shall not specify here any specific research plan because we are, at this stage, unaware of the many sit- uations which must exist in the Navy where the regression discontinuity design would be applicable. Thus, we offer here only a single hypothetical example. Let us imagine that a particular new team development approach has been put together and that it involves two weeks' time of all persons assigned to any particular organizational unit receiving the "treatment." Moreover, it is believed that

264.
many units may not need nor would they profit from the new approach unless they score below a certain score on some "state of the system" index or diagnostic indicator which we shall call Quality of Group Interaction.
The procedure would, in effect, then identify some subset of units scoring at or below this particular cutting score. A smaller subset of those units would be randomly selected and assigned to receive the new team development approach-- and, of course, al1 units would continue to be "tracked" in order to determine the effects on both the Quality of Inter- action variable and other dependent variables currently in use in the Naval organization.
iii. Implications. The implications of using this design, like those of the previous quasi-experimental procedure need not be specified apart from the valuable information to be gained about possible causal effects of organizational interventions on unit organizational effectiveness in the Navy.
We hope we have been able to convey the flavor of experimental and quasi experimental investigations which might be undertaken in the Navy and which, with astute observation and data gathering methods, can lead to reasonably accurate causal inferences about linkages between organiza- tional effectiveness and various independent variables, "treatments," and interventions. We have necessarily been sketchy and somewhat in- complete in these suggestions, but we offer them merely as methodo- logical illustrations of what can be done rather than as completely specified and substantively defined plans of research.

265,
References
Aaker, D. , 6 Day, G. Corporate responses to consumer pressures. Harvard Business Review, Nov.-Dec, 1972, 50 (6), \]k-]Zk.
Ackoff, R. L. Science in the systems age: Beyond IE, OR, and MS. Opera- tions Research, 1973, 21, 661-671.
Ackoff, R. L., £ Sasieni, M. W. Fundamentals of operations research. New York: Wiley, 1968.
Aiken, M., £ Hage, J. Organizational alienation: A comparative analysis. American Sociological Review, 1966, 31, A97"507-
Aiken, M., 6 Hage, J. Organizational interdependence and intra-organiza- tional structure. American Sociological Review, 1968, 33, 912-930.
Aiken, M. , 6 Hage, J. The organic organization and innovation. Sociology, 1971, 5, 63-82.
Albert, B. S. Cost effectiveness evaluation for mixes of Naval Air Weapons Systems. Operations Research, 1963, 11, 173"l89.
Aldrich, H. E. Technology and organizational structure: A reexamination of the findings of the Aston group. Administrative Science Quarterly, 1972, 17, 26-i»3.
Anderson, T. R., & Warkov, S. Organizational size and functional complexity: A study of administration in hospitals. American Sociological Review, 1961, 26, 23-38.
Andrews, J. D. W. The achievement motive and advancement in two types of organizations. Journal of Personality and Social Psychology, 1967, 6, 163-169.
Ansoff, H. I., £ Brandenburg, R. G. A language for organization design: Part I. Management Science, 1971, 17, B-705-B-716. (a)
Ansoff, H. I., £ Brandenburg, R. G. A language for organization design: Part II. Management Science, 1971, 17, B-717-B-731 . (b)
Aram, J. D., Morgan, C. P., £ Esbeck, E. S. Relation of collaborative interpersonal relationships to individual satisfaction and organizational performance. Administrative Science Quarterly, 1971, 16, 289-296.

266.
Argyris, C. Integrating the individual and the organization. New York: Wiley, 1964.
Argyris, C. Some unintended consequences of rigorous research. Psychological Bulletin, 1968, 70, 185-197.
Arrow, K. J. Control in large organizations. Management Science, 1964, 10, 397-408.
Astin, A. W. An empirical characterization of higher educational insti- tutions. Journal of Educational Psychology, 1962, 53, 224-235.
Astin, A. W. Undergraduate achievement and institutional "excellence." Science, 1968, 161, 661-668.
Astin, A. W., 6 Holland, J. L. The environmental assessment technique: A way to measure college environments. Journal of Educational Psychology, 1961, 52, 308-316.
Bachman, J. G., Smith, C. G., 6 Slesinger, J. A. Control, performance, and satisfaction: An analysis of structural and individual effects. Journal of Personality and Social Psychology, 1966, 4 (2), 127-136.
Barker, R. G., 6 Wright, H. F. Midwest and its children. New York: Harper S Row, 1955-
Baum, B. H., Sorenson, P. F., & Place, W. S. Patterns of consensus in the perception of organizational control. Sociological Quarterly, 1969, 10, 335-341.
Becker, H. S. Problems of inference and proof in participant evaluation. American Sociological Review, 1958, 23, 6-12.
-Beckhard, R. Organizational development: Strategies and models. Reading, Mass.: Addison-Wesley, 1969.
Beek, H. G. The influence of assembly line organization on output, quality, and morale. Occupational Psychology, 1964, 38, 161-172.
Beer, M. The technology of organization development. In M. D. Dunnette (Ed.), Handbook of industrial and organizational psychology. Chicago: Rand McNally, in press.
Beer, M., 6 Huse, E. F. A systems approach to organization development. Journal of Applied Behavioral Science, 1972, 8, 79-101.
Benedict, B. A., Calder, P. H., Callahan, D. M. , Hornstein, H. A., & Miles, M.B. The clinical-experimental approach to assessing organiza- tional change. Journal of Applied Behavioral Science, 1967, 3, 347-380.

267.
Bennis, W. G. Theory and method in applying behavioral science to planned organizational change. Journal of Applied Behavioral Science, 1965, I, 337-360.
Bennis, W. G. Organization development: Its nature, origins, and prospects, Reading, MassTi Addison-Wesley, 1969.
Bennis, W. G. Towards a truly scientific management. In J. Ghorpade (Ed.), Assessment of organizational effectiveness. Pacific Palisades, Calif.: Goodyear, 1971.
Berkowitz, N. H., S Bennis, W. G. Interaction patterns in formal service- oriented organizations. Administrative Science Quarterly, 1961, 6, 25-50.
Berrien, F. K. General and social systems. New Brunswick, N. J.: Rutgers University Press, 1968.
Blake, R. R., 6 Mouton, J. S. Corporate excellence through grid orienta- tion development. Houston: Gulf Publishing.Co., 1968.
Blake, R. R., 6 Mouton, J. S. Building a dynamic corporation through grid organization development. Reading, Mass.: Addison-Wesley, 1969.
Blankenship, V. L., 6 Miles, R. E. Organizational structure and managerial decision behavior. Administrative Science Quarterly, 1968, 13, 106-120.
Blau, P. M. The dynamics of bureaucracy. Chicago: The University of Chicago Press , 1955.
Blau, P. M. The hierarchy of authority in organizations. American Journal of Sociology, 1968, 73, 453-^67.
Blau, P. M., Heydebrand, W. V., £ Stauffer, R. E. The structure of small bureaucracies. American Sociological Review, 1966, 31, 179-192.
Blau, P. M., 6 Scott, W. R. Formal organizations. San Francisco: Chandler Publishing Co., 1962.
Blalock, H. M., Jr. Causal inference in nonexperimental research. Chapel Hill, N. C: University of North Carolina Press, 1964.
Blood, M., £ Hulin, C. Alienation, environmental characteristics, and worker responses. Journal of Applied Psychology, 1967, 51, 28^-290.
Blum, M. L., £ Naylor, J. C. Industrial psychology: Its theoretical and social foundations. New York": Harper £ Row, 1968.
Bond, N. Auditing change: The technology of measuring change'. In M. D. Dunnette (Ed.), Work and nonwork in the year 2001. (Ch. 10) Monterey, Calif.: Brooks-Cole, 1973-

268.
Bonjean, C. M., & Grimes, M. D. Bureaucracy and alienation: A dimen- sional approach. Social Forces, 1970, 48, 365-373-
Borman, W. C, & Dunnette, M. D. Selection of components to comprise a Naval Personnel Status Index (NPSI) and a strategy for investigating their relative importance. Final Technical Report, 1974, ONR Contract N00014-73-C-0210, NR156-020. Minneapolis: Personnel Decisions, Inc.
Bowers, D. G. Organizational control in an insurance company. Sociometry, 196*», 27, 230-244.
■Bowers, D. G. , & Seashore, S. Predicting organizational effectiveness with a four-factor theory of leadership. Administrative Science Quar- terly, 1966, 11, 238-263.
Box, S., & Cotgrove, S. The productivity of scientists in industrial research laboratories. Sociology, 1968, 2, 163_172.
Bradford, L. P., Gibb, J. R., & Benne, K. D. (Eds.) T-group theory and laboratory method: Innovation in re-education. New York: Wiley, 1964.
Britt, D. , & GaHe, 0. R. Industrial conflict and unionization. Ameri can Sociological Review, 1972, 37, 46-57
Brummet, R. L., Flamholtz, E. G., & Pyle, W. C. Human resource measurement— a challenge for accountants. The Accounting Review, 1968, 43 (2), 217-224.
Burke, R. J. Methods of managing superior-subordinate conflict: Their effectiveness and consequences. Canadian Journal of Behavioral Science, 1970, 2 (2), 124-135.
Burke, W. W. Organizational development. Professional Psychology, 1973, 4, 194-199.
Burns, T. Management in action. Operational Research Quarterly, 1957, 8, 45-60.
Burns, T. Micropolitics : Mechanisms of institutional change. Admin istra- tive Science Quarterly, 1961, 6, 257-281.
Burns, T., & Stalker, G. The management of innovation. London: Tavistock, 1961.
Cadwallader, M. L. The cybernetic analysis of change in complex social organizations. American Journal of Sociology, 1959-1960, 65, 154-157.
Campbell, D. T. Reforms as experiments. American Psychologist, 1969, 24,
409-429.

269.
Campbell, D. T., £ Fiske, D. W. Convergent and discriminant validation by the multitrait-multimethod matrix. Psychological Bui let in, 1959, 59, 81-105.
Campbell, D. T., 6 Stanley, J. C. Experimental and quas i-experimental designs for research. Chicago: Rand McNally, 1966.
Campbell, J. P., & Beaty, E. E. Organizational climate: Its measurement and relationship to work group, performance. Paper presented at the ■— meeting of the American Psychological Association, Washington, D. C., September, 1971•
Campbell, J. P., Dunnette, M. D. , Arvey, R. D., & Hellervik, L. W. The development and evaluation of behaviorally based rating scales. Journal of Applied Psychology, 1973, 57, 15-23-
Campbell, J. P., Dunnette, M. D. , Lawler, E. E., S Weick, K. E. Managerial behavior, performance, and effectiveness. New York: McGraw-Hill, 1970.
Caplow, T. Principles of organization. New York: Harcourt, Brace, and World, Inc., 1961».
Carlson, S. Executive behavior: A study of the workload and the working methods of managing directors"! Stockholm: Stromberg, 1951 .
Carpenter, H. H. Formal organizational structural factors and perceived job satisfaction of classroom teachers. Administrative Science Quarterly, 1971, 16, ^60-465.
Carroll, S., S Tosi, H. Management by objectives. Homewood, 111.: Irwin- Dorsey, 1973-
Caywood, T. E. How can we improve operations research? Operations Research, 1970, 18, 569-576.
Chase, S. B., Jr. (Ed.) Problems in public expenditure analysis. Washing- ton, D. C: Brookings Institution, 1968.
Child, J. Organizational structure, environment, and performance: The role of strategic choice. Sociology, 1972, 6, 1-22. (a)
Child, J. Organizational structure and strategies of control: A replica- tion of the Aston study. Administrative Science Quarterly, 1972, 17, 163-177. (b)
Child, J. Strategies of control and organizational behavior. Administra- tive Science Quarterly, 1973, 18, 1—17-

270.
Child, J. , & Mansfield, R. Technology, size, and organization structure. Sociology, 1972, 6, 369-393-
Chi Ids, M. , £ Wolfe, H. A decision and value approach to research per- sonnel allocation. Management Science, 1972, 18, B-269-B-278. .1
Christal, R. E. JAN: A technique for analyzing individual and group judgment. Lackland Air Force Base, Texas: 6570th Personnel Research Laboratory, Aerospace Medical Division, February, 1973- (PRL-TDR-63_3, ASTIA Document AD-403 813).
Christal, R. E. Selecting a harem--and other applications of the policy capturing model. Journal of Experimental Education, 1968, 36, 35-4l.
Cleland, D. I. Why project management? Business Horizons, 1964, 7(4), 81-88.
Coch, L., & French, J. R. P. Overcoming resistance to change. Human Relations, 1948, 1, 512-532.
Cohen, R. Students and colleges: Need-press dimensions for the develop- ment of a common framework for characterizing students and colleges. Unpublished Ph.D. dissertation, Syracuse University, 1963. Cited in G. G. Stern, People in context: Measuring person-environment congruence in education and industry. New York: Wiley, 1970.
Cook, T'. D., & Campbell, D. T. The design and conduct of quas i-experiments and true experiments in field settings. In M. D. Dunnette (Ed.) Handbook of industrial and organizational psychology. Chicago: Rand McNally, in press.
Davis, L. E., & Valfer, E. S. Studies in supervisory job design. Human Relations, 1966, 19, 339-352.
Dean, B. V., 5 Mishry, M. J. Scoring and profitability models for evalu- ating and selecting engineering projects. Operations Research, 1965, 13, 550-569.
Dermer, J., & Siegel, J. P. The role of behavioral measures in accounting for human resources. The Accounting Review, 1974, 49, 88-97-
Dorfman, R. (Ed.) Measuring benefits of government investments. Washing- ton, D. C.: Brookings Inst i tut ion , 1965-
Drabek, T. E-, 6 Haas, J. E. Laboratory simulation of organizational stress. American Sociological Review, 1969, 34, 223-238.
Dubin, R., S Spray, S. L. Executive behavior and interaction. Industrial Relations, 1964, 3, 99-108.

271.
Duncan, 0. D. Path analysis: Sociological example. American Journal of Sociology, 1966, 72, 1-16.
Dunnette, M. D. A note on THE criterion. Journal of Applied Psychology, 1963, 47, 251-254.
Dunnette, M. D. Personnel selection and placement. Belmont, Calif.: Wadsworth, 1966.
Dunnette, M.D. Just technicians? No! Clever technicians? Yes! Un- published paper, Bowling Green Symposium, December, 1970.
Dunnette, M. D., Milkovich, G. T., & Motowidlo, S. J. Possible approaches for development of a Naval Personnel Status Index (NPSl). Interim Technical Report, July, 1973, Personnel Decisions, Inc., Minneapolis, Minnesota.
Eckenrode, R. T. Weighting multiple criteria. Management Science, 1965, 12, 180-193.
Eitzen, S. D., S Yetman, N. R. Managerial change, longevity, and organi- zational effectiveness. Administrative Science Quarterly, 1972, 17, •110-117.
Engel, J. H. Brains and personality. Operations Research. 1969, 17, 761-769.
Etzioni, A. A comparative analysis of complex organizations. New York: The Free Press, 1961.
Evan, W. M. A systems model of organizational climate. In R. Taguri & v.v_Y G. LI twin (Eds.), Organizational climate and explorations of a concept ."""/v^ Boston: Harvard University Press, 1968.
Fanshel, S., £ Bush, J. W. A health-status index and its application to health-services outcomes. Operations Research, 1970, 18, 1021 - 1066-
Fenn,. D., & Yankelovich, D. Responding to the employee voice. Harvard Business Review, May-June, 1972, 50(3), 83-91.
Flamholtz, E. Should your organization attempt to value its human resources? California Management Review, 1971, 14(2), 40-55. (a)
Flamholtz, E. A model for human resource valuation: A stochastic process with service rewards. The Accounting Review, 1971, 46, 253_267. (b)
Flamholtz, E. Toward a theory of human resource value in formal organiza- tions. The Accounting Review, 1972, 47, 666-679-

272.
Folgi, L., Hulin, C. L., £ Blood, M. Development of first level behavioral job criterion. Journal of Applied Psychology, 1971, 55, 3-8.
Ford, R. N. Motivation through work itself. New York: American Manage- ment Association, 1969-
Franklin, J. L. A path analytic approach to describing caused relation- ships among social psychological variables in multi-level organizations. Technical Report for Office of Naval Research, 1973, University of Michigan, Institute for Social Research.
Frederiksen, N., Jensen, 0., Beaton, A., 5 Blaxom, B. Prediction of organizational behavior. New York: Pergamon, 1972.
French, J. R. P., & Raven, B. The bases of social power. In D. Cart- wright & A. Zander (Eds.), Group dynamics: Research and theory. New York: Harper & Row, 1968.
French, W. Organization development: Objectives, assumptions and strategies. In N. Margul ies & A. P. Raia (Eds.), Organ izat ional development: Values, processes, and technology. New York: McGraw- Hill, 1972.
rench, W. , & Bell, C. H., Jr. Organization development: Behavioral science intervention for organization improvement. Englewood Cliffs, N. J. : Prentice Hal 1, 1973.
Friedlander, F. Performance and interactional dimensions of organiza- tional work groups. Journal of Applied Psychology, 1966, 50, 257"265.
Friedlander, F. The impact of organizational training laboratories upon the effectiveness and interaction of ongoing work groups. Personnel Psychology, 1967, 20, 289-307-
Friedlander, F., & Greenberg, S. Effect of job attitudes, training, and organizational climate on the performance of the hard-core unemployed. Journal of Applied Psychology, 1971, 55, 287-295-
>*L • Friedlander, F., 6 Margulies, N. Multiple impacts of organizational climate and individual value systems upon job satisfaction. Personnel Psychology, 1969, 22, 171-183.
Friedlander, F., & Pickle, H. Components of effectiveness in small organizations. Administrative Science Quarterly, 1968, 13, 289~30A.
Fullan, M. Industrial technology and worker integration in the organiza- tion. American Sociological Review, 1970, 35, 1028-1039-

273.
Geoffrion, A. M., Dyer, J. S., £ Feinberg, A. An interactive approach for multi-criterion optimization, with an application to the operation of an academic department. Management Science, 1972, 19, 357-368.
Georgopoulos, B. S. Normative structure variables and organizational behavior. Human Relations, 1965, 18(2), 155-169.
Georgopoulos, B. S., & Tannenbaum, A. S. Study of organizational effec- tiveness. In J. Ghorpade (Ed.), Assessment of Organizational effective- ness ■ Pacific Palisades, Calif.: Goodyear, 1971-
Ghiselli, E. E. Exploration in managerial talent. Pacific Palisades, Calif.: Goodyear, 1971.
Ghiselli, E. E. Dimensional problems of criteria. Journal of Applied Psychology, 1956, **0, 1-4.
Ghorpade, J. Assessment of organizational effectiveness. Pacific Palisades, Calif.: Goodyear, 1971-
Gibb, J. R. Communication and productivity. Personnel Administration, 1964, 27(1), 9-13.
Glaser, E. M., & Backer, T. E. A clinical approach to program evaluation. Evaluation, 1972, 1(1), 54-59-
Glaser, E. M., 6 Backer, T. E. A look at participant-observation. Evalu- ation, 1973, 1(3), 46-49.
Glennon, R. Issues in the evaluation of manpower programs. In P. Rossi, & W. William (Eds.), Evaluating social programs: Theory, practice, and poli tics. New York: Seminar Press, 1972.
Gomson, A. Organizational responses to members. Sociological Quarterly, 1968, 9, 139-1^9.
Goodman, R. A. Organizational preference in research and development. Human Relations, 1970, 23, 279-298.
Gouldner, A. W. Patterns of industrial bureaucracy. Glencoe, 111.: Free Press, 1951».
Grusky, 0. Managerial succession and organizational effectiveness. American Journal of Sociology, 1963-1964, 69, 21-31.
Guba, E. G. Morale and satisfaction: A study in past-future time per- spective. Administrative Science Quarterly, 1958, 3, 195-209.

274.
Hackman, J. R., 6 Lawler, E. E. Employee reactions to job characteristics. Journal of Applied Psychology, 1971, 55, 259-286.
Hage, J. An axiomatic theory of organizations. Administrative Science Quarterly, 1965, 10, 289"320.
Hage, J., 5 Aiken, M. Relationship of centralization to other structural properties. Administrative Science Quarterly, 1967, 12, 72-92. (a)
Hage, J., & Aiken, M. Program change and organizational properties: A comparative analysis. American Journal of Sociology, 1967, 72, 503~519- (b)
Hage J., & Aiken, M. Routine technology, social structure, and organiza- tional goals. Administrative Science Quarterly, 1969, 14, 366-376.
Hall, D. T., & Lawler, E. E. Job characteristics and pressures and the organizational integration of professionals. Administrative Science Quarterly, 1970, 15, 271-281.
Hall, R. H. Intraorganizational structural variation: Application of the bureaucratic model. Administrative Science Quarterly, 1962, 7, 295-308.
Hall, R. H. The concept of bureaucracy: An empirical assessment. American Journal of Sociology, 1963, 69, 32-40.
Hall, R. H., Haas, J. E., & Johnson, N. J. Organizational size, com- plexity, and formalization. American Sociological Review, 1967, 32, 903-912.
Hall, W. Corporate strategic planning--some perspectives for the future. Michigan Business Review, 1972, 24(1), 16-21.
Halpin, A. W., & Croft, D. B. The organizational climate of schools. Mimeographed report, June, 1962.
Hastings, A., & Hinings, G. R. Role relations and value adaptation: A study of the professional accountant in industry. Sociology, 1970, 4, 353-367-
Hatry, H. P. Measuring the effectiveness of nondefense public programs. Operations Research, 1970, 18, 772-784.
Hayward, P. The measurement of combat effectiveness. Operations Research, 1968, 16, 314-323.
Heise, D. R. Problems in path analysis and causal inference. In E. F. Borgatta £ G. W. Bohrnstedt (Eds.), Sociological Methodology. San Francisco: Jossey-Bass, 1969-

275.
Heise, D. R. How do I know my data? Let me count the ways. Administra- tive Science Quarterly, 1972, 17, 58-61. -7
Hemphill, J. K., & Westie, C. N. The measurement of group dimentions. _ Journal of Psychology, 1950, 29, 325~342.
Henderson, B., & Dearden, J. New systems for divisional control. Harvard Business Review, I966, 44(5), 144-160.
Henry, H. Formal long-range planning and corporate performance. Mich igan Business Review, 1968, 20(5), 24-31.
Herman, J. B., & Hulin, C. L. Studying organizational attitudes from individual and organizational frames of reference. Organizational Behavior and Human Performance, 1972, 8, 84-108.
Hickson, D. J., Pugh, D. S., & Pheysey, D. C. Operations technology and organization structure: An empirical reappraisal. Admin istrat ive Science Quarterly, 1969, 14, 378-397-
£ Hilton, G. Causal ihference analysis: A(T$>ductive process. Administrative
Science Quarterly, 1972, 17, 44-54.
Hinings, C. R., & Lee, G. L. Dimensions of organization structure and their context: A replication. Sociology, 1971, 5, 83~95-
Hitch, C. J. Decision making for defense. Berkeley, Calif.: University of Cali fornia Press , 1965-
Home, J. H., S Lupton, T. The work activities of middle managers. Journal of Management Studies, 1965, 1. 14-33-
Hornstein, H. A., Bunker, B. B., Burke, W. W. , Gines, M. , & Lewicki, R. J. Social intervention: A social science approach. New York: Free Press,
1971.
House, R. J., & Rizzo, J. R. Toward the measurement of organizational practices: Scale development and validation. Journal of Applied Psy- chology, 1972, 56, 388-396. (a)
House, R. J., & Rizzo, J. R. Role conflict and ambiguity as critical variables in a model of organizational behavior. Organizational Behavior and Human Performance, 1972, 7, 467-505- (b)
Hulin, C. , 6 Blood, M. Job enlargement, individual differences, and worker responses. Psychological Bulletin, 1968, 69, 41-55.
•**

27r..
Humber, W. J. Psychologists in administration (A symposium): II. Major factors affecting organizational health. Personnel Psychology, I960, 13, 263-275-
1
Humble, J. W. (Ed.) Management by objectives in action. New York: McGraw- Hill, 1970.
Indik, B. Toward an effective theory of organization behavior. Personnel Administration, 1970, 31(A), 51-57-
Indik, B., Georgopoulos, B., & Seashore, S. E. Superior-subordinate relationships and performance. Personnel Psychology, 1961 , 14, 357-37*».
Inkson, J. H., Pugh, D. S., 6 Hickson, D. J. Organization context and structure: An abbreviated replication. Administrative Science Quar- terly, 1970, 15, 318-329.
Ivancevich, J. M., 6 Donnelly, J. H. Leader influence and performance. Personnel Psychology, 1970, 23, 539-549.
Johnson, R. A., Kast, F. E., & Rosenzweig, J. E. The theory and manage- ment of systems. (2nd ed.) New York: McGraw-Hill, 1968.
* Kast, F. E., & Rosenzweig, J. E. Organization and management: A systems approach. New York: McGraw-Hill, 1970.
Katz, D., £ Kahn, R. The social psychology of organizations. New York: Wiley, 1966.
Katz, D., & Kahn, R. The concept of organizational effectiveness. In J. Ghorpade (Ed.), Assessment of organizational effectiveness. Pacific Palisades, Calif.: Goodyear, 1971.
Katz, D., Maccoby, N., & Morse, N. Productivity, supervision, and morale in an office situation. Ann Arbor, Mich.: Institute for Social Re- search, 1950.
Katzell, R. A., Barrett, R. S., & Parkter, T. C. Job satisfaction, job performance, and situational characteristics. Journal of Applied Psychology, 1961, 45, 65~72.
Kavcic, B., Rus, V., & Tannenbaum, A. S. Control, participation, and effectiveness in four Yugoslav industrial organizations. Administrative Science Quarterly, 1971, 16, 74-87.
277.
King, W. R. A stochastic personnel assignment model. Operations Research, 1965, 13, 67-82.
Kirsch, B. A., & Lengermann, J. J. An empirical test of Robert Blauner's ideas on alienation in work as applied to different type jobs in a white collar setting. Sociology and Social Research, 1972, 56, 180-19*».
Korman, A. K. Organizational achievement, aggression, and creativity: Some suggestions toward an integrated theory. Organizational Behavior and Human Performance, 1971, 6, 590-613-
Kuin, P. Management performance in business and public administration. Academy of Management Journal, 1968, 11, 371-377.
Land, K. Principles of path analysis. In E. F. Borgatta & G. W. Bohrn- stedt (Eds.), Sociological methodology. San Francisco: Jossey-Bass, 1969.
Landy, F. J., 6 Guion, R. M. Development of scales for the measurement of work motivation. Organizational Behavior and Human Performance, 1970, 5, 93-102.
Lawrence, P. R., 6 Lorsch, J. W. Differentiation and integration in com- plex organizations. Administrative Science Quarterly, 1967, 12, 1-^7.
Lesieur, F. G., & Puckett, E. S. The Scanlon plan has proven itself. Harvard Business Review, 1969, ^7(5), 109-118.
Lev, B., 6 Schwartz,'A. On the use of the economic concept of human capital in financial statements. Accounting Review, 1971, *»6, 103-112.
Levine, E. L., & Kutzell, R. A. Effects of variations in control structure on group performance and satisfaction: A laboratory study. Proceedings of the 79th Annual Convention of American Psychological Association, 1971, ^75-^76.
Lieberson, S., & O'Connor, J. Leadership and organizational performance. American Sociological Review, 1972, 37, 117-130.
Likert, R. New patterns of management. New York: McGraw-Hill, 1961.
Ö Likert, R. The human organization. New York: McGraw-Hill, 1967-
Likert, R., & Bowers, D. Organizational theory and human resource accounting. American Psychologist, 1969, 2*», 585~592.

278.
^*- Li twin, G. H., & Stringer, R. Motivation and organizational climate. y- Boston: Harvard University Press, 1968.
Locke, E. Z. Toward a theory of task motivation and incentive. Organiza- tional Behavior and Human Performance, 1968, 3, 157-189.
Lodahl, T. M., 5 Porter, L. W. Psychometric score patterns, social char- acteristics, and productivity of small industrial work groups. Journal of Applied Psychology, 1961, 45, 73"79-
Macleod, R. K. Program budgeting works in nonprofit institutions. Harvard Bus iness Review, September-October, 1971, 49(5), 46-56.
Mahoney, T., 5 Weitzel, W. Managerial models of organizational effective- ness. Administrative Science Quarterly, 1969, 14, 357-365-
Mangum, G. L. Manpower research and manpower policy. In Industrial Relations Research Association, A review of industrial relations research. (Vol. 2) Madison, Wisconsin, 1971.
March, J. G., & Simon, H. A. Organizat ions. New York: Wiley, 1958.
Marcus, P. Group cohesion and worker productivity. Personnel Administra- tion, 1962, 25(3), 44-48.
Margulies, N., & Raia, A. P. (Eds.) Organizational development: Values, process, and technology. New York: McGraw-Hill, 1972.
McClelland, D. C, Atkinson, J. W. , Clark, R. A., & Lowell, E. L. The achievement motive. New York: Appleton-Century Crofts, 1953-
McGregor, D. The human side of enterprise. New York: McGraw-Hill, I960.
McNeil, K. , & Thompson, J. D. The regeneration of social organizations. American Sociological Review, 1971, 36, 624-637-
Meltzer, L. , S Salter, J. Organizational structure and the performance and job satisfaction of physiologists. American Sociological Review, 1962, 27, 351-362.
Meyer, H. H., Kay, E., & French, J. R. P. Split roles in performance appraisal. Harvard Business Review, 1965, 43(1), 123-129.
Meyer, M. W. Expertness and span of control. American Sociological Review, 1968, 33, 944-951.
Mulder, M. , Ritsema, J., 6 deJong, R. An organization in crisis and non- crisis situations. Human Relations, 1971, 24, 19-41.

279.
Naylor, J. C., & Wherry, R. J. The use of simulated stimuli and the "JAN" technique to capture and cluster the policies of raters. Educational and Psychological Measurement, 1965, 25, 969-986.
Nealey, S. M., & Blood, M. R. Leadership performance of nursing super- visors at two organizational levels. Journal of Applied Psychology, 1968, 52, 414-1*27.
Oaklander, H., & Fleishman, E. A. Patterns of leadership related to organ- izational stress in hospital settings. Administrative Science Quarterly, 1963, 8, 520-532.
Odiorne, G. S. Management by objective: A system of managerial leadership. New York: Pitman, 1965.
Odiorne, G. S. Management decisions by objectives. Englewood Cliffs, N. J.: Prentice-Hal 1, 1969-
Odiorne, G. S. Training by objectives. New York: Macmi1 Ian , 1970.
Odiorne, G. S. Personnel management by objectives. Homewood, 111.: Irwin, 1971.
Olmstead, J. A. Factors in organization effectiveness. Paper presented at Human Resources Research Organization, AD 743152, January, 1972.
Pace, C. R. The measurement of college environments. In R.Taguiri £ G. Li twin (Eds.), Organizational climate: Explorations of a concept. Boston: Harvard University Press, 1968.
Pace, C. R., 6 Stern, G. G. An approach to the measurement of psychological characteristics of college environments. Journal of Educational Psychology,
1958, 49, 269-277-
Packer, A. H. Applying cost effectiveness concepts to the community health system. Operations Research, 1968, 16, 227-254.
Parker, T. C. Relationships among measures of supervisory behavior, group behavior, and situational characteristics. Personnel Psychology, 1963, 16, 319-334.
Parker, T. C. The psychological environment and work group behavior. Per- sonnel Administration, 1965, 28(5), 26-31.
Payne, R. L., & Mansfield, R. Relationships of perceptions of organizational climate to organizational structure, context, and hierarchical position. Administrative Science Quarterly, 1973, 18, 515_526. \

280.
Payne, R. L., 6 Pheysey, D. C. G. G. Stern's organizational climate Index: A reconceptualization and application to business organizations. Organ- izational Behavior and Human Performance, 1971, 6, 77"98.
Payne, R. L., & Pugh, D. S. Organizational structure and climate. In M. D. Dunnette (Ed.), Handbook of industrial and organizational psychology. Chicago: Rand McNally, in press.
Pearlin, L. Alienation from work. American Sociological Review, 1962, 27, 314-326.
Perrow, C. A framework for the comparative analysis of organizations. American Sociological Review, 1967, 32, 194-208.
Pervin, L. A. A twenty-college study of student X college interaction using TAPE (Transactional Analysis of Personality and Environment): Rationale, reliability, and validity. Journal of Educational Psychology, 1967, 58, 290-302.
Pervin, L. A. Performance and satisfaction as a function of individual- environment fit. Psychological Bulletin, 1968, 69, 56-68.
Pheysey, D. C, Payne, R. L. , & Pugh, D. S. Influence of structure at organizational and group levels. Administrative Science Quarterly, 1971, 16, 61-73-
Popper, R., £ Miller, W. H. METRI personnel readiness measurement. New York: Clark, Cooper, Field, & Woh1, Inc., 1965.
Porter, L. W. , Crampon, W. J., & Smith, F. J. Organizational commitment and managerial turnover. Technical Report No. 13, 1972, University of California, Irvine, Individual Organizational Linkages Research Project.
Porter, L. W., S Lawler, E. E. Properties of organization structure in relation to job attitudes and job behavior. Psychological Bulletin, 1965, 64, 23-51.
Price, J. L. Organizational effectiveness. Homewood, 111.: Irwin, 1968.
Prien, E. P., & Ronan, W. W. An analysis of organization characteristics. Organizational Behavior and Human Performance, 1971, 6, 215-234.
Pritchard, R. L., & Karasick, B. S. The effects of organizational climate on managerial job performance and job satisfaction. Organ i zational Behavior and Human Performance, 1973, 9, 126-146.

281.
Pugh,. D. S., Hickson, D. J., & Hinings, C. R. An empirical taxonomy of structures of work organizations. Administrative Science Quarterly, 1969, 14, 115-126.
Pugh, D. S., Hickson, D. J., Hinings, C. R., MacDonald, K. M., Turner, C. , & Lupton, T. A conceptual scheme for organizational analysis. Adminis- trative Science Quarterly, 1963, 8, 289-315.
Pugh, D. S., Hickson, D. J., Hinings, C. R., & Turner, C. Dimensions of organization structure. Administrative Science Quarterly, 1968, 13, 65-105.
Pugh, D. S., Hickson, D. J., Hinings, C. R., S Turner, C. The context of organizational structures. Administrative Science Quarterly, 1969, 14, 91-114.
Pyle, W. Monitoring human resources--"on line." Michigan Business Review, 1970, 22(4) , 19-32.
Reufli, T. W. Behavioral externalities in decentralized organizations. Management Science, 1971, 9, B-649-B-658.
Ritti, R. R., & Goldner, F. H. Professional pluralism in an industrial organization. Management Science, 1969, 16, B-233-B-246.
Rivlin, A. M. Systematic thinking for social action. Washington, D. C. : The Brookings Institution, 1971-
Rizzo, J. R., House, R. J., & Lirtzman, S. I. Role conflict and ambiguity in complex organizations. Administrative Science Quarterly, 1970, 15,
150-163.
Roethlisberger, F. J., S Dickson, W. J. Management and the worker. Boston: Harvard University Press, 1939-
Ronan, W. W., & Prien, E. P. An analysis of organizational behavior and organizational performance. Organizational Behavior and Human Performance,
1973, 9, 78-99.
Rosen, N. Open systems theory in an organizational subsystem: A field experiment. Organizational Behavior and Human Performance, 1970, 5,
245-265.
Rowland, K. M., & Scott, E. W., Jr. Psychological attributes of effective leadership in a formal organization. Personnel Psychology, 1968, 21,
365-377.
282.
Salasin, S. , & Campbell, D. T. Experimentation revisited: A conversation with Donald T. Campbell. Evaluation, 1973, 1(3), 7~13-
Samuel, Y., & Manheim, B. F. A multidimensional approach toward a typology of bureaucracy. Administrative Science Quarterly, 1970, 15, 216-228.
Schein, E. H. Organizational psychology. Englewood Cliffs, N. J. : Prentice-Hal 1, 1965-
Schein, E. H. Process consultation: Its role in organization development. Reading, Mass.: Addison-Wesley, 1969.
Schmidt, F. L., & Kaplan, L. B. Composite vs. multiple criteria: A review and resolution of the controversy. Personnel Psychology, 1971, 2k, k\3~klk.
Schneider, B. Organization climate: Individual preferences and organiza- tional realities. Journal of Applied Psychology, 1972, 56, 211-217-
^^^Schneider, B., & Bartlett, C. Individual differences and organizational y^ climate: I. The research plan and questionnaire development. Per-
sonnel Psychology, 1968, 21, 323-333. i
^Schneider, B. , & Bartlett, C. Individual differences and organizational v^k climate: II. Measurement of organizational climate by the multitrait-
multirater matrix. Personnel Psychology, 1970, 23, 493-512.
Schneider, B. Dachler, H. Organizational participation and withdrawal: Impact of organization, family, and individual motivation. Unpublished research proposal, University of Maryland, 1972.
Seashore, S. The measurement of organizational effectiveness. Paper presented at the University of Minnesota, Minneapolis, 1972.
Seashore, S. , Indik, B. P., & Georgopoulos, B. S. Relationships among criteria of job performance. Journal of Applied Psychology, I960, kk, 195-202.
Seashore, S., S Yuchtman, E. Factorial analysis of organizational per- formance. Administrative Science Quarterly, 1967, 12, 377*395.
Seeman, M. On the meaning of alienation. American Sociological Review, 1959, 2k, 783-791.
Seeman, M. On the personal consequences of alienation in work. Ameri can Sociological Review, 1967, 32, 273~285.

283.
Seeman, M. The urban alienations: Some dubious theses from Marx to Marcuse. Journal of Personality and Social Psychology, 1971, 19, 135- 1*»3.
Sells, S. B. Dimensions of stimulus situations which account for behavior variance. In S. B. Sells (Ed.), Stimulus determinants of behavior. New York: Ronald Press, 1963-
Selznick, P. Foundations of the theory of organization. American Sociological Review, 19^8, 13, 25~35-
Selznick, P. TVA and the grass roots. Berkeley, Calif.: University of California Press, 19^9- (Republished: New York: Harper Torchbook Edition, 1966.)
Senate hearings on worker alienation. Hearings before the subcommittee on employment, manpower, and poverty of the Committee on Labor and Public Welfare, United States Senate, 1972.
Shepard, J. M. Alienation as a process: Work as a case in point. Sociological Quarterly, 1972, 13, 161-173-
Shepard, R. , Romney, A. K., & Nerlove, S. (Eds.) Multidimensional scaling: Theory and applications in the behavioral sciences. New York: Seminar Press, 1972.
Sheppard, H. L., 6 Herrick, N. Q. Where have all the robots gone? Worker dissatisfaction in the 70's. New York: Free Press, 1972.
Sherif, M. Superordinate goals in the reduction of intergroup conflict. American Journal of Sociology, 1957-1958, 63, 3/*9~356.
Simpson, R. L., & Gulley, W. H. Goals, environmental pressure and organ- izational characteristics. American Sociological Review, 1962, 27,
3*4-351.
Smith, C. G., S Ari, 0. N. Organizational control structure and member consensus. American Journal of Sociology, 1963-196A, 69, 623-638.
Smith, F. Private communication. Conference on the Naval Personnel Status Index, Gaithersburg, Maryland, April, 1973-
Smith, P. C, 6 Kendall, L. M. Retranslat ion of expertations: An approach to the constitution of unambiguous anchors for rating scales. Journal of Applied Psychology, 1963, **7, 149-155.

284.
Smith, P. C., Kendall, L. M., & Hulin, C. L. The measurement of satis- faction in work and retirement: A strategy for the study of attitudes. Chicago: Rand McNally, 1969-
Special Task Force of the Department of Health, Education, and Welfare. Work in America. Cambridge, Mass.: M.I.T. Press, 1972.
Stagner, R. Corporate decision making: An empirical study. Journal of Applied Psychology, 1969, 53, 1-13-
Stern, G. G. People in context: Measuring person-environment congruence in education and industry. New York: Wiley, 1970.
Stewart, J. M. Making project management work. Business Horizons, 1965, 8(3), 5^-68.
Stewart, R. Managers and their jobs. London: Macmillan, 1967-
Stogdill, R. M. Job description and expectations questionnaire: A scoring manual■ Columbus, Ohio: Bureau of Business Research, Ohio State Uni vers i ty , 1965-
Stogdill, R. M. Dimensions of organization theory. In J. D. Thompson & V. H. Vroom (Eds.), Organizational design and research. London: Henry M. Snyder & Co., Inc., 1971.
Stogdill, R. M., & Coons, A. E. Leader behavior: Its description and measurement. Ohio State University, Bureau of Business Research, Research Monograph No. 88, 1957-
Student, K. R. Supervisory influence and work group performance. Journal of Applied Psychology, 1968, 52, 188-19^-
Swinth, R. L. Organizational designs for complex problem solving. Management Science, 1971, 18, B-69-B-80.
V, aguiri, R. The concept of organizational climate. In R. Taguiri 6 G. Li twin (Eds.), Organizational Climate: Explorations of a concept. Boston: Harvard University Press, 1968.
Tannenbaum, A. S. Control and effectiveness in a voluntary organization. American Journal of Sociology, 1961-1962, 67, 33-Z*6.

285.
Tannenbaum, A. S. Control in organizations: Individual adjustment and organizational performance. Administrative Science Quarterly, 1962
7, 236-257.
Tannenbaum, A. S. (Ed.), Control in organizations. New York: McGraw- Hill, 1968.
Tannenbaum, R., & Davis, S. Values, man, and organizations. In N. Margulies and A. P. Raia (Eds.), Organizational development: Values, process, and technology. New York: McGraw-Hill, 1972.
Taylor, J. C. , 6 Bowers, D. G. Survey of organizations. Ann Arbor, ^Pc^O^X- Mich.: Institute for Social Research, 1972.
Terry, H. Comparative evaluation of performance using multiple criteria. Management Science, 1963, 9, 431-442.
Thompson, J. D. Organizations in action. New York: McGraw-Hill, 1967-
Turban, E., & Metersky, M. L. Utility theory applied to multivariate system effectiveness evaluation. Management Science, 1971, 17, B-817-B-828.
Turner, A. N., 6 Lawrence, P. R. Industrial jobs and the worker: An investigation of response to task attributes. Boston: Harvard University, Graduate School of Business Administration, 1965.
Udell, J. G. An empirical test of hypotheses relating to span of control. Administrative Science Quarterly, 1968, 12, 420-439-
Utterback, J. M. The process of technological innovation within the firm. Academy of Management Journal, 1971, 14, 75_88.
Vroom, V. H. The effects of attitudes on perception of organizational goals. Human Relations, I960, 13, 229-240.
Wainer, H. A., & Rubin, I. M. Motivation of research and development entrepreneurs: Determinants of company success. Journal of Applied Psychology, 1969, 53, 178-184.
Wallace, S. R. Criteria for what? American Psychologist, 1965, 20, 411-417-
Walton, E. A study of organizational communications systems. Personnel Administration, 1963, 26(3), 46-49-

286.
Wanous, J. P., & Lawler, E. E. Measurement and meaning of job satisfaction. Journal of Applied Psychology, 1972, 56, 95-105.
Webb, E. J., Campbell, D. T., Schwartz, R. D., £ Sechrest, L. Unobtrus ive measures: Nonreactive research in the social sciences. Chicago: Rand McNally, 1966.
Weber, M. The theory of social and economic organization. (Translators A. M. Henderson & T. Parsons.) New York: The Free Press, 19^7-
Whitely, R., 6 Frost, P. The measurement of performance in research. Human Relations, 1971, 2h, 161-178.
Whyte, W. F. Human problems of the restaurant industry. New York: McGraw-Hi11 , 19^8.
Woodward, J. Management and technology. London: Her Majesty's Stationery Office, 1958.
Woodward, J. Industrial organization: Theory and practice. New York: Oxford University Press, 1965-
Worthy, J. C. Organizational structure and employee morale. American Sociological Review, 1950, 15, 169-179-
Yuchtman, E. A study of organizational effectiveness. Unpublished doc- toral dissertation, University of Michigan, 1966.
,
Weick, K. E. The social psychology of organizing. Reading, Mass.: Addison-Wesley, 1969.
Weiss, D. W. Multivariate methods in industrial and organizational psychology. In M. D. Dunnette (Ed.), Handbook of industrial and organ- izational psychology. (Vol. 1) Chicago: Rand McNally, in press.
Weiss, D. J., Dawis, R. V., England, G. W., & Lofquist, L. H. Manual for the Minnesota Satisfaction Questionnaire. Minnesota Studies in Vocational Rehabi1itat ion, 1967, 22.
Weitzel, W. F., Mahoney, T. A., 6 Crandall, N. F. A supervisory view of unit effectiveness. California Management Review, 1971, 13(M, 37_i»3>
Werts, C. E., & Linn, R. L. Path analysis: Psychological examples. Psychological Bulletin, 1970, Ik, 193-212.

287.
Yuchtman, E., S Seashore, S. E. A system resource approach to organiza- tional effectiveness. American Sociological Review, 1967, 32, 891-903- (Republished in J. Ghorpade (Ed.), Assessment of organizational effec- tiveness. Pacific Palisades, Calif.: Goodyear, 1971.
Zald, M. M. Comparative analysis and measurement of organizational goals The case of correctional institutions for delinquents. Sociological Quarterly, 1963, 1», 206-230.

289.
DISTRIBUTION LIST
Assistant Secretary of Defense (Manpower & Reserve Affairs) Assistant Secretary of the Navy (Manpower & Reserve Affairs) Chief of Naval Operations (OP-01) [2]
(0P-01B) (OP-987E)
Chief of Naval Personnel (Pers-10) (Pers-10c) (Pers-2B) (Pers-6)
Chief of Naval Education and Training (CNET N-33) Chief of Naval Material (NMAT 030B) Chief of Naval Research (Code 450) [4] Commanding Officer, Naval Education & Training Program Development Center Commanding Officer, Naval Development and Training Center (Code 0120) Superintendent, Naval Postgraduate School Superintendent, U. S. Naval Academy Superintendent, U. S. Military Academy Superintendent, U. S. Air Force Academy Superintendent, U. S. Coast Guard Academy Chief of Research and Development, U. S. Army Army Military Personnel Center, Personnel Management Development
Directorate Army Personnel and Administration Combat Developments Activity, Human Resources Development Division
Army Research Institute for Behavioral and Social Sciences Headquarters Air Force Systems Command, Environmental & Life Sciences Division Air Force Human Resources Laboratory (AFSC), Manpower & Personnel Systems
Division, Lackland AFB Air Force Human Resources Laboratory (AFSC), Occupational Research Division,
Lackland AFB Air Force Human Resources Laboratory (AFSC), Personnel Research Division,
Lackland AFB Air Force Human Resources Laboratory, Brooks AFB Air Force Military Personnel Center, Chief Modeling, Research & Evaluation
Division, Randolph AFB Executive Secretariate, Interagency Committee on Manpower Research, Washington Civil Service Commission, Washington U. S. Employment Service, U. S. Department of Labor Center for Naval Analyses National Research Council National Science Foundation Science and Technology Division, Library of Congress Defense Documentation Center [12]