the market for veterinary services...the market for veterinary services, presenting narratives...
TRANSCRIPT

2016 AVMA Report on
THE MARKET FOR VETERINARY SERVICES
VeterinaryEconomics

2 2016 AVMA REPORT on THE MARKET FOR VETERINARY SERVICES

2016 AVMA Report on
THE MARKET FOR VETERINARY SERVICESVeterinary Economics Division American Veterinary Medical AssociationFebruary 2017
Principal ContributorsMichael R. Dicks AVMA Veterinary Economics DivisionDirector of Veterinary Economics
Bridgette Bain AVMA Veterinary Economics Division Assistant Director of Analytics
Ross Knippenberg AVMA Veterinary Economics Division Assistant Director of Economics
Barbara DuttonAVMA Veterinary Economics DivisionEconomics Writer/Content Coordinator
Frederic Ouedraogo AVMA Veterinary Economics Division Economic Analyst
2016 AVMA REPORT on THE MARKET FOR VETERINARY SERVICES 3

4 LIST OF FIGURES AND TABLES
6 SUMMARY
8 INTRODUCTION
10 EXCESS CAPACITY
10 The 2015 AVMA Capacity Survey
18 Comparison of Capacity Surveys
20 Workforce Model
30 STUDIES
30 Seasonality
33 Consumer Preferences for Pet Health Insurance
34 Veterinary Practices
39 Metro Market Pilot Study
44 DISCUSSION
46 REFERENCES
CONTENTS12 Table 1: 2015 Capacity Survey Summary Statistics: Practice Characteristics
13 Table 2: 2015 Capacity Survey Summary Statistics: Competition
13 Table 3: Correlation Between Measures of Excess Capacity, 2015
14 Table 4: Perception of Competing Veterinarians, 2015
14 Table 5: Perception of Competing Veterinary Clinics, 2015
15 Table 6: Excess Capacity, Scenario 1, 2015
15 Table 7: Excess Capacity, Scenario 2, 2015
16 Figure 1: Distribution of Excess Capacity by Private Practice Type
16 Figure 2: Geographic Distribution of Excess Capacity
17 Figure 3: Regions of the United States
18 Figure 4: Excess Capacity Survey Results
19 Figure 5: Private Practices at Full Capacity, by Region
19 Figure 6: Private Practices at Full Capacity, by Practice Type
20 Figure 7: Excess Capacity Forecast Comparison
LIST OF FIGURES AND TABLES
4 2016 AVMA REPORT on THE MARKET FOR VETERINARY SERVICES

21 Figure 8: Excess Capacity by Region
21 Figure 9: Excess Capacity by Practice Type
22 Table 8: Workforce Model Assumption Changes
23 Table 9: Excess Capacity by State and Practice Type, 2015
25 Figure 10: Forecast of Graduates of U.S. Colleges of Veterinary Medicine
26 Figure 11: Effect of Change in Uniformed Services Personnel Projections
26 Figure 12: Effect of Change in Dairy Cows Forecast on Veterinarian FTEs
27 Figure 13: Effect of Change in Beef Cattle Forecast on Veterinarian FTEs
27 Figure 14: Effect of Change in Swine Forecast on Veterinarian FTEs
28 Figure 15: Effect of Change in Broilers and Layers Forecast on Veterinarian FTEs
28 Figure 16: Effect of Change in Other Livestock Forecast on Veterinarian FTEs
29 Figure 17: Total Effect of Livestock Projections on the 2015 Excess Capacity Forecast
31 Figure 18: Quarterly Veterinary Expenditures, 2005-2014
32 Figure 19: Quarterly Veterinary Visits and Expenditures per Visit, 2005-2014
35 Table 10: Veterinary Industry National Forecast
35 Table 11: Veterinary Industry Employment by State, 2013
36 Figure 20: Number of Private Practice Veterinarians by State, 2013
37 Figure 21: Number of Veterinary Establishments by State, 2013
38 Figure 22: Veterinary Industry Labor Quotient by State, 2013
40 Figure 23: How Do People Handle Health Issues?
40 Table 12: Purveyors of Pet Care Supplies
41 Figure 24: Accuracy of Recall for Specific Veterinary Services
42 Figure 25: Accuracy of Recall for Total Veterinary Visits
43 Figure 26: Accuracy of Recall of Price Paid per "Routine Check-up"
44 Figure 27: Veterinary Services Pricing and Patronage Trends
2016 AVMA REPORT on THE MARKET FOR VETERINARY SERVICES 5
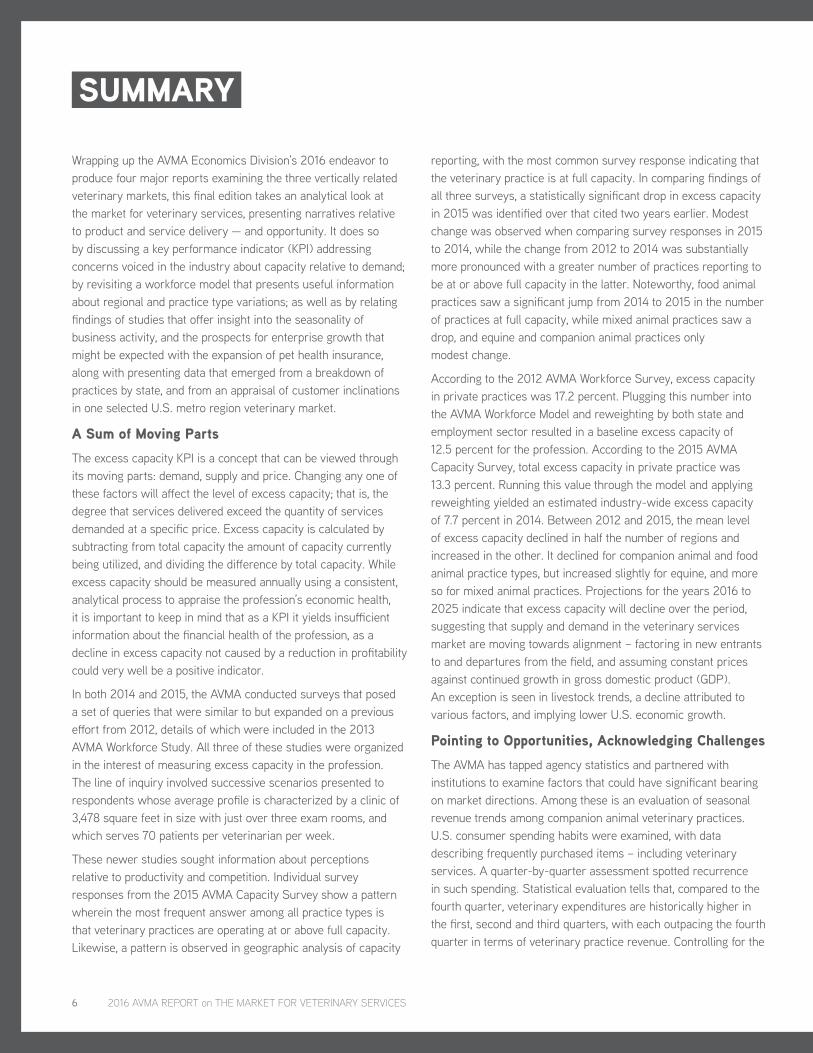
Wrapping up the AVMA Economics Division’s 2016 endeavor to produce four major reports examining the three vertically related veterinary markets, this final edition takes an analytical look at the market for veterinary services, presenting narratives relative to product and service delivery — and opportunity. It does so by discussing a key performance indicator (KPI) addressing concerns voiced in the industry about capacity relative to demand; by revisiting a workforce model that presents useful information about regional and practice type variations; as well as by relating findings of studies that offer insight into the seasonality of business activity, and the prospects for enterprise growth that might be expected with the expansion of pet health insurance, along with presenting data that emerged from a breakdown of practices by state, and from an appraisal of customer inclinations in one selected U.S. metro region veterinary market.
A Sum of Moving PartsThe excess capacity KPI is a concept that can be viewed through its moving parts: demand, supply and price. Changing any one of these factors will affect the level of excess capacity; that is, the degree that services delivered exceed the quantity of services demanded at a specific price. Excess capacity is calculated by subtracting from total capacity the amount of capacity currently being utilized, and dividing the difference by total capacity. While excess capacity should be measured annually using a consistent, analytical process to appraise the profession’s economic health, it is important to keep in mind that as a KPI it yields insufficient information about the financial health of the profession, as a decline in excess capacity not caused by a reduction in profitability could very well be a positive indicator.
In both 2014 and 2015, the AVMA conducted surveys that posed a set of queries that were similar to but expanded on a previous effort from 2012, details of which were included in the 2013 AVMA Workforce Study. All three of these studies were organized in the interest of measuring excess capacity in the profession. The line of inquiry involved successive scenarios presented to respondents whose average profile is characterized by a clinic of 3,478 square feet in size with just over three exam rooms, and which serves 70 patients per veterinarian per week.
These newer studies sought information about perceptions relative to productivity and competition. Individual survey responses from the 2015 AVMA Capacity Survey show a pattern wherein the most frequent answer among all practice types is that veterinary practices are operating at or above full capacity. Likewise, a pattern is observed in geographic analysis of capacity
reporting, with the most common survey response indicating that the veterinary practice is at full capacity. In comparing findings of all three surveys, a statistically significant drop in excess capacity in 2015 was identified over that cited two years earlier. Modest change was observed when comparing survey responses in 2015 to 2014, while the change from 2012 to 2014 was substantially more pronounced with a greater number of practices reporting to be at or above full capacity in the latter. Noteworthy, food animal practices saw a significant jump from 2014 to 2015 in the number of practices at full capacity, while mixed animal practices saw a drop, and equine and companion animal practices only modest change.
According to the 2012 AVMA Workforce Survey, excess capacity in private practices was 17.2 percent. Plugging this number into the AVMA Workforce Model and reweighting by both state and employment sector resulted in a baseline excess capacity of 12.5 percent for the profession. According to the 2015 AVMA Capacity Survey, total excess capacity in private practice was 13.3 percent. Running this value through the model and applying reweighting yielded an estimated industry-wide excess capacity of 7.7 percent in 2014. Between 2012 and 2015, the mean level of excess capacity declined in half the number of regions and increased in the other. It declined for companion animal and food animal practice types, but increased slightly for equine, and more so for mixed animal practices. Projections for the years 2016 to 2025 indicate that excess capacity will decline over the period, suggesting that supply and demand in the veterinary services market are moving towards alignment – factoring in new entrants to and departures from the field, and assuming constant prices against continued growth in gross domestic product (GDP). An exception is seen in livestock trends, a decline attributed to various factors, and implying lower U.S. economic growth.
Pointing to Opportunities, Acknowledging ChallengesThe AVMA has tapped agency statistics and partnered with institutions to examine factors that could have significant bearing on market directions. Among these is an evaluation of seasonal revenue trends among companion animal veterinary practices. U.S. consumer spending habits were examined, with data describing frequently purchased items – including veterinary services. A quarter-by-quarter assessment spotted recurrence in such spending. Statistical evaluation tells that, compared to the fourth quarter, veterinary expenditures are historically higher in the first, second and third quarters, with each outpacing the fourth quarter in terms of veterinary practice revenue. Controlling for the
SUMMARY
6 2016 AVMA REPORT on THE MARKET FOR VETERINARY SERVICES
effects of seasonality showed that overall spending on veterinary services for a specific sample size dropped between 2005 and 2014. Likewise, the number of visits by this constant sample size declined annually during this time. The average expenditure per veterinary visit, however, increased, suggesting either a decline in number of pets, or that pets are taken to veterinary service providers less often. Those who do take their pet to a veterinarian make higher cash outlays each time.
How might the habits observed be altered with the expansion of pet health insurance across the pet-owning population? A joint study by the AVMA and Mississippi State University sought information about the willingness of pet owners to purchase pet health insurance and preferences among various potentially available policy options. Consumer demand, motivations and behavior as well as market characteristics and policy attributes were taken into account. As the utility evaluation of options is linked to a buyer’s risk tolerance, the study also probed risk aversion. While most respondents ranked their risk preferences to be about the same as their neighbors, perceptions of risk were more pronounced, prompting exploration of other factors, namely socio-demographic and pet-relationship variables. Pet owners who consider their pet to be part of the family and ones who expected a pet to require medical care were found more likely to purchase pet health insurance. While the study found no evidence to suggest that income affects the decision to buy insurance, the ability to tolerate the cost of a medical emergency affects the probability that an owner will.
Industry Impact, Establishment DistributionThe next section in this report looks at the composition, employment and output, and geographic distribution of the veterinary firms that comprise what is a $31 billion industry, as computed using a model that measures economic impact based on the degree of relationship between different industries within the economy. The relationship is typically shown through a set of multipliers depicting the impact of a one-dollar investment made by an industry, and tracking how production plan changes in one industry affect the output of contributing industries. A state-by-state look at industry characteristics showed, among other observations, that heavily populated states have the highest number of veterinary establishments. A deeper dig into the data ascertains whether a state has fewer or more veterinarians than the national average.
Finally, in addition to building and improving upon previous studies concerning pet health care purchasing habits, a new
“pilot” study conducted under AVMA direction sought to analyze potential differences among local and national markets. Asking where dog owners in the combined statistical area of Raleigh-Durham, N.C., brought their pet for care, how often, and what they paid for care, the Metro Pilot Study researched choices made in obtaining pet care products and services. To better understand what kinds of health concerns prompted pet owners to seek care, the study asked about reasons for visits, and details about routine check-ups presumed to include vaccinations. A veterinary clinic or hospital emerged as the choice for routine check-ups among the vast majority of respondents who indicated that they had taken their dog somewhere for this type of exam in the previous 12 months. This study disclosed that veterinarians serving the community surveyed confront minimal competition from public clinics or animal shelters for this set of services, though face some competition in retail sales from “big box” pet stores.
Measuring Pilot survey data against actual purchase records showed a tendency to underreport actual visits, and earlier survey data were ineffectual in determining how often special visits are made to a veterinary clinic for chronic or episodic pet health issues. Hence, accuracy relative to some product and service realization might be questioned. Survey responses confirmed by purchase records indicate that non-routine check-ups specifically for de-worming is uncommon, and since the procedure is frequently part of what dog owners deem a routine checkup, they might fail to recall treatment. Likely little surprise comes with learning that customers procuring boarding services demand more days as the cost charged drops, while pricier providers see less demand in terms of days. Data on purchasing patterns for product types and providers of such showed that pet-focused retail stores led in special food and dental products, and that internet/online sources, and grocery or other retail outlets, led in vitamin supplement purchases. Veterinary clinics and hospitals, though, maintain advantage in flea/tick product purchases among the survey community.
To validate responses concerning total expenditures made on visits for the year, the Pilot study finds that, on average, consumers can accurately recall the total amount spent on veterinary services in the past 12 months, though the improved questions from the Pilot appear to better capture answers that reflect true outlays for specific, routine visits. Generally, the new questions asked in the Pilot were more effective in deriving accurate data relative to quantities of services purchased and frequency of visits, and offer useful insights into the market for veterinary services.
2016 AVMA REPORT on THE MARKET FOR VETERINARY SERVICES 7

The concept of excess capacity is new to the veterinary profession, having been first introduced in the 2013 AVMA Workforce Study. Confusion over the difference between oversupply and excess capacity, however, lingers in the profession. The difference is the use of price. In most industries the term used is “capacity utilization” rather than excess capacity. That is, understanding the capacity of a business to produce output, and then reporting how much of this capacity is being utilized. Excess capacity is the unused portion of total capacity.
The reporting of capacity utilization assumes the understanding that the level of total available capacity utilized is at the current prices charged for outputs. It is also assumed that the level of capacity utilization reflects the capability of the business to meet demand for the output at prevailing prices, rather than some strategic decision about the amount of output to place on the market. Finally, capacity utilization is understood to be affected by the prices charged for the outputs, given the current general economic conditions.
On the other hand, oversupply refers to the inability to clear the market of all possible output at any price. As an example, oversupply occurs at garage sales where one’s purpose is to dispose of unwanted items, and price is set to ensure that at the end of the day all items are gone. When there are unsold items that have been offered for free, these remaining items represent an oversupply. Obviously this is not the case for veterinary medicine. Providing veterinary services to all of the pets that currently do not see a veterinarian would require a large increase in the number of veterinarians.
A similar situation exists in human medicine where a shortage of doctors exists. The shortage is created because, due to insurance coverage, consumers of medical services are able to obtain these services regardless of their ability to pay — price has been taken
out of the equation in most cases when insurance is involved. If we introduce price into the equation for determining the capacity of human medical professionals to provide services, a shortage of professionals exists. Likewise, if we take price out of the equation for the capacity of veterinary medical doctors to provide medical services, again a shortage of professionals would exist. Pet insurance is not widespread, however, so prices are relevant to the veterinary profession, meaning there is not a shortage of veterinarians. For these reasons, we have elected to use the term “excess capacity” to describe the economic condition of the veterinary markets rather than excess supply (oversupply) and excess demand.
This report focuses on the market for veterinary services. In the three vertically related veterinary markets, the market for veterinary services is a combination of the need for veterinary medical services or other skills and training that veterinarians have to offer, and the ability of the profession to provide these services by educating, training and certifying veterinary medical professionals. The demand for veterinary services comes from a variety of sources, among them consumers and the general public.
Definition of Excess Capacity
Excess capacity means that services are being provided in excess of the quantity demanded at a specific price. To measure excess capacity, take total capacity, subtract the amount of capacity that is currently being utilized, and divide by total capacity. Equivalently, subtract the capacity utilization rate from 100 percent.
Three components comprise excess capacity: demand, supply and price. Changing any one of these factors will change the level of excess capacity. While some past workforce studies have
INTRODUCTION
8 2016 AVMA REPORT on THE MARKET FOR VETERINARY SERVICES

addressed oversupply, the difference in our latest research, while subtle, is important. In general, an oversupply of the quantity of services that can be provided exceeds the demand, regardless of price. But this is not the case in veterinary services. The need for veterinary services continues to outpace the ability to supply those services at prices consumers are willing to pay. However, that need is not captured as demand because those services are not available at prices that adequately compensate veterinarians for the time and effort they’ve invested. There is little disagreement that there are companion and food animal, equine and various non-animal-related veterinary services that are needed but not provided. Take, for instance, the number of animals that do not receive regular veterinary care or appropriate vaccinations, or the monitoring and prevention of zoonotic diseases. What we are really experiencing in the profession is excess capacity, not oversupply.
As a veterinary KPI, excess capacity should be measured annually using a consistent, analytical process so that the value can be compared across the years as a measure of the economic health of the profession. However, excess capacity is a physical measure and does not provide ample information about the financial health of the profession. A decline in excess capacity may be a positive indicator unless it is achieved through a reduction in the profitability of the profession. The 2013 AVMA Workforce Study included several assumptions because data were not available. As these assumptions are replaced with data, the baseline value of excess capacity computed for 2012 may change. Going forward, as new data are collected, the impact of this new data to the baseline estimate of excess capacity will be provided. In the meantime, let’s take a look at the current estimate of 12.7 percent excess capacity in the veterinary services market. Is that considered high? And can it be compared to other markets?
The Federal Reserve Board measures and tracks capacity utilization in the manufacturing, mining and utilities sectors. Excess capacity is the complement of capacity utilization. The Federal Reserve Board estimates that excess capacity in 2015 was 23.3 percent, up from 21.8 percent in 2014 and 23.1 percent in 2013. The average excess capacity from 1994-2015 was 21.3 percent, and from 1972-2015 was 20.0 percent (Federal Reserve Board 2016). But excess capacity in the manufacturing, mining and utilities sectors refers to physical capacity rather than labor capacity.
Currently the AVMA Economics Division knows of no measures of excess labor capacity in other service industries, so we cannot make an accurate comparison. Additionally, the problem becomes even more complicated because measuring labor for veterinary services can suffer from substitution bias. For example, the primary functions of a veterinarian include making diagnoses, and prescribing treatment and medications. A veterinary technician works alongside the veterinarian and often performs functions such as creating radiographic images, collecting and performing diagnostic tests on blood samples, and explaining follow-up care and compliance. A veterinarian might often take over these or other duties. In doing so, this is not wasted time, but it may be more efficient and economical for the veterinarian to perform the medical and diagnostic functions for which they are highly trained and delegate routine tasks to a veterinary technician.
2016 AVMA REPORT on THE MARKET FOR VETERINARY SERVICES 9

This survey provided the following information: The average size of a clinic is 3,478 square feet, has just over three exam rooms, and serves 70 patients per veterinarian per week.
The first survey on veterinary capacity was conducted by the research organization IHS Healthcare and Pharma, and the Center for Health Workforce Studies at the University at Albany, State University of New York. The details of this 2012 study can be found in Appendix A of the 2013 AVMA Workforce Study. That study used two questions to measure excess capacity, which will be referred to as the first and second scenarios. These two scenario questions take into account the fact that excess capacity can also include the concept of underemployment: A veterinarian might be busy all the time, but with additional veterinary technicians or physical space, that same veterinarian may be able to see more clients and perform more work.
The first scenario includes the following three assumptions: “1. There are no changes in the way the practice is organized; 2. There are no changes in the number of veterinarians or support staff; 3. There is an unlimited supply of clients and patients. In such a scenario, my practice could increase its productivity by: 0-10 percent, 11-25 percent, 26-50 percent, 51-75 percent, 76-100 percent.” Here, the definition of “productivity” is left up to the survey respondent.
Scenario 2 is similar but has four assumptions: “1. There is an unlimited supply of clients and patients; 2. This supply of clients and patients enables you to hire additional good technicians and support staff; 3. The staff is well-trained in providing great medical care and is very efficient;
THE 2015 AVMA CAPACITY SURVEY
EXCESS CAPACITY
10 2016 AVMA REPORT on THE MARKET FOR VETERINARY SERVICES

4. You add no square footage to the practice, but do some minor remodeling to increase efficiencies in work and client flow. In such a scenario, my practice could increase its productivity by: 0-10 percent, 11-25 percent, 26-50 percent, 51-75 percent, 76-100 percent.”
The AVMA conducted a second capacity survey in August 2014 and a third survey in August 2015, both of which asked questions similar to the previous survey but added new questions with the primary objective being to find alternative ways to measure excess capacity. The 2015 survey was electronically distributed to 17,830 practice owners, and responses were received from 2,583 of them for a response rate of 14.4 percent. Most importantly, in the 2015 survey 1,678 and 1,538 responded to the first and second scenario questions, respectively.
The 2015 survey was designed to measure capacity utilization using multiple methods. The first method was to ask two questions: “What is the average number of patients seen per week by each veterinarian?” This was followed by, “On average, what is the ideal number of patients per week seen by each veterinarian?” The ratio of actual to ideal is one measure of capacity utilization for veterinary labor. The mean of this ratio was 93.0 percent.
The second method was to ask the following two questions about physical capacity utilization: “How many total hours per week is your practice open?” And “How many hours per week are your exam rooms being used?” This resulted in a sample mean of 69.0 percent capacity utilization, lower than the 2014 estimate of 75.6 percent. Weighted by each clinic’s number of exam rooms (a mean of 3.2 per clinic) yielded 80.3 percent capacity utilization. Alternately, weighted by a clinic’s square footage, the sample mean was 63.9 percent, indicating that larger clinics were more likely to have higher excess capacity.
The third method, which is the AVMA’s current method to estimate excess capacity, is through the use of the first scenario. This estimation technique resulted in a sample excess capacity mean of 13.3 percent.
The fourth method used to estimate excess capacity is through the second scenario, as described above. The sample mean was 75.6 percent capacity utilization, and weighted by veterinarians’ work hours was 71.7 percent. This measurement technique is distinct from the first scenario because it is a measure of underemployment. Underemployment has both quantitative and qualitative components. The quantitative component is working fewer hours than desired, and the qualitative component is being under-utilized in performing assigned duties. An example would be a veterinarian whose responsibilities significantly overlap with those of a veterinary technician. A veterinarian who uses all of her time completing routine tasks that could be assigned to a veterinary technician is under-utilizing her skillset and is thus experiencing underemployment.
The fifth and final method is an open-ended version of the two scenarios. It is as follows: “Given the number of exam rooms and the number of doctors available at your practice today, estimate the percentage increase in total patients that could be seen each week.” The mean of this method was 21.4 percent and the median was 14.3 percent.
The summary statistics of the 2015 AVMA Capacity Survey are as listed in the following tables. The first table details the summary statistics pertaining to practice characteristics, the number of patients seen, and the excess capacity measures explained earlier. This survey provided the following information: The average size of a clinic is 3,478 square feet, has just over three exam rooms, and serves 70 patients per veterinarian per week.
The second table lists the summary statistics related to practices’ perceptions of competition. The following two variables, “The Number of Competing Veterinarians” and “The Number of Competing Veterinary Clinics,” are both measured on a scale of 1-5: with 1 representing “Far Too Few” and 5 representing “Far Too Many.”
2016 AVMA REPORT on THE MARKET FOR VETERINARY SERVICES 11

Variable Observations Mean Std. Dev.Single Owner 2,258 76% 43%Part Owner 2,258 15% 36%Rural 2,258 32% 47%Suburban 2,258 54% 50%Urban 2,258 14% 35%Referral Practice 2,258 4% 19%Physical Clinic 2,258 73% 45%Mobile Clinic 2,258 3% 16%Ambulatory Clinic 2,258 8% 27%Physical and Ambulatory Clinic 2,258 16% 37%Food Animal Exclusive 2,258 2% 13%Food Animal Predominant 2,258 2% 13%Companion Animal Exclusive 2,258 62% 48%Companion Animal Predominant 2,258 17% 37%Mixed Animal 2,258 8% 27%Equine 2,258 5% 21%Other 2,258 4% 20%Years in Business 1,358 30.4 55.3Clinic Square Feet 2,103 3,759.6 7,445.9Number of Exam Rooms 2,144 3.2 3.4Number of Days Per Week Open 2,110 5.8 0.7Number of Hours Per Week Open 2,148 58.2 26.2Number of Hours Per Week Exam Rooms Used 2,079 37.7 22.8Number of Patient Visits in Previous 12 months 1,369 168,559 4,220,038 Patients Per Vet Per Week 1,946 69.6 56.6Ideal Number of Patients Per Vet Per Week 1,894 79.6 71.4Veterinarian Capacity Utilization 1,880 85% 18%Veterinary Clinic Capacity Utilization 1,962 69% 22%
2015 CAPACITY SURVEY SUMMARY STATISTICS: PRACTICE CHARACTERISTICS
Table 1
12 2016 AVMA REPORT on THE MARKET FOR VETERINARY SERVICES
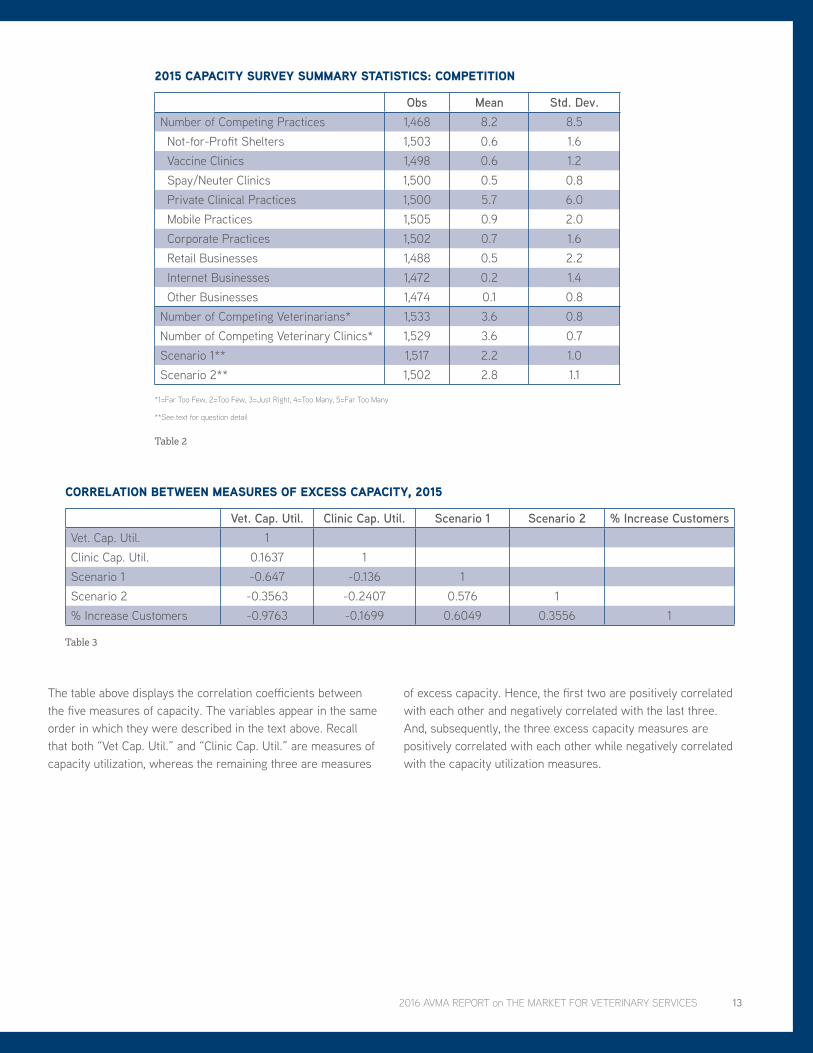
Obs Mean Std. Dev.Number of Competing Practices 1,468 8.2 8.5 Not-for-Profit Shelters 1,503 0.6 1.6 Vaccine Clinics 1,498 0.6 1.2 Spay/Neuter Clinics 1,500 0.5 0.8 Private Clinical Practices 1,500 5.7 6.0 Mobile Practices 1,505 0.9 2.0 Corporate Practices 1,502 0.7 1.6 Retail Businesses 1,488 0.5 2.2 Internet Businesses 1,472 0.2 1.4 Other Businesses 1,474 0.1 0.8Number of Competing Veterinarians* 1,533 3.6 0.8Number of Competing Veterinary Clinics* 1,529 3.6 0.7Scenario 1** 1,517 2.2 1.0Scenario 2** 1,502 2.8 1.1
2015 CAPACITY SURVEY SUMMARY STATISTICS: COMPETITION
*1=Far Too Few, 2=Too Few, 3=Just Right, 4=Too Many, 5=Far Too Many
**See text for question detail
Table 2
Vet. Cap. Util. Clinic Cap. Util. Scenario 1 Scenario 2 % Increase CustomersVet. Cap. Util. 1Clinic Cap. Util. 0.1637 1Scenario 1 -0.647 -0.136 1Scenario 2 -0.3563 -0.2407 0.576 1% Increase Customers -0.9763 -0.1699 0.6049 0.3556 1
CORRELATION BETWEEN MEASURES OF EXCESS CAPACITY, 2015
Table 3
The table above displays the correlation coefficients between the five measures of capacity. The variables appear in the same order in which they were described in the text above. Recall that both “Vet Cap. Util.” and “Clinic Cap. Util.” are measures of capacity utilization, whereas the remaining three are measures
of excess capacity. Hence, the first two are positively correlated with each other and negatively correlated with the last three. And, subsequently, the three excess capacity measures are positively correlated with each other while negatively correlated with the capacity utilization measures.
2016 AVMA REPORT on THE MARKET FOR VETERINARY SERVICES 13

Looking beyond simple correlation measures, how does the perception that there are too many veterinarians and measures of excess capacity differ across practice types? The following contingency table shows the survey responses in which respondents were asked about the number of competing veterinarians in their service area. A chi-square test on this table,
which compares the proportions of each category, has a value of 75.95, and the critical value with 16 degrees of freedom at the 5 percent significance level is 26.3. This means that there is a systematic pattern between practice type and the perception of the number of competing veterinarians.
Identifying Systematic Patterns
Companion Animal
Food Animal
Equine Mixed Unspecified Total
Far Too Few 5 1 0 0 0 6Too Few 52 13 1 15 3 84Just Right 512 29 25 61 31 658Too Many 484 8 37 39 24 592Far Too Many 148 5 15 8 6 182Total 1,201 56 78 123 64 1,522
PERCEPTION OF COMPETING VETERINARIANS, 2015
Q: In the area served by your practice, how would you characterize the number of veterinarians currently serving the same animal population?
Table 4
The next table shows the responses given when respondents were asked about the number of competing veterinary practices in their service area. The chi-square test on this contingency table has a value of 105.48 and the critical value is 26.3, meaning
that there is statistical evidence of a systematic pattern between practice type and the perception of the number of competing veterinary practices.
Companion Animal
Food Animal
Equine Mixed Unspecified Total
Far Too Few 4 0 0 0 0 4Too Few 22 12 1 9 3 47Just Right 515 32 29 68 29 673Too Many 516 10 35 38 28 627Far Too Many 141 2 13 7 4 167Total 1,198 56 78 122 64 1,518
PERCEPTION OF COMPETING VETERINARY CLINICS, 2015
Q: In the area served by your practice, how would you characterize the number of veterinary clinics currently serving the same animal population?
Table 5
The next table shows the responses when survey respondents were asked the first scenario question, which was described previously. The chi-square test on this contingency table has a value of 22.26, less than the chi-squared critical value of 31.41
(at the 5 percent significance level, with 20 degrees of freedom), meaning that there is no evidence of a systematic pattern between practice type and excess capacity.
14 2016 AVMA REPORT on THE MARKET FOR VETERINARY SERVICES

Companion Animal
Food Animal Equine Mixed Unspecified Total
0% 578 24 36 63 30 7311-10% 118 9 5 10 10 15211-25% 351 14 15 33 14 42726-50% 193 5 13 20 9 24051-75% 47 2 8 6 2 6576-100% 51 3 3 2 4 63Total 1,338 57 80 134 69 1,678
EXCESS CAPACITY, SCENARIO 1, 2015
Table 6
Lastly, the fourth table shows the responses when survey respondents were asked the second scenario question, which was also described previously. The chi-square test on this
contingency table has a value of 53.61, meaning that there is a systematic pattern between practice type and excess capacity.
Companion Animal
Food Animal Equine Mixed Unspecified Total
0% 117 1 0 13 9 1401-10% 90 12 9 17 10 13811-25% 369 14 23 40 19 46526-50% 391 13 22 32 9 46751-75% 121 1 8 11 10 15176-100% 135 10 12 11 9 177Total 1,223 51 74 124 66 1,538
EXCESS CAPACITY, SCENARIO 2, 2015
Table 7
Looking at the individual survey responses from the 2015 AVMA Capacity Survey reveals the patterns found in the following two figures. Across all practice types, the most frequent answer is that veterinary practices are operating at or above full capacity. Beyond that answer there are some differences between the practice types, but they follow similar patterns, with three of the four having 28 percent excess capacity as the next most common answer. Here the percentages represent the implied excess
capacity from the first scenario question. Specifically, we take the midpoint of the answer to the question, call it “X” and feed it into the expression 1-1/(1+X), resulting in the level of excess capacity implied by the question. And if the survey respondent answered that their ideal number of patients per week is equal to or greater than their current number of patients per week, then we code the excess capacity of that clinic as zero.
ACROSS ALL PRACTICE TYPES, THE MOST FREQUENT ANSWER IS THAT VETERINARY PRACTICES ARE OPERATING AT OR ABOVE FULL CAPACITY.
2016 AVMA REPORT on THE MARKET FOR VETERINARY SERVICES 15

0%
5%
10%
15%
20%
25%
30%
35%
40%
45%
50%
Food Animal CompanionAnimal
Equine Mixed Total
Distribu�on of Excess Capacity by Private Prac�ce Type
≤ 0%
5%
15%
28%
39%
47%
73%
DISTRIBUTION OF EXCESS CAPACITY BY PRIVATE PRACTICE TYPE
Figure 1
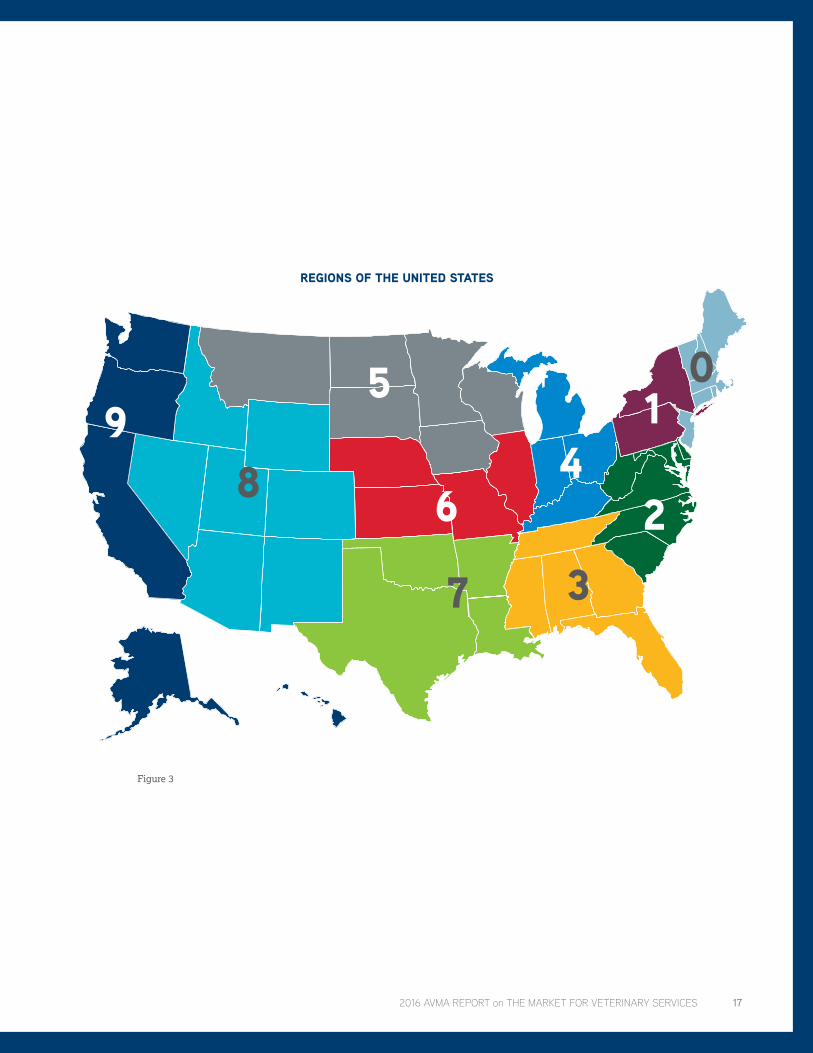
Geographically, a similar pattern emerges, with the most common survey response being that the veterinary practice is at full capacity. The second most common response is that the practice has 15 percent excess capacity, with considerably less variation by geography than by practice type.
The regions of the United States are illustrated in the figure on the opposite page. The number of the region refers to the first digit of the zip code.
0%
10%
20%
30%
40%
50%
60%
70%
80%
90%
100%
Perc
ent o
f Sur
vey
Resp
onde
nts
Excess Capacity
Geographic Distribu�on of Excess Capacity
73%
47%
39%
28%
15%
5%
≤ 0%
Regio
n 1
Regio
n 0
Regio
n 2
Regio
n 3
Regio
n 5
Regio
n 4
Regio
n 6
Regio
n 7
Regio
n 9
Regio
n 8
Figure 2
GEOGRAPHIC DISTRIBUTION OF EXCESS CAPACITY
16 2016 AVMA REPORT on THE MARKET FOR VETERINARY SERVICES
0
37
82
4
59
6
1
REGIONS OF THE UNITED STATES
Figure 3
2016 AVMA REPORT on THE MARKET FOR VETERINARY SERVICES 17

COMPARISON OF CAPACITY SURVEYSExcess capacity declined in 2015 relative to the two previous years. However, as the chart below shows, there was little change in the survey responses in 2015 compared to 2014.
The change from 2012 to 2014 was much more pronounced, however, with more practices claiming to be at or above full capacity in 2014 compared to 2012.
0%
5%
10%
15%
20%
25%
30%
35%
40%
45%
≤ 0% 5% 15% 28% 39% 47% 73%
Perc
ent o
f Sur
vey
Resp
onde
nts
Reported Excess Capacity
Excess Capacity Survey Results
2012
2014
2015
EXCESS CAPACITY SURVEY RESULTS
Figure 4
More telling is the percent of practices indicating they are working at full capacity. As the following figure illustrates, Region 9 had the highest percent of practices reporting high excess capacity, followed closely by Regions 3 and 4. In every region of the United States, the number of practices working at full capacity has increased. Most regions indicate that more than 50 percent of their practices are working at full capacity, compared to 2012 when only one region showed greater than 35 percent of practices operating at full capacity.
The percentage of practices that indicated they were working at full capacity increased substantially between 2012 and 2015, with the greatest increases in the number of practices reporting operating at full capacity occurring in Regions 6 and 8. The differences between 2014 and 2015, on the other hand, do not appear to be following any clear patterns, as some regions have seen an increase in practices at full capacity while some have seen a decrease.
MOST REGIONS INDICATE THAT MORE THAN 50 PERCENT OF THEIR PRACTICES ARE WORKING AT FULL CAPACITY, COMPARED TO 2012 WHEN ONLY ONE REGION SHOWED GREATER THAN 35 PERCENT OF PRACTICES OPERATING AT FULL CAPACITY.
18 2016 AVMA REPORT on THE MARKET FOR VETERINARY SERVICES
0% 10% 20% 30% 40% 50% 60%
Region 0
Region 1
Region 2
Region 3
Region 4
Region 5
Region 6
Region 7
Region 8
Region 9
Private Prac�ces at Full Capacity, by Region
2015
2014
2012
PRIVATE PRACTICES AT FULL CAPACITY, BY REGION
Figure 5
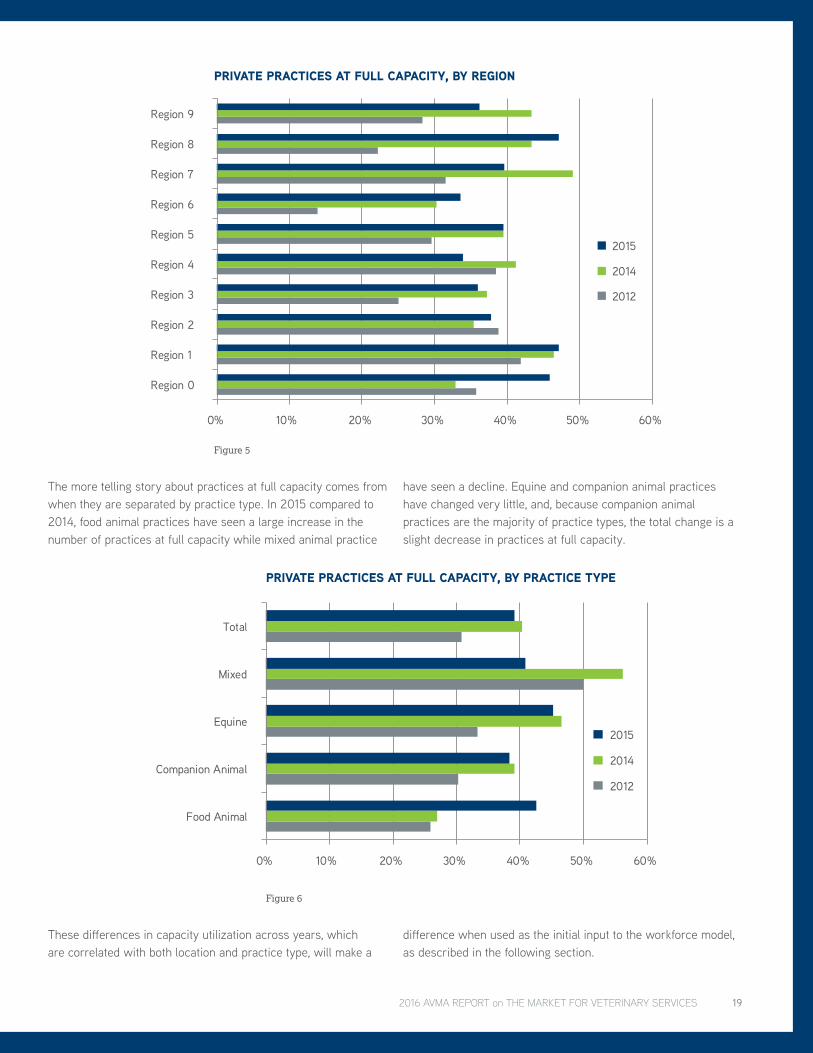
The more telling story about practices at full capacity comes from when they are separated by practice type. In 2015 compared to 2014, food animal practices have seen a large increase in the number of practices at full capacity while mixed animal practice
have seen a decline. Equine and companion animal practices have changed very little, and, because companion animal practices are the majority of practice types, the total change is a slight decrease in practices at full capacity.
0% 10% 20% 30% 40% 50% 60%
Food Animal
Companion Animal
Equine
Mixed
Total
Private Prac�ces at Full Capacity, by Prac�ce Type
2015
2014
2012
PRIVATE PRACTICES AT FULL CAPACITY, BY PRACTICE TYPE
Figure 6
These differences in capacity utilization across years, which are correlated with both location and practice type, will make a
difference when used as the initial input to the workforce model, as described in the following section.
2016 AVMA REPORT on THE MARKET FOR VETERINARY SERVICES 19

WORKFORCE MODELExcess capacity is a KPI for the veterinary profession. Excess capacity in 2015 has declined relative to both 2012 and 2014. According to the 2012 AVMA Workforce Survey, excess capacity in private practices was 17.2 percent. Feeding this number into the AVMA Workforce Model and reweighting by both state and employment sector resulted in a baseline excess capacity of 12.5 percent for the veterinary profession. According to the 2014 AVMA Capacity Survey, total excess capacity in private practice was 13.3 percent. Again, updating this initial value in the AVMA Workforce Model and reweighting gave an estimate of industry-wide excess capacity of 7.7 percent in 2014. In the 2015 AVMA Capacity Survey, excess capacity was 12.7 percent
and reweighting resulted in industry-wide excess capacity of 7.1 percent in 2015.
Projections for the years 2016 to 2025 indicate that excess capacity will decline over the forecast period. This implies that supply and demand in the veterinary services market are moving towards alignment, even as the number of new veterinarians will continue to grow through 2018 before reaching a plateau. Key assumptions driving this forecast include the flattening of the growth rate in the number of new veterinarians after 2018, continued growth in GDP over the entire period, an increasing retirement rate for veterinarians, and constant prices.
0%
2%
4%
6%
8%
10%
12%
14%
Excess Capacity Forecast Comparison
2013 Forecast
2014 Forecast
2015 Forecast
2013
2012
2014
2015
2017
2016
2018
2019
2021
2020
2022
2023
2024
2025
EXCESS CAPACITY FORECAST COMPARISON
Figure 7
On the other hand, the debt-to-income ratio for veterinarians continues to increase as the cost of education continues to climb at veterinary colleges. Some sectors of the profession continue to do quite well, while other sectors continue to do poorly. Both of these groups continue to grow in numbers and in their share of the profession. Increasing student debt and declining mean veterinary productivity may well be the primary factors driving the two results (declining excess capacity, increasing debt-to-income ratio). Over a lifetime, female veterinarians put in fewer hours than male veterinarians. Thus, as a result of the increasing proportion of women in each successive graduating class, the volume of services that are provided by the average veterinarian
will continue to decline. This means that the capacity to provide services will not increase at the same rate per veterinarian as in the past. Additionally, the potentially stagnate median incomes of the U.S. population mean that there is less disposable income to be spent on veterinary services.
Comparing the excess capacity for veterinary practices by region between 2012 and 2015, five out of 10 regions indicated a decline in the mean level of excess capacity, while five indicated an increase in the amount of excess capacity.
Excess capacity declined for both companion animal, and food animal practice types, while it has increased slightly for equine, and substantially for mixed animal practices.
20 2016 AVMA REPORT on THE MARKET FOR VETERINARY SERVICES

0% 4% 8% 12% 16% 20%
Region 0
Region 1
Region 2
Region 3
Region 4
Region 5
Region 6
Region 7
Region 8
Region 9
Excess Capacity by Region
2015
2014
2012
EXCESS CAPACITY BY REGION
Figure 8
0% 4% 8% 12% 16% 20%
Food Animal
Companion Animal
Equine
Mixed
Total
Excess Capacity by Prac�ce Type
2015
2014
2012
EXCESS CAPACITY BY PRACTICE TYPE
Figure 9
2016 AVMA REPORT on THE MARKET FOR VETERINARY SERVICES 21

The current analysis has, as have all previous studies, raised many new questions. The AVMA Veterinary Economic Strategy Committee will consider all of these questions and from them develop a set of research priorities for 2017 and beyond. Key among these for the AVMA Economics Division will be the continual updating and improvement of our market modeling. This model is based on the one described in the 2013 U.S. Veterinary Workforce Study: Modeling Capacity Utilization.
As mentioned above, excess capacity in the veterinary services market declined from 2012 to 2015. The forecast predicts it will decline to 5.7 percent in 2017 and remain flat through the remaining forecast period, which ends in 2025. This represents approximately a 5-6 percentage point reduction compared to the original 2012 forecast. The reduction can be attributed to two primary causes.
First, macroeconomic conditions in the economy have been steadily improving. This economic growth has led to increased
demand. In particular, this demand increase coupled with a drought in the West has increased the price of livestock. Using U.S. Department of Agriculture projections, the number of livestock will increase significantly from current levels, leading to a greater demand for food animal veterinarians. The macroeconomic forecast does not include any projection for recessionary periods between now and 2025, however, and it is highly unlikely that this span of time will be recession free. The macroeconomic forecast is obtained from the Congressional Budget Office (CBO) and is updated each year.
Second, with the rising costs of education and the decline in veterinary school applicants, the market for education is nearly in equilibrium. This decreases the forecast for new graduates from 2 percent growth per year to no growth after 2018. The forecast predicting the number of graduates is a key component of the decreasing excess capacity estimate.
New Questions, New Priorities
2014 Model 2015 Model Source Units(2014 to 2024) (2015 to 2025)
Federal Uniformed Services 0.0% -1.5% CBO per yearFederal Civil Service -1.3% -1.3% BLS per yearState and Local Government 0.5% 0.5% BLS per yearDairy Cattle -0.9% -1.7% USDA % chgBeef Cattle 11.0% 7.5% USDA % chgSwine 13.8% 7.6% USDA % chgBroilers and Layers 21.9% 15.9% USDA % chgSheep -10.5% -9.6% USDA % chgOther Livestock (incl. Turkey) 16.9% 16.4% USDA % chgNumber of New Graduates in 2025 4,290 4,290 AVMA per year
WORKFORCE MODEL ASSUMPTION CHANGES
Table 8
Changes in these two assumptions account for approximately half of the decline in forecasted excess capacity. The other half of the decline in excess capacity is based on the newest estimates of current excess capacity, which is about two percentage points lower than in 2012.
The AVMA Workforce Model is a physical model: No prices or incomes are incorporated into the analysis. Prices are important in many ways. The price that the consumer pays determines how much or how often they seek veterinary care. The price, or salary, that veterinary clinics pay veterinarians is determined along with the number of hours that veterinarians are willing to work. Generally, a higher level of salary is associated with a higher willingness to work, but it may be, as the 2015 AVMA
Report on the Market for Veterinarians suggests, that there exists a backward-bending supply curve. The truth is simply not known at this time.
The workforce model currently captures the physical outputs from the market for veterinary education (new veterinarians), the market for veterinarians (hours of labor per full-time equivalent (FTE)) and the market for veterinary services (services provided). However, these markets are not linked by prices (they are not price endogenous) and thus provide no indication of how the market might react to changes in factors such as the cost of veterinary education, starting salaries, or the price of veterinary services. Future efforts will focus on adding price factors to these market computations.
22 2016 AVMA REPORT on THE MARKET FOR VETERINARY SERVICES

Finally, the willingness of students to pay for veterinary education is not incorporated into the model. While the AVMA believes that the market for education is at or very near equilibrium (the availability of seats is equal to the number of students willing to pay for them), there does not yet seem to be a decline in demand for veterinary education. As with any market, rising prices for products (seats) and declining willingness of consumers (students) to pay could eventually lead to the most expensive seats being unfilled.
One of the key steps in the AVMA Workforce Model is the use of an ordered logit regression equation with the raw survey response data from the first scenario to impute missing data.
The model can then be used to estimate excess capacity for every employment sector in every state, as seen in the following table. This is necessary because the sample does not capture every employment sector (of which there are 205) in every state, and the ordered logit regression allows the estimation of the missing values. For example, the AVMA may not have received statistically valid survey responses from food animal practitioners in a state with a smaller population such as Wyoming, Delaware or Vermont, but the AVMA may have received responses from these states’ veterinarians as a whole and from food animal practitioners in other states. The ordered logit model is a procedure used to fill in those gaps in the data.
State Food Animal Small Animal Equine MixedAlabama 14% 15% 15% 15%Alaska 11% 11% 11% 11%Arizona 11% 12% 12% 11%Arkansas 11% 12% 12% 12%California 13% 14% 14% 14%Colorado 12% 13% 13% 12%Connecticut 9% 9% 9% 9%District of Columbia 0% 0% 0% 0%Delaware 9% 10% 10% 9%Florida 12% 13% 13% 13%Georgia 13% 14% 14% 14%Hawaii 12% 13% 13% 13%Idaho 14% 15% 15% 15%Illinois 11% 12% 12% 11%Indiana 14% 15% 15% 15%Iowa 10% 11% 10% 10%Kansas 14% 15% 15% 14%Kentucky 12% 13% 13% 13%Louisiana 12% 13% 13% 13%Maine 11% 12% 12% 12%Maryland 11% 12% 12% 12%Massachusetts 12% 13% 13% 12%Michigan 11% 12% 12% 12%Minnesota 12% 13% 13% 13%Mississippi 12% 13% 13% 13%Missouri 13% 13% 13% 13%Montana 14% 14% 14% 14%Nebraska 10% 11% 11% 11%Nevada 16% 16% 16% 16%New Hampshire 13% 14% 14% 13%
EXCESS CAPACITY BY STATE AND PRACTICE TYPE, 2015
Table 9 Cont'd on next page
2016 AVMA REPORT on THE MARKET FOR VETERINARY SERVICES 23

State Food Animal Small Animal Equine MixedNew Jersey 13% 14% 14% 14%New Mexico 14% 15% 15% 15%New York 15% 16% 16% 15%North Carolina 11% 12% 12% 11%North Dakota 13% 13% 13% 13%Ohio 12% 13% 13% 12%Oklahoma 15% 16% 16% 15%Oregon 14% 14% 14% 14%Pennsylvania 14% 14% 14% 14%Rhode Island 10% 11% 11% 10%South Carolina 9% 10% 10% 9%South Dakota 13% 14% 14% 13%Tennessee 13% 14% 14% 13%Texas 14% 15% 15% 15%Utah 12% 13% 12% 12%Vermont 13% 14% 14% 14%Virginia 11% 12% 12% 11%Washington 12% 13% 13% 12%West Virginia 12% 12% 12% 12%Wisconsin 13% 14% 14% 14%Wyoming 10% 11% 11% 11%U.S. 12.5% 13.4% 13.3% 13.0%
Table 9 Cont'd.
One of the key inputs to the workforce model is the growth rate of the workforce, and one of the most important indicators that is easy to track and predict is that of the forecast for the number of graduates of U.S. colleges of veterinary medicine. A problem with the original model was the assumption that veterinary student class sizes would increase by 2 percent per year in perpetuity. This would be a remarkable growth rate in whole numbers far exceeding past growth. Accomplishing a sustained 2 percent per year growth rate would require the
equivalent of adding a new veterinary college each year over the forecast period. The average annual growth in the number of new graduates over the 14-year period between 2000 and 2014 was approximately 2 percent. However, this amounts to an actual average annual increase in the number of new students of approximately 45 per year. Because the base number of graduates has increased substantially over this period, a 2 percent growth rate would require that roughly 70 new seats would need to be added each year at each of the U.S. colleges.
FOR THIS REASON, WE THINK THAT THE NUMBER OF GRADUATES WILL STABILIZE AT ABOUT 4,290 (FROM ALL SOURCES) BEGINNING IN THE YEAR 2019, AND NOT INCREASE FOR THE REMAINDER OF THE FORECAST PERIOD.
24 2016 AVMA REPORT on THE MARKET FOR VETERINARY SERVICES

2,000
2,500
3,000
3,500
4,000
4,500
5,000
5,500
Forecast of Graduates of U.S. Colleges of Veterinary Medicine
2008
2002
2000
2004
2006
2010
2012
2014
2016
2018
2020
2022
2024
2026
2028
2030
FORECAST OF GRADUATES OF U.S. COLLEGES OF VETERINARY MEDICINE
Figure 10
In reality, after Midwestern University and Lincoln Memorial University begin graduating students in 2018, we have assumed that no new universities will be opening in the foreseeable future. Further, because of the increasing costs for education and the current equilibrium in the market for education, current veterinary colleges are unlikely to remodel or add a substantial number of new students to their class sizes in the near future unless they can reduce the cost per seat. Even then, they will likely substitute less expensive seats for more expansive seats at other colleges as the willingness to pay for seats at higher prices declines. For this reason, we think that the number of graduates will stabilize at about 4,290 (from all sources) beginning in the year 2019, and not increase for the remainder of the forecast period.
The Bureau of Labor Statistics (BLS) forecasts that through 2022 the number of personnel in state governments will grow at a rate of 0.5 percent per year, and the number of personnel in federal government will decline at a rate of 1.6 percent per year. State and local governments in 2012 employed 19,103,200 people, while the federal government employed 2,814,000 people (BLS 2013). Combining the state and federal growth rates and
weighting them by their relative sizes gives a combined positive growth rate of 0.23 percent per year for all state, local and federal government positions. This is an increase from the IHS model, which predicted a contraction of 0.5 percent of government employees per year. The IHS figure was arrived at by combining 0.8 percent state and local and -1.3 percent federal (BLS 2012) and was a simple average. However, the IHS forecast ignored the fact that combined state governments are seven times larger than the federal government. Rather than a declining number of jobs in state, local and federal government, the new model forecasts an increasing number of jobs. Combined, the number of government positions will increase the demand for veterinarians by 630 FTE veterinary positions by 2025. The 2015 estimate remains unchanged from 2014.
In terms of uniformed service personnel, the current CBO has forecast a decline of 1.5 percent per year through 2025 (CBO 2014). That number is actually a large increase from the previous year’s estimate of an average annual contraction of 1.3 percentage points (CBO 2012).
2016 AVMA REPORT on THE MARKET FOR VETERINARY SERVICES 25

2012
2014
2016
2018
2020
2022
2024
2013
2015
2017
2019
2021
2023
2025
-120
-100
-80
-60
-40
-20
0
0%
2%
4%
6%
8%
10%
12%
Chan
ge in
FTE
s
Grow
th R
ate
of U
nifo
rmed
Ser
vice
s Pe
rson
nel
Effect of Change in Uniformed Services Personnel Projec�ons
2014 Forecast
2015 Forecast
Change in FTEs
EFFECT OF CHANGE IN UNIFORMED SERVICES PERSONNEL PROJECTIONS
Figure 11
As shown in the following figures, the USDA has updated its forecast for the number of food production animals in the United States. The changes in food animals will, in turn, change the demand for food animal veterinarians. First, dairy cattle are forecast to increase substantially in the 2015 forecast compared to the 2014 forecast. The 2014 forecast was, in contrast, a
decrease from its previous forecast, making the 2015 forecast more in line with previous forecasts. This will increase the demand for veterinarians by as much as 60 FTEs in 2020, but that increased demand will decline to be a null change by the end of the forecast period in 2025.
2012
2014
2016
2018
2020
2022
2024
2013
2015
2017
2019
2021
2023
2025
-10
0
10
20
30
40
50
60
70
9.1
9.1
9.2
9.2
9.3
9.3
9.4
9.4
Chan
ge in
FTE
s
Mill
ions
of D
airy
Cow
s
Effect of Change in Dairy Cows Forecast on Veterinarian FTEs
2014 Forecast
2015 Forecast
Change in FTEs
EFFECT OF CHANGE IN DAIRY COWS FORECAST ON VETERINARIAN FTEs
Figure 12
26 2016 AVMA REPORT on THE MARKET FOR VETERINARY SERVICES

Due to the severe drought in the western United States, beef cattle herds have declined. The pace of that decline, however, is not as rapid as previously supposed. This change is compounded
from a previously lowered forecast in 2014 compared to previous years. The decline in the cattle population will lead to about 140 fewer FTEs by the end of the forecast period.
2012
2014
2016
2018
2020
2022
2024
2013
2015
2017
2019
2021
2023
2025
-150
-100
-50
0
50
100
82
84
86
88
90
92
94
96
98
Chan
ge in
FTE
s
Mill
ions
of B
eef C
attle
Effect of Change in Beef Ca�le Forecast on Veterinarian FTEs
2014 Forecast2015 Forecast
Change in FTEs
EFFECT OF CHANGE IN BEEF CATTLE FORECAST ON VETERINARIAN FTEs
Figure 13
Perhaps predictions are foretelling a plateau in the bacon craze seen in recent years. The forecast reported will result in demand for 140 fewer veterinarian FTEs by 2025.
2012
2014
2016
2018
2020
2022
2024
2013
2015
2017
2019
2021
2023
2025
-160
-140
-120
-100
-80
-60
-40
-20
0
58
60
62
64
66
68
70
72
74
76
78
80
Chan
ge in
FTE
s
Mill
ions
of S
win
e
Effect of Change in Swine Forecast on Veterinarian FTEs
2014 Forecast
2015 Swine
Change in FTEs
EFFECT OF CHANGE IN SWINE FORECAST ON VETERINARIAN FTEs
Figure 14
2016 AVMA REPORT on THE MARKET FOR VETERINARY SERVICES 27

The USDA’s 2015 forecast for poultry slightly decreased from 2014. However, it is important to note that the new forecast does not reflect the 2015 Avian Influenza outbreak. In reality, the Avian Influenza outbreak led to a massive increase in the demand for
veterinary services. The total cost of the outbreak is estimated at a minimum of $1 billion, and it is too early to tell how much of a lingering effect the incident will have on the demand for veterinary services.
2012
2014
2016
2018
2020
2022
2024
2013
2015
2017
2019
2021
2023
2025
-6
-5
-4
-3
-2
-1
0
0
2,000
4,000
6,000
8,000
10,000
12,000
Chan
ge in
FTE
s
Mill
ions
of B
roile
rs a
nd L
ayer
s
Effect of Change in Broilers and Layers Forecast on Veterinarian FTEs
2014 Forecast
2015 Forecast
Change in FTEs
EFFECT OF CHANGE IN BROILERS AND LAYERS FORECAST ON VETERINARIAN FTEs
Figure 15
Lastly, the USDA’s 2015 predictions concerning other livestock, including small ruminants, is slightly higher than in 2014. This
will lead to an additional three to five FTEs over the forecast horizon.
2012
2014
2016
2018
2020
2022
2024
2013
2015
2017
2019
2021
2023
2025
-3
-2
-1
0
1
2
3
4
5
6
0
50
100
150
200
250
300
350
400
Chan
ge in
FTE
s
Mill
ions
of O
ther
Liv
esto
ck
Effect of Change in Other Livestock Forecast on Veterinarian FTEs
2014 Forecast
2015 Forecast
Change in FTEs
EFFECT OF CHANGE IN OTHER LIVESTOCK FORECAST ON VETERINARIAN FTEs
Figure 16
28 2016 AVMA REPORT on THE MARKET FOR VETERINARY SERVICES

In total, livestock trends are having a negative effect on the demand for veterinary services. This overall decline is due to several idiosyncratic factors, including drought in the western United States, but the weakening is also indicative of the lowered growth forecast for the U.S. economy. Overall, by the end of the forecast period we expect an overall decline in the demand for food animal veterinarians equal to 300 FTEs, relative to the 2014 forecast.
In conclusion, the AVMA workforce model indicates that excess capacity will continue to decline for the veterinary profession, with the biggest decrease due to the revised estimates of current excess capacity. We expect excess capacity to continue to decline through the forecast period, despite the change in the forecast for the need for food animal veterinary services.
2012
2014
2016
2018
2020
2022
2024
2013
2015
2017
2019
2021
2023
2025
-350
-300
-250
-200
-150
-100
-50
0
50
100
0%
2%
4%
6%
8%
10%
12%
Chan
ge in
FTE
s
Exce
ss C
apac
ity F
orec
ast
Total Effect of Livestock Projec�ons on the 2015 Excess Capacity Forecast
2014 Foreacst
2015 Forecast
Change in FTEs
TOTAL EFFECT OF LIVESTOCK PROJECTIONS ON THE 2015 EXCESS CAPACITY FORECAST
Figure 17
THE USDA’S 2015 FORECAST FOR POULTRY SLIGHTLY DECREASED FROM 2014. HOWEVER, IT IS IMPORTANT TO NOTE THAT THE NEW FORECAST DOES NOT REFLECT THE 2015 AVIAN INFLUENZA OUTBREAK. IN REALITY, THE AVIAN INFLUENZA OUTBREAK LED TO A MASSIVE INCREASE IN THE DEMAND FOR VETERINARY SERVICES.
29

STUDIES
In conjunction with partner institutions, the AVMA has conducted a number of studies on factors important in the market for veterinary services; their summaries follow.
SEASONALITYWhat time of year should companion animal veterinary practices expect to see the highest – and lowest – amount of revenue? To help answer this question, we collected data from the Bureau of Labor Statistics (BLS) Consumer Expenditure Survey (CE) for the years 2005 through 2014. The CE collects information on the spending habits of U.S. consumers, and separates the data into categories of frequently purchased items, including veterinary services. The monthly spending observations were aggregated to form a quarterly time series. The quarterly expenditures on veterinary services for a sample of U.S. consumers are illustrated in the following figure.
Seasonality is a characteristic of time series data where regular and predictable changes recur at specific intervals throughout the year. Any predictable change or pattern in a time series that recurs or repeats over a one-year period can be said to
27.9 percent of revenue in veterinary practices comes from the first quarter, 28.6 percent from the second, 24.9 percent from the third, and only 18.5 percent from the fourth.
30 2016 AVMA REPORT on THE MARKET FOR VETERINARY SERVICES

be seasonal. To estimate the effect of seasonality, a statistical procedure was used that allows for capturing the effect of the first, second, third and fourth quarters on the number of visits and total expenditures. The results show that, compared to the fourth quarter, veterinary expenditures are historically higher
in the first, second and third quarters by 50.8 percent, 54.5 percent, and 34.5 percent, respectively. Simply put, 27.9 percent of revenue in veterinary practices comes from the first quarter, 28.6 percent from the second, 24.9 percent from the third, and only 18.5 percent from the fourth.
2012
2014
2013
2009
2008
2007
2006
2005
2011
2010
$-
$2,000
$4,000
$6,000
$8,000
$10,000
$12,000
$14,000
$16,000
$18,000
Surv
ey E
xpen
ditu
res
Quarterly Veterinary Expenditures, 2005-2014
Veterinary Expenditures Fourth Quarter
QUARTERLY VETERINARY EXPENDITURES, 2005-2014
Figure 18
Having a better understanding of the seasonal spending patterns in the veterinary services industry allows practice managers to separate the signal (seasonal pattern) from the noise (weekly or monthly expenditures). Once the effects of seasonality are controlled, another valuable piece of information emerges: Overall
spending on veterinary services for a specific sample size has decreased between 2005 and 2014. That is, even though the prices of veterinary services have been steadily increasing over this period (BLS, 2014), the amount spent at veterinary service providers is declining for the constant sample (population) size.
Separating the Signal from the Noise
EVEN THOUGH THE PRICES OF VETERINARY SERVICES HAVE BEEN STEADILY INCREASING OVER THIS PERIOD (BLS, 2014), THE AMOUNT SPENT AT VETERINARY SERVICE PROVIDERS IS DECLINING
FOR THE CONSTANT SAMPLE (POPULATION) SIZE.
2016 AVMA REPORT on THE MARKET FOR VETERINARY SERVICES 31
0
20
40
60
80
100
120
140
160
180
200
0
50
100
150
200
250
2005 2006 2007 2008 2009 2010 2011 2012 2013 2014
Num
ber o
f Vis
its in
Sur
vey
Surv
ey E
xpen
ditu
res p
er V
isit
Quarterly Veterinary Visits and Expenditures per Visit, 2005-2014
Expenditures per Visit Veterinary Visits
QUARTERLY VETERINARY VISITS AND EXPENDITURES PER VISIT, 2005-2014
Figure 19
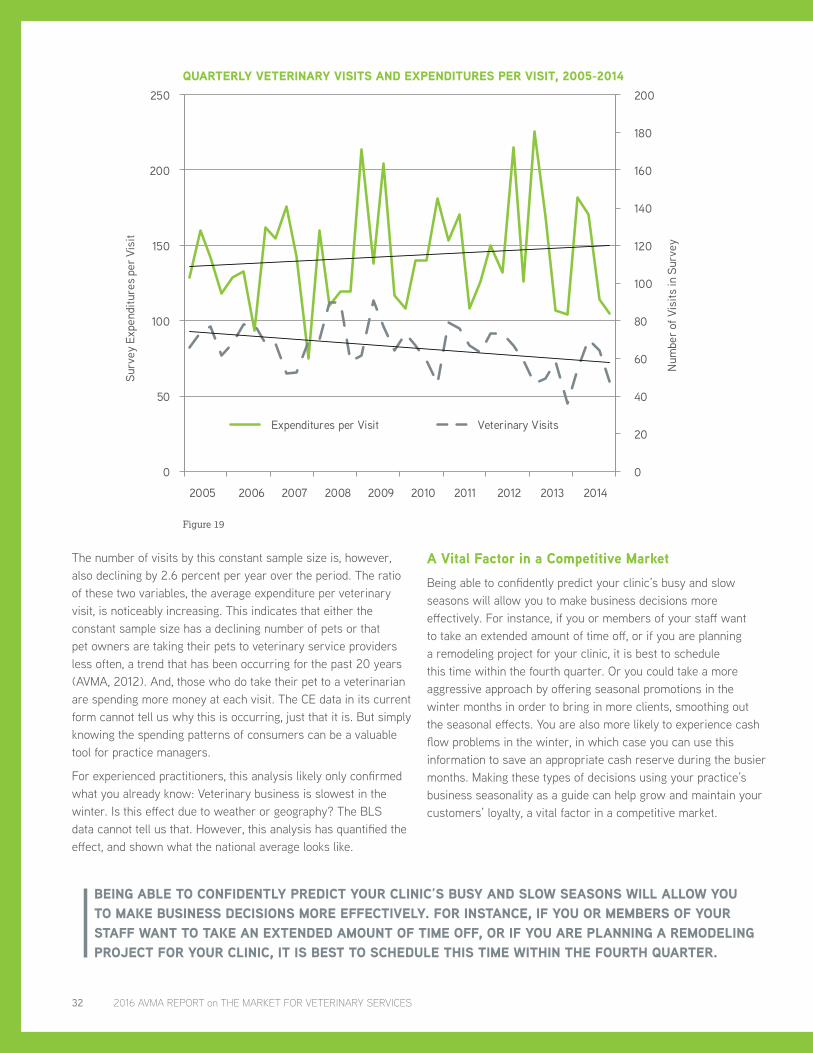
The number of visits by this constant sample size is, however, also declining by 2.6 percent per year over the period. The ratio of these two variables, the average expenditure per veterinary visit, is noticeably increasing. This indicates that either the constant sample size has a declining number of pets or that pet owners are taking their pets to veterinary service providers less often, a trend that has been occurring for the past 20 years (AVMA, 2012). And, those who do take their pet to a veterinarian are spending more money at each visit. The CE data in its current form cannot tell us why this is occurring, just that it is. But simply knowing the spending patterns of consumers can be a valuable tool for practice managers.
For experienced practitioners, this analysis likely only confirmed what you already know: Veterinary business is slowest in the winter. Is this effect due to weather or geography? The BLS data cannot tell us that. However, this analysis has quantified the effect, and shown what the national average looks like.
A Vital Factor in a Competitive MarketBeing able to confidently predict your clinic’s busy and slow seasons will allow you to make business decisions more effectively. For instance, if you or members of your staff want to take an extended amount of time off, or if you are planning a remodeling project for your clinic, it is best to schedule this time within the fourth quarter. Or you could take a more aggressive approach by offering seasonal promotions in the winter months in order to bring in more clients, smoothing out the seasonal effects. You are also more likely to experience cash flow problems in the winter, in which case you can use this information to save an appropriate cash reserve during the busier months. Making these types of decisions using your practice’s business seasonality as a guide can help grow and maintain your customers’ loyalty, a vital factor in a competitive market.
BEING ABLE TO CONFIDENTLY PREDICT YOUR CLINIC’S BUSY AND SLOW SEASONS WILL ALLOW YOU TO MAKE BUSINESS DECISIONS MORE EFFECTIVELY. FOR INSTANCE, IF YOU OR MEMBERS OF YOUR STAFF WANT TO TAKE AN EXTENDED AMOUNT OF TIME OFF, OR IF YOU ARE PLANNING A REMODELING PROJECT FOR YOUR CLINIC, IT IS BEST TO SCHEDULE THIS TIME WITHIN THE FOURTH QUARTER.
32 2016 AVMA REPORT on THE MARKET FOR VETERINARY SERVICES

CONSUMER PREFERENCES FOR PET HEALTH INSURANCEThe nascent pet health insurance market appears to hold potential for insurance and pet health service providers, according to a study conducted jointly by the AVMA and Mississippi State University. In the study, pet owners expressed interest in insurance options, and a willingness to make such a purchase depending on a set of factors. To determine the propensity to purchase pet health insurance – and preferences among policy options potentially offered, the authors performed a discrete choice analysis, employing data from an online survey of pet owners. The results yield a glimpse into pet owners’ initial preferences for insurance policy features – as well as the influence of pet owner characteristics and demographics on decisions to purchase pet health insurance.
The methodology considers consumer demand, motivations and behavior along with market characteristics and attributes of the
product as provided by existing companies: Five plan attributes were presented to include in insurance policies: monthly base premium, annual deductible, reimbursement level, unlimited maximum annual benefits and wellness coverage. These attributes were identified as potentially influencing willingness to pay for insurance. As the utility evaluation of options also depends on a potential purchaser’s risk tolerance, the model measured risk aversion, by asking respondents to speculate as to the likelihood their pet would become ill in the next year, as well as how risk averse they identified themselves. While most thought their risk preferences were about the same as their neighbors, their risk perceptions tended to vary much more – posing a challenge in predicting pet owner action, and calling for the examination of other factors in their lives that affect decisions. Hence, key socio-demographic and pet-relationship variables assessed the degree of owner-pet bond.
Costs Incurred, Usage GaugedFrom the sample of 526 respondents, the average amount spent on medical treatment for the selected pet was $248. Only 37 of the respondents covered the medical treatments with a pet insurance policy. From the group of respondents that used pet insurance on their medical treatment, an average of $396 was spent exclusively on medical treatment. When we asked these respondents what they looked for when purchasing pet insurance, 51 percent revealed that they were looking at the insurance premium, 38 percent at the type of insurance, and 10 percent at other, unknown factors.
Insurance buys, the study suggests, are sensitive to product pricing: As the price increases, the likelihood that a consumer will purchase pet health insurance drops. As a policy’s reimbursement percentage increases, however, a consumer is more likely to buy pet health insurance. And, inclusion of unlimited benefits and a wellness plan will increase the probability that a consumer will purchase a pet health care plan. Finally, study findings suggest that the more likely a consumer expects a pet to require medical care, the more likely they are to purchase pet insurance.
Who and How Much?Unsurprisingly, pet owners who consider their pet to be part of the family are more likely to purchase pet health insurance than those who do not consider their pet part of the family, though
the respondent’s location of residence is not likely to influence a pet owner’s decision to purchase pet health insurance. Older respondents were less likely to purchase insurance than younger respondents, though the coefficients for income levels were not statistically significant, suggesting that the income categories as defined had no discernible bearing on a respondent’s preference for pet health insurance. While income did not affect the decision to purchase insurance, the ability to tolerate the cost of a medical emergency for the pet does affect the probability that a pet owner will purchase pet health insurance.
Those who responded that an unanticipated $1,000 veterinary bill would present financial difficulty were found to be more likely to purchase pet health insurance. This suggests that those living paycheck to paycheck, regardless of income, would likely prefer a planned monthly expense in the form of an insurance premium than face a sudden and unexpected veterinary bill. In other words, a welcome trade-off materializes through policies that present manageable monthly premiums and circumvent infrequent, though costly, medical expenses. An average premium of $41.79 per month is considered manageable for plans that include unlimited benefits, with an extra $27.23 per month for plans that include wellness visits. Our conclusion: Pet insurance premium, reimbursement level, unlimited benefits and including wellness visits in a pet health insurance plan all have statistically significant effects on pet owners’ purchase decisions.
WHEN WE ASKED THESE RESPONDENTS WHAT THEY LOOKED FOR WHEN PURCHASING PET INSURANCE, 51 PERCENT REVEALED THAT THEY WERE LOOKING AT THE INSURANCE PREMIUM, 38 PERCENT AT THE TYPE OF INSURANCE, AND 10 PERCENT AT OTHER, UNKNOWN FACTORS.
2016 AVMA REPORT on THE MARKET FOR VETERINARY SERVICES 33
The market for veterinary services is a $31 billion industry made up of tens of thousands of firms. This section looks at the composition of these firms, their employment and output, and the distribution of them by state.
IMPLAN (Impact Analysis for Planning) is an economic input-output model designed for economic impact analysis. Originally developed by the USDA Forest Service and now maintained by a private group, it measures the economic and social impacts of a change in the economic environment for any given region in the United States. Part of the IMPLAN dataset includes estimates on the number of state-level distribution of firms in the veterinary industry.
Establishments, according to the IMPLAN definition, are not necessarily veterinary practices. This estimate includes establishments that may not necessarily be clinics, but rather could be animal control centers, animal shelters, veterinary-focused pharmaceutical companies, veterinary testing laboratories, and veterinarian independent contractors, many of whom are relief veterinarians.
The input-output account matrix provides information on the degree of relationship between different industries within the economy. The relationship is typically presented in a form of multipliers showing the share of the rest of the industries from a one-dollar investment made by an industry, for example, the veterinary services industry. These multipliers enable the tracking of the effect of a change in the production plan of the veterinary services industry on the output of all industries that contribute to the production of the output of the veterinary services industry.
The IMPLAN data provides for every industry the total number of employees, the industry labor income, and the total value of output. The employment, labor income and output associated with the industry of interest are called “direct effects.” The multipliers enable us to determine the “indirect” and “induced” effects. These terms refer to the changes that occur in other industries due to the change in the veterinary services industry. For instance, a change in the demand for veterinary services will
cause the pharmaceutical industry to revise its production plan to meet the new demand in the veterinary industry. The changes in the pharmaceutical industry are captured in the indirect effects.
Determining the Number of Practices by StateThe number of establishments was obtained from the Barnes Reports on U.S. Industry & Market Outlook – Veterinary Services Industry. The veterinary service sector (54194) as defined by the North American Industry Classification System (NAICS) and used in the Barnes Reports comprises entities that sell veterinary services to animal owners as well as establishments that supply testing services to veterinary practices. The Barnes Reports provide an estimated number of establishments, employees, and the total value of output at the state and national level for the current year and give a prediction of these variables for the next two years. In addition to the state and the national data, the reports present the same variables for the U.S. metropolitan areas. The industry is divided by sub-groups relative to the size of establishment. In 2014, for example, the veterinary services industry encompassed 37,840 establishments composed of 9,306 establishments employing between one and four people; 8,736 establishments with a capacity of five to nine people; 8,832 establishments with 10 to 19 employees each; 3,376 establishments in the category of having 20 to 49 employees; 293 establishments with a total employee group of 50 to 99 workers; 58 establishments with 100 to 249 employees; 10 establishments with 250 employees or more; and 7,229 single-operator establishments. The following table presents the estimated and projected number of establishments, employees, and the value of industry sales from 2014 to 2018 as reported in the 2013 edition of the Barnes Report.
Table 2 shows the state total employment as estimated by Barnes Reports and as reported in the IMPLAN 2013 data. The difference in the total employment between the two sets of data might lie in the definition of the industry. In fact, the IMPLAN sector 459 (veterinary services) does not match the same definition as NAICS 54194. For instance, pet stores are included in retail stores (sector 400 – 401) in IMPLAN, not in sector 459.
VETERINARY PRACTICES
37,840 ESTABLISHMENTS
=+7,229 SINGLE-OPERATOR ESTABLISHMENTS 3,376 WITH 20-49 EMPLOYEES
9,306 EMPLOYING 1-4 PEOPLE 293 WITH 50-99 WORKERS8,736 WITH 5-9 PEOPLE 58 WITH 100-249 WORKERS
8,832 WITH 10-19 EMPLOYEES 10 WITH MORE THAN 249 EMPLOYEES
34 2016 AVMA REPORT on THE MARKET FOR VETERINARY SERVICES

YearNumber of
Establishments
Number of Establishments with Employees
EmploymentIndustry Output
($ millions)2014 37,840 30,611 331,474 $27,293 2015 39,938 32,308 349,856 $29,156 2016 42,022 33,994 368,113 $30,964 2017 44,301 35,838 388,075 $34,510 2018 46,880 37,924 410,671 $38,433
VETERINARY INDUSTRY NATIONAL FORECAST
Table 10
The following table gives an estimate of the number of employees in the veterinary industry per state.
Alabama 5,501 Montana 1,804 Alaska 764 Nebraska 2,860 Arizona 7,079 Nevada 2,898 Arkansas 2,724 New Hampshire 2,191 California 35,373 New Jersey 8,579 Colorado 8,181 New Mexico 2,136 Connecticut 4,340 New York 17,178 Delaware 1,063 North Carolina 12,425 D. Columbia 267 North Dakota 759 Florida 21,235 Ohio 12,964 Georgia 10,630 Oklahoma 4,827 Hawaii 1,035 Oregon 6,545 Idaho 2,278 Pennsylvania 13,324 Illinois 13,620 Rhode Island 1,161 Indiana 7,839 South Carolina 4,518 Iowa 4,048 South Dakota 1,179 Kansas 5,144 Tennessee 7,544 Kentucky 4,895 Texas 26,522 Louisiana 4,756 Utah 2,382 Maine 1,957 Vermont 1,154 Maryland 7,598 Virginia 12,100 Massachusetts 7,464 Washington 9,279 Michigan 10,063 West Virginia 1,764 Minnesota 6,815 Wisconsin 8,050 Mississippi 2,751 Wyoming 996 Missouri 7,349 U.S.A. 351,010
VETERINARY INDUSTRY EMPLOYMENT BY STATE, 2013
Table 11
The number of private practice veterinarians per data, from AVMA data, is displayed in the map on the following page (Figure 20).
Mapping the number of veterinary establishments yields the next thematic illustration (Figure 21). States such as California, Texas, Florida and New York have the highest number of establishments. As expected, the number of firms closely follows total population.
2016 AVMA REPORT on THE MARKET FOR VETERINARY SERVICES 35

Number of Veterinarians
WA
MN
AZ
CO
MT ND
SD
IANE
KS
OK
TX
HI
LA
AR
MO
IL
WIMI
IN OH
PA
NY MA
VA
NJ
MD
NCTN
MS AL
FL
GA
KY
SC
WV
ME
NH
CT
DE
RI
VT
WY
UTNV
CA
NM
ID
OR
52-300301-600601-900901-1,2001,201-2,0002,001-4,343
AK
NUMBER OF PRIVATE PRACTICE VETERINARIANS BY STATE, 2013
Figure 20
36 2016 AVMA REPORT on THE MARKET FOR VETERINARY SERVICES
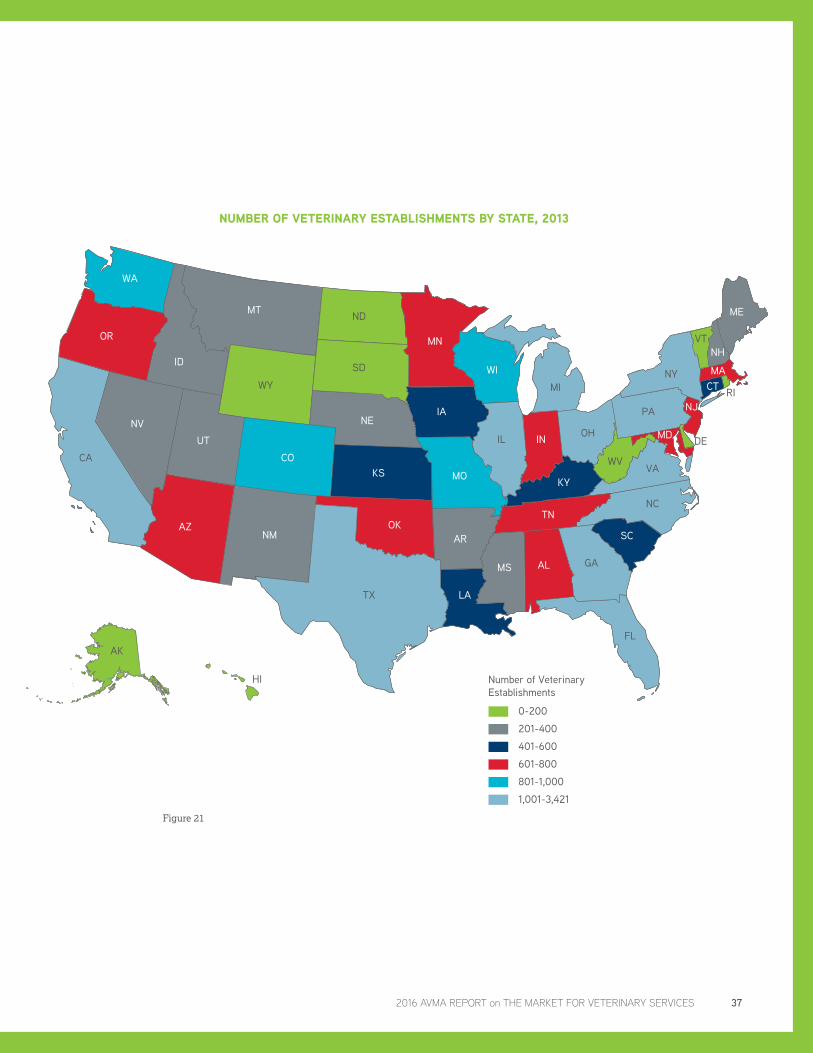
Number of Veterinary Establishments
WA
MN
AZ
CO
MT ND
SD
IANE
KS
OK
TX
HI
LA
AR
MO
IL
WIMI
IN OH
PA
NY MA
VA
NJ
MD
NCTN
MS AL
FL
GA
KY
SC
WV
ME
NH
CT
DE
RI
VT
WY
UTNV
CA
NM
ID
OR
0-200
201-400
401-600
601-800
801-1,000
1,001-3,421
AK
NUMBER OF VETERINARY ESTABLISHMENTS BY STATE, 2013
Figure 21
2016 AVMA REPORT on THE MARKET FOR VETERINARY SERVICES 37

To view the veterinary services industry in a more useful way, one can remove the effect of population by examining the location quotient of veterinarians. The location quotient is simply the number of private practice veterinarians in a state, divided by the state’s population, which is in turn divided by the ratio of the
total number of private practice veterinarians in the entire United States divided by the U.S. population. When the ratio is below 1, this indicates that a state has fewer veterinarians than the national average, and when the ratio is above 1, this indicates that a state has more veterinarians compared to the national average.
Location Quotientof Veterinarians
WA
MN
AZ
CO
MT ND
SD
IANE
KS
OK
TX
HI
LA
AR
MO
IL
WIMI
IN OH
PA
NY MA
VA
NJ
MD
NCTN
MS AL
FL
GA
KY
SC
WV
ME
NH
CT
DE
RI
VT
WY
UTNV
CA
NM
ID
OR
0.57-0.75
0.75-0.99
0.99-1.10
1.10-1.49
AK
VETERINARY INDUSTRY LABOR QUOTIENT BY STATE, 2013
Figure 22
38 2016 AVMA REPORT on THE MARKET FOR VETERINARY SERVICES

METRO MARKET PILOT STUDYAlong with augmenting data gathered in the AVMA’s established national Pet Ownership and Demographics Survey (PDS), a geographic market-focused study conducted in 2015 as a “pilot” effort endeavored to validate responses from previous PDS studies, in part by comparing survey responses to the actual sales records of veterinary clinics. Seeking answers about where survey subjects took their dog for care, how often they sought care, and how much they paid for it, the Metro Pilot Study was conducted under the direction of the AVMA by the National Center for Food and Agricultural Policy, Washington, D.C., in association with the Iowa State University of Science and Technology Center for Survey Statistics and Methodology, Ames, Iowa. Concentrating on the combined statistical area (CSA) of Raleigh-Durham, N.C., the study sought valuable market research about the choices made by dog owners in procuring services and products for their pet’s care. The survey was directed to a random sample of the CSA’s general population, as well as to individuals who were identified as clients of veterinary clinics, isolating dog-owning households within each group. Clinic records indicate that some 90 percent of the households comprising the latter group owned three or fewer dogs.
According to the most recent (2012) PDS, 19 percent of dog-owning and 44 percent of cat-owning households did not visit a veterinarian with their pet during the previous year, findings that prompted questions that not only speak to market opportunity for veterinary enterprises, but to public health concerns, as well. As such, the Pilot survey aimed to develop an understanding of pet-owner behavior as it relates to the questions concerning whether households that evidently did not take their pet to a veterinary clinic or hospital seek care elsewhere; the number of pet-owning households that skip visiting any providers; and whether households reporting veterinarian visits go to a clinic or hospital or see a veterinarian working at some other type of establishment. While in some instances the study yielded no new information, in others it elicited new insights into the use of
veterinary care alternatives and product patronization among the survey group. Two survey instruments – one including questions asked in the PDS, and one with new questions about health care visits – were offered in either an online or paper form. The latter, it was believed, would more effectively glean responses from a wider range of households by reaching into lower income groups, representation of which was judged deficient in the previous, online-only survey. Variables relative to the potential variety of service items received and the dates of their “transaction” were not calculated or reported since it is unclear as to whether they were associated with one or multiple visits.
What Prompted Visits – and to WhereTo better comprehend the variety of health issues that sent pet owners to veterinarians or other care providers, the Pilot study included questions asking about reasons for visits. Previous study queries had merely asked whether owners had bought any of 20 services or products listed. Surmising that respondents might be better able to recall the reason for a visit, rather than the services or products received during said visit, Pilot study authors asked why a dog was taken for health care attention. The new information derived from this question is reflected in Figure 23 on the following page, which documents responses from distinct study groups as to what disorders received attention from a professional – either during a routine visit or through a special visit – and what types of conditions were treated at home. Findings revealed that while some health issues such as flea/tick problems, diarrhea/vomiting, and even injuries (lacerations, broken bones) were addressed at home, other issues – including intestinal worms, ear, eye, and dental problems, and skin/fur maladies – were more likely to be addressed during a routine check-up instead of a separate visit. All of the latter such excursions reported in the Pilot Study were to a veterinary clinic or hospital.
ACCORDING TO THE MOST RECENT (2012) PDS, 19 PERCENT OF DOG-OWNING AND 44 PERCENT OF CAT-OWNING HOUSEHOLDS DID NOT VISIT A VETERINARIAN WITH THEIR PET DURING THE PREVIOUS YEAR.
19% 44%
2016 AVMA REPORT on THE MARKET FOR VETERINARY SERVICES 39

0
10
20
30
40
50
60
70N
umbe
r of
Surv
ey R
espo
nden
ts
How Do People Handle Health Issues?
Veterinarian, Made a Separate Visit
Veterinarian, as Part of a Routine Checkup
Handled at Home
Heartw
ormInt
estin
al Worm
sDiar
rhea/V
omitin
g
Ear
Eye
Dental
Skin/
Fur
Fleas
/Tick
s
Injury
Poiso
ning
Chron
ic
Other
HOW DO PEOPLE HANDLE HEALTH ISSUES?
Figure 23
Details as to routine check-ups were sought in the Pilot through questions that explicitly inquired as to frequency and price paid for such visits (which were presumed to include vaccinations). A veterinary clinic or hospital proved to be the choice for obtaining a routine check-up for the vast majority of respondents (an average of 86 percent among two subgroups in the survey) who indicated that they had taken their dog somewhere for this type of exam in the previous 12 months. Veterinarians serving the community surveyed, according to the Pilot study, face minimal competition from public clinics or animal shelters for routine check-ups and vaccinations – though “big box” pet stores pose some competition. One category where the study identified a networthy level of market share – especially among veterinary clients – is that of mobile facilities.
Another category of care studied pertained to canine spaying and neutering and euthanasia – services identified as “once-in-a-lifetime care.” Though purchase of this type of service occurs only once for an individual pet, the price charged for the package of veterinary procedures, medications and services either service entails could determine whether or not a dog owner opts for sterilization of the animal, and whether or not to euthanize. Within the Raleigh-Durham CSA, it was discovered through the Pilot, veterinarians face competition from animal shelters and public clinics for spaying and neutering dogs – a consumer decision, it could be speculated, influenced by the fact that sterilization is provided free of charge by humane societies and public clinic providers. The study concluded, however, that for the CSA surveyed, veterinary clinics or hospitals exclusively maintain the market for euthanizing dogs.
Special FoodFlea/Tick Products
Dental Products
Vitamins & Supplements
OTC Medications
Products Purchased? 34% 66% 25% 26% 6% Address Sample 30% 65% 18% 20% 5% HSAH Sample 40% 67% 35% 35% 9%If so, from where? Veterinary Clinic or Hospital 24% 44% 21% 11% 22% Pet Shop 14% 7% 15% 7% 7% Pet-Focused Retail Store 30% 14% 33% 14% 20% Grocery or Other Retail 9% 9% 12% 24% 26% Internet/Online 20% 23% 18% 43% 22% Other 3% 3% 1% 1% 3%
PURVEYORS OF PET CARE SUPPLIES
Table 12
40 2016 AVMA REPORT on THE MARKET FOR VETERINARY SERVICES

When the survey data are paired with actual purchase records, it was observed, there tends to be an inclination among consumers to underreport actual visits. When it comes to discovering how often special visits are made to a veterinary clinic for chronic or episodic pet health issues, the PDS – which asked only if respondents did or did not obtain services as listed during the last visit to the vet, and during the whole prior year – was of little help. Comparisons of accuracy among surveys call into question PDS validity relative to deworming, dental care, grooming and food, however, indicate the study to be reasonably valid concerning exams, spay/neuter, euthanasia, boarding, medications and flea/tick products. Survey responses confirmed by purchase records indicate that non-routine check-up visits to a veterinarian specifically for de-worming is rather rare, and since the procedure is frequently part of what dog owners deem a routine checkup, they might forget that treatment was administered. Similarly is the case with dental care recall, and both hypotheses are testable. When the count of these services obtained only on dates when vaccines were not provided to
the PDS survey responses is compared, the correspondence improves significantly. This analysis revealed that:
• The share of dog owners purchasing grooming during vaccine visits (15 percent) corresponds to the share of dog owners reporting they obtained grooming from a veterinarian in the past 12 months (17 percent). A larger share of respondents made special visits during which grooming services were purchased according to purchase records (36 percent), which were not reported on the survey.
• The share of dog owners purchasing dental care during special visits (28 percent) corresponds to the share of dog owners reporting they obtained dental care from a veterinarian in the past 12 months (32 percent).
• The share of dog owners purchasing de-worming care during special visits (23 percent), corresponds to the share of dog owners reporting they obtained de-worming from a veterinarian in the past 12 months (21 percent).
Bundled Services and Recall
0% 20% 40% 60% 80% 100% 120%
BoardingEuthanasiaGrooming
Dental CareFood
MedicationsFlea/Tick Products
DewormingSpay/Neuter
Exam
Accuracy of Recall for Specific Veterinary Services
Actual
Recall
ACCURACY OF RECALL FOR SPECIFIC VETERINARY SERVICES
Figure 24
VETERINARIANS SERVING THE COMMUNITY SURVEYED, ACCORDING TO THE PILOT STUDY, FACE MINIMAL COMPETITION FROM PUBLIC CLINICS OR ANIMAL SHELTERS FOR ROUTINE CHECK-UPS AND VACCINATIONS – THOUGH “BIG BOX” PET STORES POSE SOME COMPETITION.
2016 AVMA REPORT on THE MARKET FOR VETERINARY SERVICES 41

When survey respondents were asked to recall how many visits they made to the veterinarian in the past month, answers were compared to the number of visits reported by the veterinary clinic. The mean was around zero, with the vast majority of
respondents within plus or minus two visits of the actual number, but with some respondents saying they visited 16 times more than the actual, and some reporting 18 times fewer than their actual number of visits.
0%
5%
10%
15%
20%
25%
-18 -16 -14 -12 -10 -8 -6 -4 -2 0 2 4 6 8 10 12 14 16
Number of Recalled Visits Minus Actual Number of Visits
Accuracy of Recall for Total Veterinary VisitsACCURACY OF RECALL FOR TOTAL VETERINARY SERVICES
Figure 25
Boarding and FeedingTo learn more about patronization patterns for boarding, grooming and day care, the Pilot widened questioning beyond the original PDS questions, which restricted query to asking only if boarding and if grooming had been purchased from a veterinarian or not during the last visit, and during the last year. Hence, the Pilot was crafted to explicitly ask the number of days a pet was boarded, the times groomed, and the prices paid per day of boarding or for grooming. While kennels and boarders were cited as the top service provider group for dog boarding, veterinary clinics and hospitals took second place. The Pilot gathered responses relative to the “quantities” purchased and the average price paid per day boarded, by provider type. The study disclosed that respondents who reported having boarded the dog concerned did so for an average of 10 days per year. Daily boarding fees noted in the study range from $20 to $100 at kennels/boarders to $22 to $200 at a veterinarian establishment. The less expensive the provider, the report found, the more days were demanded by customers, with the opposite noted in the case of pricier providers.
In the final section to discern purchasing patterns among dog owners, responses yielded information relative to percentages of product types procured for the pet, as well as identified the types of providers patronized when dog owners bought special food, flea/tick products, dental products, vitamin supplements, digestive/urinary aids, and over-the-counter (OTC) medications. Pet-focused retail stores led in the special food and dental
products categories; the two largest percentages of vitamin supplement purchases were through internet/online sources, and grocery or other retail outlets, respectively; but that veterinary clinics and hospitals manage to hold sway in the domain of flea/tick product purchases. More than a quarter of purchases of OTC medications, the study found, were made at a grocery or other retail establishment, with veterinary clinic or hospital tying internet/online sources for second place.
Examining ExpendituresIn looking to validate respondents’ reports of total expenditures made on visits for the year, analysis of responses indicate a pattern wherein some consumers recall spending more – about $100 more – than actual records indicate (though the Pilot appears to capture answers that reflect true outlays for specific, routine visits). Given the likelihood that a share of households – primarily those signifying a higher outlay – patronize more than one veterinarian, a future survey question might ask explicitly whether multiple veterinarians are seen – and whether a positive response to the question is associated with attention to multiple dogs. Study validation determined that the PDS, while fuzzy on details as to specific services obtained, did elicit accurate responses concerning how much was spent for veterinary services in the prior 12 months. The Pilot’s questioning of average prices paid per visit also provides value, as the average response was $173 – considerably close to the average purchase record amount paid of $178!
42 2016 AVMA REPORT on THE MARKET FOR VETERINARY SERVICES
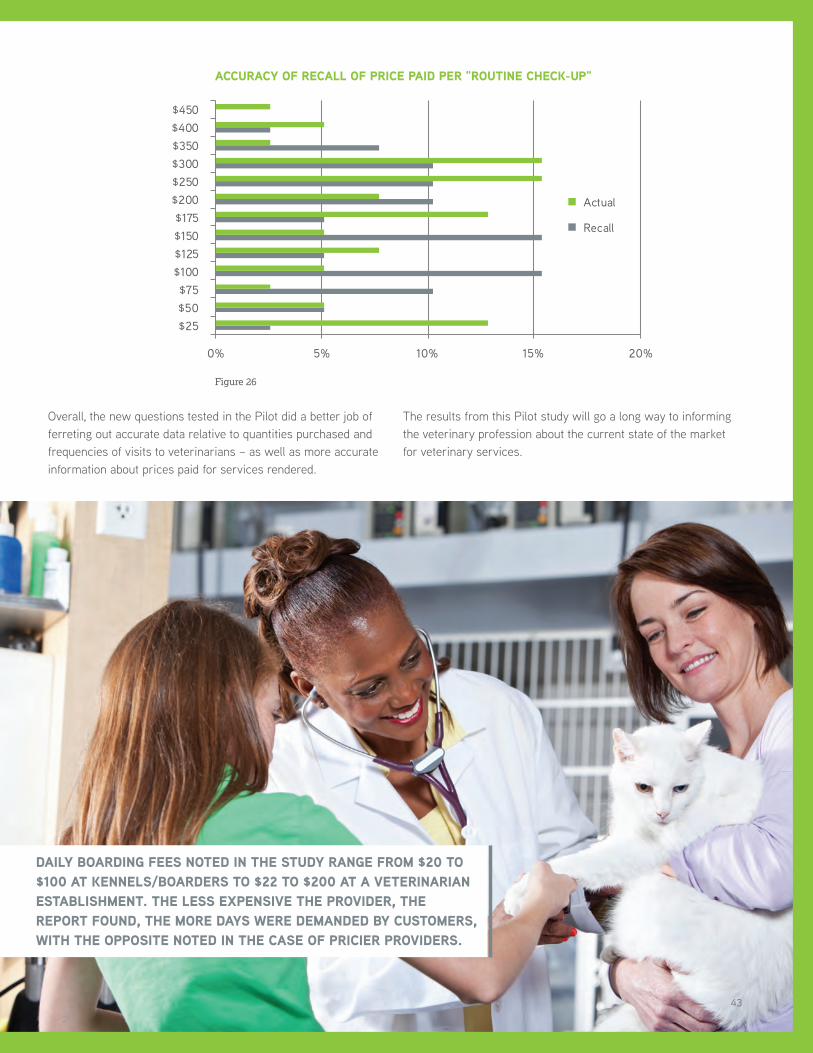
0% 5% 10% 15% 20%
$25$50$75
$100$125$150$175
$200$250$300$350$400$450
Accuracy of Recall of Price Paid per "Rou�ne Check-up"
Actual
Recall
ACCURACY OF RECALL OF PRICE PAID PER "ROUTINE CHECK-UP"
Figure 26
Overall, the new questions tested in the Pilot did a better job of ferreting out accurate data relative to quantities purchased and frequencies of visits to veterinarians – as well as more accurate information about prices paid for services rendered.
The results from this Pilot study will go a long way to informing the veterinary profession about the current state of the market for veterinary services.
DAILY BOARDING FEES NOTED IN THE STUDY RANGE FROM $20 TO $100 AT KENNELS/BOARDERS TO $22 TO $200 AT A VETERINARIAN ESTABLISHMENT. THE LESS EXPENSIVE THE PROVIDER, THE REPORT FOUND, THE MORE DAYS WERE DEMANDED BY CUSTOMERS, WITH THE OPPOSITE NOTED IN THE CASE OF PRICIER PROVIDERS.
43

DISCUSSION
The 2013 AVMA Workforce Study was conducted to estimate the amount of unutilized veterinary services capacity (excess capacity), but more importantly, to identify data shortfalls for obtaining accurate measures of the factors that affect the performance of veterinary markets. The 2013 study adequately achieved both goals, but as this report notes, improvements to the capacity utilization measures are both necessary and underway.
The most important factors in measuring excess capacity are prices of veterinary services and incomes of veterinary service consumers. As incomes rise, the price at which the same number of pet and animal owners are willing to purchase veterinary services increases. As the real price of veterinary services declines, the willingness of pet and animal owners to purchase these services will increase. And, just as important, as the pet
and animal owner expectations on costs of veterinary services becomes more in line with the actual prices charged, the leakage of clients from veterinary practices will decline.
As the figure below illustrates, the prices that consumers pay at veterinary practices have been following a historical upward trend for some time above and reach beyond the normal rate of inflation. Through the mid-1990s, the price of veterinary services was generally in line with the rest of the economy, but in the late 1980s began declining. This decline coincided with a smaller share of companion animals forgoing yearly wellness visits. In the mid-to-late 1990s prices began accelerating much faster than the general price level in the United States. This subsequently coincided with an increase in the percent of companion animals forgoing yearly wellness exams.
0%
10%
20%
30%
40%
50%
60%
70%
80%
90%
100%
0
50
100
150
200
250
300
350
Inde
x (1
985=
100)
Rela�ve Price of Veterinary Services
Veterinary Services Price Index (VSPI)Consumer Price Index (CPI)
Cats With No VisitsDogs With No Visits
1976
1972
1980 1984
1992
1988
1996
2000
2008
2004
2012
VETERINARY SERVICES PRICING AND PATRONAGE TRENDS
Figure 27
44 2016 AVMA REPORT on THE MARKET FOR VETERINARY SERVICES

As we have indicated in previous reports, increases in consumer income increase demand, while a reduction in price increases the quantity demanded. To the untrained in Economics, a change in demand and a change in the quantity demanded might sound the same, but they are very different. Demand represents the price and quantity relationship for all pet/animal owners. At some price point, the demand can be segmented by those willing to pay and those who are unwilling to pay (even though they need the service). Each increase in price will expand the number of pet and animal owners who are unwilling to pay for the service, and reduce the number who are willing to pay. Of course, the important question is whether a price increase will generate more income than is lost through the reduction in the number of pet and animal owners willing to pay.
There have been numerous instances in the past where various veterinary practice management consultants have noted that all veterinary services are price inelastic, and thus veterinarians can continue to raise prices and increase revenue (for example Brown and Silverman 1999). However, our analysis suggests that this may not be the case. To the contrary, using the best data currently available and cutting-edge econometric techniques, we cannot say with confidence we know the elasticity of even one veterinary service (e.g. wellness exams), though our current analysis would suggest wellness exams are price elastic. Better data, however, are necessary to make that claim with certainty. Most important here is that even with the best available data and the application of the best available analytic methods, we are unable, for even a single veterinary service, to definitively provide price elasticities. Thus, we question any previous claim pertaining to the price elasticity of demand for veterinary services.
The income elasticity of demand is yet another problem. Demand, which is the combination of all price and quantity points, is increased as income increases. The recent recession drastically reduced income and thereby created a reduction in demand. As the price that veterinarians were charging for their services increased prior to the recession, the quantity demanded for those services dropped precipitously as a result of the recession’s
negative impact on personal disposable income. Any increase in real price (a rise in veterinary prices at a pace faster than the increase in inflation) during the recession would further exacerbate the decline in demand. How much the drop in income and increase in price each affected the drop in the quantity of demand for veterinary services is unknown due to the lack of knowledge about price and income elasticities.
The Why and the WhatExcess capacity is the ability to provide services in excess of the quantity demanded at a price acceptable to both the buyer and the seller. The concept is different than excess supply (oversupply) because it includes price. Identifying the level of excess capacity that is a problem in the veterinary practice is of little use without understanding why it has occurred and what strategies can be used to ameliorate its adverse effects on practice profitability. Three strategies are possible: Reduce supply, increase demand, or lower the price of services so that their price level increases slower than the growth rate in general prices. Each of these strategies will provide a certain level of benefits at a specific cost. Understanding the relative benefits and costs of each strategy is imperative before a decision is made.
Many veterinarians have argued for a reduction in the number of veterinarians to reduce the supply of veterinary services and thus reduce excess capacity and increase practice profitability. Others have advocated for the increase in demand by increasing client visits and compliance. Still others have advocated for continued increase in prices. While it may be possible that any one of these might work, as yet there is not sufficient evidence to suggest which strategy or combination of strategies will produce the greatest return on investment. This is the point of the workforce model: to develop a method and process whereby these different strategies can be measured and compared. This process will not be easy to develop nor can it be developed in a short period of time. A workforce model that provides the appropriate strategies to improve the long-term sustainability of veterinary practices will require a considered and sustained effort, with participation from every veterinarian in the profession.
2016 AVMA REPORT on THE MARKET FOR VETERINARY SERVICES 45
REFERENCESAnon. (2013) Barnes Reports on U.S. Industry & Market Outlook – Veterinary Services Industry (2013).
Anon. (2013) “Industry employment and output projections to 2022.” Monthly Labor Review Bureau of Labor Statistics, December 2013.
Anon. (2014) Long-Term Implications of the 2015 Future Years Defense Program Congressional Budget Office. November 2014.
Anon. (2015) USDA Long-term Projections, United States Department of Agriculture, February 2015.
Anon. (2016) “Industrial Production and Capacity Utilization,” Federal Reserve Statistical Release G.17 (419), October 17, 2016. https://www.federalreserve.gov/releases/g17/Current/g17.pdf
Brown, John and Jon Silverman. (1999) "The Current and Future Market for Veterinarians and Veterinary Medical Services in the United Sates," JAVMA 215(2):161-183.
Dall, Timothy. (2013) “2013 U.S. Veterinary Workforce Study: Modeling Capacity Utilization” Final Report for the American Veterinary Medical Association, April 16, 2013.
Kilkenny, Maureen, Zhengyuan Zhu, Janice Larson and Anthony Connor. (2016) “Report on Metro Area Pilot Survey Study” working paper.
Williams, Angelica, Keith Coble, Brian Williams, Michael Dicks and Ross Knippenberg. (2016) “Consumer Preferences for Pet Health Insurance” working paper.
46 2016 AVMA REPORT on THE MARKET FOR VETERINARY SERVICES
2016 AVMA REPORT on THE MARKET FOR VETERINARY SERVICES 47

VeterinaryEconomics
THE AVMA 2016 ECONOMIC REPORTS INCLUDE:
The AVMA Report on Veterinary Markets:
This report summarizes the economics and finance research presented at the annual AVMA Economic Summit and provides information about general U.S. economic conditions and the markets for veterinary education, veterinarians and veterinary services, and the performance of veterinary practices.
The AVMA & AAVMC Report on the Market for Veterinary Education:
The market for veterinary education is the beginning of the pipeline to the market for veterinary services. This report examines the characteristics of veterinary college applicants, the supply of and demand for veterinary education, and the performance of the market in providing new veterinarians.
The AVMA Report on the Market for Veterinarians:
This report explores the demographics and employment of the veterinary profession: where they are located, what type of work they do, how much they are compensated, and how they are managing their educational debt. The report also measures unemployment and underemployment and identifies the contributing factors, and explores the performance of the market based on the value of the DVM degree.
The AVMA Report on the Market for Veterinary Services:
All demand for veterinarians and veterinary education begins with the demand for veterinary services. This report provides the latest information on the price of veterinary services, price and income elasticity, and the financial performance of veterinary practices. Our forecasts of capacity utilization and excess capacity for regions and types of practices provide an indication of the performance of this market.