the live export industry - livecorp · the port of darwin in the northern territory. the live sheep...
TRANSCRIPT

This publication is published by Meat & Livestock Australia Limited ABN 39 081 678 364 (MLA). Care is taken to ensure the accuracy of information in the publication. Reproduction in whole or in part of this publication is prohibited without the prior written consent of MLA.
The Live Export Industry: Value, Outlook and Contribution to the Economy
Project code: LIVE.314
Prepared by: Hassall & Associates Australia
Date published: July 2006
ISBN: 1 74036 819 3 PUBLISHED BY Meat & Livestock Australia Locked Bag 991 NORTH SYDNEY NSW 2059
Value of the live export industry
Executive Summary This study provides a quantitative and qualitative assessment of the value of the livestock export industry to the Australian economy and the regional communities where the industry is conducted. It also includes an assessment of the impact a closure of live trade would have on the livestock industry across Australia. Live sheep and cattle exports are a major sector of the Australian livestock industry, earning an average of $830 million1 annually between 2001 and 2005. The 4.2 million sheep exported live in 2005 represented 12% of the total sheep and lamb turn-off. The 573,000 cattle exported live in 2005 represented 7% of the total cattle turn-off2. The prosperity of Australian sheep and cattle producers is linked to the live export trade as domestic prices are underpinned by the trade. The live export of beef cattle industry is centred on ports in the north of Western Australia and from the Port of Darwin in the Northern Territory. The live sheep export industry is centred on Fremantle, Western Australia. The export of dairy cattle sourced from southern Australia, in particular, Victoria, is a growing live export sector. Importance of the live export industry to the domestic market for livestock Cessation of livestock exports would have an immediate adverse impact on the sheep and cattle industries, as well as a longer term structural impact. The sudden loss of live export markets, when they account for high proportions of turnoff, would inevitably cause temporary financial chaos and social hardship for producers. This is particularly true in Western Australia and the Northern Territory. Demand shocks in cattle and sheep live export markets over the last ten years have seen prices fall by 40-50%. Any significant interruption to livestock exports would impact domestic livestock markets as cattle and sheep that were destined for export are diverted back onto local markets. The impact would be greatest in regions from which live exports are sourced, but would soon have a ‘knock-on’ effect across national markets. The initial regional price drop will ease as livestock are moved (incurring transport costs) to more distant markets where the additional supply will reduce prices. This ‘knock-on’ effect will continue until all national markets are pushed lower to varying degrees, as determined by transport costs. Using the most detailed model of its type3, this study has measured the consequence of a closure of both cattle and sheep export trades on the wider domestic market in the medium term. The model calculated the price impacts across the entire national market and was based on data for the three years 2002 - 2004. The annual basis of the model means that the results relate to livestock markets that have adjusted to the changed circumstances; it does not quantify the initial regional level impacts. As it is an aggregated model across the whole of the national market the model runs do not report seasonal and regional level price impacts.
1 Free on Board (FOB). 2 Cattle slaughter numbers for 2005 are preliminary estimates (MLA 2006). 3 The Global Meat Industry model developed by the Centre for International Economics.
Value of the live export industry
For the beef cattle sector, farm gate prices for cattle would have been over 9 cents per kilogram live weight less and across the sector Gross Value of Production (GVP) would have been approximately $400 million less in the first year after any total closure of the trade and $330 million less each year thereafter. For the sheep sector, farm gate prices for sheep would have been nearly 17 cents per kilogram live weight less and lamb prices 7 cents less without the live sheep export trade. The loss of sheep and lamb sector GVP would be $220 million per year, after closure of the live export trade. Based on these estimates a closure of the live export trade in cattle and sheep would cause an ongoing reduction in the GVP of Australia’s sheep and beef cattle industries in the order of $550 million per annum. This loss is a 6% reduction in the 2004 gross value of the entire cattle and sheep meat industry for 2004 (ABS 2005). The next 5 years The future for the live export industry looks positive with markets forecast to increase for both cattle and sheep. These markets are reliant on only a few major importing countries, making the industry sensitive to shocks. Despite this, the industry has managed to absorb demand shocks and re-establish markets through proactive policies and strong relationships with customers. Live cattle exports are forecast to rebuild almost 40% to 800,000 head by 2010 and higher in the following year. The biggest risk to these forecasts is a shift in trade policy by the Indonesian Government to allow freer entry of cheaper beef from Brazil, Argentina and India. Forecasting future value of the live cattle export trade is highly problematic, but maintaining the current value of a little over $500 million for the next one to two years is highly likely. If cattle prices fall by 10 to 15%, the value may ease back slightly, but as the numbers exported expand to 750-800,000 head, an annual value in the order of $550 million is expected. This review supports the Meat and Livestock Australia (MLA) forecast that sheep exports will rebuild quite strongly over the next five years, with expectations of reaching 5 million head in 2010. Impact on the national economy The livestock export industry value chain is complex and relatively long. Up to 30 separate business types, each generating additional value and employing people in both urban and regional Australia have been identified. The businesses that are involved in the industry are often specific to the live export industry, or generate the vast majority of their revenues from live export activity. It is often the foundation of a business which supplies other requirements in remote areas. The National Institute of Economic and Industry Research (NIEIR) found that over the past 5 years the live export industry contributed the following to the national economy:
12,924 jobs;
Wages and salaries totalling $987 million annually; and
$1.80 billion to gross domestic product per annum.

Value of the live export industry
This employment number is based on general equilibrium modelling, which estimates the effect of expenditure along the value chain on other sectors of the economy. In a similar study in 1999, it was estimated that the live export industry generated 9,080 jobs in the economy (Hassall & Associates 2000). The main reason for the additional 4,000 jobs is structural changes in the economy since 1999, such as increasing import penetration and changing capacity utilisation rates for agriculture and the broader economy. These changes have led to higher multiplier values associated with economic activity generated by live exports. The industry has also grown in value since 1999. This has been due in part to the establishment of the dairy cattle live export market. However, the majority of the growth in value has been based on increased export numbers during the early part of the decade for sheep and cattle and, since 2001, an increase in the revenue per head, particularly for live sheep exports. Conclusion The information provided in this study illustrates the need for considered policy debate regarding the live export industry. The effect of any significant change to the industry would fall disproportionately to regional areas. In addition, the short to medium term impacts would be felt by all livestock producers across Australia, as livestock prices would fall in response to additional supply on the domestic market.
Value of the live export industry
Contents Page
1 Background and purpose of the study............................1 1.1 Introduction .......................................................................................................1 1.2 Methodology......................................................................................................1
1.2.1 Industry description...................................................................................1 1.2.2 Value chain analysis .................................................................................1 1.2.3 Case study selection.................................................................................2 1.2.4 Regional and national economic modelling ..............................................2 1.2.5 Forecasts and domestic linkages..............................................................3
2 Industry description ..........................................................4 2.1 The Australian livestock export industry ........................................................4 2.2 Location of the livestock export industry .......................................................6 2.3 Export markets ..................................................................................................7 2.4 The industry in the agricultural context ..........................................................9
3 Value chain description and analysis............................10 3.1 Value chain definition .....................................................................................10 3.2 Generic description.........................................................................................10 3.3 Live sheep value chain ...................................................................................15 3.4 Summary and conclusions.............................................................................16
4 Regional case study analysis.........................................17 4.1 Fremantle/southern fringe of Perth and Wongan Hills ................................17 4.2 Port of Darwin-Katherine ................................................................................18 4.3 Broome and north west Western Australia...................................................20 4.4 Portland and Victorian dairy regions.............................................................22
5 Impact of export cessation on live export industry participants.......................................................................23
5.1 Introduction .....................................................................................................23 5.2 Immediate impacts ..........................................................................................23 5.3 Subsequent adjustments................................................................................24
5.3.1 Sheep .....................................................................................................24 5.3.2 Cattle ......................................................................................................24
6 The impact of live exports on domestic livestock prices...........................................................................................26
6.1 Introduction .....................................................................................................26 6.2 Sheep industry ................................................................................................27
6.2.1 Simulation approach ...............................................................................27 6.2.2 Results across the sheep industry ..........................................................28
Value of the live export industry
6.3 Beef cattle industry .........................................................................................29 6.3.1 Simulation approach ...............................................................................29 6.3.2 Results across the beef cattle industry ...................................................29
6.4 Concluding comments....................................................................................30
7 Forecasting the value of livestock exports ...................32 7.1 Approach .........................................................................................................32 7.2 Live sheep exports..........................................................................................32
7.2.1 Overview of recent numbers and values.................................................32 7.2.2 Influences shaping demand of importing countries.................................33 7.2.3 Influences shaping supply of live sheep out of Australia.........................35
7.3 Live cattle exports...........................................................................................37 7.3.1 Overview of recent numbers and value ..................................................37 7.3.2 Influences shaping demand of importing countries.................................38 7.3.3 Influences shaping supply out of Australia..............................................39
7.4 Overall conclusions ........................................................................................41
8 Dairy cattle and goat live export sectors.......................42 8.1 Introduction .....................................................................................................42 8.2 Dairy cattle export industry............................................................................42
8.2.1 Introduction.............................................................................................42 8.2.2 Outlook for dairy exports.........................................................................43 8.2.3 The dairy cattle value chain ....................................................................44 8.2.4 Benefits for domestic producers .............................................................45 8.2.5 Conclusion..............................................................................................45
8.3 Goat export industry .......................................................................................46 8.3.1 Introduction.............................................................................................46 8.3.2 The goat value chain ..............................................................................48 8.3.3 Conclusion..............................................................................................48
9 National economic impact ..............................................49 9.1 Introduction .....................................................................................................49 9.2 Contribution to gross domestic product.......................................................49 9.3 Contribution to national employment............................................................50 9.4 The strategic importance of the industry......................................................51 9.5 Summary..........................................................................................................51
Value of the live export industry
10 Conclusions .....................................................................52 10.1 Introduction .....................................................................................................52 10.2 Impact on domestic markets..........................................................................52 10.3 Outlook.............................................................................................................52 10.4 The value chain ...............................................................................................53 10.5 Impact on the national economy....................................................................53 10.6 Policy implications..........................................................................................53
11 Reference list ...................................................................54
12 Appendix One – Case study descriptions.....................55 12.1 Fremantle/Southern Fringe Perth ..................................................................55 12.2 Darwin and Katherine .....................................................................................58 12.3 Broome and West Kimberley .........................................................................60 12.4 Portland and Dairy Regions of Victoria.........................................................62
13 Appendix Two – Data for regional economic impacts .64 List of tables Table 1: Livestock exports by port 2005......................................................................................... 7 Table 2: Notional value chain for live feeder/slaughter cattle 2004/05........................................ 14 Table 3: Notional value chain for live sheep 2004/05 .................................................................. 15 Table 4 Number of livestock exported from the Port of Fremantle ............................................. 17 Table 5: Fremantle case study businesses.................................................................................. 18 Table 6 Number of livestock exported from the Port of Darwin .................................................. 19 Table 7: Port of Darwin case study businesses ........................................................................... 19 Table 8: Number of livestock exported from the Port of Broome................................................. 21 Table 9: Broome case study businesses...................................................................................... 21 Table 10: Number of livestock exported from the Port of Portland................................................ 22 Table 11: Portland and dairy regions case study businesses........................................................ 22 Table 12: Domestic market impacts of a closure of live sheep trade ............................................ 28 Table 13: Domestic market impacts of a closure of live cattle trade ............................................. 30 Table 14: Summary of farm gate domestic price impacts.............................................................. 31 Table 15: Live sheep exports by total value and number .............................................................. 33 Table 16: Live cattle exports by total value and number ............................................................... 37 Table 17: Number of livestock exported from the Port of Portland................................................ 43 Table 18: Notional value chain for live dairy cattle 2004/05 .......................................................... 44 Table 19: Notional value chain for live goat 2004/05 ..................................................................... 48 Table 20: Key components of national gross domestic product 2000-2004.................................. 49 Table 21: Annual contribution to GDP by sector 2000-2004 ......................................................... 50 Table 22: Annual employment and household income generated ................................................ 50 Table 23 Livestock exports by port average 2000-2004............................................................... 64

Value of the live export industry
List of figures Figure 1: Australian live cattle exports (numbers and value) .......................................................... 4 Figure 2: Australian live sheep exports (numbers and value)......................................................... 5 Figure 3: Australian live cattle and sheep exports by state of loading 2003-2005 ......................... 6 Figure 4: Australian live cattle exports by destination 2003-2005 .................................................. 8 Figure 5: Australian live sheep exports by destination 2003-2005 ................................................. 8 Figure 6: Value of agricultural production for selected commodities .............................................. 9 Figure 7: Generic live export value chain ...................................................................................... 13 Figure 8: Location of Fremantle case study area.......................................................................... 17 Figure 9: Location of Port of Darwin-Katherine case study area .................................................. 19 Figure 10: Location of Broome case study area.............................................................................. 20 Figure 11: Location of Portland and Victoria case study area ........................................................ 22 Figure 12: Major destinations for live sheep exports....................................................................... 33 Figure 13: Major destinations for live cattle exports........................................................................ 37 Figure 14: Dairy cattle live exports by destination........................................................................... 42 Figure 15: Dairy cattle live exports by state of origin ...................................................................... 43 Figure 16: Goat live exports by destination ..................................................................................... 46 Figure 17: Goat live exports by state of origin................................................................................. 47 Abbreviations and acronyms ABARE Australian Bureau of Agricultural and Resource Economics ABS Australian Bureau of Statistics AMSA Australian Maritime Safety Authority AQIS Australian Quarantine Inspection Service DAFF Department of Agriculture Fisheries and Forestry CIE Centre for International Economics CIF Cost Insurance Freight (Price + Insurance + Freight incurred in shipping livestock
overseas) cwe carcass weight equivalent FMD Foot and Mouth Disease FOB free on board (Price + the cost of freight delivered on board the ship) GMI Global Meat Industry (a model developed by CIA) GVP Gross Value of Production GDP Gross Domestic Product kg kilogram kt kilotonnes live wt live weight MLA Meat and Livestock Australia NIEIR National Institute of Economic and Industry Research UAE United Arab Emirates
Value of the live export industry
Page 1 of 64
1 Background and purpose of the study 1.1 Introduction
This study provides a quantitative and qualitative assessment of the value of the livestock export industry to the national economy and to regional communities reliant on the industry. The structure of the industry has changed in the past five years, in response to changes in livestock export markets and competition from feedlots during a period of high demand in the chilled export market. Despite these changes, live export remains a significant industry that has a diverse range of interconnected services and it also underpins domestic markets.
The study includes an assessment of the:
Value chain1 for the live sheep and live cattle export industries;
Multiplier effects of live sheep and cattle exports on the national economy, including the impact on regional economies;
Employment generated by live sheep and cattle exports;
Emerging goat and dairy livestock exports; and
Value of the industry to domestic producers in the sheep and cattle industries; and
Future value of exports over the next five years. The information provided by this study will allow the development of considered Government policy. It highlights the importance of the industry, in terms of income for producers and export earnings. Additionally, the linkages that exist between the industry and regional communities are updated from previous studies, and for the first time the relationship between the live export industry and the wider domestic livestock market is analysed and quantified. 1.2 Methodology
This study was completed using desktop reviews, case study analysis and economic modelling. A brief overview of study methodology is outlined below. 1.2.1 Industry description
A description of the livestock export industry was developed using relevant literature and consultation with industry participants. The industry was described in both macro terms (i.e. total volumes and values) as well as in terms of “links” in the value chain. 1.2.2 Value chain analysis
The value chain is a quantitative and qualitative description of the live export industry, which provides a representation of the physical flow of the livestock, the costs of materials and services purchased from outside the chain, transport and handling costs and revenue accruing from the sale of products.
1 The value chain is a quantitative and qualitative description of the live export industry.
Value of the live export industry
Page 2 of 64
The value chains described for each of beef cattle, sheep, dairy cattle and goat live exports were constructed using data collected from the participants within each industry sector. Values were apportioned for the chain back to the producer and the chain was quantified on a dollar per head basis throughout. 1.2.3 Case study selection
Case studies focused on the impact of the industry on three specific regions. The dairy cattle and goat sectors were treated as individual case studies. The regions were selected based on their reliance on the live export industry and to provide a spread between northern and southern segments of the industry.
The case studies examined were: Case Study 1: Fremantle, Western Australia. Fremantle is a major port area for sheep and, to a
lesser extent, cattle. This case study highlights the service end of the industry and the businesses created specifically to service the live sheep export sector.
Case Study 2: Katherine and the Port of Darwin, Northern Territory. Katherine is a location for cattle
producers and trucking companies, a fodder cubing mill, fodder producers and helimustering services. The live export industry provides a significant level of throughput at the Port of Darwin and an array of handling and inspections services in an around Darwin itself.
Case Study 3: Broome and north west Western Australia. The Port of Broome draws cattle from the
Pilbara, east and west Kimberley and the Northern Territory. The region is also served by the Port of Wyndham. In the absence of the live export trade marketing, options for producers in this region are limited.
Case Study 4: Dairy cattle in southern Australia, in particular Portland, Victoria. Live exports have
provided support to dairy farmers during a downturn in the industry. Markets in China and Mexico have been providing an option for dairy producers to diversify income.
Case Study 5: Goat exports mainly from southern Australia and have been based initially on feral
goats. The industry is moving towards the export of domesticated goats in eastern Australia.
Case studies were specifically designed to document the qualitative dimensions of the industry. The consultations also provided quantitative data for the economic analysis. 1.2.4 Regional and national economic modelling
The basic modelling platform was provided by regional models from the National Institute of Economic and Industry Research (NIEIR). The models are anchored in specific regional input-output tables and are integration models with employment functions, consumption factors and export functions. The input-output framework translates demand into industry activity. The general integrated model was modified for the live cattle and live sheep industries at the regional level. The industries were explicitly merged into the regional models by incorporating the information from each of the industries surveyed.

Value of the live export industry
Page 3 of 64
1.2.5 Forecasts and domestic linkages
The forecasts for the various sectors of the industry were assessed at an industry workshop held in Sydney in November 2005. Various factors affecting supply and demand were examined and their potential impact over the medium term assessed. The linkages between the live export industry and the domestic markets for cattle and sheep were also examined in this workshop. Further to this, the Global Meat Industry (GMI) model, developed by Centre for International Economics (CIE), was used to estimate the medium term impacts of a cessation of live exports on farm gate prices and the gross value of the sheep and cattle markets.
Value of the live export industry
Page 4 of 64
2 Industry description 2.1 The Australian livestock export industry
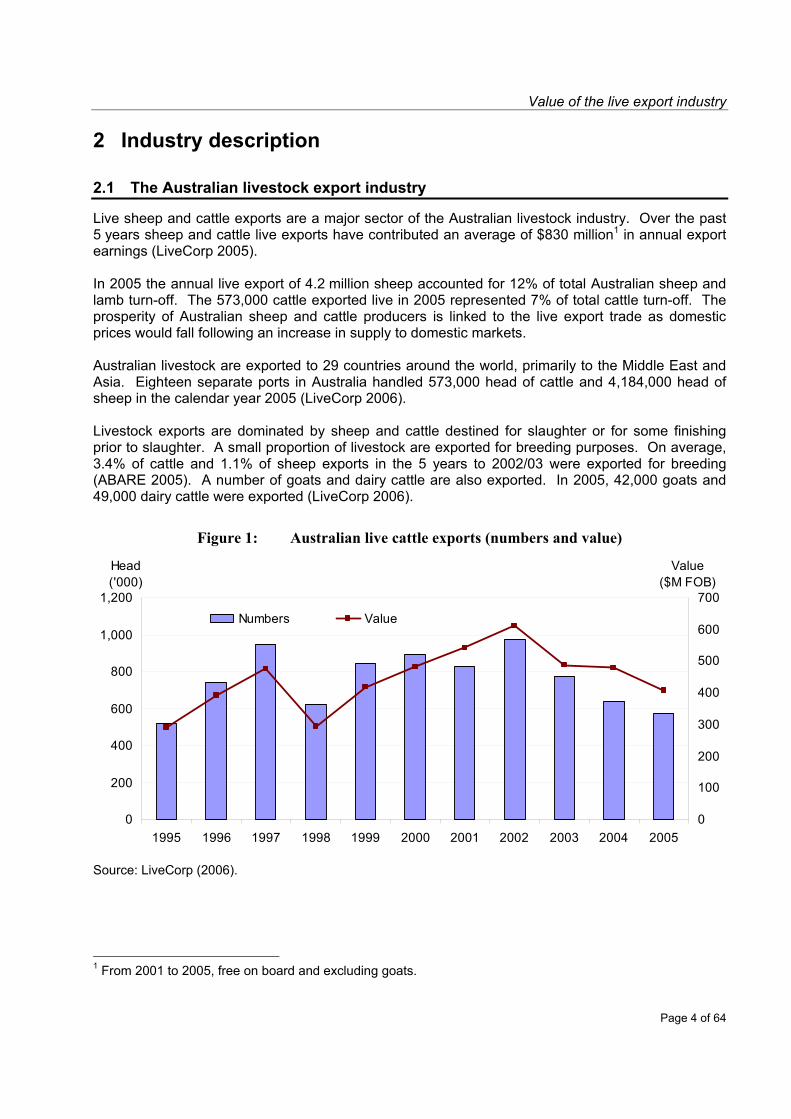
Live sheep and cattle exports are a major sector of the Australian livestock industry. Over the past 5 years sheep and cattle live exports have contributed an average of $830 million1 in annual export earnings (LiveCorp 2005). In 2005 the annual live export of 4.2 million sheep accounted for 12% of total Australian sheep and lamb turn-off. The 573,000 cattle exported live in 2005 represented 7% of total cattle turn-off. The prosperity of Australian sheep and cattle producers is linked to the live export trade as domestic prices would fall following an increase in supply to domestic markets. Australian livestock are exported to 29 countries around the world, primarily to the Middle East and Asia. Eighteen separate ports in Australia handled 573,000 head of cattle and 4,184,000 head of sheep in the calendar year 2005 (LiveCorp 2006). Livestock exports are dominated by sheep and cattle destined for slaughter or for some finishing prior to slaughter. A small proportion of livestock are exported for breeding purposes. On average, 3.4% of cattle and 1.1% of sheep exports in the 5 years to 2002/03 were exported for breeding (ABARE 2005). A number of goats and dairy cattle are also exported. In 2005, 42,000 goats and 49,000 dairy cattle were exported (LiveCorp 2006).
Figure 1: Australian live cattle exports (numbers and value)
0
200
400
600
800
1,000
1,200
1995 1996 1997 1998 1999 2000 2001 2002 2003 2004 2005
Head ('000)
0
100
200
300
400
500
600
700
Value($M FOB)
Numbers Value
Source: LiveCorp (2006).
1 From 2001 to 2005, free on board and excluding goats.

Value of the live export industry
Page 5 of 64
A number of factors have influenced the Australian livestock export industry in recent years, particularly the higher value of the Australian dollar. For cattle, higher domestic and international demand for beef has pushed up prices (ABARE 2005). Strong demand for beef products has resulted in the value of live cattle exports remaining stable, despite the fall in numbers shipped. The trend in cattle and sheep livestock exports over the past 15 years is shown in Figure 1 and Figure 2 respectively. Australian live cattle exports reached a record 972,000 head in 2002, averaging 756,000 head per annum between 2001 and 2005. Following the record in 2002, cattle numbers exported fell 41% over the 3 years to December 2005. The principle reasons for this decline were the increased value of the Australian dollar, strong competition for cattle from the meat trade, fierce competition from Brazilian and Indian beef and buffalo meat and a slowing of economic growth in the major markets of Indonesia, the Philippines and Egypt. There have been pronounced fluctuations in live sheep exports. The most significant reason for these fluctuations has been the periodic closure of access into the Saudi Arabian market.
Figure 2: Australian live sheep exports (numbers and value)
0
1,000
2,000
3,000
4,000
5,000
6,000
7,000
8,000
1995 1996 1997 1998 1999 2000 2001 2002 2003 2004 2005
Head ('000)
0
50
100
150
200
250
300
350
400
450
Value($M FOB)
Numbers Value
Source: LiveCorp (2006). The Australian livestock export industry has contributed an estimated $4.19 billion (FOB) in export earnings to the Australian economy over the past 5 years to 2006. This includes $2.52 billion from live cattle exports and $1.62 billion from live sheep sales (LiveCorp 2006). The per unit value of sheep (FOB) has climbed over the past 5 years from $53 per head in 2001 to $67 per head in 2005. The per unit value of cattle peaked in 2004 at $749 per head (FOB), falling to $711 per head in 2005.

Value of the live export industry
Page 6 of 64
2.2 Location of the livestock export industry
In the last three years the majority of cattle exports (44%) have originated from Western Australia, during the same period Darwin accounted for 34% of export numbers. The most important cattle export ports are Darwin, Broome, Fremantle and Portland. Live exports from Queensland have decreased over time with increased competition for stock from the feedlot sector for the chilled export market. This demand has partly driven by the exclusion of the US from the Japanese market due to BSE outbreaks.
Figure 3: Australian live cattle and sheep exports by state of loading 2003-2005 Cattle
SA1%
Tas0.3%
Qld11%Vic
9%
WA44%
NT34%
NSW1%
Sheep
SA11%
Tas0.3%Vic
10%
WA77%
Source: LiveCorp (2006). Live sheep exports are dominated by sheep from Western Australia. Exports from Western Australia accounted for approximately 71% of sheep exports (averaged over the 2003-2005). The remainder originate from Victoria, South Australia and Tasmania. In 2005 the other significant ports for live sheep exports were Portland and Port Adelaide (Table 1).
Value of the live export industry
Page 7 of 64
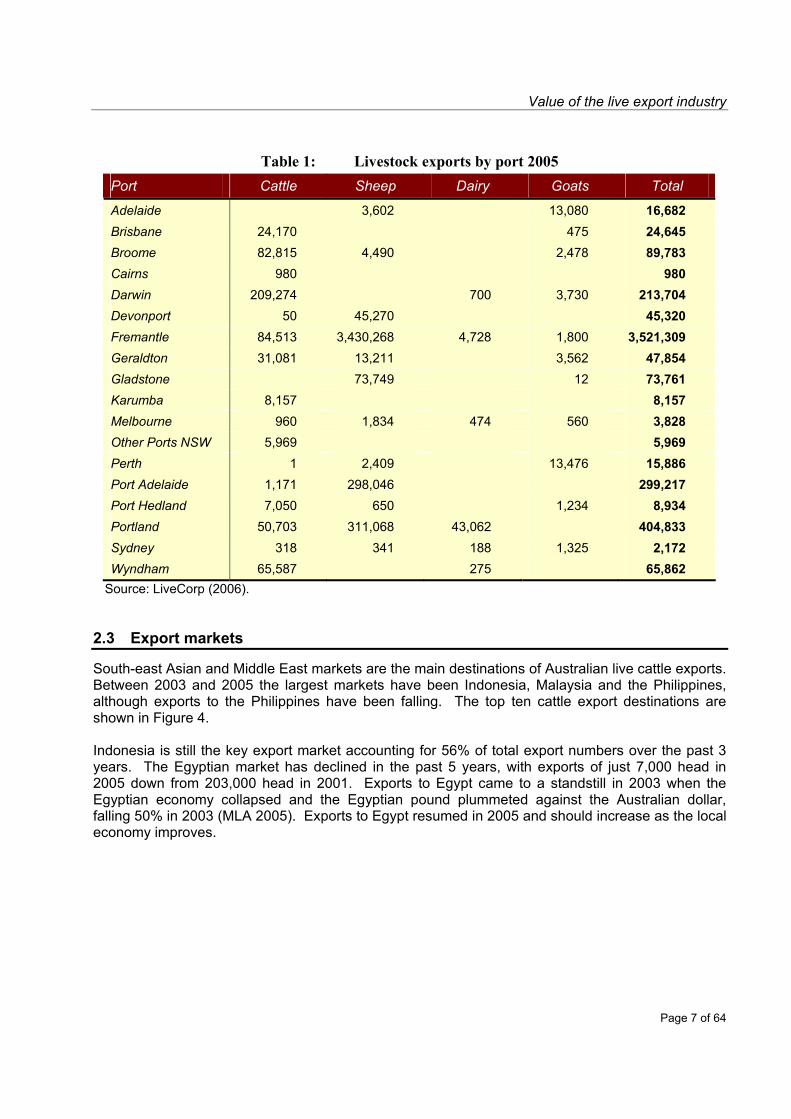
Table 1: Livestock exports by port 2005 Port Cattle Sheep Dairy Goats Total
Adelaide 3,602 13,080 16,682 Brisbane 24,170 475 24,645 Broome 82,815 4,490 2,478 89,783 Cairns 980 980 Darwin 209,274 700 3,730 213,704 Devonport 50 45,270 45,320 Fremantle 84,513 3,430,268 4,728 1,800 3,521,309 Geraldton 31,081 13,211 3,562 47,854 Gladstone 73,749 12 73,761 Karumba 8,157 8,157 Melbourne 960 1,834 474 560 3,828 Other Ports NSW 5,969 5,969 Perth 1 2,409 13,476 15,886 Port Adelaide 1,171 298,046 299,217 Port Hedland 7,050 650 1,234 8,934 Portland 50,703 311,068 43,062 404,833 Sydney 318 341 188 1,325 2,172 Wyndham 65,587 275 65,862
Source: LiveCorp (2006). 2.3 Export markets
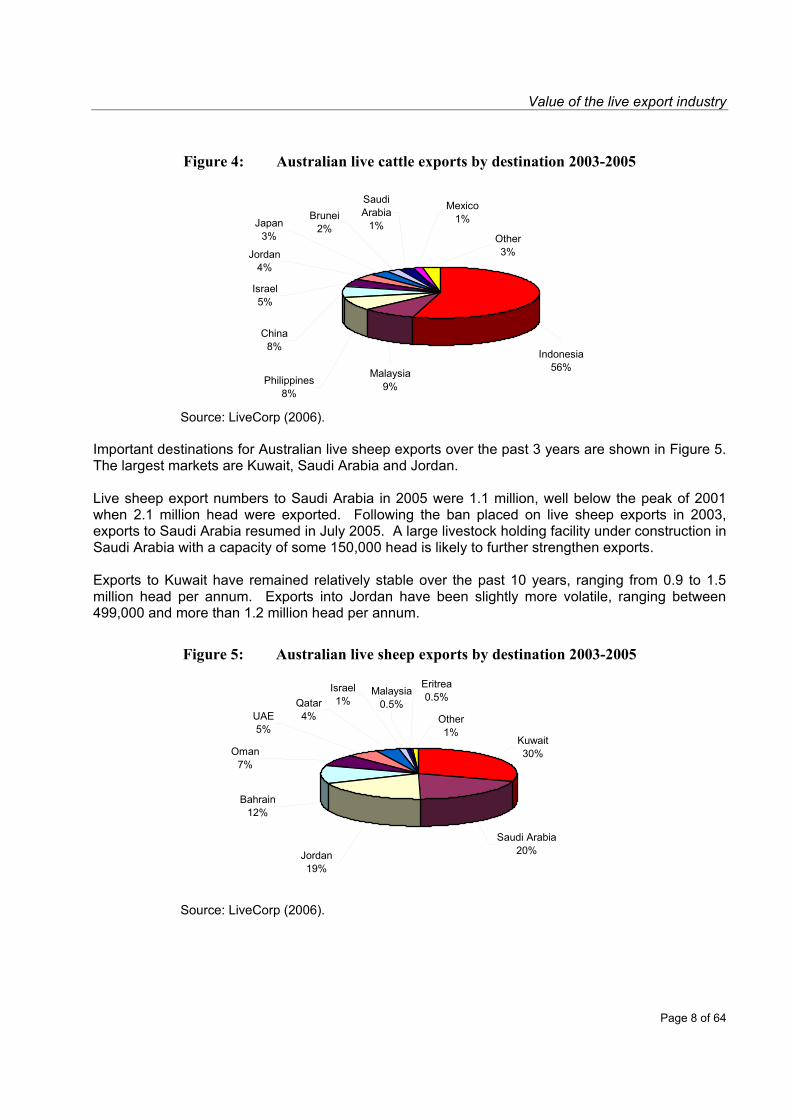
South-east Asian and Middle East markets are the main destinations of Australian live cattle exports. Between 2003 and 2005 the largest markets have been Indonesia, Malaysia and the Philippines, although exports to the Philippines have been falling. The top ten cattle export destinations are shown in Figure 4. Indonesia is still the key export market accounting for 56% of total export numbers over the past 3 years. The Egyptian market has declined in the past 5 years, with exports of just 7,000 head in 2005 down from 203,000 head in 2001. Exports to Egypt came to a standstill in 2003 when the Egyptian economy collapsed and the Egyptian pound plummeted against the Australian dollar, falling 50% in 2003 (MLA 2005). Exports to Egypt resumed in 2005 and should increase as the local economy improves.
Value of the live export industry
Page 8 of 64
Figure 4: Australian live cattle exports by destination 2003-2005
Brunei2%Japan
3%
Mexico1%
Other3%
China8%
Saudi Arabia
1%
Jordan4%
Israel5%
Philippines8%
Malaysia9%
Indonesia56%
Source: LiveCorp (2006).
Important destinations for Australian live sheep exports over the past 3 years are shown in Figure 5. The largest markets are Kuwait, Saudi Arabia and Jordan. Live sheep export numbers to Saudi Arabia in 2005 were 1.1 million, well below the peak of 2001 when 2.1 million head were exported. Following the ban placed on live sheep exports in 2003, exports to Saudi Arabia resumed in July 2005. A large livestock holding facility under construction in Saudi Arabia with a capacity of some 150,000 head is likely to further strengthen exports. Exports to Kuwait have remained relatively stable over the past 10 years, ranging from 0.9 to 1.5 million head per annum. Exports into Jordan have been slightly more volatile, ranging between 499,000 and more than 1.2 million head per annum.
Figure 5: Australian live sheep exports by destination 2003-2005
Other1%
Jordan19%
Bahrain12%
Oman7%
UAE5%
Qatar4%
Eritrea0.5%Malaysia
0.5%Israel1%
Kuwait30%
Saudi Arabia20%
Source: LiveCorp (2006).
Value of the live export industry
Page 9 of 64
2.4 The industry in the agricultural context
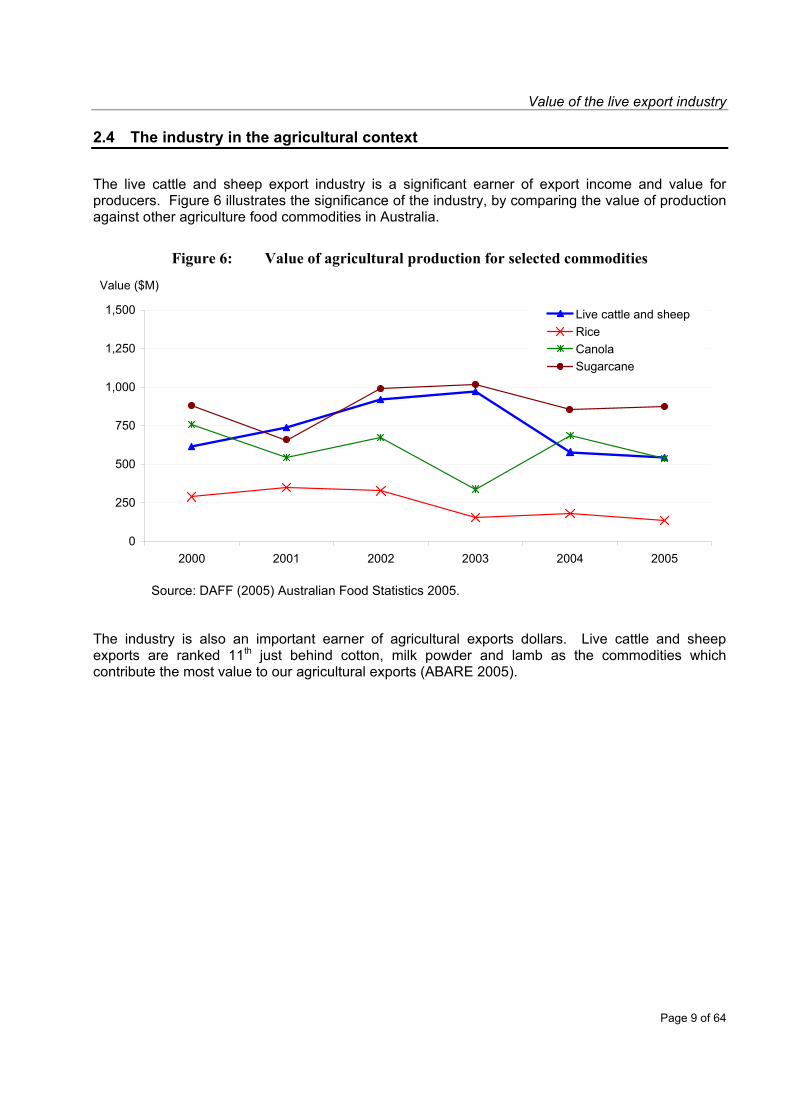
The live cattle and sheep export industry is a significant earner of export income and value for producers. Figure 6 illustrates the significance of the industry, by comparing the value of production against other agriculture food commodities in Australia.
Figure 6: Value of agricultural production for selected commodities
0
250
500
750
1,000
1,250
1,500
2000 2001 2002 2003 2004 2005
Value ($M)
Live cattle and sheepRiceCanolaSugarcane
Source: DAFF (2005) Australian Food Statistics 2005. The industry is also an important earner of agricultural exports dollars. Live cattle and sheep exports are ranked 11th just behind cotton, milk powder and lamb as the commodities which contribute the most value to our agricultural exports (ABARE 2005).

Value of the live export industry
Page 10 of 64
3 Value chain description and analysis 3.1 Value chain definition
Livestock exporting is an industry comprising a series of businesses, including livestock owners, and the suppliers of goods and service inputs and outputs along a value chain. A value chain is a method to describe an industry or the sequence of activities from the farm gate to the consumer. Value chain analysis quantifies the costs and margins associated with each event in the chain between farm gate and the consumer. In the case of international trade in livestock, the consumer is considered to be the importer in the country of destination. Value added is the difference between gross value of outputs and value of inputs used by a sector or industry (AACM International, 1996a). Total industry value added, the operating profit aggregated for all industry players, is an industry’s contribution to gross domestic product (GDP). 3.2 Generic description
The links in the livestock export chain were identified in association with the industry. A brief definition of each link, activities involved and relevance to sheep and cattle is provided below. Importer A livestock importer may be either an overseas country or company that makes
a request to an Australian exporter to supply livestock. Such requests may be made simultaneously to one or more Australian exporters, as well as to competing suppliers such as New Zealand, South America and China.
Exporter
Exporters are responsible for pricing, purchase, assembly and preparation of an importer’s order. They may work with a supplier to source livestock.
Supplier / Procurement
A supplier buys livestock for export, in response to a specific order from an exporter. A procurement service is provided by the supplier. The supplier does not own the livestock and is paid a contract rate.
Agents
Agents work on behalf of the livestock producer/vendor to sell to a supplier or directly to an exporter. Their role includes initial inspection of livestock to ensure they meet the required specification. Specifications may include age, weight, sex, breed and disease status. An agent will negotiate sale price between the producer/vendor and the exporter/supplier purchaser. After purchase, the agent will arrange transportation to the quarantine area. Agents generally attain a percentage of farm gate price, typically this figure is set at 5% for sheep and between 3 - 5 % for cattle.
Producer
Producers supply livestock for sale to an exporter. A cattle breeding or growing out operation may be specifically geared towards supply of livestock suitable for the live export trade, which is particularly true of producers in the Northern Territory and north west Western Australia. Alternatively, sale to an exporter/supplier may be opportunistic. This is more often the case in southern Australia. Suppliers of sheep may include wool producers turning off older sheep, or specialist producers turning off a younger product for higher value markets.

Value of the live export industry
Page 11 of 64
Preparation Specialist
The preparation specialist or backgrounder works with the exporter or agent to ensure consistency of livestock supply and manage the conditioning of stock for sea travel. Preparation specialists tend to be more common in the case of live cattle exports than live sheep.
Land Transport
Road transport is required at a number of stages throughout the livestock export value chain. Road transport of livestock takes place between the producer, preparation specialist, the quarantine area and the ship. Further road transport is also required for transportation of fodder from fodder mills and feed producers to quarantine areas and on board ships. Queensland is the only State where livestock are transported by rail. This has only been for a minor percentage of cattle destined for the live export market.
Veterinary Services
The role of commercial vets includes district health status certification, animal welfare, tests and treatments associated with quarantine compliance and final inspection. Commercial vets with dedicated practices in the industry are found in Darwin, Katherine, Kununurra and Perth.
Pre-export Assembly Depot Services
A pre-export assembly depot livestock quarantine area is generally located in close proximity to the port. Large depots exist as marshalling areas for live sheep and cattle prior export. These depots include quarantine facilities and large scale feeding facilities.
Quality Control Specialists
The industry currently supports a limited number of third party independent quality control specialists who inspect livestock against specification prior to vessel loading. Quality control specialists are not employed in every value chain.
Fodder Manufacturers
During the sea journey, live sheep are fed on a pellet typically consisting of 50% hay or straw, 30% grain barley, 10% lupins and the balance of bulk roughage, and urea. This type of pellet is also fed to cattle on southern export routes. On northern routes legume based cubes are generally fed to export cattle.
Fodder Growers
Fodder manufacturers often source fodder from growers in their local region. In some cases this is a vertically integrated operation.
Chemical Manufacturers and Retailers
Chemical suppliers to the livestock export industry include local stock and station agents, manufacturers of drugs, and suppliers to vets including the manufacturers of electrolytes and vaccine companies. Chemicals for disinfection and cleaning are also required on board during the journey and are supplied in bulk to the ship.
Shearing Contractors
Sheep are normally shorn prior to live export if wool growth is greater than 2.5 cm or approximately 10 weeks growth. This requirement provides the basis for a business in major live sheep export ports and regions.
Port Authority
The port authority provides port and maritime services; it also owns and maintains the port facility and wharves. The port authority generally lets space for storage and wharves, provides pilot services, towage and is responsible for all aspects of inbound and outbound shipping.
Value of the live export industry
Page 12 of 64
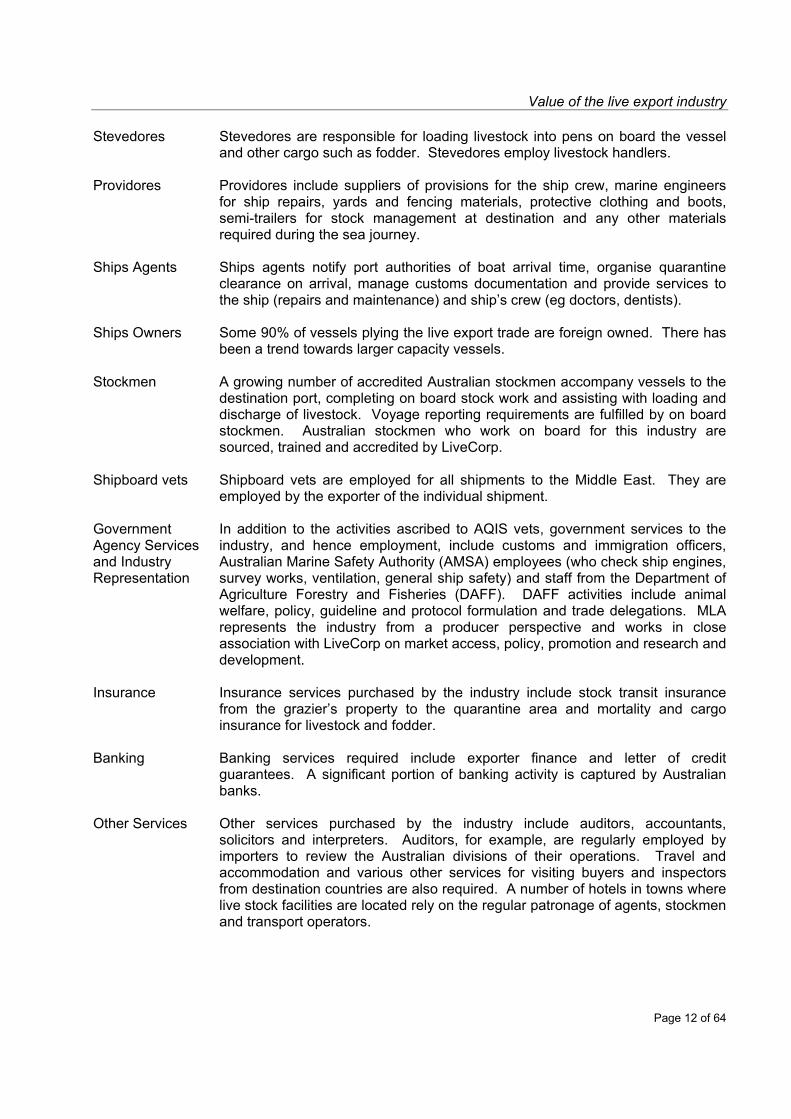
Stevedores
Stevedores are responsible for loading livestock into pens on board the vessel and other cargo such as fodder. Stevedores employ livestock handlers.
Providores
Providores include suppliers of provisions for the ship crew, marine engineers for ship repairs, yards and fencing materials, protective clothing and boots, semi-trailers for stock management at destination and any other materials required during the sea journey.
Ships Agents
Ships agents notify port authorities of boat arrival time, organise quarantine clearance on arrival, manage customs documentation and provide services to the ship (repairs and maintenance) and ship’s crew (eg doctors, dentists).
Ships Owners
Some 90% of vessels plying the live export trade are foreign owned. There has been a trend towards larger capacity vessels.
Stockmen
A growing number of accredited Australian stockmen accompany vessels to the destination port, completing on board stock work and assisting with loading and discharge of livestock. Voyage reporting requirements are fulfilled by on board stockmen. Australian stockmen who work on board for this industry are sourced, trained and accredited by LiveCorp.
Shipboard vets Shipboard vets are employed for all shipments to the Middle East. They are employed by the exporter of the individual shipment.
Government Agency Services and Industry Representation
In addition to the activities ascribed to AQIS vets, government services to the industry, and hence employment, include customs and immigration officers, Australian Marine Safety Authority (AMSA) employees (who check ship engines, survey works, ventilation, general ship safety) and staff from the Department of Agriculture Forestry and Fisheries (DAFF). DAFF activities include animal welfare, policy, guideline and protocol formulation and trade delegations. MLA represents the industry from a producer perspective and works in close association with LiveCorp on market access, policy, promotion and research and development.
Insurance
Insurance services purchased by the industry include stock transit insurance from the grazier’s property to the quarantine area and mortality and cargo insurance for livestock and fodder.
Banking
Banking services required include exporter finance and letter of credit guarantees. A significant portion of banking activity is captured by Australian banks.
Other Services
Other services purchased by the industry include auditors, accountants, solicitors and interpreters. Auditors, for example, are regularly employed by importers to review the Australian divisions of their operations. Travel and accommodation and various other services for visiting buyers and inspectors from destination countries are also required. A number of hotels in towns where live stock facilities are located rely on the regular patronage of agents, stockmen and transport operators.
Value of the live export industry
Page 13 of 64
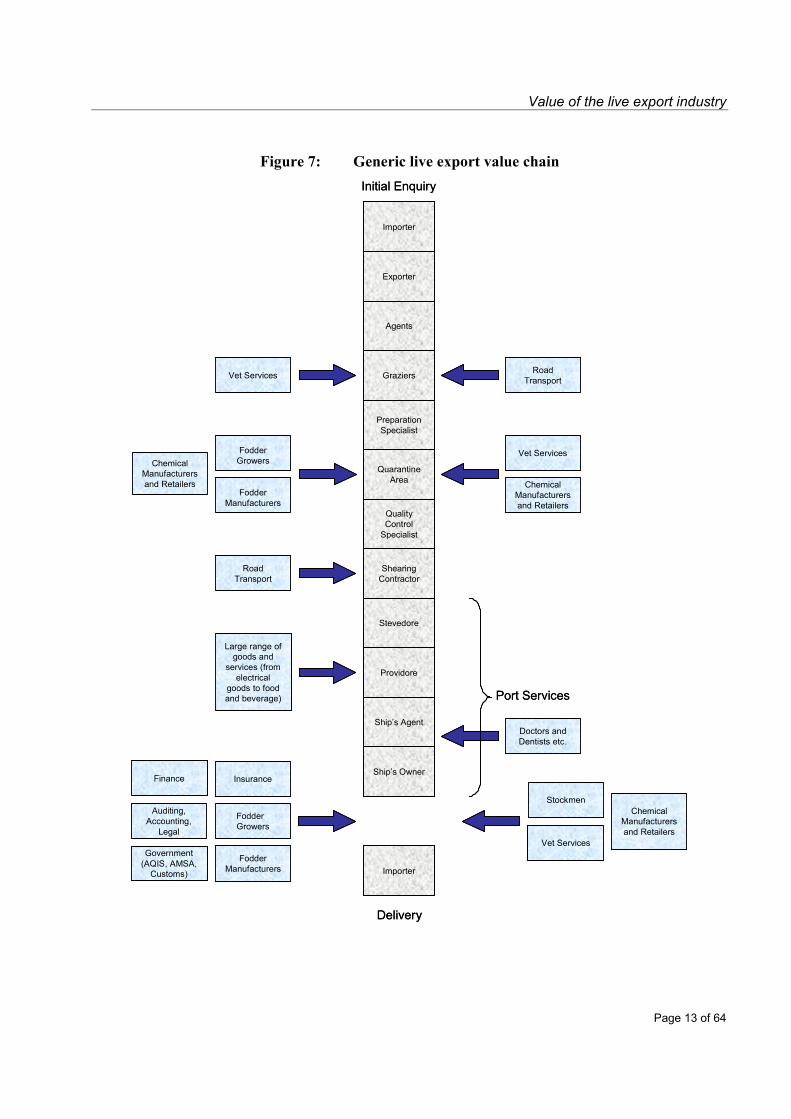
Figure 7: Generic live export value chain
Exporter
Agents
Graziers
Preparation Specialist
Quarantine Area
Importer
Ship’s Agent
Ship’s Owner
Providore
Stevedore
Shearing Contractor
Quality Control
Specialist
Importer
Finance
Auditing, Accounting,
Legal
Fodder Growers
Government(AQIS, AMSA,
Customs)
Fodder Manufacturers
Insurance
Doctors and Dentists etc.
Stockmen
Vet Services
Chemical Manufacturers and Retailers
Road Transport
Vet Services
Chemical Manufacturers and Retailers
Vet ServicesFodder Growers
Fodder Manufacturers
Chemical Manufacturers and Retailers
Road Transport
Large range of goods and
services (from electrical
goods to food and beverage) Port Services
Initial Enquiry
Delivery

Value of the live export industry
Page 14 of 64
3.3 Live cattle value chain The value chain of the live cattle export industry has been compiled following discussions with businesses along the chain and industry experts. Value chain analysis quantifies the costs associated with each event in the chain between farm gate and the consumer. Total gross value and major cost items were estimated by the internal study team and reviewed with relevant parts of the industry during field investigations. The lice feeder/slaughter cattle value chain for 2004/05 is provided in Table 2.
Table 2: Notional value chain for live feeder/slaughter cattle 2004/05 $ per Head Total Gross Value 842.00 Costs Livestock Purchase (Farm gate) 550.00 Preparation On Farm (Dip) 1.00 Road Transport to Quarantine 15.00 Agents Fees (ranges from 3-5%)* 22.00 Road Transport to Wharf 5.00 Feeding at Pre-export Assembly Depot 15.00 Wharf Charges 1.00 Third Party Vet 3.50 AQIS 1.00 Stevedoring 3.50 Fodder for Voyage 19.80 Sea Freight* 165.00 Stockmen 2.00 Export Levies 2.36 Insurance 2.75 Bank Fees 4.00 Total Costs 812.91 Value Added 29.16 * Note: These items vary considerable over time and between shipments.
The 2004/05 notional value chain for live feeder/slaughter cattle exports is based on a CIF value delivered to Indonesia. Value added per head is approximately $30.00. The value chain demonstrates that the major revenue earners from the live cattle exports industry are:
Cattle producers (65%); Livestock agents (3%); Road transport providers (2%); Fodder suppliers (4%); Others (3%); Ship owners (20%); and Exporters (3%).
These figures are sensitive to exchange rate movements and are extremely variable. Case studies for individuals participating in the industry are provided in the following chapter.

Value of the live export industry
Page 15 of 64
3.3 Live sheep value chain
A value chain for live feeder/slaughter sheep is presented in Table 3.
Table 3: Notional value chain for live sheep 2004/05 $AUD per Head Total Gross Value 103.16 Costs Livestock Purchase (Farm gate) 55.00* Road Transport to Quarantine 3.50 Agents Fees 1.75 Buying Costs 0.75 Transit Insurance 0.40 Agistment and Handling 2.00 Feeding in Pre-export Assembly Depot 1.70 Shearing** 1.40 Freight to Wharf 1.00 Wharf Charges 0.19 Stevedoring 0.35 Third Party Vet 0.06 AQIS 0.08 Export Levies and Protocol Costs* 2.40 Fodder for Voyage 4.50 Sea Freight 23.00 On Board Veterinarian 0.20* Stockmen 0.10 Finance & Insurance 0.75 Total Costs 99.13 Value Added 4.03 * Note: These items vary considerable over time and between shipments. ** Based on 35% of numbers shorn.
The 2004/05 notional value chain for live sheep exports is based on a CIF value delivered to Saudi Arabia. Value added per head is approximately $4.00. From the value chain it can be seen that the major revenue earners from live sheep exports are:
Sheep producers (53%); Livestock agents (2%); Road transport providers (4%); Shearing (1%); Fodder suppliers (6%); Others (6%). Ship owners (22%); and Exporters (4%);
The current export environment for sheep is one of high domestic prices and in export markets. The value added has decreased from $8.75 in 1999/00 and the proportion of the value to the producer has increased from 33% to 53% (Hassall & Associates 2000). This highlights the variability in the value chain as market conditions and prices received alter.

Value of the live export industry
Page 16 of 64
3.4 Summary and conclusions
The livestock export industry value chain is complex and relatively long. Up to 30 separate business types, each generating value added and employing people in both urban and regional Australia, have been identified. The value chain for live cattle shows that producers, ship owners, exporters, agents and fodder suppliers are the major recipients of revenue from the trade. For live sheep, the major revenue recipients are producers, ship owners, exporters, fodder suppliers, road transporters, agents and shearers. Value added per head for live cattle in the value chain, not including an allowance for value added by each business supplying the chain or for any multipliers for those servicing the industry outside the chain, is estimated at $30.00 per head. Similarly, value added per head for live sheep is estimated at $5.00 per head.

Value of the live export industry
Page 17 of 64
4 Regional case study analysis The case studies focused on the economic impact of the industry on regions. The case studies regions examined were: Case Study 1: Fremantle, Western Australia. Case Study 2: Katherine and the Port of Darwin, Northern Territory. Case Study 3: Broome and north west Western Australia. Case Study 4: Portland and Victorian dairy regions.
The regions were selected due to their reliance on the live export industry and to provide a spread between northern and southern regions of the industry. The case study highlight the diverse range of players involved in the live export industry and place the industry in a regional context.
4.1 Fremantle/southern fringe of Perth and Wongan Hills
Fremantle is the primary live export port servicing the southwest, west and areas immediately north of Perth (Figure 8). The region is the main export distribution centre for the Western Australian live sheep export trade. Western Australian live sheep exports accounted for 82% of the national trade or 3.4 million head in 2005 and are the major livestock type moving through the port (Table 4).
Table 4 Number of livestock exported from the Port of Fremantle 2001 2002 2003 2004 2005 Cattle 139,202 145,013 125,531 87,142 84,513 Dairy cattle 1,672 6,108 4,728 Sheep 4,334,719 3,338,362 3,023,194 2,809,908 3,430,268 Goats 24,445 22,677 12,878 7,200 1,800 Source: LiveCorp (2006).
Figure 8: Location of Fremantle case study area

Value of the live export industry
Page 18 of 64
A selection of businesses that were consulted provides an overview of the value chain. Table 5 describes the type and name of businesses which provided expenditure and employment information and estimated their reliance on the livestock export industry. This case study concentrated on the contribution made by the live sheep export sector. During consultation owners of businesses located in Fremantle that service the sector emphasised the contribution of live exports to their businesses. Businesses that benefit from the industry's activities include shearing contractors, hay producers, wool producers, shipping support services and transport providers. Many have been established solely on the basis of servicing the industry and do not have alternatives sources of income if the live export industry did not exist.
Table 5: Fremantle case study businesses Type Business Type Business Producers Information provided by
Darkan Farm Management Advisory Service
Shearing Contractors K and S Shearing
Land Transport Roberts Transport Matthews Transport
Fodder Manufacturers Wellard Feeds Pty Ltd
Pre-export Assembly Depot
Rural Export and Trading (WA) Pty Ltd
Stevedores Toll/Western Stevedores
Fodder Growers R.J and A.M Carratti Providores SINWA IMES Pty Ltd This case study illustrates that the live sheep industry is an important source of both employment and value adding in the urban areas around Fremantle and the rural areas. It is estimated approximately 50% of sheep exported from Fremantle are sourced from the Great Southern region, with 20-25% from the north of Perth to Geraldton and the remaining 25% from south of Perth1. 4.2 Port of Darwin-Katherine
The Port of Darwin-Katherine case study region includes the Local Government Areas (LGAs) of Bathurst-Melville, Litchfield, Cox Peninsular, Coomalie, South Alligator, Jabiru, West Arnhem, Daly, Katherine, Elsey-Bal and Victoria in the Northern Territory. The major urban centres in the region are Darwin and Katherine (Figure 9). Mining, manufacturing, tourism and pastoral production are other dominant industries supporting Darwin. Darwin also supports several defence force bases. In Katherine, tourism, agriculture and defence combine to make it the Territory’s third largest town. The Port of Darwin is the only port in the case study region currently servicing the live cattle trade. The closest viable alternative port option for export cattle is Wyndham, in the north of Western Australia. There are 1.7 million cattle in the Northern Territory, approximately 6.5% of the total Australian herd. In 2004, 46.5% of cattle turned off from 216 properties in the Northern Territory were consigned to live export (NT DPIFM 2005).
1 Personal communication, Steve Meerwald, Wellard Rural Exports, Western Australia.

Value of the live export industry
Page 19 of 64
Figure 9: Location of Port of Darwin-Katherine case study area
The Port of Darwin accounted for 37% of the national trade, or 210,000 head, in 2005 (Table 6).
Table 6 Number of livestock exported from the Port of Darwin 2001 2002 2003 2004 2005 Cattle 262,313 324,144 263,698 216,894 209,274 Dairy cattle 700 Sheep 186 1,940 352 Goats 3,534 11,341 10,142 4,435 3,730 Source: LiveCorp (2006).
The businesses interviewed to establish the expenditure profiles and turnover associated with the live export industry are shown in Table 7.
Table 7: Port of Darwin case study businesses Type Business Type Business Producers Heytesbury Beef Fodder Growers and
Manufacturers Northern Feed and Cube
Agents Landmark Stevedores P&O Ports Darwin Patrick
Land Transport Gulf Road Trains of Australia Hamptons Transport
Government Agency Services and Industry Representation
AQIS Northern Territory Livestock Export Association
Pre-export Assembly Depot
Darwin Export Yards (NTLEA)
Other Services Helimuster
Veterinary Services Australian Livestock Services

Value of the live export industry
Page 20 of 64
4.3 Broome and north west Western Australia
The ABS statistical local area of Fitzroy, which includes the LGAs of Broome and Derby-West Kimberley, defines the Broome and north west Western Australia case study region. Broome is the main town in the case study region. Other significant localities include Derby and Fitzroy Crossing. Outside the case study region Kununurra and Wyndham in the state’s north east, and Port Hedland south of Broome are significant nearby regional centres. Tourism, cattle production, social services provision and mining are the dominant industries in the region. The Port of Broome is the only port in the case study region currently servicing the live cattle trade. Alternative port options for export cattle in northern WA include Port Hedland and Wyndham. These ports are outside the case study region but provide a viable alternative for exporting cattle from within the case study region. Figure 10 shows the location of Broome and the location of Wyndham, which is 1,100 km away.
Figure 10: Location of Broome case study area
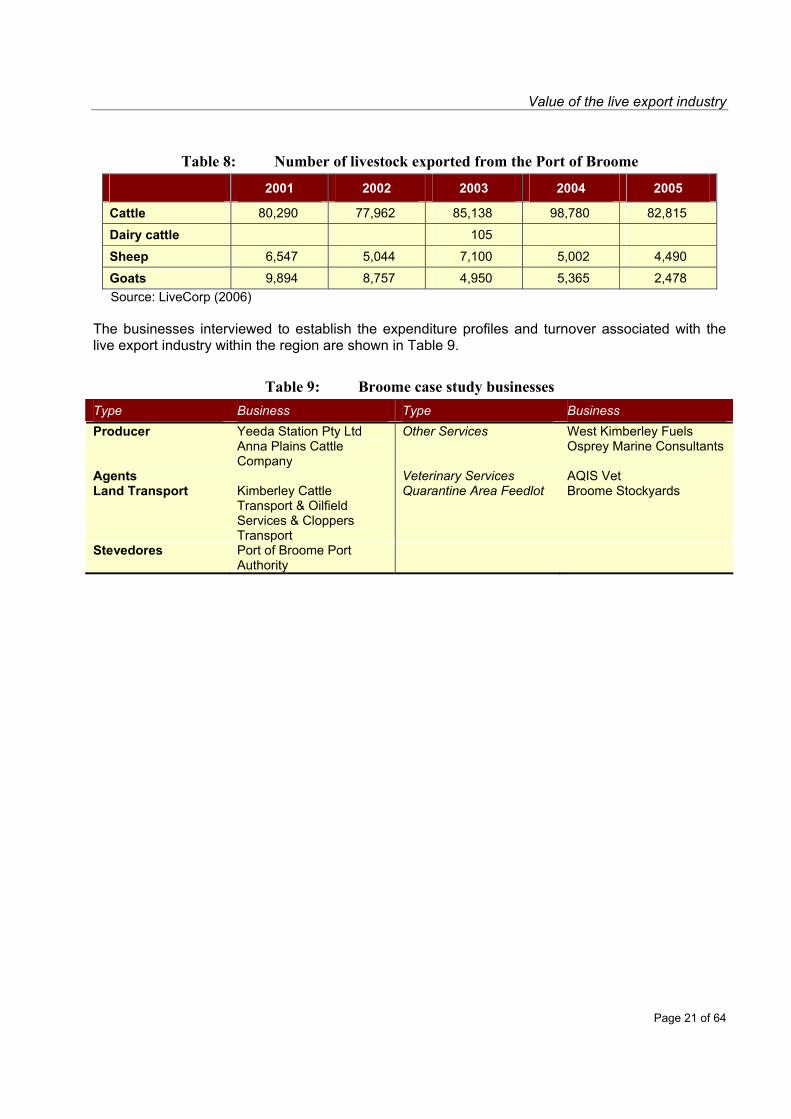
Cattle exports from the Port of Broome have been reasonably consistent over the past 5 years, averaging around 85,000 head per year (2001-2005). Broome was Australia’s second largest export port for live cattle in 2005 (14%) behind Darwin (37%). Export numbers were approximately 83,000 in 2005 (Table 8). Small numbers of sheep and goats are also exported from Broome.
Value of the live export industry
Page 21 of 64
Table 8: Number of livestock exported from the Port of Broome
2001 2002 2003 2004 2005
Cattle 80,290 77,962 85,138 98,780 82,815
Dairy cattle 105
Sheep 6,547 5,044 7,100 5,002 4,490
Goats 9,894 8,757 4,950 5,365 2,478 Source: LiveCorp (2006)
The businesses interviewed to establish the expenditure profiles and turnover associated with the live export industry within the region are shown in Table 9.
Table 9: Broome case study businesses Type Business Type Business Producer Yeeda Station Pty Ltd
Anna Plains Cattle Company
Other Services West Kimberley Fuels Osprey Marine Consultants
Agents Veterinary Services AQIS Vet Land Transport Kimberley Cattle
Transport & Oilfield Services & Cloppers Transport
Quarantine Area Feedlot Broome Stockyards
Stevedores Port of Broome Port Authority

Value of the live export industry
Page 22 of 64
4.4 Portland and Victorian dairy regions
Victoria has three significant, commercially distinct, dairy regions. They are Gippsland, western Victoria and northern Victoria. The Port of Portland is the major location for dairy cattle exports in the case study region. Victoria dominates live dairy cattle exports. Dairy cattle exported from Portland are now of similar number to cattle for feeder/slaughter (Table 10). Figure 11 shows the location of Portland and significant towns in the three dairy areas.
Table 10: Number of livestock exported from the Port of Portland 2001 2002 2003 2004 2005 Cattle 57,010 68,271 55,608 73,925 50,703 Dairy cattle na na 41,014 70,848 43,062 Sheep 1,246,728 1,250,667 736,494 246,960 311,068 Goats 1,752 43,674 20 Source: LiveCorp (2006).
Figure 11: Location of Portland and Victoria case study area
The businesses interviewed to establish the expenditure profiles and turnover associated with the live export industry within the region are shown in Table 11.
Table 11: Portland and dairy regions case study businesses Type Business Type Business Producer WN & J Higgins
BM & S Cunningham Exporter Elders International
Agents Elders – Darryl Adams Other Services - Fodder JT Johnson Land Transport AT & JM Bramstead and Son Veterinary Services Timboon Veterinary Group Port Port of Portland
Value of the live export industry
Page 23 of 64
5 Impact of export cessation on live export industry participants
5.1 Introduction
The purpose of this chapter is to describe the impact of a sudden cessation of livestock exports on the live sheep and cattle industries. Cessation of livestock exports would have an immediate adverse impact, as well as a longer term structural impact. The initial impacts would be especially focused on the sheep industry in Western Australia and the cattle industry in northern Australia. Chapter 5 assesses the structural impacts and longer term economic effects across the entire sheep and cattle industries using the Global Meat Industry (GMI) Model developed by CIE. 5.2 Immediate impacts
The immediate adverse impact of a cessation of livestock exports would be evident in a sudden fall in prices as producers and processors adjusted to the additional supplies available for domestic slaughter. The potential increased supply is significant given that live exports accounted for 12% of the annual national turnoff of sheep and 7% of the annual turnoff of cattle (MLA 2006b). In Western Australia, live exports accounted for 62% of the annual turnoff for sheep and 40% for cattle during the period 2003 to 2005 (MLA 2004). For the Northern Territory, a significantly higher percentage of cattle turned off are exported than the rest of Australia. It is noted that cattle are sourced from the Northern Territory for feedlots in Queensland. The sudden loss of live export markets when they take such high proportions of turnoff would inevitably cause temporary financial chaos and social hardship for producers, especially in Western Australia and the Northern Territory. This assessment was supported by anecdotal evidence provided during case study interviews regarding significant disruptions to the live export trade in the past decade. It was also the judgement of experienced participants in the trade who took part in the workshop to assess future prospects. In Western Australia, closure of the Saudi Arabian market for live sheep caused an immediate 50% reduction in local prices1. During the Asian financial crisis of 1997 prices for live export steers dropped from $1.45 per kg live wt at the farm gate to 90 cents per kg live wt. The price stayed within this range while demand was suppressed, and only recovered as demand increased in response to a lower Australian dollar2.
1 Personal communication, Bob Hall Darkan Western Australia. 2 Personal communication, Ross Ainsworth, Australasian Livestock Services, Darwin Northern Territory.

Value of the live export industry
Page 24 of 64
5.3 Subsequent adjustments
5.3.1 Sheep
In the longer term (after 2 years) producers’ responses to cessation of live sheep exports would be subject to the incentives, risks and costs of:
Retaining lambs and sheep with the objective of increasing wool production;
Retaining lambs and sheep with the objective of increasing lamb and/or mutton production;
Diverting supplies to other less affected markets. For example, Western Australia producers would have the option of transporting lambs/sheep to South Australia and/or eastern States for slaughter; and
Ceasing lamb/sheep production and diverting land uses, permanently or on rotation, to other livestock and/or crops.
None of these options are necessarily mutually exclusive, and it is likely that individual producers would adopt a combination, depending on the location of their operations and weather conditions. It is beyond the scope of this study to evaluate all these factors. However the following points warrant comment:
Wool prices are currently low and the outlook for wool prices is not encouraging;
The availability of slaughter capacity in Western Australia is a significant potential limitation to the scope to retain lambs and sheep for slaughter in that State. This limitation is prompted by two factors: actual capacity and labour costs inflated by the demands of a buoyant mining sector. Additional slaughtering capacity to cope with increased sheep and lamb numbers would therefore come at a cost which would be borne primarily by producers;
There are always opportunities for land use change. Commodity price cycles, land suitability and location would require detailed consideration prior to any decisions; and
As at December 2005, lambs and sheep are being transported from Western Australia to eastern States and, although costly, continuation and extension of this option would appear to be the most likely outcome.
5.3.2 Cattle
Northern Australian cattle producers would have fewer options than their sheep counterparts in the event of a sudden cessation of live cattle exports and a subsequent drop in prices. The principal options would be to:
Transport finished cattle from Northern Territory and northern Queensland by truck to the slaughter facilities in central and southern Queensland and South Australia;
For the Kimberley region trucks would take cattle to the southern agricultural areas of WA;
Sell cattle to producers in Queensland where they will be finished and eventually slaughtered; or
Construct a new slaughtering facility in the Northern Territory/Kimberley region.
Value of the live export industry
Page 25 of 64
The options are not mutually exclusive with individual producers likely to adopt a combination of the first two options. The prospects for the construction of a new slaughtering facility are dependent on the price outlook for both manufacturing and high quality beef. Historically, the common practice was for northern Australia beef producers to turnoff store cattle and transport them east and south for ‘fattening’ (e.g. on the Channel Country) but most were slaughtered in small, seasonally operated abattoirs which generally struggled financially. When these plants closed, the industry was transformed when live cattle exports surged in the nineties and early years of this decade. Currently, the movement of cattle east and south ebbs and flows, depending on prices offered for cattle for live export versus slaughter cattle. The likely outcome of the cessation of livestock exports would be a shift to moving all cattle south and east, with northern producers either directly or indirectly bearing the transport costs. This would be a major setback both for producers and the regional economies, especially in the Northern Territory. The prospects for the construction of a commercially viable abattoir in Northern Territory may improve. In summary, the one certainty of cessation of the live export trade would be lower prices and higher costs for all northern Australia cattle producers. This in turn would be likely to result in reduced total cattle numbers and beef production over the long term. Such an outcome could be avoided, at least in part, if a slaughtering facility with access to Kimberley and Northern Territory cattle was to be constructed. However, this remains only a prospect. The estimation of the farm level impact on operations and profitability from cessation of the live export trade in specific regions was not included in the terms of reference of this report.

Value of the live export industry
Page 26 of 64
6 The impact of live exports on domestic livestock prices 6.1 Introduction
This section assesses the impact of live exports on prices and Gross Value Product (GVP) of domestic beef cattle and sheep industries. The demand for cattle and sheep for live export is a significant component of the overall market for livestock and contributes to the levels of prices and, in turn, the GVP of the producing sector. In the absence of the live export industry, livestock would be diverted to other market channels, principally for slaughter for export, affecting prices for livestock and overall industry returns. The value of the contribution that the live trade makes to livestock prices in Australia and to overall industry earnings was quantified using the Global Meat Industry (GMI) model. This model is constructed and operated by the Centre for International Economics (CIE) on behalf of MLA. The model incorporates significant meat and seafood producing and consuming sectors of the world and, accounting for the inter-relationships between these sectors, is able to estimate the various impacts of changes/shifts in any component. The value of the live export trade to Australia’s beef cattle and sheep industries can be estimated by using the GMI model to simulate the closure of the trade. The impact of a closure of the live trade on Australia’s beef cattle and sheep industries will vary with the time frame used in the analysis and also the extent to which the change is anticipated by the industry. In the very short term, the impact of an unexpected closure of live trade would be highly disruptive to prices in specific regional markets. Assessment of such short term and regionally specific impacts is beyond the capabilities of the GMI model and has been discussed in Section 4. The GMI model is an annual model and the simulation undertaken for this study is designed to capture the impact of closure of the live trade over a period of 1 to 2 years. That is, the model captures the effects after all participants in the value-chain have had time to adjust to changed relative prices. It would be expected that in the longer-term (5 to 10 years) the impact would be less than in the short term as businesses adjust to the new set of price relationships. For the simulation considered in the report the model is based on the market conditions between 2002 and 2004, a time period which is considered to be representative of market conditions in the future.

Value of the live export industry
Page 27 of 64
6.2 Sheep industry
6.2.1 Simulation approach
Sheep that are currently exported live are assumed to be diverted to the domestic processing industry for slaughter and the meat sold on both domestic and export markets. This assumption required specification of the regional and market channels along which livestock would be diverted. Because sheep currently exported live are of similar weights to those slaughtered, it was assumed that there would be no lag in diverting live export types to processing. Other key assumptions were:
Of the annual average of 4.75 million sheep exported live in 2002-04, approximately 30% could be slaughtered as lamb.
Of 3.1 million sheep exported live from Western Australia in the base period, 1 million will be processed in Western Australia (as lambs) and the remainder transported to South Australia and Victoria for slaughter.
The capacity of the Western Australian processing sector to handle this extra throughput is debatable, with labour a key constraint on lifting processing capacity in the short term. If government signalled a closure of the trade, existing capacity could gear up (perhaps with labour from eastern states) to take advantage of sharply lower sheep prices, and slaughter a higher proportion locally
Of the total sheep exported live from Western Australia, 1 million are estimated to be lambs, 0.25 million ewes and the remainder (1.85 million) hoggets and wethers that are slaughtered for mutton: − Overall numbers slaughtered as lamb are 1 million (at 42 kg live wt) and slaughtered as
mutton are 2.1 million (at 52 kg live wt).
Live sheep exported from Victoria and South Australia were assumed to be processed locally: − It should be noted that South Australia does not have the capacity to slaughter its own
live sheep (1.67 million) plus the additional 2 million sheep from Western Australia. − A proportion of South Australian sheep would have to be pushed into Victoria for
slaughter under this scenario.
The additional transport cost used for WA sheep was $18 per head which, spread over the entire Australian slaughter of mutton, amounts to additional transport costs equivalent to 7.2% of the farm gate price for these animals.
The diversion of live exports resulted in lamb and mutton production increasing by 31 and 85 kt cwe or 9% and 36% respectively above the national levels of the 2002-04 base period.

Value of the live export industry
Page 28 of 64
6.2.2 Results across the sheep industry
The average annual value of live sheep exports was just under $300 million on a FOB basis over the three years 2002-04. In terms of GVP, the loss in live exports is offset somewhat by an increase in the domestic value of lamb and mutton production (Table 12). Lamb and mutton production would be around 18% higher than would otherwise be the case but mutton accounts for 80% of this increase. This increase in meat production drives lamb and mutton prices lower than they would otherwise have been because domestic and export markets have limited capacity to take additional product at the existing price (that is, demand is not perfectly elastic). The model calculates that the price of lamb would fall by 7.0 cents per kilogram live wt or by 4.1% (Table 12). The fall of nearly 17 cents per kilogram live wt or 18.3% is much larger for mutton. In response to these changes in price, other sheepmeat producers would eventually respond to lower farm-gate prices by reducing supply and prices would start to recover (these second round effects are not assessed in this GMI model simulation). The increase in GVP from this additional mutton and lamb production ($76 million) is not sufficient to offset the value lost from the closure of the live trade. In total, the national sheep/sheepmeat industry would be almost $220 million or 11.4% worse off in GVP terms without the live sheep trade.
Table 12: Domestic market impacts of a closure of live sheep trade Change Percentage Change
Annual Production Sheep meat (excluding live) 106 18.5 Lamb (kt cwe) 24 6.9 Mutton (kt cwe) 82 35.3 Live sheep (kt cwe) -108 -100.0 (‘000 head) -4,712 -100.0 Farm prices (A c/kg live weight) Lamb -7.0 -4.1 Mutton -16.9 -18.3 Live sheep na na Annual GVP ($A million) Lamb 31 2.6 Mutton 45 10.5 Live sheep -296 -100.0 Total sheepmeat -219 -11.4 Source: GMI model, based on years 2002-2004.

Value of the live export industry
Page 29 of 64
6.3 Beef cattle industry
6.3.1 Simulation approach
The methodology used to assess the contribution of the live cattle industry followed that used for the live sheep industry. A key assumption in the simulation of the closure of the live cattle export trade was that Indonesia would not simply switch to Australian boxed product. It was assumed that if the supply of Australian live cattle ceased, Indonesia would change its policy to permit the import of Indian buffalo meat and South American product as is happening now in Malaysia and the Philippines. Other assumptions were:
Cattle now exported live through northern ports will be diverted to eastern states for processing and export. Twenty percent of these cattle will be cull cows and bulls that will be slaughtered to produce 30 kt cwe of manufacturing beef for export to the US. The remaining cattle will eventually be suitable for the Japanese and Korean primals market. Trimmings from these animals will go to manufacturing markets. This scenario is consistent with what happens now in the northern Australian market where slumps in live export demand can lead to cattle being diverted to Queensland.
The average weight (355 kg) of cattle exported live over the 2002-04 period is too low for slaughter for the Japanese primals market. These cattle must be grown out for an additional year. − The analysis assumes that cattle diverted into growing out for primal production would
attain an average weight gain of 0.4-0.5 kg per day to reach a slaughter weight of around 540 kg.
Diversion incurs an additional transport cost of 40 cents per kilogram live weight over and above the current costs to the live export port.
At their original slaughter weight, the 738,000 head exported live annually between 2002-2004 would have an equivalent carcass weight tonnage of 145 kt cwe. If 80% of these cattle are grown out to Japanese slaughter weight with the remainder slaughtered immediately, the equivalent carcass weight would increase by around 210 kt cwe. This tonnage is equivalent to 13.5% of all grass fed beef produced on average in 2002-2004. This ‘first round’ increase in supply would be concentrated in central and south-eastern Queensland. 6.3.2 Results across the beef cattle industry
Live cattle exports over the period 2002-2004 averaged around $440 million on a FOB basis. If the live cattle trade were to close, the short term impact would be an initial year of lost live export sales ($440 million) offset only by the relatively modest production of 30 kt of manufacturing meat from cattle that would not be fed on. In the second year, without live exports, production of beef and veal would be 179 kt cwe or 7.9% higher. The consequent impact on prices would cause the value of grass fed beef production to fall by $32 million and the value of grain fed beef production to increase by $142 million.
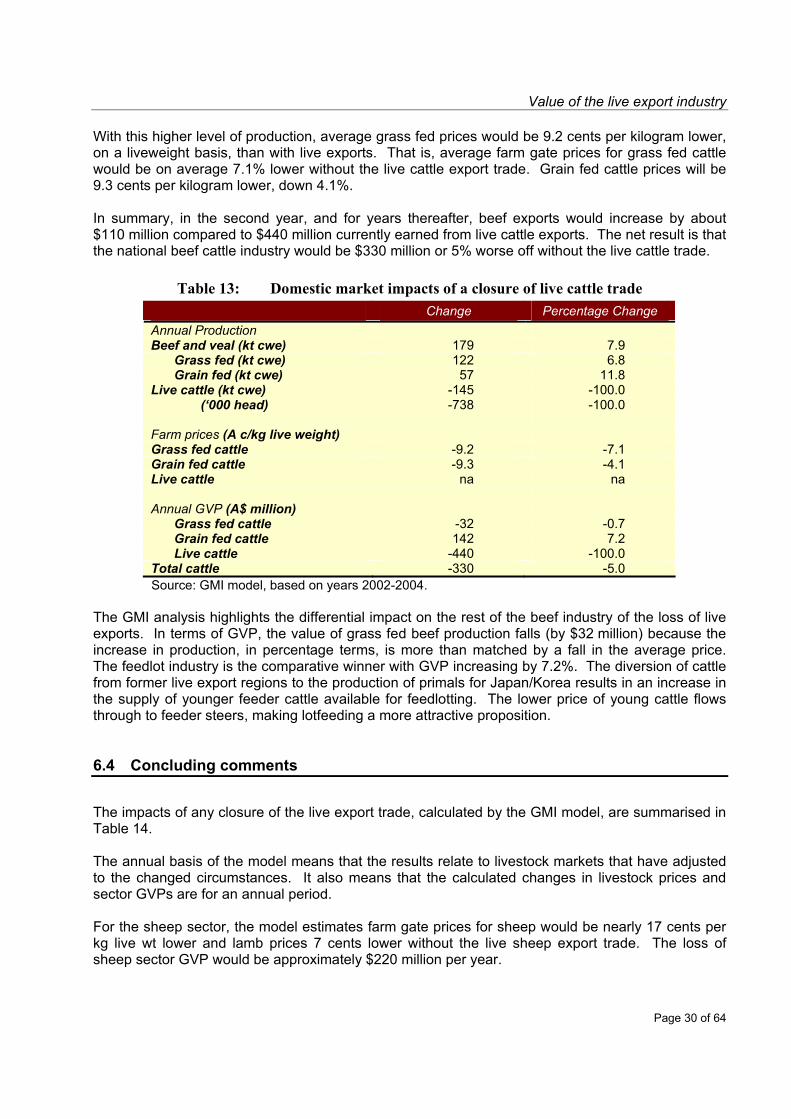
Value of the live export industry
Page 30 of 64
With this higher level of production, average grass fed prices would be 9.2 cents per kilogram lower, on a liveweight basis, than with live exports. That is, average farm gate prices for grass fed cattle would be on average 7.1% lower without the live cattle export trade. Grain fed cattle prices will be 9.3 cents per kilogram lower, down 4.1%. In summary, in the second year, and for years thereafter, beef exports would increase by about $110 million compared to $440 million currently earned from live cattle exports. The net result is that the national beef cattle industry would be $330 million or 5% worse off without the live cattle trade.
Table 13: Domestic market impacts of a closure of live cattle trade Change Percentage Change
Annual Production Beef and veal (kt cwe) 179 7.9 Grass fed (kt cwe) 122 6.8 Grain fed (kt cwe) 57 11.8 Live cattle (kt cwe) -145 -100.0 (‘000 head) -738 -100.0 Farm prices (A c/kg live weight) Grass fed cattle -9.2 -7.1 Grain fed cattle -9.3 -4.1 Live cattle na na Annual GVP (A$ million) Grass fed cattle -32 -0.7 Grain fed cattle 142 7.2 Live cattle -440 -100.0 Total cattle -330 -5.0 Source: GMI model, based on years 2002-2004.
The GMI analysis highlights the differential impact on the rest of the beef industry of the loss of live exports. In terms of GVP, the value of grass fed beef production falls (by $32 million) because the increase in production, in percentage terms, is more than matched by a fall in the average price. The feedlot industry is the comparative winner with GVP increasing by 7.2%. The diversion of cattle from former live export regions to the production of primals for Japan/Korea results in an increase in the supply of younger feeder cattle available for feedlotting. The lower price of young cattle flows through to feeder steers, making lotfeeding a more attractive proposition. 6.4 Concluding comments
The impacts of any closure of the live export trade, calculated by the GMI model, are summarised in Table 14. The annual basis of the model means that the results relate to livestock markets that have adjusted to the changed circumstances. It also means that the calculated changes in livestock prices and sector GVPs are for an annual period. For the sheep sector, the model estimates farm gate prices for sheep would be nearly 17 cents per kg live wt lower and lamb prices 7 cents lower without the live sheep export trade. The loss of sheep sector GVP would be approximately $220 million per year.

Value of the live export industry
Page 31 of 64
Table 14: Summary of farm gate domestic price impacts Change
A c/kg live wt Percentage
Change
Sheep -17 -18.3 Lamb -7 -4.1 Grass fed Cattle -9.2 -7.1 Grain fed Cattle -9.3 -4.1 Source: GMI model.
For the beef cattle sector, farm gate prices for cattle would be over 9 cents per kg live weight lower and the loss of sector GVP would be over $400 million in the first year after any closure of the trade and approximately $330 million per year thereafter. In the event of a closure of the live export trade in cattle and sheep the GVP of Australia’s sheep and beef cattle industries is estimated to fall by approximately $550 million per annum. When compared to the current value of total agricultural production of $31.3 billion this potential loss is a significant impact, approaching a 2% reduction in overall value. The medium term reduction in gross value across the beef and sheep sectors resulting from a cessation of livestock exports would be comparable to the complete loss of canola production in Australia which generated $556 million in 2003/04 (DAFF 2005).
Value of the live export industry
Page 32 of 64
7 Forecasting the value of livestock exports 7.1 Approach
An objective of this study is to provide a forecast of how the value of the live export trade may change over the next five years. The approach taken was to identify the key influences shaping the outlook for live cattle and live sheep exports and to consider how these could be expected to change over the next five years. This approach involved an intensive workshop process involving key specialists able to contribute to a consensus on these influences and their impacts. The forecasts that are made biannually by MLA for the industry were noted in the workshops and conclusions drawn as to whether they can be ‘sharpened’ as a result of the assessments generated by this study. Key MLA forecasters participated in the workshops. 7.2 Live sheep exports
7.2.1 Overview of recent numbers and values
In brief, Australia’s sheep exports decreased to approximately 60% of the peak achieved in 2001, when total export numbers reached 6.8 million. About 40% of the drop after 2001 is accounted for by the reduction of exports to the Saudi Arabian market. In 2005, total exports were 4.2 million head. Almost all exports are to Middle East countries. Figure 12 illustrates that the variability in exports to Saudi Arabia is the principal reason for fluctuation in total annual export numbers. This variability has been prompted by restrictions on access between 1989 and 1999 and again between late 2003 and mid 2005. The Saudi market reopened in 2005 with stronger, government agreed, safeguards. Apart from the fluctuations in exports to Saudi Arabia, the decline in total exports over the past decade has been greatest in exports to the UAE, with numbers falling consistently from 1.71 million in 1997 to 0.23 million in 2005. The main explanation for this decline has been UAE’s preparedness to accept sheep from a variety of sources under more liberal quarantine conditions than neighbouring countries. Exports to Jordan, that had also been falling, bounced back in 2004 and 2005. Elsewhere, the pattern is mixed. Kuwait, a long standing market, has fallen from early 2000 peaks but export numbers are still similar to a decade ago. Other outlets such as Oman and Qatar have declined to around half their purchase quantities a decade ago. Bahrain stands out with increased purchases. The average age of sheep exported continues to decline, reflecting both flock changes and customer (particularly Saudi) preferences. The unit value per sheep has been higher in the past 4 years (Table 15).
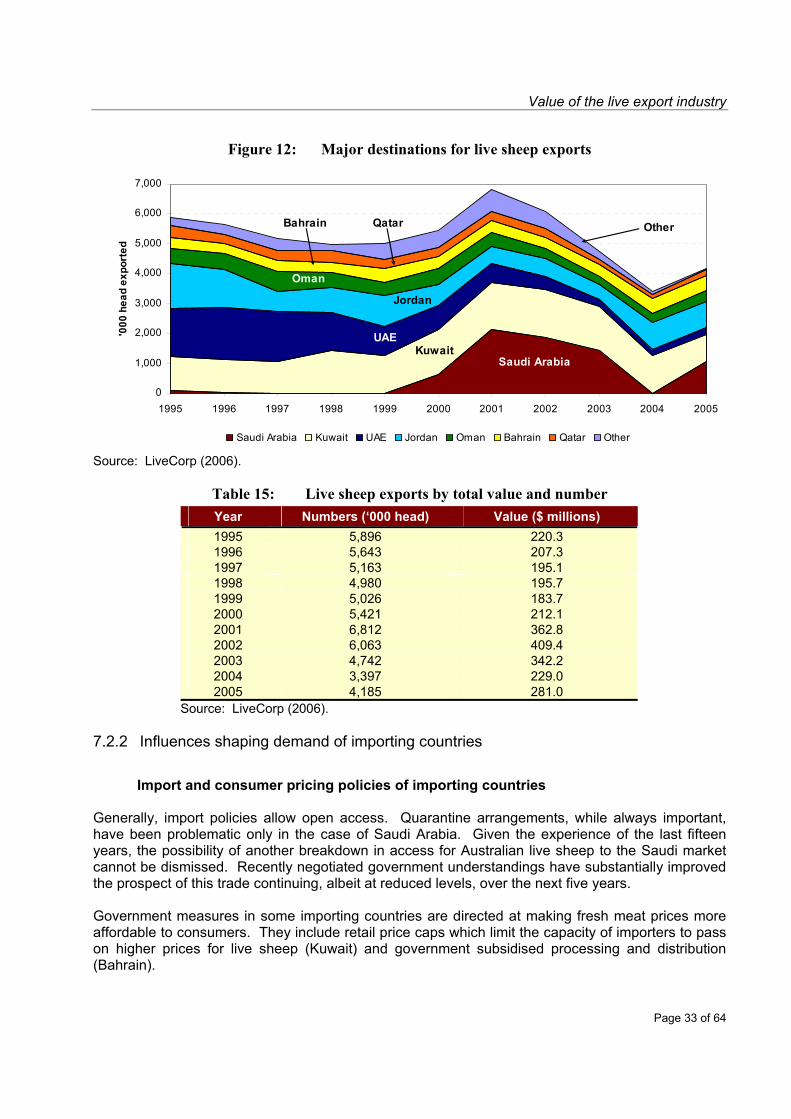
Value of the live export industry
Page 33 of 64
Figure 12: Major destinations for live sheep exports
Saudi ArabiaKuwait
UAE
Jordan
Oman
Bahrain Qatar Other
0
1,000
2,000
3,000
4,000
5,000
6,000
7,000
1995 1996 1997 1998 1999 2000 2001 2002 2003 2004 2005
'000
hea
d ex
port
ed
Saudi Arabia Kuwait UAE Jordan Oman Bahrain Qatar Other
Source: LiveCorp (2006).
Table 15: Live sheep exports by total value and number Year Numbers (‘000 head) Value ($ millions) 1995 5,896 220.3 1996 5,643 207.3 1997 5,163 195.1 1998 4,980 195.7 1999 5,026 183.7 2000 5,421 212.1 2001 6,812 362.8 2002 6,063 409.4 2003 4,742 342.2 2004 3,397 229.0 2005 4,185 281.0
Source: LiveCorp (2006). 7.2.2 Influences shaping demand of importing countries
Import and consumer pricing policies of importing countries
Generally, import policies allow open access. Quarantine arrangements, while always important, have been problematic only in the case of Saudi Arabia. Given the experience of the last fifteen years, the possibility of another breakdown in access for Australian live sheep to the Saudi market cannot be dismissed. Recently negotiated government understandings have substantially improved the prospect of this trade continuing, albeit at reduced levels, over the next five years. Government measures in some importing countries are directed at making fresh meat prices more affordable to consumers. They include retail price caps which limit the capacity of importers to pass on higher prices for live sheep (Kuwait) and government subsidised processing and distribution (Bahrain).

Value of the live export industry
Page 34 of 64
Future policies are hard to anticipate for these and other Middle Eastern countries as they are generally intended to stabilise staple food prices and avoid any adverse political consequences. Policy shifts could be triggered by changes in the level of sheep prices and, more particularly, government income which is oil price dependent in most Middle East countries. The overall conclusion is that there is a low level of risk of any import policy developments that will be adverse to imports of Australian live sheep. If the UAE were to enhance its quarantine standards in line with its rapid economic growth and rising living standards, the prospects are for a recovery in demand for Australian live sheep in that market. The traditional preference for live animals and fresh meat is likely to continue in major markets, so displacement by boxed meat is not likely in the medium term.
Supplies of sheep from other countries Large numbers of sheep from Africa compete with Australian sheep in Middle Eastern markets. The supply of these sheep depends on climatic conditions, disease events and political stability. Increasing numbers of sheep from Somalia have offset the decline in Australian exports in recent years, and Sudan would appear to have some potential to increase shipments. In the past, significant numbers of sheep have moved south out of Turkey and Syria, but this trade flow is unlikely to recover. Uruguay and China have made some shipments, but, they are not expected to be a large threat due to logistical difficulties. Overall, population pressures and disruptions to supplies are considered unlikely to allow live sheep shipments from other sources to displace Australian sheep in the next five years.
Prices of competing proteins Chicken consumption in the Middle East is greater than sheepmeat, mainly because chicken is much cheaper. Growing global concern about avian influenza has had a negative impact on chicken consumption patterns in Europe and Asia that may take years to reverse. Assuming this disease problem can be effectively managed, the future demand for chicken in Middle East markets will depend on price, which in turn depends on productivity gains and grain prices. Chicken is unlikely to become significantly more competitive with sheepmeats over the next five years. Sheepmeat from Australia and New Zealand, especially chilled lamb, compete at the margin with meat derived from sheep imported from Australia. One point of view is that sheepmeat imports will progressively displace live sheep in Middle East markets. However, the evidence of recent decades does not support this contention, particularly as supplies of cheaper mutton from both sources have declined and prices of lamb have soared. Alternative sources of sheepmeat for Middle East markets are Iran, India, Pakistan and China. Supplies from these sources are said to have displaced Australian derived product in the UAE and could pose a threat in other markets. Rapid economic growth in India and China are most likely to result in rising consumption in domestic markets and so limit any significant growth in the quantities available for export. Overall, the supply and price of meats alternative to those derived from live sheep and lambs imported from Australia are considered unlikely to shift to an extent detrimental to Middle East market prospects for Australian livestock.

Value of the live export industry
Page 35 of 64
Economic conditions in importing countries
Stronger economic conditions and rising consumer incomes in most Middle East countries is likely to result in increasing demand for fresh and chilled sheepmeat. An important component of this demand is the provisioning of guest workers employed on infrastructure development projects. The other side of the same coin is the contraction of demand when economies falter. The main driver of Middle East economies is oil, so that future oil prices will heavily affect the demand for Australian live sheep. Any attempt to forecast oil prices up to five years ahead is beyond the scope of this study, however, from an array of assessments and expert opinions the current upward trend is expected to continue. Such a development will support continuing and likely strengthening demand for fresh and chilled sheepmeats. 7.2.3 Influences shaping supply of live sheep out of Australia
Currency exchange rate
The appreciation of the $AUD in recent years has made Australian sheep more expensive for importing countries with currencies aligned with the $US. Obviously, any further appreciation of the currency would make sheep imports even less attractive. Devaluation would work to the contrary. The average daily exchange rate for the Australian dollar against the $US for 2004/05 was US75 cents. The weight of opinion canvassed by this study puts the Australian dollar in the range US65-75 cents for the next 1 to 3 years. The likelihood of the Australian dollar moving and staying outside this range is considered to be remote. These predictions are to the advantage of Australian live sheep exports.
Price of sheep in Australia Sheep numbers have almost halved over the last fifteen years as the profitability of wool production has slumped and drought has reduced carrying capacity. The numbers available for live export have also clearly declined. The demand for sheep for slaughter in Australia has been boosted in recent years by stronger mutton and lamb prices. To some extent this is a knock on effect from stronger beef prices. Future demand for sheep for slaughter will be influenced by trends in world meat prices. If beef prices decline then mutton prices are likely to follow. Sheep numbers are rebuilding, especially in Western Australia, the predominant source of live sheep for export, but recovery will depend heavily on wool prices. Another factor encouraging flock rebuilding is the problem of increasing weed infestation in the grain belt; where rotational sheep grazing is seen as an economical control measure. Arguably, the prices for sheep will depend more directly on their value for meat, either for export live or for slaughter. With Australian and global beef and mutton prices predicted to fall, competition from processors for sheep for slaughter in Australia is predicted to weaken over the next five years. A shortage of labour to operate meat plants is also a chronic difficulty for processors, particularly in Western Australia.

Value of the live export industry
Page 36 of 64
Consequently downward pressure on the prices that live exporters have to bid for sheep is anticipated. Expressed alternatively, current offer prices will elicit increasing numbers for live export.
Transport costs Higher fuel prices and associated trucking expenses have been raised as a possible factor affecting the FOB cost/value of live sheep. Because fuel costs are a relatively small component of FOB value, rises in the price of fuel of the order experienced in 2005 will not significantly influence the offer price of sheep out of Australia and therefore the live export of sheep. Further, such price rises are unlikely to persist at the same rate over the next five years. Fuel costs will also influence shipping charges. Inefficient fuel usage (among other reasons) has contributed to the withdrawal of small vessels from the live sheep export trade in recent years. Failure to meet Australian Marine Safety Authority (AMSA) survey standards is likely to see the retirement of further vessels from the trade from 2007 and beyond. Serious concern has been expressed that the retirement of vessels from 2007 could see capacity limitations constrain the level of live sheep exports to little more than 4 million head. Capacity at this level would be a binding constraint on the number of sheep and lambs shipped. The risk of such a constraint eventuating is difficult to assess because raising the issue signals an opportunity for ship owners to consider retaining AMSA certification for existing vessels before they are due to come ‘out of survey’ at the end of 2006. It also highlights the opportunity for some vessels to switch from other trades, including the live cattle trade, if the commercial incentive to carry livestock is apparent. Re-building specialised shipping capacity always has a long lead time, potentially several years when global ship building is at a cyclical high point, as at present. As at December 2005 only one new vessel is understood to be on order for the live sheep trade and delivery time is 2 to 3 years. Shipping charges are affected by the capacity available. In the past, periods of surplus shipping capacity have been associated with very competitive rates that are advantageous to exports. If capacity becomes tight, ship owners can be expected to attempt to lift rates. Even so this is likely to be limited as any excessive rise may choke off the trade in which they have invested.
Compliance costs The competitiveness of sheep exports is influenced by the standards and protocols, including those relating to animal health and welfare, which have to be complied with by exporters and shippers. Standards have progressively tightened as governments have responded to animal welfare incidents and general community concerns. Compliance costs, which have to be passed forward to the purchaser or back to the producer, will increase if standards are further tightened. While significant, these costs are now regarded by industry as ‘the cost of doing business’, and are not foreseen as likely to be detrimental to the competitiveness of the trade.
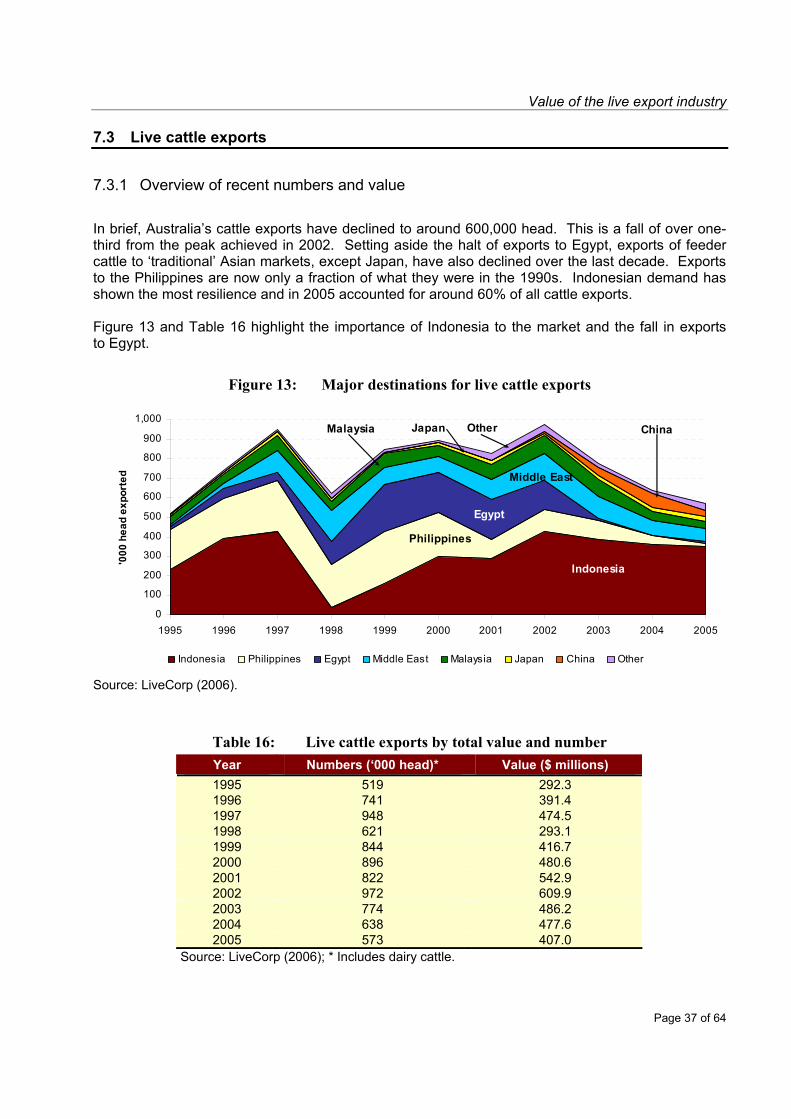
Value of the live export industry
Page 37 of 64
7.3 Live cattle exports
7.3.1 Overview of recent numbers and value
In brief, Australia’s cattle exports have declined to around 600,000 head. This is a fall of over one-third from the peak achieved in 2002. Setting aside the halt of exports to Egypt, exports of feeder cattle to ‘traditional’ Asian markets, except Japan, have also declined over the last decade. Exports to the Philippines are now only a fraction of what they were in the 1990s. Indonesian demand has shown the most resilience and in 2005 accounted for around 60% of all cattle exports. Figure 13 and Table 16 highlight the importance of Indonesia to the market and the fall in exports to Egypt.
Figure 13: Major destinations for live cattle exports
Indonesia
Philippines
Egypt
Middle East
Malaysia Japan ChinaOther
0
100
200
300
400
500
600
700
800
900
1,000
1995 1996 1997 1998 1999 2000 2001 2002 2003 2004 2005
'000
hea
d ex
port
ed
Indonesia Philippines Egypt Middle East Malaysia Japan China Other
Source: LiveCorp (2006).
Table 16: Live cattle exports by total value and number Year Numbers (‘000 head)* Value ($ millions) 1995 519 292.3 1996 741 391.4 1997 948 474.5 1998 621 293.1 1999 844 416.7 2000 896 480.6 2001 822 542.9 2002 972 609.9 2003 774 486.2 2004 638 477.6 2005 573 407.0
Source: LiveCorp (2006); * Includes dairy cattle.

Value of the live export industry
Page 38 of 64
7.3.2 Influences shaping demand of importing countries
Trade policies of importing countries
In Indonesia, demand for feeder cattle from Australia has been encouraged by restrictions on imports of cheaper frozen buffalo meat from India and frozen beef from Brazil. This policy is driven by the desire of Indonesia to avoid the risk of any incursion of Foot and Mouth Disease (FMD). A secondary consideration may be support for small livestock farmers and encouraging the availability of fresh beef throughout regional areas, where refrigeration is limited. Although not strictly enforced, this policy boosts demand for local beef, including beef produced from cattle originally imported from Australia. Other policies also support local production. Some evidence of the potential impact of any changes to Indonesian import policy can be seen in the Philippines where imports of Indian buffalo and Brazilian beef are unrestricted. Filipino imports of cattle from Australia have more than halved since 2000 and are still falling. It is assumed that Indonesia will continue to avoid any risk of FMD in the foreseeable future and will be encouraged to maintain this policy position by rising global commodity prices for beef and easing live cattle prices out of Australia. In other words, the direct economic cost to Indonesia of the policy is expected to decline. The trade policies, not only of Indonesia, but also of the other importing countries will be influential in shaping live cattle import opportunities over the next 5 years. The Philippines is not expected to change, given the new status quo with respect to meat imports and the continuing need for cheap protein to offset the poor performance of the economy. Japan’s imports are constrained by space in quarantine facilities and any increase is likely to be small. Malaysia and Middle East markets are open to live imports from a variety of supplying countries. It is considered that policies in these countries are unlikely to change over the next 5 years. Disease events have heavily influenced the pattern of global trade in beef and live cattle over the last decade and the risk of repetition is probably quite high. These events are impossible to anticipate but the continued strong policy measures of Australian governments to avoid any disease incursions suggests that new market opportunities are likely to arise.
Prices of competing proteins The prices at which alternative meats are traded internationally will influence the demand for Australian feeder cattle. Rapidly increasing supplies of beef out of South America have been one development, but others include cyclical movements in pork and poultry supplies and prices. Events shaping these developments include changes to the European Union Common Agricultural Policy and meat exports, disease outbreaks and responses, and movements in international grain prices. It is likely that the price of beef out of South America, especially Brazil, will continue to rise as currencies rebound; even though overall global beef prices will move lower than the last couple of years when the US has been excluded from high priced Asian markets. The EU will continue in its recent shift to a net beef importing position of significant size. The prices of globally traded chicken and pork are not considered to be important influences in live cattle markets and, in any case, are not expected to move much lower.

Value of the live export industry
Page 39 of 64
Economic conditions in importing countries Strong economic growth in most countries fosters increasing demand for beef. Also, as incomes rise, demand increases for fresh as compared with frozen meats. The other side of the coin is the contraction of demand when economies falter. The Asian economic crisis of 1997/98 is evidence of this, when currency values in Indonesia and the Philippines fell, import demand collapsed. Asian economies have shown reasonable (Philippines, 4.8%) to strong (China, 8.0%) economic growth in recent years. The key to Australia’s prospects for live cattle exports will be Indonesia (see Figure 4, pg. 8). The recent change to Indonesian fuel price policy is reported to have caused some dislocation to the economy and growth has been slow. However, anecdotal reports of strong investment in feedlots, increased aid assistance, re-building following the tsunami and confidence at the regional level suggest a strengthening economy. Economic growth influences not only consumer demand but also exchange rates. The Indonesian rupiah has recovered from the lows of 1997/98 crisis, but continuing fluctuations are disconcerting to the cattle export trade out of Australia. Further recovery/appreciation of the currency will clearly be to the advantage of the trade. Further devaluation, although it would have a significant impact, is considered unlikely. 7.3.3 Influences shaping supply out of Australia
Currency exchange rate
The appreciation of the Australian dollar in recent years has made Australian cattle, as with live sheep, more expensive for importing countries. Obviously, any further appreciation of the currency will make cattle imports even less attractive. With an exchange rate in the range US65-75 cents, the consensus canvassed by this study, this influence is seen to be moving to advantage the live cattle export trade.
Price of feeder cattle in Australia The demand for cattle for slaughter in Australia has been boosted since December 2003 by the exclusion of US beef from markets in Asia, particularly Japan and Korea. Australian beef exports have replaced this beef, pushing local cattle prices higher than they otherwise would be. Despite the loss of export markets, US prices have been strong and that market has also attracted a high level of beef exports from Australia. The US market has been buoyed by strong consumer demand (protein/carbohydrate dietary shift) and a cyclical downturn in beef production (US cattle cycle). Along with strong local demand for beef together with tight supplies resulting from the drought-reduced cattle population, this strong export demand for beef has kept Australian cattle prices higher.
Value of the live export industry
Page 40 of 64
Over the next five years these influences will change and the outcome is expected to be a shift downwards in local cattle prices. Major contributing influences will be the re-opening of beef markets in Japan and Korea to US beef and the possible access of Argentine beef to the US market from 2007. The long-separated Pacific and Atlantic beef trade flow markets will move closer towards becoming a single market with stronger common links; Pacific zone prices will move down and Atlantic prices move up if Brazil can expeditiously manage its recent FMD outbreak. Drought is impossible to anticipate, but its occurrence typically drives down prices as producers are forced to turnoff excessive numbers. The end of drought typically sees a strong lift in prices as turnoff contracts and producers attempt to rebuild numbers. Such an event could disturb the expectation of this study (a view shared by MLA and ABARE) for cattle prices, including those suitable for live export, to trend lower over the next five years. Lower prices for cattle will encourage live exports to existing markets and, may allow exports to markets such as Egypt to again become commercially viable.
Transport costs Transport includes significant trucking and shipping components where fuel costs have an impact. Future fuel prices could influence the trade of feeder cattle out of Australia. As with live sheep exports, recent fuel price rises have made some vessels uneconomic to operate at current shipping rates thus bringing about some restructuring of shipping in favour of larger vessels. Overall, it is concluded that any foreseeable fuel price rises are unlikely to impact too adversely on live cattle exports and the ongoing rationalisation of shipping will leave adequate capacity to carry indicative numbers of a million head and more.
Compliance costs As with live sheep exports, compliance to government standards and industry protocols are seen as a cost of being in the live cattle export business. Standards have progressively tightened as governments have responded to animal welfare incidents and more general community concerns. Compliance costs will increase if standards are further tightened, but there is a general expectation in industry that these will remain reasonable and not impact the industry’s capacity to export.

Value of the live export industry
Page 41 of 64
7.4 Overall conclusions
It is considered that live sheep exports will rebuild quite strongly over the next five years to reach around 5 million head in 2010 (as forecasted by MLA). A significant potential constraint is shipping capacity, caused by the exit of vessels as noted in an AMSA survey at the end of 2006. Capacity looks like it could be inadequate in the later years of the forecast period, unless some existing capacity can be retained or new capacity is brought into the trade. Other risks also identified by MLA forecasters are disease events and trade restrictions that result in the closure of Middle Eastern markets, but these are not considered to be of a high order. As to the future value of the trade, forecasts are even more problematic than forecasts of numbers of head. For the six years to 2000, annual values were remarkably stable, within a 10% fluctuation band of $200 million. With the reopening of the Saudi market, values soared to a peak of nearly $410 million in 2002. In that year, numbers exported exceeded 6.8 million head. When the Saudi market was closed again, the value slumped back to $229 million, almost to within the range of the second half of the 1990s. With numbers again growing, but sheep prices possibly easing, exports of 4 million head would earn a value in excess of $250 million and possibly as high as $270 million. With trade recovering to 5 million head by 2010 and average FOB prices per head no lower than in 2004, values would fall into the range $320 million to $340 million. In the case of live cattle exports, the study supports MLA forecasts that exports will rebuild to 800,000 head by 2010. The study sees the biggest risk to these forecasts as being a shift in trade policy by the Indonesian government to allow freer entry of cheaper beef from Brazil and India. While the risk of this development will be reduced by lower cattle prices out of Australia and rising global beef prices, the Australian Government and cattle industry should work to encourage and assist Indonesia to maintain its current policy of minimising the risk of an FMD incursion. Again, forecasting future values is highly problematic, but maintaining the current value of a little over $500 million for the next one to two years is highly likely. If cattle prices ease by 10-15% then the value may ease back slightly, but as numbers exported expand to 750 - 800,000 head, an annual value of the order of $550 million would be achieved.
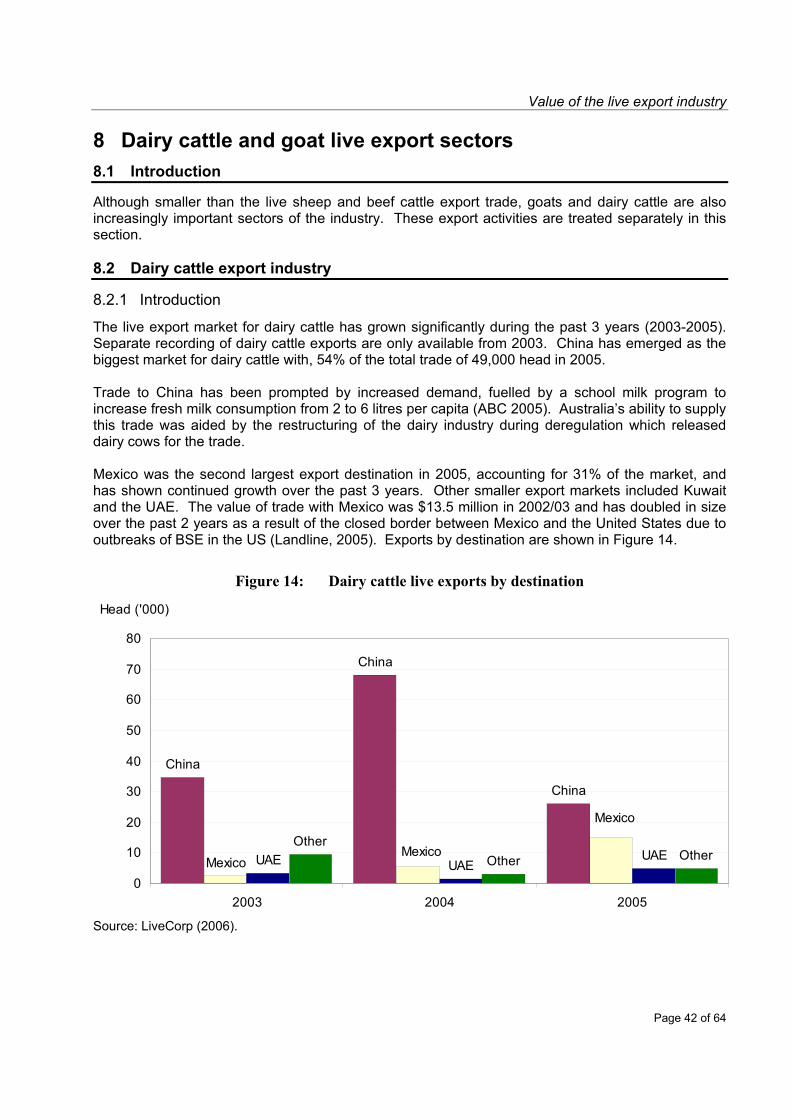
Value of the live export industry
Page 42 of 64
8 Dairy cattle and goat live export sectors 8.1 Introduction
Although smaller than the live sheep and beef cattle export trade, goats and dairy cattle are also increasingly important sectors of the industry. These export activities are treated separately in this section. 8.2 Dairy cattle export industry
8.2.1 Introduction
The live export market for dairy cattle has grown significantly during the past 3 years (2003-2005). Separate recording of dairy cattle exports are only available from 2003. China has emerged as the biggest market for dairy cattle with, 54% of the total trade of 49,000 head in 2005. Trade to China has been prompted by increased demand, fuelled by a school milk program to increase fresh milk consumption from 2 to 6 litres per capita (ABC 2005). Australia’s ability to supply this trade was aided by the restructuring of the dairy industry during deregulation which released dairy cows for the trade. Mexico was the second largest export destination in 2005, accounting for 31% of the market, and has shown continued growth over the past 3 years. Other smaller export markets included Kuwait and the UAE. The value of trade with Mexico was $13.5 million in 2002/03 and has doubled in size over the past 2 years as a result of the closed border between Mexico and the United States due to outbreaks of BSE in the US (Landline, 2005). Exports by destination are shown in Figure 14.
Figure 14: Dairy cattle live exports by destination
China
China
China
UAE UAEUAE
OtherOther Other
Mexico
MexicoMexico
0
10
20
30
40
50
60
70
80
2003 2004 2005
Head ('000)
Source: LiveCorp (2006).
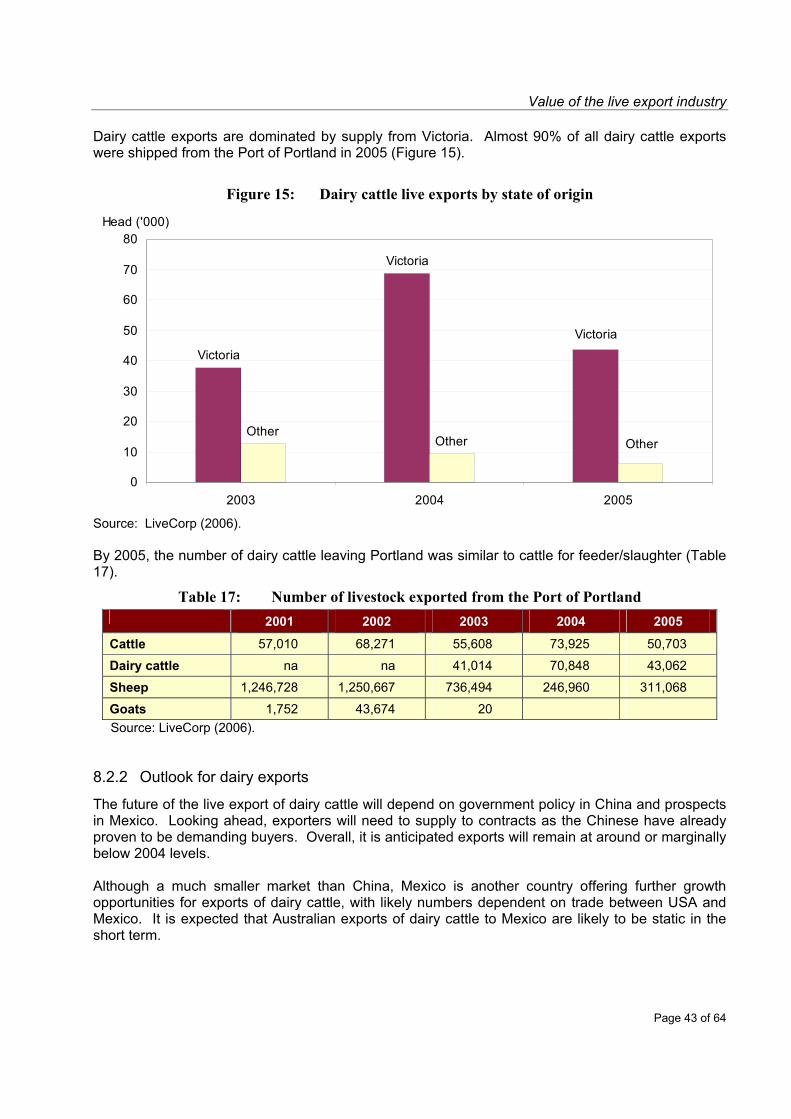
Value of the live export industry
Page 43 of 64
Dairy cattle exports are dominated by supply from Victoria. Almost 90% of all dairy cattle exports were shipped from the Port of Portland in 2005 (Figure 15).
Figure 15: Dairy cattle live exports by state of origin
Victoria
Victoria
OtherOther
Victoria
Other
0
10
20
30
40
50
60
70
80
2003 2004 2005
Head ('000)
Source: LiveCorp (2006). By 2005, the number of dairy cattle leaving Portland was similar to cattle for feeder/slaughter (Table 17).
Table 17: Number of livestock exported from the Port of Portland 2001 2002 2003 2004 2005
Cattle 57,010 68,271 55,608 73,925 50,703
Dairy cattle na na 41,014 70,848 43,062
Sheep 1,246,728 1,250,667 736,494 246,960 311,068
Goats 1,752 43,674 20 Source: LiveCorp (2006).
8.2.2 Outlook for dairy exports
The future of the live export of dairy cattle will depend on government policy in China and prospects in Mexico. Looking ahead, exporters will need to supply to contracts as the Chinese have already proven to be demanding buyers. Overall, it is anticipated exports will remain at around or marginally below 2004 levels. Although a much smaller market than China, Mexico is another country offering further growth opportunities for exports of dairy cattle, with likely numbers dependent on trade between USA and Mexico. It is expected that Australian exports of dairy cattle to Mexico are likely to be static in the short term.

Value of the live export industry
Page 44 of 64
8.2.3 The dairy cattle value chain
The value chain of the live dairy cattle export industry has been established from discussions with industry participants. The market differs from feeder/slaughter cattle and sheep, as there is a lower volume and the demand has a higher level of volatility. The value chain, based on market conditions in 2004/05, is provided in Table 18.
Table 18: Notional value chain for live dairy cattle 2004/05 $AUD per head
Total Gross Value $2,050.00 Costs Livestock Purchase (Farm gate) $1,050.00 Additional Veterinary On Farm $10.00 Road Transport to Quarantine $30.00 Agents Fees $60.00 Transit Insurance $9.00 Certification $15.00* Quarantine $70.00* Pre-export Assembly Depot $15.00 Fodder $20.00 Freight to Wharf $8.00 Wharf Charges $7.50 Third Party Veterinary and Tests $75.00* AQIS $6.25 Stevedoring $6.00 Fodder for Voyage $63.00 Tags $5.75 Levy $4.60 Sea Freight $380.00 Contingency for Rejection $30.00 Stockmen $5.75 Finance $3.47 Total Costs $1,874.32 Value Added $150.68 * Note: Highly variable depending on market. Certification, quarantine and veterinary costs vary with protocols and the estimates here are at the lower end of the scale.
The 2004/05 notional value chain for live dairy exports is based on a combination of CIF value delivered to China and Mexico. Value added per head is estimated at $150. The break-up of the live dairy cattle export industry value chain is:
Cattle producers (52%); Livestock agents (3%); Road transport providers (2%); Fodder suppliers (4%); Other (13%); Ship owners (19%); and Exporters (7%).
This distribution indicates that within the chain, changes in shipping costs and the price of dairy cattle would have the greatest impact on the value added.

Value of the live export industry
Page 45 of 64
8.2.4 Benefits for domestic producers
The main benefit of the live export of dairy cattle for domestic producers is a higher value market for surplus stock. If a typical dairy operation retains 25% of heifers for replacements, then the 15% surplus of heifers is available for sale to the export market. The export market can take these dairy cattle earlier, and at a premium, over the domestic market. Industry experts have indicated that the price on the domestic market is approximately $600 per head, a significant discount to the typical price for export of $1,000 to $1,300 per head1. This premium has a positive impact on producer income and cash flow. Dairy cattle export markets have provided an important alternative source of income for dairy producers in recent years, during a period of drought and deregulation. When domestic milk prices are low, the sale of surplus stock provides cash flow for dairy farmers. The high value of dairy cattle in export markets has led to some producers shifting their focus to produce dairy cattle specifically for the export market (Landline 2005). 8.2.5 Conclusion
The dairy cattle export industry is a relatively new and developing sector of the live export industry. Exports are sourced primarily from Victorian producers and to a lesser extent those in Western Australia. Live exports have had a positive impact on incomes for dairy producers during a period of industry adjustment and low domestic milk prices. Estimating the level of demand in the medium term is problematic, given that exports will depend heavily on demand from two markets. However, exporters are confident that demand will continue, though at reduced levels from the peak of 2004.
1 1 Personal communication, Don Naunton, December 2005.
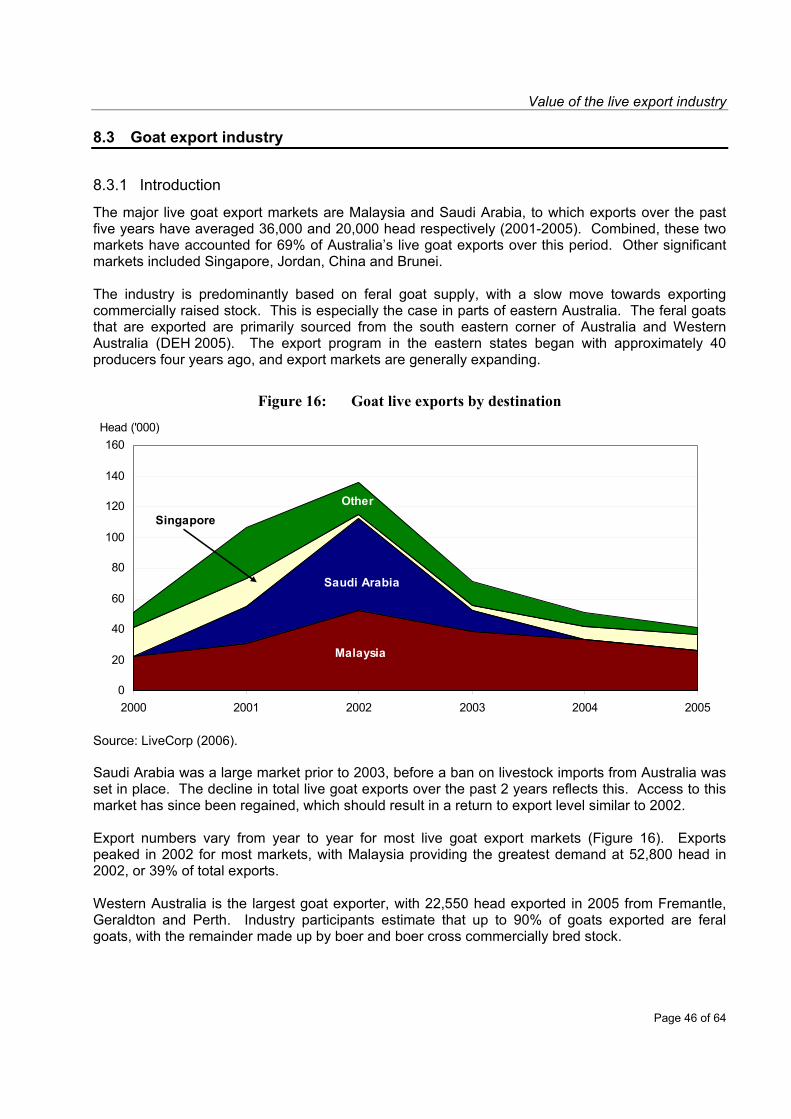
Value of the live export industry
Page 46 of 64
8.3 Goat export industry
8.3.1 Introduction
The major live goat export markets are Malaysia and Saudi Arabia, to which exports over the past five years have averaged 36,000 and 20,000 head respectively (2001-2005). Combined, these two markets have accounted for 69% of Australia’s live goat exports over this period. Other significant markets included Singapore, Jordan, China and Brunei. The industry is predominantly based on feral goat supply, with a slow move towards exporting commercially raised stock. This is especially the case in parts of eastern Australia. The feral goats that are exported are primarily sourced from the south eastern corner of Australia and Western Australia (DEH 2005). The export program in the eastern states began with approximately 40 producers four years ago, and export markets are generally expanding.
Figure 16: Goat live exports by destination
Malaysia
Saudi Arabia
SingaporeOther
0
20
40
60
80
100
120
140
160
2000 2001 2002 2003 2004 2005
Head ('000)
Source: LiveCorp (2006). Saudi Arabia was a large market prior to 2003, before a ban on livestock imports from Australia was set in place. The decline in total live goat exports over the past 2 years reflects this. Access to this market has since been regained, which should result in a return to export level similar to 2002. Export numbers vary from year to year for most live goat export markets (Figure 16). Exports peaked in 2002 for most markets, with Malaysia providing the greatest demand at 52,800 head in 2002, or 39% of total exports. Western Australia is the largest goat exporter, with 22,550 head exported in 2005 from Fremantle, Geraldton and Perth. Industry participants estimate that up to 90% of goats exported are feral goats, with the remainder made up by boer and boer cross commercially bred stock.

Value of the live export industry
Page 47 of 64
The industry is growing in Western Australia and there are plans to build a handling depot near Wyndham in the Kimberley region, with the potential for up to 15,000 head per year to be exported from the port. Export numbers by state are presented in Figure 17.
Figure 17: Goat live exports by state of origin
WA
SA
Vic
Other
0
20
40
60
80
100
120
140
160
2000 2001 2002 2003 2004 2005
Head('000)
Source: LiveCorp (2006).

Value of the live export industry
Page 48 of 64
8.3.2 The goat value chain
The value chain of the live goat export industry has been determined from discussions with industry experts. The market differs from feeder/slaughter cattle and sheep, as there is a lower volume and the demand has a higher level of risk. The value chain for 2004/05 is provided in Table 19.
Table 19: Notional value chain for live goat 2004/05 $AUD per Head Total Gross Value 110.00 Costs Livestock Purchase (Farm gate) 40.00 Additional Veterinary On Farm 0.45 Road Transport to Pre-export Assembly Depot 2.50 Agents Fees 1.50 Pre-export Assembly Depot 5.50 Freight to Wharf 1.00 Wharf Charges 1.00 Third Party Veterinary 1.80 AQIS 2.00 Export Levies 0.90 Fodder for Voyage 4.00 Sea Freight 40.00 On Board Veterinarian 0.15 Stockmen 0.15 Finance 0.10 Total Costs 101.05 Value Added 8.95
The 2004/05 notional value chain for live goat exports is based on a CIF value delivered to Malaysia out of Fremantle, by sea. Value added per head is $8.95. The value chain indicates that the major components from in the live goat exports industry are:
Goat producers (40%); Fodder suppliers (2%); Other (8%); Ship owners (40%); and Exporters (9%).
8.3.3 Conclusion
Over the past decade the gross value of live goat export has increased. It has moved from approximately $1.0 million in 1995 to an average of $7.4 million between 2003 and 2005. Though export numbers have been variable it is likely that the industry will continue to expand.
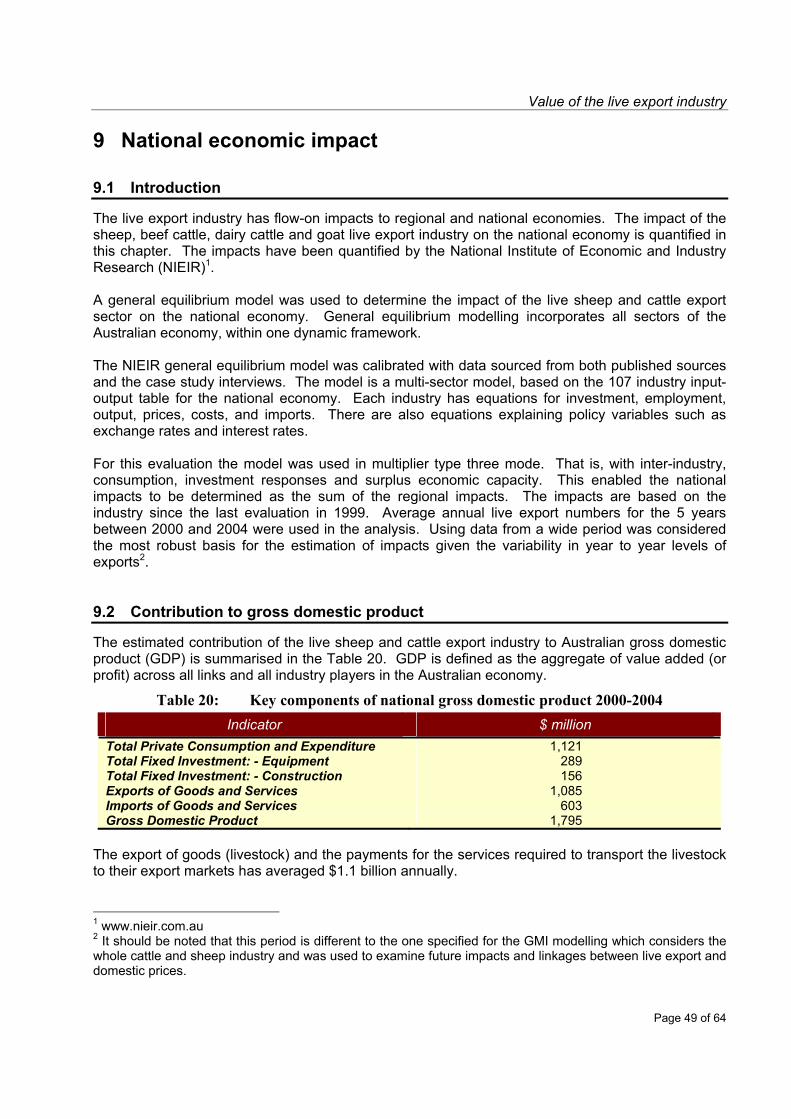
Value of the live export industry
Page 49 of 64
9 National economic impact 9.1 Introduction
The live export industry has flow-on impacts to regional and national economies. The impact of the sheep, beef cattle, dairy cattle and goat live export industry on the national economy is quantified in this chapter. The impacts have been quantified by the National Institute of Economic and Industry Research (NIEIR)1. A general equilibrium model was used to determine the impact of the live sheep and cattle export sector on the national economy. General equilibrium modelling incorporates all sectors of the Australian economy, within one dynamic framework. The NIEIR general equilibrium model was calibrated with data sourced from both published sources and the case study interviews. The model is a multi-sector model, based on the 107 industry input-output table for the national economy. Each industry has equations for investment, employment, output, prices, costs, and imports. There are also equations explaining policy variables such as exchange rates and interest rates. For this evaluation the model was used in multiplier type three mode. That is, with inter-industry, consumption, investment responses and surplus economic capacity. This enabled the national impacts to be determined as the sum of the regional impacts. The impacts are based on the industry since the last evaluation in 1999. Average annual live export numbers for the 5 years between 2000 and 2004 were used in the analysis. Using data from a wide period was considered the most robust basis for the estimation of impacts given the variability in year to year levels of exports2. 9.2 Contribution to gross domestic product
The estimated contribution of the live sheep and cattle export industry to Australian gross domestic product (GDP) is summarised in the Table 20. GDP is defined as the aggregate of value added (or profit) across all links and all industry players in the Australian economy.
Table 20: Key components of national gross domestic product 2000-2004 Indicator $ million
Total Private Consumption and Expenditure 1,121 Total Fixed Investment: - Equipment 289 Total Fixed Investment: - Construction 156 Exports of Goods and Services 1,085 Imports of Goods and Services 603 Gross Domestic Product 1,795
The export of goods (livestock) and the payments for the services required to transport the livestock to their export markets has averaged $1.1 billion annually. 1 www.nieir.com.au 2 It should be noted that this period is different to the one specified for the GMI modelling which considers the whole cattle and sheep industry and was used to examine future impacts and linkages between live export and domestic prices.
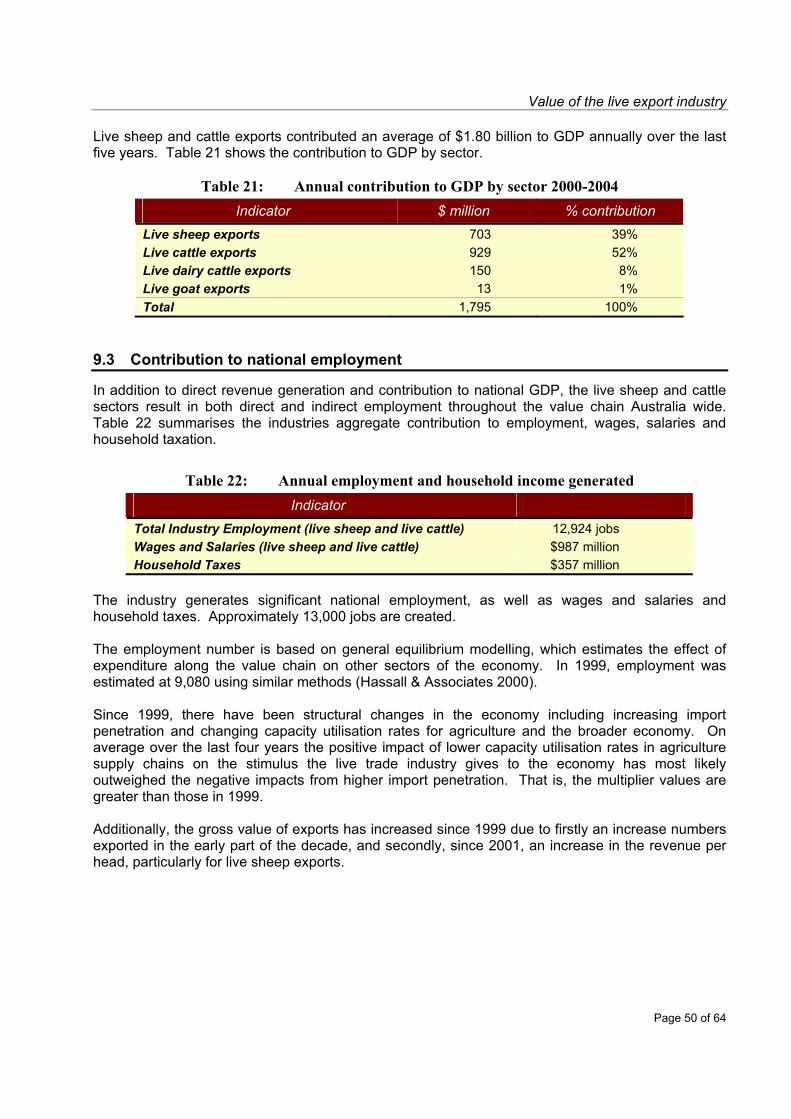
Value of the live export industry
Page 50 of 64
Live sheep and cattle exports contributed an average of $1.80 billion to GDP annually over the last five years. Table 21 shows the contribution to GDP by sector.
Table 21: Annual contribution to GDP by sector 2000-2004 Indicator $ million % contribution
Live sheep exports 703 39% Live cattle exports 929 52% Live dairy cattle exports 150 8% Live goat exports 13 1% Total 1,795 100%
9.3 Contribution to national employment
In addition to direct revenue generation and contribution to national GDP, the live sheep and cattle sectors result in both direct and indirect employment throughout the value chain Australia wide. Table 22 summarises the industries aggregate contribution to employment, wages, salaries and household taxation.
Table 22: Annual employment and household income generated Indicator
Total Industry Employment (live sheep and live cattle) 12,924 jobs Wages and Salaries (live sheep and live cattle) $987 million Household Taxes $357 million
The industry generates significant national employment, as well as wages and salaries and household taxes. Approximately 13,000 jobs are created. The employment number is based on general equilibrium modelling, which estimates the effect of expenditure along the value chain on other sectors of the economy. In 1999, employment was estimated at 9,080 using similar methods (Hassall & Associates 2000). Since 1999, there have been structural changes in the economy including increasing import penetration and changing capacity utilisation rates for agriculture and the broader economy. On average over the last four years the positive impact of lower capacity utilisation rates in agriculture supply chains on the stimulus the live trade industry gives to the economy has most likely outweighed the negative impacts from higher import penetration. That is, the multiplier values are greater than those in 1999. Additionally, the gross value of exports has increased since 1999 due to firstly an increase numbers exported in the early part of the decade, and secondly, since 2001, an increase in the revenue per head, particularly for live sheep exports.

Value of the live export industry
Page 51 of 64
9.4 The strategic importance of the industry
The long term strategic importance of the live export industry to the Australian economy is equally, if not more, important than the short term impact. This importance is based on sustained performance as an exporting industry. In the long term, exports from this industry, by reducing the current account deficit, allow further increases in economic activity and employment by facilitating lower interest rates, more expansionary fiscal and monetary polices and, in some time periods, lower exchange rates. At the other extreme, capacity constraints in the economy from time to time can reduce the economic benefits from those shown above. Weighing these factors, the benefits shown above are likely to be a good average of the long term benefits. 9.5 Summary
Based on the analysis, the live export industry contributes the following to the national economy: $1.80 billion to gross domestic product;
12,924 jobs; and
Wages and salaries totalling $0.99 billion.

Value of the live export industry
Page 52 of 64
10 Conclusions 10.1 Introduction
This study highlights the significance of the live export industry in terms of gross value, impacts on regional businesses, domestic livestock markets and the Australian economy. Importantly, it describes and quantifies the links that the live export industry has with other sectors of the economy. These include, service and input industries, industries that share the facilities that support the live export industry, and the domestic livestock industry. The structure of the industry has changed in the past five years in response to change in livestock export markets and increased competition from the feedlots during a period of high demand in the chilled export market. Live sheep and cattle exports are a major sector of the Australian livestock industry, earning more than $830 million FOB in export earnings annually between 2001 and 2005. With approximately 4.2 million sheep exported live in 2005, the trade accounted for 12% of the total sheep and lamb turnoff. The 573,000 cattle exported live in 2005 represented 7% of the total cattle turnoff. The prosperity of Australian sheep and cattle producers is linked to the live export trade as domestic prices are underpinned by the trade. 10.2 Impact on domestic markets
The export trade has direct linkages with the domestic market and any disruption will have impacts on prices received in domestic markets. Based on previous disruptions to the live export industry, prices in the short term are likely to be severely affected at a regional level. Modelling changes in livestock prices and sector GVPs has indicted that in the medium term farm gate prices for lamb across the entire sector would be 7.0 cents per kg live wt lower without the live sheep export trade. The loss of sheep sector GVP would be approximately $220 million per year. For the beef cattle sector, farm gate prices for cattle would be about 9.0 cents per kg live weight lower and the loss of sector GVP would be $400 million in the first year after any closure of the trade and approximately $330 million per year thereafter. 10.3 Outlook
It was considered that live sheep exports would rebuild quite strongly over the next five years to reach around 5 million head in 2010 (as forecasted by MLA). With numbers again growing, but sheep prices possibly easing, exports of 4 million head would earn a value in excess of $250 million and possibly as high as $270 million. With trade recovering to around 5 million head by 2010 and average FOB prices per head no lower than in 2004, values would fall into the range $320 million to $340 million.

Value of the live export industry
Page 53 of 64
In the case of live cattle exports, this study has found nothing to dispute MLA forecasts that exports will rebuild to 800,000 head by 2010. A shift in trade policy by the Indonesian government to allow less restrictive entry of cheaper beef from Brazil, Argentina and India is the biggest risk to these forecasts. If cattle prices ease by 10-15% then the value may ease back slightly, but, as numbers exported expand to an estimated 750-800,000 head, an annual value of the order of $550 million would be achieved. 10.4 The value chain
The livestock export industry value chain is complex and relatively long. Up to 30 separate business types, each generating value added and creating employment in both urban and regional Australia have been identified. The value chain for live cattle shows that producers, ship owners, exporters, agents and fodder suppliers are the major recipients of revenue from the trade. For live sheep, the major revenue recipients are producers, ship owners, exporters, fodder suppliers, road transporters, agents and shearers. Value added per head for live cattle in the value chain, excluding an allowance for value added by each business supplying the chain or for any multipliers for those servicing the industry outside the chain, is estimated at $30.00 per head. Similarly, value added per head for live sheep is estimated at $5.00 per head. The businesses that are involved in the industry are often specific to the live export industry or generate the vast majority of their revenues from live export activity. Live export is often the foundation of a business which supplies other requirements in remote areas. The export industry has been the catalyst for a significant number of new small businesses in case study areas. 10.5 Impact on the national economy
The live export industry has flow-on impacts to regional and national economies. The modelling carried out by the NIEIR estimated that during the past 5 years the live export industry contributed the following to the national economy:
$1.80 billion to gross domestic product annually;
12,924 jobs; and
Wages and salaries totalling $0.99 billion annually. 10.6 Policy implications
The information provided in this study illustrates the need for considered policy debate regarding the live export industry. The impact of any significant change to the industry would fall disproportionately to the regional level. In addition, the medium term impacts would be felt by all livestock producers across Australia.

Value of the live export industry
Page 54 of 64
11 Reference list AACM International (1996) The Value Chain for Meat and Livestock Products for the Meat
Research Corporation, AACM International Pty Ltd. ABC Rural News (2005) Dairy Cow Exports Update, Tuesday, 11 October 2005. ABARE (2005) Australian Commodity Statistics 2004, Canberra. ABS (2001) Australian Census of Population and Housing, Basic Community Profiles. ABS (2005) Livestock Products Australia, September 2005. ABS (2005) Yearbook Australia, Australia’s Beef Cattle Industry. Department of Agriculture, Fisheries and Forestry (2005) Australian Food Statistics 2005.
Commonwealth of Australia, Canberra. Department of Environment & Heritage (2005) Feral Animals in Australia: The Feral Goat, Invasive
Species Division. Web address: http://www.deh.gov.au/biodiversity/invasive/publications/goat/index.html
Hassall & Associates (2000) Value of the Live Export Industry Meat and Livestock Australia. Landline (2005) Live Exports a godsend for Dairy Producers, 3 April 2005. LiveCorp (2006) Live export value and live export numbers data supplied by LiveCorp in electronic
form. Meat & Livestock Australia (2005) LiveLink Market Update, July 2005. Meat & Livestock Australia (2006a) Meat and Livestock Statistical Review: July 2004 - June 2005. Meat & Livestock Australia (2006b) Australian Cattle and Sheep Industry Projections, February
2006. Northern Territory Department of Primary Industry, Fisheries & Mines (2005) Northern Territory
Meat Industries. Web address: www.primaryindustry.nt.gov.au/

Value of the live export industry
Page 55 of 64
12 Appendix One – Case study descriptions 12.1 Fremantle/Southern Fringe Perth
A selection of individual businesses consulted during the project is reported to provide an overview of the value chain. K and S Shearing
K and S Shearing was established in 2000 by Kim Steel and they are contracted by Emanuels to provide wool shearing, pressing and transportation services. The largest business component involves the shearing contract, employing a full time staff of 22, including 15 shearers. Wages exceeded $1 million in the 2004/05 financial year.
Shearing materials and support services, such as legal and accounting advice, are purchased locally. It is estimated that the majority of wages earned are spent within the case study area with most employees living in proximity to Mundajong.
The live sheep industry is attractive to K and S Shearing as it provides a stable year round customer with reasonably consistent throughput and a reduced requirement for extended regional travel. This has resulted in an employment mix of younger persons providing shearing support and more mature shearers who appreciate the advantages of reduced travel. Younger employees are presented with the opportunity to train as shearers assisting an industry sector experiencing an aging workforce.
Roberts Transport Roberts Transport was established in March 2005. The business was started
in response to a requirement for better coordinated sheep transportation to the port of Fremantle. Transport via feedlots and the coordinated delivery of sheep for loading is an important service reducing loading delays, transport costs and ensuring reduced stress on animals prior to shipment. In its first eight months of operation, Roberts Transport was responsible for transport coordination of 1,801,411 sheep destined for the export market.
R.J & A.M Carratti Hay Supply to RETWA Quarantine Feedlot
R.J and A.M Carratti, in conjunction with A. Carratti and Son, started producing hay for the live sheep market in 1997. The operation is primarily family based with the equivalent of two full time positions dedicated to production for the live trade and one part-time transport person working on a contracted basis. Hay production for the feedlot provides a stable income opportunity following the decline in the local dairy industry. The Baldivis/Mundajong feedlot provides a guaranteed market for the Carratti's product and hay production generates a superior gross margin to beef production, the next best alternative enterprise. The Carratti's purchase fuel, oil, spare parts, maintenance services and bailing twine locally in Waroona (population 3,000).

Value of the live export industry
Page 56 of 64
Darkan Farm Management Advisory Service JRL Hall and Company
The Darkan Farm Management Advisory Service (Inc) was formed in the early 1960s as an autonomous, incorporated group with its own executive. The advisory service has eighty farmer members located in the Williams, West Arthur River area and adjacent shires. Members within 75km of Darkan will shear 1.25 million mainly pure merino sheep this year representing approximately 1% of the Australian sheep population, or 5% of the total Western Australian sheep population.
The structure of these predominantly merino flocks, with some prime lamb production from merino ewes is: Ewes 59.1% Hoggets 32.6% Wethers 5.0% (1.5 years and waiting to ship) Rams 3.3% A very high proportion of the wethers are shipped live, as are some of the cull ewes and prime lambs.
Thirty two of the members employ at least one permanent employee. The majority of members have an average of two families residing on their farm.
Wellard Feeds Pty Ltd
Based at Wongan Hills, Wellard Feeds Pty Ltd is a stock feed manufacturer owned by the livestock exporter Wellard Rural Exports. The firm currently services the sheep, cattle and goat industries. Milled pellets are provided for on-board consumption by sheep and pre-feeding at the quarantine feedlot.
Approximately 95% of production is high fibre stock feed cubes for the live export sector. Sales to the related company Wellard Rural Exports stand at 85%, while other exporters account for the remaining 15% of turnover.
Wellard Feeds is a major employer in the Wongan Ballidu Shire and as such contributes to the ongoing viability of Wongan Hills a medium size wheatbelt town.
Toll/Western Stevedores
Toll/Western Stevedores operates berths 1 & 2 at the Fremantle Boat Harbour. It commenced operations as Western Stevedores in 1996 to provide specialist stevedoring services to the live export industry. Toll acquired Western Stevedores in Dec 2004. Toll/Western Stevedores provides all livestock services from the time the livestock arrive on trucks (unloading) to the ships pens up until the time the ship departs. During the peak period (Jul-Nov) for sheep deliveries for Ramadan it loads around 1 boat per week. Another peak period coincides with the annual sheep cull April-June. In other times frequency of boat loading is around 1-2 per month. A major benefit to Toll/Western Stevedores of being involved in the industry is it provides a reasonably consistent supply of work to maintain a large casual labour workforce.

Value of the live export industry
Page 57 of 64
SINWA IMES Pty Ltd Providores
SINWA IMES Pty Ltd was originally established in Western Australia in 1965. Today the company has offices in Fremantle, Karratha and Darwin. SINWA IMES primarily coordinates the supply of goods such as crew supplies, consumables, paint and engineering equipment to vessels using Australian ports. These products are purchased from approximately 2000 local Western Australian suppliers and on-sold to shipping operators. The major competitor in the industry is Sealanes. Historically, 70 - 80% of SINWA IMES Fremantle business was reliant on the live export industry. However this figure has reduced to 20% today.
Matthews Transport
Established in 1936, Matthews Transport is a fourth generation trucking company based in Kojonup, 256km south east of Perth. The company operates 17 trucks valued at $3.4 million, and 50 trailers designed for carting grains and live sheep. Currently, six company trucks are dedicated to the live sheep sector on a full time basis. Matthews Transport additionally owns an 8,000 head sheep feedlot based in the Kojonup Shire. The company employs 23 full time employees and two part time employees. Eight employees are dedicated on a full time basis to the live sheep transport sector. The feedlot sector of the business can employ from 5 - 30 employees depending on sheep demand. The future stability of the industry is a key consideration in regard to undertaking this expenditure.
Rural Export and Trading (WA) Pty Ltd RETWA Quarantine Area Feedlot, Baldivis /Mundajong
Rural Export and Trading (WA) Pty Ltd oversees the RETWA Quarantine Feedlot in Baldivis/Mundajong. The company is owned by Kuwait Livestock (a major sheep importer) and on contracts O'Meara Livestock Services to manage the quarantine facility. Currently the RETWA facility acts as a service feedlot with any sheep supplier able to hire the facility on a per shipment basis. Emanuels is the majority export sheep supplier. In the calendar year 2005 RETWA estimate that 1 million sheep will have pass through the feedlot destined for Kuwait Livestock. The RETWA facility and the Wellard Rural Export feedlot are the largest in the case study area. The RETWA feedlot processes approximately 30% of the live sheep exported through the port of Fremantle. The RETWA feedlot is fully reliant on the live sheep export industry. The company advises that it has seen a decline in ship repair facilities following the pressures experienced in the livestock shipping sector. RETWA has a 50% share in a feed mill located in Victoria, and ships out live sheep from Portland, Adelaide and Devonport, in addition to the case study port of Fremantle.

Value of the live export industry
Page 58 of 64
12.2 Darwin and Katherine
Helimuster Helimuster, based to the south of Darwin in the Victoria River Downs, has
been operating for 3.5 years. They are one of three companies offering helicopter mustering services to stations producing cattle for the live export trade in the case study area. The company operates 13 Robinson 22 helicopters for livestock mustering and also has a workshop. Mustering comprises 90% of the company’s business. The company employs 22 full time staff of which 12 are dedicated mustering pilots. They also employ 6 engineers, 2 administration officers 2 management staff and others.
AQIS AQIS provide an integral role in the export of live cattle from north Australian ports, providing the final inspection. The total annual commitment by AQIS to the Port of Darwin is 1.5 full time equivalents. Almost all inputs are sourced from the Darwin region apart from the vehicles which are leased by the Commonwealth Government.
Gulf RTA Gulf RTA is one of the major livestock transport companies that freight cattle from the case study region to export yards and the Port of Darwin. Gulf RTA are based in Katherine and Darwin, within the NT, and estimate that 30% of their business is related to the live export business. Gulf RTA employ 50 full time employees comprising drivers, office staff, mechanics, boilermakers and management. This includes 22 drivers. Gulf RTA is a major user of local inputs including fuel (a national account with BP) and tyres from Bridgestone in Darwin. They operate 44 prime movers nationally each with 3 trailers. A typical truck will do 150,000 km a year. A new truck, trailer and dolly can mean an investment of over $500,000.
Australian Livestock Services
Australian Livestock Services (ALS) is an integrated veterinary services company owned and operated by Ross Ainsworth in Darwin. The 3rd party services provided by ALS include stock inspections, tests, treatment, certification and loading of ships. The live cattle export trade is the foundation of ALS’s business.
Landmark Landmark has 3 offices in the Northern Territory, Darwin, Katherine and Alice Springs. Landmark has approximately 40% of the rural service business in NT. As a national company Landmark has many people working in complex structures that straddle state boundaries. The main areas of business are livestock transactions, merchandise, finance, and real estate. The operations that are relevant to the live cattle market make up 35% of the business in the north. Landmark employs approximately 25 staff. Four are directly employed to handle livestock sales.
Northern Feed & Cube
The Northern Territory market is serviced by Northern Feed & Cube. They produce cubes which provide nutrition for cattle on boats. In 2003/04 Northern Feed & Cube provided 5 full time positions to the Katherine community. This does not include management.

Value of the live export industry
Page 59 of 64
Northern Feed and Cube was established, and has grown, on the strength of the Port of Darwin live cattle trade. Increasingly, the operation is servicing Wyndham and other ports. The company has recently invested in buildings and plant. Annual production is approximately 10,000 tonnes of cubes.
P&O Ports Located at East Arm Wharf 20 minutes from the Darwin CBD, P&O Port provides stevedoring services. They organise and load livestock and fodder. The live export work is 95% cattle with some buffalo, goats, camels and horses. The live export business provides the work to maintain a workforce, which by the nature of shipping in Darwin, is part time. P&O has 12 guaranteed wage employees (a minimum of 14 hours per week) and 20 casuals. Inputs into the business include crane hire, water administration costs, licence fees, insurances and training costs for tickets.
NTLEA Industry Representation
The industry has a range of representation and associations. One of which is the Northern Territory Livestock Exports Association. NTLEA has been in existence for 20 years. Activities of NTLEA include representation and operation of Export Yards at Berema. The yards are one of 6 in the case study area. The yards take 50,000 to 75,000 head a year which is approximately 25% of the industry throughput. There are 20 associate members and 26 full members. The memberships differ in voting rights and level of service.
Hamptons Transport
Hamptons provide trucking and a registered premise which is used for cattle and buffalo (only 1% of throughput). There are trucks in Darwin and Broome. The live export industry provides approximately 30% of business for the trucking division. The full time equivalent staff is estimated at 26, which includes drivers, mechanics, welders and office staff. The majority of inputs are sourced locally. Major cost items are wages, fuels and repairs and maintenance.
Gulin Gulin Buffalo This company sends buffalo to Malaysia. They are sourced through harvesting in Arnhem Land. The company employs 7 aboriginal workers in season. Inputs include helicopter use, transport and fodder. The company also pays royalties.
Heytesbury Beef Heytesbury Beef accounts for approximately 10% of cattle produced in the region, focussing on feeder and slaughter cattle. The company has been supplying the export market for 15 years, dealing with several cattle exporters including Wellards, Emanuels, Aust Asia, NACC and SEALS. Approximately 80% of the company’s business is generated by cattle for live export sales, with the predominant benefit of this market viewed as the provision of year round selling options.

Value of the live export industry
Page 60 of 64
12.3 Broome and West Kimberley
Road Transport - Station to Yards & Yards to Wharf
Consultation in the Broome region indicated that the number of transport companies servicing the livestock export industry out of Broome has decreased from four to two over the past five years. In peak periods there may also be a number of trucks from companies based outside the case study region servicing the Broome trade. Livestock transport companies require high cost inputs, particularly fuel, repairs and maintenance and tyres. These inputs impact on the local economy of Broome, however, the distances travelled dictates that these must sometimes be purchased outside the case study area. In addition, these businesses employ local drivers on a full time basis as well as sub-contractors and part-time staff during peak demand periods.
Quarantine/Feedlot Yards
In accordance with live export protocols, which vary with the destination markets, stock must be quarantined, inspected and cleared prior to export. Stock will normally also require spelling following long distances travelled from property and some preparation for the sea travel ahead. In Broome there are three facilities providing this service, with one of these businesses beginning operations during the update period. The yards are highly dependent on the live cattle export trade, however, they may also provide clearance and spelling of southward bound cattle. The major input cost is labour, which is sourced from within the case study area. Apart from the manager and administration staff, labour tends to be seasonal along with the export market. Major inputs, other than labour, required for the operation are fodder and dipping chemicals, most of which is purchased from outside the region.
Fodder Provision Managers of Broome quarantine and feedlot yards interviewed for this study
indicated that fodder and pellets for the live cattle trade is now almost wholly purchased from outside the case study region. Fodder is transported from the south for use in the stockyards and is also on-sold to cattle stations in the case study region.
Port Services The Port of Broome is the only port in the case study region currently
servicing the live cattle trade. Derby, within the case study region, has in the past been used for the trade. Cattle exports out of the Port of Broome have been reasonably consistent over the past 5 years averaging around 80,000 head. Labour and wharf maintenance are the major input costs to the Port. All labour is sourced locally and about 50% of wharf maintenance expenditure is local. The Port has an operations team of 10 full time staff who dedicate approximately 60% of their time to work related to the livestock export trade. The operations team provides all stevedoring services. Pilotage and Harbour Master services are also contracted through the Port of Broome.

Value of the live export industry
Page 61 of 64
AQIS Vet AQIS provide an integral role in the export of livestock from Australian ports. AQIS, or AQIS approved veterinarians, provide services to 100% of the cattle exported through the Port of Broome. The total annual commitment by AQIS to the Port of Darwin is 0.25 full time equivalents. The provision of inspection services requires very little in the way of inputs besides labour. The role of the AQIS vet is a regulatory requirement that aims to ensure that the trade is not damaged by negligent stock handling and health practices. The Commonwealth Government provides this role to ensure consistency in regulation between states and territories and it assists the credibility of the trade.
Yeeda Station Pty Ltd
Yeeda Station Pty Ltd operates seven cattle stations across the Kimberley region (of an estimated 99 stations in the area). The business accounts for approximately 10% of cattle in the region. Around 95% of livestock production is export orientated, with the remainder used for domestic sales. Live exports are viewed as crucial to the survival of the business, as the nearest domestic abattoir is 2,500km away. The primary export markets for Yeeda Station’s cattle are Indonesia, Malaysia and Egypt. The company will supply to any exporters shipping from Broome and Wyndham.
Anna Plains Cattle Company
The Anna Plains Cattle Company has been operating for twelve years, supplying cattle to the live export market out of Broome. The company’s operator has an export licence, and thus for the last three years he has dealt direct with a buyer in Indonesia. The main benefit of this to the business is in freight savings. Cattle prices in Broome are similar to those obtained at Harvey in the south of Western Australia. However, freight cost is 20-30 cents per kilogram more expensive when sending cattle 2,000km south, compared with 250km to Broome. The company’s operator believes that in the absence of the live export market, cattle production would not be viable in northern Australia. The company’s predominant input costs are fuel, labour, repairs and maintenance and debt servicing. The company employs seven full-time staff and the equivalent of 3.5 full time employees on a part time basis.
Value of the live export industry
Page 62 of 64
12.4 Portland and Dairy Regions of Victoria
Producers
WN & J Higgins run a cattle trading enterprise on their farm at Lang Lang in Gippsland. For the past six years they have been buying Friesian heifers of dairy farmers either directly from the farm or at local markets. Cattle are bought at a variety of ages and retained on farm anywhere from 12 to 18 months. Approximately 70% of their turn-off is directed to the live export market. The benefit of the market for the business is the premium paid for heifers over the local market which can be as high as 20% and also the increased turn-off as cattle do not have to be retained on the property as long as for the domestic market. The major costs for the business are the cost of buying stock from dairy farmers and selling costs associated directly with the live export industry to meet protocols and transport to the port.
BM & S Cunningham have a dairy farm in Narnargoon. Surplus heifers have
been sent to the live export market. This has been up to 200 head a year. The market provides significant additional revenue. The business as a whole employs 2 full time and 4 part time employees.
Road Transport - Station to Yards & Yards to Wharf
AT & JM Bramstead & Son have four full time employees and 4 part time employees including administration staff. The live export business represents a relatively small proportion of total turnover. The work occurs during a quite time of year which enables utilisation of the significant assets associated with trucking.
Buying agent Darryl Adams is an agent that buys for Elders based at Warragul in
Gippsland. Approximately 80% of the business is generated from live exports. The business provides work for 1.5 employees. Darryl estimated that there was a premium of 30-40% between the domestic and live export markets for producers.
Fodder Provision JT Johnson supply between 20 and 30% of pellet fodder into the Port of
Portland for the live export industry, of which 90% is utilised by exporters of live dairy cattle. Approximately 20% of the business is generated by sales to the live export industry. The business operates a pellet mill which employs 10 full time staff. A majority of the pellets produced by the mill are sold to the live export industry for exports out of the Port of Portland. The business has a significant economic impact on the local region through the purchase of inputs from local suppliers.
Port Services Live exports account for 1% of exports from the Port of Portland by volume
and 5% of exports by value. The port provides all marine services associated with exports form the port, however tugs and stevedoring are contracted externally by exporters. Tugs are typically provided by a Tasmanian-based company. Of the port’s 24 full time and 15 part time employees, it is estimated that

Value of the live export industry
Page 63 of 64
approximately 2.5 full time equivalent staff would be used in the export of livestock per year.
Timboon Vet Timboon Veterinary Group is based at Timboon in the Western Victoria and
provides veterinary services both on-farm and at the feedlot at Portland. The work is a relatively small component of the overall business (estimated at 3% of turnover) however it does provide significant income and also a variety of work to the approximately 6 vets in the company. Depending on the export destination various tests are conducted ranging in costs from $18-20 / head for fees with additional lab fees of $20/hd to 2.50 / head for pregnancy tests. There are a range of others vets who also provide these services.
Exporters Elders International is an entity within the Elders group that concentrates on
live export and has a major presence within the dairy export sector. It is headquartered in Melbourne and utilises a network of Elders and private buyers to source dairy cattle from Gippsland, Northern Victoria, Western Victoria and South Australia, Tasmania and the Riverina.
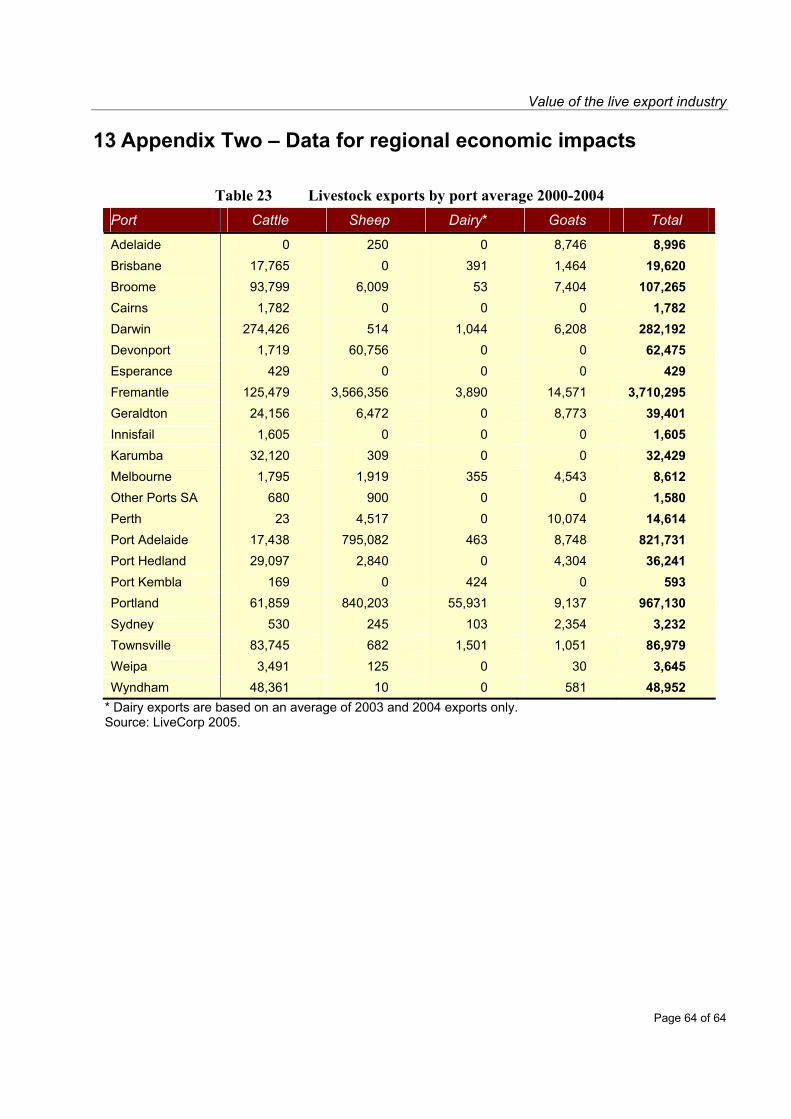
Value of the live export industry
Page 64 of 64
13 Appendix Two – Data for regional economic impacts
Table 23 Livestock exports by port average 2000-2004 Port Cattle Sheep Dairy* Goats Total
Adelaide 0 250 0 8,746 8,996 Brisbane 17,765 0 391 1,464 19,620 Broome 93,799 6,009 53 7,404 107,265 Cairns 1,782 0 0 0 1,782 Darwin 274,426 514 1,044 6,208 282,192 Devonport 1,719 60,756 0 0 62,475 Esperance 429 0 0 0 429 Fremantle 125,479 3,566,356 3,890 14,571 3,710,295 Geraldton 24,156 6,472 0 8,773 39,401 Innisfail 1,605 0 0 0 1,605 Karumba 32,120 309 0 0 32,429 Melbourne 1,795 1,919 355 4,543 8,612 Other Ports SA 680 900 0 0 1,580 Perth 23 4,517 0 10,074 14,614 Port Adelaide 17,438 795,082 463 8,748 821,731 Port Hedland 29,097 2,840 0 4,304 36,241 Port Kembla 169 0 424 0 593 Portland 61,859 840,203 55,931 9,137 967,130 Sydney 530 245 103 2,354 3,232 Townsville 83,745 682 1,501 1,051 86,979 Weipa 3,491 125 0 30 3,645 Wyndham 48,361 10 0 581 48,952
* Dairy exports are based on an average of 2003 and 2004 exports only. Source: LiveCorp 2005.