economic significance of australia's live export industry · in australia, employment...
TRANSCRIPT

~ Commercial-in-Confidence ~
Economic significance of Australia's Live Export Industry
Wellard Integrated Live Export Facility
Report Number 23919.80881
Prepared for
Wellard Rural Exports Pty
Ltd
Prepared by TOOWOOMBA
1A Pakenham Street
Fremantle WA 6160
Telephone: (08) 9432 2800
ABN: 31 109 866 328
PO Box 411
TOOWOOMBA QLD 4350
Telephone: (07) 4638 2228
ABN: 56 135 005 999

______________________________________________________________________________ Report No 23919.80881
EnviroAg Australia Pty Limited © 2015 _____________________________________________________________ Page i
Document Status Record
Report Type: Economic significance of Australia's Live Export Industry
Project Title: Wellard Integrated Live Export Facility
Client: Wellard Rural Exports Pty Ltd
Project.Document Number: 23919.80881
File Name: 23919.80881. Economic significance of Australia's Live Export
Industries_RevA4
Revision Date of
Issue
Author Reviewed Quality Assurance Approved
A 08/09/2015 Simon Lott
Michael Lane
Michael Lane Steve Webster Michael Lane
Signatures
Notes: Distribution:
Rev A: Draft report (for comment) Recipient No. Copies
Client Wellard Rural Exports
Pty Ltd
1
Company EnviroAg Australia 1
This document provides information to address the intent of Project Number 23919 as agreed to by Wellard
Rural Exports Pty Ltd.
Disclaimer: In preparing this document EnviroAg Australia Pty Limited may have relied upon certain information and data generated and provided by the client as set out in the terms of engagement agreed for the purposes of this document. Under the terms of engagement, EnviroAg Australia is not required to verify or test the accuracy and/or completeness of such client information and data. Accordingly, EnviroAg Australia does not and cannot warrant that the client information and data relied upon for the purpose of this report is accurate and complete. EnviroAg Australia therefore does not and cannot accept any responsibility and disclaims any liability for errors, omissions or misstatements contained in this report, which have resulted from EnviroAg Australia placing reasonable reliance on such client information and data.
Copyright: The contents of this document are copyright and subject to the Copyright Act 1968. Extracts or the entire document may not be reproduced by any process without the written permission of the Directors of EnviroAg Australia Pty Limited.

______________________________________________________________________________ Report No 23919.80881
EnviroAg Australia Pty Limited © 2015 ____________________________________________________________ Page ii
Table of Contents
1. Introduction and Background 1
2. Market Size Recent History 2
3. References 5
4. Appendices 6
List of Tables
Table 1 Cattle Export Statistics for 2012 Calendar Year; 11/12 Financial Year;
12/13 Financial Year; 2013 Calendar Year; 2014 & 2014/15 Forecasts
(Deards et al. 2014) 4
List of Figures
Figure 1 Breakdown of the Australian cattle industry (2013) by destination
(Deards et al. 2014) 3
List of Appendices
Appendix A. Meat and Livestock Australia: Live Link, Live Exports Statistics August
201 A-1

______________________________________________________________________________ Report No 23919.80881
EnviroAg Australia Pty Limited © 2015 ____________________________________________________________ Page 1
1. Introduction and Background
Australia’s livestock export trade has been, and will continue to be a fundamental pillar of produce and rural
prosperity in Australia. The livestock export trade provides an economically powerful alternative market to
domestic processing, the effects of which, particularly on farm gate returns, benefit producers Australia wide.
From its earliest forays exporting animals, Australia’s competitive advantage remains. Australia’s proximity
to markets as well as a lack of severe livestock disease have driven Australia to become a leading exporter of
livestock. This competitive advantage is now supported by industry investment into supply chain innovation,
research and development and animal welfare.
Australia’s livestock export industry is driven by:
The World’s increasing demand for red-meat protein;
Cultural and religious preferences for meat from freshly slaughtered animals;
Infrastructure limitations (such as refrigeration) in some markets; and,
The value adding opportunities for offshore feedlot or meat processing industries.
Through the export of Australian livestock, the industry is increasing food security in countries with
insufficient resources to feed their population and also providing meat for religious and cultural purposes.
As the global demand for red meat continues to rise, a reduction in livestock exported from Australia will
force importing nations to source animals from alternative exporting nations, none of which have welfare
standards or assurance regulations comparable to that of Australia.
Today, the livestock export industry employs more than 10,000 Australians, contributes $1.8 billion a year to
the Australian economy and, through a combination of industry initiative and government regulation, is
helping to improve animal welfare.

______________________________________________________________________________ Report No 23919.80881
EnviroAg Australia Pty Limited © 2015 ____________________________________________________________ Page 2
2. Market Size Recent History
In 2013, Australia exported 850,923 head of cattle, valued at AUD$755 million Free on Board (FOB – the
value of the animals before loading in Australia). 70% of the Australia’s cattle exports went to South East
Asia, including Indonesia, Vietnam, Malaysia and the Philippines. Indonesia is the largest market for
Australian live cattle, taking 53% of cattle exported last year, valued at AUD$308 million FOB.
The Australian Bureau of Agricultural and Resource Economics and Sciences (ABARES) report “Live
Export Trade Assessment (Deards, et al. 2014) provides a full analysis of Australia's livestock export trade—
including examining the international drivers for the trade and analysing the benefits of live exports to the
Australian economy. The report found that in 2011 Australia was the fifth-largest exporter of live cattle, the
second-largest exporter of live sheep, and the 13th-largest exporter of live goats in the world. Australia
typically exports up to 1 million head of cattle per year, up to 3 million head of sheep per year, and up to
80,000 live goats.
In Australia, employment generated from the livestock export industries is estimated to be between 8000 and
10,000 people, including employment opportunities for Indigenous people in the northern Australian live
export region.
In Australia's livestock export markets, a number of factors determine an importing country's demand for live
animals over meat. These factors also influence the likelihood of a country substituting Australian live
animals with meat imports.
“It's important to note that we found that the absence of Australian livestock in overseas
markets could not necessarily directly translate into increased meat imports from Australia.
Many other countries supply meat less expensively, and, in livestock, Australia has many
strong competitors in Africa and Europe.” (ABARES Executive Director, K. Schneider 2014).
The report shows the primary markets for Australian livestock exports are South-East Asia, the Middle East
and North Africa. In 2013, the combined value of cattle, sheep and goat exports was $685.5 million
(excluding breeder and dairy cattle). ABARES’ latest forecast is for cattle and sheep exports to rise
significantly in 2014–15 to $1 billion.
Vietnam imported 66,951 head of Australian cattle last year, valued at AUD$54.5 million FOB which was an
increase of 1897% on 2012 levels. Cattle exports to Malaysia also experienced strong growth in 2013, taking
47,620 head, an increase of 45% from 2012. In the Middle East, Israel is the largest market for Australian
cattle. Export levels to Israel were up 96% from 2012 to 2013, valued at AUD$72.8 million FOB.
It is important to note that the livestock export trade to Egypt was voluntarily suspended by industry in May
2013. This trade suspension was lifted in March 2014.
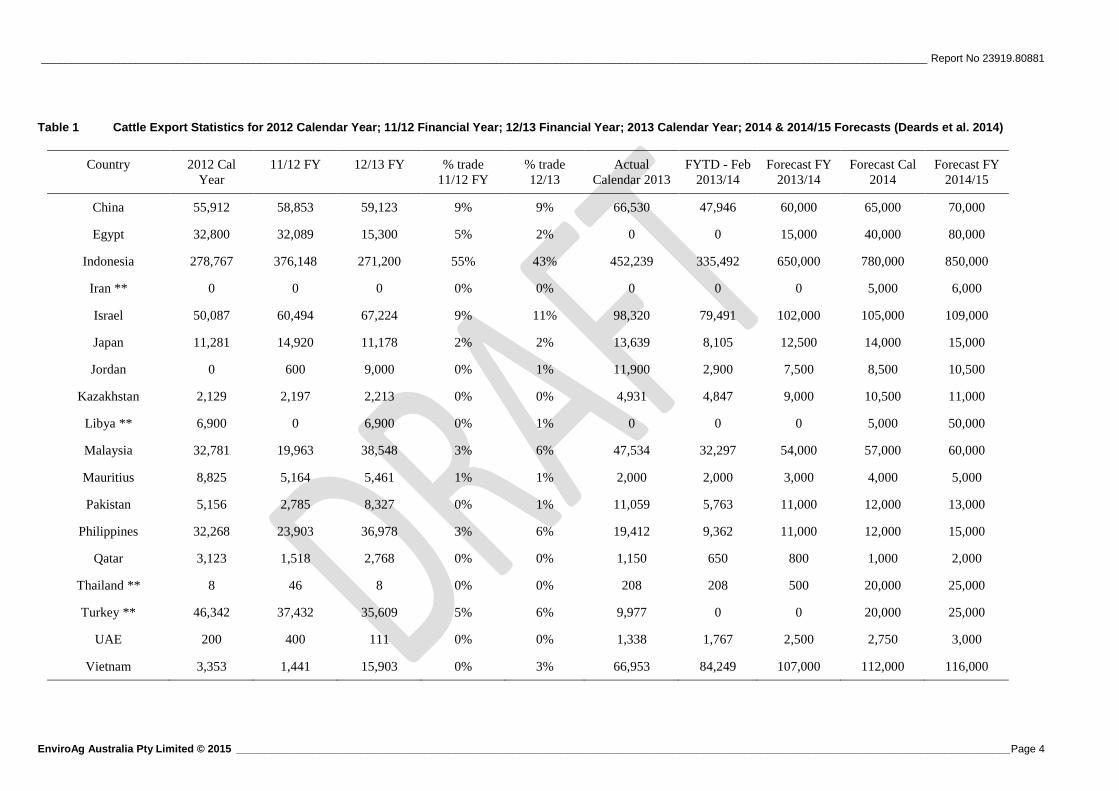
Cattle exports for key markets are shown in Figure 1, livestock export industry statistics in Table 1, whilst
Appendix A details the Live Export Market Data for August 2015.

______________________________________________________________________________ Report No 23919.80881
EnviroAg Australia Pty Limited © 2015 ____________________________________________________________ Page 3
Figure 1 Breakdown of the Australian cattle industry (2013) by destination (Deards et al. 2014)
______________________________________________________________________________________________________________________________________________________ Report No 23919.80881
EnviroAg Australia Pty Limited © 2015 ___________________________________________________________________________________________________________________________________ Page 4
Table 1 Cattle Export Statistics for 2012 Calendar Year; 11/12 Financial Year; 12/13 Financial Year; 2013 Calendar Year; 2014 & 2014/15 Forecasts (Deards et al. 2014)
Country 2012 Cal
Year
11/12 FY 12/13 FY % trade
11/12 FY
% trade
12/13
Actual
Calendar 2013
FYTD - Feb
2013/14
Forecast FY
2013/14
Forecast Cal
2014
Forecast FY
2014/15
China 55,912 58,853 59,123 9% 9% 66,530 47,946 60,000 65,000 70,000
Egypt 32,800 32,089 15,300 5% 2% 0 0 15,000 40,000 80,000
Indonesia 278,767 376,148 271,200 55% 43% 452,239 335,492 650,000 780,000 850,000
Iran ** 0 0 0 0% 0% 0 0 0 5,000 6,000
Israel 50,087 60,494 67,224 9% 11% 98,320 79,491 102,000 105,000 109,000
Japan 11,281 14,920 11,178 2% 2% 13,639 8,105 12,500 14,000 15,000
Jordan 0 600 9,000 0% 1% 11,900 2,900 7,500 8,500 10,500
Kazakhstan 2,129 2,197 2,213 0% 0% 4,931 4,847 9,000 10,500 11,000
Libya ** 6,900 0 6,900 0% 1% 0 0 0 5,000 50,000
Malaysia 32,781 19,963 38,548 3% 6% 47,534 32,297 54,000 57,000 60,000
Mauritius 8,825 5,164 5,461 1% 1% 2,000 2,000 3,000 4,000 5,000
Pakistan 5,156 2,785 8,327 0% 1% 11,059 5,763 11,000 12,000 13,000
Philippines 32,268 23,903 36,978 3% 6% 19,412 9,362 11,000 12,000 15,000
Qatar 3,123 1,518 2,768 0% 0% 1,150 650 800 1,000 2,000
Thailand ** 8 46 8 0% 0% 208 208 500 20,000 25,000
Turkey ** 46,342 37,432 35,609 5% 6% 9,977 0 0 20,000 25,000
UAE 200 400 111 0% 0% 1,338 1,767 2,500 2,750 3,000
Vietnam 3,353 1,441 15,903 0% 3% 66,953 84,249 107,000 112,000 116,000

______________________________________________________________________________ Report No 23919.80881
EnviroAg Australia Pty Limited © 2015 ____________________________________________________________ Page 5
3. References
Belton, D; 2013, Presentation Live Export Industry forum Australia. October 2013 World Organisation for
Animal Health.
Deards, B; Leith, R; Mifsud C; Murray, C; Martin, P and Gleeson, T; July 2014; Live export trade
assessment. Report to client prepared for the Live Animal Exports Reform taskforce, Department of
Agriculture. Australian Bureau of Agricultural and Resource Economics and Sciences.
Meat and Livestock Market Information Service; 2015 Live export statistics. August 2015.

______________________________________________________________________________ Report No 23919.80881
EnviroAg Australia Pty Limited © 2015 ____________________________________________________________ Page 6
4. Appendices
Appendix A. Meat and Livestock Australia: Live Link, Live Exports Statistics August
2015 A-1

______________________________________________________________________________ Report No 23919.80881
EnviroAg Australia Pty Limited © 2015 __________________________________________________________ Page A-1
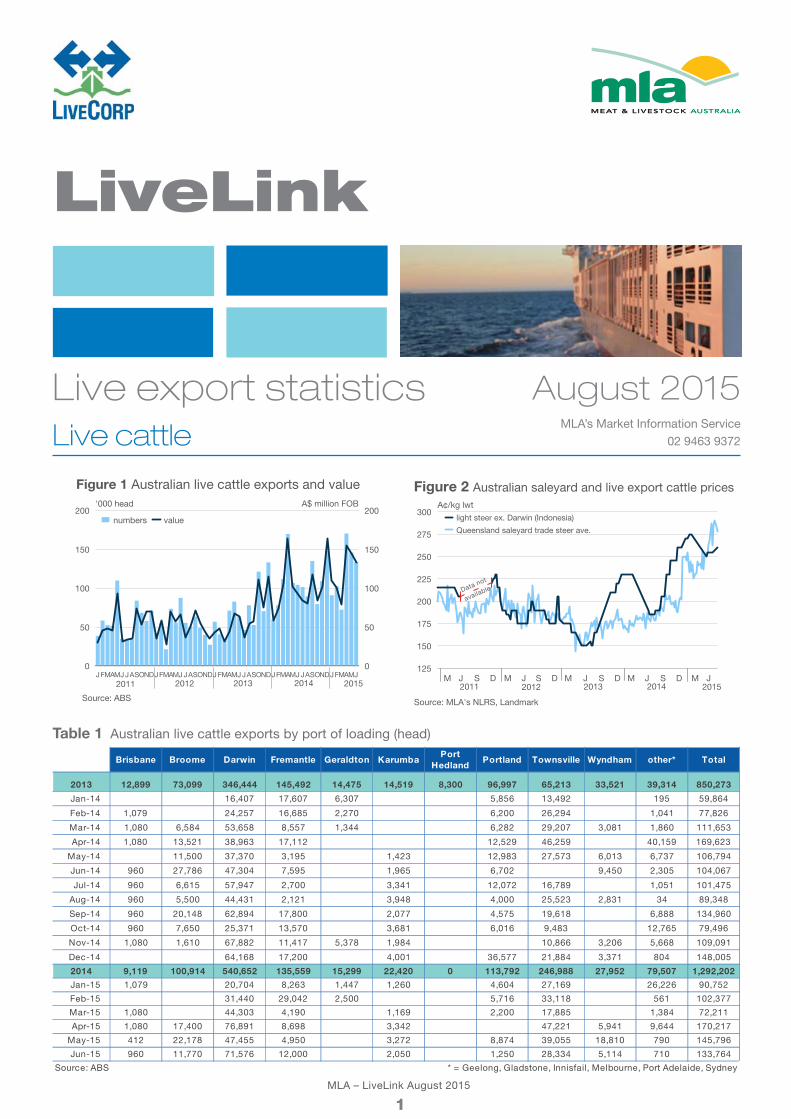
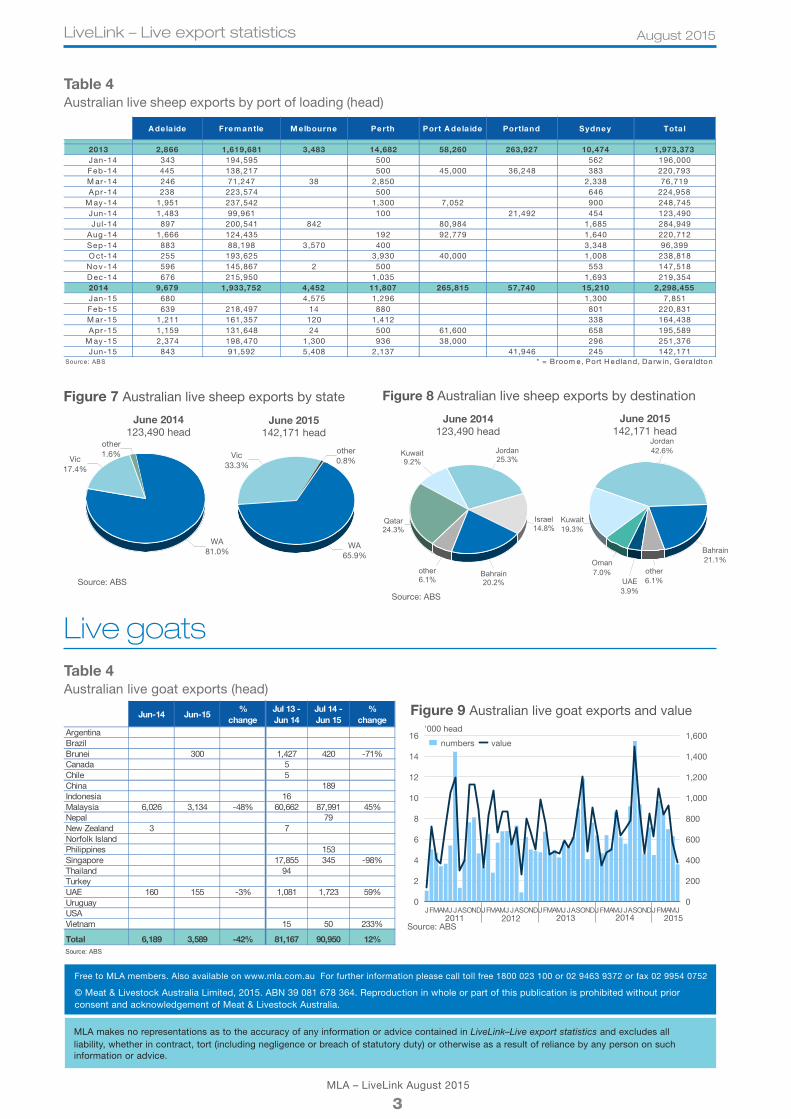
Appendix A. Meat and Livestock Australia: Live Link, Live Exports Statistics August 2015
Source: ABS
JFMAMJ JASONDJFMAMJ JASONDJ FMAMJ JASONDJFMAMJ JASONDJFMAMJ0
50
100
150
200'000 head
0
50
100
150
200A$ million FOB
numbers value
Figure 1 Australian live cattle exports and value
2011 2012 2013 2014 2015
Source: MLA's NLRS, Landmark
M J S D M J S D M J S D M J S D M J125
150
175
200
225
250
275
300A¢/kg lwt
light steer ex. Darwin (Indonesia)
Queensland saleyard trade steer ave.
Figure 2 Australian saleyard and live export cattle prices
2011 2012 2013 2014 2015
Table 1 Australian live cattle exports by port of loading (head)
Live cattle
Data not
available
LiveLink
August 2015Live export statistics
MLA – LiveLink August 2015
1
MLA’s Market Information Service
02 9463 9372
Brisbane Broome Darwin Fremantle Geraldton KarumbaPort
HedlandPortland Townsville Wyndham other* Total
2013 12,899 73,099 346,444 145,492 14,475 14,519 8,300 96,997 65,213 33,521 39,314 850,273
Jan-14 16,407 17,607 6,307 5,856 13,492 195 59,864
Feb-14 1,079 24,257 16,685 2,270 6,200 26,294 1,041 77,826
Mar-14 1,080 6,584 53,658 8,557 1,344 6,282 29,207 3,081 1,860 111,653
Apr-14 1,080 13,521 38,963 17,112 12,529 46,259 40,159 169,623
May-14 11,500 37,370 3,195 1,423 12,983 27,573 6,013 6,737 106,794
Jun-14 960 27,786 47,304 7,595 1,965 6,702 9,450 2,305 104,067
Jul-14 960 6,615 57,947 2,700 3,341 12,072 16,789 1,051 101,475
Aug-14 960 5,500 44,431 2,121 3,948 4,000 25,523 2,831 34 89,348
Sep-14 960 20,148 62,894 17,800 2,077 4,575 19,618 6,888 134,960
Oct-14 960 7,650 25,371 13,570 3,681 6,016 9,483 12,765 79,496
Nov-14 1,080 1,610 67,882 11,417 5,378 1,984 10,866 3,206 5,668 109,091
Dec-14 64,168 17,200 4,001 36,577 21,884 3,371 804 148,005
2014 9,119 100,914 540,652 135,559 15,299 22,420 0 113,792 246,988 27,952 79,507 1,292,202
Jan-15 1,079 20,704 8,263 1,447 1,260 4,604 27,169 26,226 90,752
Feb-15 31,440 29,042 2,500 5,716 33,118 561 102,377
Mar-15 1,080 44,303 4,190 1,169 2,200 17,885 1,384 72,211
Apr-15 1,080 17,400 76,891 8,698 3,342 47,221 5,941 9,644 170,217
May-15 412 22,178 47,455 4,950 3,272 8,874 39,055 18,810 790 145,796
Jun-15 960 11,770 71,576 12,000 2,050 1,250 28,334 5,114 710 133,764
* = Geelong, Gladstone, Innisfail, Melbourne, Port Adelaide, SydneySource: ABS

LiveLink – Live export statistics August 2015
MLA – LiveLink August 2015
2
2005 2006 2007 2008 2009 2010 2011 2012 2013 2014 20150
20
40
60
80
100
120
140A$/head
Figure 6 Indicative* WA live wether export prices
Source: MLA's NLRS * export wethers (Midlands to April 2010, Muchea from May 2010)
Source: ABS
2007 2008 2009 2010 2011 2012 2013 2014 20150
20
40
60
80
100
120
140'000 head
Figure 3 Australian live cattle exports to Indonesia
Figure 4 Australian live cattle exports by state
Source: ABS
Qld23.4%
Vic1.1%
NT53.5%
NSW0.4%
WA21.6%
Qld2.8%
Vic8.0%
NT45.5%
NSW0.6%
WA43.1%
June 2014104,067 head
June 2015133,764head
Live sheep
Table 2 Australian live cattle exports bydestination (head)
Table 3Australian live sheep exports by destination (head)
Source: ABS
J FMAMJ JASONDJ FMAMJ JASONDJ FMAMJ JASONDJ FMAMJ JASONDJ FMAMJ0
50
100
150
200
250
300
350'000 head
0
10
20
30
40
50A$ million FOB
numbers value
Figure 5 Australian live sheep exports and value
20132011 2012 2014 2015
Jun-14 Jun-15%
changeJul 13 - Jun 14
Jul 14 - Jun 15
%change
Argentina 6 24 300%
Bahrain 25,000 30,000 20% 100,225 374,640 274%
Brazil
Chile 20
China 6,785 4,645 17,047 267%
Egypt 79,000
Israel 18,325 101,608 56,100 -45%
Japan
Jordan 31,293 60,500 93% 293,553 203,500 -31%
Kazakhstan 12
Kuwait 11,335 27,482 142% 758,944 616,842 -19%
Libya
Malaysia 2,037 1,825 -10% 30,919 43,516 41%
Mauritius
New Zealand 43 2 -95%
Norfolk Island
Oman 10,000 62,000 78,646 27%
Philippines 41
Qatar 30,000 526,897 350,264 -34%
Samoa 14
Saudi Arabia
Singapore 4,662 2,200 -53%
South Africa
Thailand 22
Turkey
UAE 5,500 5,579 1% 124,833 358,133 187%
Uruguay 5
USA 2
Middle East 121,453 133,561 10% 1,968,060 2,117,137 8%
Asia 2,037 8,610 323% 40,226 62,804 56%
Other 0 0 73 65 -11%
Total 123,490 142,171 15% 2,008,359 2,180,006 9%Source: ABS
Jun-14 Jun-15%
changeJul 13 - Jun 14
Jul 14 - Jun 15
%change
Bangladesh 57 69 2 -97%BahrainBrunei 1,300 4,893 6,349 30%China 8,114 190 -98% 94,090 79,517 -15%Egypt 8,000 8,000 19,900 149%IndiaIndonesia 61,712 72,565 18% 623,687 746,193 20%Israel 4,543 11,800 160% 107,696 65,677 -39%Japan 960 962 0% 11,570 9,864 -15%Jordan 200 2,900 200 -93%Kazakhstan 4,847Kuwait 260LibyaMalaysia 9,209 4,448 -52% 55,270 52,876 -4%Mauritius 2,000 6,000 4,040 -33%New Caledonia 5New Zealand 1Pakistan 6,425 1,989 -69%Philippines 3,165 2,152 -32% 19,627 26,962 37%Qatar 950 350 -63%Russian Federation 50,080 39,342 -21%Samoa 46Saudi ArabiaShip & Aircraft Stores 1,400Singapore 30Sri Lanka 1,250 4 1,250 31150%SudanTaiwan 554 3 -99%Thailand 229 2,250 883% 437 7,728 1668%Turkey 2,400UAE 7 12 71% 1,796 3,004 67%UruguayUSAVietnam 6,071 36,635 503% 131,026 309,505 136%
Asia 89,460 120,502 35% 941,154 1,238,997 32%
Middle East 12,550 12,012 -4% 132,614 93,780 -29%
Other 2,057 1,250 -39% 57,554 44,715 -22%
Total 104,067 133,764 29% 1,131,322 1,377,492 22%
Source: ABS
LiveLink – Live export statistics August 2015
MLA – LiveLink August 2015
3
Figure 7 Australian live sheep exports by state
Source: ABS
Vic33.3%
WA65.9%
other0.8%Vic
17.4%
WA81.0%
other1.6%
June 2014123,490 head
June 2015142,171 head
© Meat & Livestock Australia Limited, 2015. ABN 39 081 678 364. Reproduction in whole or part of this publication is prohibited without priorconsent and acknowledgement of Meat & Livestock Australia.
Live goats
Free to MLA members. Also available on www.mla.com.au For further information please call toll free 1800 023 100 or 02 9463 9372 or fax 02 9954 0752
Table 4Australian live sheep exports by port of loading (head)
Source: ABS
JFMAMJ JASONDJFMAMJ JASONDJFMAMJ JASONDJFMAMJJASONDJFMAMJ0
2
4
6
8
10
12
14
16'000 head
0
200
400
600
800
1,000
1,200
1,400
1,600 numbers value
Figure 9 Australian live goat exports and value
2011 20132012 2014 2015
Table 4Australian live goat exports (head)
MLA makes no representations as to the accuracy of any information or advice contained in LiveLink–Live export statistics and excludes allliability, whether in contract, tort (including negligence or breach of statutory duty) or otherwise as a result of reliance by any person on suchinformation or advice.
Figure 8 Australian live sheep exports by destination
Source: ABS
Bahrain20.2%
Israel14.8%
Jordan25.3%
Kuwait9.2%
Qatar24.3%
other6.1%
Bahrain21.1%
Jordan42.6%
Kuwait19.3%
Oman7.0%
UAE3.9%
other6.1%
June 2014123,490 head
June 2015142,171 head
Jun-14 Jun-15%
changeJul 13 - Jun 14
Jul 14 - Jun 15
%change
ArgentinaBrazilBrunei 300 1,427 420 -71%Canada 5Chile 5China 189Indonesia 16Malaysia 6,026 3,134 -48% 60,662 87,991 45%Nepal 79New Zealand 3 7Norfolk IslandPhilippines 153Singapore 17,855 345 -98%Thailand 94TurkeyUAE 160 155 -3% 1,081 1,723 59%UruguayUSAVietnam 15 50 233%
Total 6,189 3,589 -42% 81,167 90,950 12%Source: ABS
A dela ide Frem antle M elbourne Perth Port A dela ide Portland Sydney Tota l
2013 2,866 1,619,681 3,483 14,682 58,260 263,927 10,474 1,973,373Jan-14 343 194,595 500 562 196,000Feb-14 445 138,217 500 45,000 36,248 383 220,793M ar-14 246 71,247 38 2,850 2,338 76,719Apr-14 238 223,574 500 646 224,958
M ay-14 1,951 237,542 1,300 7,052 900 248,745Jun-14 1,483 99,961 100 21,492 454 123,490Jul-14 897 200,541 842 80,984 1,685 284,949
Aug-14 1,666 124,435 192 92,779 1,640 220,712Sep-14 883 88,198 3,570 400 3,348 96,399O ct-14 255 193,625 3,930 40,000 1,008 238,818
Nov-14 596 145,867 2 500 553 147,518D ec-14 676 215,950 1,035 1,693 219,3542014 9,679 1,933,752 4,452 11,807 265,815 57,740 15,210 2,298,455Jan-15 680 4,575 1,296 1,300 7,851Feb-15 639 218,497 14 880 801 220,831M ar-15 1,211 161,357 120 1,412 338 164,438Apr-15 1,159 131,648 24 500 61,600 658 195,589
M ay-15 2,374 198,470 1,300 936 38,000 296 251,376Jun-15 843 91,592 5,408 2,137 41,946 245 142,171
Source: ABS * = B room e, Port H edland, Da rw in, G e ra ldton