the kinetics of non-catalyzed supercritical water
TRANSCRIPT

THE KINETICS OF NON-CATALYZED SUPERCRITICAL WATER REFORMING
OF ETHANOL
___________________________________________________
A Dissertation presented to the Faculty of the Graduate School
University of Missouri—Columbia
________________________________________
In Partial Fulfillment of the Requirements for the Degree
Doctor of Philosophy
________________________________________
by JONATHAN E. WENZEL
Dr. Sunggyu Lee, Dissertation Advisor
MAY 2008

© Copyright by Jonathan E. Wenzel 2008 All Rights Reserved

The undersigned, appointed by the Dean of the Graduate School, have examined the dissertation entitled
THE KINETICS OF NON-CATALYZED SUPERCRITICALWATER REFORMING
OF ETHANOL
Presented by Jonathan E. Wenzel A candidate for the degree of Doctor of Philosophy And hereby certify that in their opinion it is worthy of acceptance.
____________________________________ Professor Sunggyu Lee
____________________________________ Professor David Retzloff
____________________________________ Professor Stephen Lombardo
____________________________________ Professor Sudarshan Loyalka
____________________________________ Professor John Adams

For my parents, Kurt and Donna, for the constant love that they show, the support that they give, and the faith that they have in me. I am most fortunate to have the parents I have. For my family and friends who are always there for me.

ii
ACKNOWLEDGEMENTS
I would like to thank Dr. Sunggyu Lee my dissertation advisor for allowing me to
work in his group. It has been an honor and a privilege. I would especially like to thank
him for the world class education that he provided me in preparation for life both inside
and out of the laboratory. I would also like to thank my co-workers, Dr. H. Bryan
Lanterman, Mr. Jason Picou, and Ms. Alexandria Niemoeller. Dr. Lanterman was an
invaluable sounding board for my ideas. Jason provided invaluable assistance in the up-
keep and operations of the supercritical water reformer and the gas chromatograph
calibrations that made my work possible. Lexie provided help with reformer operations
and weighing all of the liquid samples that I collected.

iii
TABLE OF CONTENTS
ACKNOWLEDGEMENTS ii LIST OF FIGURES v LIST OF TABLES vi ABSTRACT ix Chapter 1. INTRODUCTION 1
1.1 Research Objective 1 1.2 Research Motivation 1 1.3 Motivation for Supercritical Water 2
2. BACKGROUND 4 2.1 Catalytic Steam Reforming of Ethanol 4 2.2 Proposed Chemical Reactions for Steam Reforming of Ethanol. 4
2.2.1 Reactions involving the Dehydration of Ethanol 5 2.2.2 Reactions involving the Dehydrogenation of Ethanol 5 2.2.3 Carbon Monoxide 6 2.2.4 Chemical Reactions involving Methane 6 2.2.5 Non-catalytic Reformation 7 2.2.6 Water Gas Shift Reaction in Supercritical Water 8
2.3 Supercritical Water and its Interaction with Intermediates 9 2.3.1 Molar Volume Estimation of Supercritical Water and Ethanol 10 2.3.2 Critical Locus of Water-Ethanol Mixtures 11 2.3.3 Critical Locus of Water-Product Mixtures 13 2.3.4 Estimation of the Critical Locus of Water-Mixtures 16
2.4 Inconel as a Reactor Material for Supercritical Water Reformation 22 3. EXPERIMENTAL METHODOLOGY 24
3.1 Materials Used 24 3.2 Experimental Apparatus 24
3.2.1 Feed System 24 3.2.2 Heat Recovery and Preheat 26 3.2.3 Supercritical Water Reactor 27 3.2.4. Sampling 30
3.3 General Procedure 31 3.3.1 Operating Procedure 31 3.3.2 Selection of Experimental Conditions 33 3.3.3 Design of Experiments 34
3.3 Product Characterization 35 4. RESULTS AND DISCUSSION 39
4.1 Experimental Results and Material Balance 39 4.2 Mechanistic Elucidation of the Process 45
4.2.1 Pyrolytic Decomposition of Ethanol and Water-gas Shift 45 4.2.2 Direct Reformation Reaction of Ethanol 48 4.2.3 Dehydration of Ethanol 49

iv
4.3 Kinetic Model 50 4.4 Optimization and Analysis of Variance 54
4.4.1 Conversion of Ethanol into Hydrogen 54 4.4.2 Selectivity of Hydrogen over Methane 57
4.5 Comparisons between Experiments 59 4.5.1 Comparisons between Water to Ethanol Ratios 59 4.5.2 Comparisons between Temperatures 61 4.5.3 Comparisons between Space Times 63
5. CONCLUSIONS 65 APPENDIX 67 REFERENCES 82 VITA 85

v
LIST OF FIGURES
Figure Page 2.1 Equilibrium constant of the water gas shift reaction as a function of
temperature. 8
2.2 Phase diagram of water. 9 2.3 Experimentally determined critical temperature of mixtures of ethanol
and water. 12
2.4 Experimentally determined critical pressure of mixtures of ethanol and
water. 12
2.5 Pressure-temperature projection of mixtures of naphthalene and water. 13 2.6 Pressure-temperature projection of mixtures of benzene and water. 14 2.7 Experimentally determined critical temperature and pressure of mixtures
of methane and water. 15
2.8 Experimentally determined critical temperature and pressure of mixtures
of carbon dioxide and water. 15
2.9 Experimentally determined critical temperature and pressure of mixtures
of hydrogen and water. 16
2.10 Computationally determined critical temperature curve for a mixture of
ethanol and water. 21
2.11 Computationally determined critical pressure curve for a mixture of
ethanol and water. 21
3.1 A representative process flow diagram for the supercritical water
reforming section of the MU hydrogen reforming unit. 25
3.2 Dimensions of the Inconel 625 Grade 1 supercritical water reactor. 28 3.3 Thermocouple placement in the SWR. 29 4.1 Arrhenius plot for the pyrolytic decomposition reaction (1) and the
direct reformation reaction (2). 53
4.2 Contour plots of DOE for hydrogen to ethanol molar ratio 56

vi
Figure Page 4.3 Contour plots of DOE for hydrogen over methane selectivity 59 4.4 Hydrogen selectivity over methane versus water to ethanol feed ratio 61 A.1 GC calibration curve for hydrogen. 68 A.2 GC calibration curve for carbon monoxide. 68 A.3 GC calibration curve for methane. 69 A.4 GC calibration curve for carbon dioxide. 69 A.5 GC calibration curve for ethane. 70

vii
LIST OF TABLES
Table Page 2.1 Critical and physical properties of some species present in ethanol
reforming. 11
2.2 Limiting chemical composition of Inconel 625. 22 3.1 Design of experiments table in coded and uncoded units. 35 3.2 Parameters for each GC method. 36 3.3 Retention time for each calibrated species using a syringe or sample
loop. 38
4.1 Target and observed experimental temperature, flow rates, and pressure. 39 4.2 Ambient condition gas and liquid effluent rates and gas effluent mole
fractions. 41
4.3 Atomic carbon balance 42 4.4 Hydrogen and oxygen from ethanol fed to the reactor, hydrogen and
oxygen exiting the reactor. 42
4.5 Molar flow rates at the inlet and outlet of the reactor. 43 4.6 Mole fractions at the inlet and outlet of the reactor. 43 4.7 Molar volume, volumetric flow rate, and space time. 44 4.8 Species concentrations at the inlet and outlet of the reactor in mmol·L-1. 45 4.9 Ethanol to water ratio and product molar ratios. 47 4.10 Calculated rate coefficients for the pyrolytic decomposition (1) and
direct reformation (2) reactions. 52
4.11 Arrhenius activation energy. 53 4.12 Analysis of variance for hydrogen generation. 55 4.13 Estimated effects and test statistics for hydrogen generation. 55

viii
Table Page 4.14 Analysis of variance for hydrogen selectivity over methane 57 4.15 Estimated effects and test statistics for hydrogen selectivity over
methane 58
A.1 Composition of GC calibration gases. 67 A.2 GC Calibration data for hydrogen. 71 A.3 GC calibration data for carbon monoxide. 72 A.4 GC calibration data for methane. 73 A.5 GC calibration data for carbon dioxide. 74 A.6 GC calibration data for ethane. 75 A.7 Integrated peak area for gas syringe samples runs A to N. 76 A.8 Integrated peak area for gas syringe samples runs O to Q. 77 A.9 Mean reactor thermocouple (RTC) temperatures, mean reactor pressure 78 A.10 Inlet mass flow rates. 79 A.11 West test meter data and mean effluent gas flow rate by experiment. 80 A.12 Liquid effluent collection. 81 A.13 Calculated heater duty by zone. 82

ix
THE KINETICS OF NON-CATALYZED SUPERCRITICAL WATER REFORMING OF ETHANOL
Jonathan E. Wenzel
Dr. Sunggyu Lee, Dissertation Supervisor
ABSTRACT
Agriculturally produced ethanol, a renewable resource, may be reformed non-
catalytically into hydrogen by a novel process utilizing supercritical water, which acts
synergistically both as a solvent and as a reactant. By utilizing supercritical water as a
reaction medium, many pitfalls of catalytic reformation may be avoided, including
catalyst poisoning due to feedstock impurities, catalyst fouling by carbon deposition, and
catalyst deactivation. Supercritical water is water above its critical point, 374°C and 22.1
MPa, and exhibits both liquid and gas-like properties and acts a non-polar solvent. Since
supercritical water is denser than steam, supercritical water reactors have the potential of
being smaller than their catalytic counterparts.
The kinetics of supercritical water reformation of ethanol were experimentally
studied using a 1 liter Inconel® 625 Grade 1 alloy tubular reactor. For the experimental
study, the temperature was varied between 901 K and 983 K, the water feed rate was
varied between 6.4 g/min and 19.7 g/min, the ethanol feed rate was varied between 0.17
g/min and 2.2 g/min, and the pressure was fixed at 24.2 MPa. All ethanol fed was
converted into gaseous products: hydrogen, carbon dioxide, methane, ethane, and carbon
monoxide, in order of mole fraction from highest to lowest.
Hydrogen was produced by two competing reactions: the direct reformation of
ethanol into hydrogen and carbon oxides and the pyrolytic decomposition of ethanol into
hydrogen, methane, and carbon oxides. In addition, there is a third, undesirable, reaction

x
that remarkably occurs in a water-rich environment: the dehydration of ethanol to form
ethene and the subsequent hydrogenation of ethene to form ethane. In addition, a low
abundance of carbon monoxide in relation to carbon dioxide is indicative that the forward
water-gas shift reaction is taking place. Arrhenius activation energies for the direct
reformation reaction and the pyrolytic decomposition reaction were also regressed.

1
CHAPTER 1
INTRODUCTION
1.1 Research Objective
The objective of this work is to determine the reaction kinetic information of the
reformation of ethanol in a non-catalyzed environment using supercritical water. For this
work, seventeen experiments were devised and performed to determine the parameters
for a kinetic model based on three stoichiometric equations: the direct reformation of
ethanol, the water-gas shift reaction (WGS), and the decomposition of ethanol. In
addition, the effects of the process conditions, such as temperature, residence time, and
reactant concentrations, will be examined and analyzed.
1.2 Research Motivation
Ethanol, produced from the fermentation of grains and other biomass, is a safe,
renewable, and potentially attractive domestically produced fuel source. Ethanol is
currently blended with gasoline in small amounts as a replacement for MTBE to improve
automotive emissions. In addition, E-85, an 85% ethanol/15% gasoline blend is currently
available as a transportation fuel for flex-fuel vehicles. However, there are several issues
that are confronting the petroleum industry when blending ethanol into gasoline or for
use as a gasoline substitute.
A primary issue is ethanol’s affinity for water, which poses problems from
ethanol production to distribution to combustion. Binary mixtures of ethanol and water
cannot be completely distilled due to the azeotrope of water and ethanol at 89.43 mole-%

2
water and 10.57 mole-% ethanol.1 This necessitates more energy-intensive means of
separation such as secondary distillation with pentane. Most carriers will not distribute
ethanol-blended fuels in their pipelines due to water contamination issues and an
increased risk for corrosion.2 Due to water’s high heat of vaporization and high heat
capacity3, water contaminated fuels lower the amount of energy that may be obtained
during combustion. Finally, ethanol’s energy density is two-thirds that of gasoline,
resulting in a lower fuel economy when measured by miles per gallon.
However, ethanol, other alcohols, and hydrocarbons can be reformed into
hydrogen, which could make ethanol attractive in a hydrogen-based economy. Ethanol’s
affinity for water is a benefit, instead of a drawback, in steam-reforming, and the
resulting hydrogen is readily separated from the reactants. In order to better understand
ethanol reforming, it is necessary to have a kinetic model of the chemical reactions that
occur during reformation. A kinetic understanding is essential for reactor sizing, reactor
design, process optimization, and economic optimization.
1.3 Motivation for Supercritical Water
Supercritical water is water above its critical point, Tc=374°C and Pc=22.064 MPa.4
Supercritical water has been successfully demonstrated as a reaction medium for
hydrocarbon reformation of methanol5 and higher carbon-number fuels such as diesel and
military logistic fuel.6 For fuel reformation to hydrogen, supercritical water acts
synergistically both as a solvent and as a reactant. Supercritical water exhibits both
liquid and gas-like properties, and as a result permits the variation of transport and
thermodynamic properties (i.e., diffusivity, surface tension, thermal conductivity,

3
viscosity, etc.) by changing the temperature and/or density of the supercritical medium.
It is also important to note that the dielectric constant of water decreases as the
temperature and pressure approach the critical point, resulting in water being a more non-
polar than polar solvent. In addition, supercritical water reformation avoids many of the
pitfalls of catalytic steam reformation including: catalyst poisoning from impurities in the
feed-stock, such as sulfur; catalyst deactivation due to coking and fouling; sintering; need
for catalyst regeneration; and etc.

4
CHAPTER 2
BACKGROUND
2.1 Catalytic Steam Reforming of Ethanol Several different catalysts have been tried and tested for facilitating steam reforming of
ethanol. Oxide catalysts include alumnia, vanadia, and zinc oxide. Oxide-supported
metal catalysts include using metals such as cobalt, nickel, copper, or rhodium supported
by alumina, vanadia, zinc oxide, etc.7 Several different kinetic pathways and chemical
mechanisms have been proposed.
2.2 Proposed Chemical Reactions for Steam Reforming of Ethanol.
Depending upon the temperature and the presence of a catalyst, several reaction pathways
for the reforming of ethanol have been proposed to take place, and several products or
intermediates have been proposed to be formed. These products include hydrogen,
carbon monoxide, carbon dioxide, methane, ethane, ethene, acetaldehyde, acetone, acetic
acid, and coke.7 Reaction pathways include dehydration of ethanol to form acetaldehyde
and ethene, decarbonylation of acetaldehyde to form methane and carbon monoxide, and
the decomposition of ethanol to form methane, carbon dioxide, and hydrogen. Overall,
the stoichiometric equation for steam reforming of ethanol may be represented as
C2H5OH + 3 H2O → 2 CO2 + 6H2 (2.1)
alternatively, the reforming reaction may be represented as
C2H5OH + H2O → 2 CO + 4 H2 (2.2)
which could be considered (2.1) combined with the forward water-gas shift reaction
CO + H2O → CO2 + H2 (2.3)
5
2.2.1 Reactions involving the Dehydration of Ethanol
The dehydration reaction of ethanol is relatively active in nickel-alumina catalyzed
reactions at low temperatures (less than 100°C) and becomes more active with increasing
temperature.8 This possible pathway competes with ethanol reformation. It may result in
fouling and coking of the catalyst and may consume the desired product, hydrogen, by
hydrogenation. The dehydration reaction is stoichiometrically represented by
C2H5OH → C2H4 + H2O (2.4)
Ethene may then be polymerized to form coke:
C2H4 → coke + H2 (2.5)
Ethene may also be hydrogenated to form ethane:
C2H4 + H2→ C2H6 (2.6)
2.2.2 Reactions involving the Dehydrogenation of Ethanol
A possible chemical pathway for the reformation of ethanol, both with or without a
catalyst, is the dehydrogenation of ethanol to form acetaldehyde:
C2H5OH → C2H4O + H2 (2.7)
This reaction has been observed at temperatures below 300°C in a copper-plated Raney
nickel catalyzed reactor and over a wide variety of other catalysts.9
Acetaldehyde can also undergo decarbonylation to form methane and carbon monoxide:
C2H4O → CH4 + CO (2.8)
This decomposition occurs very quickly, with acetaldehyde concentrations becoming
negligible, in rhodium-cerium oxide catalyzed systems at temperatures above 650°C.10

6
It is also possible for acetaldehyde to undergo further steam reforming reaction:
C2H4O + H2O→2 CO + 3 H2 (2.9)
which occurs in many different catalyzed systems, including rhodium-alumia.11
2.2.3 Carbon Monoxide
Carbon monoxide during steam reformation may participate in several different reactions
depending on the temperature and the presence of a catalyst. At temperatures below
500°C in nickel-based catalyst systems, carbon monoxide and carbon dioxide can
undergo methanation reactions8:
CO + 3 H2 → CH4 + H2O (2.10)
CO2 + 4 H2 → CH4 + 2 H2O (2.11)
In catalyzed environments, the forward water-gas shift reaction is also active7, 11, 12:
CO + H2O → CO2 + H2 (2.3)
Carbon monoxide and carbon dioxide may also contribute to coking via the Boudouard
reaction7, 8, 10:
2 CO → CO2 + C (2.12)
CO2 → C + O2 (2.13)
2.2.4 Chemical Reactions involving Methane
Methane is typically steam-reformed over nickel-based catalysts to form carbon
monoxide and hydrogen:
CH4 + H2O → CO + 3 H2 (2.14)

7
which is typically reformed between 700-800°C.13 In addition methane may be a source
of fouling7, 10, 13:
CH4 → higher order polyaromatic hydrocarbons (2.15)
2.2.5 Non-catalytic Reformation
Ethanol may also be reformed non-catalytically using supercritical water.5 Arita et al.
performed several batch experiments at 500°C in a sealed quartz tube reactor at various
reaction times, the minimum being 10 minutes and maximum 60 minutes.14 Ethanol was
completely reacted to produce hydrogen, acetaldehyde, methane, carbon dioxide, carbon
monoxide, ethylene, and ethane. They proposed the following two parallel pathways for
the decomposition of ethanol:
Pathway 1: C2H5OH → CH3CHO + H2 (2.8)
CH3CHO → CH4 + CO (2.9)
CO + H2O → CO2 + H2 (2.3)
Pathway 2: C2H5OH → C2H4 + H2O (2.4)
C2H4 + H2 → C2H6 (2.6)
At 500°C after 60 minutes of reaction, hydrogen made up approximately 44 mol-% and
acetaldehyde 28 mol- % of the decomposition products of ethanol. The initial rate
constant for the decomposition of ethanol into acetaldehyde was reported to be 3.52x10⁻⁵
s-1 at a water density of 0.20 g cm-3 at 500°C.

8
2.2.6 Water Gas Shift Reaction in Supercritical Water
In commercial practices, the first stage for water-gas shift is also typically the highest-
temperature stage, using an iron/chromium catalyst for temperatures between 320 and
360°C.15 The water gas shift reaction is a reversible equilibrium-limited reaction over a
wide temperature range. Using data from the JANAF tables16, the equilibrium constants
for the water-gas shift reaction are plotted as a function of temperature in Figure 2.1.
-5
0
5
10
15
20
25
0 0.001 0.002 0.003 0.004 0.005 0.006
1/T K-1
ln(K
)
Figure 2.1: Equilibrium constant of the water gas shift reaction as a function of temperature. The cross-over temperature between the forward and reverse shift reactions is 1074 K.
As such, the forward water-gas shift reaction also occurs in supercritical water under
appropriate imposed conditions. An experimental study using a 383-mL tubular
Haynes® Alloy 230 reactor demonstrated that the forward water-gas shift reaction can
reach 98.9% conversion in supercritical water at 1045 K and 22.4 MPa. The water feed
rate was 16.1 g·min-1, and the carbon monoxide feed rate was 0.5 SLPM.17

9
2.3 Supercritical Water and its Interaction with Intermediates
Ordinary water (non-deuterated) has a critical point of Tc=374°C and Pc=22.064 MPa,
and water is in the supercritical fluid region at temperatures and pressures above this
point.4 The phase boundaries of water, generated from correlations printed in a circular
from the International Association for the Properties of Water and Steam18 is shown in
Figure 2.2.
1.0E-01
1.0E+00
1.0E+01
1.0E+02
1.0E+03
1.0E+04
1.0E+05
1.0E+06
0 100 200 300 400 500 600 700 800 900 1000
Temperature (K)
Pres
sure
(kPa
)
Mel
ting
Cur
ve
Saturation Curve
Sublimation Curve
Triple Point
Critical PointSolid Liquid
Gas
Supercritical Region
Figure 2.2: Phase diagram of water.
Above the critical point, water will exhibit both liquid and gas-like properties which are
dependant upon temperature and pressure. Heat capacity, thermal conductivity, viscosity,
and electrolytic conductivity can be varied by changes in the temperature and pressure of
supercritical water. In addition, as the temperature and pressure of water increases up to
the critical point of water, the dielectric constant decreases from 87.96 at ambient
conditions to 6.19 at the critical point.19 As a result, supercritical water may be classified
as a non-polar solvent, which can readily dissolve other non-polar compounds such as
hydrocarbons and form supercritical mixtures.

10
2.3.1 Molar Volume Estimation of Supercritical Water and Ethanol
In order to estimate the residence time for supercritical water reformation in a flow
reactor, it is necessary to estimate the molar volume of supercritical water and any solute
of choice. For the purposes of this work, the Peng-Robinson-Stryjek-Vera equation of
state (PRSV-2) is used, which is expressed in the following form20, 21
( ) ( )bvbbvv)T(a
bvTRP
−++−
−= (2.1)
where
c
2c
2
PTR
457235.0a α= (2.2)
cPcRT
077796.0b = (2.3)
and ( )[ ]25.0
r0 T11 −κ+=α (2.4) 32
0 0196544.017131848.04897153.1378893.0 ω+ω−ω+=κ (2.5) the attractive interaction parameter, a, for a mixture is expressed by
∑∑=N
i
N
jijji axxa (2.6)
where
( ) jiijij aak1a −= (2.7)
if i≠j, then aij=aji, and if i=j, then the binary interaction parameter kij is zero. The
covolume of the mixture, b, is expressed by
∑=N
iiibxb (2.8)

11
P is pressure, T is temperature, v is molar volume, R is the universal gas constant, κ0 is a
function of the accentric factor, and ω is the accentric factor. Subscripts c and r denote
critical properties and reduced properties respectively.
For water-ethanol binary mixtures, the binary interaction parameter is
-0.051866.22 Critical properties for several species of interest to the current research are
listed in Table 2.1.4
Table 2.1: Critical and physical properties of some species present in ethanol reforming.
Species H2O CH3CH2OH H2 CO CO2 CH4 C2H6 CAS # 7732-18-5 64-17-5 1333-74-0 630-08-0 124-38-9 74-82-8 74-84-0 MW 18.015 46.069 2.016 28.01 44.01 16.043 30.07 Tc/K 647.14 513.92 32.98 132.85 304.12 190.56 305.32 Pc/bar 220.64 61.48 12.93 34.94 73.74 45.99 48.72 Vc/cm3·mol-1 55.95 167 64.2 93.1 94.07 95.6 145.5 Zc 0.229 0.24 0.303 0.292 0.274 0.286 0.279 ω 0.344 0.649 -0.217 0.045 0.225 0.011 0.099
2.3.2 Critical Locus of Water-Ethanol Mixtures
In order to ensure that the reactant mixture at the inlet of a supercritical reactor is in the
supercritical region, it is necessary to have experimental vapor-liquid equilibrium data
along the critical envelope or determine the critical locus of a mixture by an equation of
state. Figure 2.3 is a plot of experimentally determined critical temperature data for
binary mixtures of ethanol and water. Figure 2.4 is a plot of experimentally determined
critical pressure data for binary mixtures of ethanol and water.23 Ethanol and water
exhibit Type I phase behavior with a continuous critical mixture curve from the heavier
component, ethanol, to the lighter component, water.24 Even though the critical
properties of the ethanol-water mixture are more readily and accurately predictable, the
fluid mixture along the reactor length is far from being similar to the original reactant

12
mixture due to influxes of reaction intermediates, products and byproducts. A detailed
thermodynamic analysis of the critical and supercritical behavior of this multi-component
fluid mixture along with the varying composition along the length of the reactor is not an
immediate research objective of the current dissertation.
500
520
540
560
580
600
620
640
660
0 0.1 0.2 0.3 0.4 0.5 0.6 0.7 0.8 0.9 1mole-fraction ethanol
Mix
ture
Tc
/ K
Figure 2.3: Experimentally determined critical temperature of mixtures of ethanol and water23.
0
50
100
150
200
250
0 0.1 0.2 0.3 0.4 0.5 0.6 0.7 0.8 0.9 1
mole-fraction of ethanol
Mix
ture
Pc
/ bar
Figure 2.4: Experimentally determined critical pressure of mixtures of ethanol and water23.

13
2.3.3 Critical Locus of Water-Product Mixtures
Fluid-phase behavior and mixture properties of water and reformation intermediates and
products may have an influence on reactions and reaction rates. Though binary mixtures
of water with alcohols and ketones typically have Type I phase diagrams, other mixtures
of water with species of interest typically exhibit Type II and Type III phase behavior.25
Type II phase behavior is similar to Type I phase behavior with a continuous
critical line. However, with Type II behavior, there is a liquid-liquid-vapor equilibrium
region on the pressure/temperature projection ending at an upper critical end point where
the liquid-liquid-vapor phase merges to form a single liquid phase.24 An example of
Type II phase behavior is the binary mixture of water and naphthalene, a polycyclic
aromatic hydrocarbon and a potential product of coke formation, as shown in Figure
2.5.26 Naphthalene’s critical temperature is 748.4 K, and its critical pressure is 40.5 bar.4
0
5
10
15
20
25
30
35
450 500 550 600 650 700 750 800T/K
P/M
Pa
liquid-gas critical curve
three phase line
liquid+liquid critical curve
water vapor pressure curve
water critical point
naphthalene critical point
Figure 2.5: Pressure-temperature projection of mixtures of naphthalene and water26.

14
Type III phase behavior is characterized by a discontinuous critical line and a
liquid-liquid-vapor region close to the critical point of the more volatile component.
Binary mixtures with dissimilar critical properties will typically exhibit Type III phase
behavior.24 An example of Type III phase behavior is the binary mixture of water and
benzene, an aromatic hydrocarbon that is a potential coke precursor, as shown in Figure
2.6.26
0
10
20
30
40
50
400 450 500 550 600 650T/K
P/M
Pa
liquid-liquid-gas line
liquid-gas critical line
liquid-liquid+liquid gascritical line
water critical point
benzene critical point
Figure 2.6: Pressure-temperature projection of mixtures of benzene and water26.
Carbon dioxide, hydrogen25 and n-alkanes27 all form Type III mixtures with
water. For binary mixtures of water and methane, as the mole fraction of methane
increases from 0 to 0.3 the mixture critical pressure increases to 250 MPa as shown in
Figure 2.7.28 Carbon dioxide and water behave in a similar manner, as shown in Figure
2.8.23 Hydrogen and water’s pressure-temperature projection is nearly asymptotic around
the critical point of water.25 As the mole fraction of hydrogen in water increases from
zero, the mixture critical pressure rapidly increases, Figure 2.9.29

15
625
630
635
640
645
650
655
0 0.05 0.1 0.15 0.2 0.25 0.3 0.35
mole-fraction methane
Mix
ture
Tc/K
0
50
100
150
200
250
300
Mix
ture
Pc/M
Pa
T/KP/MPa
Figure 2.7: Experimentally determined critical temperature and pressure of mixtures of methane and water28.
520
540
560
580
600
620
640
660
0 0.1 0.2 0.3 0.4 0.5mole-fraction carbon dioxide
Mix
ture
Tc/K
0
50
100
150
200
250
300
350
400
Mix
ture
Pc/M
Pa
T/KP/Mpa
Figure 2.8: Experimentally determined critical temperature and pressure of mixtures of carbon dioxide and water23.

16
646
648
650
652
654
656
658
0 0.05 0.1 0.15 0.2 0.25 0.3 0.35 0.4 0.45mole-fraction hydrogen
Mix
ture
Tc/K
0
50
100
150
200
250
300
350
Mix
ture
Pc/M
Pa
T/KP/MPa
Figure 2.9: Experimentally determined critical temperature and pressure of mixtures of hydrogen and water29.
2.3.4 Estimation of the Critical Locus of Water-Mixtures
In the absence of experimental data, another means of verifying that a mixture is truly
supercritical is by determining the thermodynamic stability of the mixture at a given
temperature, pressure, and composition by an iterative means using an equation of state.
Thermodynamic stability is whether a mixture is in one phase—liquid, vapor, or
supercritical fluid—versus being a mixture of solids, liquids, and/or gases. Critical
pressure and temperature curves for binary mixtures of water and ethanol were
determined using an adaptation of a computational strategy presented by Heidemann and
Khalil.30 For a fluid to be in one phase the following condition must be satisfied:
0)n(nμ)V(VPAAD0Ti
i0ii0000 >⎥⎦
⎤⎢⎣
⎡−−−+−= ∑ (2.9)
where D is the tangential plane distance, A is the Helmholtz free energy, P is pressure, V
is volume, μ is chemical potential, and n is the number of moles. The subscript 0 denotes

17
the initial condition prior to an isothermal change. Expanding this expression with
respect to the Helmholtz free energy yields:
( ) 0Δn...OΔnΔnΔnnnn
A3!1
ΔnΔnnn
A2!1(D)
4kji
ni j k kji
3
jini j ji
2
V,T
0
0
00
>+⎟⎟⎠
⎞⎜⎜⎝
⎛
∂∂∂∂
+⎟⎟⎠
⎞⎜⎜⎝
⎛
∂∂∂
=
∑∑∑
∑∑ (2.10)
For a mixture to be thermodynamically stable in the supercritical region, the first two
expressions involving the Helmholtz free energy must be zero. This is accomplished by
evaluating the following two criteria:
Criteria 1: 0ΔnQ21b =⋅= (2.11)
Criteria 2: 0ΔnΔnΔnnnn
(A/RT)61c kji
nkji
3
i j k0
=⎥⎥⎦
⎤
⎢⎢⎣
⎡
∂∂∂∂
= ∑∑∑ (2.12)
where Q is an Nc x Nc square matrix of the second partial derivatives of the Helmholtz
free energy with respect to the numbers of moles. Nc is the total number of components
in the mixture. When the determinant of Q is zero, the first criterion for thermodynamic
stability is met. While mathematically there are several values that can satisfy criteria 1,
criteria 2 allows for a refinement of criterion 1 and eventually leads to only one set of
critical values. For the purposes of mixtures of ethanol and water, it is not necessary to
evaluate criterion 2, since criterion 1 provided only one set of sensible values.
The elements of the matrix Q can be expressed by evaluating the first partial
derivative of the natural logarithm of the fugacity of a component with respect to the
number of moles:

18
⎟⎟⎠
⎞⎜⎜⎝
⎛
∂∂
=⎥⎥⎦
⎤
⎢⎢⎣
⎡
∂∂∂
=j
iT
nji
2
ij nflnn
nn(A/RT)Q
0
(2.13)
The fugacity and its derivative can be found using an equation of state. For the mixture
of ethanol and water, the Redlich-Kwong-Soave equation of state is used:
b)υ(υa
bυRTP
+−
−= (2.14)
where the covolume of the mixture b is
c
c
PRT0.08664b = (2.15)
and the attractive interaction parameter a is
F(T)PTR0.42748ac
2c
2= (2.16)
and
( )[ ]2cT/T1m1F(T) −+= (2.17)
2ω0.176ω1.5740.480m −+= (2.18) R is the universal gas law constant, υ is the molar volume, Tc is the critical temperature
of a pure component, Pc is the critical pressure of a pure component, and ω is the
accentric factor for a pure component. For a mixture, the following mixing rules are
used:
∑∑=j i
ijji ayya (2.19)
∑∑=
j iijji byyb (2.20)
19
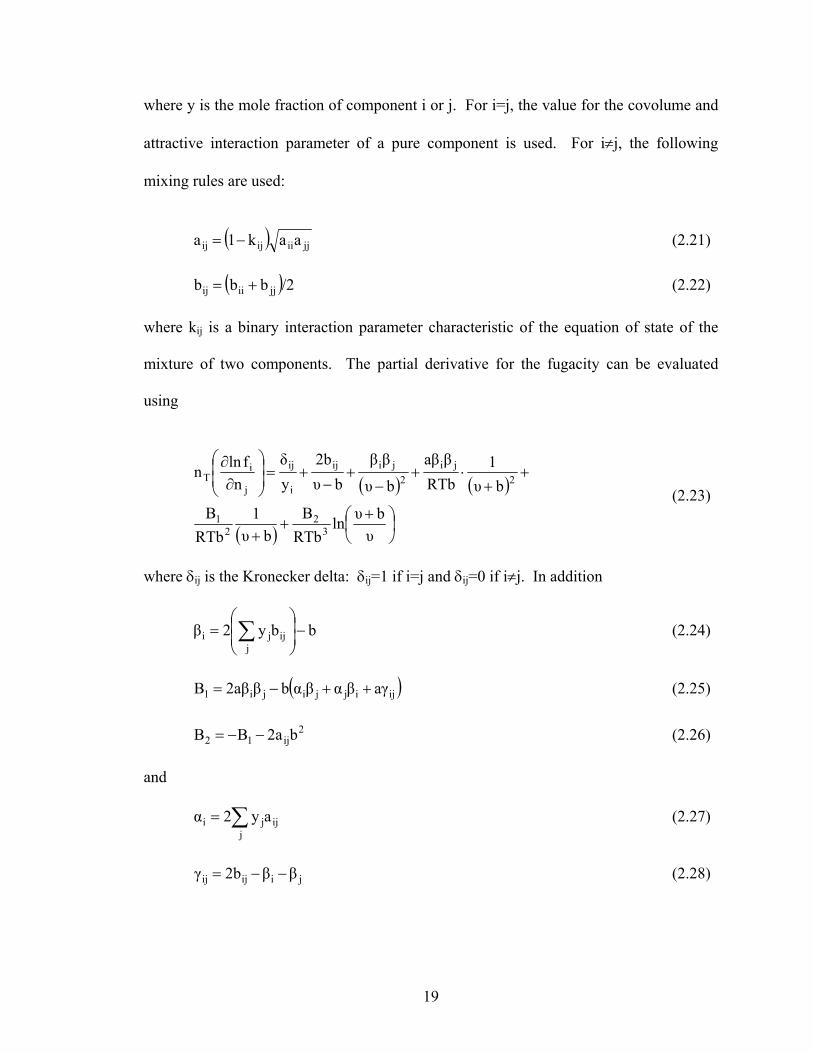
where y is the mole fraction of component i or j. For i=j, the value for the covolume and
attractive interaction parameter of a pure component is used. For i≠j, the following
mixing rules are used:
( ) jjiiijij aak1a −= (2.21)
( )/2bbb jjiiij += (2.22)
where kij is a binary interaction parameter characteristic of the equation of state of the
mixture of two components. The partial derivative for the fugacity can be evaluated
using
( ) ( )
( ) ⎟⎠⎞
⎜⎝⎛ +
++
++
⋅+−
+−
+=⎟⎟⎠
⎞⎜⎜⎝
⎛
∂∂
υbυln
RTbB
bυ1
RTbB
bυ1
RTbβaβ
bυ
ββbυ
2byδ
nflnn
32
21
2ji
2jiij
i
ij
j
iT
(2.23)
where δij is the Kronecker delta: δij=1 if i=j and δij=0 if i≠j. In addition
bby2βj
ijji −⎟⎟⎠
⎞⎜⎜⎝
⎛= ∑ (2.24)
( )ijijjiji1 aγβαβαbβ2aβB ++−= (2.25)
2
ij12 b2aBB −−= (2.26) and
∑=j
ijji ay2α (2.27)
jiijij ββ2bγ −−= (2.28)

20
The above system of equations, along with the determinant of Q may be solved
using a spreadsheet. The molar volume at the critical point of a mixture is approximated
as 4 times the covolume of the mixture, b. An iterative scheme is used to determine the
temperature at which the determinant of Q is zero. The initial guess for the temperature
is
n
initial i cii=1
T =1.5 y T∑ (2.29)
Once a critical temperature for a mixture is computed, the critical pressure is calculated
using an equation of state. The mixture critical temperature and pressure are then
compared against the pure components critical properties and are also checked to insure
that both values are positive.
Figures 2.10 and 2.11 are the computed critical pressure and temperature curves
for ethanol and water mixtures. The estimated critical data accurately model the
published data with a median error of 1.02% for the critical temperature and 1.60% for
the critical pressure.

21
500
520
540
560
580
600
620
640
660
0 0.2 0.4 0.6 0.8 1
mole-fraction ethanol
Mix
ture
Tc /
K
Figure 2.10: Computationally determined critical temperature curve for a mixture of ethanol and water.
0
50
100
150
200
250
0 0.1 0.2 0.3 0.4 0.5 0.6 0.7 0.8 0.9 1
mole-fraction ethanol
Mix
ture
Pc /
bar
Figure 2.11: Computationally determined critical pressure curve for a mixture of ethanol and water.

22
2.4 Inconel as a Reactor Material for Supercritical Water Reformation Inconel® 625 alloy has been used as a reactor body for supercritical water reformation
and supercritical water oxidation for a variety of compounds, including methanol,
ethanol, diesel, and military logistic fuel (JP-8).5, 6, 31-33 The composition of Inconel® 625
is listed in Table 2.2.
Table 2.2: Limiting chemical composition of Inconel® 625.34
Species % Nickel 58.0 Min Chromium 20.0-23.0 Iron 5.0 Max Molybdenum 8.0-10.0 Niobium (plus Tantalum) 3.15-4.15 Carbon 0.10 Max Manganese 0.50 Max Silicon 0.50 Max Phosphorus 0.015 Max Sulfur 0.015 Max Aluminum 0.40 Max Titanium 0.40 Max Cobalt 1.0 Max
Inconel® 625 is an excellent material of construction for supercritical water
oxidation reactors due to its strength and chemical resistance. Inconel® 625 is resistant to
corrosion in marine environments, chemical attack from nitric and hydrochloric acids,
and oxidation at high temperatures. In addition, at a temperature of 650°C it has a high
tensile strength of approximately 820 MPa and a high yield strength of approximately
410 MPa.34
At ambient conditions, the surface of an Inconel® 625 reactor body is mostly
oxides of nickel, chromium, and molybdenum. However, supercritical water
environments change the surface chemical composition of Inconel® 625. Kritzer et. al.

23
performed a series of experiments to determine the effects of supercritical water
oxidation on Inconel® 625. Their reactor was 1000 mm in length with an inner diameter
of 8.5 mm. An 800 hour experiment was performed at 500°C and 24 MPa using a
hydrogen peroxide solution as a feedstock. The solution feed rate was 1 g/min with a
resultant oxygen concentration of 1.44 mol/kg. At these conditions, nickel, chromium,
and molybdenum were found in the reactor effluent at concentrations of 0.5 ppm, 1.7
ppm, and 0.6 ppm respectively. The estimated corrosion rate of the reactor wall was 0.06
μm/hr. 33
Boukis et. al. studied the catalytic role of Inconel® 625 as a reactor material in
supercritical water reformation of methanol.31 After operating an Inconel® 625 reactor
for 1000 hours at 625°C, the reactor surface was examined using a scanning electron
microscope with an energy dispersive x-ray spectrometer (SEM/EDX). The reactor
surface was found to be composed of grains approximately 1 μm in diameter with a
composition of 93 wt-% nickel. The three-dimensional surface area of the reactor was
1.2 times larger than the two-dimensional surface area. The main effect was enhanced
catalytic activity caused by the reactor surface influencing the forward water-gas shift
reaction.

24
CHAPTER 3
EXPERIMENTAL METHODOLOGY
3.1 Materials Used The ethanol used for this work was undenatured ethanol, 95% ethanol and 5% water by
volume, from Pharmoco-Aaper obtained through the University of Missouri—Columbia
Chemstores. The water used for this work was distilled and deionized. The carrier gas
for the gas chromatograph was Ultra Pure Carrier Grade (UPC 5.5) Argon with a purity
of 99.9995% from Airgas.
3.2 Experimental Apparatus
Figure 3.1 is a representative process flow diagram of the system used for this work. The
experimental apparatus consists of four different process sections:
1. Feed System 2. Heat Recovery and Feed Preheat 3. Supercritical Water Reactor (SWR) 4. Sample Collection and Analysis
3.2.1 Feed System
The feed system consists of water and fuel storage, balances, and two pumps. Water and
ethanol are stored in separate five-gallon high-density polyethylene jugs resting on
balances. The balances are used to determine the mass flow rate of water and ethanol
during an experiment. The water balance was manufactured by Arlyn Scales, model
number 610C, with a range of 0-46 kg with reading increments of 0.01 kg. The fuel
balance was also manufactured by Arlyn Scales, model number D620L, with a range of
0-22,000 g with reading increments of 2 g. The two pumps were micrometering piston
pumps

25
H2O
Pum
p
Inte
grate
d H
eat E
xcha
nger
H2O
Jug
Bala
nce
EtO
HJu
g
Bala
nce
EtO
HPu
mp
Zone
1Zo
ne 2
Zone
3Zo
ne 4 Su
perc
ritic
al W
ater R
eacto
r
Efflu
ent D
rum
Liqu
id
Sam
ple
Liqu
id
Leve
l G
auge
To B
low-
out
Dru
m
To B
low-
out
Dru
m
16 P
ort
Sam
plin
g Va
lve
Gas
Sam
ple
Port
Wet
Tes
t Met
er
To V
ent
Cool
ing
Wat
er In
Cool
ing
Wat
er O
ut
Hea
t Ex
chan
ger
Cont
rol
Valv
eFi
lter
To P
rime
Cont
aine
r
PRV
SOV
EDP
CKV
PRV
SOV
SOV
SOV
EDP
EDP
CKV
CKV
Preh
eate
r
P
P
T
T
T
T
T
TT
TT
T
T
T
Figu
re 3
.1:
A re
pres
enta
tive
proc
ess f
low
dia
gram
for t
he su
perc
ritic
al w
ater
refo
rmin
g se
ctio
n of
the
MU
hyd
roge
n re
form
ing
unit.

26
manufactured by Eldex Laboratories. The ethanol pump is capable of delivering between
0.1 and 10 mL/min of liquid up to a maximum pressure of 5000 psig. The water pump is
capable of delivering between 0.1 and 100 mL/min of liquid up to a maximum pressure
of 5000 psig. The calibration fluid used by Eldex for the pumps’ flow specifications was
isopropyl alcohol. The downstream lines for the pumps were 1/4” outer diameter (OD)
seamless 316 stainless steel tubing.
The pumps are primed by opening the prime valves (PRV) to allow fluid to flow
through the pumps at ambient pressure. The pumps may be isolated from the remainder
of the experimental apparatus by regulated tee shut-off valves (SOV), which are
redundantly protected by poppet-style check valves (CKV).
3.2.2 Heat Recovery and Preheat
In order to recover heat from the reactor effluent, the feed water and reactor effluent pass
through an integrated heat exchanger. The integrated heat exchanger is a double-pipe
heat exchanger with the reactor effluent passing through the inner tube and feed water
passing through the outer tube. Due to concerns about corrosion and pitting from
supercritical effluent entering the heat exchanger, the inner tube is ¼” OD heavy-wall
(0.065” wall thickness) seamless Hastelloy® C276 tubing. The outer tube is ½” OD 316
stainless steel.
After the feed water passes through the integrated heat exchanger, it mixes with
the fuel and passes through the preheater. The preheater is constructed of ¼” OD heavy-
wall seamless Hastelloy® C276 tubing with electrical heat tape wrapped around the
exterior of the tubing. The heat tape uses 110 volts AC and is protected by a 15 amp

27
breaker. The heat tape is controlled by Labview software and a solid state relay on a
thirty-second cycle. A thermocouple measures the outer wall temperature, which is not
allowed to exceed 500°C. The inlet thermocouple is the controlling thermocouple for the
heat tape.
The reactor effluent that passes through the integrated heat exchanger then passes
through a second double-pipe heat exchanger constructed of 316 stainless steel tubing.
The second heat exchanger is cooled by tap water. After the reactor effluent passes
through both heat exchangers, it then passes through a strainer and particulate filter,
followed by a control valve. The control valve is a Badger Meter, Inc. Research Control
Valve which is pneumatically actuated and computer controlled. The control valve body
is constructed of Hastelloy® C276 with a Stellite trim set. The control valve regulates
the pressure in the Supercritical Water Reactor (SWR), with the SWR inlet pressure
being the control variable.
3.2.3 Supercritical Water Reactor
The supercritical water reactor is a custom-designed tubular reactor with an internal
volume of approximately 56.5 in3, or 0.926 liters. The reactor has an inner diameter of
1.00 in, an outer diameter of 1.75 in, and an internal length of 71.50 in. The SWR was
manufactured by the Parr Instrument Company and is made of Inconel® 625 Grade 1
alloy, mounted at a 13° angle inside the experimental apparatus’s enclosure. The SWR is
ASME rated at 5000 psig at 650°C. The gasket material used at the reactor head sealing
surface is grafoil. The reactor has ports on the sides near the heads that serve as reactant
inlet and effluent outlet ports. Preheated reactants are feed at the lower end of the

28
reactor, and the effluent flows out of the upper end of the reactor. Figure 3.2 shows the
dimensions of the reactor tube without the heads attached.
Figure 3.2: Dimensions of the Inconel 625 Grade 1 supercritical water reactor.
Two thermowells, also constructed of Inconel® 625 Grade 1, extend from the
reactor heads to the center of the reactor. Four Type K thermocouples (RTC) were
placed along the length inside each thermowell at positions illustrated in Figure 3.3. The
SWR is heated by a four zone radiant clam-shell shaped heater manufactured by Watlow
Electric Manufacturing Company. Each zone consists of two elements, each of which are
rated at 1000 watts at 120 volts. Each zone is operated at 208 volts with a maximum
heater duty of 1502 watts per zone. Each zone is protected by a 15 amp breaker.
3 ¾”
73 ¾”
2 ¼”
76 ½”
1 ¾” 1”

29
Figure 3.3: Thermocouple placement in the SWR.
Each heater zone has redundant Type K thermocouples (zone thermocouples)
monitoring the reactor outer-skin temperature at the mid-point of the length of each
heating zone. The SWR skin temperature is not allowed to exceed 750°C due to the
material properties of Inconel® 625. The SWR heaters are proportionally controlled by
Labview software using solid state relays on a thirty-second cycle with a proportional
control constant of 4. The thermowell thermocouples provide the signal that acts as the
control variable. A four-zone Omega Engineers Controller provides back-up SWR heater
control for the Labview control software to prevent overheating the reactor. SWR
thermowell thermocouples RTC 3, RTC 4, RTC 6, and RTC 7 are the controlling
thermocouples for SWR Heater Zones 1, 2, 3, and 4, respectively.
Several safety features protect the SWR from overheating and over-
pressurization. First, the Labview software will turn off the appropriate zone heater if the
SWR skin temperature exceeds 750°C. In addition, if there is a failure of the data
acquisition and control system, an Omega Four Zone controller will turn off the
15” R
TC 1
RTC
2
RTC
3
RTC
4
RTC
5
RTC
6
RTC
7
RTC
8
6”
22” 31”
38” 45 ½”
63” 69 ½”
76 ½”

30
appropriate zone heater if the SWR skin temperature exceeds 760°C. In addition, the
Labview software will turn off the SWR heaters, the water pump, and the fuel pump if
the SWR inlet pressure exceeds 50 psig above the set-point. The SWR pressure set-point
is software limited to a maximum of 5000 psig.
In addition, there are two operator means of depressurizing the SWR in addition
to using the Labview data acquisition and control system. The SWR can be
depressurized using an emergency depressurization valve (EDP) at either the reactor inlet
or the outlet. The reactor outlet has two EDP valves in series in order to maintain reactor
pressure in the event that one of the valve’s seats begins to fail. The reactor is also
protected from over-pressurization by a temperature and pressure-rated Inconel 625
rupture disc in a safety head assembly at the SWR exit.
3.2.4. Sampling
For this investigation, two different samples were collected, either gas samples or liquid
samples. After the reactor effluent undergoes an expansion at the control valve, the
gas/liquid mixture is disentrained in a Strahman Sight Gauge (liquid reservoir or LR1).
The liquid level in the gauge is operator monitored and must be periodically drained by
opening a shutoff valve (SOV). The liquid effluent is then either collected in a 5-gallon
high density polyethylene jug for disposal or in a sample container for further analysis.
The gaseous effluent from the SWR flows through LR1 and into the gas sampling
system, which consists of a bypass line to vent, a 16-port Valco multisample valve, a gas
chromatograph (GC) gas sample syringe port, and a wet-test meter. The 16-port
sampling valve allows for gas samples to be collected over time and analyzed at a time of

31
convenience. The gas sample syringe port allows for immediate sampling of the gaseous
effluent for GC analysis. The wet-test meter is used to determine the gas effluent’s
volumetric flow-rate over time.
3.3 General Procedure
3.3.1 Operating Procedure
The generalized procedure may be divided into the following: Cold Start-up Procedure,
Experimental Data Collection, Change of Experimental Run Conditions, and Shutdown.
To perform an experimental run, the preheater, the integrated heat exchanger, and
supercritical water reactor must be thermally stable. Since the effluent from the SWR is
used to provide part of the thermal energy to heat the feed water, the current experimental
apparatus can take a couple of hours to become thermally stable. In order to bring the
SWR up to operating temperature and pressure, the following steps must occur:
1. All valve positions must be noted, the SWR outlet valve should be open and the remainder of valves closed.
2. The Data Acquisition and Control System needs to be turned on and the operating conditions entered.
3. The SWR Zone Heaters need to be turned on to bring the SWR up to operating temperature. The preheater should also be turned on.
4. Once the SWR is nearing operating temperature, the water pump should be primed and water shut-off valve opened and the reactor pressurized with water. (Note: Running the pumps with shut-off valves closed will damage the pumps)
5. Once the SWR is nearing operating pressure, supercritical water will begin flowing through the integrated heat exchanger. The liquid level gauge must now be checked periodically and drained to prevent it from overfilling.
At this point, the SWR will begin to reach a thermally stable point. The inlet temperature
of the SWR will begin to increase and then stabilize. The exit temperature of the reactor
effluent side of the integrated heat exchanger will also begin to increase and then

32
stabilize. Once the SWR inlet temperature and integrated heat exchanger temperature has
stabilized, the experimental apparatus is ready for ethanol to be fed in.
The experimental start time is considered to be when the fuel pump is turned on
and the fuel, ethanol, is pumped into the reactor. Depending on the experimental run’s
residence time, the production of gaseous effluent should reach a steady flow-rate half an
hour after the fuel is first fed to the reactor. The evidence of gas production is noted as
an increase in pressure in the liquid level reservoir and also by movement of the face dial
of the wet-test meter. During an experiment, the following are performed:
1. Every quarter hour the masses shown on the water and ethanol balances are noted in the lab notebook.
2. At 30-minute intervals, a gas sample is taken using the gas sample syringe and injected into the GC.
3. At the mid-point and end of a run, a gas sample is taken using the 16-port gas sample valve.
4. At the mid-point and near the end of the run, the liquid reservoir is completely emptied, the time noted, and it is allowed to refill. Once the liquid level reaches the top of the reservoir, the liquid is drained into a sample bottle, and the time noted.
5. Periodically, the gas flow-rate is measured using the wet-test meter.
Using this procedure, an experimental run will last approximately 90 minutes. At
the conclusion of an experimental run, the fuel pump is turned off. The reactor can then
be shut-down by a step-wise procedure or prepared for another experiment. If another
experiment is performed, the new experimental flow-rates, temperature, and pressure are
set, and after 60 minutes the system is typically thermally stable and another experiment
can be performed.
To shut-down the SWR, the SWR zone heaters and the preheater are turned off.
Water is fed into the reactor for thirty minutes, and then the reactor is slowly
depressurized. Once the SWR pressure reaches 250 psig, the SWR outlet emergency

33
depressurization valves are opened and the reactor is allowed to cool. It is important to
note that the SWR outlet EDP valves must remain open while the reactor cools or
otherwise the pressure in the reactor will fall below atmospheric pressure, and the
pressure transducers can be damaged.
3.3.2 Selection of Experimental Conditions
The experimental conditions selected for this work were based on supercritical fluid
properties, equipment limitations, and literature reviews. The experimental conditions to
consider include reactant concentrations, reactant feed rates, temperature, and pressure.
For this work, the minimum pressure and temperature are bounded by the critical
point of water, Pc=22.4 MPa and Tc=374°C. The upper bounds for temperature and
pressure are limited by the design and material of construction of the supercritical water
reactor, which is ASME Rated at 34.6 MPa at 650°C. The supercritical water reactor
may be operated at temperatures above 650°C, but at reduced pressures inasmuch as the
tensile strength of the reactor body decreases with increasing temperature.32 The
maximum temperature at which the current supercritical water reactor may be safely
operated is 710°C interior temperature at 24.2 MPa.
For future potential process commercialization, it is of interest to attempt to
convert all ethanol fed into the reactor into products that would remain gaseous at
ambient conditions, preferably hydrogen and carbon dioxide. Since previously published
work indicates that the presence of acetaldehyde appears to be non-existent above 600°C
in a catalytic system, a temperature range between 630°C and the reactor maximum of
710°C was chosen for this investigation, even though the process of interest is

34
noncatalytic. The operating pressure for this work was fixed at 24.2 MPa to allow for
operation at the reactor’s maximum temperature, 710°C, and to speed thermal
stabilization between experimental runs.
Water and ethanol flow rates are both limited by the balances, pumps, reactor
thermal stability, and the control valve. The fuel balance/pump combination can
reproducibly operate at a mass flow rate of no less than 0.25 g/min, since the fuel balance
reads in 2-gram increments. At flow rates less than 0.25 g/min, it takes a considerable
amount of time to determine if the pump is functioning or malfunctioning. The fuel
pump has an upper bound of 10 g/min. Likewise, the water pump cannot be operated
reproducibly at mass flow rates below 6 g/min and is bounded by a maximum flow of
100 g/min.
When considering thermal stability and pressure control, the current reactor
operates best with water flow rates of less than 20 g/min. At flow rates greater than 20
g/min, it is difficult to achieve thermal uniformity along the length of the reactor. If
coking reactions occur, lower flow rates of water and fuel are desirable to maximize run-
time without clogging the reactor. It is also desirable to keep ethanol flow rates low in
comparison with water, as it has been theorized that greater steam to carbon ratios result
in higher conversion of ethanol to hydrogen and carbon dioxide35.
3.3.3 Design of Experiments
The design of experiments for this work was chosen to determine the main and
interactive effects of temperature, ethanol concentration, and space time upon the kinetics
of ethanol reformation to hydrogen, carbon oxides, and hydrocarbons while keeping the

35
pressure of the system fixed. For this work, a central composite circumscribed design of
experiments with a 23 factorial portion and three center points was chosen.36 The order in
which the experiments are to be performed was randomized. The test variables are
reactor temperature, ethanol flow rate, and water flow rate. The experimental design is
shown in Table 3.1.
Table 3.1: Design of experiments in coded and uncoded variables DOE Experimental Coded Variables T / EtOH / H2O /
Line Order X1 X2 X3 °C g·min-1 g·min-1 1 9 -1 -1 -1 650 0.625 9 2 10 +1 -1 -1 690 0.625 9 3 4 -1 +1 -1 650 1.375 9 4 16 +1 +1 -1 690 1.375 9 5 17 -1 -1 +1 650 0.625 15 6 12 +1 -1 +1 690 0.625 15 7 5 -1 +1 +1 650 1.375 15 8 2 +1 +1 +1 690 1.375 15 9 15 0 0 0 670 1 12
10 7 0 0 0 670 1 12 11 3 0 0 0 670 1 12 12 6 -2 0 0 630 1 12 13 1 +2 0 0 710 1 12 14 14 0 -2 0 670 0.25 12 15 11 0 +2 0 670 1.75 12 16 13 0 0 -2 670 1 6 17 8 0 0 +2 670 1 18
3.3 Product Characterization
The gas samples collected for this study were analyzed using a Hewlett-Packard 5890
Series A Gas Chromatograph equipped with a thermal conductivity detector (TCD). GC
data were collected and integrated using HP Chemstation® Software version A.06.03
build 509. Argon was chosen as the carrier gas over helium to allow for better detection
of hydrogen gas and to avoid multiple inversions of the TCD signal.37 The column was
manufactured by Supelco, part number 1-2392-U, and is 15 feet long, 1/8 inch in
diameter and constructed of stainless steel. The column packing is 60/80 Carboxen®

36
1000, lot number 021599. The column packing is designed to detect permanent gases
and can be used to distinguish between hydrogen, nitrogen, oxygen, carbon monoxide,
methane, carbon dioxide, acetylene, ethylene, ethane, and propane.
Three different methods were used for GC analysis. Methods Air02 and Air03
were used for gas samples injected into the GC using a gas sample syringe. Method
Loop05 was used for gas sample loops injected into the GC. Method Air02 is a fast
method capable of detecting hydrogen, nitrogen, oxygen, carbon monoxide, methane, and
carbon dioxide. Method Air02 is used for the first two gas syringe samples taken during
an experimental run. Method Air03 and Loop05 can detect all the gases from Method
Air02 and in addition can detect ethylene and ethane. Method Air03 is the method used
for the last gas syringe sample taken in a run. The parameters for each method are listed
in Table 3.2.
Table 3.2: Parameters for each GC method. Method Air02 Air03 Loop05 Inlet Temperature / °C 120 120 120 TCD Temperature / °C 220 220 220 Oven Maximum / °C 200 200 200 Oven Equilibrium Time / min 3 3 3 Initial Oven Temperature / °C 40 40 40 Initial Oven Time / min 8 8 10 Ramp 1 Rate / °C·min-1 20 20 8 Ramp 1 Final Temperature / °C 140 140 140 Ramp 1 Hold Time / min 8.5 7 7.5 Ramp 2 Rate / °C·min-1 N/A 20 10 Ramp 2 Final Temperature / °C N/A 200 200 Ramp 2 Hold Time / min N/A 16.5 13 Method Duration / min 21.5 39.5 49

37
Experimental run gas samples were injected using a Hamilton Gastight® model
1001 stop-cocked gas syringe. The injected gas volume was 1.0 mL. The injected gas
volume from the Valco 16-port multi-sampling valve was also 1.0 mL.
The GC was calibrated by injecting different volumes of neat hydrogen, oxygen,
nitrogen, methane, carbon dioxide, and carbon monoxide. All neat calibration gasses had
a purity of at least 99%. The GC was also calibrated by injecting different volumes of
pure gases and various gas mixtures. Neat gases used for calibration were from Airgas
and were Hydrogen 2.0, Methane 2.0, Nitrogen 2.0, Oxygen 2.0, and Carbon Dioxide 4.0.
Gas mixtures used for calibration were in-house blended mixtures of pure gases from
Airgas and purchased calibration mixtures from Supelco. The first purchased gas
mixture, Supelco catalog number 501743, was 14.97% carbon dioxide, 6.99% carbon
monoxide, 4.50% methane, 4.00% oxygen, with the balance being nitrogen. All
compositional values are in mole percents, and the accuracy of the manufacturer’s gas
analysis was ±5%. The second purchased gas mixture, Supelco catalog number 23462,
was 1.00% acetylene, 1.00% carbon dioxide, 1.00% carbon monoxide, 1.02% ethane,
1.00% ethylene, 0.999% methane, with the balance being nitrogen. The accuracy of the
manufacturer’s gas analysis is ±2%. The retention order and typical retention times for
each calibration gas are listed in Table 3.3. GC calibration data and calibration curves
are presented in the appendix.

38
Table 3.3: Retention time for each calibrated species using a syringe or sample loop. Retention
Order Species Retention Time
GSS /min Retention Time
GSL /min 1 Hydrogen 2.5 3.4 2 Nitrogen 5.5 6.5 3 Carbon Monoxide 7.2 8.4 4 Methane 12.1 15.9 5 Carbon Dioxide 16.3 22.2 6 Ethylene 24.8 35.0 7 Ethane 29.0 39.1

39
CHAPTER 4
RESULTS AND DISCUSSION
4.1 Experimental Results and Material Balance
The seventeen supercritical water reformation experiments of ethanol were conducted
over a four day period, 31 hours of which ethanol was fed into the reactor. A total of
4.968 kg of 95% ethanol was fed into the reactor and 18.81 kg of water. The target and
observed operating conditions are listed in Table 4.1.
Table 4.1: Target and observed experimental temperature, flow rates, and pressure Targets Observed
Run ID
DOE Line
T/ K
EtOH / g·min-1
H2O / g·min-1
P/ MPa
T/ K
EtOH / g·min-1
H2O / g·min-1
P/ MPa
A 13 983 1.000 12 24.20 982.9 0.93 11.4 24.21 B 8 963 1.375 15 24.20 966.6 1.55 16.1 24.22 C 11 943 1.000 12 24.20 944.2 0.90 11.4 24.20 D 3 923 1.375 9 24.20 930.3 1.55 9.2 24.19 E 7 923 1.375 15 24.20 930.3 1.55 14.1 24.20 F 12 903 1.000 12 24.20 901.4 0.91 11.3 24.18 G 10 943 1.000 12 24.20 944.0 0.92 11.4 23.83 H 17 943 1.000 18 24.20 941.3 0.90 19.7 24.18 I 1 923 0.625 9 24.20 930.7 0.52 9.3 23.96 J 2 963 0.625 9 24.20 966.5 0.61 9.3 24.24 K 15 943 1.750 12 24.20 943.2 2.02 11.3 24.23 L 6 963 0.625 15 24.20 964.3 0.58 13.7 24.24 M 16 943 1.000 6 24.20 944.1 0.91 6.4 23.98 N 14 943 0.250 12 24.20 943.7 0.17 11.5 24.19 O 9 943 1.000 12 24.20 943.6 0.93 11.6 24.18 P 4 963 1.375 9 24.20 966.6 1.55 9.3 24.20 Q 5 923 0.625 15 24.20 929.1 0.59 13.6 24.30
The observed temperature is the mean of the temperatures measured by reactor
thermocouples (RTC) 3, 4, 5, 6, and 7 over the period of the experimental run. The
temperature was measured at half-second intervals. Temperatures measured by RTC 1
and RTC 8 were not included in the average, since these thermocouples measure the

40
temperature of the reactor heads, which are not heated. RTC 2 measures the reactor
temperature near the inlet of the reactor, where the reactants are being heated to
experimental temperature. RTC 2 temperatures are likewise omitted from the average
reactor temperature. The pressure is the mean pressure measured over the period of the
experiment at the reactor inlet. The average temperature measured by each reactor
thermocouple and the average pressure measured at the inlet and outlet of reactor for each
run are listed in Table A.9 in the appendix.
At fifteen minute intervals and at the beginning and end of an experimental run,
the masses of the ethanol and water jugs were recorded. The observed ethanol and water
mass flow rates were calculated by dividing the change in mass between the beginning
and the end of a run by the experimental run time. The ethanol and water jug masses at
the beginning and end of each run as well as the duration of each run are listed in Table
A.10 in the appendix.
For each experiment, multiple wet-test meter measurements were conducted,
liquid effluent samples were collected, and gas effluent samples were sampled and
analyzed. Table 4.2 shows the average liquid and gaseous effluent rates from the reactor
for each experimental run as well as the gaseous effluent composition. Table A.11 in the
appendix lists each wet-test meter measurement of the gas effluent rate. The liquid
effluent rate data are in Table A.12, which is also in the appendix. The liquid effluent
collected averaged a total carbon content of 10 ppm. The gas effluent was analyzed using
Hewlett Packard ChemStation software, which generated the integrated peak areas of
each species in a gas sample. Using a linear regression of the GC calibration data
(Figures A.2-A.6 in the appendix) and the integrated peak areas, the molar quantity of

41
each species in a gas sample was calculated. The integrated peak areas for each gas
sample are in Tables A.7 and A.8 in the appendix.
Table 4.2: Ambient condition gas and liquid effluent rates and gas effluent mole fractions Effluent Rates Outlet Gas Mole fractions
Run ID
Gas / L·min-1
Liquid / g·min-1
H2 / mol-%
CO / mol-%
CH4 / mol-%
CO2 / mol-%
C2H6 / mol-%
A 2.19 11.23 53.4% 1.6% 18.3% 23.3% 0.2% B 3.52 17.12 53.0% 1.6% 19.9% 23.4% 1.8% C 2.02 10.75 52.8% 1.0% 19.8% 23.8% 2.1% D 3.19 8.85 49.7% 2.4% 22.8% 23.2% 3.0% E 3.22 14.49 51.5% 1.5% 21.0% 23.7% 2.7% F 2.13 10.74 54.1% 0.6% 18.9% 24.0% 1.7% G 2.06 10.97 52.6% 0.7% 20.6% 24.3% 2.2% H 2.16 17.80 54.1% 0.7% 18.4% 23.8% 2.2% I 1.18 9.04 53.1% 0.4% 19.7% 22.5% 2.1% J 1.44 11.06 58.2% 0.5% 16.8% 22.4% 1.6% K 4.17 11.39 49.1% 1.9% 23.4% 23.1% 3.1% L 1.42 13.45 57.4% 0.1% 18.0% 22.1% 1.6% M 1.90 6.19 49.4% 1.3% 23.0% 22.4% 2.4% N 0.43 11.37 60.0% 0.0% 15.1% 23.6% 1.6% O 2.02 11.31 53.0% 0.7% 19.9% 23.6% 2.2% P 3.20 8.95 51.0% 2.0% 23.5% 23.5% 2.0% Q 1.35 13.52 56.1% 0.4% 19.2% 24.3% 1.8%
At the conclusion of the design matrix, the reactor was opened and inspected.
The interior of the reactor was found to be free of deposits, which in turn indicates that
the supercritical water reformation of ethanol at the conditions considered did not result
in coking or fouling of the reactor. This coking-free inspection result as well as the low
carbon content in the liquid effluent (10 ppm) indicates that ethanol was completely
converted to gaseous product species. This result is also reflected in an effective closure
of the atomic carbon balance in Table 4.3, based on ethanol feed and gaseous effluent.
Based on ethanol feed rates and gaseous effluent composition, an atomic balance
of hydrogen and oxygen is in Table 4.4. The molar flow rates and molar fractions of the
reactor feed and effluent are listed in Tables 4.5 and 4.6.

42
Table 4.3: Atomic carbon balance
Run ID
DOE Line
Carbon In mmol·min-1
Carbon Out mmol·min-1
Difference mmol·min-1
Percentage Difference
A 13 39.7 38.6 -1.1 -2.8% B 8 66.1 66.7 0.6 1.0% C 11 38.3 38.4 0.1 0.3% D 3 65.8 67.8 2.0 3.0% E 7 65.7 65.1 -0.7 -1.0% F 12 38.6 38.9 0.3 0.9% G 10 39.1 40.3 1.2 3.0% H 17 38.1 39.9 1.9 4.9% I 1 22.0 21.5 -0.4 -2.0% J 2 26.1 24.0 -2.1 -8.0% K 15 86.0 89.1 3.0 3.5% L 6 24.6 24.1 -0.5 -1.9% M 16 38.8 38.3 -0.5 -1.2% N 14 7.3 7.1 -0.2 -3.2% O 9 39.7 38.5 -1.2 -3.1% P 4 65.8 66.7 0.9 1.4% Q 5 25.1 25.1 0.0 0.2%
Table 4.4: Hydrogen and oxygen from ethanol fed to the reactor, hydrogen and oxygen exiting the reactor
Run DOE H in O in H out O out ID Line mmol·min-1 mmol·min-1 mmol·min-1 mmol·min-1 A 13 119.1 19.9 162.3 40.6 B 8 198.2 33.0 275.6 65.4 C 11 114.9 19.1 158.3 37.6 D 3 197.5 32.9 264.4 59.7 E 7 197.2 32.9 260.9 60.3 F 12 115.7 19.3 164.3 39.5 G 10 117.4 19.6 165.0 38.9 H 17 114.2 19.0 168.1 40.1 I 1 65.9 11.0 92.6 20.5 J 2 78.3 13.0 110.5 24.9 K 15 258.1 43.0 349.2 76.9 L 6 73.7 12.3 111.5 24.2 M 16 116.3 19.4 155.2 33.5 N 14 21.9 3.6 32.7 7.8 O 9 119.1 19.9 160.1 37.1 P 4 197.4 32.9 266.1 60.4 Q 5 75.4 12.6 107.6 25.4
43
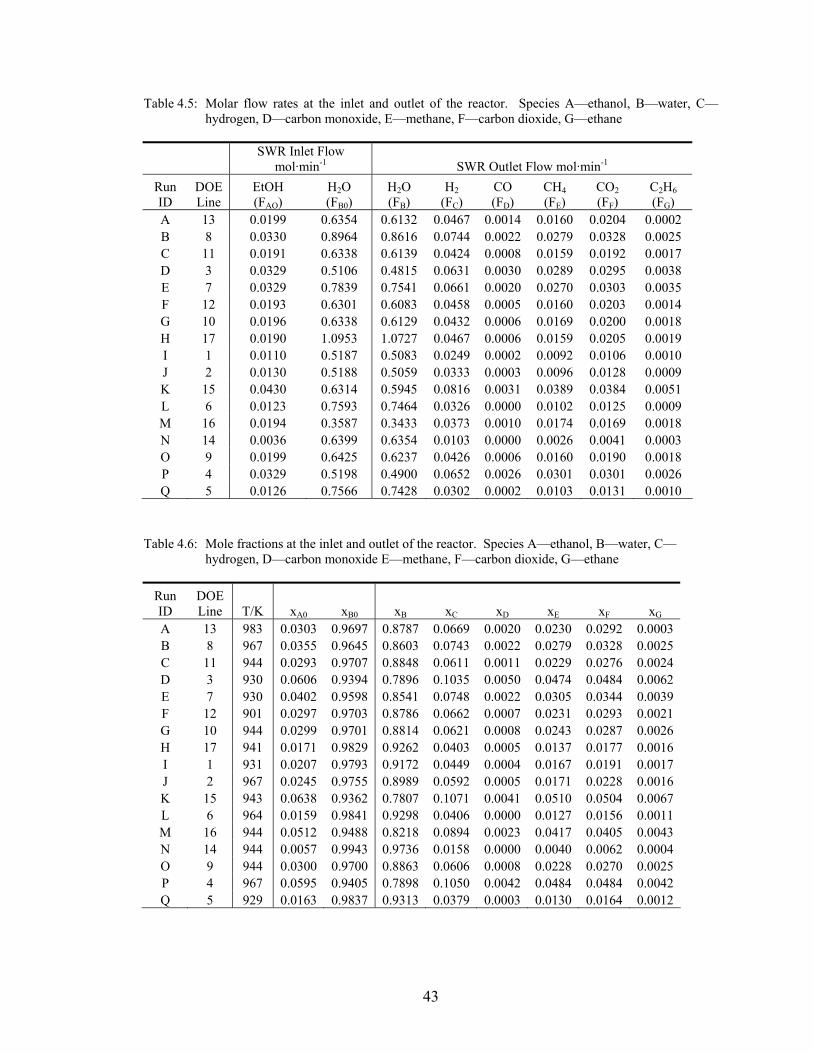
Table 4.5: Molar flow rates at the inlet and outlet of the reactor. Species A—ethanol, B—water, C—hydrogen, D—carbon monoxide, E—methane, F—carbon dioxide, G—ethane
SWR Inlet Flow
mol·min-1 SWR Outlet Flow mol·min-1 Run ID
DOE Line
EtOH (FAO)
H2O (FB0)
H2O (FB)
H2 (FC)
CO (FD)
CH4 (FE)
CO2 (FF)
C2H6 (FG)
A 13 0.0199 0.6354 0.6132 0.0467 0.0014 0.0160 0.0204 0.0002 B 8 0.0330 0.8964 0.8616 0.0744 0.0022 0.0279 0.0328 0.0025 C 11 0.0191 0.6338 0.6139 0.0424 0.0008 0.0159 0.0192 0.0017 D 3 0.0329 0.5106 0.4815 0.0631 0.0030 0.0289 0.0295 0.0038 E 7 0.0329 0.7839 0.7541 0.0661 0.0020 0.0270 0.0303 0.0035 F 12 0.0193 0.6301 0.6083 0.0458 0.0005 0.0160 0.0203 0.0014 G 10 0.0196 0.6338 0.6129 0.0432 0.0006 0.0169 0.0200 0.0018 H 17 0.0190 1.0953 1.0727 0.0467 0.0006 0.0159 0.0205 0.0019 I 1 0.0110 0.5187 0.5083 0.0249 0.0002 0.0092 0.0106 0.0010 J 2 0.0130 0.5188 0.5059 0.0333 0.0003 0.0096 0.0128 0.0009 K 15 0.0430 0.6314 0.5945 0.0816 0.0031 0.0389 0.0384 0.0051 L 6 0.0123 0.7593 0.7464 0.0326 0.0000 0.0102 0.0125 0.0009 M 16 0.0194 0.3587 0.3433 0.0373 0.0010 0.0174 0.0169 0.0018 N 14 0.0036 0.6399 0.6354 0.0103 0.0000 0.0026 0.0041 0.0003 O 9 0.0199 0.6425 0.6237 0.0426 0.0006 0.0160 0.0190 0.0018 P 4 0.0329 0.5198 0.4900 0.0652 0.0026 0.0301 0.0301 0.0026 Q 5 0.0126 0.7566 0.7428 0.0302 0.0002 0.0103 0.0131 0.0010
Table 4.6: Mole fractions at the inlet and outlet of the reactor. Species A—ethanol, B—water, C—hydrogen, D—carbon monoxide E—methane, F—carbon dioxide, G—ethane
Run ID
DOE Line T/K xA0 xB0 xB xC xD xE xF xG
A 13 983 0.0303 0.9697 0.8787 0.0669 0.0020 0.0230 0.0292 0.0003 B 8 967 0.0355 0.9645 0.8603 0.0743 0.0022 0.0279 0.0328 0.0025 C 11 944 0.0293 0.9707 0.8848 0.0611 0.0011 0.0229 0.0276 0.0024 D 3 930 0.0606 0.9394 0.7896 0.1035 0.0050 0.0474 0.0484 0.0062 E 7 930 0.0402 0.9598 0.8541 0.0748 0.0022 0.0305 0.0344 0.0039 F 12 901 0.0297 0.9703 0.8786 0.0662 0.0007 0.0231 0.0293 0.0021 G 10 944 0.0299 0.9701 0.8814 0.0621 0.0008 0.0243 0.0287 0.0026 H 17 941 0.0171 0.9829 0.9262 0.0403 0.0005 0.0137 0.0177 0.0016 I 1 931 0.0207 0.9793 0.9172 0.0449 0.0004 0.0167 0.0191 0.0017 J 2 967 0.0245 0.9755 0.8989 0.0592 0.0005 0.0171 0.0228 0.0016 K 15 943 0.0638 0.9362 0.7807 0.1071 0.0041 0.0510 0.0504 0.0067 L 6 964 0.0159 0.9841 0.9298 0.0406 0.0000 0.0127 0.0156 0.0011 M 16 944 0.0512 0.9488 0.8218 0.0894 0.0023 0.0417 0.0405 0.0043 N 14 944 0.0057 0.9943 0.9736 0.0158 0.0000 0.0040 0.0062 0.0004 O 9 944 0.0300 0.9700 0.8863 0.0606 0.0008 0.0228 0.0270 0.0025 P 4 967 0.0595 0.9405 0.7898 0.1050 0.0042 0.0484 0.0484 0.0042 Q 5 929 0.0163 0.9837 0.9313 0.0379 0.0003 0.0130 0.0164 0.0012

44
In order to calculate the space time, reactant, and product concentrations, which
are all important parameters for analyzing the process kinetics, the molar volume at the
inlet and outlet of the reactor must be calculated. The molar volume for each
experimental run was regressed by means of the Peng-Robinson-Stryjek-Vera equation of
state. The temperature and inlet and outlet compositions in Table 4.6 and the pressure in
Table 4.1 were used in this property estimation. With the calculated molar volume and
the molar flow rates in Table 4.5, the volumetric flow rate at the inlet is calculated.
Given the volume of the reactor, the space time for each experimental run condition may
be determined. The molar volume, volumetric flow rate, and space time are listed in
Table 4.7. The concentrations of each species at the inlet and outlet of the reactor are
listed in Table 4.8.
Table 4.7: Molar volume, volumetric flow rate, and space time
Inlet Outlet
Run ID
DOE Line
T / K
Vm / cm3·mol-1
Q / cm3·min-1
τ / s
Vm / cm3·mol-1
Q / cm3·min-1
A 13 983 316.0 207.0 268 322.9 225.8 B 8 967 308.7 286.9 194 316.8 317.6 C 11 944 298.2 194.7 285 305.7 212.3 D 3 930 293.3 159.4 348 305.8 186.8 E 7 930 292.2 238.7 233 301.5 266.6 F 12 901 278.0 180.5 308 287.1 199.0 G 10 944 303.1 198.0 281 310.7 216.3 H 17 941 296.5 330.4 168 301.8 349.9 I 1 931 294.6 156.0 356 300.6 166.7 J 2 967 307.8 163.7 339 314.1 176.9 K 15 943 299.1 201.7 275 311.3 237.5 L 6 964 306.3 236.3 235 311.1 249.9 M 16 944 302.2 114.3 486 312.6 130.8 N 14 944 296.9 191.1 291 299.5 195.5 O 9 944 298.2 197.5 281 305.6 215.3 P 4 967 310.2 171.4 324 321.1 199.6 Q 5 929 289.2 222.4 250 294.4 234.9

45
Table 4.8: Species concentrations at the inlet and outlet of the reactor in mmol·L-1. Species A—ethanol, B—water, C—hydrogen, D—carbon monoxide, E—methane, F—carbon dioxide, G—ethane
Inlet (mmol·L-1) Outlet (mmol·L-1) Run ID
DOE Line T / K CA0 CB0 CB CC CD CE CF CG
A 13 983 95.9 3069.0 2722.8 206.7 6.0 71.1 86.8 3.5 B 8 967 115.1 3124.7 2720.5 234.3 6.9 88.0 99.4 7.9 C 11 944 98.3 3254.9 2898.6 199.8 3.7 74.9 86.8 7.8 D 3 930 206.5 3202.5 2589.6 337.9 16.2 154.8 151.8 20.1 E 7 930 137.7 3284.4 2837.6 247.8 7.4 101.1 109.4 13.1 F 12 901 106.8 3490.7 3065.1 230.3 2.6 80.5 98.1 7.2 G 10 944 98.8 3200.6 2840.7 199.7 2.6 78.1 88.7 8.5 H 17 941 57.6 3314.9 3070.7 133.4 1.6 45.4 56.5 5.3 I 1 931 70.4 3324.2 3054.3 149.4 1.3 55.4 60.9 5.8 J 2 967 79.7 3169.1 2864.8 188.3 1.5 54.4 69.6 5.1 K 15 943 213.2 3130.4 2515.8 343.4 13.0 163.7 155.4 21.5 L 6 964 52.0 3212.6 2990.7 130.5 0.1 40.9 48.3 3.6 M 16 944 169.6 3139.3 2635.1 285.5 7.3 133.2 124.5 13.8 N 14 944 19.1 3348.5 3251.7 52.8 0.0 13.3 20.0 1.4 O 9 944 100.5 3252.5 2904.2 198.1 2.8 74.5 84.9 8.3 P 4 967 191.9 3032.3 2466.5 326.4 12.9 150.6 144.8 13.0 Q 5 929 56.5 3401.9 3165.9 128.6 0.9 44.0 53.6 4.1
4.2 Mechanistic Elucidation of the Process As shown in Table 4.2, the principal products of the supercritical water reformation of
ethanol are hydrogen, carbon oxides, methane, and ethane. By examination of the
product composition and atomic balances, as well as the selectivity of various products,
the overall reaction schemes that take place in the supercritical water reformation of
ethanol may be inferred.
4.2.1 Pyrolytic Decomposition of Ethanol and Water-gas Shift
The presence of methane in the effluent gas, in relatively high concentrations, between
15.1 and 23.5 mol-%, suggests that ethanol is being decomposed as
C2H5OH → CH4 + CO + H2 (4.1)

46
The absence of acetaldehyde is significant since in published work at 773 K,
acetaldehyde is an important intermediate in the decomposition of ethanol in supercritical
water14:
C2H5OH → CH3CHO + H2 (4.2)
Acetaldehyde may be further decomposed to form methane and carbon monoxide:
CH3CHO → CH4 + CO (4.3)
The absence of acetaldehyde in the product mixture indicates that the decomposition of
acetaldehyde to methane at the temperature ranges investigated went to completion or
ethanol decomposes by other means such as direct single-stage decomposition.
Regardless, the combination of (4.2) and (4.3) would yield (4.1):
C2H5OH → CH4 + CO + H2 (4.1)
Carbon monoxide appears in relatively low concentrations, between 0 and 2.4
mol-%. Carbon monoxide does not appear in equal molar quantities as methane, and
there is an abundance of carbon dioxide in the product stream. Both are indicative of the
mechanistic fact that the forward water-gas shift reaction is active at the conditions
investigated:
CO + H2O → CO2 + H2 (4.4)
By combining (4.1) and (4.4), the resultant stoichiometric equation, the pyrolytic
decomposition of ethanol reaction, may be reduced to
C2H5OH + H2O → CH4 + CO2 + 2H2 (4.5)
Based on the stoichiometry of (4.5), if all ethanol molecules fed were converted
predominantly by this reaction, then the molar ratios of CH4/CO2 and H2/CO2 would be

47
1:1 and 2:1, respectively. In addition, the molar ratio of H2/CH4 would be 2:1. Table 4.9
lists the molar ratios of various product gases.
As can be seen from the table, the ratios of H2/CH4 for all experimental runs range
between 2.1 and 4.0, all exceeding 2.0, thus confirming that all of the hydrogen is not
generated by this combinatory route between pyrolytic decomposition and water gas shift
reactions. Rather, hydrogen generation has also been realized to a substantial extent via
a more stoichiometrically favorable conversion route whose typical yield ratio of H2/CH4
is greater than 2.0. This is further elaborated in a later section.
Table 4.9 Ethanol to water ratio and product molar ratios
Run ID DOE Line T/K
EtOH/H2O (by mass)
H2O/EtOH (by mass) H2/EtOH H2/COX H2/CH4 CH4/COX CO2/(CO+CO2)
A 13 983 8.0% 17.9 2.347 2.227 2.910 0.765 0.935 B 8 967 9.4% 15.2 2.255 2.204 2.664 0.827 0.935 C 11 944 7.7% 5.9 2.220 2.209 2.668 0.828 0.960 D 3 930 16.5% 6.0 1.918 2.011 2.184 0.921 0.903 E 7 930 10.7% 23.1 2.009 2.121 2.450 0.866 0.936 F 12 901 7.8% 23.6 2.373 2.288 2.862 0.799 0.974 G 10 944 7.9% 9.1 2.204 2.188 2.558 0.855 0.972 H 17 941 4.4% 10.4 2.458 2.297 2.937 0.782 0.972 I 1 931 5.4% 12.5 2.264 2.403 2.696 0.891 0.980 J 2 967 6.4% 12.4 2.562 2.647 3.463 0.764 0.979 K 15 943 17.4% 12.7 1.898 2.040 2.098 0.972 0.923 L 6 964 4.1% 12.4 2.650 2.696 3.187 0.846 0.997 M 16 944 13.8% 12.3 1.923 2.166 2.143 1.011 0.945 N 14 944 1.5% 67.6 2.861 2.640 3.963 0.666 1.000 O 9 944 7.9% 5.6 2.141 2.260 2.660 0.850 0.969 P 4 967 16.2% 7.0 1.982 2.070 2.168 0.955 0.918 Q 5 929 4.2% 21.9 2.397 2.361 2.921 0.808 0.984
The extent of the forward water-gas shift reaction is significant, being greater than
90% at all experimental conditions (Table 4.6). It is important to note that the water-gas
shift reaction is a reversible reaction whose overall direction of reaction can be easily
reversed by imposed conditions. At the temperatures at which the experiments were
conducted, the water-gas shift reaction should be somewhat limited by chemical

48
equilibrium. A possible explanation for the high extent of the forward reaction is
attributable to the fact that the high concentration of water is driving the water-gas shift
reaction’s equilibrium to favor the forward direction conversion. Another explanation is
that there may be more than one phase in the reactor, a hydrogen-rich phase and a
hydrogen-poor phase that contains mostly water and carbon-containing species. If
hydrogen is not present in a phase where water and carbon monoxide are most
abundantly present, the water-gas shift reaction would proceed in the forward direction
without the full influence of an equilibrium limitation.
4.2.2 Direct Reformation Reaction of Ethanol
With hydrogen to methane ratios greater than 2, more hydrogen is being produced than
the pyrolytic decomposition reaction would predict, which indicates that another
hydrogen forming reaction is occurring outside of the decomposition reaction, and the
forward water-gas shift reaction. The overall stoichiometric equation for the steam
reformation of ethanol, or direct reformation of ethanol, is
C2H5OH + 3 H2O → 2CO2 + 6H2 (4.6)
which may account for the additional hydrogen. If all the ethanol molecules fed were
converted solely via this step (4.6), the molar ratios of CH4/CO2 and H2/CO2 would
become 0:1 and 3:1, respectively.
At higher temperatures, methane can be further reacted via methane reformation
and a subsequent water-gas shift reaction:
CH4 + H2O → CO + 3H2 (4.7)
CO + H2O → CO2 + H2 (4.4)

49
The resultant stoichiometric equation combining all three reactions, i.e., Eqns (4.4), (4.5),
and (4.7), would become essentially the same as the direct reformation reaction of
ethanol:
C2H5OH + 3 H2O → 2CO2 + 6H2 (4.6)
As a result, a vital question regarding the mechanistic pathway for noncatalytic
ethanol reformation in the supercritical water medium now becomes whether the
reformation reaction proceeds via direct reformation, reaction (4.6), to produce hydrogen
and carbon dioxide, or indirectly via methane reformation (4.4, 4.5, and 4.7) to produce
hydrogen and carbon dioxide. Based on the preliminary study of JP-8 reformation
kinetics38, it was found that the reformation of methane at temperatures lower than 690°C
is not appreciably significant. Thus, the methane reformation reaction was not heavily
involved in most of the design point runs, except the ones for 710°C, listed in Table 4.6.
As can be clearly seen in Table 4.9, the molar ratios of CH4/CO2 and H2/CO2 for
all experimental runs fall in the ranges of 0-1:1 and 2-3:1, respectively. This observation
further indicates that the reactions represented by Eq. (4.5) and Eq. (4.6) are
competitively taking place in the reaction system at the conditions investigated in the
current study. However, it must be noted that the most efficient conversion scenario
would involve maximizing the direct reformation reaction while minimizing the pyrolytic
decomposition, with complete conversion of ethanol to gaseous product.
4.2.3 Dehydration of Ethanol
The presence of ethane suggests that there is an undesirable competing reaction, even
though not a dominant one. Ethylene, a potential coking precursor, can be produced by

50
dehydration of ethanol. If there is a sufficient amount of product hydrogen present,
ethylene can be hydrogenated in situ to form ethane by the following reactions:
dehydration: C2H5OH → C2H4 + H2O (4.8)
hydrogenation: C2H4 + H2 → C2H6 (4.9)
Absence of acetylene in the product stream also indicates that the reaction environment
favors hydrogenating rather than dehydrogenating ethylene. In addition, it is noteworthy
that ethanol is still dehydrated via (4.8) in such a water-rich environment.
4.3 Kinetic Model
Since all of the reactant, ethanol, was consumed in the reformation reactions, the kinetic
model is based on carbon balances, the conversion of ethanol to methane, and the
conversion of ethanol to hydrogen. Global first-order kinetics is assumed for the
pyrolytic decomposition of ethanol to methane:
C2H5OH + H2O →1k
CH4 + CO2 + 2H2 (4.5)
with the rate of disappearance of ethanol for the decomposition reaction as
A1A Ck
dtdC
=− (4.1)
For the direct reformation of ethanol into carbon dioxide, a multiplicative factor
of the molar ratio of ethanol to water, Φn, is included in the global first-order rate
expression:
C2H5OH + 3 H2O →2k
2CO2 + 6H2 (4.6)
with the rate of disappearance of ethanol for the reformation reaction

51
An
2A CΦk
dtdC
=− (4.2)
The inclusion of a multiplicative factor of Φn in the kinetic rate expression is to account
for the ethanol-to-water feed ratio that is directly linked with the chemical equilibrium
limitation imposed on the reformation reaction. Then, the overall rate expression for the
disappearance of ethanol is
An
2A1A CkCk
dtdC
Φ+=− (4.3)
which has the integrated rate expression:
( )[ ]tkΦk-expCC 2n
1A0A += (4.4)
The rates of generation of methane and hydrogen may be expressed as a function of the
concentration of ethanol and are
A1E Ck
dtdC
= (4.5)
An
2A1C Ck6Ck2
dtdC
Φ+= (4.6)
By substituting (4.4) into equations (4.5) and (4.6) and integrating, the expressions for the
concentrations of hydrogen and methane are
( )[ ]( )tkΦk-exp1kΦk
kΦ6k2CC 2n
12
n1
2n
1A0C +−
++
= (4.7)
( )[ ]( )tkΦk-exp1kΦk
kCC 2n
12
n1
1A0E +−
+= (4.8)
where CA0 is the initial concentration of ethanol, k1 and k2 are first-order rate constants,
and Φn is the molar feed ratio of ethanol to water. These equations can be solved
simultaneously to find the rate constants k1 and k2 by setting CA0 as the inlet

52
concentration of ethanol in moles per liter, CE is the outlet concentration of methane in
moles per liter, and CC is the outlet concentration of hydrogen. The concentration for
each species is listed in Table 4.8.
The rate coefficients may then be regressed using a commercially available
software package such as Maple 10. The calculated rate coefficients for the
decomposition reaction and the reformation reaction are tabulated in Table 4.10.
Table 4.10: Calculated rate coefficients for the pyrolytic decomposition (1) and direct reformation (2) reactions
Run ID
DOE Line Φ1.5 T-1/ K-1 k1 k2
A 13 5.522E-03 1.017E-03 0.302477 0.045853 B 8 7.073E-03 1.035E-03 0.447696 0.049562 C 11 5.249E-03 1.059E-03 0.301882 0.033630 D 3 1.637E-02 1.075E-03 0.238523 0.007298 E 7 8.586E-03 1.075E-03 0.341979 0.025633 F 12 5.354E-03 1.109E-03 0.272997 0.039233 G 10 5.424E-03 1.059E-03 0.334345 0.031075 H 17 2.292E-03 1.062E-03 0.553869 0.086538 I 1 3.084E-03 1.074E-03 0.260636 0.030229 J 2 3.987E-03 1.035E-03 0.202829 0.049462 K 15 1.778E-02 1.060E-03 0.317803 0.005209 L 6 2.059E-03 1.037E-03 0.395480 0.078271 M 16 1.255E-02 1.059E-03 0.190206 0.004518 N 14 4.301E-04 1.060E-03 0.246838 0.080759 O 9 5.431E-03 1.060E-03 0.288272 0.031716 P 4 1.592E-02 1.035E-03 0.284378 0.007959 Q 5 2.138E-03 1.076E-03 0.363529 0.055794
The Arrhenius activation energy is defined by
TREaeAk −= (4.9)
where k is the rate coefficient, A is the frequency factor, Ea is the activation energy, R is
the gas law constant, and T is absolute temperature. The activation energy may be
determined by linear regression of the natural logarithm of the rate coefficient versus the
inverse of the temperature. The natural logarithm of the mean of the rate coefficient for

53
the pyrolytic decomposition reaction and the direct reformation reaction at the design of
experiment’s test temperatures are plotted in Figure 4.1.
y = -2051.6x + 0.9824R2 = 0.9914
y = -10089x + 7.164R2 = 0.9099
-5-4.5
-4-3.5
-3-2.5
-2-1.5
-1-0.5
0
0.001 0.00102 0.00104 0.00106 0.00108 0.0011 0.00112
1/T K-1
ln(k
i)
ln(k1)ln(k2)Linear (ln(k1))Linear (ln(k2))
Figure 4.1: Arrhenius plot for the pyrolytic decomposition reaction (1) and the direct reformation reaction (2).
The rate constant k1 refers to the pyrolytic decomposition reaction and k2 refers to
the direct reformation reaction. The error bars were determined from the standard error
of the average logarithm of the rate constant at each temperature. For the pyrolytic
reformation reaction, k1, the greatest standard error was 0.18. For the direct reformation
reaction, k2, the standard error was 0.50. Based on the linear best fit of the Arrhenius
plot, the Arrhenius activation energy and frequency factor values shown in Table 4.11 are
obtained.
Table 4.11: Arrhenius activation energy.
EA (kJ/mol) A R2 pyrolytic
decomposition 17.1 2.67 0.99
direct reformation 83.9 1290 0.91
54
With a lower activation energy, the pyrolytic decomposition reaction is less
temperature dependent than the direct reformation reaction. This remark is substantiated
by previously published work14, where the decomposition of ethanol combined with the
water-gas shift reaction were the predominant reactions at 773 K. At this temperature,
direct reformation was not reported. Due to the higher temperature dependence of the
direct reformation reaction, this reaction will become more active at higher temperatures
and will out-compete the decomposition reaction, thus maximizing the production of the
desired product, hydrogen. It is also noteworthy that as temperatures increase above
those tested, that the methane reformation reaction will contribute more to the product
composition.
4.4 Optimization and Analysis of Variance
The three process conditions tested in this experimental design were temperature, ethanol
feed rate, and water feed rate with a fixed pressure. There are several important
parameters of mechanistic and kinetic interest that may be statically evaluated, which
may provide further insight into improvements and optimization of supercritical water
reformation of ethanol into hydrogen. Of particular interest is the conversion of ethanol
into hydrogen, the selectivity of hydrogen over methane, and the selectivity of methane
over carbon oxides.
4.4.1 Conversion of Ethanol into Hydrogen
The effectiveness of hydrogen generation, the goal of ethanol reformation, is evaluated
by a statistical analysis of the molar ratio of hydrogen produced versus ethanol fed into

55
the reactor. An analysis of variance of the factorial portion of the design of experiments
(DOE), Table 4.12, shows that only the main effects, temperature, ethanol flow rate, and
water flow rate, are statically significant in terms of hydrogen production with p ≤ 0.05.
The interactive effects were not statistically significant. This may be due to the long
residence times used for this design since the feed ethanol was completely converted as
evidenced by practically no carbon content in the liquid phase of the reactor effluent.
Table 4.13 shows the estimated effects and corresponding p-values.
Table 4.12 Analysis of variance for hydrogen generation.
Source DF Seq SS Adj SS Adj MS F P Main Effects 3 0.503555 0.503555 0.167852 120.94 0.0082-way Interactions 3 0.011041 0.011041 0.00368 2.65 0.2863-way Interactions 1 0.00606 0.00606 0.00606 4.37 0.172Curvature 1 0.009102 0.009102 0.009102 6.56 0.125Residual Error 2 0.002776 0.002776 0.001388 Pure Error 2 0.002776 0.002776 0.001388 Total 10 0.532534
Table 4.13 Estimated effects and test statistics for hydrogen generation.
Term Effect Coef SE Coef T P Constant 2.2552 0.01317 171.22 0T 0.2106 0.1053 0.01317 7.99 0.015FEtOH -0.4297 -0.2148 0.01317 -16.31 0.004FH2O 0.151 0.0755 0.01317 5.73 0.029T*FEtOH -0.0573 -0.0286 0.01317 -2.17 0.162T*FH2O 0.0355 0.0177 0.01317 1.35 0.31FEtOH*FH2O 0.0313 0.0157 0.01317 1.19 0.356T*FETOH*FH2O 0.055 0.0275 0.01317 2.09 0.172Ct Pt -0.0646 0.02522 -2.56 0.125
Contour plots of the response surface for hydrogen to ethanol molar ratios were
generated using Minitab® statistical software and are shown in Figure 4.2. Since the
interactive effects are not statistically significant, conclusions cannot be drawn with
statistical certainty using the contour plots. However, some trends may be inferred:

56
hydrogen production is highest at higher temperatures, at higher water flow rates, and at
the lower ethanol flow rates tested.
The flow rates of water and ethanol affect both residence time and ethanol feed
concentrations (ethanol to water ratio). Since more hydrogen appears to be produced at
the lowest ethanol flow rates, it is apparent that lower ethanol to water ratios allow for
more hydrogen to be produced. This is also consistent with the fact that the lowest
ethanol-to-water feed ratio generates the highest molar ratio of hydrogen to methane in
the product stream, thus maximizing the reformation efficiency. Please refer to Run N in
Table 4.6.
Ethanol*T
210-1-2
2
1
0
-1
-2
Water*T
210-1-2
2
1
0
-1
-2
Water*Ethanol
210-1-2
2
1
0
-1
-2
T 0Ethanol 0Water 0
Hold Values
> – – – – – – < 1.8
1.8 2.02.0 2.22.2 2.42.4 2.62.6 2.82.8 3.0
3.0
H2/EtOH
Figure 4.2: Contour plots of DOE for hydrogen to ethanol molar ratio, clockwise starting with the top left
contour plot: (1) ethanol flow rate versus temperature with water flow held constant, (2) water flow rate versus temperature, ethanol flow held constant, (3) water flow rate versus ethanol flow rate, temperature held constant.

57
4.4.2 Selectivity of Hydrogen over Methane
The selectivity of hydrogen over methane is important in evaluating the
competitive nature between the direct reformation reaction and the pyrolytic
decomposition reaction. The direct reformation reaction is desirable over the pyrolytic
decomposition reaction since, when combined with the forward water gas shift reaction,
produces three times more hydrogen than the pyrolytic decomposition reaction. In
addition, if the pyrolytic decomposition reaction were the sole or dominant reaction, the
hydrogen to methane ratio would be 2:1. At conditions where this ratio increases, the
direct reformation reaction is more active. Table 4.14 is the analysis of variance of the
factorial portion of the DOE for the selectivity of hydrogen over methane.
Table 4.14 Analysis of variance for hydrogen selectivity over methane.
Source DF Seq SS Adj SS Adj MS F P Main Effects 3 1.2333 1.2333 0.4111 109.30 0.0092-way Interactions 3 0.1790 0.1790 0.0597 15.86 0.0603-way Interactions 1 0.0668 0.0668 0.0668 17.76 0.052Curvature 1 0.0169 0.0169 0.0169 4.49 0.168Residual Error 2 0.0075 0.0075 0.0038 Pure Error 2 0.0075 0.0075 0.0038 Total 10 1.503
As shown in Table 4.14, the main effects, temperature, ethanol flow rate, and
water flow rate, are statically significant in terms of hydrogen selectivity over methane
with p ≤ 0.05. The two and three way interactions are statically significant with p≤ 0.10.
Table 4.15 shows the estimated effects and corresponding p-values.
The contour plots of the response surface of the selectivity of hydrogen over
methane are shown in Figure 4.3. The contour plot of the selectivity with ethanol flow
rate versus temperature with the water flow rate held constant, plot (1), shows that with
increasing temperature, a greater amount of hydrogen is produced in relation to methane.

58
In addition, the more ethanol that is feed, hence decreasing water to ethanol ratio, the
selectivity of hydrogen over methane decreases regardless of the temperature. In
comparing contour plots (2) and (3), it is evident that as the ethanol amount in water
increases, the selectivity of hydrogen over methane decreases. As a result, over the range
of conditions tested, the selectivity of hydrogen over methane is highly dependent up the
water to ethanol ratio.
Table 4.15 Estimated effects and test statistics for hydrogen selectivity over methane.
Term Effect Coef SE Coef T P Constant 2.7166 0.02168 125.29 0T 0.3077 0.1539 0.02168 7.1 0.019FEtOH -0.7002 -0.3501 0.02168 -16.15 0.004FH2O 0.1777 0.0889 0.02168 4.1 0.055T*FEtOH -0.2087 -0.1044 0.02168 -4.81 0.041T*FH2O -0.0677 -0.0339 0.02168 -1.56 0.259FEtOH*FH2O 0.2033 0.1016 0.02168 4.69 0.043T*FETOH*FH2O 0.1828 0.0914 0.02168 4.21 0.052Ct Pt -0.088 0.04152 -2.12 0.168

59
Ethanol*T
210-1-2
2
1
0
-1
-2
Water*T
210-1-2
2
1
0
-1
-2
Water*Ethanol
210-1-2
2
1
0
-1
-2
T 0Ethanol 0Water 0
Hold Values
> – – – – – – < 1.5
1.5 2.02.0 2.52.5 3.03.0 3.53.5 4.04.0 4.5
4.5
H2/CH4
Figure 4.3: Contour plots of DOE for hydrogen over methane selectivity, clockwise starting with the top
left contour plot: (1) ethanol flow rate versus temperature with water flow held constant, (2) water flow rate versus temperature, ethanol flow held constant, (3) water flow rate versus ethanol flow rate, temperature held constant.
4.5 Comparisons between Experiments
Comparisons between experiments where only one or two conditions are varied
and the reminder are held constant provides further insight into the kinetic relationships
of supercritical water reforming of ethanol into hydrogen, which can be used to determine
optimal operating conditions.
4.5.1 Comparisons between Water to Ethanol Ratios
For this work, the water feed rate, ethanol feed rate, and temperature were varied.
As a result there are several experiments where the ratio of the water fed over the ethanol
fed changed, but the temperature and the space time remained constant. By comparing
experiments with constant temperature and space times the effects of varying the water to

60
ethanol ratios upon hydrogen selectivity, hydrogen concentration, and ethanol conversion
are determined.
For experiments Q and E, the temperature was 930 K, the space time was 240±10
s, and the respective water to ethanol ratios were 23.1 and 9.1. The respective hydrogen
selectivity over methane was 2.9 and 2.5. In addition, the ratio of carbon dioxide to
carbon oxides was 0.98 and 0.94 respectively. This indicates that higher water to ethanol
ratios enhances the hydrogen selectivity over methane and the forward water-gas shift
reaction. A similar comparison may be drawn for experiments D and I where the
temperature was 930 K, the space time was 352±4 s, and the respective water to ethanol
ratios were 5.9 and 17.9. The hydrogen selectivity over methane was 2.2 and 2.7.
Likewise for experiments N and G, the temperature was 944 K, the space time
was 285±5 s, and the respective water to ethanol ratios were 67.6 and 12.4. The
respective hydrogen selectivity over methane was 4.0 and 2.6 and the ratio of carbon
dioxide to carbon oxides was 1.00 and 0.97. This also indicates that higher water to
ethanol ratios enhances hydrogen selectivity over methane and the forward water-gas
shift reaction.
As shown in Figure 4.4, as the water to ethanol ratio increases, the selectivity of
hydrogen over methane increases, meaning that the direct reformation reaction becomes
preferred over the pyrolytic decomposition reaction. The selectivity increases linearly for
experimental conditions between 930 K and 944 K, and space times between 233 and 356
seconds, and for water to ethanol ratios between 5.6 and 23. Experiment N had the
greatest water to ethanol ratio of all experiments conducted of 67.1. As seen on Figure
4.4, the selectivity of hydrogen over methane is lower than the linear trend would predict.

61
The lower than expected selectivity for hydrogen over methane in Experiment N may be
caused by an equilibrium limitation in regards to the direct reformation reaction in
respect to ethanol concentration.
y = 0.0435x + 1.9901R2 = 0.8677
0.00.51.01.52.0
2.53.03.54.04.5
0 10 20 30 40 50 60 70 80
Water/Ethanol mass basis
H2 s
elec
tivity
ove
r met
hane
H2/CH4H2/CH4, W/E=67Linear (H2/CH4)
Figure 4.4: Hydrogen selectivity over methane versus water to ethanol feed ratio for runs between 930 and
944 K and space times between 233 and 356 s, solid line linear regression, dashed line connects minimum and maximum water to ethanol ratio points.
4.5.2 Comparisons between Temperatures
For experiments D and P, the water to ethanol ratio was 6, the space time was
336±12 s, and the reaction temperatures were respectively 930 K and 967 K. The
respective selectivity of hydrogen over methane was nearly the same at 2.18 and 2.17.
The ratios of hydrogen produced to ethanol fed, which is indicative of the extent of the
reformation reactions, were 1.92 and 1.98 respectively, which is similar. Considering the
substantial temperature difference between the two experiments, the hydrogen selectivity
is quite remarkable. This result may indicate that the reaction may have reached an
equilibrium-limited point at the temperatures for experiments D and P.

62
Experiment K has nominally similar reaction conditions to experiments D and P
with the exception of a space time of 275 s (shorter by 59 s) and a temperature of 943 K.
The selectivity of hydrogen over methane was 2.10 and the ratio of hydrogen produced to
ethanol fed was 1.90. It can be readily noted that the extents of the reactions producing
hydrogen in experiments D and P are higher than experiment K. Likewise the selectivity
of hydrogen over methane is slightly lower in experiment K. Since a shorter reaction
time coupled with a higher reaction temperature was employed for experiment K under
otherwise nominally similar conditions as experiment D, the ratio of hydrogen produced
to ethanol fed and the selectivity of hydrogen over methane should not be higher in D
when compared to K, unless the reactions are limited by equilibrium, or are past the
equilibrium conversion.
In comparing experiments C and F, where the water to ethanol ratio was
approximately 12.5 and the space time was 296±11 s, the only difference in the reaction
conditions was the temperature, respectively 901 K and 944 K. The resultant hydrogen
over methane selectivity was 2.86 and 2.67 and the resultant hydrogen produced over
ethanol fed was 2.4 and 2.2 respectively at the conditions investigated. Considering the
large difference in temperature, 43 K, between the two cases, the conversion difference is
relatively minor, which indicates that the temperature and space time conditions
considered encompasses the maximum conversion in the region, which is very similar to
the conclusion for experiments D and P.
The same conclusion can be drawn between experiments F and A, the minimum
and maximum temperatures investigated. For experiment A, the ethanol ratio was 12.3,
the space time was 268 s, and the temperature was 983. The ratio of hydrogen produced

63
over ethanol fed was 2.3 and selectivity of hydrogen over methane was 2.91. The
temperature difference between F and A was 82 K, though the selectivity of hydrogen
over methane and the ratio of hydrogen produced over ethanol fed were approximately
the same. This indicates at the space time and feed conditions considered for these two
experiments that the reactions had reached their maximum conversion for the
temperatures considered.
For experiment O, the temperature was 944 K, the water to ethanol ratio was 12.5,
and the space time was 281. In comparing experiment A and O, the major difference was
the temperature, 983 K versus 944 K. The hydrogen selectivity over methane for
experiment O was 2.66. Considering the large temperature difference, the difference in
selectivity is rather small. This result also strongly indicates that the higher temperature
experiment, A, has already reached or past the maximum equilibrium conversion.
In comparing experiments A, C, F, G, and O altogether, the space time and water
to ethanol fed ratio may all be considered about equal. The resultant hydrogen
concentration, 0.20-0.23 mol ·L-1, and methane concentrations, 0.071-0.080 mol ·L-1,
were nearly unaffected by the change in temperature. This also indicates that the most
important parameter for determining the hydrogen conversion and hydrogen selectivity of
the process is the water-to-ethanol ratio.
4.5.3 Comparisons between Space Times
For experiment K the water to ethanol ratio was 5.6 and the space time was 275 s.
For experiment M the water to ethanol ratio was 7.0 and the space was 486 s. For both
experiments, the temperature was approximately 943 K, with the only difference being
the space time. The selectivity of hydrogen over methane was nearly the same at 2.10

64
and 2.14, receptively, and the ratio of hydrogen produced over ethanol fed for both
experiments was approximately 1.9. Thus at the conditions considered, the reactions
have reached their maximum conversion for the residence times considered. The
significance of this result is that a greater throughput for the existing reactor can be
achieved without affecting conversion.

65
CHAPTER 5
CONCLUSIONS Ethanol, a renewable resource, may be reformed into hydrogen non-catalytically using
supercritical water, which acts synergistically both as a solvent and as a reactant.
Supercritical water acts as a non-polar solvent which is completely miscible with ethanol
and can form a binary supercritical mixture with ethanol at any concentration.
Supercritical water reformation of ethanol avoids many of the typical pitfalls of catalytic
steam reformation, including coke formation, fouling, sintering, poisoning, and
deactivation. As a result, supercritical water reformation is a versatile and robust means
of reforming ethanol and does not require pretreatment or refinement of the ethanol
feedstock.
Supercritical water reformation of ethanol at the conditions tested occurs by two
principal reactions: direct reformation of ethanol to hydrogen and carbon oxides, and
pyrolytic decomposition of ethanol to hydrogen, methane, and carbon oxides. In this
system the forward water-gas shift reaction is active even without the presence of a water
gas shift catalyst. An undesirable, competing reaction occurs to some extent:
dehydration of ethanol to form ethylene. Ethylene is subsequently hydrogenated to form
ethane. This reaction not only consumes a desired product, hydrogen, but also produces a
potential coking precursor, ethylene. However, upon inspection of the reactor, no coking
was evidenced under the process conditions investigated in this study.
The pyrolytic reformation reaction modeled using global first order kinetics is
found to have a regressed Arrhenius activation energy of 17.1 kJ/mol. The direct
reformation reaction based on pseudo-first-order kinetics is found to have a regressed

66
Arrhenius activation energy of 83.9 kJ/mol. Comparing the two principal reaction
mechanistic steps, the direct reformation reaction is found to be far more sensitive to the
reaction temperature than the pyrolytic decomposition reaction.
This study introduces a new process synthesis route for generating hydrogen
using a renewable agricultural feedstock of ethanol and elucidates pertinent chemical
reaction mechanisms involved in the novel supercritical reformation process system.
This study is the first of its kind to elucidate that the ethanol reformation using
supercritical water takes place competitively between the pyrolytic decomposition of
ethanol and the direct reformation of ethanol, both of which contribute to hydrogen
production. The current study further establishes that water-gas shift reaction goes to
near completion in the supercritical water medium under the conditions investigated, thus
eliminating a separate gas-enriching step or a post-treatment stage through a catalyst bed.
The current study also establishes that ethanol in a supercritical water medium is
subjected to alcohol dehydration generating ethylene and the reaction environment
involving ethylene is more hydrogenating rather than dehydrogenating.
Future experimental studies need to be performed to elucidate the effects of the
changing nature of the fluid phase behavior along the reactor length upon the reaction
kinetics, which will provide for an optimal reactor design and scale-up. Further,
embedding the methane reformation reaction in the process scheme would enhance the
ultimate conversion and resultant efficacy of the reformation process.

67
APPENDIX
C2H
6 /
mol
-%
1.02
0%
C2H
4 /
mol
-%
1.00
0%
C2H
2 /
mol
-%
1.00
0%
CO
2 /
mol
-%
99.9
9%
30%
63%
1.00
%
14.9
7%
CH
4 /
mol
-%
99%
0.99
9%
4.50
%
CO
/ m
ol-%
99.5
%
1.00
0%
6.99
%
O2 /
m
ol-%
99%
6% 5% 4.00
%
N2 /
m
ol-%
99%
23%
19%
####
###
69.5
4%
H2 /
m
ol-
% 99%
40%
14%
Cat
alog
N
umbe
r
HY
200
NI 2
00
OX
200
CM
CP3
00
ME
CP2
00
CD
I200
2346
2
5017
43
Man
ufac
ture
r
Airg
as
Airg
as
Airg
as
Airg
as
Airg
as
Airg
as
Supe
lco
Supe
lco
Nam
e
Hyd
roge
n
Nitr
ogen
Oxy
gen
Car
bon
Mon
oxid
e
Met
hane
Car
bon
Dix
oide
Mix
7
Mix
8
Silv
er
Blu
e
Tabl
e A
.1:
Com
posi
tion
of G
C c
alib
ratio
n ga
ses.

68
y = 7.15E-11x + 3.95E-07R2 = 9.97E-01
0.0E+00
5.0E-06
1.0E-05
1.5E-05
2.0E-05
2.5E-05
3.0E-05
3.5E-05
4.0E-05
4.5E-05
0.0E+00 1.0E+05 2.0E+05 3.0E+05 4.0E+05 5.0E+05 6.0E+05 7.0E+05
Peak Area Count·s
Mol
es o
f H2
Figure A.1: GC calibration curve for hydrogen.
y = 9.37E-10x - 2.91E-07R2 = 9.85E-01
0.0E+00
2.0E-06
4.0E-06
6.0E-06
8.0E-06
1.0E-05
1.2E-05
1.4E-05
1.6E-05
0.0E+00
2.0E+03
4.0E+03
6.0E+03
8.0E+03
1.0E+04
1.2E+04
1.4E+04
1.6E+04
1.8E+04
Peak Area Count·s
Mol
es o
f CO
Figure A.2: GC calibration curve for carbon monoxide.

69
y = 2.01E-10x + 4.24E-07R2 = 9.94E-01
0.0E+00
5.0E-06
1.0E-05
1.5E-05
2.0E-05
2.5E-05
3.0E-05
3.5E-05
4.0E-05
4.5E-05
0.0E+00 5.0E+04 1.0E+05 1.5E+05 2.0E+05 2.5E+05Peak Area Count·s
Mol
es o
f CH
4
Figure A.3: GC calibration curve for methane.
y = 6.03E-10x + 5.20E-07R2 = 9.71E-01
0.0E+005.0E-061.0E-051.5E-052.0E-052.5E-053.0E-053.5E-054.0E-054.5E-055.0E-05
0.0E+00 1.0E+04 2.0E+04 3.0E+04 4.0E+04 5.0E+04 6.0E+04 7.0E+04 8.0E+04
Peak Area Count·s
Mol
es o
f CO
2
Figure A.4: GC calibration curve for carbon dioxide.

70
y = 2.36E-10x - 2.20E-08R2 = 9.50E-01
0.0E+00
5.0E-07
1.0E-06
1.5E-06
2.0E-06
2.5E-06
0.0E+00 2.0E+03 4.0E+03 6.0E+03 8.0E+03 1.0E+04 1.2E+04
Peak Area Count·s
Mol
es o
f C2H
6
Figure A.5: GC calibration curve for ethane.

71
Table A.2 GC Calibration data for hydrogen.
Inj. Vol/ mL
Signal File
Area Count·s H2 / mol
Inj. Vol/ mL
Signal File
Area Count·s H2 / mol
0.50 Sig21483 300624.8 2.062E-05 0.40 Sig21708 232259.8 1.649E-05 0.50 Sig21485 299120.5 2.062E-05 0.90 Sig21709 527034.4 3.711E-05 0.10 Sig21487 53434.3 4.123E-06 0.50 Sig21710 289443.1 2.062E-05 0.70 Sig21488 413437.5 2.886E-05 0.75 Sig21711 427329.6 3.092E-05 0.40 Sig21489 235894.8 1.649E-05 0.65 Sig21712 364937.3 2.680E-05 0.70 Sig21490 413346.3 2.886E-05 0.80 Sig21713 454383.6 3.299E-05 0.15 Sig21491 74537.9 6.185E-06 0.50 Sig21714 282774.1 2.062E-05 0.60 Sig21493 352187.9 2.474E-05 0.85 Sig21715 482371.3 3.505E-05 0.05 Sig21494 23779.0 2.062E-06 0.15 Sig21716 85722.9 6.185E-06 0.10 Sig21495 46991.3 4.123E-06 0.90 Sig21717 508028.1 3.711E-05 0.60 Sig21496 320358.9 2.474E-05 1.00 Sig21718 550991.2 4.123E-05 0.40 Sig21997 217030.4 1.649E-05 0.50 Sig21719 286092.1 2.062E-05 0.20 Sig21498 100816.8 8.246E-06 0.80 Sig21720 452492.7 3.299E-05 0.90 Sig21499 478123.2 3.711E-05 1.00 Sig21722 578243.3 4.123E-05 0.18 Sig21501 86111.2 7.216E-06 0.30 Sig21723 176990.0 1.237E-05 0.45 Sig21502 239435.4 1.855E-05 0.05 Sig21724 26701.7 2.062E-06 0.30 Sig21503 158851.7 1.237E-05 0.25 Sig21725 143573.4 1.031E-05 0.15 Sig21505 70058.9 6.185E-06 0.10 Sig21726 55746.9 4.123E-06 0.70 Sig21506 372451.0 2.886E-05 0.01 Sig21727 1487.6 4.123E-07 0.40 Sig21556 221691.4 1.649E-05 0.20 Sig21728 113806.1 8.246E-06 0.30 Sig21557 162770.8 1.237E-05 0.50 Sig21729 289367.9 2.062E-05 0.70 Sig21558 384685.7 2.886E-05 0.10 Sig21730 55852.2 4.123E-06 1.00 Sig21559 547236.1 4.123E-05 0.02 Sig21731 9210.8 8.246E-07 0.15 Sig25160 73788.2 6.185E-06 0.15 Sig21732 82719.6 6.185E-06 0.40 Sig21561 221657.1 1.649E-05 0.03 Sig21733 12212.8 1.031E-06 0.20 Sig21562 104042.3 8.246E-06 0.45 Sig21734 263962.2 1.855E-05 0.60 Sig21563 333388.1 2.474E-05 0.05 Sig21735 26460.3 2.062E-06 0.50 Sig21564 277345.4 2.062E-05 0.01 Sig21736 1667.7 4.123E-07 0.30 Sig21565 161769.6 1.237E-05 0.15 Sig21737 83915.0 6.185E-06 0.05 Sig21566 19029.7 2.062E-06 0.25 Sig21738 142127.0 1.031E-05 0.30 Sig21567 162306.9 1.237E-05 0.34 Sig21739 199677.9 1.402E-05 0.25 Sig21569 121376.4 1.031E-05 0.48 Sig21740 283184.6 1.979E-05 1.00 Sig21701 588546.1 4.123E-05 0.60 Sig21741 348288.2 2.474E-05 0.90 Sig21702 529072.6 3.711E-05 0.30 Sig21743 178803.6 1.237E-05 0.80 Sig21703 458151.7 3.299E-05 0.22 Sig21744 123730.9 9.071E-06 0.80 Sig21704 457498.5 3.299E-05 0.12 Sig21745 65093.8 4.948E-06 0.70 Sig21705 399370.5 2.886E-05 0.07 Sig21746 37420.4 2.886E-06 1.00 Sig21706 572350.3 4.123E-05 0.20 Sig21747 111847.7 8.246E-06 0.60 Sig21707 348973.3 2.474E-05

72
Table A.3: GC calibration data for carbon monoxide.
Source Inj. Vol/
mL mol-frac
Signal File
Area Count·s CO / mol
Supelco 501743 0.2 0.0699 Sig20397 823.3 5.764E-07 Supelco 501743 0.5 0.0699 Sig20396 2025.4 1.441E-06 Supelco 501743 0.5 0.0699 Sig20411 1901.5 1.441E-06 Supelco 23462 1.0 0.0100 Sig20282 585.6 4.123E-07 Supelco 23462 1.0 0.0100 Sig20442 516.4 4.123E-07 Supelco 501743 1.0 0.0699 Sig20392 3993.0 2.882E-06 Supelco 501743 1.0 0.0699 Sig20398 3992.5 2.882E-06 Supelco 501743 1.0 0.0699 Sig20425 3435.9 2.882E-06 Supelco 23462 2.0 0.0100 Sig20422 995.1 8.246E-07 Supelco 501743 2.0 0.0699 Sig20395 7699.6 5.764E-06 Supelco 501743 2.0 0.0699 Sig20443 5438.0 5.764E-06 Supelco 23462 3.0 0.0100 Sig20416 1558.7 1.237E-06 Supelco 501743 3.0 0.0699 Sig20393 11158.8 8.646E-06 Supelco 501743 3.0 0.0699 Sig20413 9930.0 8.646E-06 Supelco 23462 4.0 0.0100 Sig20424 2089.9 1.649E-06 Supelco 23462 4.0 0.0100 Sig20441 1822.9 1.649E-06 Supelco 23462 4.0 0.0100 Sig20488 1955.4 1.649E-06 Supelco 23462 4.0 0.0100 Sig20489 2054.2 1.649E-06 Supelco 501743 4.0 0.0699 Sig20421 12970.9 1.153E-05 Supelco 23462 5.0 0.0100 Sig20415 2140.8 2.062E-06 Supelco 23462 5.0 0.0100 Sig20439 2638.8 2.062E-06 Supelco 23462 5.0 0.0100 Sig20444 2131.7 2.062E-06 Supelco 23462 5.0 0.0100 Sig20490 2442.0 2.062E-06 Supelco 501743 5.0 0.0699 Sig20412 15413.6 1.441E-05 Supelco 501743 5.0 0.0699 Sig20423 14922.9 1.441E-05 Supelco 501743 5.0 0.0699 Sig20440 14452.9 1.441E-05

73
Table A.4: GC calibration data for methane.
Source Inj. Vol/
mL mol-frac
Signal File
Area Count·s CH4 / mol
Methane 2.0 0.06 0.99 Sig20785 13927.8 2.474E-06 Methane 2.0 0.10 0.99 Sig20784 20698.1 4.123E-06 Methane 2.0 0.20 0.99 Sig20776 38663.9 8.246E-06 Methane 2.0 0.20 0.99 Sig20782 43976.8 8.246E-06 Methane 2.0 0.30 0.99 Sig20779 63194.3 1.237E-05 Methane 2.0 0.40 0.99 Sig20783 79915.4 1.649E-05 Methane 2.0 0.50 0.99 Sig20781 104671.0 2.062E-05 Methane 2.0 0.50 0.99 Sig20772 107570.0 2.062E-05 Methane 2.0 0.60 0.99 Sig20780 114700.0 2.474E-05 Methane 2.0 0.80 0.99 Sig20778 165943.0 3.299E-05 Methane 2.0 1.00 0.99 Sig20775 199526.0 4.123E-05 Methane 2.0 1.00 0.99 Sig20771 202311.0 4.123E-05 Supelco 23462 0.50 0.0099 Sig20418 982.1 2.062E-07 Supelco 23462 0.50 0.0099 Sig20417 1068.0 2.062E-07 Supelco 23462 1.00 0.0099 Sig20442 1729.0 4.082E-07 Supelco 23462 1.00 0.0099 Sig20282 1907.9 4.082E-07 Supelco 23462 2.00 0.0099 Sig20422 3617.4 8.164E-07 Supelco 23462 3.00 0.0099 Sig20416 5158.9 1.225E-06 Supelco 23462 4.00 0.0099 Sig20441 6166.8 1.633E-06 Supelco 23462 4.00 0.0099 Sig20488 6505.3 1.633E-06 Supelco 23462 4.00 0.0099 Sig20489 6826.4 1.633E-06 Supelco 23462 5.00 0.0099 Sig20444 7185.0 2.041E-06 Supelco 23462 4.00 0.0099 Sig20424 7197.2 1.633E-06 Supelco 23462 5.00 0.0099 Sig20415 7223.0 2.041E-06 Supelco 23462 5.00 0.0099 Sig20490 7895.8 2.041E-06 Supelco 23462 5.00 0.0099 Sig20439 8954.3 2.041E-06 Supelco 501743 0.20 0.0450 Sig20397 1930.8 3.711E-07 Supelco 501743 0.50 0.0450 Sig20411 4081.2 9.277E-07 Supelco 501743 0.50 0.0450 Sig20396 4400.8 9.277E-07 Supelco 501743 1.00 0.0450 Sig20425 7445.1 1.855E-06 Supelco 501743 1.00 0.0450 Sig20398 8589.5 1.855E-06 Supelco 501743 1.00 0.0450 Sig20392 9390.6 1.855E-06 Supelco 501743 2.00 0.0450 Sig20443 11499.6 3.711E-06 Supelco 501743 2.00 0.0450 Sig20395 18009.0 3.711E-06 Supelco 501743 3.00 0.0450 Sig20413 21712.5 5.566E-06 Supelco 501743 3.00 0.0450 Sig20393 25724.3 5.566E-06 Supelco 501743 4.00 0.0450 Sig20421 27650.7 7.422E-06 Supelco 501743 5.00 0.0450 Sig20440 30921.0 9.277E-06 Supelco 501743 5.00 0.0450 Sig20423 32135.1 9.277E-06 Supelco 501743 5.00 0.0450 Sig20412 38093.8 9.277E-06

74
Table A.5: GC calibration data for carbon dioxide.
Source Inj. Vol/
mL mol-frac
Signal File
Area Count·s CO2 / mol
CO2 4.0 1.00 0.9999 Sig20030 72777.8 4.0820E-05 CO2 4.0 1.00 0.9999 Sig20031 69958.9 4.0820E-05 CO2 4.0 0.10 0.9999 Sig20032 6873.3 4.0820E-06 CO2 4.0 0.10 0.9999 Sig20033 6646.3 4.0820E-06 CO2 4.0 1.00 0.9999 Sig20034 69815.7 4.0820E-05 CO2 4.0 0.50 0.9999 Sig20037 36362.1 2.0410E-05 Mix 7 1.00 0.303 Sig20069 21650.6 1.2493E-05 Mix 7 0.10 0.303 Sig20070 2225.6 1.2493E-06 Mix 8 1.00 0.625 Sig20224 43801.5 2.5770E-05 Mix 8 0.10 0.625 Sig20225 5139.4 2.5770E-06 Mix 8 0.02 0.625 Sig20226 1753.2 5.1540E-07 Mix 8 0.20 0.625 Sig20230 9638.3 5.1540E-06 Mix 8 0.06 0.625 Sig20232 3346.3 1.5462E-06 Mix 8 0.04 0.625 Sig20233 2710.1 1.0308E-06 Mix 8 0.10 0.625 Sig20234 5167.6 2.5770E-06 Supelco 501743 1.00 0.1497 Sig20392 10168.9 6.1725E-06 Supelco 501743 3.00 0.1497 Sig20393 28148.6 1.8517E-05 Supelco 501743 2.00 0.1497 Sig20395 19333.4 1.2345E-05 Supelco 501743 0.50 0.1497 Sig20396 5118.6 3.0862E-06 Supelco 501743 0.20 0.1497 Sig20397 2160.7 1.2345E-06 Supelco 501743 1.00 0.1497 Sig20398 10037.7 6.1725E-06 Supelco 501743 0.50 0.1497 Sig20411 4684.8 3.0862E-06 Supelco 501743 3.00 0.1497 Sig20413 24301.2 1.8517E-05 Supelco 501743 4.00 0.1497 Sig20421 31201.7 2.4690E-05 Supelco 23462 5.00 0.0100 Sig20415 2489.2 2.0616E-06 Supelco 23462 3.00 0.0100 Sig20416 1831.1 1.2370E-06 Supelco 23462 2.00 0.0100 Sig20395 1129.5 8.2465E-07 Supelco 501743 5.00 0.1497 Sig20423 44346.7 3.0862E-05 Supelco 23462 4.00 0.0100 Sig20424 2378.0 1.6493E-06 Supelco 501743 1.00 0.1497 Sig20425 8335.8 6.1725E-06 Supelco 23462 5.00 0.0100 Sig20439 3147.8 2.0616E-06 Supelco 501743 5.00 0.1497 Sig20440 34345.5 3.0862E-05 Supelco 501743 2.00 0.1497 Sig20443 12350.2 1.2345E-05 Supelco 501743 1.00 0.1497 Sig20961 10255.3 6.1725E-06 Supelco 501743 0.50 0.1497 Sig20962 5217.9 3.0862E-06 Supelco 23462 4.00 0.0100 Sig20441 1995.3 1.6493E-06 Supelco 23462 5.00 0.0100 Sig20444 2235.7 2.0616E-06 Supelco 23462 4.00 0.0100 Sig20488 1875.3 1.6493E-06 Supelco 23462 4.00 0.0100 Sig20489 1987.0 1.6493E-06 Supelco 23462 5.00 0.0100 Sig20490 2324.7 2.0616E-06 CO2 4.0 1.00 0.9999 Sig20850 69482.9 4.1232E-05 CO2 4.0 0.10 0.9999 Sig20851 7390.1 4.1232E-06 CO2 4.0 0.04 0.9999 Sig20852 3477.8 1.6493E-06 CO2 4.0 0.20 0.9999 Sig20886 14671.6 8.2465E-06

75
Table A.6: GC calibration data for ethane.
Source Inj. Vol/
mL mol-frac
Signal File
Area Count·s C2H6 / mol
Supelco 23462 1 0.0101 Sig20282 1858.5 4.206E-07 Supelco 23462 5 0.0101 Sig20415 7921.7 2.103E-06 Supelco 23462 3 0.0101 Sig20416 5592.2 1.262E-06 Supelco 23462 2 0.0101 Sig20422 3821.1 8.411E-07 Supelco 23462 4 0.0101 Sig20424 7877.6 1.682E-06 Supelco 23462 5 0.0101 Sig20439 9911.5 2.103E-06 Supelco 23462 1 0.0101 Sig20442 1992.6 4.206E-07 Supelco 23462 5 0.0101 Sig20444 7841.0 2.103E-06 Supelco 23462 4 0.0101 Sig20488 7244.6 1.682E-06 Supelco 23462 4 0.0101 Sig20489 7460.7 1.682E-06 Supelco 23462 5 0.0101 Sig20490 8917.5 2.103E-06 Supelco 23462 1 0.0101 Sig21088 2065.3 4.206E-07 Supelco 23462 1 0.0101 Sig21089 1934.8 4.206E-07 Supelco 23462 1 0.0101 Sig21090 2103.4 4.206E-07

76
Table A.7: Integrated peak area for gas syringe samples runs A to N. Run Sample Carrier H2 CO CH4 CO2 C2H6 ID ID Flow Data File Method counts·s A GSS_1 7.7 Sig21341.D Air02 304934 1199 37139 13130 A GSS_2 7.5 Sig21342.D Air02 290074 1056 37515 15228 A GSS_3 8 Sig21343.D Air02 297719 860 32516 16067 A GSS_4 7.5 Sig21344.D Air03 309836 855 33811 15564 1667 B GSS_5 7.4 Sig21345.D Air02 301683 1030 38702 15075 B GSS_6 7.4 Sig21346.D Air02 296257 1008 38130 15042 B GSS_7 7.5 Sig21347.D Air03 297996 938 38425 15076 3185 C GSS_8 7.5 Sig21348.D Air02 293585 817 37917 15210 C GSS_9 7.5 Sig21349.D Air02 299931 699 38350 15657 C GSS_10 7.4 Sig21350.D Air03 297900 682 38198 15216 3658 D GSS_11 7.5 Sig21351.D Air02 281583 1437 44790 14875 D GSS_12 7.4 Sig21352.D Air02 277125 1323 43655 14716 D GSS_13 7.5 Sig21353.D Air03 279557 1302 44199 15201 5229 E GSS_14 7.5 Sig21354.D Air02 293821 998 41169 15272 E GSS_15 7.5 Sig21355.D Air02 288967 954 40495 15164 E GSS_16 7.5 Sig21356.D Air03 287482 1011 40519 15292 4813 F GSS_17 7.6 Sig21357.D Air02 312407 529 33803 15009 F GSS_18 7.5 Sig21358.D Air02 306783 548 36898 15387 F GSS_19 7.4 Sig21359.D Air03 294520 652 38348 15910 3019 G GSS_20 7.4 Sig21360.D Air02 299229 615 38603 15587 G GSS_21 7.4 Sig21361.D Air02 294420 582 42057 16012 G GSS_22 7.4 Sig21362.D Air03 295505 630 38721 15452 3985 H GSS_23 7.4 Sig21363.D Air02 312496 641 35351 14964 H GSS_24 7.4 Sig21364.D Air02 303634 711 35910 15686 H GSS_25 7.4 Sig21366.D Air03 298589 434 34957 15405 3858 I GSS_26 7.5 Sig21367.D Air02 307143 634 37966 14639 I GSS_28 7.5 Sig21369.D Air02 295160 372 39710 14597 I GSS_29 7.5 Sig21370.D Air03 295344 514 36378 14168 3680 J GSS_30 6.2 Sig21377.D Air02 365363 365 25504 14171 J GSS_31 6.9 Sig21378.D Air02 324053 864 31835 14232 J GSS_32 7 Sig21379.D Air03 294718 38911 14674 2819 K GSS_33 7.1 Sig21380.D Air02 278042 1169 42863 14291 K GSS_34 7.1 Sig21381.D Air02 269588 1095 45921 15240 K GSS_35 7.2 Sig21382.D Air03 279855 1104 47679 15003 5417 L GSS_36 7.4 Sig21383.D Air02 323618 31441 15995 L GSS_37 7.3 Sig21384.D Air02 320600 381 35738 13154 L GSS_38 7.4 Sig21385.D Air03 327416 36550 13376 2829 M GSS_39 7.4 Sig21386.D Air02 270416 837 43186 13553 M GSS_40 7.4 Sig21387.D Air02 279065 877 43283 14444 M GSS_41 7.4 Sig21388.D Air03 283138 869 47902 15126 4235 N GSS_42 6.9 Sig21393.D Air02 257937 40541 N GSS_43 7 Sig21394.D Air02 356274 26581 14400 N GSS_44 7.1 Sig21395.D Air03 321206 30877 16059 2888

77
Table A.8: Integrated peak area for gas syringe samples runs O to Q. Run Sample Carrier H2 CO CH4 CO2 C2H6 ID ID Flow Data File Method counts·s O GSS_45 7.2 Sig21396.D Air02 304937 655 38673 15199 O GSS_46 7.3 Sig21397.D Air02 295494 651 38203 15446 O GSS_47 7.3 Sig21399.D Air03 295529 594 38572 15027 3945 P GSS_48 7.3 Sig21400.D Air02 292793 1233 46571 15619 P GSS_49 7.4 Sig21401.D Air02 282176 1117 44140 14576 P GSS_50 7.4 Sig21402.D Air03 286623 1237 46755 15281 3626 Q GSS_51 7.4 Sig21403.D Air02 322054 473 37293 15641 Q GSS_52 7.4 Sig21404.D Air02 318137 37507 15578 Q GSS_53 7.4 Sig21406.D Air03 309303 636 36283 15890 3220
Table A.9: Mean reactor thermocouple (RTC) temperatures, mean reactor pressure.
Run ID
RTC1 T/°C
RTC2 T/°C
RTC3 T/°C
RTC4 T/°C
RTC5 T/°C
RTC6 T/°C
RTC7 T/°C
RTC8 T/°C
Inlet P / psig
Outlet P / psig
Mean Rctr T/°C
A 347.4 546.2 708.7 717.5 691.7 718.1 712.9 687.8 3496.8 3481.4 709.8 B 352.6 517.5 687.8 701.5 677.9 701.4 698.6 674.3 3498.1 3484.9 693.4 C 351.2 520.2 668.9 677.6 656.1 678.0 674.7 653.8 3496.2 3481.6 671.0 D 342.8 525.0 655.2 663.4 642.8 663.8 660.5 639.6 3493.5 3479.9 657.1 E 346.0 503.2 651.7 664.3 644.4 664.2 661.1 640.5 3496.0 3482.5 657.2 F 335.3 482.1 623.9 634.5 616.7 634.6 631.5 614.2 3492.7 3480.7 628.2 G 346.7 523.1 667.8 678.0 655.3 678.3 674.6 652.7 3442.4 3428.8 670.8 H 365.6 496.1 653.5 677.9 656.6 677.7 675.0 654.0 3492.5 3478.8 668.2 I 351.6 528.4 656.9 663.5 642.6 664.1 660.7 641.4 3460.7 3449.5 657.6 J 324.0 533.4 692.9 700.5 674.3 701.4 697.9 674.0 3500.8 3488.0 693.4 K 341.2 525.8 666.2 677.5 653.8 677.7 674.9 652.0 3500.4 3487.2 670.0 L 343.8 511.4 680.2 700.7 675.3 701.2 698.3 674.9 3501.2 3486.2 691.1 M 340.6 562.6 673.6 676.9 651.8 678.0 674.6 651.8 3464.4 3460.1 671.0 N 343.5 512.7 668.6 677.3 654.6 677.8 674.7 654.2 3494.4 3480.5 670.6 O 347.8 525.8 668.0 677.4 654.2 677.7 674.8 653.2 3492.5 3479.6 670.5 P 344.4 550.7 693.1 700.6 674.2 701.3 698.2 672.9 3495.5 3482.3 693.5 Q 352.2 498.0 648.5 663.7 642.6 663.9 661.1 641.4 3509.9 3494.3 656.0

78
Table A.10: Inlet mass flow rates.
Run ID
Run Start
Run Finish
Run Duration /
min
Initial H2O /
kg
Final H2O /
kg
H2O Rate / g·min-1
Initial EtOH / g
Final EtOH / g
EtOH Rate/
g·min-1 A 16:35 18:45 130 13.95 12.75 11.43 -24 -122 0.93 B 19:50 21:25 95 11.71 10.34 16.12 -196 -328 1.55 C 21:45 23:25 100 10.1 8.96 11.40 -330 -420 0.90 D 23:40 1:24 104 8.63 7.86 9.17 -450 -580 1.55 E 1:30 3:28 118 7.36 6.12 14.09 -636 -772 1.55 F 14:50 16:33 103 13.92 13.07 11.33 -14 -82 0.91 G 16:43 18:25 102 12.9 11.76 11.40 -86 -178 0.92 H 18:40 20:36 116 11.41 9.34 19.71 -184 -278 0.90 I 20:53 23:04 127 8.99 7.87 9.33 -288 -350 0.52 J 19:15 20:50 95 13.87 13.17 9.33 -8 -54 0.61 K 21:05 22:47 102 12.85 11.83 11.33 -76 -258 2.02 L 0:35 2:18 103 10.93 9.7 13.67 -270 -322 0.58 M 2:35 4:50 135 9.41 8.83 6.44 -362 -444 0.91 N 15:22 17:19 117 7.9 6.69 11.52 -2 -20 0.17 O 17:26 19:18 112 12.82 11.78 11.56 -38 -122 0.93 P 19:30 21:15 105 11.34 10.64 9.33 -172 -288 1.55 Q 21:30 23:15 105 10.45 9.02 13.62 -288 -350 0.59

79
Table A.11: West test meter data and mean effluent gas flow rate by experiment.
Run ID Time
Vol / L
t / min
Gas Rate /
L min-1
Mean Gas
Rate/ L min-1
Run ID Time
Vol / L
t / min
Gas Rate /
L min-1
Mean Gas
Rate/ L min-1
A 17:08 9 4.51 2.00 K 21:33 9 2.08 4.33 A 17:34 9 4.25 2.12 K 21:43 9 2.23 4.04 A 17:49 9 4.14 2.18 K 21:52 9 2.25 4.00 A 18:04 9 3.89 2.31 K 22:05 9 2.07 4.35 A 18:26 9 3.95 2.28 K 22:22 9 2.15 4.19 A 18:41 9 3.94 2.29 2.19 K 22:34 9 2.13 4.22 B 20:35 9 2.58 3.48 K 22:43 9 2.21 4.07 4.17 B 20:55 9 2.53 3.55 L 1:08 9 6.64 1.35 B 21:11 9 2.54 3.54 L 1:20 9 5.87 1.53 B 21:19 9 2.56 3.51 3.52 L 1:35 9 6.04 1.49 C 22:25 12 5.83 2.06 L 1:46 9 6.33 1.42 C 22:45 9 4.36 2.06 L 2:04 9 6.53 1.38 C 23:06 9 4.53 1.99 L 2:13 6 4.38 1.37 1.42 C 23:21 9 4.59 1.96 2.02 M 3:37 9 4.88 1.85 D 0:21 9 2.82 3.19 M 3:53 12 6.54 1.83 D 0:34 9 2.81 3.20 M 4:07 12 5.97 2.01 D 1:04 9 2.82 3.19 M 4:22 12 6.33 1.90 D 1:18 9 2.84 3.17 3.19 M 4:32 12 6.34 1.89 E 2:15 9 2.90 3.11 M 4:44 9 4.70 1.91 1.90 E 2:49 9 2.72 3.31 N 16:28 3 8.98 0.33 E 3:19 9 2.79 3.23 3.22 N 16:40 3 6.01 0.50 F 15:24 9 4.39 2.05 N 16:57 4.5 9.90 0.45 F 15:44 9 4.17 2.16 N 17:15 6 13.74 0.44 0.43 F 15:59 9 4.16 2.17 O 17:55 9 4.25 2.12 F 16:26 9 4.21 2.14 2.13 O 18:06 9 4.32 2.08 G 17:16 9 4.46 2.02 O 18:21 12 6.17 1.95 G 17:35 9 4.15 2.17 O 18:34 9 4.56 1.97 G 17:47 9 4.35 2.07 O 18:51 12 6.00 2.00 G 18:02 9 4.44 2.03 O 19:04 9 4.53 1.98 G 18:18 9 4.48 2.01 2.06 O 19:17 18 8.92 2.02 2.02 H 19:08 9 4.05 2.22 P 20:11 9 2.76 3.26 H 19:24 9 3.89 2.31 P 20:25 15 4.79 3.13 H 20:01 9 4.72 1.91 P 20:32 6 1.85 3.25 H 20:12 9 4.15 2.17 P 20:43 12 3.70 3.25 H 20:25 9 4.08 2.20 2.16 P 20:54 12 3.78 3.18 I 21:56 6 5.30 1.13 P 21:10 12 3.81 3.15 3.20 I 22:17 6 4.88 1.23 Q 21:55 3 2.71 1.11 I 22:47 6 5.14 1.17 1.18 Q 22:11 6 4.73 1.27 J 19:53 9 6.38 1.41 Q 22:24 6 4.26 1.41 J 20:06 9 5.83 1.54 Q 22:35 9 6.13 1.47 J 20:25 9 6.01 1.50 Q 22:51 12 8.22 1.46 J 20:37 9 6.33 1.42 Q 23:04 9 6.48 1.39 1.35 J 20:49 6 4.56 1.31 1.44

80
Table A.12: Liquid effluent collection.
Run ID Sample ID Time
Sample Time / min Mass / g Q / g·min-1
Q Mean / g·min-1
A LS200604141725 17:25 16 176 11.00 A LS200604141754 17:54 15 172 11.47 11.23 B LS200604142039 20:39 11 183 16.64 B LS200604142101 21:01 10 176 17.60 17.12 C LS200604142245 22:45 18.5 204 11.03 C LS200604142312 23:12 17 178 10.47 10.75 D LS200604150046 0:46 24 209 8.71 D LS200604150112 1:12 20 180 9.00 8.85 E LS200604150234 2:34 14 186 13.29 E LS200604150309 3:09 13 204 15.69 14.49 F LS200604151546 15:46 18 191 10.61 F LS200604151618 16:18 16 174 10.88 10.74 G LS200604161738 17:38 16 175 10.94 G LS200604151809 18:09 16 176 11.00 10.97 H LS200604151940 19:40 9.5 205 21.58 omitted H LS200604152013 20:13 10 178 17.80 H LS200604152027 20:27 10 178 17.80 17.80 I LS200604152122 21:22 18 172 9.56 I LS200604152148 21:48 19 162 8.53 9.04 J LS200604162016 20:16 20 184 9.20 J LS200604162038 20:38 12 155 12.92 11.06 K LS200604162155 21:55 15 172 11.47 K LS200604162229 22:29 16 181 11.31 11.39 L LS200604170126 1:26 14 189 13.50 L LS200604170152 1:52 15 201 13.40 13.45 M LS200604170413 4:13 32 202 6.31 M LS200604170446 4:46 33 200 6.06 6.19 N LS200604171632 16:32 16 186 11.63 N LS200604171659 16:59 18 200 11.11 11.37 O LS200604171827 18:27 16 178 11.13 O LS200604171858 18:58 16 184 11.50 11.31 P LS200604172033 20:33 21 183 8.71 P LS200604172105 21:05 21 193 9.19 8.95 Q LS200604172226 22:26 14 193 13.79 Q LS200604172255 22:55 16 212 13.25 13.52

81
Table A.13: Calculated heater duty by zone.
Run ID
DOE Line T/K
Zone 1 / Watts
Zone 2 / Watts
Zone 3 / Watts
Zone 4 / Watts
Total / Watts
A 13 982.9 990 468 430 609 2496 B 8 966.6 1220 405 408 579 2613 C 11 944.2 922 399 374 572 2267 D 3 930.3 876 390 368 564 2198 E 7 930.3 1112 352 363 544 2372 F 12 901.4 931 343 335 525 2135 G 10 944.0 950 386 369 573 2278 H 17 941.3 1280 378 393 553 2603 I 1 930.7 802 402 366 570 2139 J 2 966.5 918 462 409 618 2407 K 15 943.2 1019 407 392 560 2378 L 6 964.3 1109 454 419 595 2577 M 16 944.1 640 437 371 580 2028 N 14 943.7 924 418 386 573 2300 O 9 943.6 956 406 390 562 2314 P 4 966.6 897 459 414 602 2372 Q 5 929.1 1012 392 380 546 2331

82
REFERENCES
1. Perry, R. H.; Green, D. W.; Maloney, J. O., Perry's chemical engineers' handbook. Sixth ed.; McGraw-Hill: New York, 1984. 2. API Ethanol Fact Sheet. http://www.api.org/aboutoilgas/otherfuels/upload/Ethanol_Fact_Sheet_07_24_07.pdf (December 4, 2007), 3. Smith, J. M.; Ness, H. C. V.; Abbott, M. M., Introduction to chemical engineering thermodynamics. Fifth ed.; McGraw-Hill: New York, 1996. 4. Poling, B. E.; Prausnitz, J. M.; O'Connell, J. P., The properties of gases and liquids. Fifth ed.; McGraw-Hill: New York, 2000. 5. Taylor, J. D.; Herdman, C. M.; Wu, B. C.; Wally, K.; Rice, S. F., Hydrogen production in a compact supercritical water reformer. International Journal of Hydrogen Energy 2003, 28, 1171-1178. 6. Lee, S.; Lanterman, H. B.; Wenzel, J. E.; Edwards, N.; Adams, A.; Wootton, J.; Garcia, A., Noncatalytic direct reformation of JP-8 fuel in supercritical water. Preprints - American Chemical Society, Division of Petroleum Chemistry 2006, 51, 487-490. 7. Haryanto, A.; Fernando, S.; Murali, N.; Adhikari, S., Current status of hydrogen production techniques by steam reforming of ethanol: a review. Energy & Fuels 2005, 19, 2098-2106. 8. Fatsikostas, A. N.; Verykios, X. E., Reaction network of steam reforming of ethanol over Ni-based catalysts. Journal of Catalysis 2004, 225, 439-452. 9. Morgenstern, D. A.; Fornango, J. P., Low-temperature reforming of ethanol over copper-plated raney nickel: a new route to sustainable hydrogen for transportation. Energy & Fuels 2005, 19, 1708-1716. 10. Deluga, G. A.; Salge, J. R.; Schmidt, L. D.; Verykios, X. E., Renewable Hydrogen from Ethanol by Autothermal Reforming. Science 2004, 303, (5660), 993-997. 11. Cavallaro, S., Ethanol steam reforming on Rh/Al2O3 catalysts. Energy & Fuels 2000, 14, 1195-1199. 12. Klouz, V.; Fierro, V.; Denton, P.; Katz, H.; Lisse, J. P.; Bouvot-Mauduit, S.; Mirodatos, C., Ethanol reforming for hydrogen production in a hybrid electric vehicle: process optimization. Journal of Power Sources 2002, 105, 26-34. 13. Caillot, T.; Gélin, P.; Dailly, J.; Gauthier, G.; Cayron, C.; Laurencin, J., Catalytic steam reforming of methane over La0.8Sr0.2CrO3 based Ru catalysts. Catalysis Today 2007, 128, 264-268. 14. Arita, T.; Nakahara, K.; Nagami, K.; Kajimotoa, O., Hydrogen generation from ethanol in supercritical water without catalyst. Tetrahedron Letters 2003, 44, 1083-1086. 15. Ruettinger, W.; Ilinich, O., Water gas shift reaction. In Encyclopedia of Chemical processing, Lee, S., Ed. Taylor & Francis: New York, 2006; Vol. 5, pp 3205-3215. 16. Chase, M. W.; Davies, C. A.; Downey, J. R.; Frurip, D. J.; McDonald, R. A.; Syverud, A. N., JANAF thermochemical tables, third edition. J. Phys. Chem. Ref. Data 1985, 14, (Suppl. 1), 1-1856. 17. Picou, J.; Wenzel, J.; Lanterman, H. B.; Lee, S., Kinetics of non-catalytic water gas shift reaction In a supercritical water medium. In American Insititute of Chemical Engineers Spring Meeting, New Orleans, 2008.

83
18. IAPWS Release on the pressure along the melting and the sublimation curves of ordinary water substance; The International Association for the Properties of Water and Steam: Milian, Italy, September, 1993; pp 1-4. 19. IAPWS Release on the state dielectric constant of ordinary water substance for temperatures from 238 K to 873 K and pressures up to 1000 MPa; The International Association for the Properties of Water and Steam: September, 1997; pp 1-9. 20. Stryjek, R.; Vera, J. H., PRSV: an improved Peng-Robinson equation of state for pure compounds and mixtures. . Canadian Journal of Chemical Engineering 1986, 64, 323-333. 21. Stryjek, R.; Vera, J. H., PRSV2: a cubic equation of state for accurate vapor-liquid equilibria calculations. . Canadian Journal of Chemical Engineering 1986, 64, 820-826. 22. Abu-Eishah, S., Modification of the predictive capability of the PRSV-2 equation of state for critical volumes of binary mixtures. Fluid Phase Equilibria 1999, 157, 1-16. 23. Hicks, C. P.; Young, C. L., The gas-liquid critical properties of binary mixtures. Chem. Rev. 1975, 79, 119-175. 24. McHugh, M. A.; Krukonis, V. J., Supercritical fluid extraction: principles and practice. Butterworths: Boston, 1986; p 507. 25. Kolář, P.; Kojima, K., Prediction of critical points in multicomponent systems using the PSRK group contribution equation of state. Fluid Phase Equilibria 1996, 118, 175-200. 26. Brunner, E.; Thies, M. C.; Schneider, G. M., Fluid mixtures at high pressures: Phase behavior and critical phenomena for binary mixtures of water with aromatic hydrocarbons. Journal of Supercritical Fluids 2006, 39, 160-173. 27. Brunner, E., Fluid mixtures at high pressures: IX. Phase separation and critical phenomena in 23 (n-alkane + water) mixtures. J. Chem. Thermodyn. 1990, 22, (4), 335-353. 28. Shmonov, V. M.; Sadus, R. J.; Franck, E. U., High-pressure phase equilibria and supercritical pVT data of the binary water + methane mixture to 723 K and 200 MPa. J. Phys. Chem. 1993, 97, 9054-9059. 29. Sadus, R. J., High pressure phase behaviour of multicomponent fluid mixtures. Elsevier: Amsterdam, 1992; p 392. 30. Heidemann, R. A.; Khalil, A. M., The calculation of critical points. AIChE Journal 1980, 26, 769-779. 31. Boukis, N.; Diem, V.; Habicht, W.; Dinjus, E., Methanol reforming in supercritical water. Ind. Eng. Chem. Res. 2003, 42, 728-735. 32. Factor, M. J.; Lanterman, H. B.; Wenzel, J. E.; Lee, S., Use of haynes alloy 230 for supercritical Water reactors. In American Insititute of Chemical Engineers Annual Meeting Salt Lake City Utah, 2007. 33. Kritzer, P.; Boukis, N.; Dinjus, E., The corrosion of nickel-base alloy 625 in sub- and supercritical aqueous solutions of oxygen: a long time study. Journal of Materials Science Letters 1999, 18, 1845-1847. 34. Technical Bulletin, SMC-063; Special Metals Corporation: New Hartford, NY, January 2006, 2006. 35. Lee, S., Methane and its derivatives. Marcel Dekker: New York, 1997; p 415.

84
36. Box, G. E. P.; Hunter, W. G.; Hunter, J. S., Statistics for experimenters : an introduction to design, data analysis, and model building Wiley: New York, 1978; p 653. 37. Detector Systems. In HP 5980A Gas Chromatograph Reference Manual, 8th ed.; Hewlett-Packard Company: Avondale, Pennsylvania, 1986; Vol. 1. 38. Lee, S.; Lanterman, H.; Wenzel, J.; Picou, J.; Factor, M.; Leavitt, L., Global kinetics of supercritical water reformation of JP-8 fuels. Preprints-American Chemical Society, Division of Petroleum Chemistry 2006, 51, 521-523.

85
VITA
Jonathan Evar Wenzel was born on November 10, 1975 in Belvidere, Illinois to
Kurt and Donna Wenzel. During Jonathan’s childhood, his family lived in multiple
locations throughout the Midwest including Rockford and Mt. Morris in Illinois,
Hutchinson, Kansas, and Chillicothe, Missouri. Jonathan graduated in 1994 from
Chillicothe High School. He then went to college at the University of Missouri—
Columbia where he received his Bachelor’s of Science in Chemical Engineering in 1999.
Jonathan currently works as an Assistant Research Engineer for Dr. Sunggyu Lee in the
Department of Chemical and Biological Engineering at the Missouri University of
Science and Technology in Rolla, Missouri.