kinetics of the nickel-catalyzed …...kinetics of the nickel-catalyzed hydrogenation of ethylene...
TRANSCRIPT
Instructions for use
Title KINETICS OF THE NICKEL-CATALYZED HYDROGENATION OF ETHYLENE AND ITS VARIATION WITHCATALYST POISONING
Author(s) MATSUZAKI, Isao; TADA, Akio; NAKAJIMA, Tsuyoshi
Citation JOURNAL OF THE RESEARCH INSTITUTE FOR CATALYSIS HOKKAIDO UNIVERSITY, 16(2), 543-554
Issue Date 1968-08
Doc URL http://hdl.handle.net/2115/24878
Type bulletin (article)
File Information 16(2)_P543-554.pdf
Hokkaido University Collection of Scholarly and Academic Papers : HUSCAP
J. Res. Inst. Catalysis, Hokkaido Univ., Vol. 16, No.2, pp. 543 to 554 (1968)
KINETICS OF THE NICKEL-CATALYZED HYDROGENATION OF ETHYLENE AND ITS VARIATION
WITH CATALYST POISONING
By
Isao MATSUZAKI*), Akio TADA**) and Tsuyoshi NAKAJIMAt)
(Received April 2, 1968)
Abstract
The reaction of the title has been investigated both theoretically and experimentally to
inspect the validity of the experimental result, obtained by MASUDA,3) that the order of
reaction is 0.7 in hydrogen and 0 in ethylene below optimum temperatures, and that of the
inference, drawn by MA TSUZAKI et al.6 ) on the premise of the HORIUTI-POLANYI's associative
mechanism being operative, that catalyst poisoning might inhibit unevently the constituent
elementary steps.
Theoretical treatment, with preliminary approval of both the experimental result and
premise mentioned above, has first been developed on the reaction at 50°C of ethylene and
hydrogen each of 10 mmHg initial partial pressure for the correlation of the hydrogen partial
pressure PH, the dependence, n, of the reaction rate upon PH and the degree of catalyst
poisoning, and then followed by an experimental check.
The theoretical results have been found to be in semi-quantitative agreement with the
experimental ones (i) that on clean catalyst n increases approximately from 0.8 to 1.0 as PH
decreases from 10 to 2 mmHg, and (ii) that increasing degree of catalyst poisoning causes n
to increase by about 0.3, hence the validities under study having been augmented.
Introduction
In 1934 HORIUTI and POLANYI1) put forward the associative mechanism,
as represented by Scheme (1), for the catalyzed hydrogenation of ethylene on metallic catalysts:
Ia C2H 4 -----> C2H 4 (a) I II
Ib J H (a) f -----> C2H S (a) t III
H2 -----> lH (a) .. , ............ '" J -----> C2H6 , ( 1 )
* ) Dept. of Chern., Faculty of Science, Hokkaido Univ., Sapporo, Japan
**) Present address: Chemical Process Engineering Department, Faculty of Technology,
Hokkaido Univ., Sapporo, Japan
t) Present address: Institute of Chemistry, Faculty of Fisheries, Hokkaido Univ., Hakodate,
Japan
543
544
1. MA TSUZAKI, A. T ADA and T. NAKAJIMA
where (a) denotes the adsorbed state and la, etc. signify each elementary step. In 1959 HORIUTI2
) developed the statistical mechanical theory of the associative mechanism for the nickel-catalyzed hydrogenation of ethylene, designating, with the aid of experimental data then available, the characteristic rate functions st' (la), etc. to each constituent step as follows:
st' (la) /> st' (lb), ~ (II), ~ (III); ~ (la) /> V -1356.6
st' (lb) = 2.0573 )( 10-18 )( lO-r- x PH (PE)0.525 P
-220.12
st' (II) = 2.4687 )( 1020 y. lO-r - )( (PHt 2 P
1092.3
.~ (III) = 2.4012)( 10-25 X 10--T X PHPEP ,
(2.1)
(2.2)
(2.3)
(2.4)
where st' (la), etc. are the forward unidirectional rate of step la, etc., respectively, which would be the case, if all steps of the associative mechanism but step la, etc. respectively were in equilibrium, V is the steady rate of the hydrogenation, viz. -dPHldt, PH and PE are the hydrogen and ethylene partial pressure respectively, and P is a common factor. The characteristic rate functions determine V and various associated reactions, e.g., isotopic exchange reactions among C2H 4, Hz and CZH 6, ortho-para conversion of hydrogen, H z-Dz exchange, etc. The latter reactions, which reveal different aspects of the catalyzed hydrogenation, are constructed of Sl: (lb), etc. according to the mechanism (1). The mechanism incorporated with the specification, eg., (2) of st' (lb) etc., will be called the structure of a steady reaction. This structure of the catalyzed reaction has been confirmed by a number of experimental results.7
,1l) However there has recently been reported as follows an experimental result by MASUDA3
) which deviates from the above structure. MASUDA3
) found with particular precaution against catalyst poisoning that
the order of reaction of the nickel-catalyzed hydrogenation of ethylene is 0.7 or zero with respect to hydrogen or ethylene partial pressure below the optimum temperature; this result fits in with a revised ~ (lb) expression st' (lb) =
k)( 1O-13566!r X (PH )0.7 (k: constant). This conclusion is qualitatively supported by recent results.4
,5)
It is practically inevitable that heterogeneous catalysts are more or less subject to the effect of poison; hence it is of significance to elucidate the effect of catalyst poisoning. With this end in view, the present authors investigated in the preceding paper6
) the effect of catalyst poisoning in the nickelcatalyzed deuteration of ethylene on the basis of the premise that the catalyzed hydrogenation of ethylene proceeds via the associative mechanism irrespective of the extent of poisoning: the conclusion was that catalyst poisoning exerts
Kinetics of the Nickel-Catalyzed Hydrogenation of Ethylene
greater inhibiting effect upon step III than upon step lb. This conclusion suggests the possibility that increasing degree of catalyst poisoning will shift the kinetics from that with step Ib controlling the rate to that with step III operating as the rate-determining step.
The present research was attempted to make an experimental check on the suitability of the above-mentioned revision of the ~ (Ib) expression and on the validity of the inference mentioned above concerning the shift of the ratedetermining step due to catalyst poisoning. It was advanced in the following order. First, with preliminary approval of both the above-mentioned MASUDA'S
experimental result and MATSUZAKI et al.'s premise, the reaction at 50°C of ethylene and hydrogen each of 10 mmHg initial partial pressure was treated theoretically, with the aid of the experimental result,7) for the correlation of PH, the dependence n of Von PH and the degree of catalyst poisoning. This theoretical correlation was then experimentally tested.
Theoretical
1. Variation of n with PH
The tentatively revised ~ (Ib) expression IS:
-1356.6 se (Ib) = 1.375 >< WI? x 1O~:r- x (PRO.?) P . (3 )
The simultaneous change of the value of the coefficient was made so that the optimum temperature, at which ~ (Ib) = ~ (III) holds, for the reaction of ethylene and hydrogen each of 10 mmHg partial pressure remained unaffected by the revision of the exponents of PH and PE •
The set of Eqs. (2. 1), (2.3), (2. 4) and (3) enables us to derive, as a function of PH, the values of V in the course of the reaction at 50°C of ethylene and hydrogen each of 10 mmHg initial partial pressure, the procedure of derivation having been described elsewhere. B) Table 1 shows the values of V together with those of other characteristic quantities of the above-mentioned reaction thus obtained.
The value of n is now determined graphically using the data of Table 1 as follows; according to the definition of n we have:
(k: constant)
Differentiating the logarithms of both sides of the above equation with respect to 10gPH :
n = dlog VjdlogPR , ( 4 )
which indicates that the value of n IS identical with the slope of the plot of
545
546
I. MATSUZAKI, A. TADA and T. NAKAJIMA
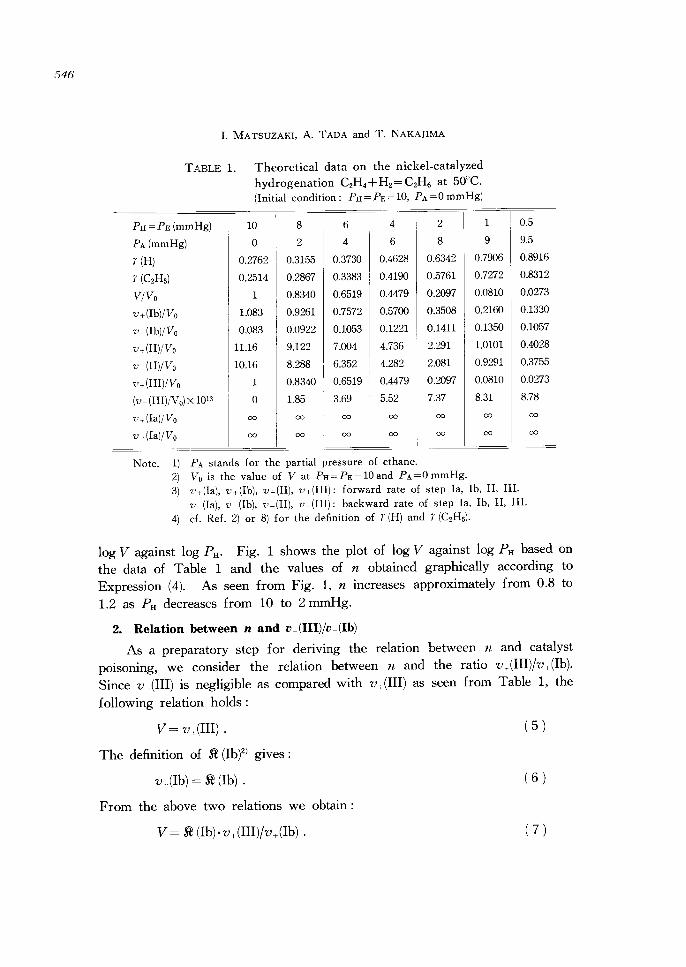
TABLE 1. Theoretical data on the nickel-catalyzed hydrogenation C2H 4 + H2 = C2HS at 50°C. (Initial condition: PH=PE=10, PA=OmmHg)
PH = PE (mmHg)
PA(mmHg)
r(H)
r (C2Hs)
ViVo
v+(lb)/Vo
v-(Ib)/Vo
10 8 6 4 2
o 2 4 6 8
0.2762 0.3155 0.3730 0.4628 0.6342
0.2514 0.2867 i 0.3383 0.4190 0.5761
1 0.8340 0.6519 0.4479 0.2097
1.083 0.9261 0.7572 0.5700 0.3508
0.083 0.0922 0.1053 0.1221 0.1411
v+(I1)/Vo 11.16 9.122 7.004 4.736
4.282
0.4479
5.52
2.291
2.081
0.2097
7.37
v-(II)/Vo 10.16 8.288 6.352
v + (I1I)/Vo 1 1 0.8340 0.6519
(v-(I1I)!Vo) X 1013 ! 0 1.85 3.69
v+(Ia)/Vo 00 00 00 00 00
v-(Ia)/Vo 00 00 00 00 00
Note. 1) PA stands for the partial pressure of ethane. 2) Vo is the value of V at PH = PE = 10 and P A = 0 mmHg.
1 0.5
9 9.5
0.7906 0.8916
0.7272 0.8312
0.0810 0.0273
0.2160 0.1330
0.1350 0.1057
1.0101 0.4028
0.9291 0.3755
0.0810 0.0273
8.31 8.78
00 00
00 00
3) v 7 (la), v+(lb), v,(II), v+(III): forward rate of step la, Ib, II, III. v--(Ia), v-(Ib), v-(II), v-(III): backward rate of step la, Ib, II, III.
4) d. Ref. 2) or 8) for the definition of r (H) and r (C2HS).
log V against log PH' Fig. 1 shows the plot of log V against log PH based on the data of Table 1 and the values of n obtained graphically according to Expression (4). As seen from Fig. 1, n increases approximately from 0.8 to 1.2 as PH decreases from 10 to 2 mmHg.
2. Relation between nand v+(III)/v+(Ib)
As a preparatory step for deriving the relation between n and catalyst poisoning, we consider the relation between n and the ratio vT(1II)jv+(1b). Since v_(II1) is negligible as compared with v+(II1) as seen from Table 1, the
following relation holds:
V = v+(III) . (5 )
The definition of ~ (1b)2) gives:
v+(1b) = ~ (1b) . (6 )
From the above two relations we obtain:
(7 )

1.7
Kinetics of the Nickel-Catalyzed Hydrogenation of Ethylene
0.5
log' PH (Fi< in mmHg)
1.0
m o
Fig. 1 log (VIVo) 1'S. log PH plotted with the data of Table 1 and the values of n evaluated graphically according to Expression (4).
From Expressions (3), (4) and (7) the following is readily derived:
n = O.7+dlog {v (III)/v, (Ib)}/dlog PH, (8 )
which indicates that it is the change of log {vT(III)/v+(Ib)} with log PH that is responsible for the change of n with PH mentioned in the preceding section.
3. Effect of catalyst poisoning on n
Consideration here is advanced on the basis of the same premIse that was adopted in the preceding paper,6) i. e., that on poisoned catalysts the ethylene hydrogenation also proceeds via the associative mechanism.
As is evident from the procedure of derivation described in the preceding section, Expression (8) can be applied also for the case with poisoned catalysts provided that the relation v+(III)> v_(III) holds. We have two separate experimental results, combination of which leads to the conclusion that v~(III)> v_(III) holds in the case in question: one is the result obtained by two of the
547
548
1. MA TSUZAKI, A. T ADA and T. NAKAJIMA
present authors8) that the deuterium atoms of deutero-substituted ethane ex
changed with neither hydrogen nor ethylene while nickel catalyst was kept, for about 27 hrs., in contact with a mixture of hydrogen, ethylene and deuterosubstituted ethane each of ca. 10 mmHg initial pressure, and the other is the result to be reported in this paper that such a contact gives rise to decrease in the catalytic activity by 60% of the initial value. It is therefore concluded that Expression (8) can be applied for the case with poisoned catalysts.
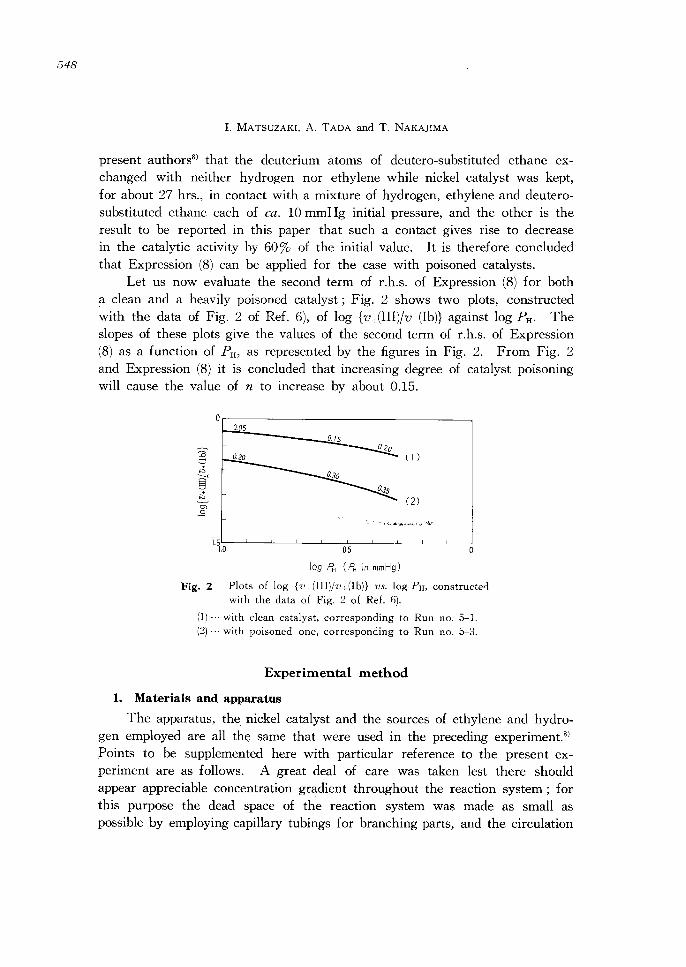
Let us now evaluate the second term of r.h.s. of Expression (8) for both a clean and a heavily poisoned catalyst; Fig. 2 shows two plots, constructed with the data of Fig. 2 of Ref. 6), of log {v,(III)jv_(Ib)} against log PH' The slopes of these plots give the values of the second term of r.h.s. of Expression (8) as a function of PH, as represented by the figures in Fig. 2. From Fig. 2 and Expression (8) it is concluded that increasing degree of catalyst poisoning will cause the value of n to increase by about 0.15.
0.05
(I)
(2)
T.5~~---L--~--~~~~ __ -L __ ~ __ L-~ 1.0 0.5
log PH (PH in mmHg)
Fig. 2 Plots of log {v_(III)jv+(Ib)} vs. log PH, constructe<:l with the data of Fig. 2 of Ref. 6).
(1) ... with clean catalyst, corresponding to Run no. 5-l. (2) ... with poisoned one, corresponding to Run no. 5-3.
Experimental method
1. Materials and apparatus
The apparatus, the nickel catalyst and the sources of ethylene and hydrogen employed are all the same that were used in the preceding experiment.8
)
Points to be supplemented here with particular reference to the present experiment are as follows. A great deal of care was taken lest there should appear appreciable concentration gradient throughout the reaction system; for this purpose the dead space of the reaction system was made as small as possible by employing capillary tubings for branching parts, and the circulation
Kinetics of the Nickel-Catalyzed Hydrogenation of Ethylene
velocity of the reacting mixture was controlled so as to keep the conversion, caused during one circulation of the reacting mixture through the reaction system, less than 0.1 % of the total amount of the conversion to be attained at the completion of the reaction.
The pressure change of the circulation system was followed by measuring the mercury level of manometer MJ (the notations specifying the parts of the apparatus are the same as in Ref. 8)) by means of a travelling microscope. That the manometer MJ functioned well without the sticking of the mercury was confirmed preliminarily by applying the manometer for measuring the pressure of hydrogen which was being evacuated slowly and steadily out of the circulation system.
2. Procedure
2. 1. Activation of the catalyst
Reaction vessel RV had been left disconnected from trap Tb for about four months, since the end of the preceding experiment8
) lest the catalyst should be rendered irreversibly poisoned due to the contact with the vapor of mercury condensed at trap TJ during the preceding experiment. The reaction vessel was first connected to trap TJ> evacuated to 10-6 mmHg and inserted in an electric furnace regulated at 300°C. Trap TJ was now immersed in methanol-dry ice mixture and hydrogen of about 20 mmHg introduced into the reaction system and circulated. Heating of the catalyst at 300°C in hydrogene lasted about 20 hrs. to complete recovery of the catalytic activity. Reactivation of used catalyat was effected by similar reduction.
2. 2. Run of reaction
The reaction system was evacuated to 10-6 rnmHg and the electric furnace replaced by a methanol-dry ice bath. Then the two 3-way taps connecting to trap TJ were positioned so that the gas could be circulated in the reaction system except the reaction vessel. Ethylene was first introduced into the reaction system precisely to 16.00 mmHg, which had been found to amount to 10.30 mmHg when expanded into the reaction vessel and to 11.30 mmHg with the reaction vessel immersed in a 50°C-oil bath, and condensed at capillary C by immersing C in liquid nitrogen. Then hydrogen was introduced in the same way and mixed with the ethylene slowly by removing the liquid nitrogen from capillary C. The mixture was expanded into the reaction vessel and circulated through the reaction vessel by switching the 3-way taps; it had been preliminarily confirmed that under this condition the progress of reaction was practically negligible.
549
550
1. MA TSUZAKI, A. T ADA and T. NAKAJIMA
The methanol-dry ice bath was now replaced by an oil bath regulated at 50°C and measurements of both the pressure of the reaction system and the electric resistance of the catalyst were continued to deep conversion. Then evacuation of the reaction vessel was conducted with the reaction vessel immersed in the methanol-dry ice bath, followed by repetition of another run of reaction in the same way as above. In such a manner several runs were successively carried out.
Results and Discussion
1. Observed pressure-time curves and V-PH curves uncorrected for catalyst poisoning
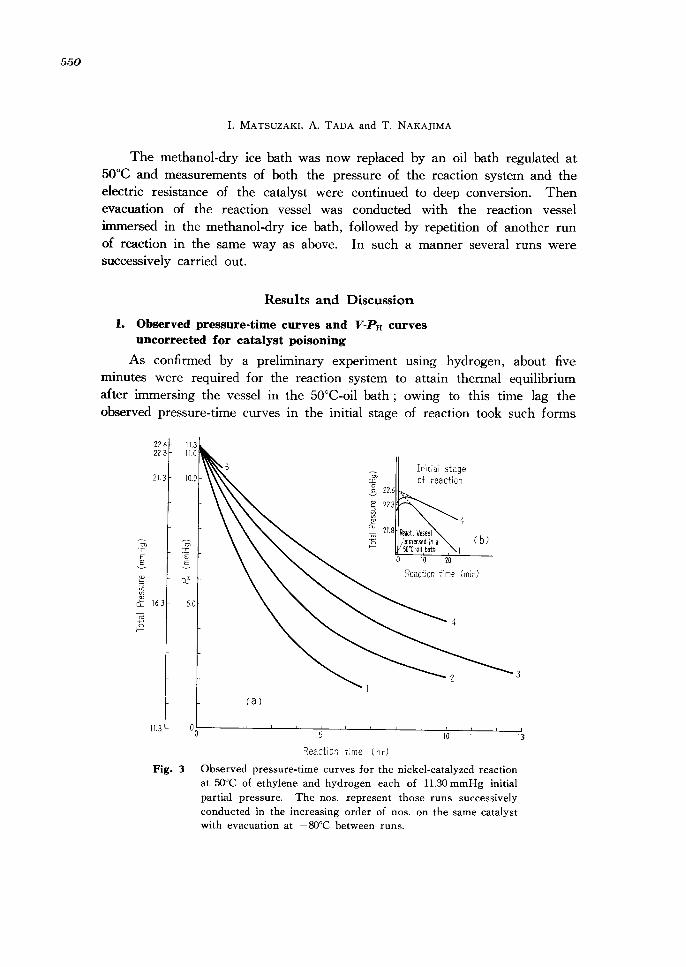
As confirmed by a preliminary experiment using hydrogen, about five minutes were required for the reaction system to attain thermal equilibrium after immersing the vessel in the 50°C-oil bath; owing to this time lag the observed pressure-time curves in the initial stage of reaction took such forms
0)
I E
~
'" co if> if> W
ct .;:; ~
22.6 22.3
21.3
16.3
1J
'" :r: E
~
Q"
5.0
(a)
Reaction time (hr)
Initial stage of reaction
( b)
Reaction time (min)
3
Fig. 3 Observed pressure-time curves for the nickel-catalyzed reaction at 50°C of ethylene and hydrogen each of 11.30 mmHg initial partial pressure. The nos. represent those runs successively conducted in the increasing order of nos. on the same catalyst with evacuation at -80°C between runs.
Kinetics of the Nickel-Catalyzed Hydrogenation of Ethylene
as shown by the solid lines in Fig. 3 (b), so that the pressure-time curves in the initial stage of reaction, expected- to be observed in the absence of this time lag, were decided by extrapolation as shown by the dotted lines in Fig. 3 (b). In Fig. 3 (a) are shown the pressure-time curves,corrected for this time lag, for five successive runs conducted in the increasing order of nos. indicated.
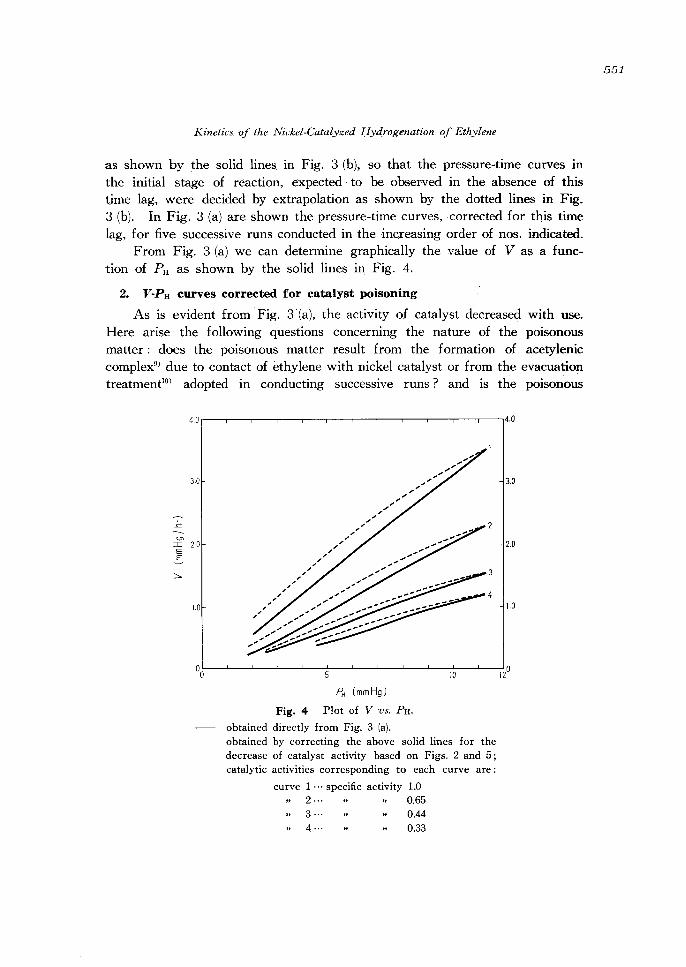
From Fig. 3 (a) we can determine graphically the value of V as a function of PH as shown by the solid lines in Fig. 4.
2. V-PH curves corrected for catalyst poisoning
As is evident from Fig. 3 (a), the activity of catalyst decreased with use. Here arise the following questions concerning the nature of the poisonous matter: does the poisonous matter result from the formation of acetylenic complex9
) due to contact of ethylene with nickel catalyst or from the evacuation treatmentI°) adopted III conducting successive runs? and is the poisonous
..c
0> ::c E
-.5 ::::,.
4.0 ,---,-~--r---,--,--.--r--'---'---'--r--,4.0
30
2.0
1.0
PH (mmHg)
Fig. 4 Plot of V VS. PH.
obtained directly from Fig. 3 (a). obtained by correcting the above solid lines for the decrease of catalyst activity based on Figs. 2 and 5; catalytic activities corresponding to each curve are:
curve 1 ... specific activity 1.0 2··· 0.65
0.44
0.33
551
552
I. MA TSUZAKI, A. T ADA and T. NAKAJIMA
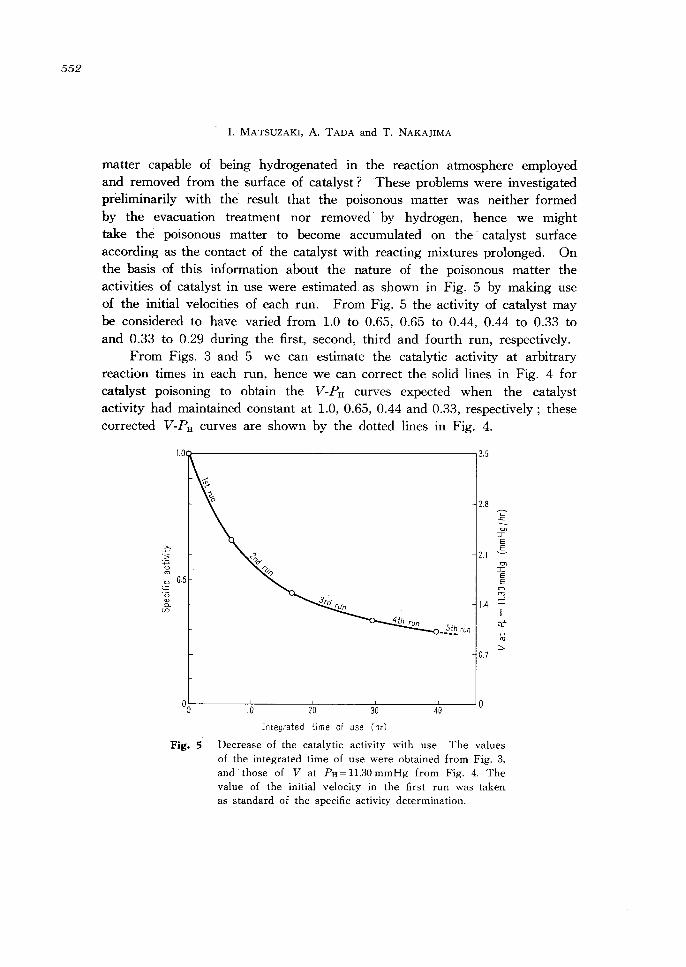
matter capable of being hydrogenated in the reaction atmosphere employed and removed from the surface of catalyst? These problems were investigated preliminarily with the result that the poisonous matter was neither formed by the evacuation treatment nor removed by hydrogen, hence we might take the poisonous matter to become accumulated on the catalyst surface according as the contact of the catalyst with reacting mixtures prolonged. On the basis of this information about the nature of the poisonous matter the activities of catalyst in use were estimated as shown in Fig. 5by making use of the initial velocities of each run. From Fig. 5 the activity of catalyst may be considered to have varied from 1.0 to 0.65, 0.65 to 0.44, 0.44 to 0.33 to and 0.33 to 0.29 during the first, second, third and fourth run, respectively.
From Figs. 3 and 5 we can estimate the catalytic activity at arbitrary reaction times in each run, hence we can correct the solid lines in Fig. 4 for catalyst poisoning to obtain the V-PH curves expected when the catalyst activity had maintained constant at 1.0, 0.65, 0.44 and 0.33, respectively; these corrected V-PH curves are shown by the dotted lines in Fig. 4.
1.00------------------------,3.5
2.8 .<=:
en I E
-P 2.1 -S :~ ~ 0)
'" I '" E u E
'+= 0 .<3 '" '" 0. 1.4 Cf)
•• 5l~ run Cl:' ~
'" ~
D.7
°0~---~I~D----~2D----~3DL-----4~e--~o
Integrated time of use (hr)
Fig. 5 Decrease of the catalytic activity with use The values of the integrated time of use were obtained from Fig. 3, and those of V at PH = 11.30 mmHg from Fig. 4. The value of the initial velocity in the first run was taken as standard of the specific activity determination.
Kinetics of the Nickel-Catalyzed Hydrogenation of Ethylene
n=J.O
log Pe (mmHg)
'" o
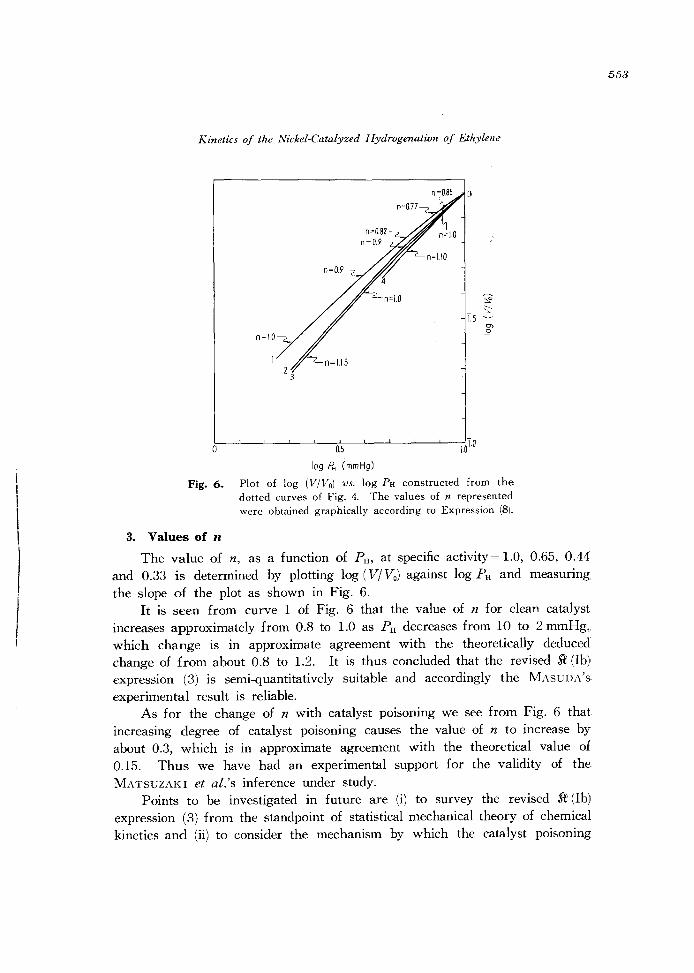
Fig. 6. Plot of log (VIVo) vs. log PH constructed from the dotted curves of Fig. 4. The values of n represented were obtained graphically according to Expression (8).
3. Values of n
The value of n, as a function of PH, at specific activity = 1.0, 0.65, 0.44 and 0.33 is determined by plotting log (VIVo) against log PH and measuring the slope of the plot as shown in Fig. 6.
It is seen from curve 1 of Fig. 6 that the value of n for clean catalyst increases approximately from 0.8 to 1.0 as PH decreases from 10 to 2 mmHg, which change is in approximate agreement with the theoretically deduced change of from about 0.8 to 1.2. It is thus concluded that the revised ~ (Ib} expression (3) is semi-quantitatively suitable and accordingly the MASUDA'S.
experimental result is reliable. As for the change of n with catalyst poisoning we see from Fig. 6 that
increasing degree of catalyst poisoning causes the value of n to increase by about 0.3, which is in approximate agreement with the theoretical value of 0.15. Thus we have had an experimental support for the validity of the MATSUZAKI et al.'s inference under study.
Points to be investigated in future are (i) to survey the revised ~ (Ib) expression (3) from the standpoint of statistical mechanical theory of chemical kinetics and (ii) to consider the mechanism by which the catalyst poisoning
553
554
I. MATSUZAKI, A. TADA and T. NAKAJIMA
exerts uneven inhibiting effects upon constituent elementary steps.
Acknowledgement
The present authors wish to express their smcere thanks to Emeritus Professor J. HORIUTI for his kind advices and valuable discussion for the present work.
References
1) J. HORIUTI and M. POLANYI, Trans. Faraday Soc., 30, 1164 (1934).
2) ]. HORIUTI, This Journal, 7, 163 (1959).
3) M. MASUDA, ibid., 12, 67 (1965).
4) S. TERAT ANI and K. HIROTA, Catalyst (in Japanese), 7, 286 (1965).
5) K. J. LAIDLER and R. E. TOWNSHEND, Trans. Faraday Soc., 57, 1959 (1961).
6 ) I. MA TSUZAKI, T. NAKAJIMA and A. T ADA, This Journal, 13, 187 (1966).
7) I. MA TSUZAKI, ibid., 7, 210 (1959); Proc. 2nd International Congress on Catalysis,
Paris, (1961), p. 1121.
8) I. MATSUZAKI and T. NAKAJIMA, This Journal, 13, 44 (1965).
9) G. I. JENKINS and S. E. RIDEAL, J. Chern. Soc. (London), 2490 (1955).
10 ) K. MIYAHARA, This Journal, 11, 1 (1963).
11) J. HORIUTI and I. MATSUZAKI, ibid., 7, 187 (1959).