degradation kinetics of organic amines in...
TRANSCRIPT

DEGRADATION KINETICS OF ORGANIC AMINES
IN SUPERCRITICAL WATER
By
PRANAY NAMILAKONDA
Bachelor of Science
University College of Technology
Osmania University
Hyderabad, INDIA
2003
Submitted to the Faculty of the Graduate College of the
Oklahoma State University in partial fulfillment of
the requirements for the Degree of
MASTER OF SCIENCE December 2005

DEGRADATION KINETICS OF ORGANIC AMINES
IN SUPERCRITICAL WATER
Thesis Approved:
Gary L. Foutch Thesis Advisor
Dea
Arland H. Johannes
Afshin J. Ghajar
n
A. Gordon Esmileof the Graduate College
ii

ACKNOWLEDGEMENTS
I would like to acknowledge my parents Yamuna and Hari Prasad Namilakonda,
my elder brother Pranava Swaroop, and my younger brother Pandu for their love and
continuous encouragement which helped me in completing this work in time. My parents
always stood by me since my first foot steps and inspired me in every aspect of my life. I
am thankful for all the painful sacrifices they have made for my education.
I owe my gratitude to my advisor, Dr. Gary Foutch, for the opportunity to take
part in this work. I’m thankful to him for the freedom I enjoyed while working on this
project. I would like to thank my graduate committee members Dr. A.H Johannes and
Dr. Afshin Ghajar, for their valuable guidance. I would like to thank Dr. Khaled Gasem
for providing me with necessary financial support when I need it the most.
I would like to thank my friends Rahul and Venkat for making my stay in
Stillwater memorable. I also would like to thank my best pals, Sunita and Sharath, for
their care and support, and for always being there for me during my masters. I cannot
end without thanking my love of life, Prathima for her encouragement, care and love.
Thank you for being what you are.
Finally, I would like to thank the Department of Chemical Engineering at
Oklahoma State University, Stillwater for providing me an opportunity to pursue my
Masters degree.
iii

TABLE OF CONTENTS
CHAPTER PAGE
I. INTRODUCTION..........................................................................................................1 Supercritical Water Cooled Reactor ........................................................................2 Current Status of Research.......................................................................................3 Water Chemistry and Corrosion ..............................................................................4 Water chemistry control...............................................................................6 Proposed Work.........................................................................................................7 Objectives ................................................................................................................8 References..............................................................................................................10 II. PROPERTIES OF SUPERCRITICAL WATER .........................................................13 Properties of Supercritical Water...........................................................................14 Density .......................................................................................................14 Viscosity ....................................................................................................14 Dielectric constant .....................................................................................17 Heat capacity..............................................................................................20 Ionic product ..............................................................................................20 Hydrogen bonding .....................................................................................20 References..............................................................................................................24 III. ORGANIC AMINES AS ACID NEUTRALIZING AGENTS...................................26 Basicity of Amines.................................................................................................27 Hydrogen bonding .....................................................................................28 Aromaticity and hybridization ...................................................................29 Volatility of Amines ..............................................................................................31 References..............................................................................................................34 IV. KINETICS AND MECHANISMS..............................................................................36 Literature Review...................................................................................................27 Benzylamine ..............................................................................................37 Nitro-anilines .............................................................................................40 p-nitroaniline..............................................................................................41 Benzylphenylamine....................................................................................43 Methylamine ..............................................................................................47 Possible Mechanisms .............................................................................................48 Free radical mechanism .............................................................................49 Ionic mechanism ........................................................................................49
iv
Discussion..............................................................................................................51 References..............................................................................................................53 V. SOLVENT EFFECTS..................................................................................................56 Literature Review...................................................................................................57 Ion product .................................................................................................58 Dielectric constant .....................................................................................62 Other effects...............................................................................................64 Modification of Kinetic Equation ..........................................................................66 Conventional kinetic analysis ....................................................................66 References..............................................................................................................69 VI. CONCLUSIONS AND RECOMMENDATIONS......................................................72 Conclusions............................................................................................................72 Reaction pathways of amine degradation ..................................................72 Water effects in supercritical state.............................................................73 Recommendations..................................................................................................74 Experimentation.........................................................................................74 Rate equation .............................................................................................75 APPENDIX A – Thermodynamic data of water: Sub and supercritical conditions ..........78 A-I. Dielectric Constant of Water.........................................................................79 A-II. Ion Product of Water.....................................................................................81
v

LIST OF TABLES
TABLE PAGE 2.1 pKa values for simple amines in aqueous solutions at 25oC and 1 atm ......................28
2.2 pKa values for simple amines in aqueous solutions at 25oC and 1 atm ......................31
2.3 Distribution ratios of commonly used industrial amines ............................................32
4.1 Products of benzylamine pyrolysis .............................................................................38
4.2 Reaction products of benzylamine and supercritical water ........................................39
4.3 Pseudo-first order rate constants of nitroanilines at 300oC.........................................42
4.4 Pyrolysis and hydrolysis products of benzyl phenyl amine at 386oC.........................46
5.1 Sample data necessary to compute rate constant and Arrhenius parameters of organic
amine degradation..................................................................................................67
vi

LIST OF FIGURES
FIGURE PAGE
1.1 Schematic of supercritical water cooled reactor ..........................................................5
2.1 Phase diagram single component...............................................................................13
2.2 Isothermal variation of density with pressure............................................................15
2.3a Isothermal variation of viscosity with pressure .........................................................16
2.3b Isothermal variation of viscosity with density ...........................................................16
2.4 Dielectric constant isobar of water plotted against temperature and density.............18
2.5a Isobaric variation of CP with temperature ..................................................................19
2.5b Isobaric variation of CP with density .........................................................................19
2.6 Ion product of high-temperature water and steam .....................................................22
2.7 Density and Ionic product isobars of water plotted against temperature...................23
3.1a Monoethanolamine.....................................................................................................26
3.1b Diethanolamine ..........................................................................................................26
3.1c Triethanolamine .........................................................................................................26
3.2 Stabilization of methyl group on ammonium ion through hydrogen bonding...........29
3.3 Reduced basicity of aniline due to electron pair delocalization ................................30
4.1 Molar yields of reaction products of benzyl phenyl amine pyrolysis in water at
340oC......................................................................................................................45
vii

4.2 Molar yields of reaction products of benzyl phenyl amine pyrolysis in water at
386oC......................................................................................................................45
4.3 Nucleophilic attack of water on saturated carbon atom.............................................46
4.4 Substitution reactions of amines ................................................................................50
4.5 Transition state complex in SN2 reaction...................................................................50
5.1 Isobaric variation of Ion Product of water with temperature.....................................60
5.2 Isobaric variation of Ion Product of water with density ............................................61
5.3 Kirkwood plot showing dependency of hydrolysis rate constant on dielectric
constant of solvent – hydrolysis of methylamine in supercritical water at 410oC.65
viii

NOMENCLATURE
Symbols
1o Primary 2o Secondary 3o Tertiary C0, Cn,0 Initial concentrations of reactive species (mol l-1) CA Concentration of species A (mol l-1) CP Thermal conductivity (Wm-1K-1) k' Pseudo first order rate constant K‡ Equilibrium constant of transition state species k0 Reference state rate constant Ka Equilibrium dissociation constant of acid in aqueous solution Kb Equilibrium dissociation constant of base in aqueous solution KW Ion product of water (mol2 kg-2) PC Critical point pressure (22.05 MPa) pKa Negative logarithm of acid dissociation constant pKb Negative logarithm of base dissociation constant Pr Reduced pressure ri Molecular/complex radius of species i (cm) SN1 Unimolecular nucleophilic substitution mechanism SN2 Bimolecular nucleophilic substitution mechanism TC Critical point temperature (374 oC) Tr Reduced temperature X‡ Transition state species Yn Yield of species n ∆G‡ Free energy of activation (kJ mol-1) ∆v‡ Activation volume (cm-3 mol-1) ε Dielectric constant of water κ Transmission coefficient κT Isothermal compressibility µi Dipole moment of species I (Debye, D) ρ Solvent density (kg m-3) ρr,w Reduced water density ρw Water density (kg m-3) Ψ Modified rate constant
ix

Abbreviations 2, 6-DNA 2, 6-dinitroaniline 2NA 2-nitroaniline 2NPDA 2-nitro- 1, 4-phenylenediamine 3NPDA 3-nitro- 1, 2-phenylenediamine 4NA 4-nitroaniline 4NPDA 4-nitro- 1, 2-phenylenediamine AVT All Volatile Treatment BA Benzylamine BP Boiling Point BPA Benzylphenylamine DOE Department of Energy DR ` Distribution Ratio FA Film forming Amine IC Inter-granular Corrosion I-NERI International Nuclear Energy Research Initiative LWR Light Water Reactor MPa Mega Pascal NA Neutralizing Amine NERI Nuclear Energy Research Initiative NIST National Institute of Standards and Technology OT Oxygenated Treatment PC Pitting Corrosion Ph Phenol PWR Pressurized Water Reactor SCC Stress Corrosion Cracking SCWO Supercritical Water Oxidation SCWR Supercritical Water Cooled Reactor SFE Supercritical Fluid Extraction THQ 1, 2, 3, 4-tetrahydroquinoline Other
E Activation energy (kJ mol-1) F Fractional conversion h Plank’s constant K Kelvin k Rate constant N Avogadro number (6.022E23 mol-1) oC Degree centigrade P Pressure R Gas constant (J mol-1 K-1) T Temperature t Time (s)
x

CHAPTER – I
INTRODUCTION
One of the major requirements for sustaining human progress is an adequate
source of energy. The largest sources of energy currently are combustion of coal, oil and
natural gas. These will last quite a while, but probably will run out or become limiting in
tens to hundreds of years. Solar energy is viable but is not developed except for special
applications due to high cost. Nuclear energy is likely to remain cheaper than oil and gas.
The main advantage of nuclear and solar energy is that it does not put carbon dioxide into
the atmosphere.
To enhance the role of nuclear energy systems, the government of the United
States of America began two programs; Nuclear Energy Research Initiative (NERI) in
1999 and International Nuclear Energy Research Initiative (I-NERI) in 2001 [1]. The
objective of these two programs is to develop safe, clean, sustainable and cost-effective
nuclear energy systems that can fuel the world for future generations. In April 2003, the
Department of Energy (DOE) developed a concrete plan for development of such systems
and issued ‘A Technology Roadmap for Generation IV Nuclear Energy Systems’ [2].
The supercritical water-cooled reactor (SCWR) is one of the six reactor technologies
selected for research and development under the Generation IV program.
At present there are 103 commercial nuclear reactors with operating licenses in
the United States. These are located at 64 different sites in 31 states, 34 of which are
1

Boiling Light Water Reactors (LWRs) and 69 are Pressurized Water Reactors (PWRs).
About 20% of the electricity generated in United States is from nuclear and this energy is
considered emission free [3, 4]. The working principle of LWRs is similar to
conventional coal fired power plant except that fuel source (combustion of coal) is
replaced by nuclear fuel. PWRs operation is carried out in two different loops, primary
and secondary. Primary loop consists of working fluid (water) in direct contact with
nuclear fuel and is heated by radioactive decay of the nuclear fuel. Water in the primary
loop is under high pressure to prevent it from boiling. Heat from the primary loop is
transferred to the secondary loop to generate steam which is used to propel turbines. Use
of a two loop system prevents leakage of radiation emitted in the primary loop to other
steam generation equipment. In contrast, Supercritical Water Cooled Reactor (SCWR)
can be visualized as LWR operating above the thermodynamic critical point of water [5,
6].
Supercritical Water-Cooled Reactor (SCWR)
SCWRs are high temperature, high pressure water cooled reactors that operate
above the critical point of water (374 oC, 22.1 MPa). SCWR has the following
advantages over the current state of art nuclear Light Water Reactors (LWRs) [5-7]:
1. The thermal efficiency of SCWRs can be much higher compared to LWRs. The
efficiency of SCWR can approach 44%, compared to 33-35% for LWRs.
2. The mass flow rate of coolant per unit core thermal power is low in SCWRs. This
results in increased enthalpy of coolant offering reduction in size of reactor
coolant pumps, piping, pumping power and associated equipment.
2
3. Reduced coolant flow rate results from once-through coolant path in the reactor
vessel and reduced coolant density.
4. Discontinuous heat transfer regimes in the reactor core are eliminated as a result
of single phase operation (no boiling).
5. Steam dryers, steam separators, recirculation pumps and steam generators which
are currently used in LWRs are not required. This results in simplified plant
operation with fewer major components.
Few data exist on the behavior of materials in a supercritical water environment
under irradiation. Water chemistry is one of the key issues addressed by the DOE in the
research and development of SCWR as it may lead to corrosion of materials of
construction. DOE plans to develop a pilot plant scale supercritical water cooled reactor
by the year 2020 [2].
Current status of research
At present, no pilot plant scale reactor is available for design evaluation and
analysis of SCWR. The technology available for LWRs and supercritical water cooled
fossil-fired power plants is considered basic technology for development of SCWR. It
can be said that current status of research in the development of SCWR is at a
rudimentary stage of testing materials of construction and analyzing the feasibility of
reactor operation [8]. According to 2004 NERI annual report published by DOE, current
research for SCWR is classified into three major goals [6]:
1. Fuel-cycle neutronic analysis and reactor core design,
3

2. Fuel cladding and structural material corrosion and stress corrosion cracking
studies, and
3. Plant engineering and reactor safety analysis.
The issue of water chemistry is addressed under fuel cladding and structural material
corrosion and stress corrosion cracking studies. Water chemistry at supercritical
conditions poses significant challenges in the research and development of SCWR as
reactor material is susceptible to corrosion under continuous operation.
Water chemistry and corrosion
In any hydrothermal system, water treatment is critical to both equipment life and
efficiency. Most of the conventional hydrothermal systems operating under sub-critical
conditions use stainless steel or metal alloys with Iron (Fe) and Copper (Cu) as
equipment material [9]. Poor control of alkalinity / acidity of water and presence of
impurities in feed water in such systems may lead to various forms of corrosion.
Corrosion results in damage to piping and equipment as well as loss of high quality water
and energy. In some instances, the products of corrosion, if returned to the boiler (or
heating unit), may contribute to the formation of damaging deposits over the unit
internals there by reducing the overall system reliability and increasing the operating and
maintenance costs. Different forms of corrosion include pitting corrosion (PC), general
corrosion, inter-granular corrosion or inter-crystalline corrosion (IC) and stress corrosion
cracking (SCC).
4

Figu
re 1
.1 S
chem
atic
of S
uper
criti
cal W
ater
Coo
led
Rea
ctor
[2]
5

Water chemistry control – focus on pH
The fundamental objectives of feed-water chemistry in a hydrothermal system are
control over acidity / alkalinity and impurities to reduce corrosion of material of
construction. Currently there are three types of chemical treatments available for control
over acidity / alkalinity in hydrothermal systems operating at sub-critical conditions [9,
10]:
• Type I is classical all-volatile treatment (AVT) using ammonia (NH3) and a
reducing agent or oxygen scavenger (such as hydrazine)
• Type II is the same as Type A minus the reducing agent, called new AVT
• Type III is oxygenated treatment (OT) using only ammonia and oxygen (O2)
All three treatments mentioned involve addition of an external chemical agent to
feedwater to maintain the required minimum pH at process operating conditions. The
major difference between the three types of treatments is that Type I provides a reducing
environment, whereas Types II and III result in oxidizing environments. In nuclear
pressurized water reactor (PWR) plants, the feed water treatment is limited to all-volatile
treatment as the secondary cycle corrosion is extremely pH sensitive [11]. In Type III
treatment, there is a possibility of reaction between ammonia and oxygen resulting in
consumption of ammonia which further results in shift of pH value from alkaline to
acidic scale. Hence Type III treatment is least preferred compared to Type I and Type II.
All the three treatments are currently used in steam generation systems depending on the
type of impurities present in the feed water and other pH control considerations.
However, it should be noted that these treatments can be used when process operating
6

conditions are in the sub-critical region. The application of above treatments may not be
effective in stabilizing the pH and further reducing the corrosion in hydrothermal systems
operating above the critical point.
Organic amines have been used extensively as pH stabilizing agents in all-volatile
treatments in various boiler feed water and steam condensate systems -- replacing
ammonia [12-24]. Amines offer unique advantages over ammonia like low volatility,
varying distribution ratios and ease of shipping and handling. Moreover ammonia is not
suited for this application as pH neutralizing agent in water at near critical operating
conditions. This is because in sub-critical once-through reactors, the presence of NH3 /
O2 does not cause problems, since oxidation of ammonia is slow. In contrast, the
oxidation rate of ammonia is strongly accelerated near supercritical conditions with major
oxidation products being nitrogen (N2) gas and N2O. These oxidation reactions lead to
ammonia and oxygen consumption resulting in a shift of pH to less alkaline values [9,
11].
Proposed work
In view of current progress in research and development of SCWR and its unique
advantages over existing electricity generation units, advanced research on water
chemistry is necessary. This report evaluates the feasibility of application of organic
amines as acid neutralizing agents in hydrothermal systems operating above the
thermodynamic critical point of water.
7

Hypothesis
Based on the proven performance of organic amines in sub and near-critical
hydrothermal systems as acid neutralizing agents, it is hypothesized that organic amines
have the potential to remain relatively stable and elevate pH to required alkaline values at
conditions above the critical point. Organic amines that stabilize pH decompose into
light molecular weight organic and inorganic molecules. Initial review of the literature
indicates that the rate of decomposition of an organic amine in any hydrothermal system
is mainly dependent upon process operating temperature and pressure. Two major
mechanisms for amine decomposition in supercritical water are identified: pyrolysis and
hydrolysis. Pyrolysis is dominant in low water density region and hydrolysis in high
water density region. There exists a range of solvent density where the two mechanisms
proceed in parallel.
In the case of supercritical water, the rate of decomposition of an organic amine is
not only dependent upon the operating temperature and pressure but also on solvent
properties in hydrolysis region (higher water densities). Better prediction of rates of
decomposition of amines under hydrolysis can be obtained by correlating the solvent
properties (di-electric constant, density and ionic product) with the decomposition
reaction rate constant.
Objectives
1. To understand and analyze the properties of water at supercritical conditions,
2. To assess the work that was done on decomposition kinetics of amines in water at
supercritical conditions,
8

3. To draw analogies between mechanisms at sub-critical and supercritical
conditions for structurally similar organic compounds and address key issues
related to solvent effects on reaction kinetics, and
4. To recommend feasible methodology for generation of kinetics data and
development of mechanistic models.
9

References
1. Department of Energy, “Nuclear Energy Research Initiative”, 2001 Annual
Report (May 2002).
2. Department of Energy, “A Technology Roadmap for Generation IV Nuclear
Energy Systems”, DRAFT (December 2002).
3. Department of Energy, “Report to Congress on Viable Domestic Uranium,
Conversion and Enrichment Industries”, Congressional Report (December
2000).
4. Nuclear Energy Institute Home Page.
http://www.nei.org/index.asp?catnum=3&catid=13 (accessed November 15th,
2005).
5. Department of Energy, “Generation IV Nuclear Energy Systems Ten Year
Program Plan”, DRAFT (February 2004).
6. Danielyan, D. Supercritical – Water Cooled Reactor System – as one of the most
promising type of Generation IV Nuclear Reactor Systems.
http://www.tkk.fi/Units/AES/courses/crspages/Tfy-56.181_03/Danielyan.pdf
(accessed November 15th, 2005).
7. Department of Energy, “Nuclear Energy Research Initiative”, 2004 Annual
Report (May 2005).
10

8. Buongiorno, J. Supercritical Water – Cooled Reactor (SCWR). presented at
Advanced Reactor, Fuel Cycle, and Energy Products – Workshop for
Universities: Department of Energy, Gaithersburg, MD, March 4-5, 2004.
9. Dooley, R.B.; Chexal, V.K. Flow – Accelerated Corrosion. CORROSION 99,
NACE International, Houston, 1999, Paper # 347.
10. Kritzer, P. Corrosion in high – temperature and supercritical water and aqueous
solutions: a review. J. Supercrit. Fluids 2003, 29, 1.
11. Kilmas, S.J.; Fruzzetti, K.; Turner, C.W.; Balakrishnan, P.V.; Strati, G.L.;
Tapping, R.L. Identification and Testing of Amines for Steam Generator
Corrosion and Fouling Control. In 2003 ECI Conference on Heat Exchanger
Fouling and Cleaning: Fundamentals and Applications, Proceedings of ECI
Symposium Series, Vol. RP1, Santa Fe, New Mexico, USA, May 18-22, 2003;
Watkinson, P.W.; Steinhagen, H.S.; Malayeri, M.R Eds.
http://services.bepress.com/eci/heatexchanger/37/ (accessed November 15th,
2005).
12. Strauss, S.D. Power, October 1, 1995, p.31.
13. Jonas, O.; Daniels, D. Power, October 1, 2000, p.61.
14. Daniels, D. Power, September 1, 2004, p.50.
15. Carr, H.E.; Denman, W.L.; Silverstein, R.M. Field Studies on Octadecylamine
and Dioctadecylamine in Steam and Condensate Systems. I&EC Prod. Res. Dev.
1962, 1, 302.
16. Ulmer, R.C. Prevention of Corrosion in Steam Lines. U.S Patent 2,587,249,
February 26, 1952.
11

17. Cuisia, D.G.; Hwa, C. Composition and Method for Inhibiting Corrosion. U.S
Patent 4,350,606, September 21, 1982.
18. Moran, F. Anticorrosive Composition. U.S Patent 4,562,042, December 31, 1985.
19. Nemes, J.; Thompson, H.W.; Waller, J.E. Composition and Method for
Deoxygenation. U.S Patent 4,656,411, December 2, 1986.
20. Walker, J.L.; Zupanovich, J.D. Stabilized Sodium Erythorbate Boiler Corrosion
Inhibitor Compositions and Methods. U.S Patent 4,681,737, July 21, 1987.
21. Fellows, L.A.; Eckler, P.E. Corrosion Inhibitors. U.S Patent 4,726,914, February
23, 1988.
22. Hwa, C.M.; Kelly, J.A.; Neton, J.; Scanlon, P.M.; Gaudette, R.R.; Hudson, N.H.
Control of Corrosion in Aqueous Systems Using Certain Phosphonomethyl
Amines, U.S Patent 5,019,343.
23. Rossi, A.M.; Vincentown, N.J.; McDonald, A.C. Corrosion Control Composition
and Method for Boiler/Condensate Steam System, U.S Patent 5,368,775,
November 29, 1994.
24. Braden, V.K.; Fearnside, P.; Murphy, C.J. Amine Blend Neutralizers for Refinery
Process Corrosion, U.S Patent 5,965,785, October 19, 1999.
12

CHAPTER - II
PROPERTIES OF SUPERCRITICAL WATER
In this chapter thermo-physical properties of supercritical water will be discussed.
A fluid is termed as supercritical when its temperature and pressure exceed the critical
temperature and pressure, respectively. For water (H2O), the critical temperature is TC
374oC and critical pressure is PC = 22.05 MPa. At this temperature and pressure, the
properties of vapor and liquid cannot be distinguished. The phase diagram of a single
Figure 2.1 Phase diagram for single component
component fluid is shown in Figure 2.1. The vapor liquid saturation curve disappears
beyond the critical point indicating that the vapor and liquid phases coexist. Any liquid
when heated at constant pressure beyond its critical pressure would undergo expansion
13

reaching a vapor like state without phase transition. This physical phenomenon is termed
as continuity of states. At any temperature beyond the critical point, the vapor can no
longer be liquefied regardless of the pressure applied.
Properties of supercritical water
Properties of supercritical water are quite different from those of liquid water at
ambient conditions. Water at supercritical conditions has unique properties, some are
intermediate of vapor and liquid (viscosity, dielectric constant) and some are not (CP,
thermal conductivity) [1]. This section briefly describes the thermo physical properties
of supercritical water.
Density
Figure 2.2 shows the isothermal variation of density with pressure [2]. It can be
observed that the density in near critical region (below 22.05 MPa, vapor) changes
rapidly with very slight increase in pressure. This change in pressure shifts the density to
liquid like values. At this point, the fluid can be visualized as a dense gas with density
comparable to liquids. Note that the drop shifts towards higher temperatures at higher
pressures. In the following sections it will be shown that other physical properties like
viscosity and specific heat follow a smooth trend with density even in the critical point
region.
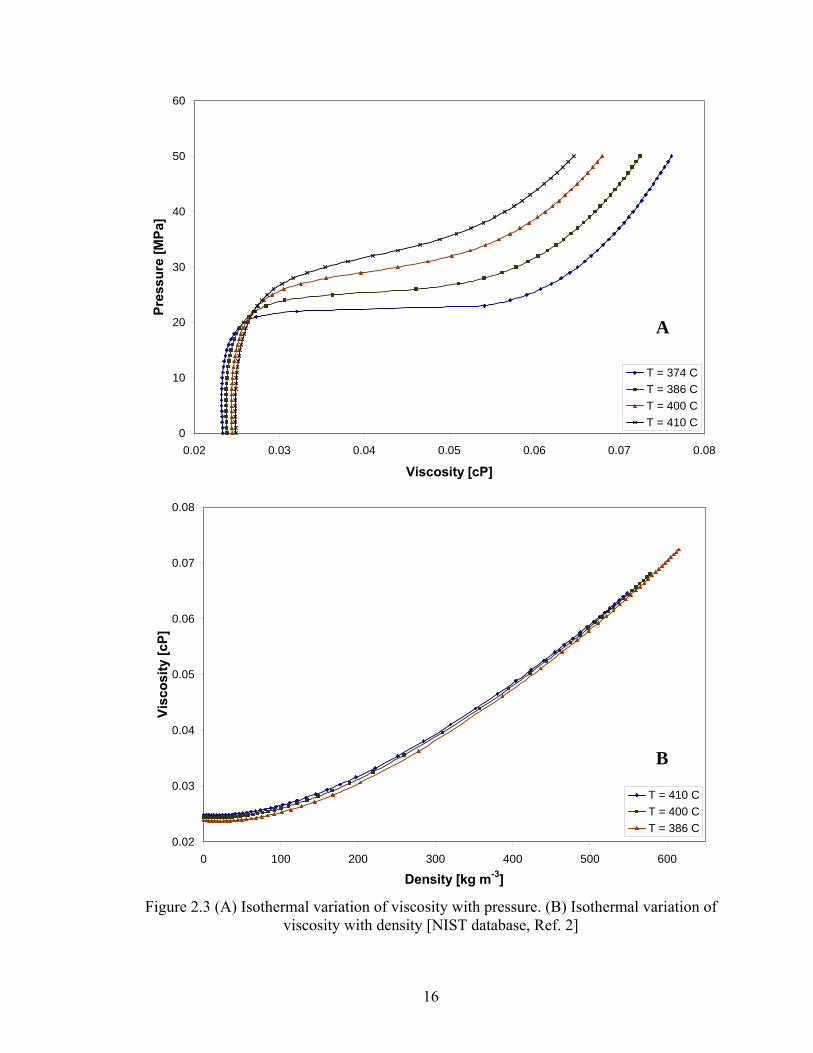
Viscosity
Figure 2.3 shows the isothermal variation of viscosity at different temperatures
[2]. As in the case of density, there is a sharp change in viscosity near supercritical point
(Figure 2.3 A). This difference is due to diverging compressibility at critical point
14

01020304050
010
020
030
040
050
060
070
0
Den
sity
(kg
m-3
)
Pressure (MPa)
T =
374
CT
= 38
6 C
T =
400
CT
= 41
0 C
22.0
5 M
Pa
Figu
re 2
.2 Is
othe
rmal
var
iatio
n of
den
sity
with
pre
ssur
e [N
IST
data
base
. Ref
. 2]
15
0
10
20
30
40
50
60
0.02 0.03 0.04 0.05 0.06 0.07 0.08
Viscosity [cP]
Pres
sure
[MPa
]
T = 374 CT = 386 CT = 400 CT = 410 C
0.02
0.03
0.04
0.05
0.06
0.07
0.08
0 100 200 300 400 500 600
Density [kg m-3]
Visc
osity
[cP]
T = 410 CT = 400 CT = 386 C
A
B
Figure 2.3 (A) Isothermal variation of viscosity with pressure. (B) Isothermal variation of viscosity with density [NIST database, Ref. 2]
16

of water. When viscosity is plotted against density along the same isotherm there are no
sharp changes in the values viscosity of irrespective of critical point region (Figure 2.3
B). Viscosity of supercritical water is far less than ambient water making it a fluid with
high self diffusivity at elevated temperatures [3-7]. This property of supercritical water is
considered as great advantage for its use in process industries
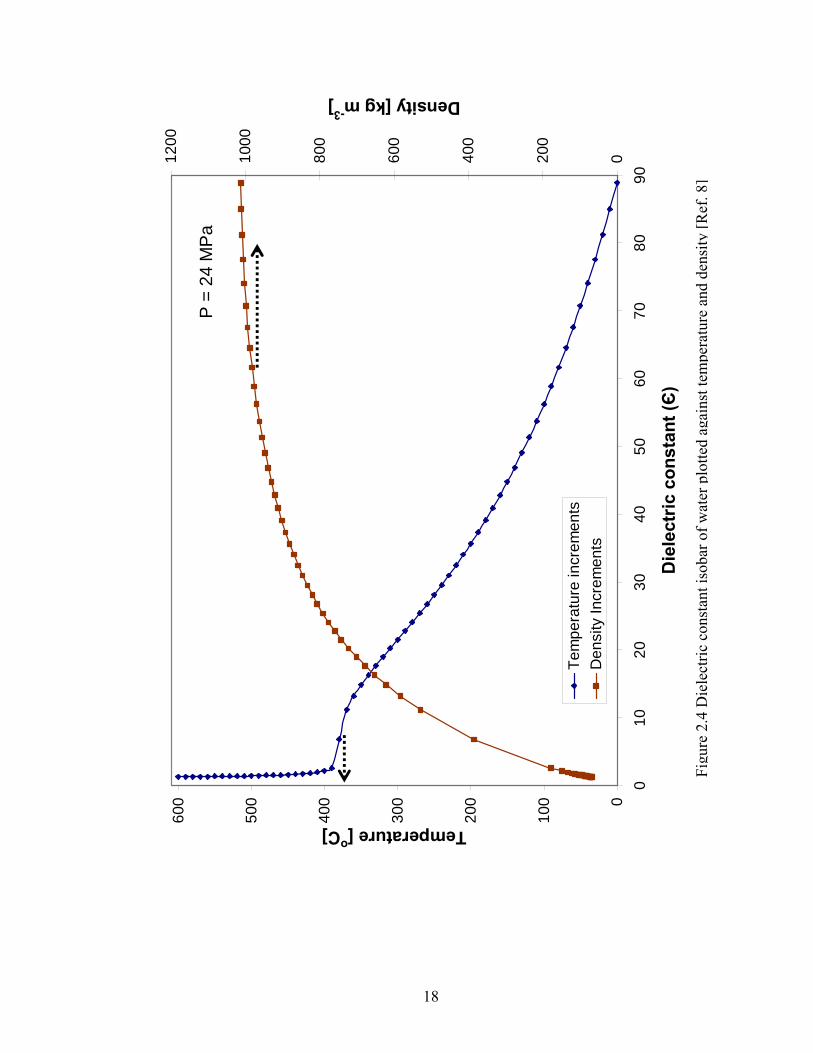
Dielectric constant
Dielectric constant (ε) or permittivity is defined as a numerical quantity that
expresses the degree of non-conductivity of a substance (Dielectric constant of vacuum =
1.0). In Figure 2.4, ε of water is plotted against temperature (left y – axis) and density
(right y – axis) [8]. Notice the steep change in the value of ε from 13.2 to 2.6 with
change in temperature near critical region. At these conditions water is a low dielectric
fluid, a poor solvent for electrolytes and a good solvent for organic compounds. This
sudden drop in ε change is due to the diverging expansion coefficient [1]. When the
same isobar is plotted against density, the steep change is replaced by a smooth curve
following similar trend as viscosity plotted against density (Fig 1.3 B).
The properties, viscosity, ε, coefficient of self diffusion, enthalpy and entropy are
intermediate between those of vapor and liquid and can be tuned to desired value by
changing density of water above critical point.
Beyond critical the point, properties such as heat capacity, isothermal
compressibility and isobaric coefficient do not behave smoothly with density and cannot
be considered intermediate between those of liquid and vapor. The following section
discusses the isobaric variation of heat capacity at constant pressure near critical region.
17
0
100
200
300
400
500
600
010
2030
4050
6070
8090
Die
lect
ric c
onst
ant (Є
)
Temperature [oC]
0200
400
600
800
1000
1200
Density [kg m-3
]
Tem
pera
ture
incr
emen
tsD
ensi
ty In
crem
ents
P =
24
MP
a
Figu
re 2
.4 D
iele
ctric
con
stan
t iso
bar o
f wat
er p
lotte
d ag
ains
t tem
pera
ture
and
den
sity
[Ref
. 8]
18

0
200
400
600
800
1000
1200
0 100 200 300 400 500 600
Temperature [oC]
Cp
[J m
ol-1
K-1
]
24 MPa
30 MPa
36 MPa
42 MPa
0
200
400
600
800
1000
1200
0 200 400 600 800 1000
Density [kg m-3]
Cp [
J m
ol-1
K-1
]
P = 24 MPaP = 30 MPaP = 36 MPaT = 42 MPa
A
B
Figure 2.5 (A) Isobaric variation of CP with temperature. (B) Isobaric variation of CP with density [NIST database Ref. 2]
19

Heat capacity (CP)
Isobaric variation of CP is plotted against temperature and density in Figures 2.5
A and B respectively [2]. The sharp spike (24 MPa) in Figure 2.5 (A) is equivalent to the
broad spectrum (24 MPa) in Figure 2.5(B). This is because a small change in
temperature causes a huge density change due to diverging expansion coefficient [1].
Ionic product (Kw)
Ionic product of water is defined as the product of hydrogen ion concentration and
hydroxide ion concentration. At ambient temperature Kw = 1.0 x 10⁻¹⁴ mol-2 l-2. Figure
2.7 shows ion product and density plotted against temperature (isobars) [2] and Figure
2.8 shows ionic product of high-temperature water and steam versus temperature [9].
Steam and low-density supercritical water behave like non-polar solvents. At low
pressures, water behaves as a non-polar solvent with low self-disassociation. High
pressures can increase the ionic product to values above those found for water at ambient
conditions. Ion product can significantly alter reaction mechanisms in supercritical water
as the concentration of H+ and OH- ions is sensitive to conditions of operation.
Hydrogen bonding
Few hydrogen bonds exist in supercritical water compared to ambient liquid
water. It has also been reported that almost all the properties of supercritical water differ
from ambient water due to the decrease in number of hydrogen bonds as supercritical
state is reached [10]. Unlike continuous network of hydrogen bonds in ambient liquid
water, hydrogen bond network in supercritical water exists as clusters. The size of cluster
20

depends on the localized state in any supercritical water system and is a function of
pressure and temperature [11-14].
It has been observed that sudden change in physical properties at the critical point
makes water a highly corrosive fluid in supercritical water systems [15]. These
properties include density, pH value, and electrochemical potential of the solution. The
temperature plays an important role influencing the aggressiveness of attacking solvent
species to accelerate corrosion. The investigation of chemistry of organic amines in this
region is of fundamental interest.
The data used to generate various plots in this chapter are attached in Appendix
A.
21

22
-45
-40
-35
-30
-25
-20
-15
-10
010
2030
4050
Pres
sure
[MPa
]
log [Kw (mol kg-1
)2]
T =
25 C
T =
300
CT
= 37
4 C
T =
400
CT
= 65
0 C
Wat
er a
t am
bien
tte
mpe
ratu
re
Figu
re 2
.7 Is
othe
rmal
var
iatio
n of
ion
prod
uct o
f wat
er [R
ef. 9
]

23
0
200
400
600
800
1000
1200
1400
010
020
030
040
050
060
070
0Te
mpe
ratu
re [o C
]
Density [kg m-3
]
-30
-28
-26
-24
-22
-20
-18
-16
-14
-12
-10
log [Kw (mol l-1
)2]
Den
sity
at 2
4 M
PaD
ensi
ty a
t 36
MPa
Ioni
c Pr
oduc
t at 2
4 M
PaIo
nic
Prod
uct a
t 36
MPa
24 M
pa
36 M
Pa
Ion
Prod
uct
Den
sity
Figu
re 2
.7 D
ensi
ty a
nd Io
nic
prod
uct i
soba
rs o
f wat
er p
lotte
d ag
ains
t tem
pera
ture
[Ref
. 2 &
9]

References
1. Levelt Sengers, J.M.H. Supercritical Fluids: Their properties and applications. In
Supercritical Fluids Fundamentals and Applications, Proceedings of NATO
Advanced Study Institute on Supercritical Fluids – Fundamentals and
Applications, Kemer, Antalya, Turkey, July 12-24, 1988; Kiran, E.; Debenedetti,
P.G.; Peters, C.J., Eds.; Kluwer Academic Publishers: Boston, USA, 2000; p.1-
29.
2. NIST Online Database Homepage. http://webbook.nist.gov/chemistry/fluid/
(accessed November 15, 2005).
3. Mizan, T.I.; Savage, P.E.; Ziff, R.M. Comparison of Rigid and Flexible Simple
Point Charge Water Models at Supercritical Conditions. J. Comput. Chem. 1996,
17, 1757.
4. Yoshii, N.; Yoshie, H.; Muira, S.; Okazaki, S. A Molecular Dynamics Study of
Sub- and Supercritical Water using a Polarizable Potential Model. J. Chem. Phys.
1998, 109, 4873.
5. Liew, C.C.; Inomata, H.; Arai, K.; Saito, S. Three-Dimensional Structure and
Hydrogen Bonding of Water in Sub- and Supercritical Regions: A Molecular
Simulation Study. J. Supercrit. Fluids 1998, 13, 83.
24

6. Tassaing, T.; Bellissent-Funel, M.C. The Dynamics of Supercritical Water: A
Quasielastic Incoherent Neutron Scattering Study. J. Chem. Phys. 2000, 113,
3332.
7. Lamb, W.J.; Hoffman, G.A.; Jonas, J. Self-Diffusion in Compressed Supercritical
Water. J. Chem. Phys. 1981, 74, 6875.
8. Uematsu, M.; Franck, E.U. Static Dielectric Constant of Water and Steam. J.
Phys. Chem. Ref. Data 1980, 4, 1291.
9. Marshall, W.L.; Franck, E.U. Ion Product of Water Substance, 0 – 1000 oC, 1 –
10,000 Bars New International Formulation and Its Background. J. Phys. Chem.
Ref. Data 1981, 10, 295.
10. Akiya, N.; Savage, P.E. Roles of Water for Chemical Reactions in High -
Temperature Water. Chem. Rev. 2002, 102, 2725.
11. Mountain, R.D. Voids and Clusters in Expanded Water. J. Chem. Phys. 1999,
110, 2109.
12. Mizan, T.I.; Savage, P.E.; Ziff, R.M. Temperature Dependence of Hydrogen
Bonding in Supercritical Water. J. Phys. Chem. 1996, 100, 403.
13. Kalinichev, A.G.; Churakov, S.V. Size and Topology of Molecular Clusters in
Supercritical Water: A Molecular Dynamics Simulation. 1999, 302, 411.
14. Boero, M.; Terakura, K.; Ikeshoji, T.; Liew, C.C.; Parrinello, M. Water at
Supercritical Conditions: A first principles study. J. Chem. Phys. 2001, 115, 2219.
15. Kritzer, P. Corrosion in High – Temperature and Supercritical Water and
Aqueous Solutions: a review. J. Supercrit. Fluids 2004, 1.
25

CHAPTER – III
ORGANIC AMINES AS ACID NEUTRALIZING AGENTS
Amines are nitrogen-containing in which one or more of the hydrogens has been
replaced by an alkyl or aryl group. Amines are as broadly classified as primary (1o),
secondary (2o) and tertiary (3o) amines based on number of alkyl (or aryl) groups attached
to nitrogen atom.
N
C2H4OH
HH Figure 3.1 (a) Monoethanolamine (1o – amine)
N
H
C2H4OHHOC2H4 Figure 3.1 (b) Diethanolamine (2o – amine)
N
C2H4OH
C2H4OHHOC2H4 Figure 3.1 (c) Triethanolamine (3o - amine)
Like ammonia, most amines are Brønsted or Lewis bases. The basicity of amines
will be discussed in later sections of the chapter. Amines are widely used in commercial
26
hydrothermal systems as acid neutralizing agents and corrosion inhibitors. They have
been proven to be very effective in stabilizing pH of high temperature water in boiler and
steam condensate systems [1-3].
Amines are broadly classified at the industrial scale as acid neutralizing amines
(in short NA) and film forming amines (in short FA) in their application as corrosion
inhibitors [4]. A corrosion inhibitor is defined as a chemical substance which, when
added in small concentrations, effectively checks, decreases, or prevents the reaction of a
metal with the environment. Acid neutralizing amines or alkalizing amines or volatile
amines are used to elevate the pH of water environment by neutralizing H+ ion
concentration. Film forming amines are aliphatic amines with a long hydrocarbon chain
which, may deposit on inner surfaces of metallic systems in which circulates liquid water,
forms a protecting film against aggressive corrosion causing chemicals. Numerous NA-
amines are being used as pH neutralizing and elevation agents at industrial scale. The
selection of appropriate amine is based on its basicity, volatility and stability [5].
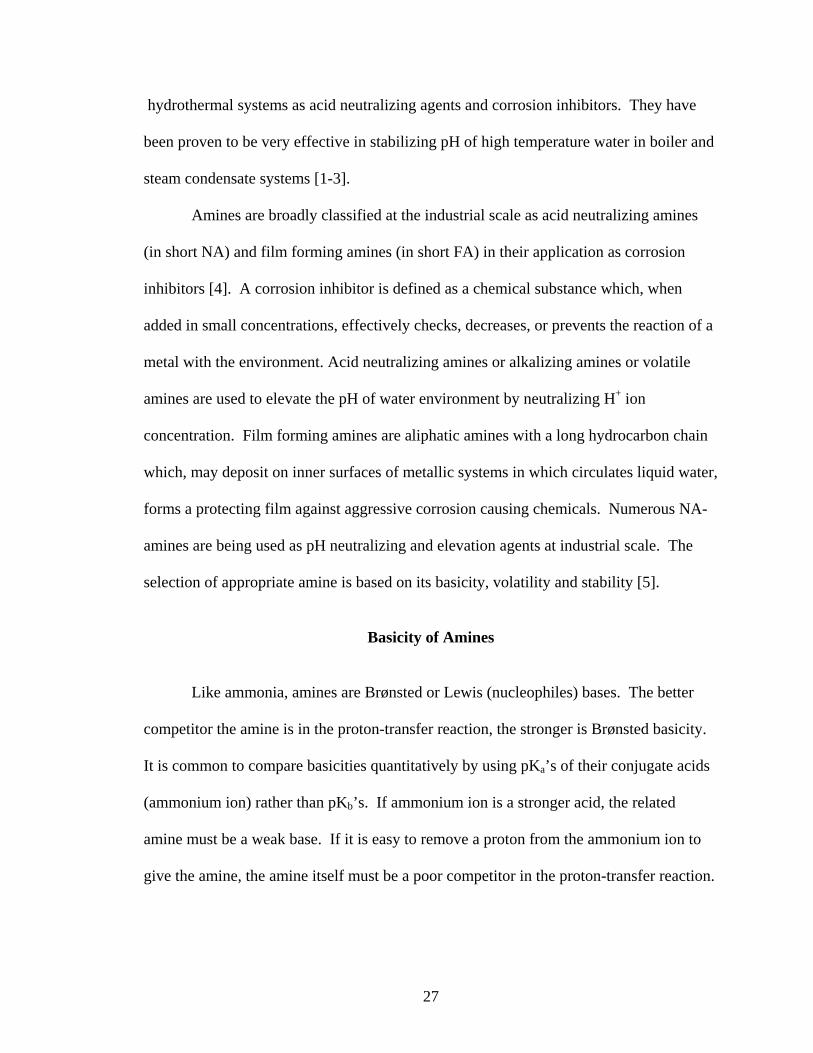
Basicity of Amines
Like ammonia, amines are Brønsted or Lewis (nucleophiles) bases. The better
competitor the amine is in the proton-transfer reaction, the stronger is Brønsted basicity.
It is common to compare basicities quantitatively by using pKa’s of their conjugate acids
(ammonium ion) rather than pKb’s. If ammonium ion is a stronger acid, the related
amine must be a weak base. If it is easy to remove a proton from the ammonium ion to
give the amine, the amine itself must be a poor competitor in the proton-transfer reaction.
27

Strongly basic amines give ammonium ions from which it is difficult to remove a proton,
ammonium ions with high pKa values [6].
Hydrogen bonding
Structure of organic amines has significant influence on their ability to accept a
proton in aqueous solutions. In other words the basicity of amine is a factor of the
structure of amine in aqueous solutions [7]. In general, the more substituted an
ammonium ion, the more stable it is. The more stable an ammonium ion, the less readily
it loses a proton, and the higher its pKa. pKa values of some simple amines in aqueous
solutions at 25oC and 1Atm are listed in Table 3.1. The general trend of pKa values on
the left hand and right hand sides of the table can be explained by concept of hydrogen
bonding. It can be observed that di-methylamine is a stronger base than methylamine;
which is, in turn, a stronger base than tri-methylamine. This trend is not observed in case
of ethanolamine in which di-ethanolamine is weaker base than mono-ethanolamine.
Things are totally different with pKa values of amines in gas phase.
Table 3.1 pKa values for some simple amines in aqueous solutions at 25oC and 1 Atm [8]
Compound pKa Compound pKa
Methylamine 10.66 ± 0.20 Primary (1o) Ethanolamine 9.16 ± 0.20
Di-methylamine 10.73 ± 0.20 Secondary (2o) Di-ethanolamine 8.71 ± 0.20
Tri-methylamine 9.75 ± 0.20 Tertiary (3o) Tri-ethanolamine 7.77 ± 0.10
In gas-phase, order of increasing pKa is +NH4 < +NRH3 < +NR2H2 < +NR3H. The
irregularities of the values in aqueous solutions can be explained by the concept of
28

hydrogen bonding. Ions in solution are strongly stabilized by solvation, by interaction of
the solvent molecules with the ion [7]. One such interaction is the formation of partial
covalent bond due to strong dipole - dipole attractions as in hydrogen bonding. An alkyl
group has two different effects on ammonium ion stability in aqueous solutions. One
effect is the stabilizing effect and other, destabilizing. An alkyl group stabilizes the
ammonium ion by dispersing the charge and simultaneously destabilizes the ion by
interfering with solvation. In case of primary amines, two hydrogen bonds are formed
between two available hydrogens and water. In addition to this, stabilizing effect of alkyl
group predominates the destabilizing effect making it a strong base. In case of secondary
amines, the destabilizing effect is almost balanced by stabilizing effect. But in tertiary
amines, the presence of three alkyl groups makes the ammonium ion more unstable and
hence the result is a less stable, more acidic ammonium ion.
CH3 N
H
H
H
HO
H
Figure 3.2 Stabilization of methyl group on ammonium ion through hydrogen bonding
In gas phase, where there is no solvation, only the stabilizing effects remain, and
each replacement of hydrogen with an alkyl group makes the ammonium ion more stable.
29

Aromaticity and hybridization
Aromatic (or aryl-) amines are weaker bases than aliphatic amines due to the
resonance delocalization of lone pair of electron on nitrogen. Hybridization also has
significant effect on basicity of aromatic amines. The greater the percentage of s-
character, the closer the lon pair of electrons to nitrogen nucleus which results in
decreased ability to participate in proton transfer reaction. Very few aromatic amines are
used at industrial scale as corrosion inhibitors. pKa values of some simple aromatic
amines in aqueous solutions at 25oC and 1 atm are tabulated in Table 3.2. Resonance
delocalization of electron pair in aniline is illustrated in Figure 3.3. Hybridization of
nitrogen atom in aniline is some where in between sp2 and sp3. Delocalization of electron
pair combined with high s-character results in low basicity of aniline [9]. In di-
phenylamine two benzene rings replace two hydrogens bonded to nitrogen atom making
it a much weaker base than aniline. This is due to the increase in degree of delocalization
of lone pair of electrons on nitrogen atom.
N N
H
H
HH
N
HH
N
HH
Figure 3.3 Reduced basicity of aniline due to electron pair delocalization
In pyridine nitrogen is sp2 hybridized and non-bonding electron pair is localized
on nitrogen atom. But increasing s-character brings it closer to nitrogen nucleus reducing
30
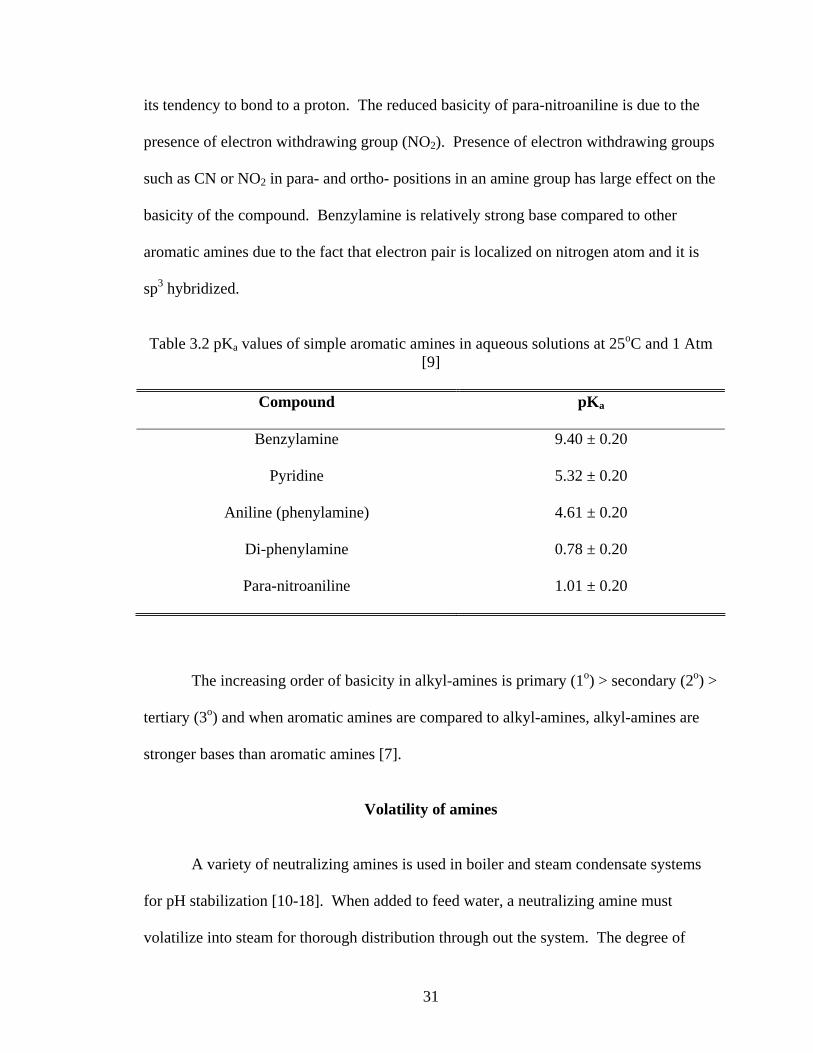
its tendency to bond to a proton. The reduced basicity of para-nitroaniline is due to the
presence of electron withdrawing group (NO2). Presence of electron withdrawing groups
such as CN or NO2 in para- and ortho- positions in an amine group has large effect on the
basicity of the compound. Benzylamine is relatively strong base compared to other
aromatic amines due to the fact that electron pair is localized on nitrogen atom and it is
sp3 hybridized.
Table 3.2 pKa values of simple aromatic amines in aqueous solutions at 25oC and 1 Atm
[9]
Compound pKa
Benzylamine 9.40 ± 0.20
Pyridine 5.32 ± 0.20
Aniline (phenylamine) 4.61 ± 0.20
Di-phenylamine 0.78 ± 0.20
Para-nitroaniline 1.01 ± 0.20
The increasing order of basicity in alkyl-amines is primary (1o) > secondary (2o) >
tertiary (3o) and when aromatic amines are compared to alkyl-amines, alkyl-amines are
stronger bases than aromatic amines [7].
Volatility of amines
A variety of neutralizing amines is used in boiler and steam condensate systems
for pH stabilization [10-18]. When added to feed water, a neutralizing amine must
volatilize into steam for thorough distribution through out the system. The degree of
31

volatilization of amine in such systems is measured by a quantity called distribution
factor or distribution ratio (DR). Distribution ratio is defined as the ratio of amount of
amine in vapor phase to the amount of amine in water phase (condensate) at a defined
pressure or temperature. Amines with distribution ratio greater than 1.0 have more amine
in vapor phase than the water phase.
Distribution ratios for commonly used neutralizing amines (at 1 atm) are tabulated
in Table 2.3. As the distribution ratio is a function of temperature and pressure at any
point in boiler / condensate system, the varying distribution ratios of commonly used NA
amines affect their ability as neutralizing agents in certain locations where the amine is
anticipated to be most effective.
Table 3.3 Distribution ratios of commonly used industrial amines.
Compound DR [Ref. 17]
pKa (25 oC, 1 atm) [Ref. 8]
Boiling Point (oC )[Ref. 8]
Morpholine 0.4 8.97 ± 0.20 128.9
Diethyl-aminoethanol 1.7 9.79±0.20 164
Dimethyl-isopropanolamine 1.7 9.43 ± 0.20 124.0
Cyclohexylamine 4.0 10.57 ± 0.20 134.5
Dimethylamine 3.0 10.73 ± 0.20 6.1 ± 3.0
Typical neutralizing amines have DR’s from 0.1 to 10; carbon dioxide has a DR
of 100 or more depending upon temperature. Because of this difference in distribution
Distribution Ratio = Amount of amine in vapor phase (steam) Amount of amine in liquid water (condensate)
32

ratios, amines and carbon dioxide tend to concentrate at remote locations within in the
hydrothermal system making it impossible for an amine to completely neutralize the
carbonic acid formed due to dissolved carbon dioxide.
The importance of distribution ratio of neutralizing amine in supercritical water is
not yet quantified. Before addressing its importance, the stability of amines at extreme
temperatures and pressures has to be evaluated. Once it is known that a particular amine
is stable at such operating conditions, the influence of distribution ratio on its pH
neutralizing capability can then be considered.
33

References
1. Strauss, S.D. Power, October 1, 1995, P.31.
2. Jonas, O.; Daniels, D. Power, October 1, 2000, P.61.
3. Daniels, D. Power, September 1, 2004, P.50.
4. Dooley, R.B.; Chexal, V.K. Flow – Accelerated Corrosion. CORROSION 99,
NACE International, Houston, 1999, Paper # 347.
5. Kilmas, S.J.; Fruzzetti, K.; Turner, C.W.; Balakrishnan, P.V.; Strati, G.L.;
Tapping, R.L. Identification and Testing of Amines for Steam Generator
Corrosion and Fouling Control. In 2003 ECI Conference on Heat Exchanger
Fouling and Cleaning: Fundamentals and Applications, Proceedings of ECI
Symposium Series, Vol. RP1, Santa Fe, New Mexico, USA, May 18-22, 2003;
Watkinson, P.W.; Steinhagen, H.S.; Malayeri, M.R Eds.
http://services.bepress.com/eci/heatexchanger/37/ (accessed November 15th,
2005).
6. Solomons, T.W.G. In Fundamentals of Organic Chemistry, 2nd ed., Wiley: New
York, 1986, pp 68-72.
7. Jones, M. Jr. In Organic Chemistry, 3rd ed., W.W. Norton: New York, 2005.
8. SciFinder Scholar Database v.2004. http://www.cas.org/SCIFINDER/SCHOLAR/
(accessed November 15th, 2005).
34

9. Reusch, W. Virtual Text Book of Organic Chemistry,
http://www.cem.msu.edu/~reusch/VirtualText/amine1.htm#amin2 (accessed 15th
November, 2005)
10. Ulmer, R.C. Prevention of Corrosion in Steam Lines. U.S Patent 2,587,249,
February 26, 1952.
11. Cuisia, D.G.; Hwa, C. Composition and Method for Inhibiting Corrosion. U.S
Patent 4,350,606, September 21, 1982.
12. Moran, F. Anticorrosive Composition. U.S Patent 4,562,042, December 31, 1985.
13. Nemes, J.; Thompson, H.W.; Waller, J.E. Composition and Method for
Deoxygenation. U.S Patent 4,656,411, December 2, 1986.
14. Walker, J.L.; Zupanovich, J.D. Stabilized Sodium Erythorbate Boiler Corrosion
Inhibitor Compositions and Methods. U.S Patent 4,681,737, July 21, 1987.
15. Fellows, L.A.; Eckler, P.E. Corrosion Inhibitors. U.S Patent 4,726,914, February
23, 1988.
16. Hwa, C.M.; Kelly, J.A.; Neton, J.; Scanlon, P.M.; Gaudette, R.R.; Hudson, N.H.
Control of Corrosion in Aqueous Systems Using Certain Phosphonomethyl
Amines, U.S Patent 5,019,343
17. Rossi, A.M.; Vincentown, N.J.; McDonald, A.C. Corrosion Control Composition
and Method for Boiler/Condensate Steam System, U.S Patent 5,368,775,
November 29, 1994.
18. Braden, V.K.; Fearnside, P.; Murphy, C.J. Amine Blend Neutralizers for Refinery
Process Corrosion, U.S Patent 5,965,785, October 19, 1999.
35

CHAPTER IV
KINETICS AND MECHANISMS
The selection criterion for an amine as a pH stabilizing agent depends on its
stability, basicity and volatility. If an amine is not stable in a solvent (in this case, water)
at process operating temperatures and pressures, it decomposes forming undesirable light
molecular weight compounds such as ammonia. Before evaluating amine basicity and
volatility, it is important to figure out how stable the amine is. Different amines
decompose in respective solvents at different rates based on their chemical structure,
reactivity and process operating conditions.
Little data are available on decomposition kinetics of amines in supercritical
water. This chapter focuses on two major topics, reaction kinetics and mechanisms
which are fundamental in evaluating organic amine stability in supercritical water.
Reaction kinetics of amines in this study is the decomposition or degradation kinetics; the
reactants being the organic amine and water at supercritical conditions (Tc = 374 oC and
Pc = 22.4 MPa). The usual way of investigating a chemical reaction is to start from
stoichiometry, then the Kinetics, followed by investigation of the chemical mechanism
involved. Stoichiometry of a reaction can be determined only when complete
information of the final reaction products is known. The importance of stoichiometry
will be discussed only when needed.
36
Literature Review
No literature was found investigating the degradation kinetics of amines in
supercritical water highlighting their potential as pH stabilizing agents. Research
involving supercritical water has focused on two broad areas until the mid 1900’s;
supercritical fluid extraction (SFE) and supercritical water oxidation (SCWO) [1, 2]. The
Nuclear Energy Research Initiative (NERI) program (1999) initiated advanced research
in promoting supercritical water as nuclear reactor coolant for power generation. The
literature reviewed in this section is related to either supercritical fluid extraction (SFE)
or supercritical water oxidation (SCWO). It is beyond the scope of this work to present
extensive details about SFE or SCWO; the end uses of presented data in these sources
may be for different purposes but it can help evaluate current research interests. The
following sections are subcategorized based on compounds of similar structure and/or
attached organic/inorganic molecular group.
Benzylamine
Houser and coworkers studied the reactions of 1,2,3,4-tetrahydroquinoline (THQ)
and benzylamine in supercritical water [3]. These reactions were carried out in a batch
reactor in presence of zinc chloride catalyst. Gaseous phase products were not analyzed
after the completion of reaction; aqueous phase products were analyzed using standard
gas chromatography and mass spectroscopy. It was observed that the rate of conversion
of THQ is not influenced by the presence of ZnCl2 catalyst. However, it did influence the
formation of quinoline, a major product formed in the reaction, enhancing its yield. It
was also reported that the presence of catalyst favors the formation of low molecular
37

products such as ammonia. Only trace amounts of ammonia were found when the
catalyst was not used.
Table 4.1 Products of benzylamine pyrolysis [Houser et al., Ref. 3]
Time: 1h; Temperature: 400oC; 100% reacted
Volatile products % yield
Toluene 26.9
Benzonitrile 9.5
Diphenyl methane 1.2
Bibenzyl 18.1
Stilbene 11.7
Methylcarbazole 0.6
Diphenylmethylene indole 7
Triphenylimidazole 3.8
Tetraphenylpyrrole 6
Experiments with benzylamine were carried out without ZnCl2 catalyst. The final
reaction products of pyrolysis were compared to reaction products of benzylamine and
supercritical water reaction. Benzylamine completely reacted with supercritical water and
it was reported that supercritical water has significant effect on the final reaction
products.
38
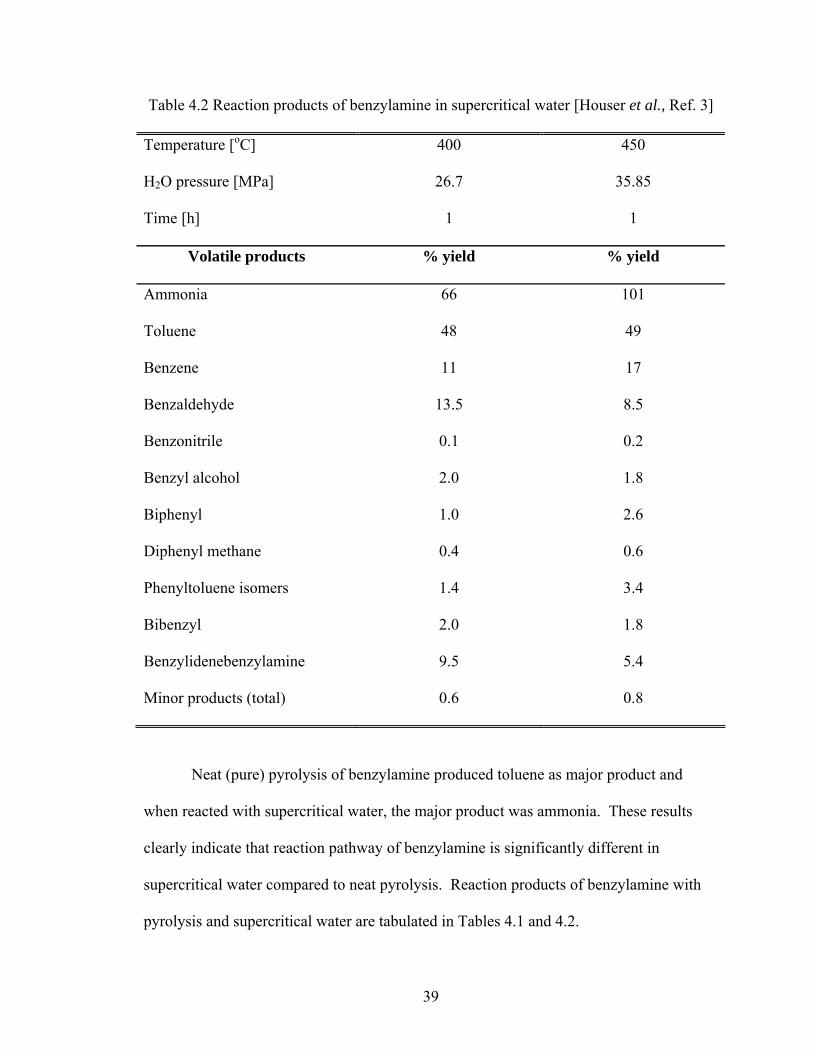
Table 4.2 Reaction products of benzylamine in supercritical water [Houser et al., Ref. 3]
Temperature [oC] 400 450
H2O pressure [MPa] 26.7 35.85
Time [h] 1 1
Volatile products % yield % yield
Ammonia 66 101
Toluene 48 49
Benzene 11 17
Benzaldehyde 13.5 8.5
Benzonitrile 0.1 0.2
Benzyl alcohol 2.0 1.8
Biphenyl 1.0 2.6
Diphenyl methane 0.4 0.6
Phenyltoluene isomers 1.4 3.4
Bibenzyl 2.0 1.8
Benzylidenebenzylamine 9.5 5.4
Minor products (total) 0.6 0.8
Neat (pure) pyrolysis of benzylamine produced toluene as major product and
when reacted with supercritical water, the major product was ammonia. These results
clearly indicate that reaction pathway of benzylamine is significantly different in
supercritical water compared to neat pyrolysis. Reaction products of benzylamine with
pyrolysis and supercritical water are tabulated in Tables 4.1 and 4.2.
39

Observation of Table 4.1 and 4.2 indicates that benzene, biphenyl and
benzylidenebenzylamine (BBA) are absent in pyrolysis where as toluene, diphenyl
methane and bibenzyl were common reaction products in both the reactions. This
suggests that there might be two different reaction pathways for benzylamine
decomposition in supercritical water. One pathway involves the formation of ammonia
and toluene and the other involves the oxidation of benzylic carbon which results in
formation of benzene. The latter pathway is possible only when there is a source of
hydrogen present, in this case water. However, it has to be noted that ammonia is formed
in trace quantities in pyrolysis. No kinetic data for the decomposition of benzylamine in
supercritical water or pyrolysis have been reported. The possibility of two reaction
mechanisms in supercritical water is qualitatively discussed but not confirmed. The
second reaction pathway (oxidation/hydrolysis), where hydrogen is utilized, is
Benzylamine
CH2H2N
H2O CO2 NH3 2H2
Nitro-anilines
Wang and coworkers studied the pyrolysis reaction pathways and stability of
nitroanilines with nitro and amino substituents in high temperature water (100oC < T <
374oC) [4]. The compounds selected for this study are 2-nitroaniline (2NA), 4-
nitroaniline (4NA), 2,6-dinitroaniline (2,6-DNA), 2-nitro-1,4-phenylenediamine
(2NPDA), 3-nitro-1,2-phenylenediamine (3NPDA), and 4-nitro-1,2-phenylenediamine
(4NPDA). All the experiments were carried out in batch reactors. It was reported that
40
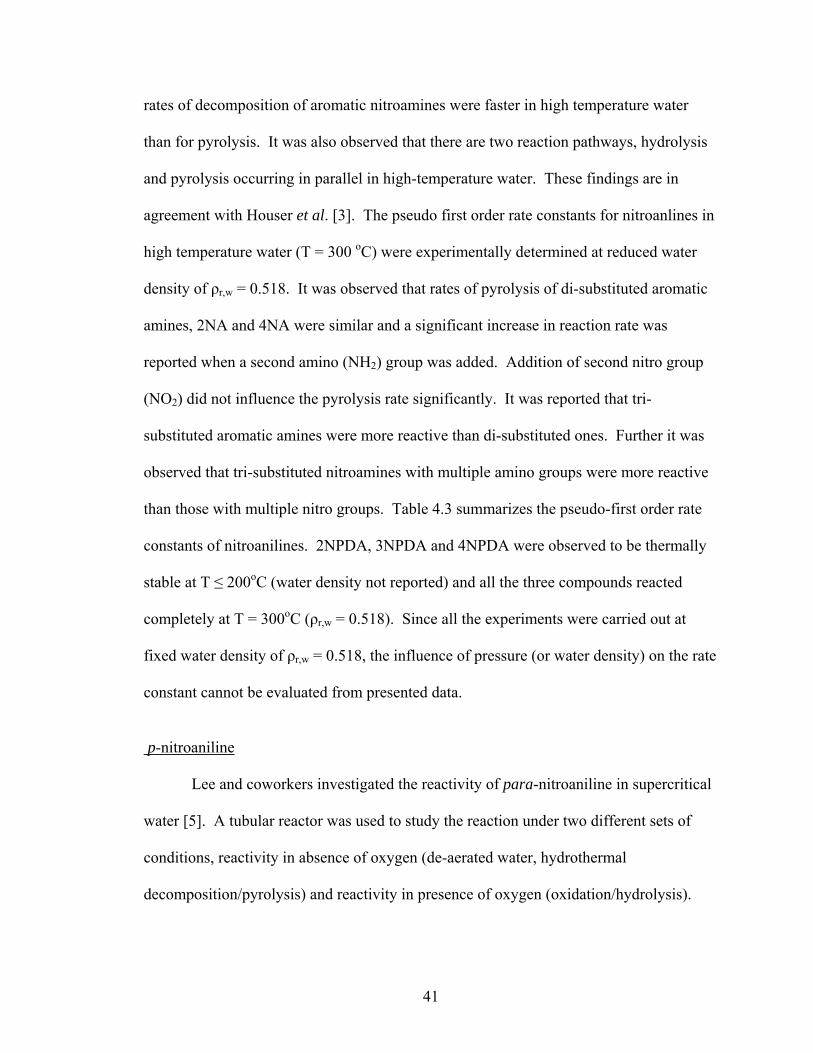
rates of decomposition of aromatic nitroamines were faster in high temperature water
than for pyrolysis. It was also observed that there are two reaction pathways, hydrolysis
and pyrolysis occurring in parallel in high-temperature water. These findings are in
agreement with Houser et al. [3]. The pseudo first order rate constants for nitroanlines in
high temperature water (T = 300 oC) were experimentally determined at reduced water
density of ρr,w = 0.518. It was observed that rates of pyrolysis of di-substituted aromatic
amines, 2NA and 4NA were similar and a significant increase in reaction rate was
reported when a second amino (NH2) group was added. Addition of second nitro group
(NO2) did not influence the pyrolysis rate significantly. It was reported that tri-
substituted aromatic amines were more reactive than di-substituted ones. Further it was
observed that tri-substituted nitroamines with multiple amino groups were more reactive
than those with multiple nitro groups. Table 4.3 summarizes the pseudo-first order rate
constants of nitroanilines. 2NPDA, 3NPDA and 4NPDA were observed to be thermally
stable at T ≤ 200oC (water density not reported) and all the three compounds reacted
completely at T = 300oC (ρr,w = 0.518). Since all the experiments were carried out at
fixed water density of ρr,w = 0.518, the influence of pressure (or water density) on the rate
constant cannot be evaluated from presented data.
p-nitroaniline
Lee and coworkers investigated the reactivity of para-nitroaniline in supercritical
water [5]. A tubular reactor was used to study the reaction under two different sets of
conditions, reactivity in absence of oxygen (de-aerated water, hydrothermal
decomposition/pyrolysis) and reactivity in presence of oxygen (oxidation/hydrolysis).
41
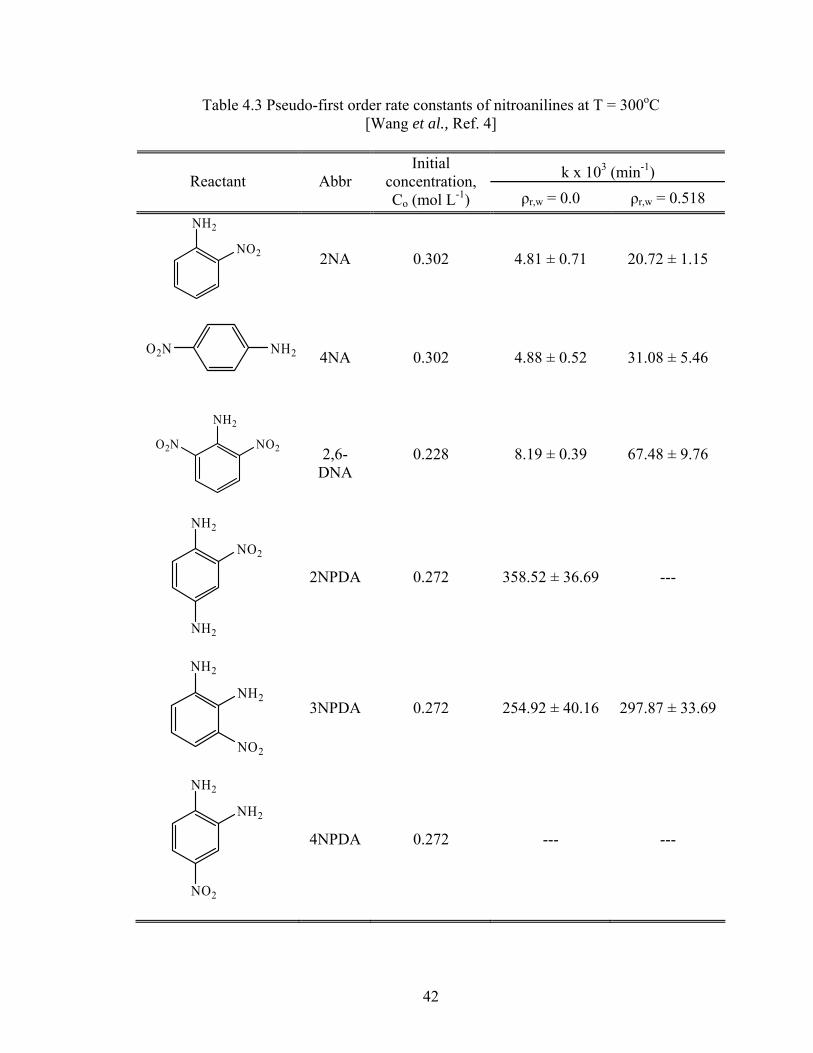
Table 4.3 Pseudo-first order rate constants of nitroanilines at T = 300oC [Wang et al., Ref. 4]
k x 103 (min-1) Reactant Abbr Initial
concentration, Co (mol L-1) ρr,w = 0.0 ρr,w = 0.518
NH2
NO2
2NA 0.302 4.81 ± 0.71 20.72 ± 1.15
O2N NH2
4NA 0.302 4.88 ± 0.52 31.08 ± 5.46
NH2
NO2O2N
2,6-DNA
0.228 8.19 ± 0.39 67.48 ± 9.76
NH2
NO2
NH2
2NPDA 0.272 358.52 ± 36.69 ---
NH2
NH2
NO2
3NPDA 0.272 254.92 ± 40.16 297.87 ± 33.69
NH2
NH2
NO2
4NPDA 0.272 --- ---
42

It was reported that overall reaction rate significantly increased with addition of oxygen.
Activation energies of pyrolysis and pyrolysis combined with hydrolysis were calculated
experimentally. The observed trends in the reaction rates are in agreement with data
published by Wang et al. [4]. However, the authors did not address the key issues such
as possible reaction mechanism and the effect of solvent density on the overall reaction
rate which makes the kinetic model a mere correlation of generated experimental data
and does not account for possible influence of solvent properties.
Benzylphenylamine
Abraham and Klein studied the pyrolysis reaction of benzyl phenyl amine (BPA)
in sub and supercritical water [6]. All the reactions were carried out in a batch reactor at
340oC (subcritical) and 386oC (supercritical). The operating pressure at supercritical
conditions was reported as Pr = 1.09 (reduced pressure). The major reaction products
identified in both cases were aniline, benzyl alcohol and toluene, aniline being major
product at sub and supercritical conditions. The yields of benzyl alcohol and toluene
changed significantly with increase in reaction temperature, the former being the second
major product to aniline at subcritical conditions and the latter being the second major
product at supercritical conditions. It was observed that the reactivity of BPA was lower
in supercritical water. The pseudo-first order rate constant for BPA reaction in subcritical
water was observed to be 2.8 x 10⁻⁴ s-1 and in supercritical water the rate was 6.60 x 10⁻⁴
s-1. The yields of major reaction products are summarized in Figures 4.1 and 4.2.
Townsend and coworkers studied chemical kinetics and reaction mechanisms of
heteroatom containing coal model hydrocarbons in supercritical water [7]. One of the
compounds investigated was benzylphenylamine at water densities of 0 < ρr,w < 2.1 and T
43

= 386 oC. The major products observed were toluene, aniline and benzaniline at ρr,w =
0.0 and benzyl alcohol at ρr,w = 1.2. It was also observed that selectivity of aniline, was
relatively uneffected by solvent density. However, solvent density was observed to
significantly effect the selectivity of toluene which decreased as the water density
increased indicating that pyrolysis is inhibited by increasing water density. The
selectivity of benzyl alcohol was observed to increase with increasing water density
indicating that increasing density favors hydrolysis. On the whole, decomposition of
BPA in supercritical water is aided by parallel hydrolysis and pyrolysis pathways,
hydrolysis dominating at high solvent densities and pyrolysis dominating at low densities.
The conversion rates of BPA in pyrolysis (ρr,w = 0.0) were observed to be higher (about
0.8) when compared to hydrolysis (ρr,w = 1.2) where the conversion was around 0.7.
These findings are not in agreement with the conversion rates observed by Wang et al.
[5] for nitroanilines where the reaction rate rapidly increased with addition of water (T =
300 oC). It has to be noted that there is a difference in operating temperature of the
experiments. Pyrolysis and hydrolysis products of BPA are summarized in Table 4.4. In
addition to BPA, the authors also studied the reactions of dibenzyl ether, phenethyl
phenyl ether, guaiacol, and benzyl phenyl ether. Based on the reaction products of these
compounds in supercritical water and their pyrolysis products, it was concluded that the
mechanism of hydrolysis in supercritical water requires a heteroatom (in case of BPA,
nitrogen). Further, for hydrolysis mechanism to occur, the reactant (organic compound)
should contain a saturated carbon to which the heteroatom is attached.
44

Figure 4.1 Yields of major reaction products of benzyl phenyl amine pyrolysis in water at 340oC [Abraham and Klein, Ref. 6]
Figure 4.2 yields of major reaction products of benzyl phenyl amine pyrolysis in
water at 386oC [Abraham and Klein, Ref. 6]
45
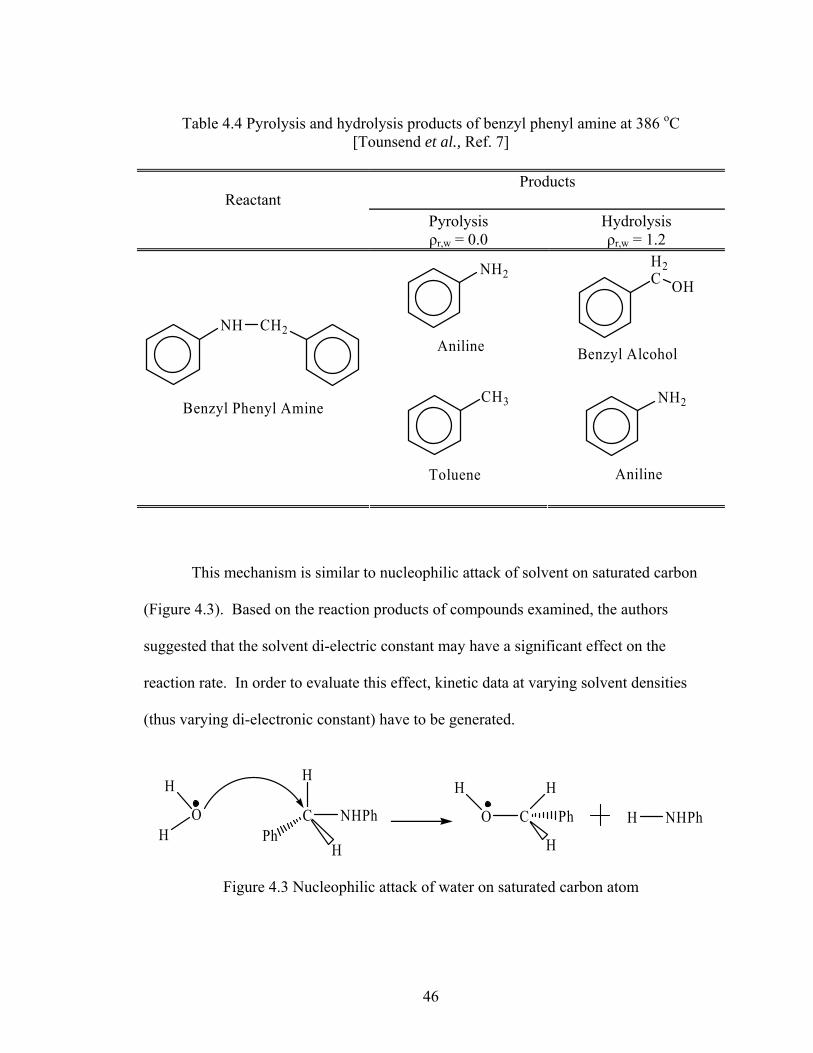
Table 4.4 Pyrolysis and hydrolysis products of benzyl phenyl amine at 386 oC
[Tounsend et al., Ref. 7]
Products Reactant
Pyrolysis ρr,w = 0.0
Hydrolysis ρr,w = 1.2
NH2
Aniline
H2C OH
Benzyl Alcohol
NH CH2
Benzyl Phenyl AmineCH3
Toluene
NH2
Aniline
This mechanism is similar to nucleophilic attack of solvent on saturated carbon
(Figure 4.3). Based on the reaction products of compounds examined, the authors
suggested that the solvent di-electric constant may have a significant effect on the
reaction rate. In order to evaluate this effect, kinetic data at varying solvent densities
(thus varying di-electronic constant) have to be generated.
H
OH
C NHPh
H
HPh
C
H
PhO
H
H
H NHPh
Figure 4.3 Nucleophilic attack of water on saturated carbon atom
46

Methylamine
Benjamin and Savage studied the reactions of methylamine in supercritical water
from 386 and 500 oC and water densities from 40 to 540 kg m-3 [8]. Experiments were
carried out in stainless-steel batch reactors; gas phase products were not analyzed. At
low water densities (ρw ≤ 260 kg m-3) it was observed that reactivity of methylamine was
not influenced by variation in solvent density and methylamine conversion was too low,
the major reaction product was ammonia. In this low density region the conversion of
methylamine almost remained constant. When the water density was increased above
260 kg m-3, the reactivity of methylamine increased, and the major product formed in this
high density region was methanol. Based on these observations, it was reported that
pyrolysis of methylamine occurred in low water density region and hydrolysis dominated
in high water density region. These findings are in agreement with results published by
Houser et al. [3], Townsend et al. [7], and Wang et al. [4]. The experimental data at
different temperatures were used to generate Arrhenius relation for rate constant in low
density region (ρw less than 300 kg m-3) where solvent has barely any effect over the
reaction kinetics.
The proposed Arrhenius equation is
134.030.21.6 )/(,/738exp10 −± ⎟
⎠⎞
⎜⎝⎛ ±−
= scmmolRT
molkcalk
The order of reaction with respect of methylamine in this region was found to be 0.66 ±
0.11 which further gives the global rate expression of methylamine degradation kinetics
in supercritical water at water densities below 300 kg m-3 as
47
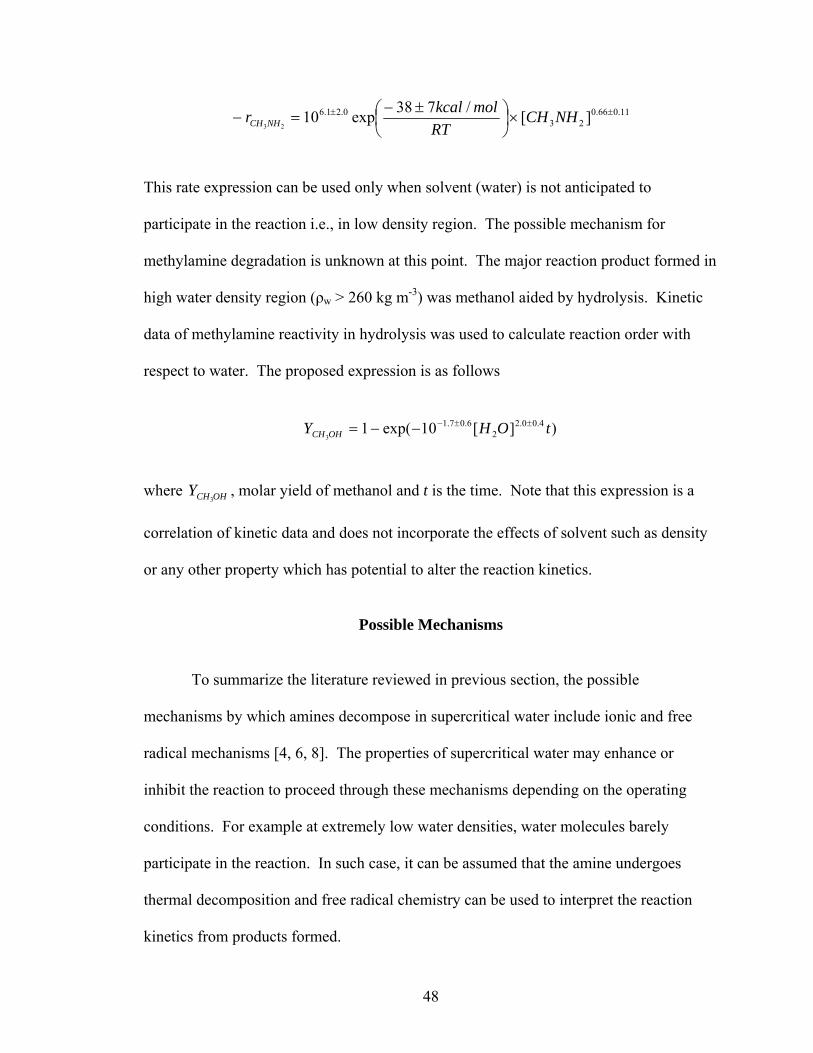
11.066.023
0.21.6 ][/738exp1023
±± ×⎟⎠⎞
⎜⎝⎛ ±−
=− NHCHRT
molkcalr NHCH
This rate expression can be used only when solvent (water) is not anticipated to
participate in the reaction i.e., in low density region. The possible mechanism for
methylamine degradation is unknown at this point. The major reaction product formed in
high water density region (ρw > 260 kg m-3) was methanol aided by hydrolysis. Kinetic
data of methylamine reactivity in hydrolysis was used to calculate reaction order with
respect to water. The proposed expression is as follows
)][10exp(1 4.00.2
26.07.1
3tOHY OHCH
±±−−−=
where , molar yield of methanol and t is the time. Note that this expression is a
correlation of kinetic data and does not incorporate the effects of solvent such as density
or any other property which has potential to alter the reaction kinetics.
OHCHY3
Possible Mechanisms
To summarize the literature reviewed in previous section, the possible
mechanisms by which amines decompose in supercritical water include ionic and free
radical mechanisms [4, 6, 8]. The properties of supercritical water may enhance or
inhibit the reaction to proceed through these mechanisms depending on the operating
conditions. For example at extremely low water densities, water molecules barely
participate in the reaction. In such case, it can be assumed that the amine undergoes
thermal decomposition and free radical chemistry can be used to interpret the reaction
kinetics from products formed.
48

Free radical mechanism
Higashihara and coworkers studied the thermal decomposition of methylamine in
the temperature range of 1400 and 1820 K [9]. The possible steps involved in the
decomposition according to them is
CH3NH2 CH3 + NH2
CH3 + CH3NH2 CH4 + CH2NH2
CH3 + CH2NH2 CH4 + CH2NH
NH2 + CH3NH2 NH3 + CH2NH2
NH2 + CH2NH2 NH3 + CH2NH
CH2NH H2 + HCN
With increase in water density, the concentration of hydroxyl and hydronium ions
increase resulting in the increased possibility for water to participate in the reaction. This
might significantly change products formed in the reaction steps shown above. Hence
free radical chemistry can be used to explain the product formation in low water density
region where pyrolysis is major reaction pathway. If water is assumed to participate in
the reaction at elevated water densities then the reaction pathway can be interpreted
through either ionic or molecular mechanisms.
Ionic mechanism
Most of the reactions involving organic compounds through ionic pathway
include substitution reactions on carbon atom [10]. In case of organic amines in
supercritical water, there is a possibility for the reaction to occur through nucleophilic
substitution reaction, the nucleophile, X being either hydroxyl ion or water molecule
49

itself (Figure 4.4). The nucleophilic substitutions reactions fall into two categories, SN1
and SN2 [11]. SN1 stands for substitution nucleophilic uni-molecular and SN2 stands for
substitution nucleophilic bi-molecular. In SN1 reaction, the global reaction rate is
independent of concentration of nucleophile where as in SN2 reaction global reaction rate
is dependent on the concentrations of both amine and attacking nucleophile.
X + C NH2
Y
R
R C NH2
X
R
R + Y
Figure 4.4 Substitution reactions of amines
The qualitative picture of these two reactions is that in SN2 mechanism the
nucleophile attacks the amine molecule forcing it to depart (Figure 4.5) where as SN1
mechanism proceeds through the stabilization transition complex by the cation formed
from amine molecule followed by subsequent attack of nucleophile on cation. The
structure of amine molecule plays an important role in determining whether the
substitution is carried through SN1 or SN2 mechanisms. For example, SN2 mechanism is
likely to operate if the substitution site is sterically unhindered (Figure 4.5). The
nucleophilic substitution mechanism is likely to occur only when water molecules
actively participate in the reaction.
X + C Y CX ..... ..... Y
‡
X C + Y
Figure 4.5 Transition state complex in SN2 reaction
50

The reaction kinetics alone is not sufficient to distinguish between SN1 and SN2
mechanism pathways in a solution [10]. This is because in any solution as the reaction
proceeds, the concentration of solvent nucleophile participating in the reaction is always
in excess and does not change significantly. SN2 mechanism consists of a single
elementary step in which nucleophile attacks the amine to form final product where as
SN1 mechanism consists of two steps: rate determining step of amine dissociation to
carbocation and subsequent rapid attack of nucleophile on carbocation. So the possibility
of a bimolecular reaction cannot be ruled out when the reaction rate is independent of
nucleophile concentration.
Discussion
To summarize the results in this section, organic amines decompose in
supercritical water aided by pyrolysis at low water density and by both pyrolysis and
hydrolysis at high density; the density of water at which a shift from pyrolysis to
hydrolysis takes place is compound specific. Taking into account the fact that
supercritical water supports free radical, polar and ionic mechanisms [11], the literature
on organic amine degradation mechanisms in supercritical water is sparse. Careful
observation of published kinetic data of methylamine reveals that methylamine is more
stable than benzyl phenyl amine (BPA) and benzylamine (BA) in water at supercritical
conditions. This behavior can be attributed to weaker C-N bonds in aromatic compounds
[8]. From these investigations it can be taken for granted that aliphatic amines are more
stable than aromatic amines in supercritical water and can serve as good pH neutralizing
agents.
51

The influence of solvent properties is dominant on reaction kinetics, especially in
hydrolysis [6-8, 11]. Better prediction of conversion rates is possible if these solvent
effects are taken into consideration while formulating the rate equation. Such solvent
effects include the effect of dielectric constant of water (ε) [4, 7, 8, 12-20], density of
water (ρw) and ionic product of water (Kw) [21]. When searching for the possible
reaction mechanism, it should be noted that mechanism and kinetic equation are
interdependent. Hence the approach for determination of reaction mechanism is an
iterative process in which certain changes in kinetic rate equation should to be made.
The stability of methylamine in supercritical water gave hope that amines have
the potential to remain stable and neutralize the acid concentration. The effect of
supercritical state of water on reactivity of amines has to be addressed next. The next
chapter deals with possible interaction of solvent and the effects of its properties on
reaction rate of amine in supercritical water and on their basicity.
52

References
1. Savage, P.E.; Gopalan, S.; Mizan, T.I.; Martino, C.J.; Brock, E.E. Reactions at
Supercritical Conditions: Applications and Fundamentals. AIChE J. 1995, 41,
1723.
2. Izzo, B.; Harrell, C.L.; Klein, M.T. Nitrile Reaction in High-Temperature Water:
Kinetics and Mechanism. AIChE J. 1997, 43, 2048.
3. Houser, T.J.; Tsao, C.C.; Dyla, J.E.; Van Atten, M.K.; McCarville, M.E. The
Reactivity of Tetrahydroquinoline, benzylamine and bibenzyl with supercritical
water. Fuel, 1989, 68, 323.
4. Wang, X.; Gron, L.U.; Klein, M.T. The Influence of High-Temperature Water on
the Reaction Pathways of Nitroanilines. J. Supercrit. Fluids 1995, 8, 236.
5. Lee, D.S.; Park, K.S.; Nam, Y.W.; Kim, Y.C.; Lee, C.H. Hydrothermal
decomposition and oxidation of p – nitroaniline in supercritical water. J. Hazard.
Mater. 1997, 56, 247.
6. Abraham, M.A.; Klein, M.T. Pyrolysis of Benzylphenylamine Neat and with
Tetralin, Methanol, and Water Solvents. Ind. Eng. Chem. Prod. Res. Dev. 1985,
24, 300.
7. Townsend, S.H.; Abraham, M.A.; Huppert, G.L.; Klein, M.T.; Paspek, S.C.
Solvent Effects During Reactions in Supercritical Water. Ind. Eng. Chem. Res.
1988, 27, 143.
53

8. Benjamin, K.M.; Savage, P.E. Hydrothermal Reactions of Methylamine. J.
Supercritical Fluids 2004, 31, 301.
9. Higashihara, T.; Gardiner, W.C.; Hwang, M. Shock Tube Modeling Study of
Methylamine Thermal Decomposition. J. Phys. Chem. 1987, 91, 1900.
10. Lowry, T.H.; Richardson, K.S. In Mechanism and Theory in Organic Chemistry,
2nd Ed., Harper & Row: New York, 1981, Pp 291-366.
11. Akiya, N.; Savage, P.E. Roles of Water for Chemical Reactions in High-
Temperature Water. Chem. Rev. 2002, 102, 2725.
12. Iyer, S.D.; Klein, M.T. Effect of Pressure on the Rate of Butyronitrile Hydrolysis
in High-Temperature Water. J. Supercrit. Fluids 1997, 10, 191.
13. Habenicht, C.; Kam, L.C.; Wilschut, M.J.; Antal, M.J. Homogeneous Catalysis of
Ethyl Tert-Butyl Ether Formation from Tert-Butyl Alcohol in Hot, Compressed
Liquid Ethanol. Ind. Eng. Chem. Res. 1995, 34, 3784.
14. Xiang, T.; Johnston, K.P. Acid Base Behavior of Organic Compounds in
Supercritical Water. J. Phys. Chem. 1994, 98, 7915.
15. González, G.; Montané, D. Kinetics of Dibenzylether Hydrothermolysis in
Supercritical Water. AIChE J. 2005, 51, 971.
16. Venardou, E.; Garcia-Verdugo, E.; Barlow, S.J.; Gorbaty, Y.E.; Poliakoff, M. On-
line Monitoring of the Hydrolysis of Acetonitrile in Near-Critical Water using
Raman Spectroscopy. Vibrational Spectroscopy 2004, 35, 103.
17. Marrone, P,A.; Arias, T.A.; Peters, W.A.; Tester, J.W. Solvation Effects on
Kinetics of Methylene Chloride Reactions in Sub- and Supercritical Water:
Theory, Experiment, and Ab Initio Calculations. J. Phys. Chem. 1998, 102, 7013.
54
18. Salvatierra, D.; Taylor, J.D.; Marrone, P.A.; Tester, J.W. Kinetic Study of
Hydrolysis of Methylene Chloride from 100 to 500oC. Ind. Eng. Chem. Res. 1999,
38, 4169.
19. Antal, M.J., Jr.; Brittain, A.; Dealmedia, C.; Ramayya, S.; Roy, J.C. Heterolysis
and Homolysis in Supercritical Water. in Supercritical Fluids, Squires, T.G.,
Paulaitis, M.E., Eds.; Acs Symp. Ser. 1987, 329, 77.
20. Connors, K.A. In Chemical Kinetics: Study of Reaction Rates in Solution, Vch:
New York, 1990, Pp 407.
21. Ryan, E.T.; Xiang, T.; Johnston, K.P.; Fox, M.A. Excited-State Proton Transfer
Reactions in Subcritical and Supercritical Water. J. Phys. Chem. 1996, 100, 9395.
55

CHAPTER V
SOLVENT EFFECTS
Water, when heated from ambient to supercritical conditions, transforms from
being a dense, strongly-polar, hydrogen-bonded liquid to a lower density, non-polar fluid
with gas like diffusivity and viscosity [1-3]. Supercritical water exhibits properties that
are very different from those of ambient liquid water. Supercritical water has a lower
dielectric constant, fewer and weaker hydrogen bonds and a high isothermal
compressibility than ambient liquid water. The ion product, or dissociation constant
(KW) for water as it approaches the critical point, is about 3 orders of magnitude than it is
for ambient liquid water. Beyond the critical point KW decreases dramatically making
supercritical water a poor medium for ionic chemistry. For example KW is about nine
orders of magnitude lower at 600 oC and about 24 MPa than it is at ambient conditions.
The literature available on reactions of various organic compounds including
amines in supercritical water provides strong precedent for noticeable solvent effects on
reaction rates. The quantities most likely to affect reaction rate of amines and other
organic compounds in supercritical water are density and dielectric nature of the solvent.
The possible reaction mechanisms involved in the degradation of organic amines in
supercritical water involves free-radical, ionic and molecular mechanisms. The free-
radical mechanism is predominantly observed in low-water density region where the
reaction pathway proceeds through pyrolysis of amine molecule. It is in the hydrolysis
56

region where there is a possibility of amine undergoing degradation through ionic and
molecular mechanisms [6]. The affect of properties of solvent medium on these reaction
pathways in hydrolysis contributes to the deviation of reaction rate from Arrhenius-like
behavior.
Literature Review
Townsend et al. [4] observed parallel pyrolysis and hydrolysis reaction
mechanisms of coal model compounds in supercritical water and it was reported that
hydrolysis reaction rate of dibenzylether and guaiocol is strongly dependent on the
dielectric constant of the solvent medium. Similar trends were observed in the study of
reactions of nitroaniline explosive simulants in high temperature and supercritical water
by Wang et al. [5]. Benjamin and Savage [6] studied the reaction of methylamine in
supercritical water and found that solvent dielectric constant has significant effect on the
reaction rate. In addition, they reported that hydrolysis mechanism may be aided either
by SN2 or molecular mechanism with one water molecule in which the transition state is
more polar than the reactants. A dielectric constant dependent term was incorporated by
Iyer and Klein [7] into the rate equation for correlating the rate constant of butyronitrile
hydrolysis to account for changes in the electrostatic nature of solvent resulting from
pressure variation. Improved fits in the reaction model of synthesis of ethyl tert-butyl
ether from tert-butyl alcohol in liquid ethanol were observed by Habenicht et al. [8] when
the influence of solvent dielectric constant was taken into account. Xiang and Johnston
[9] studied the reaction of β-naphthol and base (OH-) in supercritical water up to 400oC
and 470 bar and reported that density and dielectric nature of solvent influences the
57
equilibrium rate constant at constant temperature. Ryan et al. [10] investigated the
dynamics of proton transfer from 2-naphthol to various bases in sub and supercritical
water and reported that dielectric constant of reaction medium has significant effect on
the proton transfer reaction. González and Montané [11] observed that the reaction rate
of Dibenzylether hydrolysis in supercritical water is lowered with increase in dielectric
constant of solvent medium indicating that transition complex is less polar than the
reactants. Venardou et al. [12] investigated the hydrolysis reaction of acetonitrile at near
critical conditions and suggested that solvent properties like dielectric constant and ionic
product may have a significant affect on the reaction rate and final product composition.
Researchers at Massachusetts Institute of Technology incorporated a correction term into
their rate expression which accounts for solvation effects in the reaction kinetics of
methylene chloride in sub and supercritical conditions [13-14].
Ion Product (KW)
Literature concerning hydrolysis of organic amines in near critical and supercritical
water suggests that there is a possibility for reaction pathway to proceed through ionic
mechanism. Three such possible mechanisms in hydrolysis region were suggested by
Benjamin and Savage [6]:
1. SN2 reaction with water as nucleophile
2. SN2 reaction with hydroxyl ion as nucleophile (base-catalyzed)
3. Protonation of organic amine by hydronium ion (acid-catalyzed)
58
These mechanisms were discussed in detail in Chapter IV. All the above mechanisms
involve either hydroxyl ion (OH-) or hydronium ion (H3O+), or both. The concentration
of hydroxyl and hydronium ions (or concentration of water) is expressed by ion product
(KW) of water at specific temperature and pressure. KW of water is not a strong function
of pressure at sub-critical conditions. However, beyond the critical point, it varies
dramatically with increase in pressure (Figure 5.1). Ion product when plotted against
density, a smooth curve is observed (Figure 5.2). If the reaction pathway follows ionic
mechanism, then very slight changes in pressure can dramatically change the ionic
product further influencing the rate determining kinetic equation.
Now it is evident that ion product of water is a key parameter for tuning the
reaction rate in hydrolysis region provided the reaction pathway is through ionic
mechanism. The next step is to evaluate the conditions favorable for reaction to proceed
through ionic pathway. Ionic mechanisms in any aqueous system are favored when KW >
10-14 [15]. At such relatively higher concentration of hydroxyl and hydronium ions, the
probability of attack by one of either ion on amine molecule in amine – water system is
higher. From Figure 5.2, it can be inferred that increase in pressure increases the ion
product of water at a fixed density. Although the variation in ion product with pressure at
a fixed density is low, this behavior can help fine tune ion product to desired values with
variation in pressure. At conditions where KW <<10-14 (Figure 5.2), the concentration of
hydroxyl and hydronium ions in water is lowered resulting in low probability for ionic
mechanisms. In this region, radical mechanisms dominate are most favored in systems
with water as a solvent medium.
59

-24
-22
-20
-18
-16
-14
-12
-100 100 200 300 400 500 600
Temperature [oC]
log[
Kw (m
ol /
l)2 ]
P = 42 MPaP = 36 MPaP = 30 MPaP = 24 MPa
Figure 5.1 Isobaric variation of Ion Product of water (KW) with temperature [19]
60

-24
-23
-22
-21
-20
-19
-18
-17
-16
-15
-14
-13
-12
-11
-10
-90 200 400 600 800 1000
Density [Kg m-3]
log
[Kw(m
ol /
l)2]
42 Mpa36 Mpa30 Mpa24 Mpa
Favorable region for ionic mechanisms
Favorable region for free-radical mechanisms
Figure 5.2 Isobaric variation of Ion product of water (KW) with density [19]
61

Dielectric constant (ε)
Previous studies [4, 6] showed that hydrolysis of organic compounds in
supercritical water can be interpreted using transition state theory. According to
transition state theory, the rate constant for reaction at temperature T and density ρ is
given by
⎟⎟⎠
⎞⎜⎜⎝
⎛ ∆−⎥⎦
⎤⎢⎣⎡= −
RTG
hTkk nB
‡)1( expρκ (5.1)
where
‡‡ ln KRTG −=∆ (5.2)
Where κ is the transmission coefficient, n is the sum of reactants stoichiometric
coefficients, and is the free energy of activation [16]. For the reaction occurring in
solvent medium, the solute (organic amine) – solvent (water) interactions influence the
rate constant by modifying the free energy of activation and transmission coefficient.
‡G∆
The change in free energy of activation due to solvent-solute interactions are termed as
equilibrium solvation effects. In such cases, the pressure and density dependence of
reaction rate can be derived from equations 5.1 and 2.
RT)1(ln ‡vn
Pk
TT
∆−−=⎥⎦
⎤⎢⎣⎡∂∂ κ (5.3)
⎟⎟⎠
⎞⎜⎜⎝
⎛ ∆−
−=⎥
⎦
⎤⎢⎣
⎡∂∂
RT11ln ‡vnk
TT ρκρρ (5.4)
62

Where κT is isothermal compressibility and is activation volume given by ‡v∆
TT P
VV
⎟⎠⎞
⎜⎝⎛∂∂
−=1κ (5.5)
and
TPKRTv ⎟
⎟⎠
⎞⎜⎜⎝
⎛
∂∂
−=∆‡
ln‡ (5.6)
The activation volume is the difference between the partial molar volumes of the
transition state and the reactants and is strongly dependent on solute-solvent interactions.
The effect of temperature, pressure and density on the solvation of reactants and
transition state species in supercritical water may significantly change the kinetics of
organic amine reaction as indicated by equations 5.3 and 4. The effect of these
parameters may change depending on the characteristics of transition state. For example,
if the transition state involves reactants with charge localization (ions) or polar
molecules, then electrostatic interactions between the solvent and solute would influence
the reaction kinetics. Dielectric constant of solvent in such instances may play a critical
role in solvation of reactants and transition state species in water. The qualitative picture
of solvent dielectric effect on reaction rate is that reactions involving a transition state
more polar than individual reactants facilitate by increasing dielectric constant and
reactions involving a transition state that is less polar than individual reactants are
facilitated by decreasing dielectric constant.
The conventional approach of evaluating the effect of dielectric constant on
reaction rate includes the use of Kirkwood theory [17-18]. For reactions involving
63

changing dipole moment, Kirkwood theory quantifies the effect of solvent polarity on the
reaction rate. Consider the following reaction of two polar molecules:
A + B X Products (5.7) ‡
According to Kirkwood theory, the rate constant of the above reaction is given by
( ) ( )⎥⎥⎦
⎤
⎢⎢⎣
⎡++⎟
⎠⎞
⎜⎝⎛
+−
+= 3
2
3
2
3‡
2‡
0 121lnln
B
B
A
A
X
X
rrrRTNkk µµµ
εε (5.8)
where k0 is the value of rate constant in reference state of unit activity coefficients, X ‡ is
transition state species, µ the dipole moment, r the molecular/complex radius, N
Avogadro number, and ε the solvent dielectric constant. According to this theory, a plot
of ln(k) vs 1/ε should be linear. The slope of the plot determines the relative polarity of
transition state compared to the reactants. A positive plot of ln(k) vs 1/ε indicates that the
reaction proceeds through a transition state less polar than the reactants and vice versa.
Figure 5.3 shows the sample Kirkwood plot for kinetics of methylamine methylamine
hydrolysis in supercritical water at 410 oC.
Other effects
The literature highlights dielectric constant and ion product of water as two major
solvent effects which can alter the hydrolysis reaction rate of various organic compounds
in supercritical water. However, effect of key variables like solvent structure and
hydrogen bonding on reaction rate is unknown.
64
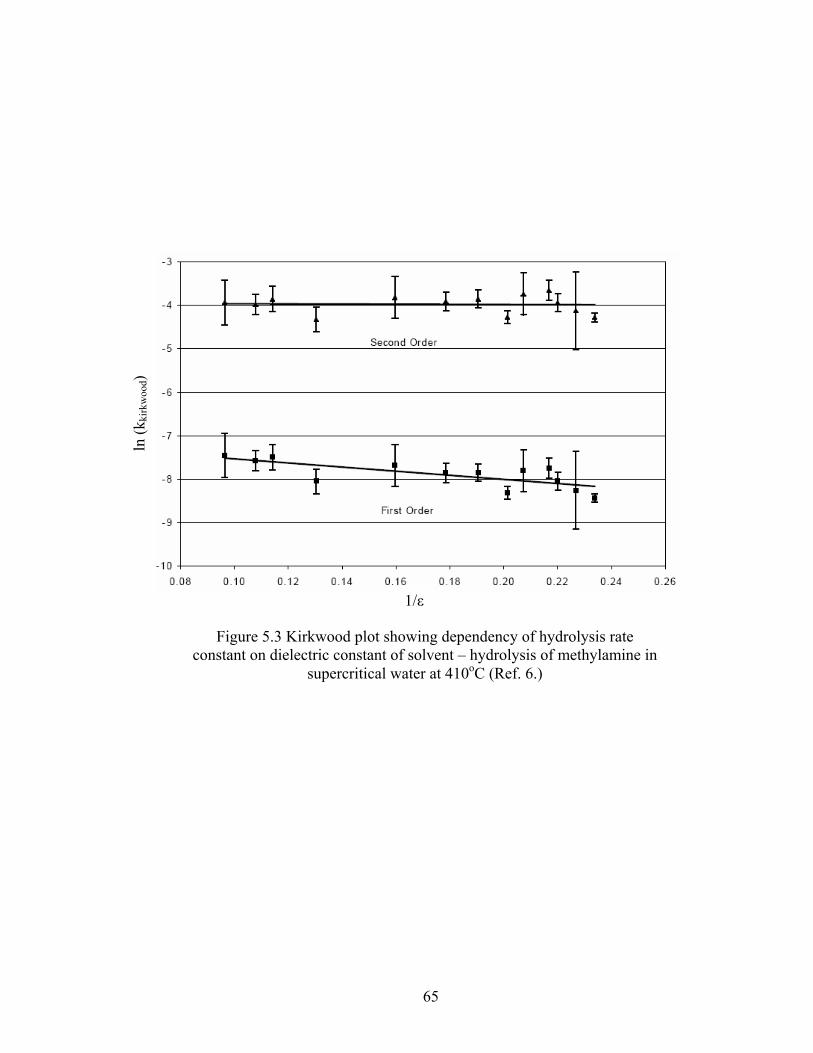
1/ε
ln (k
kirk
woo
d)
Figure 5.3 Kirkwood plot showing dependency of hydrolysis rate
constant on dielectric constant of solvent – hydrolysis of methylamine in supercritical water at 410oC (Ref. 6.)
65
Modification of kinetic equation
Conventional kinetic analysis
Consider the following reaction between organic amine and water at ambient
conditions. Although amines are relatively inert in ambient water, a hypothetical case is
presented below.
A (amine) + B (water) Product 1 (C) + Product 2 (D) (5.9)
The rate expression for the disappearance of A is given by
bB
aA
AA CkC
dtdCr =−=− (5.10)
where k is the rate constant. According to Arrhenius expression form of rate constant,
this would be
RTE
ekk−
= 0 (5.11)
Where k0 is the frequency factor and E is activation energy of the reaction. The
concentration of water will not change appreciably during the course of reaction.
Therefore the rate dependence on A can be isolated and can be written as
aA
AA Ck
dtdCr '=−=− (5.12)
where k’ is pseudo first order rate constant, given by
( )bBCkk .'= (5.13)
Integrating equation 5.12 from time 0 to t seconds and CA0 to CA, CA0 being the initial
concentration, one would end up with the following equation:
( ) ( ) ( ) ( )( )1'
1lnln1ln1
0 −−
+−=−
akFCat
a
A (5.14)
66

where F is fractional conversion, 0A
AC
CF =
Experimental data can then be generated at various initial concentrations (CA0) and
varying reaction times.
Temperature Initial concentration of organic amine (CA0)
Time of reaction (t) Final concentration of organic amine (CA)
(CA0)1 t1 (CA)1
(CA0)2 t2 (CA)2T1
(CA0)3 t3 (CA)3
(CA0)1 t1 (CA)1
(CA0)2 t2 (CA)2T2
(CA0)3 t3 (CA)3
Table 5.1 Sample set of data points necessary to compute the rate constant and Arrhenius
parameters of organic amine degradation
Once the experimental data is generated, equation 5.14 can be used to create a
linear plot of ln(t) versus ln (CA0), the slope of plot, (1-a) and intercept on ln(t) axis being
( )( )1'
1ln1
−−−
akF a
. The slope of the, (1-a) is positive and greater than one, then the reaction
has a negative order with respect to CA. If the slope is positive and less than one, then the
order of reaction is positive with respect to CA. k’ can be calculated from the intercept of
plot on ln(t) axis and finally the global reaction rate constant, k can be computed using
equation 5.13. To evaluate the activation energy and frequency factor of the reaction,
similar set of experiments should be performed at a different temperature to generate
Arrhenius plot [20].
67

The above presented conventional kinetic analysis would be sufficient to
determine the rate kinetics of organic amines in supercritical water at very low water
densities where the solvent effects are negligible. In this region, water is not an active
participant in the reaction and decomposition of amines could be aided by cracking of
molecular species. In other words, pyrolysis of organic molecules dominates in this
region and use of conventional methods to correlate the kinetic data would be sufficient
to obtain a fair approximation of rate constant. The threshold value of water density
above which the solvent effects would alter the rate constant may be specific to the
organic amine (or compound) participating in the reaction. Above this threshold value
of density, water is an active participant in the reaction and may significantly change the
overall stoichiometry of the reaction resulting in formation of new products. With
continuous increase in water density, a transition from pyrolytic region to hydrolysis
region takes places. During this transition, the two reaction pathways may proceed in
parallel, with different rates with different product formations. Of these two reactions,
the rate of hydrolysis (and probably pyrolysis too) reaction may be significantly altered
by the changing physical properties of solvent (Dielectric constant, Ion product and
Hydrogen bonding). Or it can be said that rate of reaction is a function of temperature,
concentration of reactants and solvent properties.
-rA = f(temperature, concentration of reactants, KW, ε, H-bonding) (5.15)
bB
aAA CCr ψ=− (5.16)
where Ψ is new rate constant and is a function of temperature and solvent properties.
68

References
1. Tester, J.W.; Holgate, H.R.; Armellini, F.J.; Webly, P.A.; Killilea, W.R.; Hong,
G.T.; Barner, H.T. In Emerging Technologies in Hazardous Waste Management;
Tedder, D.W., Pohland, F.G., Eds.; ACS Symp. Ser. 1993, 518, 35.
2. Modell, M. In Standard Handbook of Hazardous Waste Management and
Disposal, 8.153; Freeman, H.M., Ed.; McGraw-Hill: New York, 1989.
3. Franck, E.U. Fluids at High Temperatures and Pressures. J. Chem. Thermodyn.
1987, 19, 225.
4. Townsend, S.H.; Abraham, M.A.; Huppert, G.L.; Klein, M.T.; Paspek, S.C.
Solvent Effects during Reactions in Supercritical Water. Ind. En. Chem. Res.
1988, 27, 143.
5. Wang, X.; Gron, L.U.; Klein, M.T.; Brill, T.N. The Influence of High-
Temperature Water on the Reaction Pathways of Nitroanilines. J. Supercritical
Fluids 1995, 8, 236.
6. Benjamin, K.M.; Savage, P.E. Hydrothermal Reactions of Methylamine. J.
Supercritical Fluids 2004, 31, 301.
7. Iyer, S.D.; Klein, M.T. Effect of Pressure on the Rate of Butyronitrile Hydrolysis
in High-Temperature Water. J. Supercrit. Fluids 1997, 10, 191.
69

8. Habenicht, C.; Kam, L.C.; Wilschut, M.J.; Antal, M.J. Homogeneous Catalysis of
Ethyl tert-Butyl Ether Formation from tert-Butyl Alcohol in Hot, Compressed
Liquid Ethanol. Ind. Eng. Chem. Res. 1995, 34, 3784.
9. Xiang, T.; Johnston, K.P. Acid Base Behavior of Organic Compounds in
Supercritical Water. J. Phys. Chem. 1994, 98, 7915.
10. Ryan, E.T.; Xiang, T.; Johnston, K.P.; Fox, M.A. Excited-State Proton Transfer
Reactions in Subcritical and Supercritical Water. J. Phys. Chem. 1996, 100, 9395.
11. González, G.; Montané, D. Kinetics of Dibenzylether Hydrothermolysis in
Supercritical Water. AIChE J. 2005, 51, 971.
12. Venardou, E.; Garcia-Verdugo, E.; Barlow, S.J.; Gorbaty, Y.E.; Poliakoff, M. On-
line Monitoring of the Hydrolysis of Acetonitrile in Near-Critical Water using
Raman Spectroscopy. Vibrational Spectroscopy 2004, 35, 103.
13. Marrone, P,A.; Arias, T.A.; Peters, W.A.; Tester, J.W. Solvation Effects on
Kinetics of Methylene Chloride Reactions in Sub- and Supercritical Water:
Theory, Experiment, and Ab Initio Calculations. J. Phys. Chem. 1998, 102, 7013.
14. Salvatierra, D.; Taylor, J.D.; Marrone, P.A.; Tester, J.W. Kinetic Study of
Hydrolysis of Methylene Chloride from 100 to 500oC. Ind. Eng. Chem. Res. 1999,
38, 4169.
15. Antal, M.J., Jr.; Brittain, A.; DeAlmedia, C.; Ramayya, S.; Roy, J.C. Heterolysis
and Homolysis in Supercritical Water. In Supercritical Fluids, Squires, T.G.,
Paulaitis, M.E., Eds.; ACS Symp. Ser. 1987, 329, 77.
16. Lowry, T.H.; Richardson, K.S. In Mechanism and Theory in Organic Chemistry,
2nd ed., Harper & Row: New York, 1981, pp 189-221.
70

17. Kirkwood, J.G. Theory of Solutions of Molecules Containing Widely Separated
Charges with Special Applications to Zwitterions. J. Chem. Phys. 1934, 2, 351.
18. Connors, K.A. In Chemical Kinetics: Study of Reaction Rates in Solution, VCH:
New York, 1990, pp 407.
19. Uematsu, M.; Frank, E.U. Static Dielectric Constant of Water and Steam. J. Phys.
Chem. Ref. Data, 1980, 9, 1291.
20. Levenspiel, O. In Chemical Reaction Engineering, Wiley: New York, 1999, pp
27.
71
CHAPTER VI
CONCLUSIONS AND RECOMMENDATIONS
Conclusions
The study reported in this thesis included (a) an extensive review of literature
available on possible reaction pathways of organic amines in supercritical water and (b)
possible solvent parameters that can affect the rate of reaction of organic amines in
supercritical water.
Reaction pathways of amine degradation
1. Organic amines decompose in supercritical water through pyrolysis and / or
hydrolysis pathways,
2. Pyrolysis is favored in low water density region (typically ρw << 0.4 kg m-3) and
hydrolysis pathway is favored in high water density region (ρw > 0.4 kg m-3),
3. There is a possibility for the two reaction pathways to proceed in parallel with
equal or unequal rates within a range of water densities, the range being specific
to selected organic amine,
4. The available literature is not sufficient to generate a robust procedure to quantify
the reaction rates of the two mechanisms,
72

5. The decomposition rate of amine through pyrolysis pathway in low water density
region can be interpreted using free radical chemistry, and
6. The decomposition rate of amine through hydrolysis pathway in high water
density region can be interpreted by nucleophilic substitution mechanisms.
Water effects in supercritical state
1. Pyrolysis of amine decomposition in low water density region is independent of
properties of water
2. Rate of decomposition through hydrolysis is altered by dielectric constant and ion
product of water at elevated water densities
3. The nature of dielectric constant influence on hydrolysis reaction can be evaluated
using conventional Kirkwood analysis
4. The change in reaction pathway, either from pyrolysis to hydrolysis or hydrolysis
to pyrolysis is accompanied by changes in water density and further, changes in
ion product of water
To conclude, organic amines decompose in supercritical water and can serve as potential
corrosion inhibitors when used in hydrothermal systems operating above critical point.
Out of the three key parameters for selection an amine, stability, volatility and basicity,
this report presented the results of investigation on the stability of amines by evaluating
possible reaction mechanisms and kinetics. The volatility of amines which is an
important factor to be considered when used in sub-critical systems may not have an
impact in supercritical systems as the amine itself is in a supercritical state. Finally, no
previous work was found evaluating the basicity of amines in supercritical water and
73

significant amount of work should be done in this area to determine the acid - base
behavior of amines in water beyond the critical point.
Recommendations
Literature available on reactions kinetics of organic amines in supercritical water
is sparse. The kinetic data of amine reaction in supercritical water available till date
include reactant conversions and product yields as functions of temperature and initial
concentrations in batch reactors. None of the works reported analyzing the gas phase
products formed after completion of reaction. These available experimental data are
accompanied by a discussion of complementary mechanistic modeling components, not
validated by experimental data.
There is a necessity to develop robust mechanistic and kinetic models to predict
the elementary reaction rates and global kinetics of amine degradation in supercritical
water. The model predictions should be compared with experimental measurements of
intermediate molecular and free radical species of the reaction. Such measurements
would need to be made in situ, and till date there have been no reports for measuring
radical and molecular species concentrations during organic chemical reactions in
supercritical water systems.
Experimentation
Experiments can be conducted either in batch or plug flow reactors. The reaction
amine in supercritical state should be continuously monitored for any intermediate
products formed. An ideal solution to monitor the reaction intermediates in situ would be
use of spectroscopic techniques such as fiber-optic Raman spectroscopy, Fourier
74

transform infrared (FTIR) spectroscopy and emission spectroscopy. The use of
spectroscopic techniques would facilitate in examining the possible reaction
intermediates in situ based on their respective wave characteristics. Temperature,
pressure and pH in spectroscopic cell can be measured using conventional
thermocouples, transducers and pH measurement devices. The sample can then be
cooled to ambient temperature, vapor phase separated from liquid and analyzed for
respective concentrations using Gas Chromatography (G.C) and Mass Spectroscopic
(M.S) techniques. Notice that initial spectroscopic measurements are made in situ at
supercritical conditions followed by G.C-M.S analysis at ambient temperature and
pressure. This procedure would provide sufficient information on the reaction
intermediate products and final reaction products in vapor as well as in liquid phases. It
would also facilitate in investigation of acid – base behavior of organic amines in
supercritical water and further investigation in molecular dynamics of solute – solvent
interactions at supercritical conditions.
Rate equation
For accurate prediction of rate of decomposition of amines in supercritical water
there is a necessity for development a global kinetic rate equation over a wide range of
operating conditions. Considering the fact that the properties of supercritical water,
density, ion product and dielectric constant are extremely sensitive to changes in
temperature and pressure, and have the potential to alter the decomposition reaction
pathway and reaction kinetics of amines, it is essential to incorporate these solvent effects
into global kinetic equation.
75

An alternative approach to attain the goal is to breakdown the range of operating
conditions based on density at which a shift of reaction pathway occurs. The reason for
selecting density as a fundamental property here is that dielectric constant and ion
product of water have smooth variation with density and can be easily correlated with the
same.
Three possible regimes can be identified based on decomposition pathways:
I. wPTw ρρ <<0 where ρw is water density and ρwPT is the value of density below
which solvent effects can be neglected and reaction pathway is assumed to be aided
by pyrolysis pathway only. In this region water is not an active participant in the
reaction and major amount of organic amine can be assumed to decompose through
thermal cracking
II. MOPwwTH ρρρ << where ρwTH is the value of water density above which reaction
pathway is assumed to proceed only through hydrolysis. Water is an active
participant in the reaction in this region; ion product and dielectric constant of water
have significant influence on reaction kinetics. In this region, major amount of
organic amine is assumed to decompose through ionic mechanisms. ρMOP is water
density at maximum operating pressure and minimum operating temperature
III. wTHwwPT ρρρ << . In this region, the decomposition of amine is aided by both
hydrolysis and pyrolysis. This regime can be visualized as a transition region where
amine is partially decomposed through thermal degradation and partially through
reaction with water (hydrolysis). The reaction pathway in this region is a function
of localized density due to formation and dissociation of clusters of water
molecules. Amine decomposes through hydrolysis pathway only if amine molecule
76

is located within a cluster of water molecules where the probability for water
molecule to participate in the reaction is higher.
This methodology of breaking down the operating range based on density would result in
three different rate equations for the three regimes discussed above. The three rate
expressions would then be of the form
( ) II ionConcentrateTemperaturfr Π=− , (6.1)
( ) IIWII KionConcentrateTemperaturfr Π=− ,,, ε (6.2)
( ) IIIWIII KionConcentrateTemperaturfr Π=− ,,, ε (6.3)
Where rI, rII, rIII are rates of decomposition of amine in region I, II and III. Note that rate
in equation 6.1 is independent of solvent properties. ПI in equation 6.1 is correction
factor for rate equation that takes into account reaction with water, if any. Similarly ПII
in equation 6.2 is correction factor in region II to take into account the reaction purely by
thermal degradation. In equation 6.3, ПIII should incorporate the effects of varying rates
of two different reaction pathways, pyrolysis through free radical mechanism and
hydrolysis through ionic mechanism.
Finally, little data on dissociation constants of amines in supercritical water are
available in literature which limits this study to evaluate the basic strength of organic
amines. Availability of such experimental data would also contribute in evaluating the
multiple steps involved in ionic mechanisms in hydrolysis region.
77

APPENDIX A
THERMODYNAMIC DATA OF WATER:
SUB AND SUPERCRITICAL CONDITIONS
78
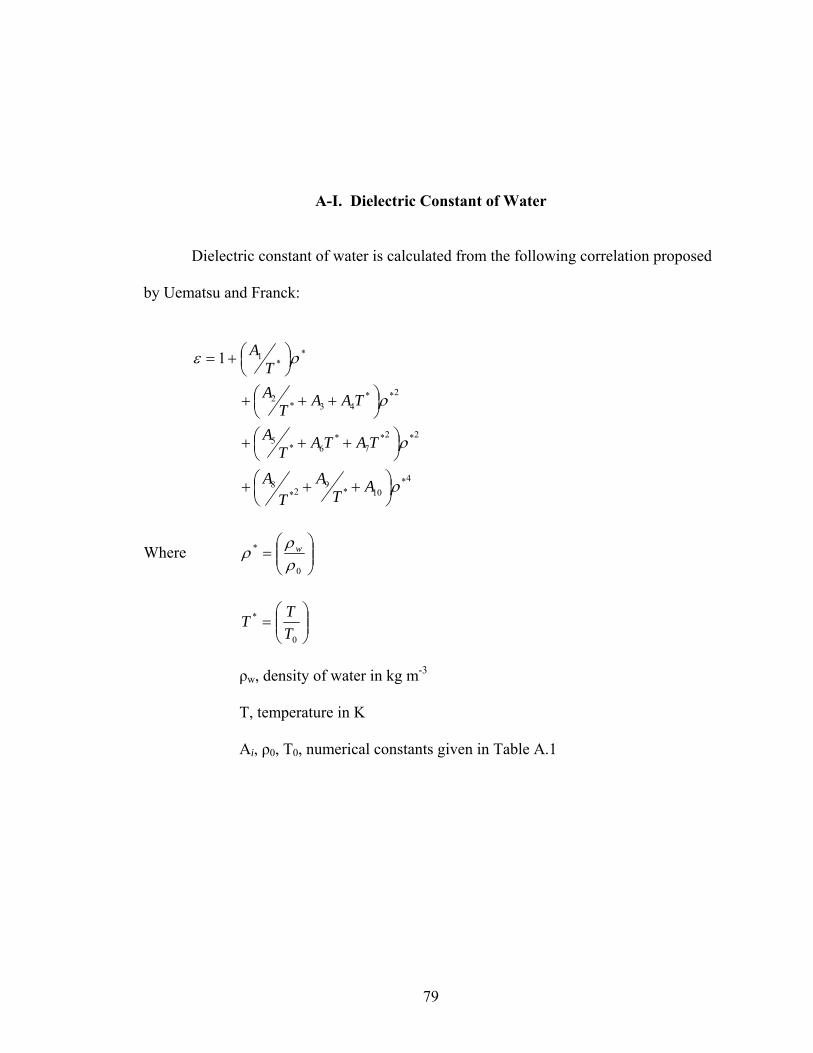
A-I. Dielectric Constant of Water
Dielectric constant of water is calculated from the following correlation proposed
by Uematsu and Franck:
*
*11 ρε ⎟
⎠⎞⎜
⎝⎛+= T
A
2**43*
2 ρ⎟⎠⎞⎜
⎝⎛ +++ TAAT
A
2*2*7
*6*
5 ρ⎟⎠⎞⎜
⎝⎛ +++ TATAT
A
4*10*
92*
8 ρ⎟⎠⎞
⎜⎝⎛ +++ AT
AT
A
Where ⎟⎟⎠
⎞⎜⎜⎝
⎛=
0
*
ρρρ w
⎟⎟⎠
⎞⎜⎜⎝
⎛=
0
*
TTT
ρw, density of water in kg m-3
T, temperature in K
Ai, ρ0, T0, numerical constants given in Table A.1
79

Table A.1 Numerical values of coefficients in section A-I
A1 7.62571E00
A2 2.44003E02
A3 -1.40569R02
A4 2.77841E01
A5 -9.62805E01
A6 4.17909E01
A7 -1.02099E01
A8 -4.52059E01
A9 8.46395E01
A10 -3.58644E01
T0 298.15 K
ρ0 1000 kg m-3
80

A-II. Ion Product of Water
Ion product (KW) of water is calculated from the following correlation proposed
by Marshall and Franck:
( ) ( )*232
* loglog wW TG
TFE
TD
TC
TBAK ρ⎟
⎠⎞
⎜⎝⎛ ++++++=
Where
( ) ( ) 22* / −= kgmolKK WW , ( )( ) 3* / −= cmgww ρρ
and values for the parameters are
A = -4.098
B = -3245.2 K
C = 2.2362E05 K2
D = -3.984E07 K3
E = 13.957
F = -1262.3 K
G = 8.5641E05 K2
81

Table A.2 Isobaric data of water at P = 24 MPa
T (C) Pressure (MPa)
Density (kg/m3)
Cp (J/mol*K)
Therm. Cond.
(W/m*K) Phase log(Kw(mol/kg)2) ε
0.01 24 1011.7 74.118 0.57427 liquid -14.83036255 88.93004
10.01 24 1010.8 74.104 0.5917 liquid -14.42991646 85.00651
20.01 24 1008.9 74.148 0.60948 liquid -14.07118158 81.2264
30.01 24 1006 74.222 0.62635 liquid -13.74934898 77.58265
40.01 24 1002.4 74.309 0.64155 liquid -13.45803329 74.09461
50.01 24 998.19 74.402 0.65472 liquid -13.19336801 70.76187
60.01 24 993.37 74.499 0.66579 liquid -12.9527465 67.57615
70.01 24 988.02 74.605 0.67487 liquid -12.73335303 64.53599
80.01 24 982.19 74.723 0.68214 liquid -12.53296448 61.63721
90.01 24 975.91 74.86 0.68781 liquid -12.34979479 58.87409
100.01 24 969.2 75.02 0.6921 liquid -12.18236274 56.24028
110.01 24 962.09 75.21 0.69518 liquid -12.02930172 53.73039
120.01 24 954.58 75.432 0.69719 liquid -11.88962743 51.33706
130.01 24 946.69 75.693 0.69824 liquid -11.76233888 49.05469
140.01 24 938.42 75.995 0.6984 liquid -11.64669618 46.87662
150.01 24 929.77 76.343 0.69773 liquid -11.54205568 44.79652
160.01 24 920.75 76.741 0.69626 liquid -11.44778389 42.80912
170.01 24 911.33 77.194 0.69399 liquid -11.3636153 40.90691
180.01 24 901.52 77.709 0.69092 liquid -11.28905547 39.0854
190.01 24 891.3 78.29 0.68704 liquid -11.22389034 37.33855
200.01 24 880.66 78.947 0.68233 liquid -11.16788664 35.66137
210.01 24 869.56 79.689 0.67677 liquid -11.12108648 34.04753
220.01 24 857.98 80.527 0.67031 liquid -11.08343457 32.49232
230.01 24 845.88 81.477 0.66291 liquid -11.05507701 30.99032
240.01 24 833.23 82.556 0.6545 liquid -11.03613736 29.53713
250.01 24 819.96 83.791 0.64503 liquid -11.02710346 28.12671
260.01 24 806.01 85.211 0.6344 liquid -11.02845547 26.7541
270.01 24 791.3 86.859 0.62252 liquid -11.04090839 25.41389
280.01 24 775.73 88.793 0.60931 liquid -11.0654339 24.10036
290.01 24 759.15 91.095 0.59467 liquid -11.10353726 22.8062
300.01 24 741.4 93.885 0.57857 liquid -11.15698525 21.52463
310.01 24 722.23 97.343 0.56101 liquid -11.22854586 20.24601
82
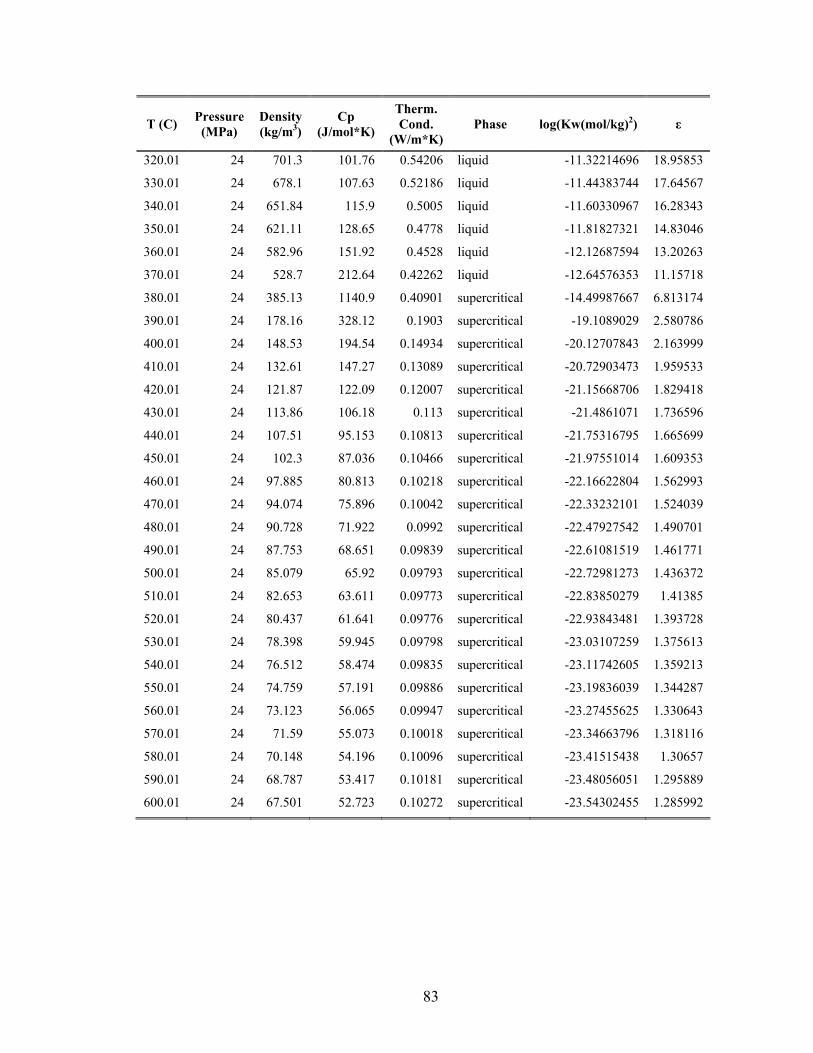
T (C) Pressure (MPa)
Density (kg/m3)
Cp (J/mol*K)
Therm. Cond.
(W/m*K) Phase log(Kw(mol/kg)2) ε
320.01 24 701.3 101.76 0.54206 liquid -11.32214696 18.95853
330.01 24 678.1 107.63 0.52186 liquid -11.44383744 17.64567
340.01 24 651.84 115.9 0.5005 liquid -11.60330967 16.28343
350.01 24 621.11 128.65 0.4778 liquid -11.81827321 14.83046
360.01 24 582.96 151.92 0.4528 liquid -12.12687594 13.20263
370.01 24 528.7 212.64 0.42262 liquid -12.64576353 11.15718
380.01 24 385.13 1140.9 0.40901 supercritical -14.49987667 6.813174
390.01 24 178.16 328.12 0.1903 supercritical -19.1089029 2.580786
400.01 24 148.53 194.54 0.14934 supercritical -20.12707843 2.163999
410.01 24 132.61 147.27 0.13089 supercritical -20.72903473 1.959533
420.01 24 121.87 122.09 0.12007 supercritical -21.15668706 1.829418
430.01 24 113.86 106.18 0.113 supercritical -21.4861071 1.736596
440.01 24 107.51 95.153 0.10813 supercritical -21.75316795 1.665699
450.01 24 102.3 87.036 0.10466 supercritical -21.97551014 1.609353
460.01 24 97.885 80.813 0.10218 supercritical -22.16622804 1.562993
470.01 24 94.074 75.896 0.10042 supercritical -22.33232101 1.524039
480.01 24 90.728 71.922 0.0992 supercritical -22.47927542 1.490701
490.01 24 87.753 68.651 0.09839 supercritical -22.61081519 1.461771
500.01 24 85.079 65.92 0.09793 supercritical -22.72981273 1.436372
510.01 24 82.653 63.611 0.09773 supercritical -22.83850279 1.41385
520.01 24 80.437 61.641 0.09776 supercritical -22.93843481 1.393728
530.01 24 78.398 59.945 0.09798 supercritical -23.03107259 1.375613
540.01 24 76.512 58.474 0.09835 supercritical -23.11742605 1.359213
550.01 24 74.759 57.191 0.09886 supercritical -23.19836039 1.344287
560.01 24 73.123 56.065 0.09947 supercritical -23.27455625 1.330643
570.01 24 71.59 55.073 0.10018 supercritical -23.34663796 1.318116
580.01 24 70.148 54.196 0.10096 supercritical -23.41515438 1.30657
590.01 24 68.787 53.417 0.10181 supercritical -23.48056051 1.295889
600.01 24 67.501 52.723 0.10272 supercritical -23.54302455 1.285992
83

Table A.3 Isobaric data of water at P = 30 MPa
T (C) Density (kg/m3)
Cp (J/mol*K)
Viscosity (cP)
Therm. Cond.
(W/m*K) Phase log(Kw(mol/kg)2) ε
0.01 1014.5 73.712 1.7271 0.57754 liquid -14.805381 89.192425
10.01 1013.5 73.781 1.2784 0.59461 liquid -14.40653794 85.255163
20.01 1011.5 73.874 0.99155 0.61224 liquid -14.04925604 81.461387
30.01 1008.6 73.979 0.79603 0.62907 liquid -13.72792582 77.812966
40.01 1004.9 74.085 0.65624 0.64429 liquid -13.43784881 74.311399
50.01 1000.7 74.189 0.55255 0.65751 liquid -13.17346179 70.974699
60.01 995.84 74.293 0.47338 0.66865 liquid -12.93345868 67.780776
70.01 990.51 74.401 0.41152 0.6778 liquid -12.71416774 64.737363
80.01 984.7 74.519 0.36227 0.68516 liquid -12.51384521 61.835258
90.01 978.47 74.652 0.32241 0.69094 liquid -12.33048215 59.071065
100.01 971.82 74.807 0.28971 0.69534 liquid -12.16275476 56.436786
110.01 964.77 74.988 0.26256 0.69853 liquid -12.00937339 53.926268
120.01 957.35 75.2 0.23978 0.70067 liquid -11.86913224 51.534307
130.01 949.55 75.446 0.22048 0.70186 liquid -11.74125393 49.253092
140.01 941.38 75.732 0.20398 0.70218 liquid -11.6249241 47.076628
150.01 932.86 76.059 0.18976 0.70167 liquid -11.51935147 44.999892
160.01 923.96 76.434 0.17741 0.70036 liquid -11.42419465 43.014895
170.01 914.7 76.858 0.16661 0.69827 liquid -11.33881797 41.117334
180.01 905.06 77.339 0.15709 0.69539 liquid -11.26294375 39.300696
190.01 895.04 77.88 0.14866 0.69171 liquid -11.19620537 37.560113
200.01 884.61 78.489 0.14112 0.68723 liquid -11.13851072 35.889309
210.01 873.75 79.173 0.13436 0.68191 liquid -11.08974502 34.283053
220.01 862.45 79.942 0.12824 0.67573 liquid -11.0497668 32.737062
230.01 850.68 80.807 0.12267 0.66864 liquid -11.01863053 31.246311
240.01 838.39 81.785 0.11756 0.66061 liquid -10.99659178 29.805155
250.01 825.54 82.892 0.11285 0.65156 liquid -10.98388439 28.40896
260.01 812.09 84.153 0.10846 0.64144 liquid -10.98079804 27.053521
270.01 797.96 85.598 0.10435 0.63018 liquid -10.98799871 25.733126
280.01 783.08 87.268 0.10045 0.61769 liquid -11.00615574 24.443128
290.01 767.35 89.218 0.09674 0.60391 liquid -11.03627446 23.178052
300.01 750.64 91.526 0.09315 0.58881 liquid -11.07973284 21.931769
310.01 732.78 94.3 0.08965 0.57241 liquid -11.13841614 20.697257
84

T (C) Density (kg/m3)
Cp (J/mol*K)
Viscosity (cP)
Therm. Cond.
(W/m*K) Phase log(Kw(mol/kg)2) ε
320.01 713.56 97.703 0.08618 0.55477 liquid -11.21479455 19.466863
330.01 692.67 101.98 0.08271 0.53604 liquid -11.31256599 18.230178
340.01 669.67 107.55 0.07916 0.51641 liquid -11.4371672 16.973616
350.01 643.92 115.13 0.07546 0.49595 liquid -11.59684462 15.678877
360.01 614.36 126.15 0.07149 0.47447 liquid -11.80562872 14.316934
370.01 579.05 143.97 0.06705 0.45108 liquid -12.09011435 12.836704
380.01 533.88 177.7 0.06176 0.4235 supercritical -12.50965754 11.134813
390.01 468.72 258.34 0.05471 0.387 supercritical -13.22709461 8.9799564
400.01 357.29 466.21 0.04393 0.33197 supercritical -14.80096793 5.9327997
410.01 251.13 353.64 0.03541 0.24322 supercritical -16.86198579 3.6735759
420.01 203.21 229.84 0.03253 0.19147 supercritical -18.06614518 2.8545344
430.01 177.39 172.24 0.03144 0.16392 supercritical -18.81072685 2.4650537
440.01 160.59 140.61 0.03099 0.14721 supercritical -19.33590258 2.2312397
450.01 148.42 120.68 0.03085 0.13615 supercritical -19.73726872 2.0716906
460.01 139.01 106.96 0.03088 0.12843 supercritical -20.05973314 1.9541339
470.01 131.43 96.936 0.03101 0.12287 supercritical -20.326898 1.8632103
480.01 125.11 89.301 0.03121 0.1188 supercritical -20.55476892 1.7900996
490.01 119.73 83.3 0.03145 0.11581 supercritical -20.75221999 1.7298524
500.01 115.07 78.47 0.03172 0.11362 supercritical -20.92572428 1.6792007
510.01 110.95 74.508 0.03202 0.11205 supercritical -21.0813968 1.6356984
520.01 107.29 71.208 0.03234 0.11097 supercritical -21.22116282 1.5980581
530.01 104 68.424 0.03267 0.11027 supercritical -21.34810463 1.5650743
540.01 101.01 66.051 0.03301 0.10989 supercritical -21.46474994 1.5358399
550.01 98.274 64.009 0.03336 0.10977 supercritical -21.57263638 1.5097306
560.01 95.76 62.239 0.03372 0.10985 supercritical -21.67272467 1.4862916
570.01 93.436 60.695 0.03408 0.11011 supercritical -21.76617217 1.4651132
580.01 91.277 59.34 0.03444 0.11052 supercritical -21.85387213 1.4458741
590.01 89.262 58.145 0.0348 0.11104 supercritical -21.93659682 1.4283099
600.01 87.375 57.086 0.03517 0.11167 supercritical -22.01489773 1.4122132
85

Table A.4 Isobaric data of water at P = 36 MPa
T (C) Density (kg/m3)
Cp (J/mol*K)
Viscosity (cP)
Therm. Cond.
(W/m*K) Phase log(Kw
(mol/kg)2) ε
0.01 1017.4 73.329 1.7169 0.58078 liquid -14.77957983 89.4632
10.01 1016.2 73.474 1.2743 0.5975 liquid -14.38322162 85.503
20.01 1014 73.613 0.99027 0.615 liquid -14.02822688 81.6867
30.01 1011.1 73.745 0.7962 0.63179 liquid -13.70737865 78.0339
40.01 1007.4 73.868 0.65716 0.64702 liquid -13.41771449 74.5278
50.01 1003.1 73.983 0.55386 0.66029 liquid -13.15447459 71.1779
60.01 998.28 74.093 0.47489 0.67149 liquid -12.91445203 67.9826
70.01 992.96 74.204 0.41312 0.68073 liquid -12.69533767 64.9352
80.01 987.19 74.321 0.36389 0.68817 liquid -12.49492639 62.0315
90.01 980.99 74.452 0.32403 0.69405 liquid -12.31152056 59.2648
100.01 974.4 74.601 0.29131 0.69855 liquid -12.14349773 56.6301
110.01 967.41 74.774 0.26413 0.70187 liquid -11.98979656 54.1191
120.01 960.06 74.975 0.24132 0.70414 liquid -11.84913829 51.7272
130.01 952.35 75.209 0.22199 0.70547 liquid -11.72067275 49.4472
140.01 944.29 75.479 0.20545 0.70593 liquid -11.60358642 47.2732
150.01 935.87 75.788 0.19121 0.70558 liquid -11.49730726 45.1979
160.01 927.11 76.14 0.17883 0.70443 liquid -11.40112586 43.2168
170.01 917.99 76.539 0.16801 0.70251 liquid -11.31469729 41.3227
180.01 908.51 76.989 0.15848 0.69981 liquid -11.23759398 39.5105
190.01 898.66 77.493 0.15003 0.69634 liquid -11.16951865 37.7746
200.01 888.44 78.059 0.14249 0.69206 liquid -11.11015221 36.1104
210.01 877.81 78.692 0.13572 0.68697 liquid -11.05951901 34.5114
220.01 866.77 79.401 0.12961 0.68104 liquid -11.01739422 32.9737
230.01 855.28 80.194 0.12404 0.67425 liquid -10.98389513 31.4918
240.01 843.32 81.083 0.11895 0.66654 liquid -10.95903559 30.0615
250.01 830.86 82.083 0.11426 0.65788 liquid -10.94295029 28.6784
260.01 817.85 83.212 0.10991 0.64821 liquid -10.93597689 27.3376
270.01 804.23 84.492 0.10584 0.63748 liquid -10.93858936 26.0342
280.01 789.95 85.953 0.102 0.62561 liquid -10.95124975 24.7643
290.01 774.94 87.633 0.09835 0.61257 liquid -10.97465286 23.5233
300.01 759.08 89.585 0.09485 0.59833 liquid -11.00999547 22.305
86

T (C) Density (kg/m3)
Cp (J/mol*K)
Viscosity (cP)
Therm. Cond.
(W/m*K) Phase log(Kw
(mol/kg)2) ε
310.01 742.28 91.877 0.09146 0.58288 liquid -11.05836015 21.1055
320.01 724.38 94.609 0.08813 0.56631 liquid -11.12157251 19.9182
330.01 705.17 97.921 0.08484 0.54875 liquid -11.20212684 18.7356
340.01 684.4 102.02 0.08153 0.53039 liquid -11.30321428 17.5498
350.01 661.71 107.23 0.07816 0.51141 liquid -11.42952577 16.3505
360.01 636.57 114.08 0.07466 0.49184 liquid -11.58816763 15.1229
370.01 608.24 123.51 0.07096 0.47141 liquid -11.78970846 13.8489
380.01 575.45 137.37 0.06693 0.44927 supercritical -12.0527267 12.4978
390.01 536.1 159.04 0.0624 0.42364 supercritical -12.41039178 11.0234
400.01 486.99 193.71 0.05712 0.39165 supercritical -12.9217839 9.36863
410.01 423.76 251.48 0.05083 0.35125 supercritical -13.69355663 7.48968
420.01 348.61 290.57 0.04408 0.29998 supercritical -14.80376059 5.57337
430.01 285.41 258.81 0.03915 0.24974 supercritical -15.94108078 4.20596
440.01 242.72 208.93 0.03636 0.21202 supercritical -16.84765419 3.40683
450.01 214.4 170.52 0.03488 0.18609 supercritical -17.52512504 2.93201
460.01 194.48 144.11 0.03409 0.16824 supercritical -18.0431373 2.62456
470.01 179.59 125.61 0.03368 0.1556 supercritical -18.45455667 2.40924
480.01 167.94 112.14 0.0335 0.14642 supercritical -18.79145628 2.24955
490.01 158.48 101.97 0.03347 0.13962 supercritical -19.07501386 2.12569
500.01 150.59 94.056 0.03353 0.13454 supercritical -19.31843947 2.02649
510.01 143.88 87.747 0.03366 0.13071 supercritical -19.53035216 1.94513
520.01 138.06 82.615 0.03385 0.12784 supercritical -19.7179573 1.87689
530.01 132.94 78.372 0.03407 0.12572 supercritical -19.88599775 1.81871
540.01 128.39 74.815 0.03432 0.12417 supercritical -20.03768242 1.7685
550.01 124.31 71.799 0.03459 0.12309 supercritical -20.17559771 1.72471
560.01 120.61 69.216 0.03488 0.12239 supercritical -20.30243505 1.68607
570.01 117.24 66.986 0.03518 0.12199 supercritical -20.41937408 1.65176
580.01 114.15 65.046 0.03549 0.12183 supercritical -20.52786903 1.62108
590.01 111.29 63.348 0.03582 0.12188 supercritical -20.62963997 1.59338
600.01 108.65 61.853 0.03614 0.1221 supercritical -20.72448284 1.56839
87

Table A.5 Isobaric data of water at P = 42 MPa
T (C) Density (kg/m3)
Cp (J/mol*K)
Viscosity (cP)
Therm. Cond.
(W/m*K) Phase log(Kw (mol/kg)2) ε
0.01 1020.2 72.968 1.7074 0.58398 liquid -14.75473804 89.7236
10.01 1018.9 73.183 1.2705 0.60037 liquid -14.35996717 85.7501
20.01 1016.6 73.364 0.98921 0.61774 liquid -14.00641148 81.9205
30.01 1013.5 73.521 0.7965 0.6345 liquid -13.68770111 78.2455
40.01 1009.8 73.661 0.65815 0.64975 liquid -13.39843249 74.7351
50.01 1005.5 73.785 0.55521 0.66306 liquid -13.13553277 71.3807
60.01 1000.7 73.9 0.47642 0.67433 liquid -12.89564701 68.1825
70.01 995.38 74.013 0.41473 0.68364 liquid -12.67678373 65.1304
80.01 989.64 74.13 0.36552 0.69117 liquid -12.47635799 62.2244
90.01 983.48 74.257 0.32565 0.69714 liquid -12.29283249 59.456
100.01 976.93 74.401 0.29291 0.70176 liquid -12.12466335 56.8195
110.01 970.01 74.567 0.2657 0.70519 liquid -11.97056849 54.3088
120.01 962.74 74.759 0.24285 0.70759 liquid -11.8294211 51.9177
130.01 955.11 74.981 0.22348 0.70905 liquid -11.70044473 49.6385
140.01 947.14 75.236 0.20692 0.70966 liquid -11.58275234 47.4656
150.01 938.83 75.529 0.19264 0.70946 liquid -11.47569827 45.3926
160.01 930.19 75.86 0.18024 0.70847 liquid -11.37864537 43.4141
170.01 921.2 76.235 0.1694 0.70672 liquid -11.2912463 41.5231
180.01 911.88 76.657 0.15985 0.7042 liquid -11.2129248 39.7155
190.01 902.2 77.129 0.15138 0.70091 liquid -11.14352546 37.9843
200.01 892.16 77.656 0.14383 0.69683 liquid -11.08272497 36.3251
210.01 881.74 78.244 0.13706 0.69196 liquid -11.03039368 34.7324
220.01 870.94 78.898 0.13095 0.68627 liquid -10.98629836 33.2023
230.01 859.72 79.628 0.12539 0.67973 liquid -10.95054464 31.7289
240.01 848.06 80.441 0.12031 0.67233 liquid -10.92313326 30.3081
250.01 835.94 81.349 0.11564 0.66401 liquid -10.90410674 28.9359
260.01 823.32 82.366 0.11131 0.65474 liquid -10.89370363 27.6078
270.01 810.16 83.51 0.10727 0.64447 liquid -10.89221248 26.3195
280.01 796.41 84.802 0.10348 0.63316 liquid -10.9000544 25.0669
290.01 782.01 86.269 0.09989 0.62075 liquid -10.91779356 23.8456
300.01 766.88 87.948 0.09646 0.60723 liquid -10.94623225 22.6511
310.01 750.95 89.886 0.09315 0.59261 liquid -10.98618775 21.4795
88

T (C) Density (kg/m3)
Cp (J/mol*K)
Viscosity (cP)
Therm. Cond.
(W/m*K) Phase log(Kw (mol/kg)2) ε
320.01 734.1 92.144 0.08993 0.57694 liquid -11.03900749 20.3256
330.01 716.2 94.808 0.08678 0.56035 liquid -11.10628921 19.1844
340.01 697.08 97.996 0.08364 0.54301 liquid -11.19019299 18.05
350.01 676.51 101.87 0.08049 0.52511 liquid -11.2937213 16.9153
360.01 654.21 106.69 0.07729 0.5068 liquid -11.4207914 15.7727
370.01 629.78 112.8 0.07399 0.48804 liquid -11.57713674 14.6121
380.01 602.68 120.81 0.07055 0.46847 supercritical -11.77097952 13.4211
390.01 572.14 131.69 0.06688 0.44729 supercritical -12.01477635 12.1837
400.01 537.07 146.62 0.0629 0.42314 supercritical -12.32783448 10.8798
410.01 496.33 166.31 0.05857 0.3944 supercritical -12.73627668 9.49831
420.01 449.24 191.2 0.05388 0.3605 supercritical -13.27081509 8.05405
430.01 396.49 215.56 0.04903 0.32209 supercritical -13.95754573 6.60816
440.01 344.42 217.56 0.04467 0.28217 supercritical -14.73952586 5.34249
450.01 300.53 201.1 0.0414 0.24748 supercritical -15.49397897 4.39432
460.01 266.47 177.72 0.03919 0.21972 supercritical -16.15176586 3.73256
470.01 240.65 155.59 0.03777 0.19846 supercritical -16.69937061 3.2739
480.01 220.81 137.38 0.03688 0.18241 supercritical -17.15222627 2.94677
490.01 205.18 123 0.03634 0.17029 supercritical -17.53018265 2.70465
500.01 192.53 111.68 0.03602 0.16109 supercritical -17.85053697 2.51891
510.01 182.05 102.67 0.03587 0.15406 supercritical -18.12610602 2.37208
520.01 173.19 95.395 0.03583 0.14867 supercritical -18.3664837 2.25305
530.01 165.56 89.439 0.03587 0.14453 supercritical -18.57915702 2.15439
540.01 158.92 84.496 0.03598 0.14136 supercritical -18.76842965 2.07147
550.01 153.05 80.343 0.03613 0.13895 supercritical -18.93925149 2.00055
560.01 147.81 76.818 0.03632 0.13716 supercritical -19.09459419 1.93917
570.01 143.1 73.798 0.03653 0.13585 supercritical -19.23651964 1.8856
580.01 138.83 71.189 0.03677 0.13494 supercritical -19.36717708 1.83838
590.01 134.92 68.919 0.03703 0.13435 supercritical -19.48872217 1.79631
600.01 131.34 66.932 0.0373 0.13401 supercritical -19.60143644 1.75878
89
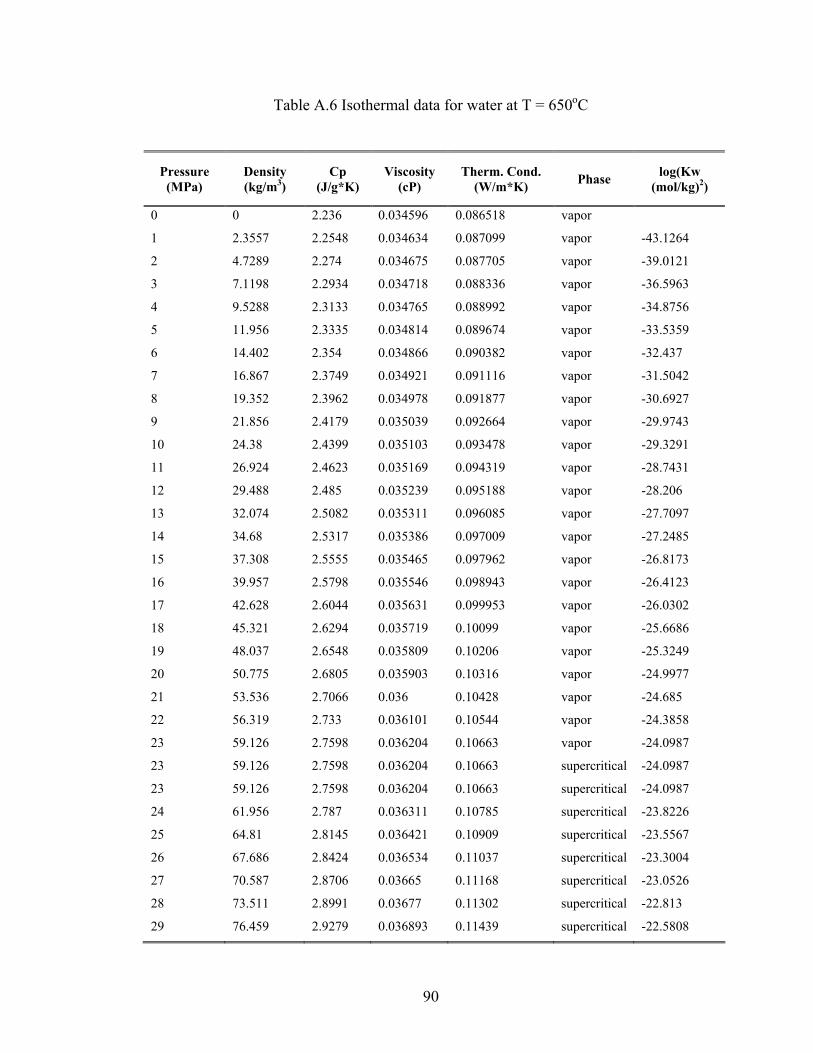
Table A.6 Isothermal data for water at T = 650oC
Pressure (MPa)
Density (kg/m3)
Cp (J/g*K)
Viscosity (cP)
Therm. Cond. (W/m*K) Phase log(Kw
(mol/kg)2)
0 0 2.236 0.034596 0.086518 vapor
1 2.3557 2.2548 0.034634 0.087099 vapor -43.1264
2 4.7289 2.274 0.034675 0.087705 vapor -39.0121
3 7.1198 2.2934 0.034718 0.088336 vapor -36.5963
4 9.5288 2.3133 0.034765 0.088992 vapor -34.8756
5 11.956 2.3335 0.034814 0.089674 vapor -33.5359
6 14.402 2.354 0.034866 0.090382 vapor -32.437
7 16.867 2.3749 0.034921 0.091116 vapor -31.5042
8 19.352 2.3962 0.034978 0.091877 vapor -30.6927
9 21.856 2.4179 0.035039 0.092664 vapor -29.9743
10 24.38 2.4399 0.035103 0.093478 vapor -29.3291
11 26.924 2.4623 0.035169 0.094319 vapor -28.7431
12 29.488 2.485 0.035239 0.095188 vapor -28.206
13 32.074 2.5082 0.035311 0.096085 vapor -27.7097
14 34.68 2.5317 0.035386 0.097009 vapor -27.2485
15 37.308 2.5555 0.035465 0.097962 vapor -26.8173
16 39.957 2.5798 0.035546 0.098943 vapor -26.4123
17 42.628 2.6044 0.035631 0.099953 vapor -26.0302
18 45.321 2.6294 0.035719 0.10099 vapor -25.6686
19 48.037 2.6548 0.035809 0.10206 vapor -25.3249
20 50.775 2.6805 0.035903 0.10316 vapor -24.9977
21 53.536 2.7066 0.036 0.10428 vapor -24.685
22 56.319 2.733 0.036101 0.10544 vapor -24.3858
23 59.126 2.7598 0.036204 0.10663 vapor -24.0987
23 59.126 2.7598 0.036204 0.10663 supercritical -24.0987
23 59.126 2.7598 0.036204 0.10663 supercritical -24.0987
24 61.956 2.787 0.036311 0.10785 supercritical -23.8226
25 64.81 2.8145 0.036421 0.10909 supercritical -23.5567
26 67.686 2.8424 0.036534 0.11037 supercritical -23.3004
27 70.587 2.8706 0.03665 0.11168 supercritical -23.0526
28 73.511 2.8991 0.03677 0.11302 supercritical -22.813
29 76.459 2.9279 0.036893 0.11439 supercritical -22.5808
90

Pressure (MPa)
Density (kg/m3)
Cp (J/g*K)
Viscosity (cP)
Therm. Cond. (W/m*K) Phase log(Kw
(mol/kg)2)
30 79.431 2.957 0.037019 0.11579 supercritical -22.3557
31 82.427 2.9865 0.037149 0.11721 supercritical -22.1371
32 85.447 3.0162 0.037282 0.11867 supercritical -21.9247
33 88.491 3.0462 0.037419 0.12016 supercritical -21.718
34 91.558 3.0765 0.037558 0.12168 supercritical -21.5168
35 94.649 3.1071 0.037702 0.12323 supercritical -21.3208
36 97.764 3.1379 0.037848 0.12481 supercritical -21.1296
37 100.9 3.1689 0.037998 0.12642 supercritical -20.9432
38 104.06 3.2001 0.038151 0.12806 supercritical -20.7611
39 107.25 3.2315 0.038308 0.12972 supercritical -20.5829
40 110.46 3.2631 0.038468 0.13141 supercritical -20.4088
41 113.69 3.2948 0.038631 0.13313 supercritical -20.2386
42 116.94 3.3267 0.038798 0.13488 supercritical -20.0722
43 120.22 3.3587 0.038968 0.13665 supercritical -19.9089
44 123.52 3.3909 0.039141 0.13845 supercritical -19.749
45 126.84 3.4231 0.039318 0.14027 supercritical -19.5924
46 130.18 3.4553 0.039498 0.14212 supercritical -19.4389
47 133.54 3.4876 0.039681 0.14399 supercritical -19.2885
48 136.92 3.5199 0.039867 0.14588 supercritical -19.1409
49 140.32 3.5522 0.040057 0.1478 supercritical -18.9961
50 143.74 3.5845 0.04025 0.14973 supercritical -18.8539
91
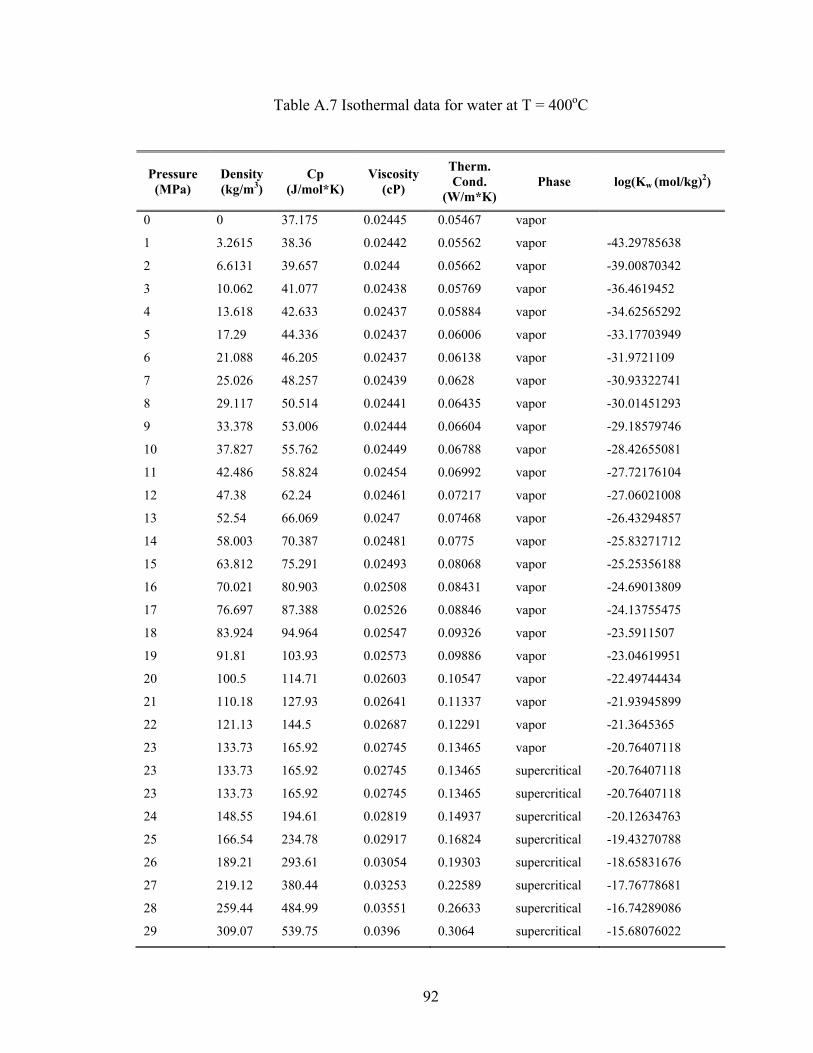
Table A.7 Isothermal data for water at T = 400oC
Pressure (MPa)
Density (kg/m3)
Cp (J/mol*K)
Viscosity (cP)
Therm. Cond.
(W/m*K) Phase log(Kw (mol/kg)2)
0 0 37.175 0.02445 0.05467 vapor
1 3.2615 38.36 0.02442 0.05562 vapor -43.29785638
2 6.6131 39.657 0.0244 0.05662 vapor -39.00870342
3 10.062 41.077 0.02438 0.05769 vapor -36.4619452
4 13.618 42.633 0.02437 0.05884 vapor -34.62565292
5 17.29 44.336 0.02437 0.06006 vapor -33.17703949
6 21.088 46.205 0.02437 0.06138 vapor -31.9721109
7 25.026 48.257 0.02439 0.0628 vapor -30.93322741
8 29.117 50.514 0.02441 0.06435 vapor -30.01451293
9 33.378 53.006 0.02444 0.06604 vapor -29.18579746
10 37.827 55.762 0.02449 0.06788 vapor -28.42655081
11 42.486 58.824 0.02454 0.06992 vapor -27.72176104
12 47.38 62.24 0.02461 0.07217 vapor -27.06021008
13 52.54 66.069 0.0247 0.07468 vapor -26.43294857
14 58.003 70.387 0.02481 0.0775 vapor -25.83271712
15 63.812 75.291 0.02493 0.08068 vapor -25.25356188
16 70.021 80.903 0.02508 0.08431 vapor -24.69013809
17 76.697 87.388 0.02526 0.08846 vapor -24.13755475
18 83.924 94.964 0.02547 0.09326 vapor -23.5911507
19 91.81 103.93 0.02573 0.09886 vapor -23.04619951
20 100.5 114.71 0.02603 0.10547 vapor -22.49744434
21 110.18 127.93 0.02641 0.11337 vapor -21.93945899
22 121.13 144.5 0.02687 0.12291 vapor -21.3645365
23 133.73 165.92 0.02745 0.13465 vapor -20.76407118
23 133.73 165.92 0.02745 0.13465 supercritical -20.76407118
23 133.73 165.92 0.02745 0.13465 supercritical -20.76407118
24 148.55 194.61 0.02819 0.14937 supercritical -20.12634763
25 166.54 234.78 0.02917 0.16824 supercritical -19.43270788
26 189.21 293.61 0.03054 0.19303 supercritical -18.65831676
27 219.12 380.44 0.03253 0.22589 supercritical -17.76778681
28 259.44 484.99 0.03551 0.26633 supercritical -16.74289086
29 309.07 539.75 0.0396 0.3064 supercritical -15.68076022
92
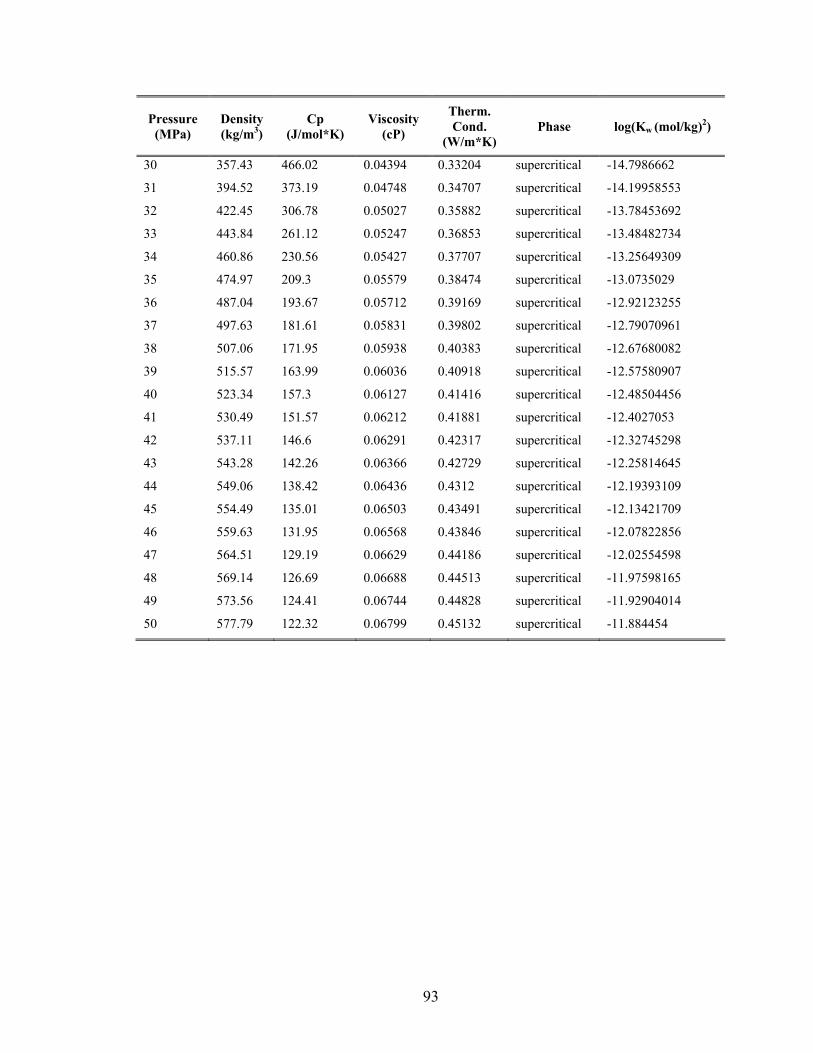
Pressure (MPa)
Density (kg/m3)
Cp (J/mol*K)
Viscosity (cP)
Therm. Cond.
(W/m*K) Phase log(Kw (mol/kg)2)
30 357.43 466.02 0.04394 0.33204 supercritical -14.7986662
31 394.52 373.19 0.04748 0.34707 supercritical -14.19958553
32 422.45 306.78 0.05027 0.35882 supercritical -13.78453692
33 443.84 261.12 0.05247 0.36853 supercritical -13.48482734
34 460.86 230.56 0.05427 0.37707 supercritical -13.25649309
35 474.97 209.3 0.05579 0.38474 supercritical -13.0735029
36 487.04 193.67 0.05712 0.39169 supercritical -12.92123255
37 497.63 181.61 0.05831 0.39802 supercritical -12.79070961
38 507.06 171.95 0.05938 0.40383 supercritical -12.67680082
39 515.57 163.99 0.06036 0.40918 supercritical -12.57580907
40 523.34 157.3 0.06127 0.41416 supercritical -12.48504456
41 530.49 151.57 0.06212 0.41881 supercritical -12.4027053
42 537.11 146.6 0.06291 0.42317 supercritical -12.32745298
43 543.28 142.26 0.06366 0.42729 supercritical -12.25814645
44 549.06 138.42 0.06436 0.4312 supercritical -12.19393109
45 554.49 135.01 0.06503 0.43491 supercritical -12.13421709
46 559.63 131.95 0.06568 0.43846 supercritical -12.07822856
47 564.51 129.19 0.06629 0.44186 supercritical -12.02554598
48 569.14 126.69 0.06688 0.44513 supercritical -11.97598165
49 573.56 124.41 0.06744 0.44828 supercritical -11.92904014
50 577.79 122.32 0.06799 0.45132 supercritical -11.884454
93

Table A.8 Isothermal data for water at T = 386oC
Pressure (MPa)
Density (kg/m3)
Cp (J/mol*K)
Viscosity (cP)
Therm. Cond.
(W/m*K) Phase log(Kw
(mol/kg)2)
0 0 37.01 0.02387 0.05302 vapor
1 3.3346 38.311 0.02383 0.05403 vapor -43.3553783
2 6.7697 39.751 0.0238 0.0551 vapor -39.04600627
3 10.315 41.346 0.02378 0.05625 vapor -36.48302249
4 13.981 43.11 0.02376 0.05748 vapor -34.63233323
5 17.78 45.065 0.02375 0.0588 vapor -33.16946183
6 21.727 47.234 0.02375 0.06023 vapor -31.94937367
7 25.837 49.647 0.02375 0.06179 vapor -30.89499943
8 30.13 52.338 0.02377 0.0635 vapor -29.95952974
9 34.628 55.352 0.0238 0.06538 vapor -29.11274541
10 39.358 58.743 0.02384 0.06746 vapor -28.3335413
11 44.352 62.582 0.0239 0.06979 vapor -27.60654175
12 49.648 66.957 0.02397 0.07242 vapor -26.92006286
13 55.295 71.986 0.02406 0.0754 vapor -26.26447497
14 61.352 77.825 0.02418 0.07882 vapor -25.63188588
15 67.896 84.688 0.02432 0.08279 vapor -25.01509507
16 75.027 92.878 0.0245 0.08745 vapor -24.40730166
17 82.878 102.84 0.02472 0.093 vapor -23.80163417
18 91.632 115.23 0.02499 0.09972 vapor -23.19055453
19 101.56 131.15 0.02533 0.10803 vapor -22.56451425
20 113.05 152.46 0.02578 0.11856 vapor -21.91223665
21 126.78 182.71 0.02636 0.13239 vapor -21.2146646
22 143.93 229.65 0.02718 0.15151 vapor -20.44253756
23 166.99 313.94 0.02842 0.18024 vapor -19.53814752
23 166.99 313.94 0.02842 0.18024 supercritical -19.53814752
23 166.99 313.94 0.02842 0.18024 supercritical -19.53814752
24 202.77 510.53 0.03064 0.23057 supercritical -18.3566621
25 278.35 1131.8 0.03629 0.3384 supercritical -16.42864154
26 386.94 682.14 0.04611 0.37504 supercritical -14.42404139
27 436.16 401.32 0.05109 0.38116 supercritical -13.69533198
28 464.16 295.13 0.05406 0.38843 supercritical -13.31667312
29 483.49 244.74 0.05618 0.39596 supercritical -13.06836493
94

Pressure (MPa)
Density (kg/m3)
Cp (J/mol*K)
Viscosity (cP)
Therm. Cond.
(W/m*K) Phase log(Kw
(mol/kg)2)
30 498.43 215.48 0.05785 0.40304 supercritical -12.88315899
31 510.73 195.96 0.05926 0.40949 supercritical -12.73480012
32 521.24 181.76 0.06048 0.41534 supercritical -12.61083555
33 530.44 170.86 0.06157 0.42069 supercritical -12.50435699
34 538.65 162.18 0.06256 0.42562 supercritical -12.41088438
35 546.07 155.07 0.06346 0.43021 supercritical -12.32762371
36 552.85 149.12 0.06429 0.4345 supercritical -12.25252784
37 559.11 144.07 0.06507 0.43854 supercritical -12.18400479
38 564.92 139.71 0.06581 0.44237 supercritical -12.12109054
39 570.36 135.91 0.0665 0.44602 supercritical -12.0627667
40 575.47 132.56 0.06716 0.4495 supercritical -12.00848536
41 580.29 129.58 0.06778 0.45284 supercritical -11.95772452
42 584.86 126.91 0.06838 0.45605 supercritical -11.9099844
43 589.21 124.49 0.06895 0.45915 supercritical -11.86488777
44 593.36 122.31 0.06951 0.46215 supercritical -11.8221738
45 597.33 120.31 0.07004 0.46504 supercritical -11.78159115
46 601.13 118.47 0.07055 0.46786 supercritical -11.74299817
47 604.79 116.78 0.07105 0.47059 supercritical -11.70605698
48 608.31 115.22 0.07153 0.47325 supercritical -11.67073913
49 611.7 113.76 0.072 0.47585 supercritical -11.6369183
50 614.98 112.41 0.07246 0.47838 supercritical -11.60437283
95

Table A.9 Isothermal data for water at T = 374oC
Pressure (MPa)
Density (kg/m3)
Cp (J/mol*K)
Viscosity (cP)
Therm. Cond.
(W/m*K) Phase log(Kw
(mol/kg)2)
0 0 36.869 0.02338 0.05161 vapor
1 3.4001 38.284 0.02333 0.05269 vapor -43.41136384
2 6.9109 39.867 0.02329 0.05383 vapor -39.08295628
3 10.544 41.637 0.02325 0.05505 vapor -36.50495075
4 14.312 43.617 0.02323 0.05636 vapor -34.6404127
5 18.232 45.836 0.02321 0.05778 vapor -33.16314215
6 22.32 48.327 0.0232 0.05933 vapor -31.92859547
7 26.598 51.133 0.02321 0.06103 vapor -30.85852064
8 31.091 54.308 0.02322 0.06291 vapor -29.9060424
9 35.83 57.921 0.02324 0.065 vapor -29.04031123
10 40.851 62.061 0.02328 0.06734 vapor -28.24000626
11 46.201 66.849 0.02334 0.07001 vapor -27.48898206
12 51.937 72.445 0.02342 0.07306 vapor -26.77481726
13 58.135 79.075 0.02352 0.07661 vapor -26.08685348
14 64.893 87.066 0.02365 0.08081 vapor -25.4157603
15 72.347 96.909 0.02382 0.08584 vapor -24.7522197
16 80.689 109.38 0.02403 0.09201 vapor -24.08627448
17 90.203 125.82 0.02431 0.09979 vapor -23.40609749
18 101.34 148.69 0.02468 0.10994 vapor -22.69566424
19 114.92 183.35 0.0252 0.12393 vapor -21.92825573
20 132.56 244.16 0.02597 0.14501 vapor -21.05683715
21 158.85 391.47 0.0273 0.18364 vapor -19.95275909
22 232.51 2703.1 0.03205 0.39813 vapor -17.62790723
23 469.23 407.96 0.05415 0.40406 vapor -13.34304165
23 469.23 407.96 0.05415 0.40406 supercritical -13.34304165
23 469.23 407.96 0.05415 0.40406 supercritical -13.34304165
24 495.97 279.53 0.05713 0.40813 supercritical -13.00483164
25 513.45 230.58 0.05914 0.41461 supercritical -12.79346124
26 526.8 203.17 0.0607 0.42078 supercritical -12.63682271
27 537.73 185.16 0.06201 0.42641 supercritical -12.51150607
28 547.07 172.23 0.06315 0.43158 supercritical -12.40642145
29 555.25 162.41 0.06416 0.43634 supercritical -12.31585136
96

Pressure (MPa)
Density (kg/m3)
Cp (J/mol*K)
Viscosity (cP)
Therm. Cond.
(W/m*K) Phase log(Kw
(mol/kg)2)
30 562.57 154.65 0.06508 0.44078 supercritical -12.23592746
31 569.21 148.32 0.06592 0.44495 supercritical -12.16432264
32 575.3 143.05 0.0667 0.44888 supercritical -12.09937954
33 580.94 138.57 0.06744 0.45261 supercritical -12.03984544
34 586.2 134.71 0.06813 0.45617 supercritical -11.9848411
35 591.13 131.34 0.06878 0.45958 supercritical -11.93373385
36 595.78 128.36 0.0694 0.46286 supercritical -11.88591836
37 600.18 125.7 0.06999 0.46601 supercritical -11.841016
38 604.36 123.31 0.07056 0.46906 supercritical -11.79866263
39 608.35 121.15 0.07111 0.47201 supercritical -11.75850678
40 612.16 119.18 0.07164 0.47487 supercritical -11.72040755
41 615.82 117.38 0.07215 0.47766 supercritical -11.68403093
42 619.33 115.73 0.07264 0.48036 supercritical -11.64934768
43 622.71 114.19 0.07312 0.483 supercritical -11.61613427
44 625.97 112.77 0.07358 0.48558 supercritical -11.58427039
45 629.11 111.45 0.07403 0.4881 supercritical -11.55373592
46 632.16 110.21 0.07447 0.49057 supercritical -11.52422221
47 635.11 109.06 0.0749 0.49298 supercritical -11.49581132
48 637.97 107.97 0.07532 0.49535 supercritical -11.46839291
49 640.75 106.94 0.07573 0.49767 supercritical -11.441859
50 643.45 105.98 0.07613 0.49995 supercritical -11.41619863
97

Name: Pranay Namilakonda Date of Degree: December, 2005
Institution: Oklahoma State University Location: Stillwater, Oklahoma
Title of Study: DEGRADATION KINETICS OF ORGANIC AMINES IN SUPERCRITICAL WATER
Pages in Study: 97 Candidate for Degree of Master of Science
Major Field: Chemical Engineering
Scope and Method of Study: Organic amines are widely used in hydrothermal systems operating at sub and near critical conditions as potential pH stabilizing agents. This report investigates the feasibility of their application in hydrothermal systems operating beyond critical point of water. Reaction kinetics of organic amine degradation plays a key role in evaluating their stability, basicity and volatility in supercritical water. A thorough literature review indicates that organic compounds in supercritical water decompose through pyrolysis and hydrolysis mechanisms. Pyrolysis mechanism is favored at low water densities and hydrolysis at high water densities, density being specific to organic compound. The reaction rate in hydrolysis pathway is significantly altered by solvent properties like ionic product and dielectric constant. Findings and Conclusions: Organic amines have the potential to serve as pH stabilizing agents in supercritical hydrothermal systems. Better prediction of degradation kinetics in hydrolysis pathway needs a modification in the kinetic equation by incorporating the effects of solvent properties. ADVISOR’S APPROVAL__________________________________________________ Gary L. Foutch
VITA
Pranay Kumar Namilakonda
Candidate for the Degree of
Master of Science
Thesis: DEGRADATION KINETICS OF ORGANIC AMINES IN SUPERCRITICAL WATER
Major Field: Chemical Engineering Biographical Information: Personal Data: Born in Vemulawada, Andhra Pradesh, India, August 5th, 1981,
the son of Namilakonda Yamuna and Namilakonda Hari Prasad. Education: Graduated from Mahathi Jr. College, Karimnagar, India, in May
1998; received Bachelor of Technology Degree in Chemical Engineering from Osmania University, Hyderabad, India, in June 2003; completed requirements for Master of Science Degree from Oklahoma State University, Stillwater in December 2005.
Experience: Summer Internship at Nuclear Fuel Complex, Hyderabad, India,
2002; employed by Oklahoma State University, School of Chemical Engineering as Graduate Assistant, January 2004 to December 2005.