the iri guide to certified infoscan measuresmela/marketing460/ata... · 2007-03-28 · sales per...
TRANSCRIPT

IRI InfoScan Measure Guide Copyright Information Resources, Inc. 2006 June, 2006
- 1 -
THE IRI GUIDE TO CERTIFIED INFOSCAN MEASURES
Published by Analytics Research and Development

IRI InfoScan Measure Guide Copyright Information Resources, Inc. 2006 June, 2006
- 2 -
Introduction to the Guide................................................................................................5 How to use this Guide................................................................................................................. 6 Description of the Entries ........................................................................................................... 7 Causal Definitions....................................................................................................................... 8 Base and Incremental Sales Overview...................................................................................... 18 % ACV (including ACV Weighted Distribution) (Algorithm 019) ......................................... 20 % ACV Selling (Algorithm 003) .............................................................................................. 22 % Base Decomposed Sales ....................................................................................................... 24 % Base Decomposed Sales to Total Sales (Algorithm 057)..................................................... 25 % Base Decomposed Sales @ Size........................................................................................... 26 % Base Decomposed Sales @ Size to Total Sales (Algorithm 065) ........................................ 27 % Base Sales @ Size to Total Sales (Algorithm 065) .............................................................. 28 % Baseline Sales to Total Sales (Algorithm 008)..................................................................... 29 % CWD (including Category Weighted Distribution) (Algorithm 019) .................................. 30 % CWD Selling......................................................................................................................... 32 % Increase in Sales (Algorithm 037) ........................................................................................ 34 % Increase in Sales @ Size (Algorithm 107) ........................................................................... 36 % Incremental Decomposed Sales............................................................................................ 38 % Incremental Decomposed Sales @ Size ............................................................................... 39 % Incremental Sales to Total Sales (Algorithm 060) ............................................................... 40 % Incremental Sales @ Size to Total Sales (Algorithm 061)................................................... 41 % of Sales (Algorithm 012) ...................................................................................................... 42 % of Stores (Algorithm 021)..................................................................................................... 43 % of Stores Selling (Algorithm 066) ........................................................................................ 45 % Promoted Sales (Merchandising Mix).................................................................................. 46 % Promoted Sales, Incremental (Trade Efficiency) ................................................................. 47 % Promoted Sales, Incremental (SP) (Trade Efficiency) ......................................................... 48 % Weekly ACV (Algorithm 088) ............................................................................................. 49 ACV ($MM) (Algorithm 997) .................................................................................................. 50 Added Dollars if 100% Distribution (Opportunity Dollars) ..................................................... 52 Additive Cumulative Weighted Weeks (Algorithm 040) ......................................................... 53 Additive Cumulative Weighted Weeks CWD (Algorithm 40)................................................. 55 Additive Weighted Weeks (Algorithm 087)............................................................................. 57 Additive Weighted Weeks CWD (Algorithm 087) .................................................................. 59 Average % Price Reduction with Coupon (Algorithm 102)..................................................... 61 Average Category Weighted Distribution (Algorithm 030) ..................................................... 63 Average Items per Store (CWD weighted) (Algorithm 048).................................................... 64 Average Items per Store Selling (Algorithm 048).................................................................... 65 Average Manufacturer Coupon Value (551) ............................................................................ 67 Average Number of Levels....................................................................................................... 68 Average Period ACV Weighted Distribution (Algorithm 009)................................................ 70 Average Price (Algorithm 018) ................................................................................................ 71 Average Sales per Store Selling (Algorithm 005) .................................................................... 72 Average Store Coupon Value (076).......................................................................................... 73 Average Store Price with Coupon (Algorithm 101) ................................................................. 74 Average Weekly % of ACV (Algorithm 030) .......................................................................... 75

IRI InfoScan Measure Guide Copyright Information Resources, Inc. 2006 June, 2006
- 3 -
Average Weekly Base Sales per $MM ACV (Algorithm 023) ................................................ 76 Average Weekly Base Volume (Algorithm A02)..................................................................... 78 Average Weekly Category Weighted Distribution (Algorithm 030)........................................ 79 Average Weekly Incremental Sales per $MM ACV (Algorithm 031) ..................................... 80 Average Weekly Items per Store Selling (Algorithm 180) ...................................................... 82 Average Weekly Items per Store Selling (CWD weighted) (Algorithm 180).......................... 84 Average Weekly Sales per $MM ACV (Algorithm 020) ......................................................... 86 Base Decomposed Sales (Algorithm 010) ................................................................................ 88 Base Decomposed Sales @ Size (Algorithm 079).................................................................... 89 Base Sales (Algorithm 010) ...................................................................................................... 91 Base Sales @ Size (Algorithm 079) ......................................................................................... 93 Base Sales @ Size per $MM ACV (Algorithm 086)................................................................ 95 Base Sales per $MM ACV (Algorithm 052) ............................................................................ 97 Base Sales Share of Category Base (Algorithm 026) ............................................................... 98 Base Sales Share of Total Category (Algorithm 025) .............................................................. 99 Base Weighted Weeks ............................................................................................................ 100 Baseline Sales (Algorithm 078) .............................................................................................. 101 Brand Development Index ...................................................................................................... 103 Bump Sales (Algorithm 071) .................................................................................................. 104 Category Development Index ................................................................................................. 106 Coupon Circulation (Algorithm 552)...................................................................................... 107 Estimated Coupon Redemption (Algorithm 553) ................................................................... 108 Households (Algorithm 998) .................................................................................................. 109 Incremental Decomposed Sales (Algorithm 024)................................................................... 110 Incremental Decomposed Sales @ Size (Algorithm 050) ...................................................... 112 Incremental Dollars per Markdown Dollars (Algorithm 044)................................................ 115 Incremental Sales (Algorithm 024)......................................................................................... 116 Incremental Sales @ Size (Algorithm 050) ............................................................................ 118 Incremental Sales Share of Category Volume (Algorithm 034)............................................. 121 Incremental Sales Share of Category Incremental (Algorithm 035) ...................................... 122 Incremental Weeks (Algorithm 032) ...................................................................................... 123 Items Moved (Algorithm 049) ................................................................................................ 124 Manufacturer Coupon Dollars ................................................................................................ 126 Markdown Dollars (Algorithm 043)....................................................................................... 127 Normal Sales (Algorithm 111)................................................................................................ 128 Number of Displays (Algorithm 109)..................................................................................... 130 Population (Algorithm 999).................................................................................................... 131 Product Development Index ................................................................................................... 132 Sales (Algorithm 001)............................................................................................................. 133 Sales per Point of ACV Weighted Distribution (Algorithm 004)........................................... 134 Sales Per Point of Category Weighted Distribution ............................................................... 135 Sales per Thousand Category Dollars Selling ........................................................................ 136 Sales Per Total Points of Category Weighted Distribution .................................................... 137 Sales Per Total Points of Distribution..................................................................................... 138 Sales per $MM ACV (Algorithm 002) ................................................................................... 139 Sales Share of Category (Algorithm 006)............................................................................... 141

IRI InfoScan Measure Guide Copyright Information Resources, Inc. 2006 June, 2006
- 4 -
Share of Coupon Circulation (Algorithm 554) ....................................................................... 142 Share of Merchandising Occurrences (Algorithm 014).......................................................... 143 Share of Weighted Feature – Brand (Algorithm 016) ............................................................ 145 Share of Weighted Feature - Size (Algorithm 017) ................................................................ 147 Total Points of ACV Weighted Distribution (Algorithm 084) ............................................... 149 Total Points of Category Weighted Distribution (Algorithm 084)......................................... 150 Total Points of Quality Merchandising (Algorithm 114) ....................................................... 151 UPC......................................................................................................................................... 152 Weeks in Distribution (Algorithm 108).................................................................................. 153 Weighted Average % Price Cut (Algorithm 046)................................................................... 154 Weighted Average % Price Reduction (Algorithm 045) ........................................................ 156 Weighted Average Base Price (Algorithm 027) ..................................................................... 158

IRI InfoScan Measure Guide Copyright Information Resources, Inc. 2006 June, 2006
- 5 -
Introduction to the Guide
IRI InfoScan Measure Guide Copyright Information Resources, Inc. 2006 June, 2006
- 6 -
How to use this Guide This measure guide contains information on all IRI certified stored and derived measures. The measures have been organized into Measure Groups. The Measure Group closely corresponds to the concept of an algorithm. An algorithm is the general calculation for a group of related measures. For example, Unit Sales on Display Only, Volume Sales on Feature and Display, and Dollar Sales on Feature are all calculated in the same manner – sum Unit, Volume, or Dollar Sales across stores with a particular causal condition. This guide can be used alone or it can be used in conjunction with the Certified Measure List. To find the description of a Certified Measure, first find the measure on the Certified Measure List and then scroll to the right to find the Measure Group to which the measure belongs (column F). You can then look up the Measure Group description in this document’s Table of Contents. You can also use the Measure Group column in the Certified Measure List to find all of the Certified Measures belonging to a particular measure group. Please note that this Guide does not cover measures offered as part of IRI’s Tobacco services nor does it cover shelf or display audit measures.

IRI InfoScan Measure Guide Copyright Information Resources, Inc. 2006 June, 2006
- 7 -
Description of the Entries
Below is a template of the Measure Guide Entries, with explanations for the entries. Measure Group This heading refers to the measure algorithm. A measure
group will almost always contain more than one actual measure.
Measure Type Indicates whether a measure is Stored or Derived.
Definition Provides a text description of the measure.
Calculation Provides the formula used to calculate the measure.
Common Use(s) Lists the common applications of the measure.
Usage Notes Provides additional recommendations, caveats, or
restrictions on using the measure Additivity This section indicates whether the measure is additive
across processed geography, time, or product dimensions.
Aggregation Rules Aggregation refers to methods of combining processed
data for a custom geography, time period, or product combination. This section lists the rules for calculating custom aggregates.
Geography Product Time Related Measures Lists measures that have similar uses.

IRI InfoScan Measure Guide Copyright Information Resources, Inc. 2006 June, 2006
- 8 -
Causal Definitions Definitions for Causal Collection Features: A feature is a retailer print advertisement that is used to promote
a specific product or group of products.
IRI collects chain wide advertising from the following sources:
• Newspapers o Circulars or door hangers o Rotos – full-color glossy inserts o ROPs – Features printed Right on the NewsPaper
• In-Store Flyers • Mailers • Coupon Booklets (coded for Census stores only if received
from corporate offices) • Monthly Ads
Feature Vehicle
Primary Ads The primary ad is the main advertising vehicle for a retailer for a
given week. Primary ads usually run seven days or more. The Primary ad should be the ad vehicle with the highest level of distribution to the consumer. For example, a retailer ad dropped in a newspaper would have more distribution than an in-store flyer. Primary Ads are collected for all stores (both census and sample stores).
Rotos appearing in their first week are always considered primary ads, even if there is also another primary ad in that week.
Secondary Ads/Tertiary Ads The secondary ad is an ad vehicle that the retailer may drop in addition to the primary ad in a particular ad week. Secondary ads may run fewer than 7 days and may be dropped after the retailer’s best food day. Secondary ads may also be monthly coupon booklets or 4-week monthly ads or special rotos. Secondary ads may be chain-wide such as some coupon booklets or monthly ads. Secondary ads may also be regional,

IRI InfoScan Measure Guide Copyright Information Resources, Inc. 2006 June, 2006
- 9 -
market or metro area specific. Secondary ads are collected for sample stores only. Feature ads that run for more than one week are captured in the data for up to 4 weeks. In the first week, the feature ad will be reported as primary or secondary based on the definitions outlined above. In weeks, 2-4 the feature ad will be classified as a Tertiary ad. A multi-ad week will not be considered a feature after the fourth week. Tertiary ads are only captured for sample stores. Feature Dominance IRI classifies all collected features based on their absolute size. The following categories are used to classify features. Large Feature A Features are the largest sized features. Medium Feature B Features are medium sized features. Small Feature C Features are the smallest features. These are generally text only with no picture. C Features are sometimes referred to as obituary ads. Coupon Features
Coupon Features are features that include a retailer coupon, or a manufacturer coupon printed in the feature, regardless of the size of the feature. (Coupon Features are called A+ features by IRI reporting systems.) Frequent Shopper Features
In addition to collecting information about the size of a feature and the vehicle in which it is located, IRI also collects information about whether or not the feature advertised a frequent shopper program offer.
Displays: A display is a mechanism used by a retailer or manufacturer to increase sales by stocking products in high traffic locations

IRI InfoScan Measure Guide Copyright Information Resources, Inc. 2006 June, 2006
- 10 -
throughout the retail environment. A display is defined by its location in the retail outlet.
Display Locations
Products stocked in one or more of the following locations qualify as a display:
• Lobby • Front End Cap • Back End Cap • Other End Cap • Perimeter • In-Aisle • Seasonal/Promotional • Shipper
Price Reductions: Price Reductions are price decreases of at least 5 % from the
regular shelf price. Price Reductions are identified by IRI systems at a store-week-UPC level by comparing the movement price with IRI’s base price. If a price is reduced for more than six consecutive weeks without feature or display, the reduced price becomes the new base price in the seventh week.
Please note the following: • Unadvertised FSP price reductions will be captured and
identified as price reductions by IRI’s systems—retailers do not provide enough detail to discriminate between FSP price reductions and general price reductions.
• For Special Pack categories, Price Reductions are identified at the baselining level NOT at the UPC level.
Special Pack: A Special Pack is a manufacturer promotion. Manufacturers
offer consumers a special incentive as part of the package itself. Special packs are identified by IRI during the new item coding process. IRI codes the following five package types as special packs: cents-off packs, pre-priced packs, bonus packs, buy/get packs, and premium packs. Special packs are only treated as promotional conditions for categories that are processed using Special Pack Baselining.

IRI InfoScan Measure Guide Copyright Information Resources, Inc. 2006 June, 2006
- 11 -
Definitions for Reporting Standard Causal Conditions Using information about the merchandising activity defined in the previous section, IRI can report measures for a wide variety of causal conditions. The following two sections provide definitions for each of these causal conditions. Standard Causal Conditions: Most standard (non-special pack) causal conditions are defined based on the presence or absence of each of three merchandising activities: feature, display, and price reduction.
FEATURE DISPLAY
PRICEREDUCTION
4
1 2 3
56
7
Any Display 2+3+5+6 Feature &/or Display 1+2+3+4+5+6 Any Feature 1+2+4+5 Any Merchandising 1+2+3+4+5+6+7 Feature Only 1+4 Price Reduction Only (TPR) 7 Display Only 3+6 Any Price Reduction 4+5+6+7 Feature & Display 2+5 No promo No promo present

IRI InfoScan Measure Guide Copyright Information Resources, Inc. 2006 June, 2006
- 12 -
Special Pack Causal Conditions In addition to Features, Displays, and Price Reduction, causal conditions used in special pack database are defined with reference to an additional causal type – Special Pack.
Any Display b+c+e+f+g+i
+j Feature &/or Display a+b+c+d+e+f+g+h+i+j
Any Feature a+b+d+e+f+h+i
Any Merchandising and/or Special Pack
a+b+c+d+e+f+g+h+i+j+k+l+m
Feature Only a+d+h Price Reduction Only, no Special Pack
k
Display Only c+g+j Any Price Reduction d+e+h+i+j+k+l Feature & Display
b+e+f+i Special Pack Only J+l+m
No Promo No promo present
Any Special Pack f+g+h+i+j+l+m
Please note: In Special Pack categories, all UPCs belonging to the same baselining aggregate are treated as though they were promoted in the same way. For example, if one UPC within the aggregate was on display, all of the UPCs will be treated as though they were on display for purposes of measure calculation. As a result, it is possible to see sales on ‘Any Special Pack’ or ‘Special Pack Only’ for UPCs that are not themselves Special Packs.
a b c
d e f g
hi
jk l m
FEATUR DISPLAY
PRICE REDUCTION
SPECIAL PACK

IRI InfoScan Measure Guide Copyright Information Resources, Inc. 2006 June, 2006
- 13 -
Special Causal Conditions: In addition to the standard InfoScan causal conditions, IRI also offers a variety of special causal conditions that can be delivered to clients to meet more specific needs. In most instances, only a limited number of measures are available with these special causal conditions. Special Feature Conditions: IRI delivers several special feature conditions. These conditions provide additional information about the size or type of feature that was offered. Any FSP Feature: A frequent shopper feature was present. Feature A+: A retailer coupon was present. There may or may
not be a display, price reduction (or special pack) present.
Feature A: A large feature and/or a retailer coupon were present. There may or may not be a display, price reduction (or special pack) present.
Feature B: A medium feature was present. There may or may not be a display, price reduction (or special pack) present.
Feature C: A small sized feature present. There may or may not be a display, price reduction (or special pack) present.
Feature AB: A retailer coupon, large feature, or medium feature was present. There may or may not be a display, price reduction (or special pack) present.
Feature A+ Only A retailer coupon feature but no display was present. There may or may not be a price reduction.
Feature A Only A large feature and/or a retailer coupon feature but no display was present. There may or may not be a price reduction.
Feature B Only A medium feature but no display was present. There may or may not be a price reduction.
Feature C Only A small sized feature but no display was present. There may or may not be a price reduction.
Feature AB Only A retailer coupon feature, large feature, or medium feature but no display was present. There may or may not be a price reduction.
Please note the following:
IRI InfoScan Measure Guide Copyright Information Resources, Inc. 2006 June, 2006
- 14 -
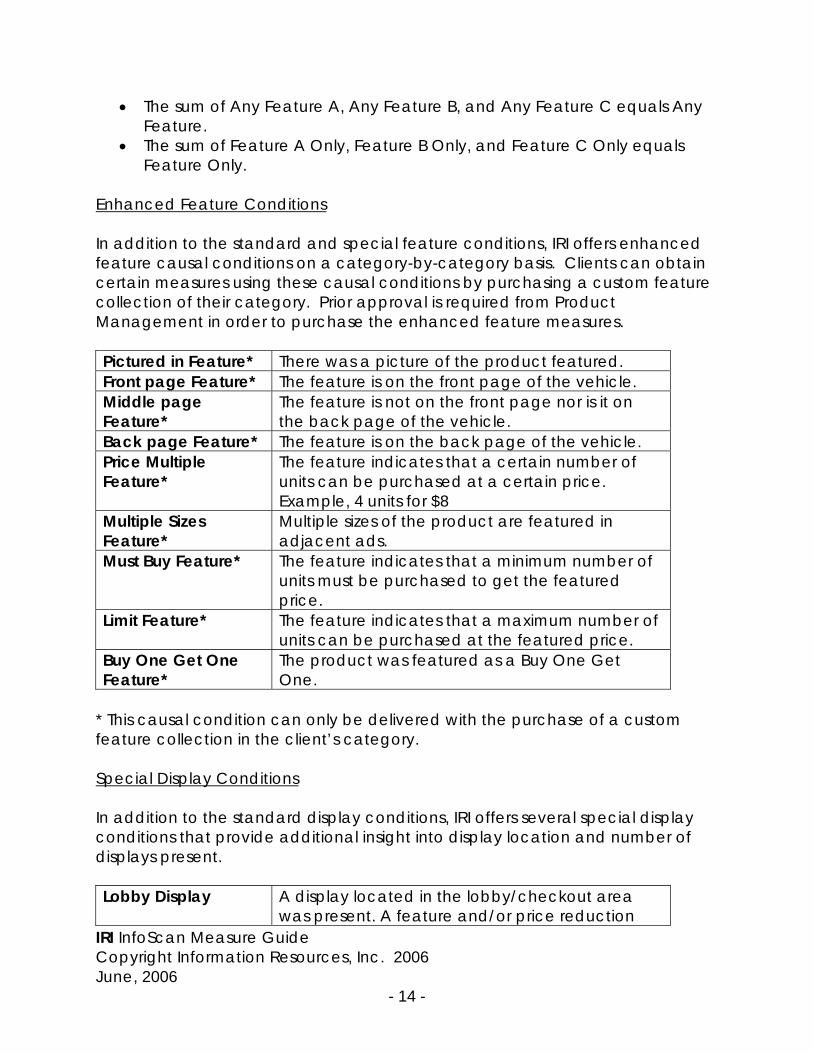
• The sum of Any Feature A, Any Feature B, and Any Feature C equals Any
Feature. • The sum of Feature A Only, Feature B Only, and Feature C Only equals
Feature Only. Enhanced Feature Conditions In addition to the standard and special feature conditions, IRI offers enhanced feature causal conditions on a category-by-category basis. Clients can obtain certain measures using these causal conditions by purchasing a custom feature collection of their category. Prior approval is required from Product Management in order to purchase the enhanced feature measures. Pictured in Feature* There was a picture of the product featured. Front page Feature* The feature is on the front page of the vehicle. Middle page Feature*
The feature is not on the front page nor is it on the back page of the vehicle.
Back page Feature* The feature is on the back page of the vehicle. Price Multiple Feature*
The feature indicates that a certain number of units can be purchased at a certain price. Example, 4 units for $8
Multiple Sizes Feature*
Multiple sizes of the product are featured in adjacent ads.
Must Buy Feature* The feature indicates that a minimum number of units must be purchased to get the featured price.
Limit Feature*
The feature indicates that a maximum number of units can be purchased at the featured price.
Buy One Get One Feature*
The product was featured as a Buy One Get One.
* This causal condition can only be delivered with the purchase of a custom feature collection in the client’s category. Special Display Conditions In addition to the standard display conditions, IRI offers several special display conditions that provide additional insight into display location and number of displays present. Lobby Display A display located in the lobby/checkout area
was present. A feature and/or price reduction

IRI InfoScan Measure Guide Copyright Information Resources, Inc. 2006 June, 2006
- 15 -
may or may not have been present. Major Display A display was located in the checkout/lobby
area, front end-of-aisle, or back end-of-aisle. A feature and/or price reduction may or may not have been present.
Minor Display A display was located mid-aisle, in the promotional aisle, or in a specialty location. A feature and/or price reduction may or may not have been present. A feature and/or price reduction may or may not have been present.
Shipper A shipper display was present. A feature and/or price reduction may or may not have been present.
Major Display Only A Major Display was present but there was no feature. There may or may not have been a price reduction.
Minor Display Only A Minor Display was present but there was no feature. There may or may not have been a price reduction.
Multiple Displays More than one display was present in the store.

IRI InfoScan Measure Guide Copyright Information Resources, Inc. 2006 June, 2006
- 16 -
Special Price Reduction Measures IRI offers a set of special price reduction measures that offer additional visibility into the depth of temporary price reductions. Extra Large Price Reduction
A price reduction greater than Z% is present. There may or may not have been a feature or display.
Large Price Reduction A price reduction greater than or equal to Y% is present. There may or may not have been a feature or display.
Medium Price Reduction A price reduction greater than or equal to X% but less than Y% is present. There may or may not have been a feature or display.
Small Price Reduction A price reduction greater than or equal to 5% but less than X% is present. There may or may not have been a feature or display.
The thresholds can be defined on a client/category basis at the time the database is set-up. The default values for the thresholds are:
• X = 15% • Y = 25% • Z = 35%
Please note:
• The sum of Large Price Reduction, Medium Price Reduction, and Small Price Reduction equals Any Price Reduction.
• Extra Large Price Reduction is a subset of Large Price Reduction.

IRI InfoScan Measure Guide Copyright Information Resources, Inc. 2006 June, 2006
- 17 -
Special Census Causal Conditions IRI delivers a special set of causal conditions for use in geographies for which full causal data is not releasable. Although Displays and Non-Primary features are not reported for these geographies, Price Reduction and Primary feature information is available. The following causal conditions have been created to allow users to track promoted sales and promotion response in geographies for which full causal data is not releasable. Any Main Ad A primary feature was present. There may or
may not have been a price reduction. There may or may not have been a display or secondary/tertiary feature.
Any Price Cut A price reduction of at least 5% was present. There may or may not have been a primary feature. There may or may not have been a display or secondary/tertiary feature.
Main Ad or Price Cut A primary feature and/or a price reduction of at least 5% was present. There may or may not have been a display or secondary/tertiary feature.
Price Cut Only A price reduction of at least 5% was present with no primary feature. There may or may not have been a display or secondary/tertiary feature.
IRI InfoScan Measure Guide Copyright Information Resources, Inc. 2006 June, 2006
- 18 -
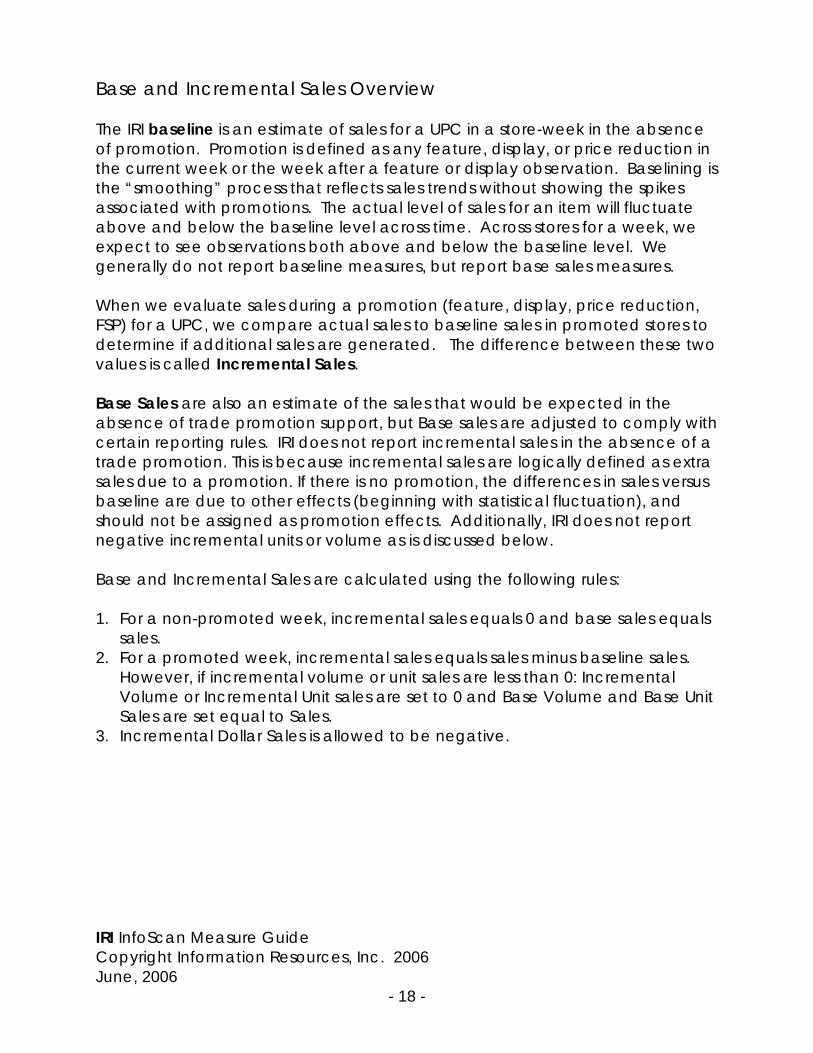
Base and Incremental Sales Overview The IRI baseline is an estimate of sales for a UPC in a store-week in the absence of promotion. Promotion is defined as any feature, display, or price reduction in the current week or the week after a feature or display observation. Baselining is the “smoothing” process that reflects sales trends without showing the spikes associated with promotions. The actual level of sales for an item will fluctuate above and below the baseline level across time. Across stores for a week, we expect to see observations both above and below the baseline level. We generally do not report baseline measures, but report base sales measures. When we evaluate sales during a promotion (feature, display, price reduction, FSP) for a UPC, we compare actual sales to baseline sales in promoted stores to determine if additional sales are generated. The difference between these two values is called Incremental Sales. Base Sales are also an estimate of the sales that would be expected in the absence of trade promotion support, but Base sales are adjusted to comply with certain reporting rules. IRI does not report incremental sales in the absence of a trade promotion. This is because incremental sales are logically defined as extra sales due to a promotion. If there is no promotion, the differences in sales versus baseline are due to other effects (beginning with statistical fluctuation), and should not be assigned as promotion effects. Additionally, IRI does not report negative incremental units or volume as is discussed below. Base and Incremental Sales are calculated using the following rules: 1. For a non-promoted week, incremental sales equals 0 and base sales equals
sales. 2. For a promoted week, incremental sales equals sales minus baseline sales.
However, if incremental volume or unit sales are less than 0: Incremental Volume or Incremental Unit sales are set to 0 and Base Volume and Base Unit Sales are set equal to Sales.
3. Incremental Dollar Sales is allowed to be negative.

IRI InfoScan Measure Guide Copyright Information Resources, Inc. 2006 June, 2006
- 19 -
Measure Guide Entries

IRI InfoScan Measure Guide Copyright Information Resources, Inc. 2006 June, 2006
- 20 -
Measure Group % ACV (including ACV Weighted Distribution)
(Algorithm 019) Measure Type Stored Definition These measures report a product’s distribution or
distribution on promotion weighted by the store size (ACV). Theses measures can be reported either with or without a merchandising condition.
• When reported without a merchandising condition, the measure is often called ACV Weighted Distribution.
• When reported with a merchandising condition, the measure group is called % of ACV.
Calculation ACV Weighted Distribution:
Σ ACV of stores selling the product *100 Σ ACV of stores in the geography % of ACV, on merchandising condition: Σ ACV of stores selling the product on merchandising *100 Σ ACV of stores in the geography A store will be counted as having sold the product or product group if at least one unit was scanned within the selected time period.
Common Use(s) • To understand the distribution of a product or
group of products. • To understand and compare the promotional
reach of products. Usage Notes • In general, when evaluating overall distribution
for periods greater than 13 weeks, the measure Average Weekly % of ACV is preferable to ACV

IRI InfoScan Measure Guide Copyright Information Resources, Inc. 2006 June, 2006
- 21 -
Weighted Distribution. • In general, when evaluating promotional reach
for periods greater than 13 weeks, the measure % Weekly ACV on merchandising is preferable to % ACV on merchandising.
• These measures are not additive across merchandising conditions. For example, summing % ACV, Feature Only, % ACV, Feature and Display, % ACV Display Only, and % ACV Price Reduction Only does not equal % ACV, Any Merchandising.
Additivity Non-additive across all dimensions Aggregation Rules Geography Average Weighted by: ACV Product Largest Time Largest Related Measures • % ACV Selling
• Average Weekly % of ACV • Average Period % of ACV • % Weekly ACV • % of Stores

IRI InfoScan Measure Guide Copyright Information Resources, Inc. 2006 June, 2006
- 22 -
Measure Group % ACV Selling (Algorithm 003) Measure Type Derived Definition These measures report distribution on
merchandising within the stores selling the product. These measures weight distribution by store size (ACV).
Calculation Σ ACV of stores selling the product on merchandising *100
Σ ACV of stores selling the product A store will be counted as having sold the product or product group if at least one unit was scanned within the selected time period.
Common Use(s) • To compare relative levels of merchandising
across brands or products of varying distribution.
• To understand the types of promotional support a product receives, irrespective of effectiveness.
Usage Notes • These stores differ from % ACV measures
because % ACV Selling expresses the ACV of the stores selling the product on merchandising as a percentage of the ACV of the stores selling the product, while % ACV measures express the ACV of stores selling the product on merchandising as a percentage of the total ACV of the geography.
• These measures are most useful with time periods of 13 weeks or less.
• These measures are not additive across merchandising conditions. For example, summing % ACV Selling, Feature Only, % ACV Selling, Feature and Display, % ACV Selling Display Only, and % ACV Selling Price Reduction Only does not equal % ACV Selling, Any Merchandising.
Additivity Non-additive across all dimensions

IRI InfoScan Measure Guide Copyright Information Resources, Inc. 2006 June, 2006
- 23 -
Aggregation Rules Derived measures inherit the aggregation rules of
their component stored measures. Related Measures • % ACV
• % of Stores Selling • Cumulative Weighted Weeks • Additive Cumulative Weighted Weeks

IRI InfoScan Measure Guide Copyright Information Resources, Inc. 2006 June, 2006
- 24 -
Measure Group % Base Decomposed Sales Measure Type Derived Definition These measures report a product’s Base Sales in
promoting stores expressed as a percentage of the product’s total Base Sales.
Calculation Base Decomposed Sales * 100
Base Sales Common Use(s) To determine what percentage of total Base Sales
was contributed by stores with a particular merchandising condition.
Usage Notes • Base Sales @ Size on merchandising condition
does not take into account the week-after effect, while Base Sales @ Size does. This inconsistency may tend to underestimate % Base Sales @ Size on merchandising condition.
• Because of the inconsistency noted above, these measures are not recommended for general use.
Additivity Non-additive across all dimensions. Aggregation Rules Derived measures inherit the aggregation rules of
their component stored measures. Related Measures • % of Sales
• % Promoted Sales • % Incremental Sales • Base Weighted Weeks
IRI InfoScan Measure Guide Copyright Information Resources, Inc. 2006 June, 2006
- 25 -
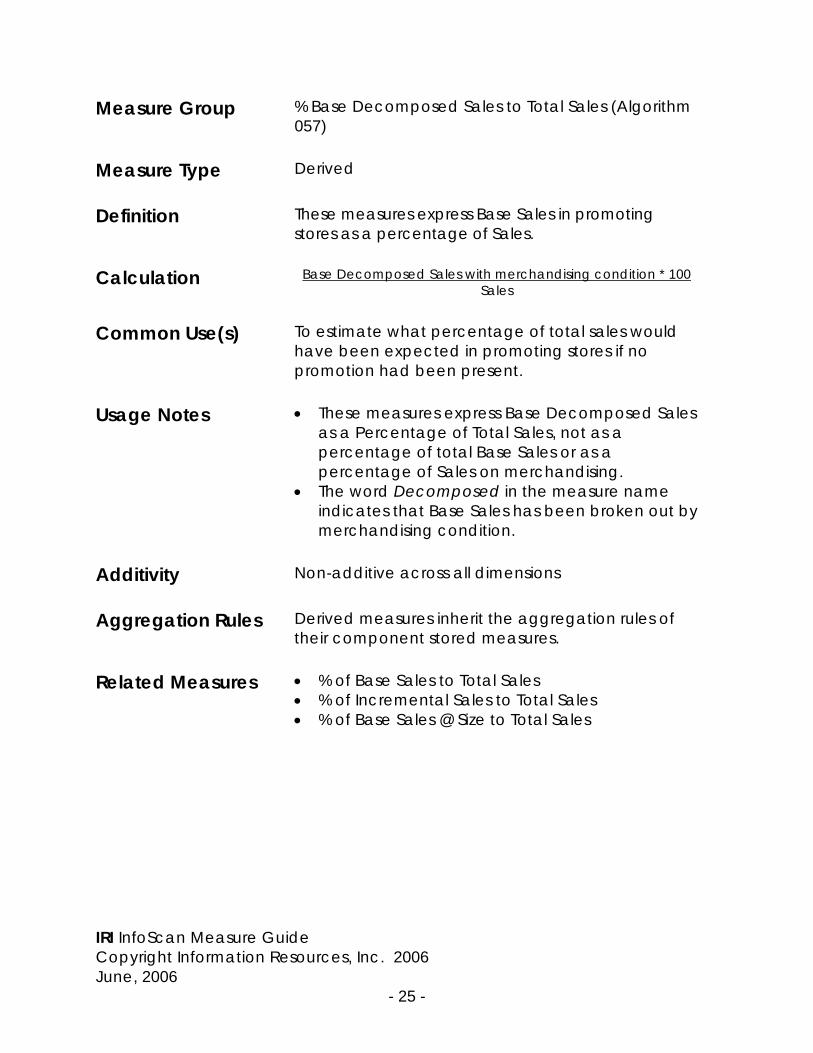
Measure Group % Base Decomposed Sales to Total Sales (Algorithm
057) Measure Type Derived Definition These measures express Base Sales in promoting
stores as a percentage of Sales. Calculation Base Decomposed Sales with merchandising condition * 100
Sales Common Use(s) To estimate what percentage of total sales would
have been expected in promoting stores if no promotion had been present.
Usage Notes • These measures express Base Decomposed Sales
as a Percentage of Total Sales, not as a percentage of total Base Sales or as a percentage of Sales on merchandising.
• The word Decomposed in the measure name indicates that Base Sales has been broken out by merchandising condition.
Additivity Non-additive across all dimensions Aggregation Rules Derived measures inherit the aggregation rules of
their component stored measures. Related Measures • % of Base Sales to Total Sales
• % of Incremental Sales to Total Sales • % of Base Sales @ Size to Total Sales
IRI InfoScan Measure Guide Copyright Information Resources, Inc. 2006 June, 2006
- 26 -
Measure Group % Base Decomposed Sales @ Size Measure Type Derived Definition % Base Decomposed Sales @ Size (Volume and
Dollars) are used in place of % Base Decomposed Sales for all Special Pack categories. These measures report a product’s Base Sales @ Size on a particular merchandising condition expressed as a percentage of the product’s total Base Sales @ Size.
Calculation Base Sales @ Size on merchandising condition * 100
Base Sales @ Size Common Use To determine what percentage of total Base Sales
@ Size was contributed by stores with a particular merchandising condition.
Usage Notes • Base Sales @ Size on merchandising condition
does not take into account the week-after effect, while Base Sales @ Size does. This inconsistency may tend to underestimate % Base Sales @ Size on merchandising condition.
• Because of the inconsistency noted above, these measures are not recommended for general use.
Additivity Non-additive across all dimensions. Aggregation Rules Derived measures inherit the aggregation rules of
their component stored measures. Related Measures • % of Sales
• % Incremental Decomposed Sales @ Size • % Base Decomposed Sales

IRI InfoScan Measure Guide Copyright Information Resources, Inc. 2006 June, 2006
- 27 -
Measure Group % Base Decomposed Sales @ Size to Total Sales
(Algorithm 065) Measure Type Derived Definition % Base Decomposed Sales @ Size to Total Sales are
used in place of % Base Decomposed Sales to Total Sales for all Special Pack categories. These measures express Base in promoting stores as a percentage of total Sales.
Calculation Base Decomposed Sales @ Size * 100
Sales Common Use(s) To estimate what percentage of total sales would
have been expected in promoting stores if no promotion had been present.
Usage Notes • Do not use these measures for products below the
Special Pack baselining level. • These measures express Base Decomposed Sales
as a Percentage of Total Sales, neither as a percentage of total Base Sales nor as a percentage of Sales on merchandising.
• The word Decomposed in the measure name indicates that Base Sales has been broken out by merchandising condition.
Additivity Non-additive across all dimensions Aggregation Rules Derived measures inherit the aggregation rules of
their component stored measures. Related Measures % of Base Sales @ Size to Total Sales
% of Base Decomposed Sales to Total Sales

IRI InfoScan Measure Guide Copyright Information Resources, Inc. 2006 June, 2006
- 28 -
Measure Group % Base Sales @ Size to Total Sales (Algorithm 065) Measure Type Derived Definition % Base Sales @ Size) to Total Sales are used in place
of % Base Sales to Total Sales for all Special Pack categories. These measures express Base Sales @ Size or Base Decomposed Sales @ Size as a percentage of total Sales.
Calculation Base Sales @ Size * 100
Sales Common Use(s) • To determine what amount of Sales would have
sold in absence of any merchandising. • To track the importance of Base Sales relative to
the competition. • To compare the importance of Base Sales of a
product across geographies. Usage Notes Do not use these measures for products below the
Special Pack baselining level. Additivity Non-additive across all dimensions Aggregation Rules Derived measures inherit the aggregation rules of
their component stored measures. Related Measures • % of Base Sales to Total Sales
• % of Incremental Sales @ Size to Total Sales

IRI InfoScan Measure Guide Copyright Information Resources, Inc. 2006 June, 2006
- 29 -
Measure Group % Baseline Sales to Total Sales (Algorithm 008) Measure Type Derived Definition These measures express Baseline Sales as a
percentage of total Sales. Calculation Baseline Sales * 100
Sales Common Use(s) For most purposes IRI recommends using Base Sales
instead of Baseline Sales. Therefore, in most cases % of Base Sales to Total Sales is the preferred measure group. For a comparison of Baseline and Base Sales, please see the description in this document for Baseline Sales.
Usage Notes Because Baseline Sales is allowed to be greater
than Sales in any given week, % of Baseline Sales to Total Sales can result in values greater than 100%.
Additivity Non-additive across all dimensions Aggregation Rules Derived measures inherit the aggregation rules of
their component stored measures. Related Measures • % of Base Sales to Total Sales
• % of Base Sales @ Size to Total Sales • Baseline Sales

IRI InfoScan Measure Guide Copyright Information Resources, Inc. 2006 June, 2006
- 30 -
Measure Group % CWD (including Category Weighted Distribution)
(Algorithm 019) Measure Type Stored Definition These measures report a product’s distribution
weighted by the Dollar Sales of the stores carrying the category. Theses measures can be reported either with or without a merchandising condition.
• When reported without a merchandising condition, the measure is often called Category Weighted Distribution.
• When reported with a merchandising condition, the measure group is called % CWD.
Calculation Category Weighted Distribution:
Σ Category sales of stores selling the product *100
Σ Category sales of stores in the geography
%CWD, on merchandising condition:
(Σ Category sales of stores selling the product on merchandising *100)
/ Σ Category sales of stores in the geography
A store will be counted as having sold the product or product group if at least one unit was scanned within the selected time period.
Common Use(s) • To understand the distribution of a product or
group of products. • This measure is a useful alternative to ACV
Weighted distribution for categories that may not sell in all stores in geography (for example liquor categories).

IRI InfoScan Measure Guide Copyright Information Resources, Inc. 2006 June, 2006
- 31 -
Usage Notes • The sales of all of the items in the product hierarchy are considered to be the ‘category sales.’ If a client’s product hierarchy contains more than one category, it will take the sum of the sales of the items in all categories in the product hierarchy.
• Unlike ACV Weighted Distribution, only stores where the category is selling will be included in Category Weighted Distribution.
• When creating geography custom aggregates, this measure is weighted by ACV ($MM)
• In general, this measure is most useful for evaluating distribution for periods smaller than 13 weeks.
Additivity Non-additive across all dimensions Aggregation Rules Geography Average Weighted By:
ACV($MM) Product Largest Time Largest Related Measures Average Category Weighted Distribution

IRI InfoScan Measure Guide Copyright Information Resources, Inc. 2006 June, 2006
- 32 -
Measure Group % CWD Selling Measure Type Derived Definition These measures report distribution on merchandising
within the stores selling the product. These measures weight distribution by TOTAL Category Sales. Category sales will represent the hierarchy when more than one category is present.
Calculation (Σ Category Sales of stores selling the product on
merchandising) /
(Σ Category Sales of stores selling the product) Common Use(s) • To compare relative levels of merchandising
across brands or products of varying distribution. • To understand the types of promotional support
a product receives, irrespective of effectiveness. Usage Notes • These measures differ from % CWD measures
because % CWD Selling expresses the CWD of the stores selling the product on merchandising as a percentage of the CWD of the stores selling the product, while % CWD measures express the CWD of stores selling the product on merchandising as a percentage of the total CWD of the geography.
• These measures are not additive across merchandising conditions. For example, summing % CWD Selling, Feature Only, % CWD Selling, Feature and Display, % CWD Selling Display Only, and % CWD Selling Price Reduction Only does not equal % CWD Selling, Any Merchandising.
• The sales of all of the items in the product hierarchy are considered to be the ‘category sales.’ If a client’s product hierarchy contains more than one category, it will take the sum of the sales of the items in all categories in the product hierarchy.

IRI InfoScan Measure Guide Copyright Information Resources, Inc. 2006 June, 2006
- 33 -
Additivity Non-additive across all dimensions Aggregation Rules Derived measures inherit the aggregation rules of
their component stored measures. Related Measures % CWD

IRI InfoScan Measure Guide Copyright Information Resources, Inc. 2006 June, 2006
- 34 -
Measure Group % Increase in Sales (Algorithm 037) Measure Type Stored Definition These measures express the percentage by which
sales increase in a week during which a specified merchandising condition occurs.
Calculation These measures are calculated as follows:
Let: A(p) = Actual Sales during promotion condition p. B(p) = Base Sales during promotion condition p. WAE = Week-after effect, if applicable.
[A(p) + WAE - B(p)] * 100 B(p)
WAE or "week-after effect" captures any incremental sales that occurs in the week following a feature or display if there was no promotion in that week. The week-after effect was designed to capture any spill-over incremental resulting from potential misalignment between a retailer’s movement week and their promotional week.
Common Use(s) • To determine what types of merchandising are
most effective. • To measure the response to the same types of
merchandising across different products and time periods.
Usage Notes • Do not derive these measures. Due to IRI’s
handling of the week-after effect, it is not possible to accurately calculate these measures using other delivered measures.
• % Increase in Dollars can be negative. • These measures are not additive across
merchandising conditions. For example, summing % Increase, Feature Only, % Increase,
IRI InfoScan Measure Guide Copyright Information Resources, Inc. 2006 June, 2006
- 35 -
Feature and Display, % Increase Display Only, and % Increase Price Reduction Only does not equal % Increase, Any Merchandising.
Additivity Non-additive across all dimensions Aggregation Rules Geography Average Weighted by: Base
Decomposed Sales Product Average Weighted by: Base
Decomposed Sales Time Average Weighted by: Base
Decomposed Sales Related Measures % Increase in Sales @ Size
IRI InfoScan Measure Guide Copyright Information Resources, Inc. 2006 June, 2006
- 36 -
Measure Group % Increase in Sales @ Size (Algorithm 107) Measure Type Stored Definition % Increase in Sales @ Size are used in place of %
Increase in Sales for all Special Pack categories. These measures express the percentage by which sales increase in a week during which a specified merchandising condition occurs. These measures are reported for both volume and dollars.
Calculation These measures are calculated as follows:
Let: A(p) = Actual Sales during promotion condition p. B(p) = Base Sales during promotion condition p. WAE = Week-after effect, if applicable.
A(p) + WAE - B(p) * 100
B(p)
WAE or "week-after effect" captures any incremental sales that occurs in the week following a feature or display if there was no promotion in that week. The week-after effect was designed to capture any spill-over incremental resulting from potential misalignment between a retailer’s movement week and their promotional week.
Common Use(s) • To determine what types of merchandising are
most effective. • To measure the response to the same types of
merchandising across different products and time periods.

IRI InfoScan Measure Guide Copyright Information Resources, Inc. 2006 June, 2006
- 37 -
Usage Notes • Do not use these measures for products below the Special Pack baselining level.
• Do not derive these measures. Due to IRI’s handling of the week-after effect, it is not possible to accurately calculate these measures using other delivered measures.
• % Increase in Units measures are not available in Special Pack databases.
• These measures are not additive across merchandising conditions. For example, summing % Increase @ Size, Feature Only, % Increase @ Size, Feature and Display, % Increase @ Size Display Only, % Increase @ Size, Special Pack Only and % Increase @ Size Price Reduction Only, No Special Pack does not equal % Increase @ Size, Any Merchandising and/or Special Pack.
Additivity Non-additive across all dimensions Aggregation Rules Geography Average Weighted by: Base
Decomposed Sales Product Average Weighted by: Base
Decomposed Sales Time Average Weighted by: Base
Decomposed Sales Related Measures % Increase in Sales

IRI InfoScan Measure Guide Copyright Information Resources, Inc. 2006 June, 2006
- 38 -
Measure Group % Incremental Decomposed Sales Measure Type Derived Definition These measures report a product’s Incremental Sales
on a particular merchandising condition expressed as a percentage of the product’s total Incremental Sales .
Calculation Incremental Sales on merchandising condition * 100
Incremental Sales Common Use(s) To determine what percentage of total Incremental
Sales was contributed to by Incremental Sales with a particular merchandising condition.
Usage Notes Additivity Non-additive across all dimensions. Aggregation Rules Derived measures inherit the aggregation rules of
their component stored measures. Related Measures • % of Sales
• % Base Decomposed Sales • % Incremental Decomposed Sales @ Size
IRI InfoScan Measure Guide Copyright Information Resources, Inc. 2006 June, 2006
- 39 -
Measure Group % Incremental Decomposed Sales @ Size Measure Type Derived Definition % Incremental Decomposed Sales @ Size (Volume
and Dollars) are used in place of % Incremental Decomposed Sales for all Special Pack categories. These measures report a product’s Incremental Sales @ Size on a particular merchandising condition expressed as a percentage of the product’s total Incremental Sales @ Size.
Calculation Incremental Sales @ Size on merchandising condition * 100
Incremental Sales @ Size Common Use To determine what percentage of total Incremental
Sales was contributed to by Incremental Sales with a particular merchandising condition.
Usage Notes Additivity Non-additive across all dimensions. Aggregation Rules Derived measures inherit the aggregation rules of
their component stored measures. Related Measures • % of Sales
• % Base Decomposed Sales @ Size • % Incremental Decomposed Sales

IRI InfoScan Measure Guide Copyright Information Resources, Inc. 2006 June, 2006
- 40 -
Measure Group % Incremental Sales to Total Sales (Algorithm 060) Measure Type Derived Definition These measures express Incremental Sales as a
percentage of total Sales. Calculation Incremental Sales * 100
Sales Common Use(s) • To determine what portion of total Sales were
driven by merchandising. • To compare the importance of Incremental Sales
across products and geographies. Usage Notes % Incremental Dollars may be negative. Additivity Non-additive across all dimensions Aggregation Rules Derived measures inherit the aggregation rules of
their component stored measures. Related Measures • % of Base Sales to Total Sales
• % of Base Decomposed Sales to Total Sales • % of Incremental Sales @ Size to Total Sales

IRI InfoScan Measure Guide Copyright Information Resources, Inc. 2006 June, 2006
- 41 -
Measure Group % Incremental Sales @ Size to Total Sales (Algorithm
061) Measure Type Derived Definition % Incremental Sales @ Size to total Sales is used in
place of % of Incremental Sales to total Sales for all Special Pack categories. These measures express Incremental Sales @ Size as a percentage of total Sales. %
Calculation Incremental Sales @ Size * 100
Sales Common Use(s) • To determine what proportion of total Sales were
driven by merchandising. • To compare the importance of Incremental Sales
across products and geographies. Usage Notes • Do not use these measures for products below
the Special Pack baselining level. • % Incremental Units @ Size is not available for
Special Pack Categories. • % Incremental Dollars @ Size may be negative.
Additivity Non-additive across all dimensions Aggregation Rules Derived measures inherit the aggregation rules of
their component stored measures. Related Measures • % of Base Sales @ Size to Total Sales
• % of Incremental Sales to Total Sales

IRI InfoScan Measure Guide Copyright Information Resources, Inc. 2006 June, 2006
- 42 -
Measure Group % of Sales (Algorithm 012) Measure Type Derived* Definition These measures report a product’s sales sold in
stores with a particular merchandising condition expressed as a percentage of total Sales.
Calculation Sales on merchandising condition *100
Sales Common Use(s) • To compare relative levels of merchandising
across products, geographies, or time periods. • To understand the types of promotional support
a product receives, regardless of effectiveness. • To indicate brand reliance on merchandising. • To understand the importance of different
promotion types to product sales. Usage Notes Additivity Non-additive across all dimensions Aggregation Rules Derived measures inherit the aggregation rules of
their component stored measures. Related Measures • % Promoted Sales
• % Base Sales • % Incremental Sales
* The following two measures are stored due to availability of merchandising conditions: % of Sales, Minor Display Only and % of Sales, Major Display Only.
IRI InfoScan Measure Guide Copyright Information Resources, Inc. 2006 June, 2006
- 43 -
Measure Group % of Stores (Algorithm 021) Measure Type Stored Definition These measures report a product’s distribution or
distribution on promotion. These measures do not weight distribution by the size of the store.
Calculation % of Stores (with no merchandising condition):
Σ Projection Weights of Stores Selling the product * 100 Σ Projection Weights of all Stores in the Geography % of Stores on merchandising condition: Σ Projection Weights of Stores Selling the product with merchandising* 100 Σ Projection Weights of all Stores in the Geography A store will be counted as having sold the product or product group if at least one unit was scanned within the selected time period.
Common Use(s) • These measures track the distribution of a
product or group of products in terms of the number of stores in which it was selling.
• When used in conjunction with % ACV, to understand whether a product is selling in larger or smaller stores. If % Stores Selling is greater than % ACV, the product tended to sell in stores that are smaller than average. If % Stores Selling is less than % ACV, the product tended to sell in stores that are larger than average.
• These measures can be used to understand promotional reach in terms of the number of stores in which the promotion was present.
Usage Notes • Unlike % of ACV measures, these measures do not
take into account store size. • These measures are most useful with time periods
of 13 weeks or less. • These measures are not additive across
merchandising conditions. For example, summing % of Stores, Feature Only, % of Stores,

IRI InfoScan Measure Guide Copyright Information Resources, Inc. 2006 June, 2006
- 44 -
Feature and Display, % of Stores Display Only, and % of Stores Price Reduction Only does not equal % of Stores, Any Merchandising.
Additivity Non-additive across all dimensions Aggregation Rules Geography Average Weighted by: ACV Product Largest Time Largest Related Measures • % of ACV
• % of Stores Selling

IRI InfoScan Measure Guide Copyright Information Resources, Inc. 2006 June, 2006
- 45 -
Measure Group % of Stores Selling (Algorithm 066) Measure Type Derived Definition These measures report distribution on merchandising
within the stores selling the product. These measures are not weighted by store size.
Calculation
Σ Projection Weights of Stores selling the product with merchandising* 100 Σ Projection Weights of all Stores selling the product A store will be counted as having sold the product or product group if at least one unit was scanned within the selected time period.
Common Use(s) To compare the promotional reach of brands or
products of varying distribution without regard to the size of the stores in which the promotions occurred.
Usage Notes • These measures differ from % of Stores because
% of Stores Selling is based on all stores in the geography that sold the product, while % of Stores is based on all stores regardless of whether they sold the product.
• These measures are most useful with time periods of 13 weeks or less.
• These measures are not additive across merchandising conditions. For example, adding % Stores Selling, Feature Only and % Stores Selling Feature and Display does not produce % Stores Selling, Any Feature.
Additivity Non-additive across all dimensions Aggregation Rules Derived measures inherit the aggregation rules of
their component stored measures. Related Measures • % of Stores
• % of ACV Selling
IRI InfoScan Measure Guide Copyright Information Resources, Inc. 2006 June, 2006
- 46 -
Measure Group % Promoted Sales (Merchandising Mix) Measure Type Derived Definition These measures report Sales with a specific
merchandising condition as a percent of total merchandized sales.
Calculation Sales on merchandising condition * 100
Sales, Any Merchandising Common Use(s) To determine the importance of a particular
merchandising event to total merchandized sales. Usage Notes Additivity Non-additive across all dimensions. Aggregation Rules Derived measures inherit the aggregation rules of
their component stored measures. Related Measures • % of Sales
• % Base Sales • % Incremental Sales
IRI InfoScan Measure Guide Copyright Information Resources, Inc. 2006 June, 2006
- 47 -
Measure Group % Promoted Sales, Incremental (Trade Efficiency) Measure Type Derived Definition These measures report Incremental Sales as a
percent of total merchandized sales. Calculation Incremental Sales * 100
Sales, Any Merchandising Common Use(s) To evaluate the effectiveness of merchandising by
determining what amount of Sales that sold on Merchandising was Incremental.
Usage Notes • IRI’s standard, recommended measure for
evaluating promotional effectiveness is % Increase.
• Incremental Sales includes the week-after effect while Sales, Any Merchandising does not. As a result, this measure could report a value greater than 100%. For this reason, caution should be used when delivering this measure.
Additivity Non-additive across all dimensions. Aggregation Rules Derived measures inherit the aggregation rules of
their component stored measures. Related Measures • % Incremental Sales to Total Sales
• % Promoted Sales, Incremental (SP)

IRI InfoScan Measure Guide Copyright Information Resources, Inc. 2006 June, 2006
- 48 -
Measure Group % Promoted Sales, Incremental (SP) (Trade
Efficiency) Measure Type Derived Definition % Promoted Sales, Incremental (SP) is used in place
of % Promoted Sales, Incremental for all Special Pack categories. These measures report Incremental Sales @ Size as a percent of merchandized sales.
Calculation Incremental Sales @ Size * 100
Sales, Any Merchandising Common Use(s) To evaluate the effectiveness of merchandising by
determining what amount of Sales that sold on Merchandising were Incremental.
Usage Notes • Do not use this measure for products below the
special pack baselining level. • IRI’s standard, recommended measure for
evaluating promotional effectiveness in special pack categories is % Increase @ Size.
• Incremental Sales @ Size includes the week-after effect while Sales, Any Merchandising does not. As a result, this measure could report a value greater than 100%. For this reason, caution should be used when delivering this measure.
Additivity Non-additive across all dimensions. Aggregation Rules Derived measures inherit the aggregation rules of
their component stored measures. Related Measures % Incremental Sales @ Size to Total Sales
% Promoted Sales, Incremental

IRI InfoScan Measure Guide Copyright Information Resources, Inc. 2006 June, 2006
- 49 -
Measure Group % Weekly ACV (Algorithm 088) Measure Type Stored Definition These measures are an average of the single week
ACV Weighted Distributions with merchandising across all weeks in the period.
Calculation Σ % ACV with merchandising across all weeks in period
Number of weeks in the time period Common Use(s) • These measures track the average weekly ACV
weighted distribution of a product or group of products on merchandising.
• % Weekly ACV measures may be preferable to % ACV measures when evaluating distribution for time periods longer than 13 weeks.
Usage Notes • These measures are averaged across all weeks in
the period. • These measures are only offered with promotion
conditions. • These measures are not additive across
merchandising conditions. For example, adding % Weekly ACV, Feature Only and % Weekly ACV Feature and Display does not produce % Weekly ACV, Any Feature.
Additivity Non-additive across all dimensions Aggregation Rules Geography Average Weighted by: ACV Product Largest Time Average Weighted by: ACV Related Measures • Average weekly % of ACV
• Average period % of ACV • % ACV

IRI InfoScan Measure Guide Copyright Information Resources, Inc. 2006 June, 2006
- 50 -
Measure Group ACV ($MM) (Algorithm 997) Measure Type Stored Definition ACV, or All Commodity Volume, represents the total
annual dollar sales of the selected geography in million dollars ($MM). The total dollar sales that go into ACV include the entire store inventory, rather than sales for a specific category of products.
Calculation This measure is the sum of annualized ACV across all
stores in the selected geography. Common Use(s) This measure is used to compare relative geography
size. Usage Notes • Our retail agreements do not allow us to release
actual chain level ACV information. Therefore when reporting retailer ACV for key accounts and RMAs, we report the midpoint of a predetermined range as the ACV. For example, if we have a predetermined ACV range of 0-25,000 and a retailer who’s actual ACV is 18,000, we report the ACV as 12,500 for that retailer.
• This measure will report the same values at all levels in the product hierarchy.
• Because this is an annualized number, it will always represent ACV for a 52-week period, regardless of number of weeks in the selected period.
• For Total US, Regions, Markets, and CRMAs this measure is updated every four weeks. Therefore, it will report the same value four weeks in a row until its next update.
• Because we report mid-point ACV information for key accounts and RMAs, for these geographies, the value for this measure will only change if the retailer’s ACV moves into a new range.
• For weekly databases this measure will display

IRI InfoScan Measure Guide Copyright Information Resources, Inc. 2006 June, 2006
- 51 -
NA until the ACV is updated for the 4th week of the period.
Additivity This measure is additive across geographies. Aggregation Rules Geography Total Product NA Time Largest Related Measures • Population
• Households

IRI InfoScan Measure Guide Copyright Information Resources, Inc. 2006 June, 2006
- 52 -
Measure Group Added Dollars if 100% Distribution (Opportunity Dollars)
Measure Type Derived Definition This measure estimates the additional Dollar sales that
a product would have if it had 100% distribution. Calculation ((Dollar Sales ÷ ACV Weighted Distribution) * 100) - Dollar Sales
Common Use(s) To evaluate the potential gain in dollars that may
result from increasing distribution to 100%. Usage Notes This measure assumes that the product would sell at
the same rate in stores where it is not distributed as it sells in stores where it is distributed.
Additivity Non-additive across all dimensions. Aggregation Rules Derived measures inherit the aggregation rules of
their component stored measures. Related Measures Sales per point of Distribution
IRI InfoScan Measure Guide Copyright Information Resources, Inc. 2006 June, 2006
- 53 -
Measure Group Additive Cumulative Weighted Weeks (Algorithm
040) Measure Type Stored Definition These measures report the reach and frequency of
promotions. They report the number of weeks with a given merchandising condition weighted by the ACV of the stores participating in the promotion.
Calculation For a single week, these measures are calculated as
follows: Σ ACV of stores selling the product on merchandising Σ ACV of stores in the geography These measures are summed across weeks to obtain values for multi-week time periods.
Common Use(s) • To assess the reach and frequency of a given
merchandising condition. • To compare the reach and frequency of a given
merchandising condition across products, geographies, and time periods.
Usage Notes • For a single week, these measures will be equal
to: (% ACV on merchandising condition) ÷100 • These measures are not designed to provide
insight into how distribution may vary over time. • These measures are not additive across
merchandising conditions. For example, summing Additive Cumulative Weighted Weeks, Feature Only; Additive Cumulative Weighted Weeks, Feature and Display; Additive Cumulative Weighted Weeks Display Only; and Additive Cumulative Weighted Weeks Price Reduction Only does not equal Additive Cumulative Weighted Weeks, Any Merchandising.
• These measures can report values greater than 1 for a single week if the cume-week parameter in

IRI InfoScan Measure Guide Copyright Information Resources, Inc. 2006 June, 2006
- 54 -
COES is set to a value greater than 1. Additivity Additive across time. Aggregation Rules Geography Average Weighted by:
ACV Product Largest Time Total Related Measures • % ACV
• Additive Weighted Weeks

IRI InfoScan Measure Guide Copyright Information Resources, Inc. 2006 June, 2006
- 55 -
Measure Group Additive Cumulative Weighted Weeks CWD
(Algorithm 40) Measure Type Stored Definition These measures report the reach and frequency of
promotions. They report the number of weeks with a given merchandising condition weighted by the stub sales of the stores participating in the promotion.
Calculation For a single week, these measures are calculated as
follows:
(Category sales of stores selling the product on merchandising *100)
/ Category sales of stores in the geography
These measures are summed across weeks to obtain values for multi-week time periods.
Common Use(s) • To assess the reach and frequency of a given
merchandising condition. • To compare the reach and frequency of a given
merchandising condition across products, geographies, and time periods.
Usage Notes • The sales of all of the items in the product
hierarchy are considered to be the ‘category sales.’ If a client’s product hierarchy contains more than one category, it will take the sum of the sales of the items in all categories in the product hierarchy.
• For a single week, these measures will be equal to: (% CWD on merchandising condition) * 100.
• These measures are not designed to provide insight into how distribution may vary over time.
• These measures are not additive across merchandising conditions. For example, summing Additive Cumulative Weighted Weeks, Feature Only; Additive Cumulative Weighted

IRI InfoScan Measure Guide Copyright Information Resources, Inc. 2006 June, 2006
- 56 -
Weeks, Feature and Display; Additive Cumulative Weighted Weeks Display Only; and Additive Cumulative Weighted Weeks Price Reduction Only does not equal Additive Cumulative Weighted Weeks, Any Merchandising.
• These measures can report values greater than 1 for a single week if the cume-week parameter in COES is set to a value greater than 1.
Additivity Additive across time. Aggregation Rules Geography Average Weighted By: ACV Product Largest Time Total Related Measures • % CWD
• Additive Weighted Weeks CWD

IRI InfoScan Measure Guide Copyright Information Resources, Inc. 2006 June, 2006
- 57 -
Measure Group Additive Weighted Weeks (Algorithm 087) Measure Type Stored Definition These measures report the reach and duration of
various merchandising conditions, while also taking into account the number of products on promotion. These measures are similar to Percent ACV with causal condition except these measures are additive across time and up the product hierarchy starting at the level specified by the client.
Calculation Up to the additivity level, for a single week, these
measures are calculated as follows: Σ ACV of stores selling the product on merchandising Σ ACV of stores in the geography These measures are summed across weeks to obtain values for multi-week time periods. Above the additivity level these measures are summed up the product hierarchy.
Common Use(s) To evaluate the depth and frequency of
merchandising events across time. Usage Notes • The client needs to specify the level of the
product hierarchy where these measures become additive. In general it is recommended that it be set at the level at which items are priced and promoted together.
• The additivity level cannot be set at the UPC level.
• The additivity level cannot be set at the category level.
• These measures should not be used below the additivity level.
• Do not use these measures with product custom aggregates containing members below the

IRI InfoScan Measure Guide Copyright Information Resources, Inc. 2006 June, 2006
- 58 -
additivity level. For example, if the additivity level is Brand, you should not use these measures with custom aggregates built from the UPC level.
Additivity Additive across time and up the product hierarchy
starting at the additivity level. Aggregation Rules Geography Average Weighted by:
ACV Product Total Time Total Related Measures • % ACV
• Additive Cumulative Weighted Weeks • Base Weighted Weeks

IRI InfoScan Measure Guide Copyright Information Resources, Inc. 2006 June, 2006
- 59 -
Measure Group Additive Weighted Weeks CWD (Algorithm 087) Measure Type Stored Definition • These measures report the reach and duration of
various merchandising conditions, while also taking into account the number of products on promotion.
• These measures are similar to Percent CWD with causal condition except these measures are additive across time and up the product hierarchy starting at the level specified by the client.
Calculation Up to the additivity level, for a single week, these measures are calculated as follows:
(Σ Category sales of stores selling the product on
merchandising) /
(Σ Category sales of stores in the geography) These measures are summed across weeks to obtain values for multi-week time periods. Above the additivity level these measures are summed up the product hierarchy.
Common Use(s) To evaluate the depth and frequency of
merchandising events across time. Usage Notes • The client needs to specify the level of the
product hierarchy where these measures become additive. In general it is recommended that it be set at the level at which items are priced and promoted together.
• The additivity level cannot be set at the UPC level.
• The additivity level cannot be set at the category level.
• These measures should not be used below the

IRI InfoScan Measure Guide Copyright Information Resources, Inc. 2006 June, 2006
- 60 -
additivity level. • Do not use these measures with product custom
aggregates containing members below the additivity level. For example, if the additivity level is Brand, you should not use these measures with custom aggregates built from the UPC level.
• The sales of all of the items in the product hierarchy are considered to be the ‘category sales.’ If a client’s product hierarchy contains more than one category, it will take the sum of the sales of the items in all categories in the product hierarchy.
Additivity Additive across time and up the product hierarchy
starting at the additivity level. Aggregation Rules Geography Average Weighted By: ACV Product Total Time Total Related Measures • % CWD
• Additive Cumulative Weighted Weeks

IRI InfoScan Measure Guide Copyright Information Resources, Inc. 2006 June, 2006
- 61 -
Measure Group Average % Price Reduction with Coupon (Algorithm
102) Measure Type Stored Definition These measures report the average price reduction
from base price in stores that had a Coupon Feature. Calculation These measures are calculated as follows:
Let: $MD = Markdown Dollars. $AD = Actual Dollar Sales during promotion. Weighted Average Percent Price Reduction equals:
$AD*100 100 - (-------------------) $AD + $MD This can also be expressed as:
$MD*100 ------------------- $AD + $MD Where Markdown Dollars is calculated at the store level for all stores in which there is at least a 5% price reduction as follows:
(Base Price – Actual Price) * Units Common Use(s) To estimate the depth of price reduction for a
product in stores where a coupon was present. Usage Notes • This measure reports on the average % Price
Reduction in stores that had the coupon present, regardless of the extent to which the coupon was actually redeemed.
• This measure captures retailer coupons (i.e.

IRI InfoScan Measure Guide Copyright Information Resources, Inc. 2006 June, 2006
- 62 -
coupons that are included in retailer features), not manufacturer coupons.
Additivity Non-additive across all dimensions Aggregation Rules Geography NA Product NA Time NA Related Measures • Weighted Average % Price Reduction
• Weighted Average % Price Cut

IRI InfoScan Measure Guide Copyright Information Resources, Inc. 2006 June, 2006
- 63 -
Measure Group Average Category Weighted Distribution (Algorithm
030) Measure Type Derived Definition This measure is an average of the Category
Weighted Distributions across all weeks in a time period in which the product was distributed.
Calculation Σ % CWD for a product across all weeks in a time period
Number of weeks the product was in distribution Common Use(s) This measure is used to track the average weekly
Category Weighted Distribution of a product or group of products.
Usage Notes • For single week periods, this measure returns the
same value as %CWD. • Weeks in which there was no distribution of the
product are excluded from this calculation. • This measure is also known as Average Weekly
CWD Weighted Distribution. Additivity Non-additive across all dimensions. Aggregation Rules Derived measures inherit the aggregation rules of
their component stored measures. Related Measures %CWD
IRI InfoScan Measure Guide Copyright Information Resources, Inc. 2006 June, 2006
- 64 -
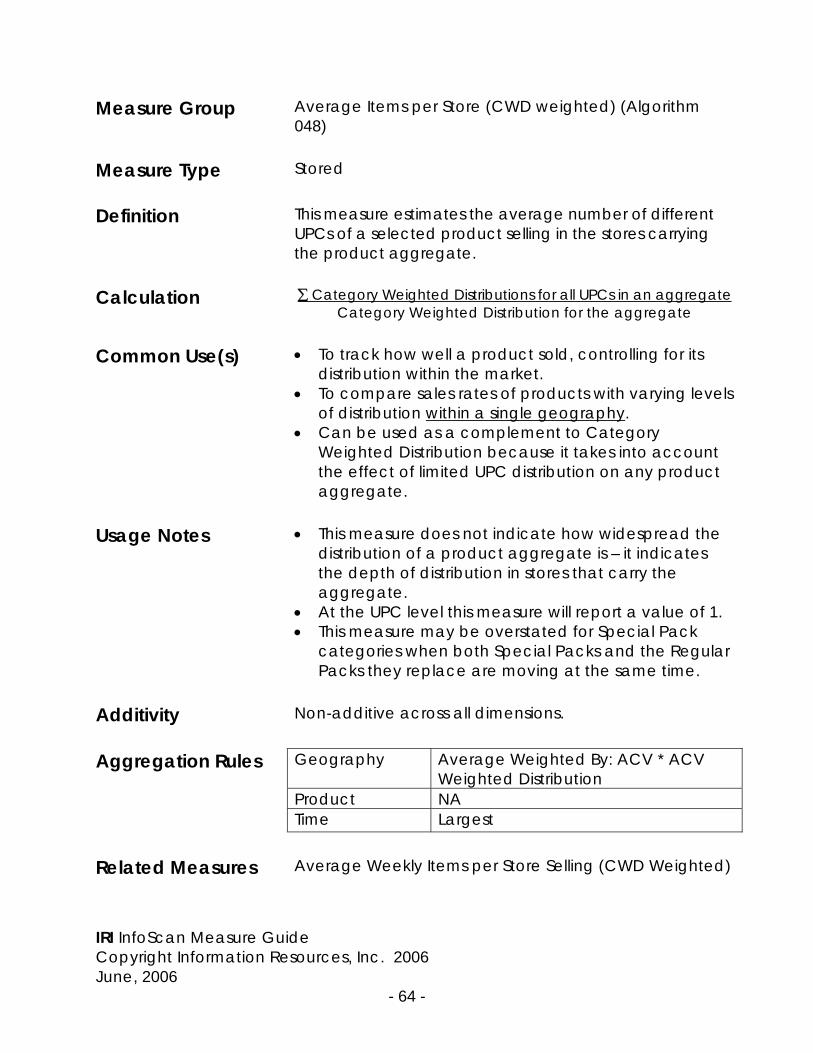
Measure Group Average Items per Store (CWD weighted) (Algorithm
048) Measure Type Stored Definition This measure estimates the average number of different
UPCs of a selected product selling in the stores carrying the product aggregate.
Calculation ∑ Category Weighted Distributions for all UPCs in an aggregate
Category Weighted Distribution for the aggregate Common Use(s) • To track how well a product sold, controlling for its
distribution within the market. • To compare sales rates of products with varying levels
of distribution within a single geography. • Can be used as a complement to Category
Weighted Distribution because it takes into account the effect of limited UPC distribution on any product aggregate.
Usage Notes • This measure does not indicate how widespread the
distribution of a product aggregate is – it indicates the depth of distribution in stores that carry the aggregate.
• At the UPC level this measure will report a value of 1. • This measure may be overstated for Special Pack
categories when both Special Packs and the Regular Packs they replace are moving at the same time.
Additivity Non-additive across all dimensions. Aggregation Rules Geography Average Weighted By: ACV * ACV
Weighted Distribution Product NA Time Largest Related Measures Average Weekly Items per Store Selling (CWD Weighted)

IRI InfoScan Measure Guide Copyright Information Resources, Inc. 2006 June, 2006
- 65 -
Measure Group Average Items per Store Selling (Algorithm 048) Measure Type Stored Definition This measure estimates the average number of
different UPCs of a selected product selling in the stores carrying the product aggregate.
Calculation ∑ ACV Weighted Distribution for all UPCs in an aggregate
ACV Weighted Distribution for the aggregate Common Use(s) • To compare how many different UPCs sold within
one product aggregate versus another. • To compare the depth of distribution across
products, geographies, and time periods. • Can be used as a complement to ACV
Weighted Distribution because it takes into account the effect of limited UPC distribution on any product aggregate.
Usage Notes • These measures are most useful with time periods
of 13 weeks or less. For longer time periods, use Average Weekly Items per Store Selling.
• This measure does not indicate how widespread distribution of a product aggregate is – it indicates the depth of distribution in stores that carry it.
• Average Items per Store may be overstated for Special Pack categories when both Special Packs and the Regular Packs they replace are moving at the same time.
• At the UPC level this measure will report a value of 1.
Additivity Non-additive across all dimensions. Aggregation Rules Geography Average Weighted by:
ACV * %ACV Weighted Distribution
Product Non-additive Time Largest
IRI InfoScan Measure Guide Copyright Information Resources, Inc. 2006 June, 2006
- 66 -
Related Measures Average Weekly Items per Store Selling

IRI InfoScan Measure Guide Copyright Information Resources, Inc. 2006 June, 2006
- 67 -
Measure Group Average Manufacturer Coupon Value (551) Measure Type Stored Definition This measure estimates the average face value of
manufacturer coupons weighted by the circulation of the publications in which the coupon was distributed.
Calculation (Coupon value in publication 1 * Circulation of publication 1 +
Coupon value in publication 2 * Circulation of publication 2 + Coupon value in publication 3 * Circulation of publication 3)
(Circulation of publication 1 + Circulation of publication 2 + Circulation of publication 3)
Common Use(s) To track the average value of tracked
manufacturer coupons dropped in a market. Usage Notes • This measure weights the coupon value by the
publication’s circulation, not by actual coupons redeemed or by unit sales with coupon.
• This measure tracks manufacturer, not retailer, coupons.
• Not all manufacturer coupons are tracked in InfoScan.
Additivity Non-additive across all dimensions Aggregation Rules Geography Average Weighted by: Coupon
Circulation Product Average Weighted by: Coupon
Circulation Time Average Weighted by: Coupon
Circulation Related Measures Average Store Coupon Value

IRI InfoScan Measure Guide Copyright Information Resources, Inc. 2006 June, 2006
- 68 -
Measure Group Average Number of Levels Measure Type Stored Definition This measure estimates the average number
of product aggregates at a certain user-specified level that are selling in the stores carrying the product aggregate.
Calculation ∑ ACV Weighted Distribution of all
aggregates at the specified level ACV Weighted Distribution of the aggregate
Common Use(s) • To compare how many different levels sold
within one product aggregate versus another. • To compare the depth of distribution across
products, geographies, and time periods. • This measure is especially useful for Special Pack
clients. It is similar to Average Number of Items, but it reports how many sizes (or brands, or forms) are moving without letting the number of UPCs that are moving influence the measure.
Usage Notes • These measures are most useful with time periods
of 13 weeks or less. • This measure does not indicate how widespread
distribution of a product aggregate is – it indicates the depth of distribution in stores that carry it.
• This measure should only be used for Special Pack categories.
• The client should set the additivity level of this measure at the Special Pack baselining level.
• This measure cannot be used at or below the additivity level.
• This measure can be used for secondary totals made up of levels above the additivity level, but cannot be used for secondary totals whose members are levels at or below the additivity level.

IRI InfoScan Measure Guide Copyright Information Resources, Inc. 2006 June, 2006
- 69 -
Additivity Non-additive across all dimensions. Aggregation Rules Geography Average Weighted by:
ACV * %ACV Weighted Distribution
Product Non-additive Time Largest Related Measures Average Items per store selling

IRI InfoScan Measure Guide Copyright Information Resources, Inc. 2006 June, 2006
- 70 -
Measure Group Average Period ACV Weighted Distribution (Algorithm 009)
Measure Type Stored Definition This measure is an average of the quads of the ACV
Weighted Distributions across all weeks in which there was distribution of the product.
[(% ACV of quad 1 * # of wks in quad1) + (% ACV of quad 2 * # of wks in quad2) + (% ACV of quad 3 * # of wks in quad 3)]
Calculation
Total number of weeks in the time period Common Use(s) • To understand the quad-weekly average ACV
weighted distribution of a product or group of products.
• For most purposes, Average Weekly % ACV is the preferred measure for understanding average distribution.
Usage Notes • This measure is most appropriate for 12 or 13 week
periods. • For time single weeks and quads, this measure
reports the same value as % ACV. • This measure cannot be delivered for databases
delivering 13 week periods on a 4-4-4 schedule. Additivity Non-additive across all dimensions Aggregation Rules Geography Average Weighted by: ACV Product Largest Time Average Weighted by: ACV Related Measures • % ACV
• Average Weekly % ACV

IRI InfoScan Measure Guide Copyright Information Resources, Inc. 2006 June, 2006
- 71 -
Measure Group Average Price (Algorithm 018) Measure Type Derived Definition These measures report the average product unit or
volume price in stores. Calculation Average Price without Merchandising:
Dollar Sales
Unit or Volume Sales
Average Price on Merchandising Condition:
Dollar Sales with Merchandising Condition Unit or Volume Sales with Merchandising Condition
Common Use(s) To track average product price and average
promoted price. Usage Notes • These measures report an average scanned
price, not the shelf price. • Price reflects all FSP discounts for participating
FSP retailers and featured FSP discounts for non-participating retailers.
• The average price is weighted by Sales, it is not simply a straight average across stores and weeks.
• The price reported at upper levels of the product hierarchy becomes an average price of products of different sizes, brands, and flavors.
• Average Price per Unit should not be used above the size level in the product hierarchy.
Additivity Non-additive across all dimensions Aggregation Rules Derived measures inherit the aggregation rules of
their component stored measures. Related Measures Weighted Average Base Price
Weighted Average % Price Reduction

IRI InfoScan Measure Guide Copyright Information Resources, Inc. 2006 June, 2006
- 72 -
Measure Group Average Sales per Store Selling (Algorithm 005) Measure Type Stored Definition These measures are calculated as Sales (unit,
volume, or dollars) divided by the projected number of stores selling at least one unit of the product during the period(s).
Calculation Sales (Unit, Volume, Dollar)
Number of projected stores selling the product Common Use(s) • To track how well a product sold, controlling for
its distribution within the market when the size of the stores in which the item is distributed is not relevant.
• To compare sales rates of products with varying levels of distribution or across time when the size of the stores in which the item is distributed is not relevant.
Usage Notes These measures are similar to Sales per $MM ACV
and Sales per Point ACV Weighted Distribution, except that Average Sales per Store Selling is normalized by the number of stores selling the product and therefore do not take into account store size. One can therefore expect products that tend to sell in larger stores to have higher Sales per Stores Selling than items that sell predominately in smaller stores.
Additivity Non-additive across all dimensions Aggregation Rules Geography Average Weighted by: ACV *
ACV Weighted Distribution Product NA Time NA Related Measures • Sales per $MM ACV
• Sales per Point ACV Weighted Distribution

IRI InfoScan Measure Guide Copyright Information Resources, Inc. 2006 June, 2006
- 73 -
Measure Group Average Store Coupon Value (076) Measure Type Stored Definition This measure is an estimate of the average value of
retailer coupons (A+ features). Calculation Coupon value * Unit Sales in stores where coupon is valid 1 +
Coupon value * Unit Sales in stores where coupon is valid 2 + Coupon value * Unit Sales in stores where coupon is valid 3
Unit Sales in stores where coupon is valid Example Store 1 Store 2
Coupon Value $.10 $.20 Projected Units 10 30 ($.10)*(10) + ($.20)*(30) Ave Store Coupon Val = ------------------------------------ 30 + 10 (1 + 6)/40 = (7/40) = .175 ~ $.18 The value of the coupon in each store, geography or product is weighted by the units sold in each store where the coupon is valid.
Common Use(s) To track the average value of retailer coupons. Usage Notes • This measure represents the value of coupons
that appear in retailer features – it does not include manufacturer coupons distributed through other methods.
• This measure does not take into account coupon redemption.
Additivity Non-additive across all dimensions Aggregation Rules Geography NA Product NA Time NA Related Measures Average Manufacturer Coupon Value

IRI InfoScan Measure Guide Copyright Information Resources, Inc. 2006 June, 2006
- 74 -
Measure Group Average Store Price with Coupon (Algorithm 101) Measure Type Stored Definition These measures report the average product price
per unit in stores where a retailer coupon was present.
Calculation Dollar Sales in Stores where coupon was valid
Unit Sales in Stores where coupon was valid Common Use(s) To track average product price with coupon. Usage Notes • These measures report an average scanned
price of stores where the coupon was valid. • For most retailers, price reflects FSP discounts. • The average price is weighted by sales of stores
where the coupon was valid, it is not simply an average across weeks.
• The price reported at upper levels of the hierarchy becomes an average price of products of different sizes, brands, and flavors.
Additivity Non-additive across all dimensions Aggregation Rules Geography NA Product NA Time NA Related Measures Average Price

IRI InfoScan Measure Guide Copyright Information Resources, Inc. 2006 June, 2006
- 75 -
Measure Group Average Weekly % of ACV (Algorithm 030) Measure Type Stored Definition This measure is an average of the ACV Weighted
Distributions across all weeks in a time period in which the product was distributed.
Calculation Σ % ACV for a product across all weeks in time period
Number of weeks the product was in distribution Common Use(s) • This measure is used to track the average weekly
ACV weighted distribution of a product or group of products.
• Because % ACV Weighted Distribution tends towards 100% for long time periods, this measure is preferable to ACV Weighted Distribution for longer time periods.
Usage Notes • For single week periods, this measure returns the
same value as %ACV. • Weeks in which there was no distribution of the
product are excluded from this calculation. • This measure is also known as Average Weekly
ACV Weighted Distribution. Additivity Non-additive across all dimensions Aggregation Rules Geography Average Weighted by: ACV Product Largest Time Average Weighted by: ACV Related Measures • % ACV
• % Weekly ACV • Average Period ACV

IRI InfoScan Measure Guide Copyright Information Resources, Inc. 2006 June, 2006
- 76 -
Measure Group Average Weekly Base Sales per $MM ACV (Algorithm 023)
Measure Type Stored Definition These measures report the average weekly Base
Sales rate per million dollar annual ACV, weighted by the product’s average weekly distribution.
Calculation These measures can be expressed mathematically
as follows: Let: S(t) = Base Sales per $MM ACV at week t D(t) = ACV Weighted Distribution at week t t = 1,...,n Average Weekly Base Sales per $MM ACV equals:
N ∑ [S(t) * D(t)] t-1 ---------------------------------------
N ∑ D(t) t=1
Common Use(s) • These measures are used to compare Base Sales
rates of products with varying levels of distribution and to compare Base Sales rates across geographies of different sizes and across time periods of varying lengths.
• Average Weekly Base Sales per $MM ACV are preferable to Base Sales per $MM ACV when looking at longer time periods or comparing periods of different lengths.
Usage Notes • Because these measures are weighted by ACV
Weighted Distribution, weeks in which the product was not distributed are effectively eliminated from the calculation.
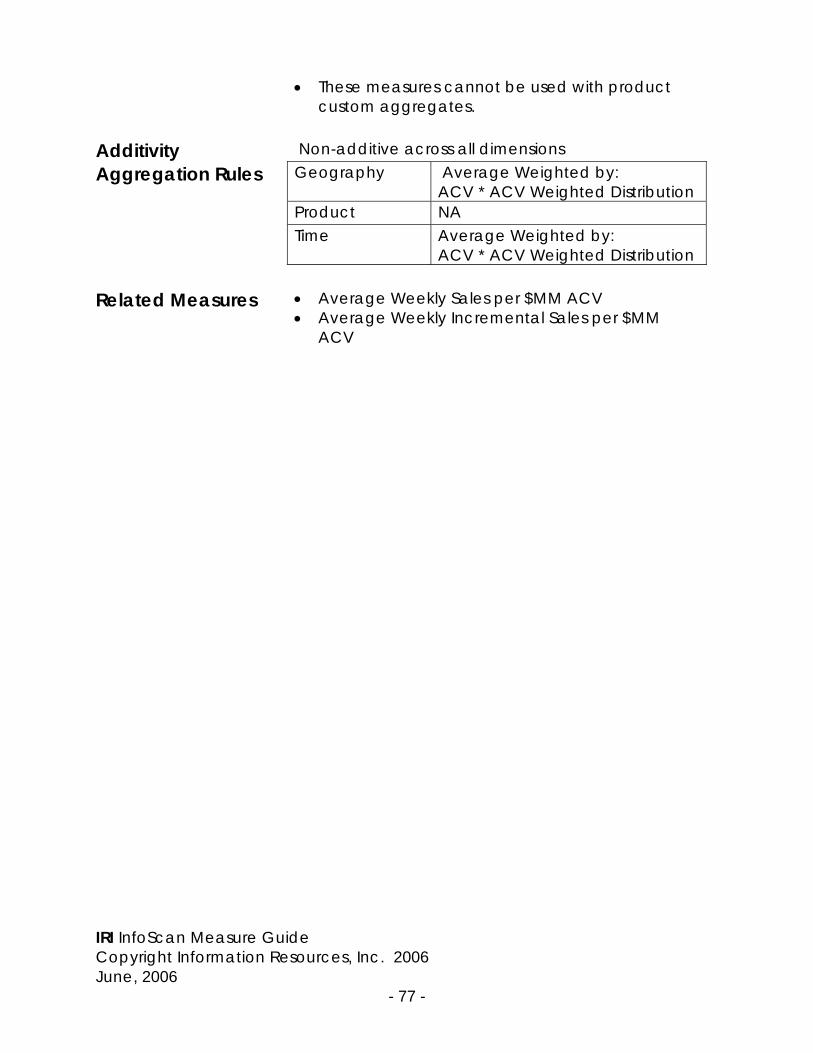
IRI InfoScan Measure Guide Copyright Information Resources, Inc. 2006 June, 2006
- 77 -
• These measures cannot be used with product custom aggregates.
Additivity Non-additive across all dimensions Aggregation Rules Geography Average Weighted by:
ACV * ACV Weighted Distribution Product NA Time Average Weighted by:
ACV * ACV Weighted Distribution Related Measures • Average Weekly Sales per $MM ACV
• Average Weekly Incremental Sales per $MM ACV

IRI InfoScan Measure Guide Copyright Information Resources, Inc. 2006 June, 2006
- 78 -
Measure Group Average Weekly Base Volume (Algorithm A02) Measure Type Derived Definition This measure is a weekly average of Base Volume
across all weeks in a time period. Calculation Base Volume
Number of weeks in the period Common Use(s) To compare Base Volume across time periods of
different lengths. Usage Notes Aggregation Rules Derived measures inherit the aggregation rules of
their component measures. Related Measures • Base Sales
• Base Weighted Weeks

IRI InfoScan Measure Guide Copyright Information Resources, Inc. 2006 June, 2006
- 79 -
Measure Group Average Weekly Category Weighted Distribution
(Algorithm 030) Measure Type Stored Definition This measure is an average of the Category
Weighted Distributions across all weeks in a time period in which the product was distributed.
Calculation Σ Category Weighted Distribution for a product across all
weeks in time period Number of weeks the product was in distribution
Common Use(s) • This measure is used to track the average weekly
Category Weighted Distribution of a product or group of products.
• Because Category Weighted Distribution tends towards 100% for long time periods, this measure is preferable to Category Weighted Distribution for longer time periods.
Usage Notes • For single week periods, this measure returns the
same value as Category Weighted Distribution. • Weeks in which there was no distribution of the
product are excluded from this calculation. Additivity Non-additive across all dimensions Aggregation Rules Geography Average Weighted by: ACV Product Largest Time Average Weighted by: ACV Related Measures • Category Weighted Distribution
• Average Weekly % of ACV

IRI InfoScan Measure Guide Copyright Information Resources, Inc. 2006 June, 2006
- 80 -
Measure Group Average Weekly Incremental Sales per $MM ACV (Algorithm 031)
Measure Type Stored Definition These measures report the average weekly Incremental
Sales per million dollar annual ACV, weighted by the product’s average weekly distribution. They represent the incremental sales efficiency for a product in relation to its distribution.
Calculation These measures are expressed mathematically as
follows: Let: S(t) = Incremental Sales per $MM ACV at week t D(t) = ACV Weighted Distribution at week t t = 1,...,n Average Weekly Incremental Sales per $MM ACV equals:
N ∑ [S(t) * D(t)] t-1 ---------------------------------------
N ∑ D(t) t=1
Common Use(s) • These measures are used to compare Incremental
Sales across products with varying levels of distribution, across geographies of different sizes, or across time periods of different lengths.
• Average weekly measures are preferable to non-weekly measures when looking at longer time periods or comparing periods of different lengths.
Usage Notes • Because these measures are weighted by ACV
Weighted Distribution, weeks in which the product was not distributed are effectively eliminated from the calculation.
• These measures cannot be used with product custom aggregates.
Additivity Non-additive across all dimensions

IRI InfoScan Measure Guide Copyright Information Resources, Inc. 2006 June, 2006
- 81 -
Aggregation Rules Geography Average Weighted by:
ACV *ACV Weighted Distribution Product NA Time Average Weighted by:
ACV * ACV Weighted Distribution Related Measures • Average Weekly Sales per $MM ACV
• Average Weekly Base Sales per $MM ACV

IRI InfoScan Measure Guide Copyright Information Resources, Inc. 2006 June, 2006
- 82 -
Measure Group Average Weekly Items per Store Selling (Algorithm 180)
Measure Type Stored Definition This measure estimates the average weekly number
of different UPCs of a selected product available in each store carrying the product aggregate.
Calculation Σ Average Items per Store Selling across all weeks
Number of weeks in distribution Common Use(s) • This measure is used to compare the depth of
distribution across products, geographies, and time periods.
• This measure is recommended over Average Items per Store Selling for larger time periods and when comparing time periods of varying lengths.
• This measure can be used as a complement to Average Weekly ACV Weighted Distribution because it takes into account the effect of limited UPC distribution on any higher aggregate of UPC (i.e.: brand, category, etc.) distribution.
Usage Notes • This measure does not indicate how widespread
distribution of a product aggregate is – it indicates the depth of distribution in stores that carry it.
• This measure may be overstated for Special Pack categories when both Special Packs and the Regular Packs they replace are both moving at the same time.
Additivity Non-additive across all dimensions

IRI InfoScan Measure Guide Copyright Information Resources, Inc. 2006 June, 2006
- 83 -
Aggregation Rules Geography Average Weighted by: ACV * Average Weekly ACV Weighted Distribution
Product NA Time Average Weighted by: ACV *
Average Weekly ACV Weighted Distribution
Related Measures Average Items per Store Selling

IRI InfoScan Measure Guide Copyright Information Resources, Inc. 2006 June, 2006
- 84 -
Measure Group Average Weekly Items per Store Selling (CWD
weighted) (Algorithm 180) Measure Type Stored Definition This measure estimates the average number of
different UPCs of a selected product selling in the stores carrying the product aggregate.
Calculation Σ Average Items per Store Selling across all weeks
Number of weeks in distribution Common Use(s) • This measure is used to compare the depth of
distribution across products, geographies, and time periods.
• This measure is recommended over Average Items per Store Selling for larger time periods and when comparing time periods of varying lengths.
• This measure can be used as a complement to Average Weekly CWD Weighted Distribution because it takes into account the effect of limited UPC distribution on any higher aggregate of UPC (i.e.: brand, category, etc.) distribution.
Usage Notes • This measure does not indicate how widespread
distribution of a product aggregate is – it indicates the depth of distribution in stores that carry it.
• This measure may be overstated for Special Pack categories when both Special Packs and the Regular Packs they replace are both moving at the same time.
Additivity Non-additive across all dimensions. Aggregation Rules Geography Average Weighted By: ACV *
Average Weekly ACV Weighted Distribution
Product NA Time Average Weighted By: ACV *
IRI InfoScan Measure Guide Copyright Information Resources, Inc. 2006 June, 2006
- 85 -
Average Weekly ACV Weighted Distribution
Related Measures Average Items per Store Selling CWD

IRI InfoScan Measure Guide Copyright Information Resources, Inc. 2006 June, 2006
- 86 -
Measure Group Average Weekly Sales per $MM ACV (Algorithm 020)
Measure Type Stored Definition These measures report the average weekly sales per
million dollar annual ACV, weighted by the product’s average weekly distribution.
Calculation These measures are expressed mathematically as
follows: Let: S(t) = Sales per $MM ACV at week t D(t) = ACV Weighted Distribution at week t t = 1,...,n Average Weekly Sales per $MM ACV equals:
N ∑ [S(t) * D(t)] t-1 ---------------------------------------
N ∑ D(t) t=1
Common Use(s) • To compare sales rates of products with varying
levels of distribution and to compare sales rates across geographies of different sizes.
• Average Weekly Sales per $MM ACV are preferable to Sales per $MM ACV when looking at longer time periods or comparing periods of different lengths.
Usage Notes • Because these measures are weighted by ACV
Weighted Distribution, weeks in which the product was not distributed are effectively eliminated from the calculation.
• This measure cannot be used with product custom aggregates.
Additivity Non-additive across all dimensions

IRI InfoScan Measure Guide Copyright Information Resources, Inc. 2006 June, 2006
- 87 -
Aggregation Rules Geography Average Weighted by:
ACV * ACV Weighted Distribution Product NA Time Average Weighted by:
ACV * ACV Weighted Distribution Related Measures • Sales per $MM ACV
• Average Weekly Base Sales per $MM ACV • Average Weekly Incremental Sales per $MM
ACV
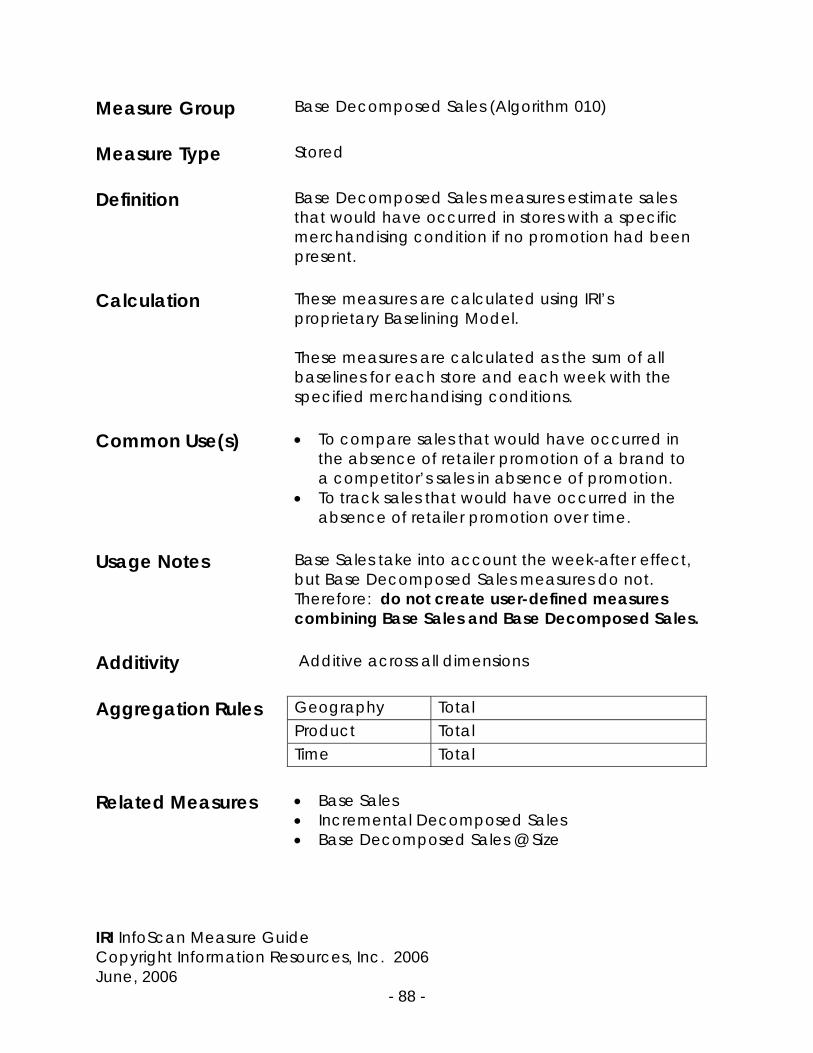
IRI InfoScan Measure Guide Copyright Information Resources, Inc. 2006 June, 2006
- 88 -
Measure Group Base Decomposed Sales (Algorithm 010) Measure Type Stored Definition Base Decomposed Sales measures estimate sales
that would have occurred in stores with a specific merchandising condition if no promotion had been present.
Calculation These measures are calculated using IRI’s
proprietary Baselining Model. These measures are calculated as the sum of all baselines for each store and each week with the specified merchandising conditions.
Common Use(s) • To compare sales that would have occurred in
the absence of retailer promotion of a brand to a competitor’s sales in absence of promotion.
• To track sales that would have occurred in the absence of retailer promotion over time.
Usage Notes Base Sales take into account the week-after effect,
but Base Decomposed Sales measures do not. Therefore: do not create user-defined measures combining Base Sales and Base Decomposed Sales.
Additivity Additive across all dimensions Aggregation Rules Geography Total Product Total Time Total Related Measures • Base Sales
• Incremental Decomposed Sales • Base Decomposed Sales @ Size

IRI InfoScan Measure Guide Copyright Information Resources, Inc. 2006 June, 2006
- 89 -
Measure Group Base Decomposed Sales @ Size (Algorithm 079) Measure Type Stored Definition Base Decomposed Sales @ Size measures are used
in place of Base Decomposed Sales for all Special Pack categories. Base Decomposed Sales @ Size measures estimate sales that would have occurred in stores with a specific merchandising condition if no promotion had been present.
Calculation These measures are calculated using IRI’s
proprietary Special Pack Baselining Model. In weeks without promotions, Base Sales are always equal to sales. Base Sales @ Size measures are calculated as the sum of all baselines for each store and each week with the specified merchandising condition.
Common Use(s) • To compare sales that would have occurred in
the absence of retailer promotion or manufacturer Special Packs for a brand relative to a competitor’s sales in the absence of retailer promotion.
• To track sales that would have occurred in the absence of retailer promotion or manufacturer Special Packs over time.
Usage Notes • Do not use these measures for products below
the Special Pack baselining level. • Base Sales @ Size measures take into account
the week-after effect, Base Decomposed Sales @ Size do not. Therefore: do not create user-defined measures that combine Base Sales @ Size and Base Decomposed Sales @ Size.
• Because Special pack baselines are calculated on a per volume basis, it is not possible to calculate meaningful Base Decomposed Units @ Size measures. Base Decomposed Units @ Size
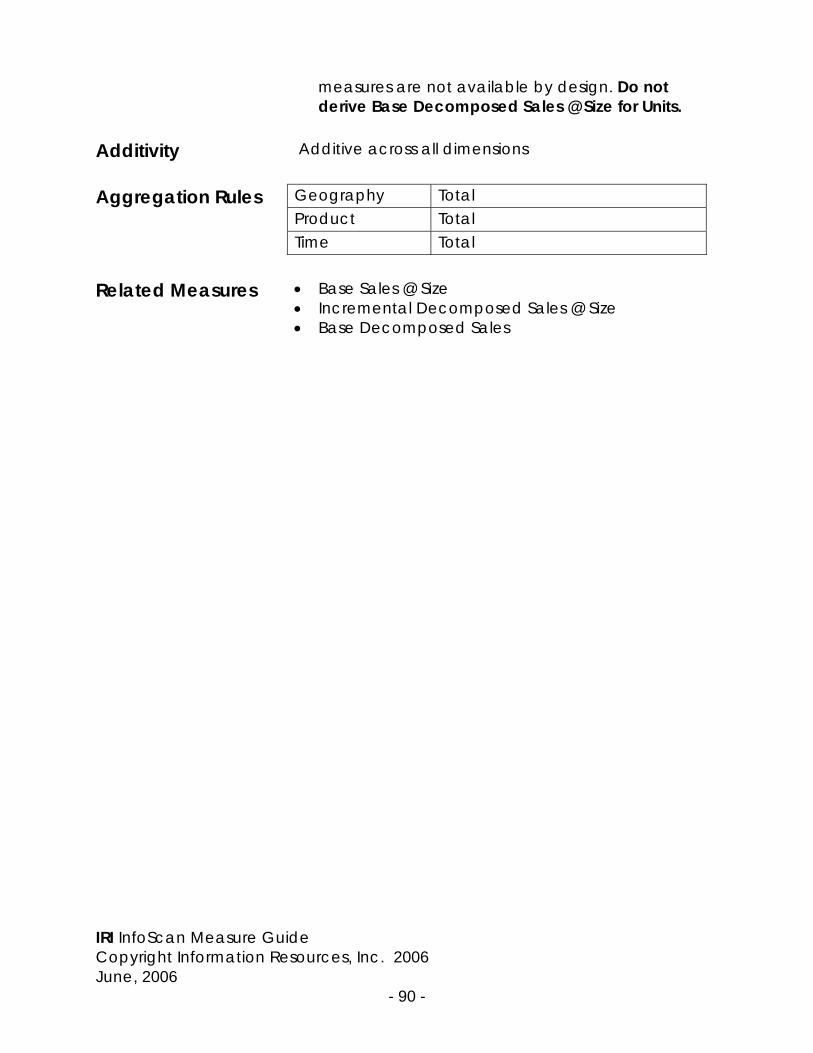
IRI InfoScan Measure Guide Copyright Information Resources, Inc. 2006 June, 2006
- 90 -
measures are not available by design. Do not derive Base Decomposed Sales @ Size for Units.
Additivity Additive across all dimensions Aggregation Rules Geography Total Product Total Time Total Related Measures • Base Sales @ Size
• Incremental Decomposed Sales @ Size • Base Decomposed Sales

IRI InfoScan Measure Guide Copyright Information Resources, Inc. 2006 June, 2006
- 91 -
Measure Group Base Sales (Algorithm 010) Measure Type Stored Definition These measures estimate sales that would have
occurred in the absence of retailer merchandising (features, displays, and/or price reductions) or in the absence of a display or feature in the previous week.
Calculation These measures are calculated using IRI’s
proprietary Baselining Model. These measures are calculated as the sum of all baselines for each store and each week during the period. The following rule are applied when calculating base sales:
• Weeks after Features and Displays are considered promoted for the purposes of calculating Base Sales.
• In non-promoting store/weeks base sales are set equal to sales.
• If projected Base Unit (or Volume) Sales exceed Unit (or Volume) Sales, Base Unit (or Volume) Sales are set equal to sales.
• Base Dollar Sales are allowed to exceed Dollar Sales.
Common Use(s) • To compare sales that would have occurred in
the absence of retailer promotion of a brand relative to a competitor’s sales in absence of promotion.
• To track sales that would have occurred in the absence of retailer promotion over time.
Usage Notes Base Sales take into account the week-after effect,
but Base Decomposed Sales measures do not. Therefore: do not create user-defined measures that combine Base Sales and Base Decomposed Sales.
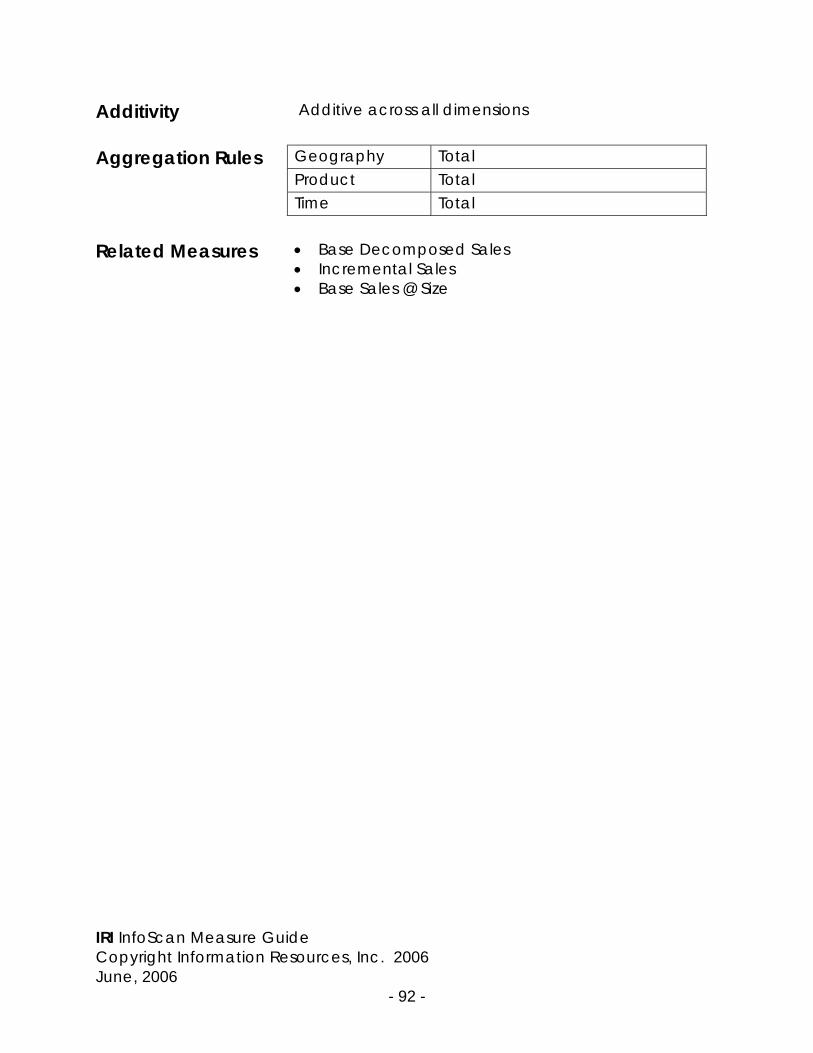
IRI InfoScan Measure Guide Copyright Information Resources, Inc. 2006 June, 2006
- 92 -
Additivity Additive across all dimensions Aggregation Rules Geography Total Product Total Time Total Related Measures • Base Decomposed Sales
• Incremental Sales • Base Sales @ Size
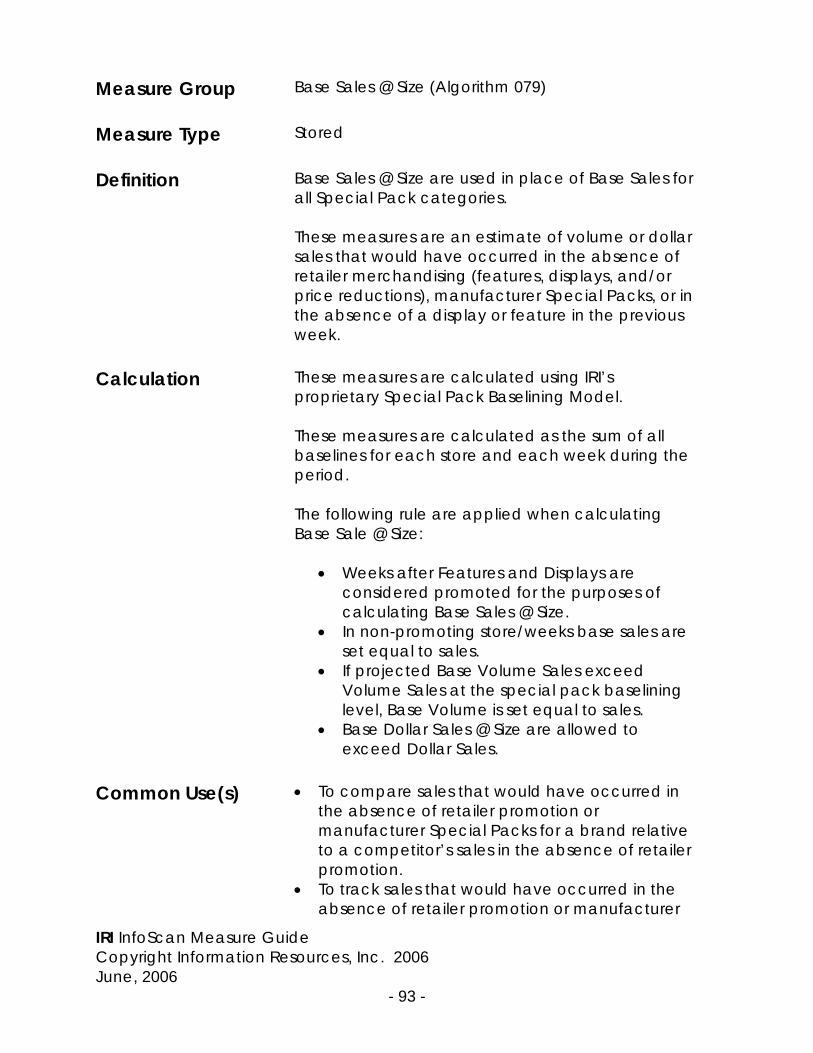
IRI InfoScan Measure Guide Copyright Information Resources, Inc. 2006 June, 2006
- 93 -
Measure Group Base Sales @ Size (Algorithm 079) Measure Type Stored Definition Base Sales @ Size are used in place of Base Sales for
all Special Pack categories. These measures are an estimate of volume or dollar sales that would have occurred in the absence of retailer merchandising (features, displays, and/or price reductions), manufacturer Special Packs, or in the absence of a display or feature in the previous week.
Calculation These measures are calculated using IRI’s
proprietary Special Pack Baselining Model. These measures are calculated as the sum of all baselines for each store and each week during the period. The following rule are applied when calculating Base Sale @ Size:
• Weeks after Features and Displays are considered promoted for the purposes of calculating Base Sales @ Size.
• In non-promoting store/weeks base sales are set equal to sales.
• If projected Base Volume Sales exceed Volume Sales at the special pack baselining level, Base Volume is set equal to sales.
• Base Dollar Sales @ Size are allowed to exceed Dollar Sales.
Common Use(s) • To compare sales that would have occurred in
the absence of retailer promotion or manufacturer Special Packs for a brand relative to a competitor’s sales in the absence of retailer promotion.
• To track sales that would have occurred in the absence of retailer promotion or manufacturer

IRI InfoScan Measure Guide Copyright Information Resources, Inc. 2006 June, 2006
- 94 -
Special Packs over time. Usage Notes • Do not use these measures for products below
the Special Pack baselining level. • Base Sales @ Size measures take into account
the week-after effect, Base Decomposed Sales @ Size do not. Therefore: do not create user-defined measures that combine Base Sales @ Size and Base Decomposed Sales @ Size.
• Because Special pack baselines are calculated on a per volume basis, it is not possible to calculate meaningful Base Units @ Size measures. Base Units @ Size measures are not available by design. Do not derive Base Sales @ Size for Units
Additivity Additive across all dimensions Aggregation Rules Geography Total Product Total Time Total Related Measures • Base Decomposed Sales @ Size
• Incremental Sales @ Size • Base Sales

IRI InfoScan Measure Guide Copyright Information Resources, Inc. 2006 June, 2006
- 95 -
Measure Group Base Sales @ Size per $MM ACV (Algorithm 086) Measure Type Stored Definition Base Sales @ Size per $MM ACV are used in place of
Base Sales per $MM ACV for all Special Pack categories. Total Base Sales @ Size during the selected time period per million dollars of annual ACV of stores selling the product.
Calculation Base Sales @ size
Σ ACV of the stores selling the product
A store will be counted as having sold the product or product group if at least one unit was scanned within the selected time period.
Common Use(s) • To compare Base Sales @ Size of products with
varying levels of distribution • To compare Base Sales across geographies of
different sizes. Usage Notes • Do not use these measures for products below
the Special Pack baselining level. • Because IRI uses an annualized ACV estimate
when calculating Base Sales @ Size per $MM ACV, do not use these measures to compare sales rates across time periods of varying length. The denominator in these measures always represents ACV for 52 weeks regardless of the length of the time period selected.
• These measures cannot be used with time or product custom aggregates.
Additivity Non-additive across all dimensions

IRI InfoScan Measure Guide Copyright Information Resources, Inc. 2006 June, 2006
- 96 -
Aggregation Rules Geography Average Weighted by:
ACV * ACV Weighted Distribution Product NA Time NA Related Measures • Sales per $MM ACV
• Base Sales per $MM ACV

IRI InfoScan Measure Guide Copyright Information Resources, Inc. 2006 June, 2006
- 97 -
Measure Group Base Sales per $MM ACV (Algorithm 052) Measure Type Stored Definition Total Base Sales during the selected time period per
million dollars of annual ACV of stores selling the product.
Calculation Base Sales
Σ ACV of the stores selling the product
A store will be counted as having sold the product or product group if at least one unit was scanned within the selected time period.
Common Use(s) • To compare Base Sales of products with varying
levels of distribution • To compare Base Sales across geographies of
different sizes. Usage Notes • Because IRI uses an annualized ACV estimate
when calculating Base Sales @ Size per $MM ACV, do not use these measures to compare sales rates across time periods of varying length. The denominator in these measures always represents ACV for 52 weeks regardless of the length of the selected time period.
• For time periods larger than 13 weeks, Average Weekly Base Sales per $MM ACV is recommended.
• These measures cannot be used with time or product custom aggregates.
Additivity Non-additive across all dimensions Aggregation Rules Geography Average Weighted by:
ACV * ACV Weighted Distribution Product NA Time NA Related Measures Sales per $MM ACV

IRI InfoScan Measure Guide Copyright Information Resources, Inc. 2006 June, 2006
- 98 -
Measure Group Base Sales Share of Category Base (Algorithm 026) Measure Type Derived Definition These measures report a product’s Base Sales
expressed as a percentage of the category’s Base Sales.
Calculation Base Sales of the product * 100
Base Sales of the Category Common Use(s) To evaluate a product’s share of the category
taking out the impacts of temporary promotions. Usage Notes None Additivity Additive up the product hierarchy for products
within the same category. Aggregation Rules Derived measures inherit the aggregation rules of
their component stored measures. Related Measures • Sales Share of Category Sales
• Incremental Sales Share of Category Incremental
• Base Sales Share of Total Category

IRI InfoScan Measure Guide Copyright Information Resources, Inc. 2006 June, 2006
- 99 -
Measure Group Base Sales Share of Total Category (Algorithm 025) Measure Type Derived Definition These measures report a product’s Base Sales
expressed as a percentage of the total category sales.
Calculation Base Sales of the product *100
Total Sales of the category Common Use(s) • Track Base Sales relative to the competition.
• Compare Base Sales of a product across geographies.
Usage Notes None Additivity Additive up the product hierarchy for items
belonging to the same category. Aggregation Rules Derived measures inherit the aggregation rules of
their component stored measures. Related Measures • Sales Share of Category Sales
• Base Share of Category Base Sales

IRI InfoScan Measure Guide Copyright Information Resources, Inc. 2006 June, 2006
- 100 -
Measure Group Base Weighted Weeks Measure Type Derived Definition These measures report the number of weeks, each
equivalent to an average week of the product's base sales, for which the product was supported with a particular type of promotion.
Calculation Base Decomposed Volume with Merchandising condition
Average Weekly Base Volume Common Use(s) To evaluate the depth and duration of promotional
support, particularly when not all items within the product line were promoted similarly.
Usage Notes Unlike Additive Cumulative Weighted Weeks, Base
Weighted Weeks does not assume that all items within a product hierarchy are being promoted identically.
Additivity Non-additive across all dimensions. Aggregation Rules
Derived measures inherit the aggregation rules of their component measures.
Related Measures • Additive Weighted Weeks
• Additive Cumulative Weighted Weeks • Incremental Weeks

IRI InfoScan Measure Guide Copyright Information Resources, Inc. 2006 June, 2006
- 101 -
Measure Group Baseline Sales (Algorithm 078) Measure Type Stored Definition Baseline Sales are IRI’s projected baseline sales with
no additional reporting adjustments. They report estimated (unit, volume, or dollar) sales that would have occurred in the absence of retailer merchandising (features, displays, and/or price reductions).
Calculation These measures are calculated using IRI’s
proprietary Baselining Model. They are calculated as the sum of all the projected baselines for each store and for each week during the period(s).
Common Use(s) IRI recommends Base Sales for most tracking
purposes. Baseline Sales are most useful for complex modeling purposes.
Usage Notes Base and Baseline Sales differ in the following ways:
• In weeks of promotion, Baseline Sales are allowed to be higher than Sales, while Base Sales are not.
• In weeks of non-promotion, Baseline Sales measures are not set equal to sales and are therefore allowed to be greater or less than Sales.
• Baseline Sales measures do no take into account the week-after effect, while Base Sales measures do.
Additivity Additive across all dimensions Aggregation Rules Geography Total Product Total Time Total

IRI InfoScan Measure Guide Copyright Information Resources, Inc. 2006 June, 2006
- 102 -
Related Measures • Base Sales • Normal Sales • Incremental Sales

IRI InfoScan Measure Guide Copyright Information Resources, Inc. 2006 June, 2006
- 103 -
Measure Group Brand Development Index Measure Type Derived Definition This measure estimates the strength of a brand’s
sales in a given market relative to the brand’s sales in the Total US.
Calculation (Volume Sales in a Geography÷Population of the Geography)
(Volume Sales in Total US÷Total US Population) Common Use(s) To identify markets where there is a
sales/distribution/marketing opportunity by determining which markets have strong or weak sales of the brand compared to the Total US.
• An index of around 100 suggests that the market has average development, or that sales are at an average level compared to Total US.
• An index higher than 120 suggests that it is a particularly strong market for the brand.
• An index below 80 suggests it is a weak market for the brand.
Usage Notes • This measure will report NA for secondary totals if
the members of the secondary total are from different categories or different brands.
• This measure is not available for CRMAs. They can be made available for some CRMAs if custom programming is done to link the CRMA population to Total US.
• This measure is not available for RMAs. • Below the Brand level this measure will report the
index for the Brand to which the product belongs.
• This measure will report an NA above the Brand level.
Aggregation Rules Derived measures inherit the aggregation rules of their component stored measures.
Related Measures • Product Development Index (PDI)
• Category Development Index (CDI)

IRI InfoScan Measure Guide Copyright Information Resources, Inc. 2006 June, 2006
- 104 -
Measure Group Bump Sales (Algorithm 071) Measure Type Stored Definition These measures are like Incremental Sales except
they are used for Census only accounts where we report only Primary Features (Main Ads) and Price Cuts, but not Displays. They are the estimated additional sales attributable to Main Ads (Primary Features) and/or Price Cuts. Bump Sales are reported for a product or group of products during weeks with observed retailer merchandising and during weeks of non-merchandising when there was a Main Ad in the previous week.
Calculation These measures are calculated using IRI’s
proprietary Baselining Model. These measures are calculated as the difference between Sales and Baseline Sales. The following rule are applied when calculating Bump Sales:
• In non-promoting store/weeks Bump Sales equal zero.
• If Units (or Volume) – Baseline Units (or Volume) is less than zero, Bump Sales is set equal to zero.
• Bump Dollars are allowed to be negative. Common Use(s) • To determine the amount of sales generated by
primary features and price cuts. • To measure the relative effectiveness of
promotions across products, time, and in geographies that are not full-causal releasable.
• To determine if the price reduction on a promotion generated enough sales to offset the decrease in dollar sales due to price reduction.

IRI InfoScan Measure Guide Copyright Information Resources, Inc. 2006 June, 2006
- 105 -
Usage Notes • These measures are calculated exclusively from census stores.
• Unlike Incremental Sales, Bump Sales measures do not include the effect of Displays.
• Bump Dollars are allowed to be negative, but Bump Units and Bump Volume are always greater than or equal to zero.
Additivity Additive across all dimensions Aggregation Rules Geography Total Product Total Time Total Related Measures • Normal Sales
• Incremental Sales

IRI InfoScan Measure Guide Copyright Information Resources, Inc. 2006 June, 2006
- 106 -
Measure Group Category Development Index Measure Type Derived Definition This measure estimates the strength of a category’s
sales in a given market relative to the category sales in the Total US.
Calculation (Volume Sales in a Geography÷Population of the Geography)
(Volume Sales in Total US÷Total US Population) Common Use(s) To identify markets where there is a
sales/distribution/marketing opportunity by determining which markets have strong or weak sales of the brand compared to the Total US.
• An index of around 100 suggests that the market has average development, or that sales are at an average level compared to Total US.
• An index higher than 120 suggests that it is a particularly strong market for the category.
• An index below 80 suggests it is a weak market for the category.
Usage Notes • This measure will report NA for a secondary total
if the elements in the secondary total are from different categories.
• This measure is not available for CRMAs. They can be made available for some CRMAs if custom programming is done to link the CRMA population to Total US.
• This measure is not available for RMAs. • This measure will report the same value for all
products within a category. Aggregation Rules Derived measures inherit the aggregation rules of
their component stored measures. Related Measures • Product Development Index (PDI)
• Category Development Index (CDI)

IRI InfoScan Measure Guide Copyright Information Resources, Inc. 2006 June, 2006
- 107 -
Measure Group Coupon Circulation (Algorithm 552) Measure Type Stored Definition Estimated circulation of newspapers and magazines
in which a tracked manufacturer coupon was present.
Calculation Coupon Circulation for Newspapers:
(Circulation of audited newspapers with coupon ÷
Circulation of all audited newspapers) * Total newspaper circulation
Coupon Circulation for Magazines: For each magazine circulation event, the circulation is simply the magazine’s market circulation.
Common Use(s) To measure the total reach of a coupon drop. Usage Notes • Coupon Circulation is reported in 49 out of 65
standard InfoScan markets. • This measure will not report for secondary totals
because of the potential for double counting items.
• Not all manufacturer coupons are tracked in InfoScan.
Additivity Additive across geographies and time. Aggregation Rules Geography Total Product Largest Time Total Related Measures Share of Coupon Circulation

IRI InfoScan Measure Guide Copyright Information Resources, Inc. 2006 June, 2006
- 108 -
Measure Group Estimated Coupon Redemption (Algorithm 553) Measure Type Stored Definition This measure estimates the total number of
manufacturer coupons that could potentially be redeemed for a product or group of products.
Calculation (Coupon Circulation * Redemption Rate of vehicle 1 +
Coupon Circulation * Redemption Rate of vehicle 2 + Coupon Circulation * Redemption Rate of vehicle 3) Redemption rates will vary by type of coupon (i.e., Free Standing Insert = 42%, direct mail redemption rate = 7.0 %, etc.).
Common Use(s) To estimate the total number of coupons that could
be redeemed for all tracked manufacturer coupons that were dropped for a product or group of products.
Usage Notes • This measure does not measure the actual
redemption of the coupon. • Not all manufacturer coupons are tracked in
InfoScan. Additivity Additive across geographies and periods. Aggregation Rules Geography Total Product Largest Time Total Related Measures Coupon Circulation
IRI InfoScan Measure Guide Copyright Information Resources, Inc. 2006 June, 2006
- 109 -
Measure Group Households (Algorithm 998) Measure Type Stored Definition The number of households within a specified
geography. Calculation This measure is taken directly from the U.S. Census
Bureau and is updated annually. Common Use(s) To compare the demographic size of geographies. Usage Notes • This measure is not available for Key Accounts or
RMAs. • This measure will return the same value for all
levels in the product hierarchy. Additivity This measure is additive across geographies. Aggregation Rules Geography Total Product NA Time Largest Related Measures • Population
• ACV

IRI InfoScan Measure Guide Copyright Information Resources, Inc. 2006 June, 2006
- 110 -
Measure Group Incremental Decomposed Sales (Algorithm 024) Measure Type Derived Definition Incremental Decomposed Sales estimate sales
attributable to a specific retailer merchandising condition.
Calculation These measures are calculated using IRI’s
proprietary Baselining Model. These measures are calculated as the difference between actual sales and baseline sales in stores with the specified promotional condition. The following rules are applied when calculating Incremental Decomposed Sales:
• Incremental Decomposed Volume is allowed to be negative for individual promotional conditions as long as Incremental Volume is not negative.
• Incremental Decomposed Dollars is always allowed to be negative.
• Weeks after a feature or display will be considered promoted.
Common Use(s) • To determine the sales generated by
promotional activity. • To measure the relative effectiveness of different
types of promotions. • To measure the relative effectiveness of
promotions across products, time, and geographies.
• To determine if the price reduction on a promotion generated enough sales to offset the decrease in dollar sales due to price reduction.
Usage Notes • Incremental Decomposed Sales on
merchandising condition + Base Decomposed Sales on merchandising condition does not equal sales on merchandising condition

IRI InfoScan Measure Guide Copyright Information Resources, Inc. 2006 June, 2006
- 111 -
because Incremental Decomposed Sales counts weeks after features or displays as promoted while Base Decomposed Sales does not.
• The measure Incremental Sales is the sum of all Incremental Decomposed Sales across all merchandising conditions. There is no Incremental Decomposed Sales, Any Merchandising.
• Because weeks after features and displays are treated as promoted for the purpose of calculating Incremental Decomposed Sales, there may be cases in which Incremental Decomposed Sales on a promotional condition is reported when % ACV on the condition is zero.
Additivity Additive across all dimensions Aggregation Rules Geography Total Product Total Time Total Related Measures • Incremental Sales
• Base Decomposed Sales • Incremental Decomposed Sales @ Size

IRI InfoScan Measure Guide Copyright Information Resources, Inc. 2006 June, 2006
- 112 -
Measure Group Incremental Decomposed Sales @ Size (Algorithm
050) Measure Type Derived Definition Incremental Sales @ Size are used in place of
Incremental Sales for all Special Pack categories. Incremental Decomposed Sales @ Size estimate sales attributable to a specific retailer merchandising condition.
Calculation These measures are calculated using IRI’s
proprietary Special Pack Baselining Model. These measures are calculated as the difference between actual sales and baseline sales in stores with the specified promotional condition. The following rule are applied when calculating Incremental Decomposed Sales @ Size:
• Incremental Decomposed Volume @ Size is allowed to be negative for individual promotional conditions as long as Incremental Volume is not negative.
• Incremental Decomposed Dollars @ Size are always allowed to be negative.
• Weeks after a feature or display will be considered promoted.

IRI InfoScan Measure Guide Copyright Information Resources, Inc. 2006 June, 2006
- 113 -
Common Use(s) • To determine the volume generated by
promotional activity. • To measure the relative effectiveness of different
types of promotions. • To measure the relative effectiveness of
promotions across products, time, and geographies.
• To determine if the price reduction on a promotion generated enough sales of offset the decrease in dollar sales due to the price reduction.
Usage Notes • Do not use these measures for products below
the Special Pack baselining level. • Incremental Decomposed Sales @ Size on
merchandising condition + Base Decomposed Sales @ Size on merchandising condition does not equal sales on merchandising condition because Incremental Decomposed Sales counts weeks after features or displays as promoted while Base Decomposed Sales does not.
• The measure Incremental Sales @ Size is the sum of all Incremental Decomposed Sales @ Size across all merchandising conditions. There is no Incremental Decomposed Sales @ Size, Any Merchandising or Special Pack.
• Because weeks after features and displays are treated as promoted for the purpose of calculating Incremental Decomposed Sales @ Size, there may be cases in which Incremental Decomposed Sales @ Size on a promotional condition is reported when % ACV on the condition is zero.
Additivity Additive across all dimensions Aggregation Rules Geography Total Product Total Time Total

IRI InfoScan Measure Guide Copyright Information Resources, Inc. 2006 June, 2006
- 114 -
Related Measures • Incremental Sales @ Size • Base Decomposed Sales @ Size • Incremental Decomposed Sales

IRI InfoScan Measure Guide Copyright Information Resources, Inc. 2006 June, 2006
- 115 -
Measure Group Incremental Dollars per Markdown Dollars (Algorithm 044)
Measure Type Derived Definition This measure is a ratio of Incremental Dollars to each
dollar of price reduction (Markdown Dollars). Calculation Incremental Dollars
Markdown Dollars Common Use(s) • To evaluate the effectiveness of a price
reduction at bringing in additional revenue. The higher the ratio, the more effective the price reduction was in bringing in additional revenue.
• To determine if increased dollar sales from a promotion offset the decrease in dollar sales due to the price reduction.
Usage Notes This measure can yield a negative number since
Incremental Dollars can be negative. Additivity Non-additive across all dimensions Aggregation Rules Derived measures inherit the aggregation rules of
their component stored measures. Related Measures • Markdown Dollars
• Incremental Dollars

IRI InfoScan Measure Guide Copyright Information Resources, Inc. 2006 June, 2006
- 116 -
Measure Group Incremental Sales (Algorithm 024) Measure Type Derived Definition These measures estimate sales attributable to
retailer merchandising (features, displays, and/or price reductions). Incremental sales are reported for a product or group of products during weeks with observed retailer merchandising and during weeks of non-merchandising when there was a display or feature in the previous week.
Calculation These measures are calculated using IRI’s
proprietary Baselining Model. These measures are calculated as the difference between actual sales and baseline sales in stores with the specified promotional condition. The following rule are applied when calculating Incremental Sales:
• Weeks after a feature or display will be counted as promoted for the purpose of calculating Incremental Sales.
• In weeks with no promotion Incremental Sales is set equal to zero.
• If Volume (or Unit) Sales – Baseline Volume (or Unit) Sales is less than zero, Incremental Volume (or Units) is set equal to zero.
• Incremental Dollars is allowed to be negative. Common Use(s) • To determine the sales generated by
promotional activity. • To measure the relative effectiveness of different
types of promotions. • To measure the relative effectiveness of
promotions across products, time, and geographies.
• To determine if the price reduction on a promotion generated enough sales to offset the

IRI InfoScan Measure Guide Copyright Information Resources, Inc. 2006 June, 2006
- 117 -
decrease in dollar sales due to price reduction. Usage Notes • Incremental Dollars is allowed to be negative, but
Incremental Units and Volume are always greater than or equal to zero.
• Because weeks after features and displays are considered promoted for the purposes of calculating Incremental Sales, there may be cases in which Incremental Sales are reported but % ACV, Any Merchandising is zero.
Additivity Additive across all dimensions Aggregation Rules Geography Total Product Total Time Total Related Measures • Incremental Decomposed Sales
• Base Sales • Incremental Sales @ Size

IRI InfoScan Measure Guide Copyright Information Resources, Inc. 2006 June, 2006
- 118 -
Measure Group Incremental Sales @ Size (Algorithm 050) Measure Type Derived Definition Incremental Sales @ Size are used in place of
Incremental Sales for all Special Pack categories. These measures are an estimate of volume or dollar sales attributable to retailer merchandising (features, displays, and/or price reductions) and/or manufacturer Special Packs. Incremental Sales are reported for a product or group of products during weeks with observed retailer merchandising and during weeks of non-merchandising when there was a display or feature in the previous week.
Calculation These measures are calculated using IRI’s
proprietary Baselining Model. These measures are calculated as the difference between actual sales and baseline sales in stores with the specified promotional condition. The following rule are applied when calculating Incremental Sales @ Size:
• Weeks after a feature or display will be counted as promoted for the purpose of calculating Incremental Sales @ Size.
• In weeks with no merchandising Incremental Sales @ Size is set equal to zero.
• If Volume Sales – Baseline Volume Sales is less than zero, Incremental Volume is set equal to zero.
• Incremental Dollars @ Size is allowed to be negative.
Common Use(s) • To determine the volume generated by
promotional activity. • To measure the relative effectiveness of different

IRI InfoScan Measure Guide Copyright Information Resources, Inc. 2006 June, 2006
- 119 -
types of promotions. • To measure the relative effectiveness of
promotions across products, time, and geographies.
• To determine if the price reduction on a promotion generated enough sales of offset the decrease in dollar sales due to the price reduction.
Usage Notes • Do not use these measures for products below
the Special Pack baselining level. • Incremental Dollars is allowed to be negative, but
Incremental Volume @ Size is always greater than or equal to zero.
Additivity Additive across all dimensions

IRI InfoScan Measure Guide Copyright Information Resources, Inc. 2006 June, 2006
- 120 -
Aggregation Rules Geography Total Product Total Time Total Related Measures • Incremental Decomposed Sales @ Size
• Base Sales @ Size • Incremental Sales

IRI InfoScan Measure Guide Copyright Information Resources, Inc. 2006 June, 2006
- 121 -
Measure Group Incremental Sales Share of Category Volume (Algorithm 034)
Measure Type Derived Definition These measures report a product’s Incremental Sales
expressed as a percentage of the category’s total Sales.
Calculation These measures are calculated as Incremental Sales
(unit, volume, or dollars) divided by the total Sales of all products in the category, multiplied by 100.
Incremental Sales of the product *100 Sales of the category
Common Use(s) To determine what portion of a category’s Sales
were driven by a particular product’s Incremental Sales
Usage Notes Because we allow incremental Dollars to be
negative, Incremental Dollar Share can also be negative.
Additivity Additive up the hierarchy. Aggregation Rules Derived measures inherit the aggregation rules of
their component stored measures. Related Measures • Sales Share of Category
• Base Sales Share of Category • Base Sales @ Size Share of Category
IRI InfoScan Measure Guide Copyright Information Resources, Inc. 2006 June, 2006
- 122 -
Measure Group Incremental Sales Share of Category Incremental (Algorithm 035)
Measure Type Derived Definition These measures report a product’s Incremental Sales
expressed as a percentage of the category’s Incremental Sales.
Calculation These measures are calculated as Incremental Sales
(unit, volume, or dollars) divided by the Incremental Sales of all products in the category during the period(s), multiplied by 100. This can be expressed mathematically as:
Incremental Sales of the product * 100 Incremental Sales of the category
Common Use(s) • To determine what amount of total category
Incremental Sales were made up of a particular product’s Incremental Sales.
• To compare Incremental Sales of a product across geographies.
• To compare a brand’s share of category Incremental Sales to its share of total category Sales.
Usage Notes Because we allow incremental Dollars to be
negative, Incremental Dollar Share can also be negative.
Additivity Additive up the hierarchy. Aggregation Rules Derived measures inherit the aggregation rules of
their component stored measures. Related Measures • Base Sales Share of Category Base Sales
• Sales Share of Category

IRI InfoScan Measure Guide Copyright Information Resources, Inc. 2006 June, 2006
- 123 -
Measure Group Incremental Weeks (Algorithm 032) Measure Type Derived Definition These measures estimate the effectiveness of a
merchandising event by expressing Incremental Sales as a percentage of Average Weekly Base Sales.
Calculation Incremental Volume with Merchandising
Average Weekly Base Volume
Common Use(s) To compare Incremental Sales across geographies
and products. Usage Notes • Incremental Weeks for a 4-week period can be
lower than it is for the individual weeks within the period.
• Because Incremental Decomposed Volume is allowed to be negative (as long as Total Incremental Volume is positive), Incremental Weeks may report a negative value.
• For effective promotions, Incremental Weeks may report a value greater than the number of weeks in the period.
Aggregation Rules
Derived measures inherit the aggregation rules of their component measures.
Related Measures • % Increase in Sales
• % Increase in Sales @ Size • Base Weighted Weeks
IRI InfoScan Measure Guide Copyright Information Resources, Inc. 2006 June, 2006
- 124 -
Measure Group Items Moved (Algorithm 049) Measure Type Stored Definition This measure reports the average weekly items
moved weighted by ACV Weighted Distribution. This measure is very similar to Total Points of ACV Weighted Distribution.
• At the UPC-week level, and up the product hierarchy, this measure reports the same value as Total Points of ACV Weighted Distribution divided by 100.
• Across weeks, this measure reports the average weekly Total Points of ACV Weighted Distribution divided by 100.
Calculation Across UPCs:
Σ (ACV weighted Distribution / 100) Across Weeks:
Σ (ACV weighted Distribution / 100) Number of Weeks
Common Use(s) • To track how many UPCs are moving in the
market. • To track how many UPCs are moving in the
market on an average weekly basis. Usage Notes For a single week and UPC, this measure reports the
same values as ACV Weighted Distribution divided by 100 and Total Points of ACV Weighted Distribution divided by 100.
Additivity Additive up the product hierarchy. Aggregation Rules Geography Average Weighted by: ACV *
ACV Weighted Distribution Product Total Time NA
IRI InfoScan Measure Guide Copyright Information Resources, Inc. 2006 June, 2006
- 125 -
Related Measures Total Points of ACV Weighted Distribution
IRI InfoScan Measure Guide Copyright Information Resources, Inc. 2006 June, 2006
- 126 -
Measure Group Manufacturer Coupon Dollars Measure Type Derived Definition This measure estimates the dollar value of all coupons
in circulation for a product or group of products. Calculation Coupon Circulation * Average Coupon Value Common Use(s) To understand the relative magnitude of the
couponing effort for a product. Usage Notes • This measure reflects the value of the coupons
based on the vehicle(s) in which they were distributed. It does not take into account actual coupon redemption.
• Not all manufacturer coupons are tracked in InfoScan.
Aggregation Rules Derived measures inherit the aggregation rules of
their component stored measures. Related Measures • Coupon Circulation
• Average Coupon Value

IRI InfoScan Measure Guide Copyright Information Resources, Inc. 2006 June, 2006
- 127 -
Measure Group Markdown Dollars (Algorithm 043) Measure Type Stored Definition This measure represents the opportunity cost of any
price reductions during the period. In other words, it is the total dollar amount of all price reductions.
Calculation This measure is calculated at the store level as for all
stores that had a price reduction of at least 5%: (Base Price – Promoted Price) * Unit Sales
Common Use(s) To estimate the opportunity cost of a price
reduction. Usage Notes • Markdown dollars represents the difference
between the dollars that would have been obtained if the same number of units had sold at full price and the dollars that were actually obtained by selling those units on price reduction. This is different than Incremental Dollars, which represents the difference between IRI’s estimate of what sales would have been in the absence of any promotion and actual sales with promotion.
• Markdown Dollars is always reported as a positive value, even though it effectively represents a theoretical loss in dollars.
Additivity Additive across all dimensions Aggregation Rules Geography Total Product Total Time Total Related Measures • Incremental Dollars per Markdown Dollars
• Incremental Dollars
IRI InfoScan Measure Guide Copyright Information Resources, Inc. 2006 June, 2006
- 128 -
Measure Group Normal Sales (Algorithm 111) Measure Type Stored Definition Normal Sales are similar to Base Sales except they
are used for Census only accounts where we report only Primary Features (Main Ads) and Price Cuts.
These measures are an estimate of what sales would have been for a product or group of products in the absence of retailer promotion.
Calculation These measures are calculated using IRI’s
proprietary Baselining Model. These measures are calculated as the sum of all baselines for each store and each week during the period. The following rule are applied when calculating base sales:
• For the purposes of calculating Normal Sales store/week/UPCs with primary features or price reductions are considered promoted. Non-promoted weeks may include secondary/tertiary features or displays.
• In non-promoting store/weeks Normal Sales are set equal to Sales.
• If projected Normal Unit (or Volume) Sales exceed Unit (or Volume) Sales, Normal Unit (or Volume) Sales are set equal to sales.
• Normal Dollar Sales are allowed to exceed Dollar Sales.
Common Use(s) • To track sales that would have occurred in
absence of retailer promotion in those geographies for which full causal data is not releasable.
• To track sales that would have occurred in absence of retailer promotion over time.

IRI InfoScan Measure Guide Copyright Information Resources, Inc. 2006 June, 2006
- 129 -
Usage Notes • These measures are calculated exclusively from
census stores. • Normal Sales may or may not include Sales due
to Display and/or Secondary Features. • In promoted weeks Normal Volume and Normal
Units are not allowed to be greater than Volume or Units respectively. Normal Dollars is allowed to be greater than Dollars.
Additivity Additive across all dimensions Aggregation Rules Geography Total Product Total Time Total Related Measures • Base Sales
• Bump Sales

IRI InfoScan Measure Guide Copyright Information Resources, Inc. 2006 June, 2006
- 130 -
Measure Group Number of Displays (Algorithm 109) Measure Type Stored Definition This measure is a count of the displays found for a
product or group of products. Calculation This is a sum of the projected total number of
displays for a product. Common Use(s) To track and compare the level of display activity
across products, time or geographies. Usage Notes • The client needs to specify the level of the
product hierarchy where this measure becomes additive. In general it is recommended that it be set at the level at which items are priced and promoted together.
• This measure is a simple count of displays, and is not an indication of the amount of sales attributable to the displays or the type of displays present.
Additivity Additive across time and geography. Additive
across products starting from the additivity level. Aggregation Rules Geography Total Product Total (above the additivity level) Time Total Related Measures Share of Merchandising Occurrences

IRI InfoScan Measure Guide Copyright Information Resources, Inc. 2006 June, 2006
- 131 -
Measure Group Population (Algorithm 999) Measure Type Stored Definition The number of people within a specified
geography. Calculation This measure is taken directly from the U.S. Census
Bureau on an annual basis. Common Use(s) • To compare the demographic size of
geographies and identify opportunities for markets where an item does not have distribution.
• To calculate development index measures. Usage Notes • This measure is not available for Key Accounts or
RMAs. • This measure will return the same value for all
levels in the product hierarchy. Additivity This measure is additive across geographies. Aggregation Rules Geography Total Product NA Time Largest Related Measures • Households
• Product Development Index • Brand Development Index • Category Development Index

IRI InfoScan Measure Guide Copyright Information Resources, Inc. 2006 June, 2006
- 132 -
Measure Group Product Development Index Measure Type Derived Definition This measure estimates the strength of a product’s
sales in a given market relative to total US sales. Calculation Volume sales in Geography
Population in Geography ÷
Volume Sales in Total US Population of Total US
Common Use(s) This measure is used to identify markets where there
is a sales/distribution/marketing opportunity by determining which markets have strong or weak sales of product compared to the total US.
• An index of around 100 suggests that the market has average development, or that sales are at an average level compared to total US.
• An index higher than 120 suggests that it is a particularly strong market for the product,
• An index below 80 suggests it is a weak market for the product.
Usage Notes • These measures are not available for CRMAs.
They can be made available for some CRMAs if custom programming is done to link the CRMA population to total US.
• These measures are not available for RMAs. Aggregation Rules Derived measures inherit the aggregation rules of
their component stored measures. Related Measures • Brand Development Index (BDI)
• Category Development Index (CDI)
IRI InfoScan Measure Guide Copyright Information Resources, Inc. 2006 June, 2006
- 133 -
Measure Group Sales (Algorithm 001) Measure Type Stored Definition Total dollar, unit, or volume sales of a product or
group of products. Calculation For Sales that are not specific to a merchandising
condition the measures are calculated as: Σ dollars, units, or volume scanned For Sales by merchandising condition, these measures are calculated as: Σ dollars, units, or volume scanned in stores where the merchandizing condition was present
Common Use(s) • To track sales trends of products over time.
• To compare sales levels across products. Usage Notes Price reflects all FSP discounts for participating FSP
retailers and feature FSP discounts for non-participating retailers.
Additivity Additive across all dimensions Aggregation Rules Geography Total Product Total Time Total Related Measures % of Sales * Sales is derived for the following causal conditions: Major Display Only and Minor Display Only.

IRI InfoScan Measure Guide Copyright Information Resources, Inc. 2006 June, 2006
- 134 -
Measure Group Sales per Point of ACV Weighted Distribution
(Algorithm 004) Measure Type Derived Definition These measures report total product sales during the
selected time period, per percentage point of the ACV of the geography.
Calculation Sales
ACV Weighted Distribution
Common Use(s) • To track how well a product sold, controlling for
its distribution within the market. • To compare sales rates of products with varying
levels of distribution within a single geography. Usage Notes Because a point of distribution in one geography is
not equal to a point of distribution in another geography, these measures only allows comparisons of products within a geography, not across geographies.
Additivity Non-additive across all dimensions. Aggregation Rules Derived measures inherit the aggregation rules of
their component stored measures. Related Measures • Sales per $MM ACV
• Average Sales per Store Selling
IRI InfoScan Measure Guide Copyright Information Resources, Inc. 2006 June, 2006
- 135 -
Measure Group Sales Per Point of Category Weighted Distribution Measure Type Derived Definition These measures report total product sales during the
selected time period, per percentage point of the CWD of the geography.
Calculation Sales
Category Weighted Distribution Common Use(s) • To track how well a product sold, controlling for
its distribution within the market. • To compare sales rates of products with varying
levels of distribution within a single geography. Usage Notes Because a point of distribution in one geography is
not equal to a point of distribution in another geography, these measures only allow comparisons of products within a geography, not across geographies.
Additivity Non-additive across all dimensions. Aggregation Rules Derived measures inherit the aggregation rules of
their component stored measures. Related Measures • Sales per Thousand Category Dollars Selling
• Sales per Total Points of CWD
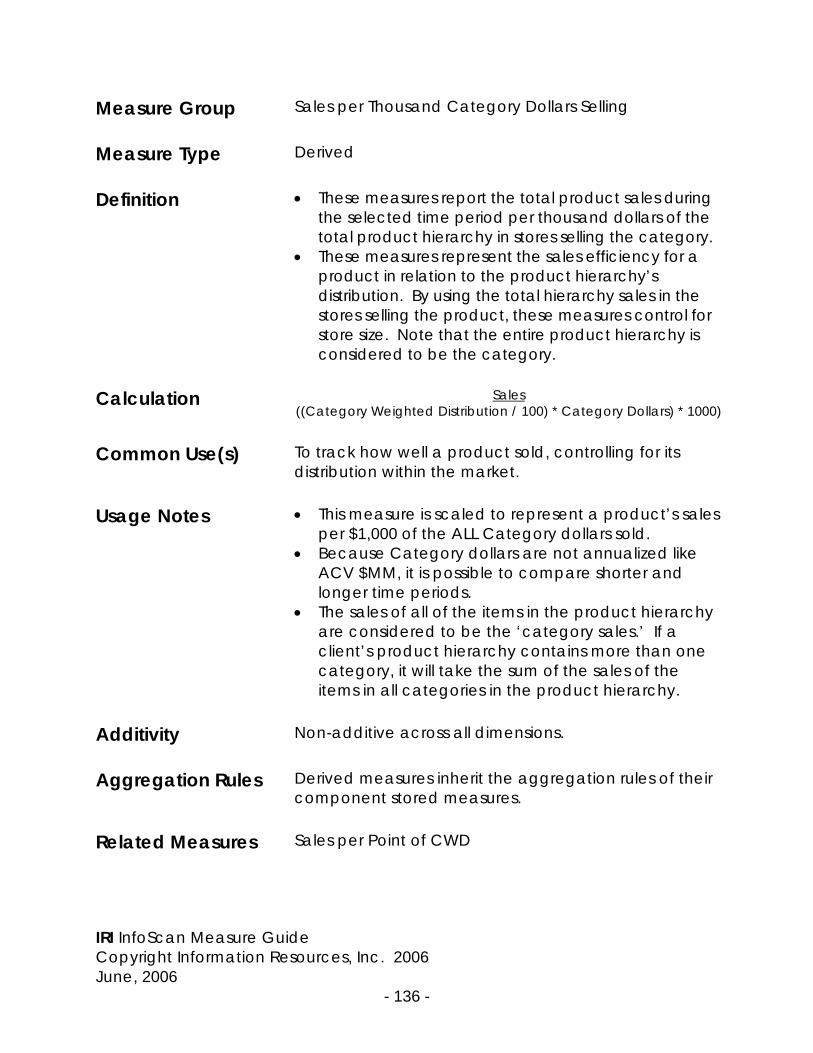
IRI InfoScan Measure Guide Copyright Information Resources, Inc. 2006 June, 2006
- 136 -
Measure Group Sales per Thousand Category Dollars Selling Measure Type Derived Definition • These measures report the total product sales during
the selected time period per thousand dollars of the total product hierarchy in stores selling the category.
• These measures represent the sales efficiency for a product in relation to the product hierarchy’s distribution. By using the total hierarchy sales in the stores selling the product, these measures control for store size. Note that the entire product hierarchy is considered to be the category.
Calculation Sales
((Category Weighted Distribution / 100) * Category Dollars) * 1000) Common Use(s) To track how well a product sold, controlling for its
distribution within the market. Usage Notes • This measure is scaled to represent a product’s sales
per $1,000 of the ALL Category dollars sold. • Because Category dollars are not annualized like
ACV $MM, it is possible to compare shorter and longer time periods.
• The sales of all of the items in the product hierarchy are considered to be the ‘category sales.’ If a client’s product hierarchy contains more than one category, it will take the sum of the sales of the items in all categories in the product hierarchy.
Additivity Non-additive across all dimensions. Aggregation Rules Derived measures inherit the aggregation rules of their
component stored measures. Related Measures Sales per Point of CWD
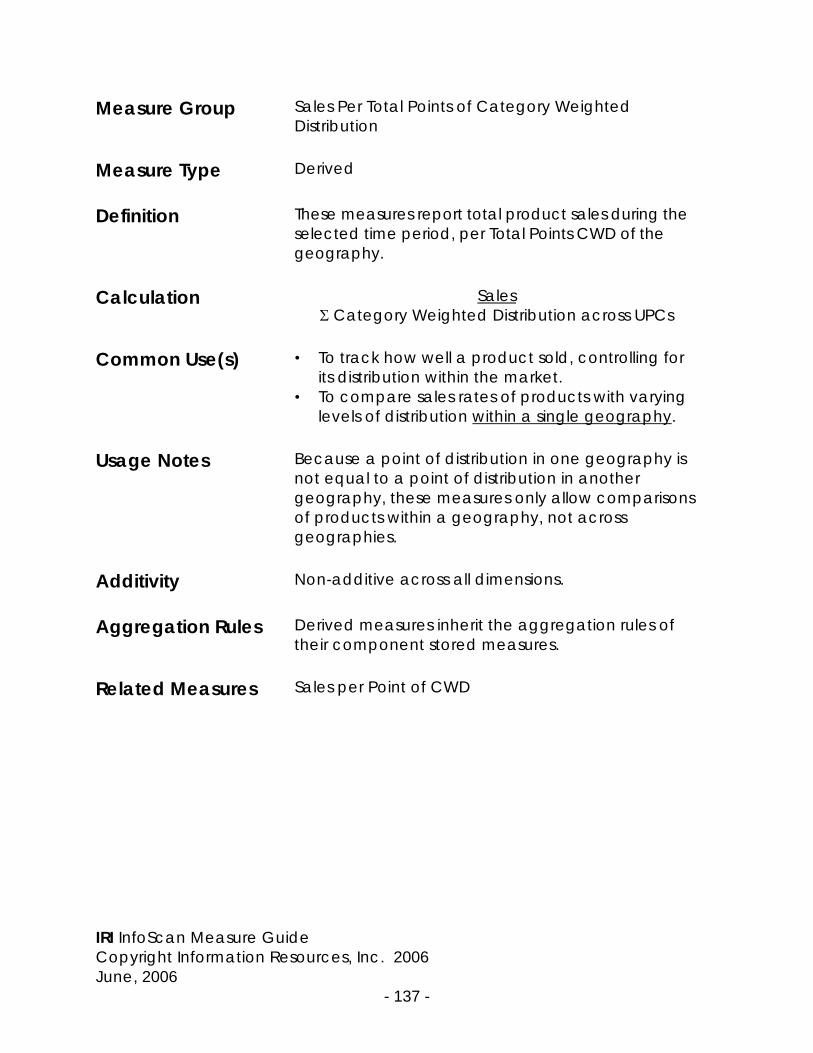
IRI InfoScan Measure Guide Copyright Information Resources, Inc. 2006 June, 2006
- 137 -
Measure Group Sales Per Total Points of Category Weighted
Distribution Measure Type Derived Definition These measures report total product sales during the
selected time period, per Total Points CWD of the geography.
Calculation Sales
Σ Category Weighted Distribution across UPCs Common Use(s) • To track how well a product sold, controlling for
its distribution within the market. • To compare sales rates of products with varying
levels of distribution within a single geography. Usage Notes Because a point of distribution in one geography is
not equal to a point of distribution in another geography, these measures only allow comparisons of products within a geography, not across geographies.
Additivity Non-additive across all dimensions. Aggregation Rules Derived measures inherit the aggregation rules of
their component stored measures. Related Measures Sales per Point of CWD

IRI InfoScan Measure Guide Copyright Information Resources, Inc. 2006 June, 2006
- 138 -
Measure Group Sales Per Total Points of Distribution Measure Type Derived Definition These measures report total product sales during the
selected time period, per Total Points of ACV Weighted Distribution in the geography.
Calculation Sales
Σ ACV Weighted Distributions across UPCs Common Use(s) • To track how well a product sold, controlling for
its distribution within the market. • To compare sales rates of products with varying
levels of distribution within a single geography. Usage Notes Because a point of distribution in one geography is
not equal to a point of distribution in another geography, these measures only allow comparisons of products within a geography, not across geographies.
Additivity Non-additive across all dimensions. Aggregation Rules Derived measures inherit the aggregation rules of
their component stored measures. Related Measures Sales per Point of ACV Weighted Distribution

IRI InfoScan Measure Guide Copyright Information Resources, Inc. 2006 June, 2006
- 139 -
Measure Group Sales per $MM ACV (Algorithm 002) Measure Type Stored Definition These measures report the total product sales during
the selected time period per million dollars of annual ACV of stores selling the product. Sales per $MM ACV represents the sales efficiency for a product in relation to its distribution. By using the ACV of the stores selling the product, these measures control for store size.
Calculation Sales
Σ ACV of the stores selling the product
A store will be counted as having sold the product or product group if at least one unit was scanned within the selected time period.
Common Use(s) • To determine how well a product sold,
controlling for its distribution within the market. • To compare sales rates of products with varying
levels of distribution across geographies. Usage Notes • Unlike Sales per Point ACV Weighted Distribution,
these measures can be used to compare sales across geographies of different sizes.
• Because IRI uses an annualized ACV estimate when calculating Sales per $MM ACV, these measures should not be used to compare sales rates across time periods of varying length. Regardless of the length of the time period selected, the denominator for these measures always represents ACV for a 52 week period.
• In general, for time periods greater than 13 weeks Average Weekly Sales per $MM ACV are preferable to Sales per $MM ACV.
• These measure cannot be used with time or product custom aggregates.

IRI InfoScan Measure Guide Copyright Information Resources, Inc. 2006 June, 2006
- 140 -
Additivity Non-additive across all dimensions Aggregation Rules Geography Average Weighted by:
ACV * ACV Weighted Distribution Product NA Time NA Related Measures • Sales per Point ACV Weighted Distribution
• Average Sales per Store Selling • Average Weekly Sales per $MM ACV

IRI InfoScan Measure Guide Copyright Information Resources, Inc. 2006 June, 2006
- 141 -
Measure Group Sales Share of Category (Algorithm 006) Measure Type Derived Definition These measures report a product’s total sales
expressed as a percentage of the category’s total sales.
Calculation These measures are calculated as Sales (unit,
volume, or dollars) divided by the Sales of all products in the category during the period(s), multiplied by 100. This can be expressed mathematically as:
Total Sales of the product *100 Total Sales of the category
Common Use(s) • To track a product’s performance over time.
• To track business relative to the competition. • To compare performance of a product across
geographies. Usage Notes None Additivity Additive up the product dimension (within a
category). Aggregation Rules Derived measures inherit the aggregation rules of
their component stored measures. Related Measures • Base Sales Share of Category Base Sales
• Incremental Sales Share of Category Incremental
• Base Sales @ size Share of Category Base Sales @ size

IRI InfoScan Measure Guide Copyright Information Resources, Inc. 2006 June, 2006
- 142 -
Measure Group Share of Coupon Circulation (Algorithm 554) Measure Type Stored Definition A product’s coupon circulation as a percentage of
the total category coupon circulation. Calculation Coupon Circulation of a product * 100
Coupon Circulation of the category Common Use(s) To track the share of total Category Circulation
attributable to a product. Usage Notes • This measure does not take into account coupon
redemption. • Not all manufacturer coupons are tracked in
InfoScan. Additivity Non-additive across all dimensions Aggregation Rules Geography Average Weighted by:
Coupon Circulation Product Largest Time Average Weighted by:
Coupon Circulation Related Measures Coupon Circulation
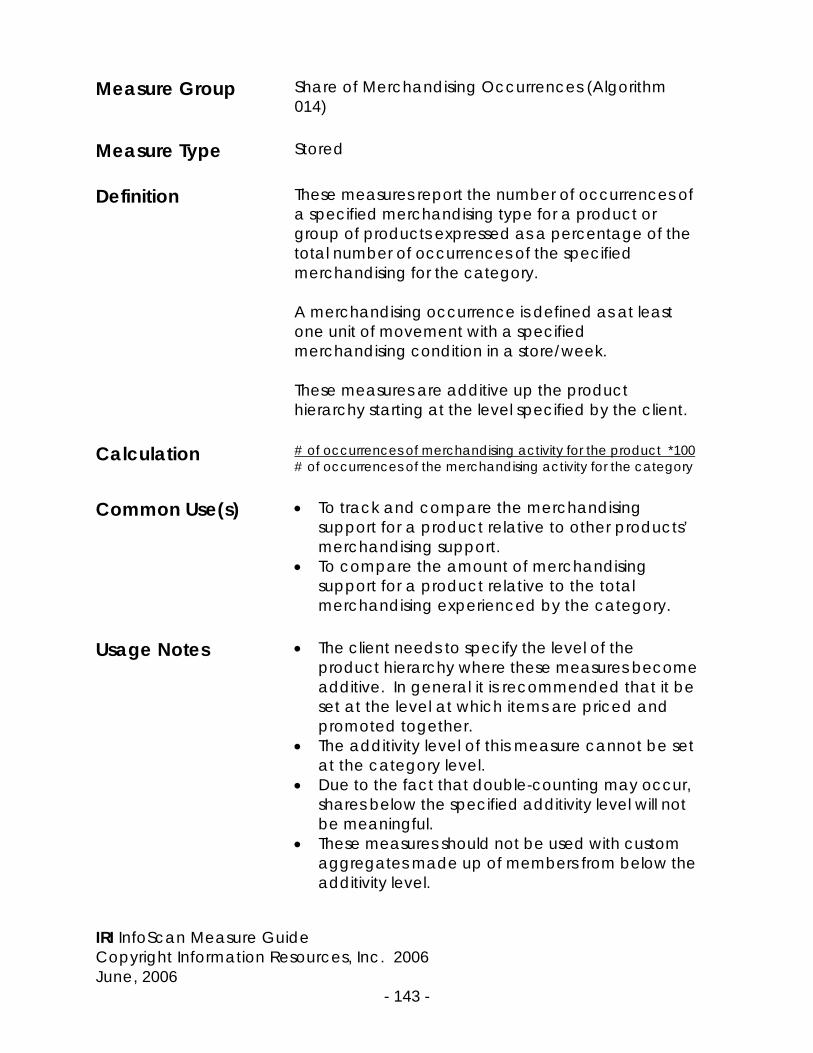
IRI InfoScan Measure Guide Copyright Information Resources, Inc. 2006 June, 2006
- 143 -
Measure Group Share of Merchandising Occurrences (Algorithm 014)
Measure Type Stored Definition These measures report the number of occurrences of
a specified merchandising type for a product or group of products expressed as a percentage of the total number of occurrences of the specified merchandising for the category. A merchandising occurrence is defined as at least one unit of movement with a specified merchandising condition in a store/week. These measures are additive up the product hierarchy starting at the level specified by the client.
Calculation # of occurrences of merchandising activity for the product *100
# of occurrences of the merchandising activity for the category Common Use(s) • To track and compare the merchandising
support for a product relative to other products’ merchandising support.
• To compare the amount of merchandising support for a product relative to the total merchandising experienced by the category.
Usage Notes • The client needs to specify the level of the
product hierarchy where these measures become additive. In general it is recommended that it be set at the level at which items are priced and promoted together.
• The additivity level of this measure cannot be set at the category level.
• Due to the fact that double-counting may occur, shares below the specified additivity level will not be meaningful.
• These measures should not be used with custom aggregates made up of members from below the additivity level.

IRI InfoScan Measure Guide Copyright Information Resources, Inc. 2006 June, 2006
- 144 -
Additivity Additive up the product hierarchy starting at the specified additivity level.
Aggregation Rules Geography NA Product Total Time NA Related Measures Share of Weighted Feature – Brand
Share of Weighted Feature - Size

IRI InfoScan Measure Guide Copyright Information Resources, Inc. 2006 June, 2006
- 145 -
Measure Group Share of Weighted Feature – Brand (Algorithm 016) Measure Type Stored Definition This measure estimates the feature activity that took
place for a product or group of products by counting the number of features that were present, weighted by the relative sizes of the features.
Calculation This measure is based on a feature weighting
scheme developed by Majors Corporation, which used to collect feature ads. Majors used the following weighting scheme to take into account the relative importance of different sized features: Feature Weighted values: A size features =6 B size features = 3 C size features = 1 Up to the Brand level this measure is calculated as follows:
(ACV Distribution, A Feature for the product * 6 + ACV Distribution B Feature for the product * 3 +
ACV Distribution C Feature for the product) (ACV Distribution, A Feature for the category * 6 + ACV Distribution B Feature for the category * 3 +
ACV Distribution C Feature for the category) This measure is additive above the Brand level.
Common Use(s) To understand the amount of feature activity
relative to the amount of feature activity that took place for the category taking into account the relative size of the features.
Usage Notes • This measure should not be used below the Brand
level. • Unlike Share of Weighted Feature - Size, which is
defined to be additive up the product hierarchy

IRI InfoScan Measure Guide Copyright Information Resources, Inc. 2006 June, 2006
- 146 -
starting at the brand level, this measure is defined to be additive up the product hierarchy starting at the size level.
Aggregation Rules Geography NA Product Total Time NA Related Measures Share of Weighted Feature Size
Share of Merchandizing Occurrences

IRI InfoScan Measure Guide Copyright Information Resources, Inc. 2006 June, 2006
- 147 -
Measure Group Share of Weighted Feature - Size (Algorithm 017) Measure Type Stored Definition This measure estimates the feature activity that took
place for a product or group of products by counting the number of features that were present, weighted by the relative sizes of the features.
Calculation This measure is based on a feature weighting
scheme developed by Majors Corporation, which used to collect feature ads. Majors used the following weighting scheme to take into account the relative importance of different sized features: Feature Weighted values: A size features =6 B size features = 3 C size features = 1 Up to the Size level this measure is calculated as follows:
(ACV Distribution, A Feature for the product * 6 + ACV Distribution B Feature for the product * 3 +
ACV Distribution C Feature for the product) (ACV Distribution, A Feature for the category * 6 + ACV Distribution B Feature for the category * 3 +
ACV Distribution C Feature for the category) This measure is additive above the Size level.
Common Use(s) To understand the amount of feature activity
relative to the amount of feature activity that took place for the category taking into account the relative size of the features.
Usage Notes • This measure should not be used below the Size
level. • Unlike Share of Weighted Feature Brand, which
is defined to be additive up the product
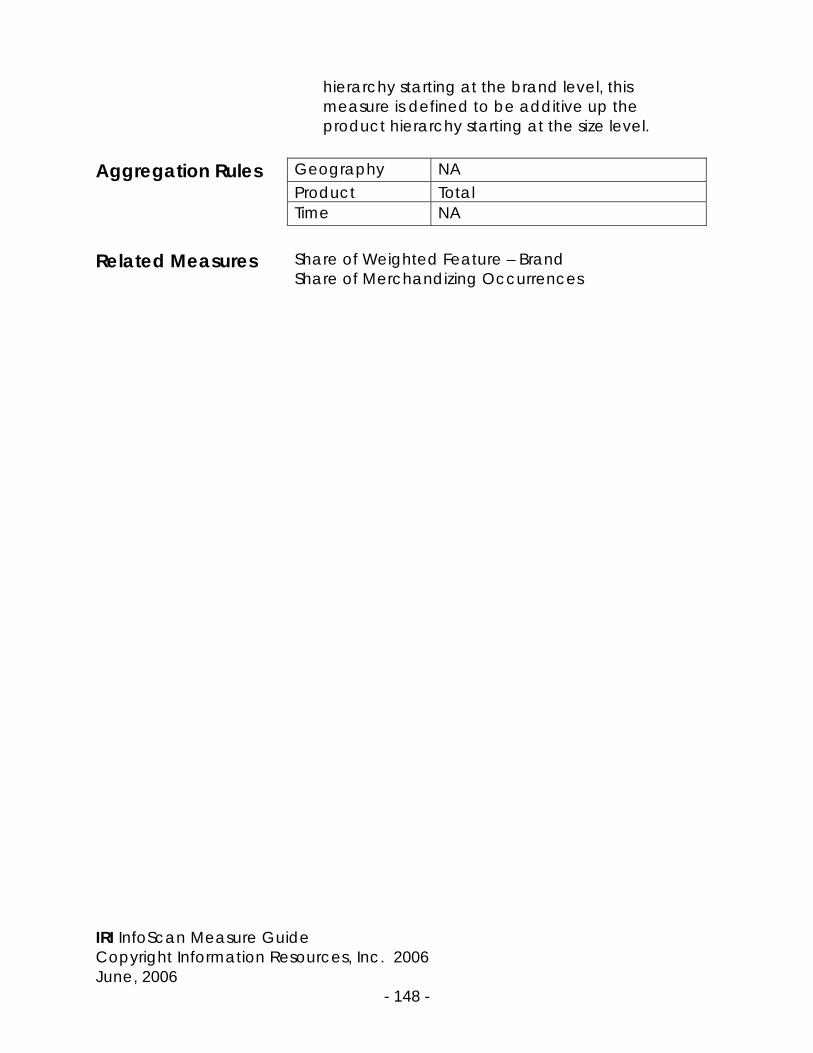
IRI InfoScan Measure Guide Copyright Information Resources, Inc. 2006 June, 2006
- 148 -
hierarchy starting at the brand level, this measure is defined to be additive up the product hierarchy starting at the size level.
Aggregation Rules Geography NA Product Total Time NA Related Measures Share of Weighted Feature – Brand
Share of Merchandizing Occurrences

IRI InfoScan Measure Guide Copyright Information Resources, Inc. 2006 June, 2006
- 149 -
Measure Group Total Points of ACV Weighted Distribution (Algorithm
084) Measure Type Stored Definition This measure reports the distribution of a product
aggregate while taking into account the number of UPCs selling within that aggregate.
Calculation Σ ACV Weighted Distribution across UPCs Common Use(s) • Used in conjunction with ACV Weighted
Distribution to understand how many active UPCs contributed to the total reach of the product aggregate.
• To compare the total depth of distribution of different brands (ideally with similar numbers of active UPCs) within a geography.
• To compare total depth of distribution of a brand across different but equal time periods.
Usage Notes • This measure differs from ACV Weighted
Distribution only in the way that it aggregates up the product hierarchy. Like ACV Weighted Distribution, this measure is NOT additive across time periods.
• For a single UPC, this measure reports the same value as % ACV.
Additivity Additive up the product hierarchy. Aggregation Rules Geography Average Weighted by:
ACV Product Total Time Largest Related Measures • % ACV
• Total Points of Quality Merchandising

IRI InfoScan Measure Guide Copyright Information Resources, Inc. 2006 June, 2006
- 150 -
Measure Group Total Points of Category Weighted Distribution
(Algorithm 084) Measure Type Stored Definition This measure reports the distribution of a product
aggregate while taking into account the number of UPCs selling within that aggregate.
Calculation Σ Category Weighted Distribution across UPCs Common Use(s) • Used in conjunction with Category Weighted
Distribution to understand how many active UPCs contributed to the total reach of the product aggregate.
• To compare the total depth of distribution of different brands (ideally with similar numbers of active UPCs) within a geography.
• To compare total depth of distribution of a brand across different but equal time periods.
Usage Notes • This measure differs from Category Weighted
Distribution only in the way that it aggregates up the product hierarchy. Like Category Weighted Distribution, this measure is NOT additive across time periods.
• For a single UPC, in a single week, in a single geography, this measure reports the same value as % CWD.
Additivity Additive up the product hierarchy. Aggregation Rules Geography Average Weighted By: ACV Product Total Time Largest Related Measures Category Weighted Distribution

IRI InfoScan Measure Guide Copyright Information Resources, Inc. 2006 June, 2006
- 151 -
Measure Group Total Points of Quality Merchandising (Algorithm 114)
Measure Type Stored Definition This measure reports the cumulative ACV distribution
points with Quality Merchandising (i.e. Feature and/or Display) of all UPCs that fall under a specified product in a market.
Calculation Σ ACV Weighted Distribution on Feature and/or Display across UPCs
100
This measure sums the UPCs’ ACV Weighted Distribution up the product hierarchy and across time.
Common Use(s) • To compare the total ACV Weighted Distribution
points on Quality Merchandising of different brands (ideally with similar numbers of active UPCs) within a geography.
• To compare total distribution points on Quality Merchandising of different brands across different but equal time periods.
Usage Notes • This measure differs from Total Points of
Distribution in that it is additive across both the product and the time dimension.
• This measure is similar to Additive Weighted Weeks, Feature and/or Display but is always additive beginning at the UPC level.
Additivity Additive up the product hierarchy and across time. Aggregation Rules Geography Average Weighted by:
ACV Product Total Time Largest Related Measures • % ACV on Feature or Display
• Total Points of ACV Weighted Distribution
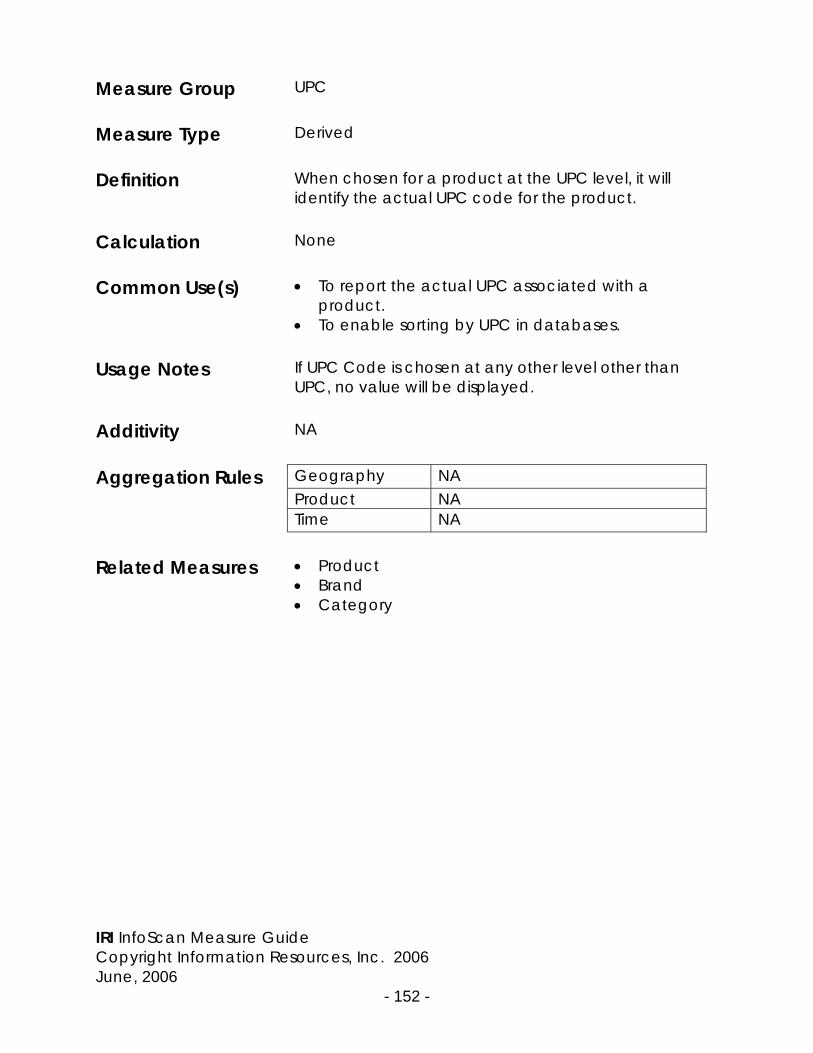
IRI InfoScan Measure Guide Copyright Information Resources, Inc. 2006 June, 2006
- 152 -
Measure Group UPC Measure Type Derived Definition When chosen for a product at the UPC level, it will
identify the actual UPC code for the product. Calculation None Common Use(s) • To report the actual UPC associated with a
product. • To enable sorting by UPC in databases.
Usage Notes If UPC Code is chosen at any other level other than
UPC, no value will be displayed. Additivity NA Aggregation Rules Geography NA Product NA Time NA Related Measures • Product
• Brand • Category

IRI InfoScan Measure Guide Copyright Information Resources, Inc. 2006 June, 2006
- 153 -
Measure Group Weeks in Distribution (Algorithm 108) Measure Type Stored Definition This measure reports the number of weeks in a period
in which a product sold at least one unit. Calculation Sum of weeks in which ACV Weighted Distribution is
greater than zero. Common Use(s) • To check if a product is in constant distribution.
• To track and compare the weeks in distribution across product, time, and geography.
Usage Notes • This measure reports the number of weeks in
which a product was in distribution, regardless of how high the distribution was.
• This measure reports the number of weeks in which the product was actually moving, not the elapsed number of weeks since the product first entered distribution.
Additivity This measure is additive across the product and time
dimensions. Aggregation Rules Geography Largest Product Largest Time Total Related Measures % of ACV
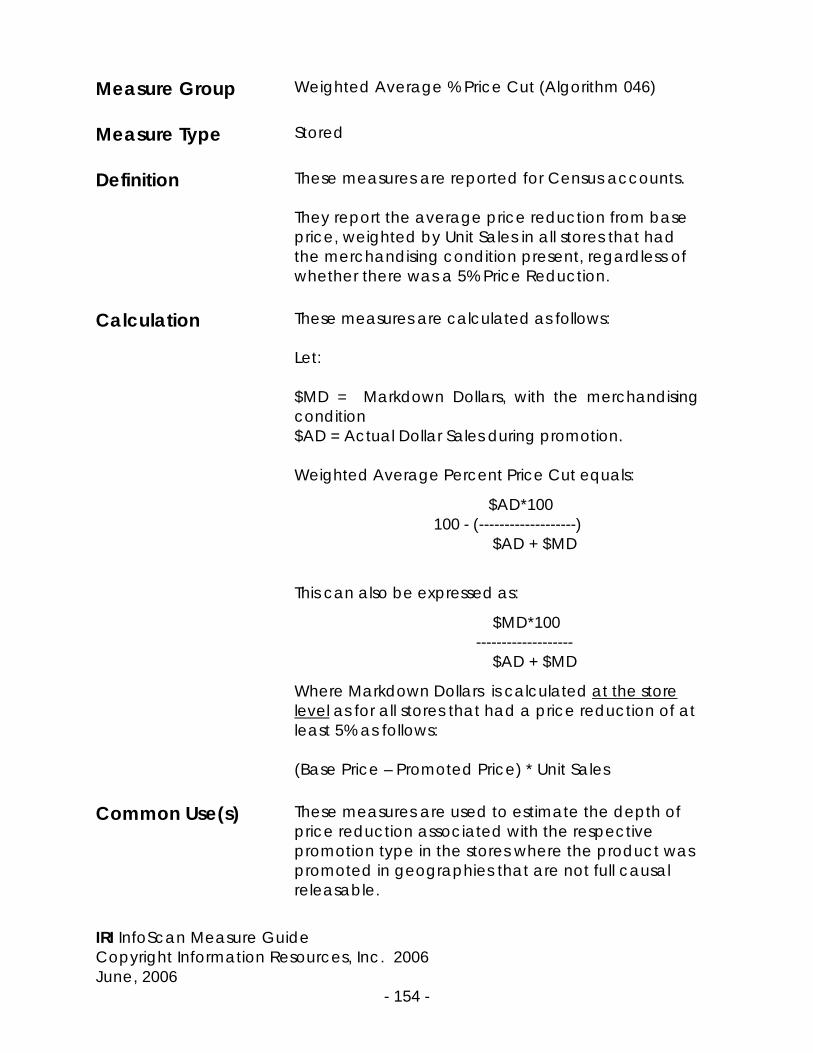
IRI InfoScan Measure Guide Copyright Information Resources, Inc. 2006 June, 2006
- 154 -
Measure Group Weighted Average % Price Cut (Algorithm 046) Measure Type Stored Definition These measures are reported for Census accounts.
They report the average price reduction from base price, weighted by Unit Sales in all stores that had the merchandising condition present, regardless of whether there was a 5% Price Reduction.
Calculation These measures are calculated as follows:
Let: $MD = Markdown Dollars, with the merchandising condition $AD = Actual Dollar Sales during promotion. Weighted Average Percent Price Cut equals:
$AD*100 100 - (-------------------) $AD + $MD This can also be expressed as:
$MD*100 ------------------- $AD + $MD
Where Markdown Dollars is calculated at the store level as for all stores that had a price reduction of at least 5% as follows: (Base Price – Promoted Price) * Unit Sales
Common Use(s) These measures are used to estimate the depth of
price reduction associated with the respective promotion type in the stores where the product was promoted in geographies that are not full causal releasable.
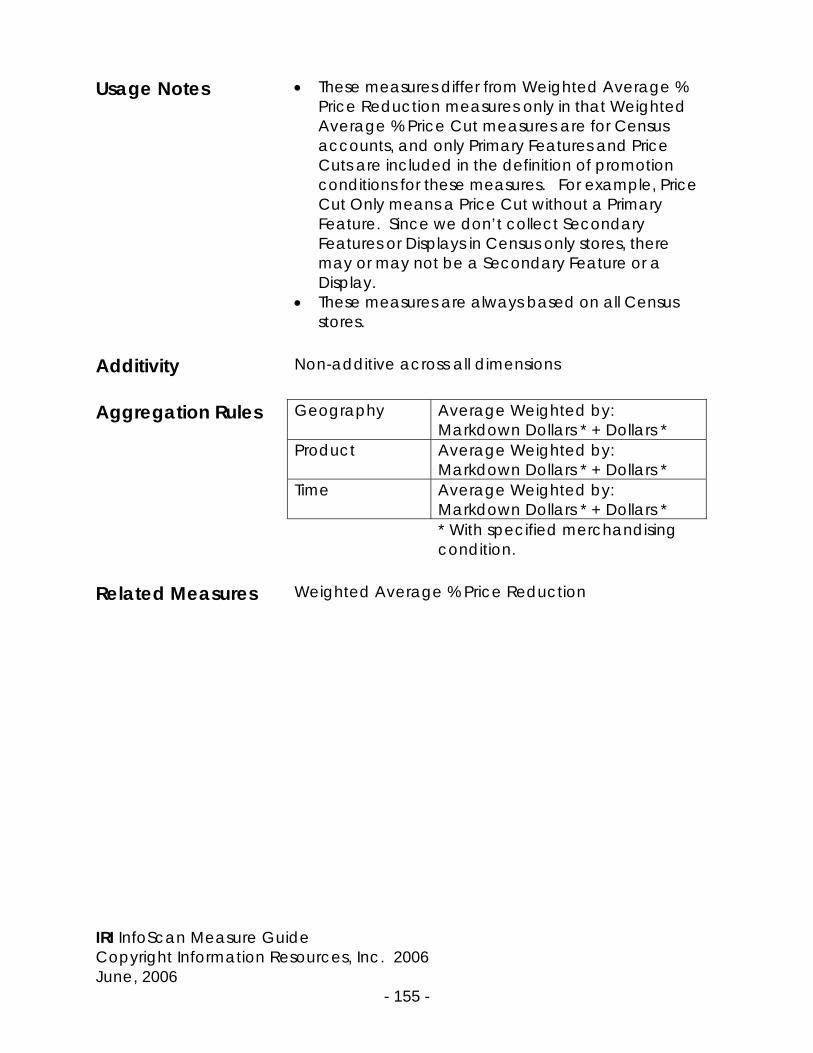
IRI InfoScan Measure Guide Copyright Information Resources, Inc. 2006 June, 2006
- 155 -
Usage Notes • These measures differ from Weighted Average % Price Reduction measures only in that Weighted Average % Price Cut measures are for Census accounts, and only Primary Features and Price Cuts are included in the definition of promotion conditions for these measures. For example, Price Cut Only means a Price Cut without a Primary Feature. Since we don’t collect Secondary Features or Displays in Census only stores, there may or may not be a Secondary Feature or a Display.
• These measures are always based on all Census stores.
Additivity Non-additive across all dimensions Aggregation Rules Geography Average Weighted by:
Markdown Dollars * + Dollars * Product Average Weighted by:
Markdown Dollars * + Dollars * Time Average Weighted by:
Markdown Dollars * + Dollars * * With specified merchandising
condition. Related Measures Weighted Average % Price Reduction

IRI InfoScan Measure Guide Copyright Information Resources, Inc. 2006 June, 2006
- 156 -
Measure Group Weighted Average % Price Reduction (Algorithm 045)
Measure Type Stored Definition These measures report the average price reduction
from base price under different merchandising conditions. They are weighted by Unit Sales all stores that had the merchandising condition present, regardless of whether there was a 5% Price Reduction.
Calculation These measures are calculated as follows:
Let: $MD = Markdown Dollars. $AD = Actual Dollar Sales during promotion. Weighted Average Percent Price Reduction equals:
$AD*100 100 - (-------------------) $AD + $MD This can also be expressed as:
$MD*100 ------------------- $AD + $MD
Where Markdown Dollars is calculated at the store level as for all stores that had a price reduction of at least 5% as follows: (Base Price – Promoted Price) * Unit Sales
Common Use(s) These measures estimate the depth of price
reduction associated with the respective promotion type in the stores where the product was promoted.
Usage Notes None

IRI InfoScan Measure Guide Copyright Information Resources, Inc. 2006 June, 2006
- 157 -
Additivity Non-additive across all dimensions Aggregation Rules Geography Average Weighted by:
Markdown Dollars * + Dollars * Product Average Weighted by:
Markdown Dollars * + Dollars * Time Average Weighted by:
Markdown Dollars * + Dollars * * With specified merchandising
condition. Related Measures Weighted Average % Price Cut
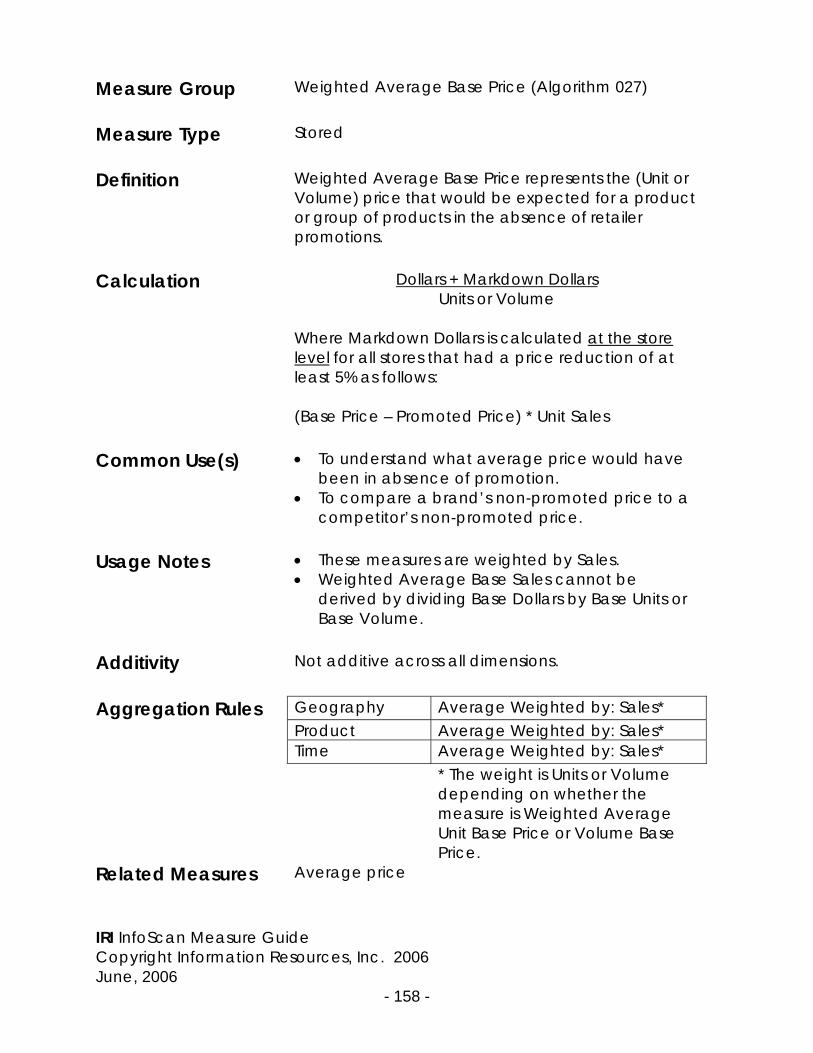
IRI InfoScan Measure Guide Copyright Information Resources, Inc. 2006 June, 2006
- 158 -
Measure Group Weighted Average Base Price (Algorithm 027) Measure Type Stored Definition Weighted Average Base Price represents the (Unit or
Volume) price that would be expected for a product or group of products in the absence of retailer promotions.
Calculation Dollars + Markdown Dollars
Units or Volume Where Markdown Dollars is calculated at the store level for all stores that had a price reduction of at least 5% as follows: (Base Price – Promoted Price) * Unit Sales
Common Use(s) • To understand what average price would have
been in absence of promotion. • To compare a brand’s non-promoted price to a
competitor’s non-promoted price. Usage Notes • These measures are weighted by Sales.
• Weighted Average Base Sales cannot be derived by dividing Base Dollars by Base Units or Base Volume.
Additivity Not additive across all dimensions. Aggregation Rules Geography Average Weighted by: Sales* Product Average Weighted by: Sales* Time Average Weighted by: Sales* * The weight is Units or Volume
depending on whether the measure is Weighted Average Unit Base Price or Volume Base Price.
Related Measures Average price