the international economy and the situation of emerging markets josé viñals banco de españa
TRANSCRIPT

The International Economy and the situation of Emerging Markets
José Viñals
Banco de España

2
Contents
A globalised, interdependent world.
The global economy: where is it and where is it going?
The economic situation in emerging markets.
Economic perspectives for emerging markets.

3
Aggregate Shares in World GDP Emerging markets gaining share in world output.Developing Asia is the biggest area by far, and increasing, thanks to push of China and, to a lesser extent, India
The World in areasShares in Aggregate World GDP, 2003
Percent of World GDP
Advanced economies 55.5
of which:
United States 21.1Euro area 15.9Japan 7.0Other advanced economies 11.6 of which:
Newly industrialized countries 3.3
Developing countries 44.5
of which
Africa 3.2Developing Asia 23.8 of which:
China 12.6 India 5.7Middle East and Europe 2.8Western Hemisphere 7.6Central and Eastern Europe 3.3Commomwealth of independent states 3.7
Source: IMF

4
The smaller share of the Western Hemisphere is not new and to some extent it is the outcome of a long downward trend in per
capita income coupled with the emergence of Asia.
DEVELOPING ECONOMIES: GDP PER CAPITA IN PPP(USA=100)
Soource: IMF (april 2000), Maddisson (1995) and WEO database.(a) South Korea and Taiwan up to 1992, adding Hong Kong and Singapore from 1992 onwards(b) Indonesia, Phillippines and Thailand up to 1992, adding Malaysia from 1992 onwards.(c) Eastern and Central Europe and Commonwealth of Independent States.
0
10
20
30
40
50
60
1900 1913 1938 1950 1973 1980 1985 1992 1998 1999 2000 2001 2002 2003 2004
0
10
20
30
40
50
60
Western Hemisphere
NICs (a)
ChinaNew NICs (b)
Transition countries (c)

5
A global, interdependent world
Links between advanced economies and emerging markets.• Financial channels (flows of capitals: increasing trend, volatile)
• Commercial channels (flows of trade; increasing, sustained trend, extending beyond tradables)
Link among emerging markets • Financial contagion
• Trade competition, integration…

The global economy.

7
The current recovery exhibits the following features:• Broadening and consolidation
• exception Euro area, but including, remarkably Japan
• Awareness of new global player: China
• Lack of inflation pressures
• Expansionary policies (sometimes in excess)
• Global imbalances non corrected in downturn
• Higher oil and commodities prices
• Ample liquidity in financial markets, caution in equites
The global economy: Where is it now?

8
Summary of World OutputReal GDP. Annual percent change
Summary of World OutputReal GDP. Annual percent growthAdvanced economies, recovery gaining strength
Source: IMF.
-2
-1
0
1
2
3
4
5
1995 1996 1997 1998 1999 2000 2001 2002 2003 2004
Advanced economies
United States
Japan
Euro area
Average 95-04
2,8
3,4
1,5
2,0
9
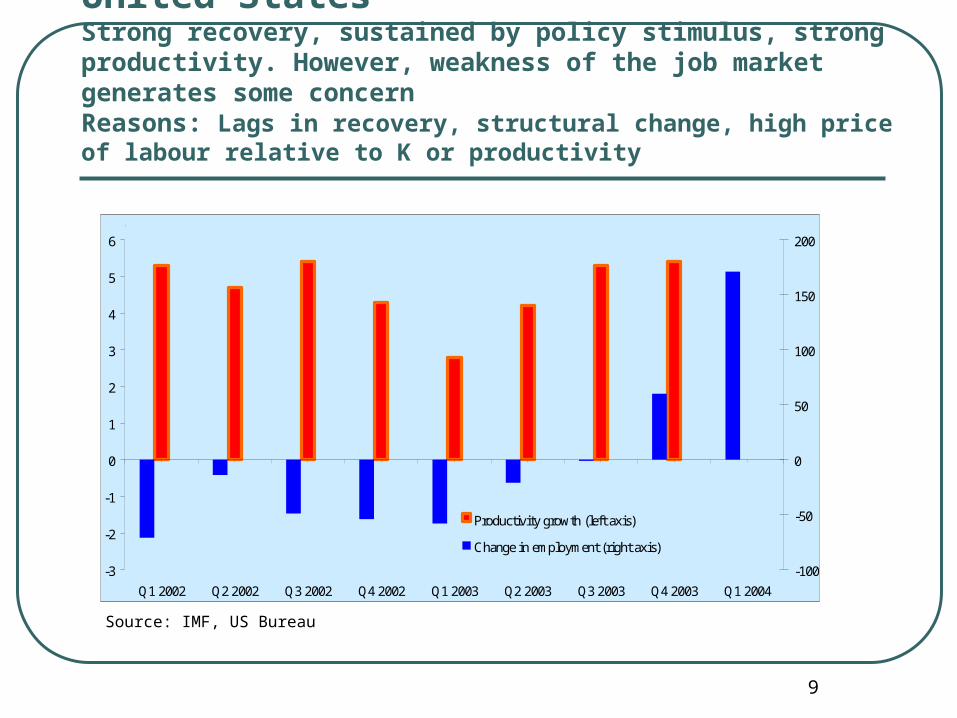
Source: IMF, US Bureau
United StatesStrong recovery, sustained by policy stimulus, strong productivity. However, weakness of the job market generates some concernReasons: Lags in recovery, structural change, high price of labour relative to K or productivity
NameCodeQ1 2002Q2 2002Q3 2002Q4 2002Q1 2003Q2 2003Q3 2003Q4 2003Q1 2004Q2 2004
promedio
-3
-2
-1
0
1
2
3
4
5
6
Q1 2002 Q2 2002 Q3 2002 Q4 2002 Q1 2003 Q2 2003 Q3 2003 Q4 2003 Q1 2004
-100
-50
0
50
100
150
200
Productivity growth (left axis)
Change in employment (right axis)
Average 2002-2003
%
4.7
-4.1
'000

10
United StatesGrowing fiscal and current account imbalances: Twin deficits
Source: IMF
-5
-4
-3
-2
-1
0
1
2
1995 1996 1997 1998 1999 2000 2001 2002 2003
-5
-4
-3
-2
-1
0
1
2General government fiscal balance
Balance of payments on Current Account
Average 1995-2003% %-1.3
-3.1
11
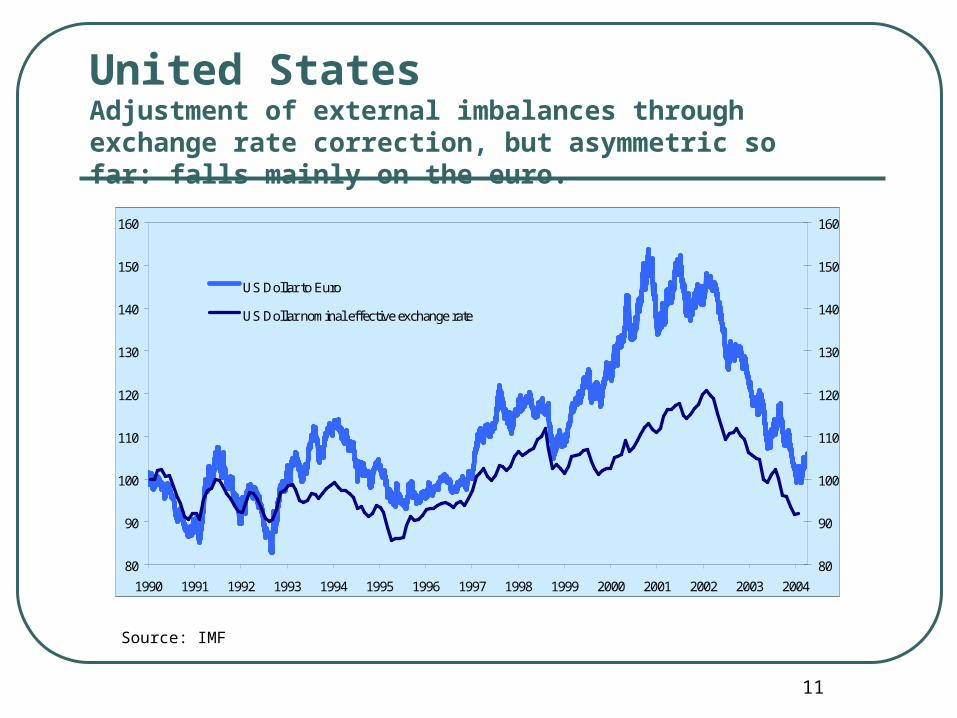
United StatesAdjustment of external imbalances through exchange rate correction, but asymmetric so far: falls mainly on the euro.
Source: IMF
NameCode
01/01/9002/01/9003/01/9004/01/9005/01/9008/01/9009/01/9010/01/9011/01/9012/01/9015/01/9016/01/9017/01/90
80
90
100
110
120
130
140
150
160
1990 1991 1992 1993 1994 1995 1996 1997 1998 1999 2000 2001 2002 2003 2004
80
90
100
110
120
130
140
150
160
US Dollar to Euro
US Dollar nominal effective exchange rate
1-ene-90 = 100

12
Financial developments
Extremely ample liquidity conditions, sustained by lack of inflationary pressures
Interest rates at record low levels, both in the short and long run
Certain anomaly at this phase of the cycle and given US expansionary fiscal stance. Explained by low inflation expectations (Fed stance) + Asian central banks
Equity markets recovery, after correction of overvaluation in past three years. • Caution remains, although higher appetite for risk is reflected in
evolution of high-yield and emerging markets bond markets

13
Source: Bloomberg
Main equity indexes
40
80
120
160
200
240
280
320
ene-98 jul-98 ene-99 jul-99 ene-00 jul-00 ene-01 jul-01 ene-02 jul-02 ene-03 jul-03 ene-04
40
80
120
160
200
240
280
320
NASDAQ COMPOSITE
S&P 500 COMPOSITEFTSE E300
NIKKEI225 STOCK
1-ene-1998 = 100 Max 1990-2004Date Level
24-mar-004-sep-00
319.2156.7
169.3255.0
10-mar-00
1-ene-90

14
Public and Corporate Bond Markets.For how long will low yields remain, and how sharply will they rebound?
Source: Bloomberg
2
4
6
8
10
12
02/04/2001 30/07/2002 26/11/2002 25/03/2003 22/07/2003 18/11/2003 16/03/2004
2
4
6
8
10
12Junk Bond
Corporate Bond AAA
Ten Year Treasury Bond

15
The global economy: where is it going in 2004?
Central scenario: • strengthening of recovery in 2004, stabilising in 2005
• World output forecasts: ’03:3,8; ’04:4,6%; ’05:4,4%
• Containment of inflationary pressures (doubts in some EMEs) Risks remain
• Economic factors: regionally unbalanced growth• US persistent imbalances, EU fragile recovery, Japan uncertainty,
Emerging markets underlying vulnerabilities
• …impinging on financial variables• Disorderly dollar adjustment, sudden peaking of interest rates
• Persistence of geopolitical uncertainty

The economic situation in emerging markets
17
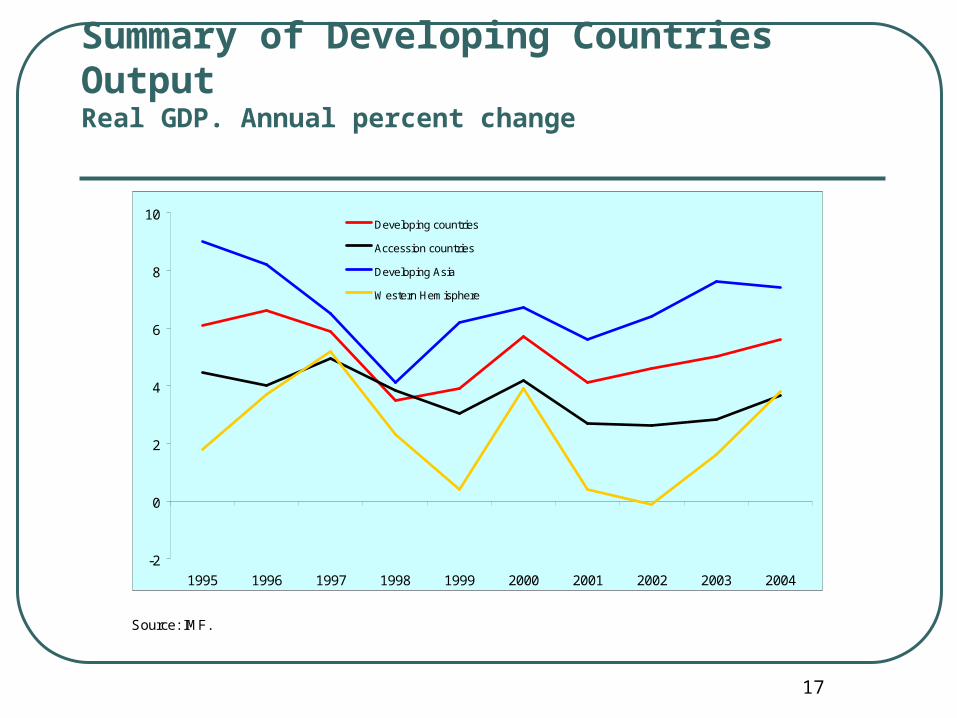
Summary of Developing Countries OutputReal GDP. Annual percent change
Source: IMF.
-2
0
2
4
6
8
10
1995 1996 1997 1998 1999 2000 2001 2002 2003 2004
Developing countries
Accession countries
Developing Asia
Western Hemisphere
Average 95-02
5,1
3,6
6,8
2,3
18
The situation in emerging markets
Economic growth in EMEs has been strong• EMEs output forecast: ’03:5,9; ’04:6,0%; ’05:5,9%
• NB: China systematically contributes to around 2.5 p.p (40%) to GDP growth
Pushed by external sectors: high global demand, recovery of commodity prices. • Protecting external competitiveness through exchange rate intervention
Recovery of financial flows, but remaining vulnerabilities Economic performance in the Western Hemisphere lags behind, due
to turbulences, already overcome

19
Developments in non Japan Asia
Highest growing region in the world (7,5% in 2003) Broadly based
• Domestic + external demand
• Most countries grow at over 4% China factor
• Strong domestic demand • risks of unbalanced growth, structural weaknesses
• Pulls external demand in rest of the regions
• OMC entry underpins export growth (4th largest world exporter) Importance of external sector robustness
• Underscored by proactive intervention policies• Reinforces global imbalances (asymmetric adjustment of dollar, demand of
US securities)
20
.
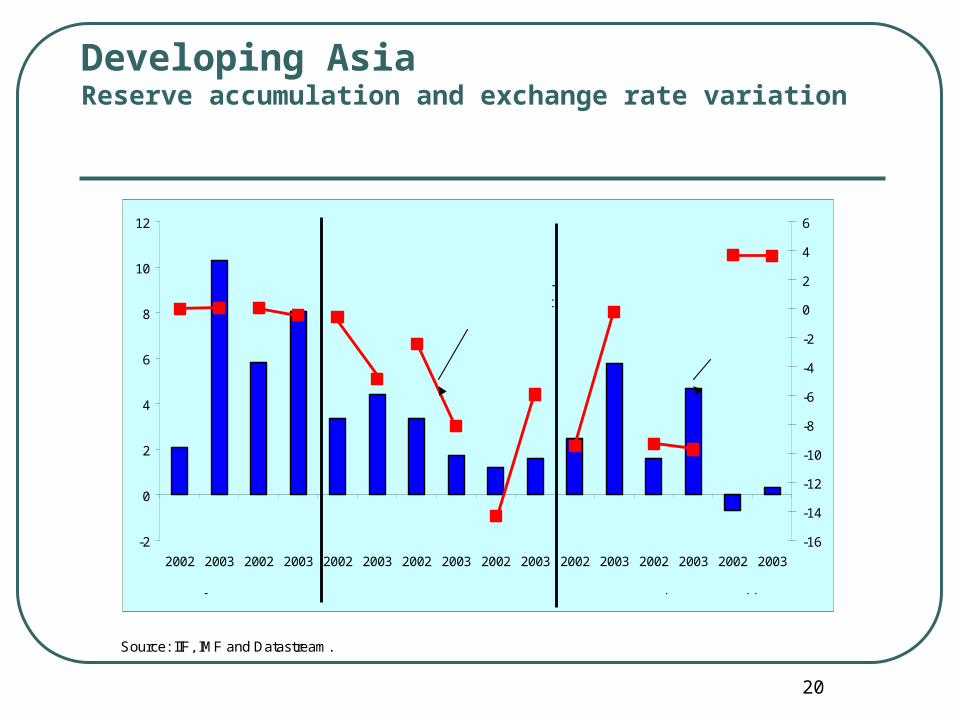
Developing AsiaReserve accumulation and exchange rate variation
Source: IIF, IMF and Datastream.
-2
0
2
4
6
8
10
12
2002 2003 2002 2003 2002 2003 2002 2003 2002 2003 2002 2003 2002 2003 2002 2003
-16
-14
-12
-10
-8
-6
-4
-2
0
2
4
6
Malaysia China India Thailand Indonesia South Korea
Japan Phillippines
FIXED REGIMES MANAGED FLOATING FLOATING REGIMES
Variation of international reserves (%
GDP) (left scale)
Exchange rate appreciation (-) or deppreciation (+) against
$ (right scale)

21
Developments in Central and Eastern European countries
Growth remains robust (4,1% in 2003) after resilience in past years. Strong domestic demand
Integration in the EU plays a key role as umbrella to the international environment
However, some relevant problems in terms of nominal convergence• Fiscal deterioration: increase in deficits plus deviations from targets
• Hungary, Check Republic,…higher than 6%
• Dilemma: expenditure control in the face of social demands
• Widening of current account deficits• Not alarming as long as supporting investment and productivity convergence
• But not always so, in particular, domestic demand
• Exchange rate pressures and inflation deterioration in certain countries Feasibility of smooth transition into EMU? Fast track vs Gradualism
22
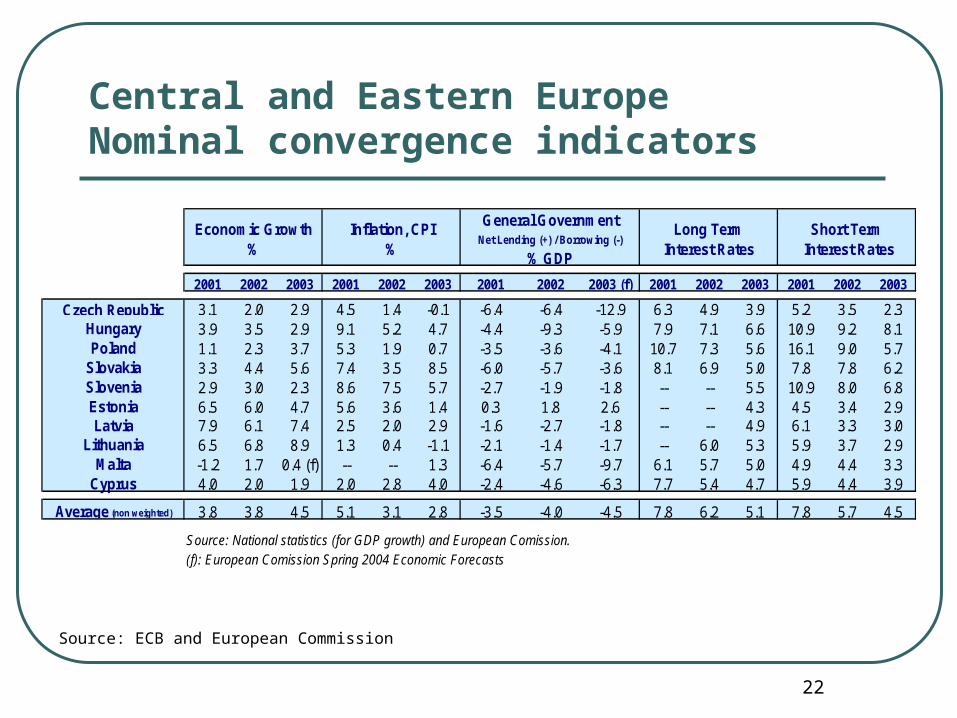
Source: ECB and European Commission
Central and Eastern EuropeNominal convergence indicators
Economic Growth%
Inflation, CPI%
General Government Net Lending (+) / Borrowing (-)
% GDP
Long Term Interest Rates
Short Term Interest Rates
2001 2002 2003 2001 2002 2003 2001 2002 2003 (f) 2001 2002 2003 2001 2002 2003
Czech Republic 3.1 2.0 2.9 4.5 1.4 -0.1 -6.4 -6.4 -12.9 6.3 4.9 3.9 5.2 3.5 2.3Hungary 3.9 3.5 2.9 9.1 5.2 4.7 -4.4 -9.3 -5.9 7.9 7.1 6.6 10.9 9.2 8.1Poland 1.1 2.3 3.7 5.3 1.9 0.7 -3.5 -3.6 -4.1 10.7 7.3 5.6 16.1 9.0 5.7
Slovakia 3.3 4.4 5.6 7.4 3.5 8.5 -6.0 -5.7 -3.6 8.1 6.9 5.0 7.8 7.8 6.2Slovenia 2.9 3.0 2.3 8.6 7.5 5.7 -2.7 -1.9 -1.8 -- -- 5.5 10.9 8.0 6.8Estonia 6.5 6.0 4.7 5.6 3.6 1.4 0.3 1.8 2.6 -- -- 4.3 4.5 3.4 2.9Latvia 7.9 6.1 7.4 2.5 2.0 2.9 -1.6 -2.7 -1.8 -- -- 4.9 6.1 3.3 3.0
Lithuania 6.5 6.8 8.9 1.3 0.4 -1.1 -2.1 -1.4 -1.7 -- 6.0 5.3 5.9 3.7 2.9Malta -1.2 1.7 0.4 (f) -- -- 1.3 -6.4 -5.7 -9.7 6.1 5.7 5.0 4.9 4.4 3.3
Cyprus 4.0 2.0 1.9 2.0 2.8 4.0 -2.4 -4.6 -6.3 7.7 5.4 4.7 5.9 4.4 3.9
Average (non weighted) 3.8 3.8 4.5 5.1 3.1 2.8 -3.5 -4.0 -4.5 7.8 6.2 5.1 7.8 5.7 4.5
Source: National statistics (for GDP growth) and European Comission.(f): European Comission Spring 2004 Economic Forecasts

23
Developments in Latin America Latin America is hardly recovering from economic turbulences in 2001
and 2002 Sharp improvement in financing conditions contrasts with delays in
growth reactivation• Burden of required adjustment after sudden stops
• Restrictive fiscal policies to recover confidence• Restrictive monetary policies to tame pass-through of large previous
depreciations
• Large deterioration of purchasing power of consumers (increase in unemployment, adjustment of real wages) hinders recovery
Vulnerability remains, mainly in the fiscal side • Increase in debt and sensibility to deterioration of financing costs• Fiscal discipline to stay
Reform fatigue and disenchantment• Challenges to economic policy.• NO shortcuts to growth, though

24
Summary of Latin American OutputReal GDP. Annual percent changeVolatility and divergence in cyclical position
Source: national statistics.
-30
-25
-20
-15
-10
-5
0
5
10
15
20
2001q1 2001q2 2001q3 2001q4 2002q1 2002q2 2002q3 2002q4 2003q1 2003q2 2003q3 2003q4
Argentina
Venezuela
Uruguay
Average 2001-2003
-2,2
-4,9
-3,8
-3
-2
-1
0
1
2
3
4
5
2001q1 2001q2 2001q3 2001q4 2002q1 2002q2 2002q3 2002q4 2003q1 2003q2 2003q3 2003q4
Mexico
Brazil
Latin America
Average 2001-2003
0,6
1,0
0,5
25
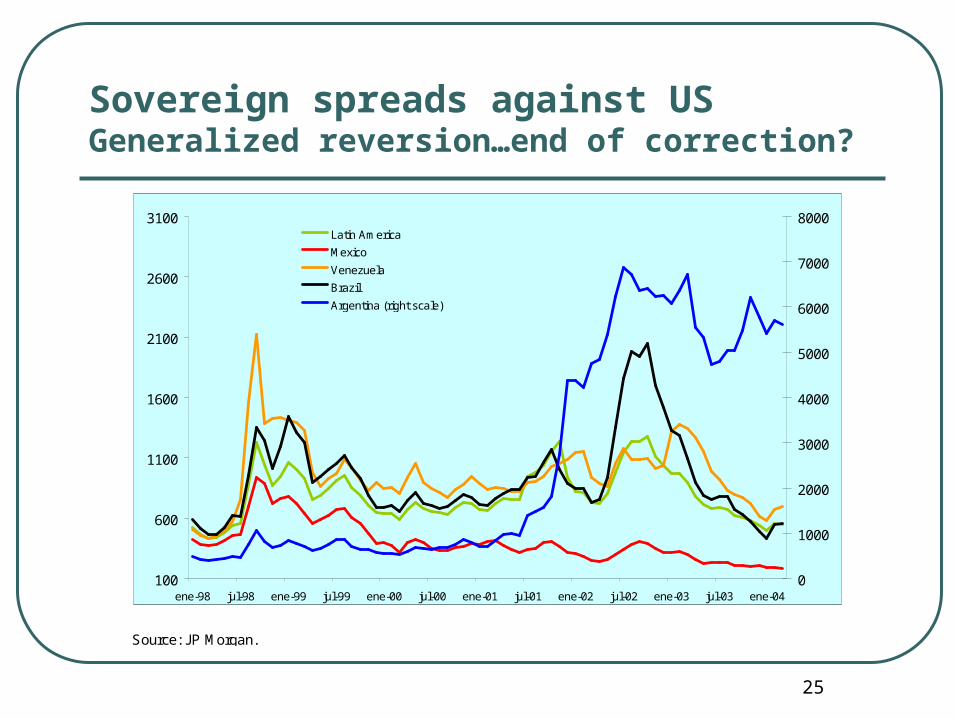
Sovereign spreads against USGeneralized reversion…end of correction?
Source: JP Morgan.
100
600
1100
1600
2100
2600
3100
ene-98 jul-98 ene-99 jul-99 ene-00 jul-00 ene-01 jul-01 ene-02 jul-02 ene-03 jul-03 ene-040
1000
2000
3000
4000
5000
6000
7000
8000Latin America
Mexico
Venezuela
Brazil
Argentina (right scale)

26
Public debt (% of GDP)Vulnerabilities remain. Debt dynamics cause of concern
Source: national statistics.
-25
-20
-15
-10
-5
0
5
10
15
20
25
BRAZIL ARGENTINA MEXICO VENEZUELA PERU CHILE LATINAMERICA
58,2
17,0
122,7
7,6
26,18,5
77,6
22,3
47,8
13,8
13,3 3,1
51,912,0
Change in public debt 2003/2002 (% GDP)
Change in interest payments 2003/2002 (% fiscal revenues)
Level of public debt (% GDP) and interest payments (% fiscal revenues) in 2003

Capital flows to emerging markets
28
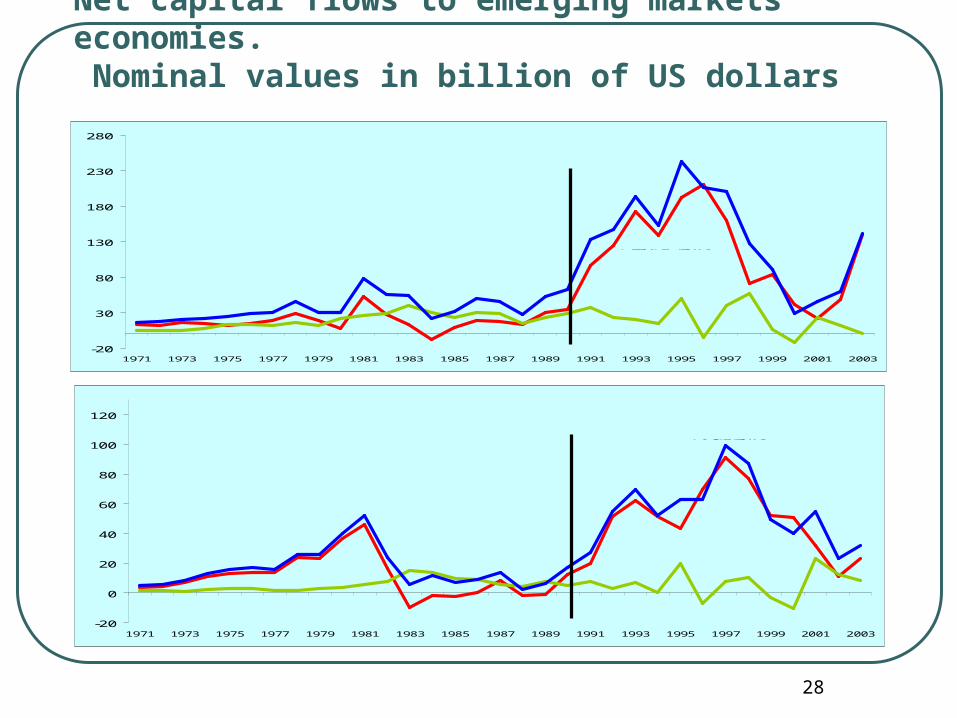
Source: own calculations from IMF's data ( WEO database september 2001
Net capital flows to emerging markets economies. Nominal values in billion of US dollars
-20
30
80
130
180
230
280
1971 1973 1975 1977 1979 1981 1983 1985 1987 1989 1991 1993 1995 1997 1999 2001 2003
Total flows
Private flows
Start of "globalisation"
Official flows
CAPITAL FLOWS TO EMERGING ECONOMIES: TOTAL
-20
0
20
40
60
80
100
120
1971 1973 1975 1977 1979 1981 1983 1985 1987 1989 1991 1993 1995 1997 1999 2001 2003
Total flows
Private flows
Start of "globalisation"
Official flows
CAPITAL FLOWS TO EMERGING ECONOMIES: WESTERN HEMISPHERE

29
Capital flows to emerging markets
Recovery of net capital inflows to levels prior to 1998, reaching 140 m.m.$ (vs. 60 m.m. in 2002)• Very favourable factors
• global recovery
• ample liquidity, larger appetite for risk in context of low returns in developed countries
• Overcoming of financial turbulences in some emerging markets
• China factor heavily weighs.
• Main target of FDI

30
Capital flows to emerging markets
Looking at the geographical composition: Non-Japan East AsiaNon-Japan East Asia: largest increase, from 6 m.m in 2001
to 85 m.m in 2003, due to reactivation of banking loans (95 m.m $)
Latin AmericaLatin America: remarkable recovery after overcoming turbulences, from 22,5 in 2002 to 31,6 in 2003, but far from levels prior to 1998. Mostly due to recovery of portfolio flows (bonds and equity) and supported by official flows
EU accession countriesEU accession countries: stability of capital flows 38 m.m.$. Pulling due to integration process might be petering out,a as reduction in FDI suggests

31
Capital flows to emerging markets
By components: Direct investmentDirect investment continues a smoothly declining trend,
but continues to be the main engine of inflows due to its resilience, averaging more than 150 m.m.$ since 1996
Cross-border banking flows Cross-border banking flows end their protracted retrenchment initiated after the Asian crises. It is precisely Asia which benefits most.
Porfolio flows , Porfolio flows , on the contrary, continue their retrenchment for the third consecutive year, due, again, to outflows from Asia.
Official flows Official flows are zero in net terms, due to offseting effects among regions. Africa and Latin America net recipients

32
Economic perspectives for emerging markets in 2004 Broad based recovery sustained by maintenance of favourable external
conditions Start of restrictive cycle of monetary policies risks having important effects
• But central scenario contemplates late and smooth tightening cycle Regional differentiation:
• Asia: autonomous recovery, but export led. China’s locomotive role and risks within
• Central and Eastern Europe: EU accesssion as some convergence indicators deteriorate
• Latin-America: recovery cycle based on maintenance of investor sentiment• Very favourable external position, price stability, fiscal discipline• Persistence of vulnerabilities• Domestic policies and reform require strenghtening in the face of disenchantment• Robust growth as diluter of problems….sustainable only with new leap in reforms