the interactions between xenobiotics and soil microbial
TRANSCRIPT

The Interactions Between Xenobiotics And
Soil Microbial Communities
by
Smriti Rayu
Hawkesbury Institute for the Environment
Western Sydney University, Australia
Thesis submitted: January 2016
A thesis submitted for fulfilment of the requirements of the degree of
Doctor of Philosophy

Dedication
I would like to dedicate my thesis to my beloved parents, Ashwani K Rayu and
Vijayanti Matas, who have taught me to work hard for the things that I aspire to
achieve. Thank you for your support along the way.

Acknowledgements
First and foremost I would like to thank my PhD supervisor, Prof. Brajesh Singh, for
encouraging my research and allowing me to grow as a research scientist. I
appreciate all his contributions of time, ideas and funding to make my PhD
experience productive. I am especially grateful to my associate supervisor, Uffe
Nielsen, for helping me develop confidence in statistics and for presentation of
scientific data. I would also like to thank my other associate supervisors, Nick
Coleman and Loic Nazaries, for their helpful advice and suggestions in general.
There is an endless list of people that have helped me along the way in my PhD.
Special thanks go to Akitomo Kawasaki and Nga Le for their help with setting up the
degradation and microresp experiments, Christopher Mitchell for his help with
HPLC and GC work, Marcus Klein and Vu Le for technical support, and Hang-Wei
Hu for showing me how to perform SIP analysis. Next I would like to thank Pankaj
Trivedi for his scientific advice and knowledge and many insightful discussions and
suggestions.
Thank you to G.R.Tucker (Nufarm, Australia) for his assistance with obtaining soil
samples from Australian sugarcane farms. To Nick Coleman, for providing soil
samples from Botany Industrial Park (Sydney). To Caroline Janitz (and team), for
performing shotgun sequencing on my soil samples. My gratitude is also extended to
Thomas Jeffries, for the speedy shotgun sequencing data analysis. I also thank Gavin
McKenzie for all the administrative help and Jasmine Grinyer for her support in
various aspects of experimental and paperwork. Thank you Jasmine for your friendly
advice and support. I express my sincere thanks to my colleagues (Federica,
Catarina, Guomin and Kylie) and other lab-mates for providing support and timely
help.
A special thanks to my parents for their unconditional love and encouragement. To
my sister, Aroop for all the emotional support and laugh. Last but not the least, my
husband Anup, for his endless support and patience. Thank you for keeping up with
my ‘PhD mood swings’!

Statement of Authentication
The work presented in this thesis is, to the best of my knowledge and belief, original
except as acknowledged in the text. It contains no material previously published or
written by another person. I hereby declare that I have not submitted this material,
either in full or in part, for a degree at this or any other institute.
Signed
Smriti Rayu
Date

Table of Contents
Table of Contents .......................................................................................................... i
List of Tables............................................................................................................... iii
List of Figures .............................................................................................................. v
List of Abbreviations................................................................................................... xi
Abstract ...................................................................................................................... xv
Chapter 1: General Introduction .............................................................................. 1
1.1 Xenobiotics and soil microbial communities ................................................ 1
1.2 Influence of xenobiotics on soil microbial communities ............................ 12
1.3 Transformation of xenobiotics by soil microbial communities ................... 16
1.4 Methods to determine impacts of xenobiotics on soil microbial communities ……... ..................................................................................................................... 36
1.5 Knowledge gaps .......................................................................................... 40
1.6 Aims and objectives .................................................................................... 42
Chapter 2: Characterisation of active methanotrophs involved in the methane-assisted biodegradation of trichloroethene (TCE) in three Australian soils .............. 46
2.1 Introduction ................................................................................................. 46
2.2 Materials and methods ................................................................................. 51
2.3 Results ......................................................................................................... 65
2.4 Discussion ................................................................................................... 81
2.5 Conclusion ................................................................................................... 90
Chapter 3: Effects of chlorpyrifos (CP) and imidacloprid (IC) on soil bacterial community composition ............................................................................................. 91
3.1 Introduction ................................................................................................. 91
3.2 Materials and methods ................................................................................. 96
3.3 Results ....................................................................................................... 107
3.4 Discussion ................................................................................................. 128
3.5 Conclusion ................................................................................................. 136
Chapter 4: Isolation and molecular characterisation of chlorpyrifos (CP) and 3,5,6-trichloro-2-pyridinol degrading (TCP) degrading bacteria from Australian sugarcane farm soils…… .......................................................................................................... 137
4.1 Introduction ............................................................................................... 137
i

4.2 Material and methods ................................................................................ 142
4.3 Results ....................................................................................................... 150
4.4 Discussion ................................................................................................. 163
4.5 Conclusion ................................................................................................. 173
Chapter 5: Impact of pesticides on soil microbial community structure and functional capabilities .............................................................................................. 174
5.1 Introduction ............................................................................................... 174
5.2 Materials and method ................................................................................ 178
5.3 Results ....................................................................................................... 182
5.4 Discussion ................................................................................................. 201
5.5 Conclusion ................................................................................................. 210
Chapter 6: Final conclusion and future work ....................................................... 212
6.1 Conclusion ................................................................................................. 212
6.2 Future work ............................................................................................... 216
Appendix A. ............................................................................................................. 218
References ................................................................................................................ 235
ii

List of Tables
Table 1-1 Physical and chemical properties of TCE. ................................................... 5
Table 1-2 Physical and chemical properties of chlorpyrifos (CP) and imidacloprid
(IC). ............................................................................................................................ 12
Table 1-3 List of microorganisms involved in aerobic and anaerobic degradation of
TCE ............................................................................................................................ 23
Table 1-4 General characteristics of aerobic methanotrophic bacteria. ..................... 26
Table 2-1 PCR and sequencing primers used in this study ........................................ 58
Table 2-2 Selected soil properties of the soils from Sydney University (SU), Victoria
Park (VP) and Botany Industrial Park (BI) ................................................................ 66
Table 2-3 Relative abundances of T-RFs (%) produced after digestion of the pmoA
and 16S rRNA genes for Sydney University (SU), Victoria Park (VP) and Botany
Industrial (BI) park soils.. .......................................................................................... 74
Table 2-4 PERMANOVA table of results for the T-RFLP data versus different
factors and their interactions. ..................................................................................... 75
Table 3-1 Pesticide history of five sugarcane farms in Queensland used in this study
.................................................................................................................................... 98
Table 3-2 Soil properties measured for all the five sites (sugarcane farms). ........... 107
Table 3-3 Kinetics data of the two pesticides (CP/ IC) in five different sites. ........ 111
Table 3-4 Kinetics data of the two pesticides (CP/ IC) in five different sites. ........ 112
iii

Table 3-5 Results of the univariate analysis for basal and substrate induced
respiration after 45d CP and 43d IC treatment......................................................... 114
Table 3-6 Results of the univariate analysis for diversity indices and abundances
after CP treatment for 105 days.. ............................................................................. 119
Table 3-7 Results of the univariate analysis for diversity indices and abundances
after IC treatment for 102 days.. .............................................................................. 123
Table 5-1 Summary of metagenomes (bp) obtained across sites ............................. 183
Table 5-2 Summary of the features that were annotated by the different databases
across sites ................................................................................................................ 184
Table 5-3 Average relative frequency of top 25% bacterial genera in pesticide-treated
and non-treated sites.. ............................................................................................... 188
Table 5-4 Phosphorus metabolism associated genes (at level 3) contributing to the
dissimilarity of pesticide-treated and non-treated sites metagenomes. .................... 195
APPENDIX
Chapter 5 Table A-1 Summary of metagenomic data (bp) obtained across sites from
each replicate. ........................................................................................................... 230
Chapter 5 Table A-2 Summary of number of features that were annotated by the
different databases across sites from each replicate. ................................................ 233
iv

List of Figures
Figure 1-1 Chemical structure of a representative of the three classes of chlorinated
organic compounds ...................................................................................................... 4
Figure 1-2 World-wide proportion of each class of pesticides used. ........................... 8
Figure 1-3 Chemical structure of chlorpyrifos (CP) and imidacloprid (IC) .............. 12
Figure 1-4 Flow-diagram outlining the main degradation mechanisms in microbe-
assisted biodegradation. ............................................................................................. 18
Figure 1-5 Anaerobic degradation pathways for trichloroethylene. .......................... 22
Figure 1-6 Aerobic oxidation of methane. ................................................................. 25
Figure 1-7 Proposed mechanism for TCE co-metabolism by methane
monooxygenase (MMO). ........................................................................................... 27
Figure 1-8 Proposed pathways for degradation of chlorpyrifos (CP) by
microorganisms.. ........................................................................................................ 34
Figure 1-9 Proposed metabolic pathway for transformation of imidacloprid in
Pseudomonas sp.1G.. ................................................................................................. 35
Figure 1-10 Schematic diagram of approaches used to achieve aims of the project
(Chapter 3-5). ............................................................................................................. 45
Figure 2-1 Methane (CH4) oxidation by enriched methanotrophic consortia from
different soils in nitrate mineral salt (NMS) liquid media over time. ........................ 65
Figure 2-2 Methane oxidation (33%), TCE degradation and corresponding growth of
mixed cultures from three Australian soils ................................................................ 68
v

Figure 2-3 Methane (CH4) oxidation (1%), TCE degradation and corresponding
growth of mixed cultures from three Australian soils ................................................ 69
Figure 2-4 TCE degradation by the methanotrophic consortium from Sydney
University (SU) soil at 10% methane (CH4) concentration ....................................... 70
Figure 2-5 Distribution of the relative abundance of pmoA gene in CsCl gradient for
13CH4 and 12CH4 treatments during DNA-SIP microcosm of mixed cultures from
three selected Australian soils .................................................................................... 72
Figure 2-6 2-D MDS ordination of pmoA-based methanotrophic community structure
obtained for different site-enrichment combinations ................................................. 76
Figure 2-7 2-D MDS ordination of 16S rRNA-based methanotrophic community
structure obtained for different site-enrichment combinations .................................. 77
Figure 2-8 Maximum likelihood phylogenetic tree representing pmoA gene
sequences derived from the 13C fractions of mixed methanotrophic cultures from the
SU soil. ....................................................................................................................... 80
Figure 3-1 A schematic diagram of sampling pattern for each sugarcane farm site.. 97
Figure 3-2 Degradation of chlorpyrifos (CP) in the different sites (soils) after three
repeated applications (10 mg/kg). ............................................................................ 108
Figure 3-3 Degradation of imidacloprid (IC) in the different sites (soils) after three
repeated applications (10 mg/kg). ............................................................................ 109
Figure 3-4 Microbial respiration in soil samples after lab pesticide treatment ........ 113
Figure 3-5 Bacterial 16S rRNA gene copies g-1 soils amended with pesticide CP in
the lab. ...................................................................................................................... 116
vi

Figure 3-6 Bacterial 16S rRNA gene copies g-1 soils amended with pesticide IC in
the lab. ...................................................................................................................... 117
Figure 3-7 Results of the T-RFLP analysis showing effect of chlorpyrifos (CP) on a)
Simpson’s diversity, b) Richness and c) Evenness .................................................. 119
Figure 3-8 MDS ordination of bacterial community structure grouped on site, past
pesticide and chlorpyrifos (CP) lab treatment. ......................................................... 122
Figure 3-9 Results of the T-RFLP analysis showing effect of imidacloprid (IC) on a)
Simpson’s diversity, b) Richness and c) Evenness .................................................. 124
Figure 3-10 MDS ordination of bacterial community structure grouped on site, past
pesticide and imidacloprid (IC) lab treatment .......................................................... 125
Figure 3-11 Linear regression of natural log transformed microbial respiration (basal
and SIR) and community structure (MDS axis 1) .................................................... 127
Figure 4-1 Degradation of chlorpyrifos (CP) and production of TCP inoculated with
bacterial communities .............................................................................................. 152
Figure 4-2 Maximum likelihood tree showing the phylogenetic relationship between
all six isolates (in bold) and related species based on the 16S rRNA gene sequences
.................................................................................................................................. 155
Figure 4-3 Degradation of CP (%) and production of TCP (ppm) by Xanthomonas sp.
4R3-M1, Rhizobium sp. 4H1-M1 and Pseudomonas sp. 4H1-M3 in different media
.................................................................................................................................. 158
Figure 4-4 Degradation of CP (%) and production of TCP (ppm) by Xanthomonas sp.
4R3-M1and Pseudomonas sp. 4H1-M3 in MSM (-N+P-C). ................................... 159
vii

Figure 4-5 Degradation of TCP (%) and corresponding growth (OD600) of
Xanthomonas sp. 4R3-M1, Rhizobium sp. 4H1-M1and Pseudomonas sp. 4H1-M3 in
different media.. ....................................................................................................... 161
Figure 4-6 Degradation of TCP (%) and corresponding OD600 of Xanthomonas sp.
4R3-M1and Pseudomonas sp. 4H1-M3 in MSM (-N+P-C). ................................... 162
Figure 5-1 MDS ordination of bacterial community structure in pesticide-treated and
non-treated sites. ...................................................................................................... 185
Figure 5-2 Difference in alpha diversity levels between pesticide-treated and non-
treated sites. .............................................................................................................. 187
Figure 5-3 Taxa enriched or depleted in pesticide-treated (R) and non-treated (H)
sites at genus level of MG-RAST taxonomic hierarchy.. ........................................ 189
Figure 5-4 MDS ordination of the metabolic gene abundance profile, based on
metagenomic metabolic processes data (at hierarchical level 2), in pesticide-treated
and non-treated sites. ................................................................................................ 190
Figure 5-5 Metabolic processes over-and under-represented in pesticide-treated
metagenomes relative to the non-treated metagenomes ........................................... 192
Figure 5-6 Box plot showing the distribution in the proportion of phosphorus
metabolism sequences assigned to samples from pesticide-treated and non-treated
sites. .......................................................................................................................... 194
Figure 5-7 Metabolic processes over- and under-represented within site 5 in
pesticide-treated (5R) metagenomes relative to the non-treated metagenomes (5H) at
metabolic hierarchical level 2. ................................................................................. 197
viii

Figure 5-8 Box plot showing the distribution in the proportion of phosphorus
metabolism sequences assigned to samples from 5H and 5R. ................................. 199
Figure 5-9 Box plot showing the distribution in the proportion of phosphorus
metabolism sequences assigned to samples from 4H and 4R .................................. 200
APPENDIX
Chapter 2 Figure A-1 Activity of methanotrophic mixed culture in Sydney University
(SU) soil under 33% methane concentration. .......................................................... 218
Chapter 3 Figure A-2 Simpson’s diversity in soils amended with pesticide CP in the
lab ............................................................................................................................. 219
Chapter 3 Figure A-3 Bacterial richness in soils amended with pesticide CP in the lab
.................................................................................................................................. 220
Chapter 3 Figure A-4 Bacterial evenness in soils amended with pesticide CP in the
lab ............................................................................................................................. 221
Chapter 3 Figure A-5 Simpson’s diversity in soils amended with pesticide IC in the
lab ............................................................................................................................. 222
Chapter 3 Figure A-6 Bacterial richness in soils amended with pesticide IC in the lab
.................................................................................................................................. 223
Chapter 3 Figure A-7 Bacterial evenness in soils amended with pesticide IC in the
lab ............................................................................................................................. 224
Chapter 4 Figure A-8 Degradation of chlorpyrifos (CP) in MSM+N (without
vitamins) when inoculated with six bacterial isolates.. ............................................ 225
ix

Chapter 4 Figure A-9 Bacterial growth, degradation of CP (%) and production of
TCP (ppm) in soil extract media (SEM) .................................................................. 226
Chapter 4 Figure A-10 Bacterial growth and degradation of TCP in SEM ............. 228
Chapter 5 Figure A-11 Relative abundances of sequences across all sites .............. 229
x

List of Abbreviations
%- Percent
μ- Micro
µl- Microliter
μM- Micrometer
12C-DNA- Unlabelled DNA
13C- Labelled carbon
13C-DNA- Labelled DNA
13CH4- Labelled Methane
16S rRNA- 16S ribosomal ribonucleic acid
AChE- Acetylcholine esterase
ANOSIM- Analysis of similarities
ANOVA-Analysis of variance
APVMA- Australian Pesticides and Veterinary Medicines Authority
ATP- Adenosine triphosphate
BI- Botany Industrial Park
BLAST- Basic local alignment search tool
bp- Base pair
BSA- Bovine serum albumin
C- Carbon
CH4- Methane
ChE- Cholinesterase
CHN analyser- Carbon, Hydrogen, Nitrogen analyser
CO2- Carbon dioxide
CP- Chlorpyrifos
CsCl- Cesium Chloride
xi

DCE- Dichloroethylene
DGGE- Denaturing Gradient Gel Electrophoresis
Diss/SD- Dissimilarity/standard
DNA- Deoxyribonucleic acid
DNA-SIP- Deoxyribonucleic acid stable isotope probing
dNTPs- Deoxynucleoside triphosphate
EtOH- Ethyl alcohol
FID- Flame Ionization Detector
g- Gram
GC- Gas chromatograph
GTA- Gene transfer agents
HPLC- High-performance liquid chromatography
IC- Imidacloprid
k- Degradation rate constant
K2+G- Kimura-2-parameter model with Gamma distribution
kg- Kilogram
kg/ha- kilogram per hectare
LB agar- Luria broth agar
MDS analysis- Multidimensional scaling analysis
MEGA- Molecular Evolutionary Genetics Analysis
ml- Milliliter
mm- Millimeter
mM- Millimolar
MMO- Methane monooxygenase
MOPS- 3-(N-morpholino)propanesulfonic acid
MQ- Milli-Q
MSM- Mineral salt medium
xii

N- Nitrogen
nACh- Nicotinic acethylcholine
NCBI- National Center for Biotechnology Information
nm- Nanometer
NMS- Nitrate mineral salt
oC- Degree Celsius
OD600- Optical density
OP- Organophosphorus
OTUs- Operational taxonomic units
OTUs- Operational Taxonomic Units
P- Phosphorus
PAHs- Poly aromatic hydrocarbons
PCB- Polychlorinated biphenyl
PCR- Polymerase chain reaction
PERMANOVA- Permutational multivariate ANOVA
pH- Potential of hydrogen
PLFA- Phospholipid fatty acid analysis
PLFA-SIP- phospholipid fatty acids stable isotope probing
pMMO- particulate MMO
pmoA- gene for alpha subunit of the pMMO
pmol- Picomoles
QC- Quality control
q-PCR- Quantitative polymerase chain reaction
RT – Room temperature
SEM- Soil extract medium
SIMPER- Similarity percentage
SIP- Stable isotope probing
xiii

SIR- Substrate induced respiration
sMMO- soluble MMO
SOM- Soil organic matter
STAMP- Statistical Analysis of Metagenomic Profiles
SU- Sydney University
t1/2- Half-life
TBP- 2,4,6-tribromophenol
TCE- Trichloroethene
TCP- 3,5,6-trichloro-2-pyridinol
T-RFLP- Terminal Restriction Fragment Length Polymorphism
T-RFs- Terminal restriction fragments
US EPA- US Environmental Protection Agency
VP- Victoria Park
xiv

Abstract
Excessive use and lack of appropriate disposal technology for industrial xenobiotics
have resulted in the contamination of ecosystems globally impacting the self-
regulating capacity of the biosphere. This often results in irreversible alterations of
ecosystem’s structure and function, but the outcomes of these events on soil
microbial communities (and their functional capabilities) are poorly understood.
Assessing the impact of xenobiotics on soil microbial communities is of paramount
importance as they play a vital role in ecosystem services and maintain soil health,
which are key requirements for sustainable land use in terms of food security and
environmental sustainability. Bacteria are the most abundant and diverse soil micro-
flora and play a key role in the biogeochemical cycles of important elements
including carbon (C), nitrogen (N), and phosphorus (P) and sulphur (S). The current
work aimed to unravel the two-way interactions between xenobiotics and soil
microbial communities; i.e., how soil microbial communities modulate xenobiotic
persistence through biodegradation and what impacts xenobiotic have on soil
microbial community’s structure and functions, with particular focus on widely used
pesticides (chlorpyrifos and imidacloprid) and industrial solvents (trichloroethene)
In Chapter 2, characterisation of active methanotrophs involved in trichloroethene
(TCE) degradation under different methane (CH4) concentrations was evaluated.
Methane (CH4) enriched methanotrophic consortia from three Australian soils
(Sydney University, Victoria Park and Botany Industrial Park) were examined for
their effectiveness in TCE (50µM) degradation at 1%, 10% and 33% CH4
concentration at 20oC. Only the methanotrophic consortium from Sydney University
(SU) soil was able to co-metabolically degrade TCE. The (SU) methanotrophic
xv

growth and TCE degradation was accelerated under high CH4 concentration
degrading up to 30% (within 2 days) and 20% (within 5 days) TCE under 33% and
10% CH4, respectively. No degradation of TCE was observed at 1% CH4
concentration or in the absence of CH4 suggesting the dependence on relatively high
CH4 availability for TCE degradation. pmoA-based stable isotope probing (SIP),
terminal restriction fragment length polymorphism (T-RFLP), clone library
construction and sequencing of TCE degrading SU methanotroph consortium
revealed the dominance of novel uncultivable Type I methanotrophs (distantly
related to Methylovulum-88%) belonging to TRF-53 in TCE degradation.
In Chapter 3, the effects of the pesticides chlorpyrifos (CP) and imidacloprid (IC)
on soil microbial processes (e.g. biodegradation and respiration) and community
structure were evaluated. Two soil treatments (from five sugarcane farms), one with
no history of pesticide application (non-treated; 1H, 2H, 3H, 4H and 5H) and the
other with ~20 years pesticide application (pesticide-treated; 1R, 2R, 3R, 4R and
5R), were used in this study. MicroRespTM, q-PCR and T-RFLP analyses were
combined to explore the relationship between pesticide degradation and soil
microbial communities in soils spiked (3 times) with 10 mg/kg of CP or IC, under
lab conditions. The results showed that the half-lives of CP decreased with
application frequency and were 23-47, 8-20 and 3-17 days following the first, second
and third application, respectively (for soils from five sugarcane farms). In particular,
the soils from 4R, 4H and 5R showed enhanced CP degradation even when not
exposed to CP for last 13 years due to legacy effect of the pesticide. Parallel analyses
of IC degradation (10 mg/kg) showed high persistence of this pesticide in soil where
repeated application increased half-lives from 30-60 days for the first treatment to
45-65 days for second treatment. The application of both pesticides (CP and IC)
xvi

reduced soil respiration (basal and substrate-induced) between 7-76% with the lowest
respiration found in 5R and highest in 1R after the pesticides treatment, indicating
that application of pesticides had an adverse impact on soil functional activity. The
molecular analyses showed that both CP and IC significantly altered the soil bacterial
community structure and reduced diversity, evenness and richness.
In Chapter 4, sequential soil and liquid culture enrichments enabled the isolation of
six bacterial CP degraders with sequence homologies to Xanthomonas sp. (3),
Pseudomonas sp. (1), Rhizobium sp. (1) and Lysobacter sp. (1). The efficacy of the
isolated strains: Xanthomonas sp. 4R3-M1, Pseudomonas sp. 4H1-M3 and
Rhizobium sp. 4H1-M1 were further investigated for biodegradation of CP and its
primary metabolic product, TCP (3,5,6-trichloro-2-pyridinol). The results indicated
that all three bacterial strains utilised CP (10 mg/l) and TCP (as CP degradation
product) in mineral salt media (MSM) as a sole source of C and N. Bacterial strains
Xanthomonas sp. 4R3-M1 and Pseudomonas sp. 4H1-M3 could also degrade 10 mg/l
TCP as a sole C- and N-source, when provided externally. Thus, these bacterial
strains promise to be effective in practical application of bioremediation of both CP
and TCP.
In Chapter 5, using next-generation sequencing, the structure and potential functions
of bacterial communities in pesticide-treated and non-treated reference sites was
compared at finer levels. Across all soils, the functional beta diversity was correlated
with taxonomic diversity indicating possible linkages between the structure and
functioning of soil microbial communities. The pesticide-treated sites had higher
relative abundance of Proteobacteria and Bacteroidetes, with Archaea exhibiting the
opposite pattern. Metagenomic analysis revealed increases in the relative abundance
of genes associated with key specialised functions (iron acquisition and metabolism,
xvii

motility, cell signalling, stress response) at pesticide-treated sites. The results
suggested impacts of long-term pesticide application on soil microbial community
composition and potential functions. Despite, a CP legacy effect, no marked
difference was observed in abundance of genes related to P-metabolism between
pesticide-treated and non-treated sites. Overall, the results supported taxonomic and
functional adaptations in the soil microbial communities following pesticide
treatment.
Overall, this study provides the novel insights into the interaction between
xenobiotics and soil microbial communities both at structural (diversity, community
structure) and functional (degradation) levels and should be considered in developing
new bioremediation technologies and agronomic practices such as number and
frequency of pesticide applications.
xviii

Chapter 1: General Introduction
1.1 Xenobiotics and soil microbial communities
A vast number of pollutants are disposed into the environment every year due to
anthropogenic activities and the number is still increasing rapidly. Industrial and
agricultural activities can require the intensive use of organic (nitro-aromatic,
organochlorine, organophosphorus), inorganic (e.g. arsenic, mercury) and radioactive
compounds (e.g. uranium) (Ecobichon, 2001, Bleise et al., 2003, Pirrone et al.,
2010). A combination of extensive use and indiscriminate release of xenobiotics of
different chemical structure and complexity into the environment cause substantial
ecosystem stress (Sen and Chakrabarti, 2009). The presence of the compounds that
are resistance to degradation are of concern because of their toxicity and
biomagnification via the food web (Davies et al., 2006, Sharma et al., 2009,
Takeuchi et al., 2009), and the need for decontamination of such compounds has
been therefore highlighted (Singh and Naidu, 2012).
Soils are increasingly under environmental pressure from pollution and intensified
agricultural management practices, leading to the biotic and abiotic stress on the soil
microbial communities (Creamer et al., 2010). Understanding microbial ecology is
important because soil microorganisms play a critical role in soil functioning, soil
health restoration, maintenance of basic resources for food production and terrestrial
biodiversity maintenance. In the context of soil contamination, they play a crucial
role in metabolising recalcitrant xenobiotic compounds (e.g. pesticides) and thus are
essential in global processes contributing to the health and life cycles of plants and
animals. In addition to this, microorganisms also play essential roles in
1

biogeochemical cycles (e.g. carbon and nitrogen) and any changes in their
community composition or activities may affect the availability of essential nutrients,
thus affecting soil functions (Gianfreda and Rao, 2008, Grenni, 2011). For example,
soil microorganisms make a valuable contribution to maintaining soil fertility
through their catabolic role in degradation of plant and animal residues, recycling of
soil nutrients and breakdown of a number of organic and inorganic molecules.
When xenobiotics are released into soils they can interact with natural environment
(abiotic) or living organisms (biotic) in two ways:
a) Transfer of xenobiotics without alteration of their structure, by runoff,
diffusion, adsorption etc. Of these, adsorption/desorption mechanisms are
critically important as this interaction depends on the chemical properties of
the xenobiotic, strongly influencing the movement of xenobiotics, their
availability for uptake and transformation by microbial and impact on other
soil processes.
b) Degradation of xenobiotics through abiotic (physical, photochemical and
chemical) and biological transformation (plants and microorganisms), via
enzymes, where the chemical structure of the compound is transformed.
Xenobiotic-induced stress is thought to affect the dynamics of the soil microbes
(genomic stability, physical distribution or community composition and diversity)
by: a) an extinction response where the sensitive microbial population is eliminated
from the system and b) development of the microbial communities with innate
capabilities to resist pollution and for direct utilisation of the compound for energy
and nutrients (biodegradation) (Giller et al., 1998, Gianfreda and Rao, 2008).
Particular attention in this thesis is given to organophosphorus (OP) pesticides (e.g.
2

chlorpyrifos (CP)), neonicotinoids (e.g. imidacloprid (IC)) and OC compounds (e.g.
TCE) because they are among the most widely used classes of chemicals in
agriculture and/or chemical manufacturing industries (Whitacre and Gunther, 2012).
Pesticides enter the soil system mainly through their application in agricultural and
horticultural systems for management of pests (for increasing productivity) and
disease vector control (e.g. mosquitoes), wash-off manufacturing waste and
accidental spillage into the soil. Similarly, organochlorine (OC) compounds, such as,
trichloroethene (TCE), enter the soil from chemical manufacturing industries, oil
refineries and industrial-waste effluents.
1.1.1 Organochlorine compounds (TCE)
Organochlorines are a class of organic compounds in which at least one chlorine
atom is covalently bound to a tetrahedral carbon (or tetravalent carbon). The chlorine
substituent induces stronger interactions than hydrogen, modifying the physical and
chemical properties of organic compounds in several ways. The carbon-chlorine
bond is very stable to hydrolysis and results in prolonged persistence (Rossberg et
al., 2006) and hence, these chemicals are problematic once they enter the
environment (Bradley, 2003, Fetzner, 2010). Although this property differ among the
OC compounds, some of them may exhibit an ability to resist degradation, associate
with sediments or other solids, and to accumulate in the tissue of invertebrates, fish,
and mammals (Imo et al., 2013, Ahmed et al., 2015). Chlorinated organic
compounds can be grouped into three classes (Figure 1-1):
i) Aliphatic; for example, trichloroethene (TCE)
ii) Polycyclic; for example, dichlorodiphenyltrichloroethane (DDT)
3

iii) Aromatic; for example, pentachlorophenol (PCP).
Their wide structural variety and divergent chemical properties has led to their
manufacture for diverse applications, including industrial, military, agricultural and
medical as solvents, degreasers, insecticides, plasticisers, defoliants and coolants
(Field and Sierra-Alvarez, 2004).
Figure 1-1 Chemical structure of a representative of the three classes of chlorinated organic
compounds, where TCE, DDT and PCP belong to aliphatic, polycyclic class and aromatic classes,
respectively. Abbreviations: TCE=trichloroethene, DDT= dichlorodiphenyltrichloroethane and PCP=
pentachlorophenolate
Trichloroethene, a volatile, aliphatic chlorinated organic compound has two carbon
(C) molecules joined by a double bond (ethenes) with three chlorine atoms (Figure
1.1). This compound has unique solvent properties making it suitable for various
4

industrial applications like dry cleaning, electroplating, printing, pulp and paper
manufacturing, electronic industries and pharmaceutical chemical production (Ohlen
et al., 2005, Hazen et al., 2009). The annual global consumption of TCE was 4.3x10⁵
metric tonnes versus global production capacity of 5.5x10⁵ metric tonnes in 2011
(www.dow.com). The physical and chemical properties of TCE are given in Table 1-
1.
Trichloroethene is a toxic pollutant and enters into the biosphere through industrial
effluents, disposal by consumers, emissions from landfills, leakage and accidental
spills (Haest et al., 2010). Owing to its environmental persistence and mobility , soil
and groundwater contamination by TCE has become widespread (Riley and Zachara,
1992, Doucette et al., 2007a). However, TCE also occurs naturally and is produced
by some macro- and microalgae, making oceans a major source of TCE (Gribble,
2003). There is currently limited data available to estimate the production of TCE by
the oceans which is correlated to temperature and seasonal variations (Yokouchi et
al., 1996, Abrahamsson et al., 2003). On the other hand, according to the National
Table 1-1 Physical and chemical properties of TCE. Source: ATSDR (2014).
Properties Value Chemical formula C2HCl3 Molecular weight 131.39 g/mole Boiling point 87.2oC Melting point -84.7oC Density at 20oC 1.4642 g/cm3 Vapour pressure at 20oC 69 mm Hg at 25oC Henry’s law constant at 25oC 9.85x10⁻³ atm-m3 /mol Solubility Water at 25oC Organic solvents
1,280 mg/l Soluble in ethanol, diethyl ether, acetone, and chloroform
5

Pollutant Inventory (NPI, Australia) the anthropogenic release of TCE into the
environment in Australia was 26 metric tonnes in 2012-2013 and therefore it is
considered as one of the major pollutant emitted to the environment
(http://www.npi.gov.au/).
The release of TCE to the environment poses a serious problem through soil and
groundwater contamination where it remains persistent for decades. TCE has been
identified in more than 700 hazardous waste sites (soil or groundwater) listed by the
U.S. EPA (Chiu et al., 2012). In addition to this, TCE is also known to have
deleterious effects on food chains due to bioaccumulation and biomagnification
(Rattner, 2009). An emerging concern is the uptake of TCE by tress grown in TCE
contaminated area and the potential transfer into the plant edible tissue (Doucette et
al., 2007b).
Studies have shown that reproduction of aquatic invertebrates was adversely affected
by TCE (Niederlehner et al., 1998). The U.S. EPA has set the maximum permissible
limit of TCE in the air and drinking water to 0.003 mg/m3 and 0.005 mg/l,
respectively. The Occupational Safety and Health Administration (OSHA)
permissible exposure limit is a time-weighted average (TWA) of 100 ppm in two
hour period. The epidemiologic studies have provided strong evidences that high
TCE exposure increases the risk of many diseases (e.g. autoimmune disorder,
systemic sclerosis and skin disorders) (Chiu et al., 2013). In humans, high level TCE
exposure is known as a central nervous system depressant (Bale et al., 2011) and
adversely affect the liver, kidney, immune-system and developing embryos (Bull,
2000, Lash et al., 2000, Yauck et al., 2004, Cooper et al., 2009). Studies have also
associated occupational TCE exposure to increased risk of liver and kidney cancer
6

(Rusyn et al., 2014). Similarly, there is evidence that TCE can induce liver and lung
tumours in mice (Maronpot, 2009)
1.1.2 Pesticides (chlorpyrifos and imidacloprid)
Pesticides are a diverse group of organic or inorganic synthetic chemicals that are
purposely introduced and extensively used in agriculture as a part of control
strategies to protect crops against weeds, insects, fungi and other pests and pathogens
(Yang et al., 2007). Pesticides are generally classified based on the type of organism
they are designed to control and include herbicides, insecticides, nematicides,
fungicides and soil fumigants (Imfeld and Vuilleumier, 2012). Each major group of
pesticide can be further classified based on their structure (e.g. organochlorine and
organophosphorus) and their biochemical targets (e.g. choline esterase inhibitors).
Globally 4.6 million tons of chemical pesticides are annually sprayed into the
environment (Zhang et al., 2011b) with over 8000 pesticides registered for use in
Australian agriculture alone (Immig, 2010). With the world’s population expected to
grow from 6.8 billion today to 9.1 billion by 2050 with limited croplands
(Alexandratos and Bruinsma, 2012), further intensification of the use of pesticide to
increase crop production in order to ensure food security is likely (Zhang et al., 2007,
2008c; Zhang, 2009). The use of pesticide is particularly high in countries with cash
crops where pest pressures are high, including Australian sugarcane farms (total
annual revenue of $2 billion).
Chlorpyrifos (CP) and imidacloprid (IC) have gained wide use in agriculture and
currently there are 164 CP-containing and 37 IC-containing products registered in
Australia (http://apvma.gov.au/). However, at present, there is no detailed and
7

publicly available information on Australian usage of individual pesticides. Between
the years 2002-2006, the average annual global use of CP was 25 million kg active
ingredients (Pengphol et al., 2012). On the other hand, IC is gaining popularity due
to its high insecticidal activity at low application rates, and comprises 41% of the
market, becoming the second most widely used agrochemical (Goulson, 2013). The
total consumption of pesticide world-wide is shown in Figure 1-2 (De et al., 2014).
Figure 1-2 World-wide proportion of each class of pesticides used. Adapted from De et al. (2014)
Certainly, pesticides have improved crop production, but their potential to persist in
the environment may cause adverse effects among different forms of life and
ecosystems. Approximately 90% of agricultural pesticide application never reaches
its target organisms with the remaining bulk contaminating Earth’s ecosystems and
affecting public health by entering the food chain (Carriger et al., 2006). In addition
to this, many pesticides are intentionally introduced into the soil system for the
17.5%
29.5%47.5%
5.5%
Fungicides
Insecticides
Herbicides
Others
8

control of soil borne pests and pathogen, which eventually results in the
accumulation at unacceptably high levels (Redondo et al., 1997, Singh, 2012). The
fate of pesticides in the environment is influenced by many processes that determine
their persistence and mobility. The interaction of pesticides with soil and/or water is
complex and is usually controlled by various physio-chemical and biological factors.
Other concerns related to pesticide uses is run-off from the treated area into the water
system (Larson et al., 2010) and aerial volatilization causing atmospheric pollution
(Armstrong et al., 2013). Similar to TCE, studies have shown that pesticides affect
the fertility and reproduction of aquatic invertebrates resulting in significant
developmental changes (Boone et al., 2007). Certain pesticides can accumulate in the
tissue of the organisms (bioaccumulation) (Favari et al., 2002) and the residues can
travel up the food chain affecting non-targeted organisms in the ecosystem like
earthworms (Pelosi et al., 2014), pollinators (Gill et al., 2012, Wu et al., 2012) and
birds (Guerrero et al., 2012). In humans, some pesticides are known to be
carcinogenic (Xu et al., 2010, Band et al., 2011, Cocco et al., 2012), adversely
affecting the nervous system (Hayden et al., 2010), the cardiovascular system
(Abdullah et al., 2011), the respiratory system (Hoppin et al., 2009) and the
reproductive system impacting embryo development and causing birth defects
(Greenlee et al., 2003, Xavier et al., 2004, Mesnage et al., 2010). The severity of risk
is normally associated with the chemical nature of the pesticide, level of toxicity,
mode of action and level of exposure (Richter, 2002). Every year about three million
acute pesticide poisoning are being reported worldwide resulting from accidental
poisoning, occupational exposure, but also suicide attempts (Maiti et al., 2011).
9

1.1.2.1 Chlorpyrifos (CP)
Chlorpyrifos [O,O-diethyl O-(3,5,6-trichloro-2-pyridyl) phosphorothioate)], an OP
pesticide is one of the most widely used pesticide in agriculture (Figure 1-3). The
physical and chemical properties of CP are given in Table 1-2. Chlorpyrifos is a
highly effective pesticide because it irreversibly inhibits acetylcholinesterase (AChE)
enzymes leading to excess acetylcholine accumulation at nerve terminals resulting in
agitation, hypersalivation, convulsion and ultimately death of insects and mammals
(King and Aaron, 2015). Based on the results of animal testing, the U.S. EPA has set
its health based standard for acceptable exposure to CP at 30 ng/kg of body weight
(chronic) and 500 ng/kg of body weight (acute).
The Agriculture and Resource Management Council of Australia and New Zealand
(ARMCANZ) have set a drinking water health guideline value of 0.01 mg/l. The
National Occupational Health and Safety Commission (NOSCH) have set a
permissible occupational exposure limit of 0.2 mg/m3 (TWA) for an eight hour
period. However, continuous and excessive use have shown to cause serious damage
to humans that include developmental toxicity, liver damage, reproductive defects,
endocrine disruptions, nervous system disorders and immune system abnormalities
(Furlong et al., 2006, Whyatt, 2011, Terry, 2012). Acute toxicity of CP has also been
reported in other animals, aquatic invertebrates and fishes, arthropods and soil
microorganisms (Michereff-Filho et al., 2004, Palma et al., 2008, Tuzmen et al.,
2008, Dutta et al., 2010).
10

1.1.2.2 Imidacloprid (IC)
Imidacloprid 1-[(6-chloro-3-pyridinyl)methyl]-N-nitro-2-imidazolidinimine, belongs
to a relatively new class of synthetic organic pesticide (neonicotinoids, Figure 1-3),
now widely used, that exhibit a novel mode of action by acting as an antagonist at the
nicotinic acetylcholine receptors (nAChRs) leading to paralysis and death of pest
organisms (Matsuda et al., 2001, Matsuda et al., 2009). Available data does not
suggest that IC has either dermal or inhalation toxicity potential, therefore, there are
no established health advisory levels for IC in drinking water or
occupational/residential risk assessments (http://www.cdpr.ca.gov/). Although
imidacloprid show low toxicity to some vertebrates, high exposures (300 mg/kg of
body weight) have resulted in vomiting, disorientation, severe cardiac toxicity and
chromosome abnormalities in humans (Agarwal and Srinivas, 2007, Demsia et al.,
2007). Imidacloprid is generally toxic to insects (e.g. termites) in minute quantities
and the toxicity has been reported in various non-target organisms, for example, rats
(140 mg/kg of body weight), birds (14 mg/kg of body weight), fish (16-177 ppm),
pollinators (5 ng/insect) and soil microorganisms (Tišler et al., 2009, Bhardwaj et al.,
2010, Cycoń et al., 2013). A list of physical and chemical properties of IC is given in
Table 1-2.
11

Figure 1-3 Chemical structure of chlorpyrifos (CP) and imidacloprid (IC)
Table 1-2 Physical and chemical properties of chlorpyrifos (CP) and imidacloprid (IC). Source: http://pubchem.ncbi.nlm.nih.gov/
Properties Chlorpyrifos Imidacloprid Molecular weight (g/mol) 350.57 255.70 Melting point (oC) 42.00 144.00 Boiling point (oC) 160.20 442.30 Density (g/cm3) at 20oC 1.44 1.54 Solubility in water (mg/l) at 20oC 0.70 610.00 Partition co-efficient (log Kow) 4.82 0.57 Dissociation constant pKa1 non-dissociative in
nature 1.56
pKa2 non-dissociative in nature
11.12
1.2 Influence of xenobiotics on soil microbial communities
Soil microorganisms are the key players of many soil functions such as nutrient
cycling, organic matter decomposition, maintaining soil health and fertility
(Wainwright, 1978, Lo, 2010). Xenobiotics may interact with the soil and its
indigenous microorganisms, altering microbial diversity and community
composition, and through this influence biochemical reactions and enzymatic activity
N O PS
OO
CH3
CH3
Cl
Cl Cl
N
Cl
NNH
N NO2
Chlorpyrifos (CP) Imidacloprid (IC)
12

(Hussain et al., 2009, Muñoz-Leoz et al., 2011) and ultimately ecosystem functions
and services; hence, it is important to elucidate the influence of xenobiotics on soil
microbes to preserve soil’s vital functions. Co-metabolism of an organochlorine,
TCE (and toluene), in a lab-based study, was shown to cause a shift in microbial
community composition where total culturable heterotrophs increased 500-fold
during incubation with toluene and TCE, but only 3-fold during incubation with TCE
alone (Hubert et al., 2005). In a field based study, TCE (and phenol) has also been
reported to alter the microbial community structure by increasing the population of
Variovorax and Burkholderia in TCE-contaminated groundwater (Humphries et al.,
2005).
On the other hand, the impacts of pesticides on soil microbial communities
(population) have been investigated in many studies with negative, positive and no
effects observed (Jjemba, 2002, Pandey and Singh, 2004, Singh and Singh, 2005a).
In one study, the application of exogenous endosulfan was reported to increase the
bacterial biomass by 76% and reduce the fungal biomass by 47% (Xie et al., 2011a).
A recent study showed no effect of fenamiphos on urease and dehydrogenase
activities (in Australian soils); however, soil microbial potential nitrification was
highly sensitive to fenamiphos addition (10 mg/kg) clearly indicating a risk to soil
health (Cáceres et al., 2008). In addition to this, long-term application of pesticides,
e.g. methyl parathion have also been shown to cause a loss of soil microbial diversity
(Zhang et al., 2006b). Inconsistent effects of pesticides on soil microbial
communities were observed when the studies were conducted using repeated
applications of one or more pesticides with different chemical properties (Gundi et
al., 2005, Wang et al., 2007a, Chu et al., 2008).
13

Intensive use of CP in agro-ecosystems has resulted in several studies of the effects
of CP on soil microbial communities. The half-life of CP is generally between 10 and
120 days in soil but can be up to one year depending on soil types and climatic
conditions (Singh and Walker, 2006). Persistence of CP residues in soils may affect
the soil microbial community functions and stability (Kulkarni et al., 2000).
Microbial biomass, an important indicator of microbial activities and other ecological
processes (Schultz and Urban, 2008) has been reported to respond negatively
following CP treatment at a concentration of 10 mg/kg, the lowest dose used for
agricultural purposes (Shan et al., 2006, Vischetti et al., 2008). In one of the studies
it was found that the application of CP at concentrations from 10-300 µg/g in an
agricultural loam significantly decreased aerobic dinitrogen fixing bacteria
(Azotobacter sp.); however, total viable counts of fungi and denitrifying bacteria
were not affected at this concentration (Martinez-Toledo et al., 1992).
The application of CP has also been shown to affect the soil microbial functional
diversity causing a significant decrease by 18.2%, 30.5% and 27.7% in soils treated
with CP at concentration of 4, 8 and 12 mg/kg, respectively (Fang et al., 2009). In a
similar study, the diversity index of bacterial community significantly decreased
when the soil was treated with 20 mg/kg of CP (Chen et al., 2014). The impact of
repeated application of CP has also been reported to decrease the soil microbial
activity (Fang et al., 2008). However, in all these cases, CP had a temporary or short-
term inhibition effect on soil microbial communities and the diversity recovered
gradually at the later stages of the experiment. While these studies showed an
adverse effect of CP on soil microbial communities, some other studies have shown
little or no effect of CP alone or in combination with other pesticides on soil
microbial parameters (enzyme activity and total microbial biomass) (Singh et al.,
14

2002a, Singh et al., 2002b). In addition to this, CP application has been shown to
alter microbial activity (Wang et al., 2010a), which in turn reduce the availability of
nitrogen (N) and phosphorus (P) content in soils (Sardar and Kole, 2005), and
reduction in plant productivity. A study by Menon et al. (2005) has also reported
significant negative impacts of CP on N mineralisation in loamy sand and sandy
loam soils.
While several studies have shown that CP impact soil microbial activities, very little
is known about the environmental fate of IC and their impact on soil microbial
community structure and function. Half-lives of this pesticide in soils appear to range
from 40 days in unamended soil to 124 days in soils recently amended with organic
fertilizers, and for the most common seed treatments, the half-life reported range
from 28 to 1250 days in soils (Rouchaud et al., 1994, Goulson, 2013).
Recently, studies have started to assess the effects of IC on soil microbial
composition and activities (Cycoń et al., 2013, Cycoń and Piotrowska-Seget, 2015a,
Cycoń and Piotrowska-Seget, 2015b). These studies found that IC did not affect
microbial soil functioning when applied at field rate (1 mg/kg). However, at the
concentration of 10 mg/kg, IC induced significant changes in community
composition. It is expected that the repeated applications of IC would lead to their
accumulation in soils in successive years (Goulson, 2013), eventually altering
microbial soil functioning. At high concentrations IC (10 mg/kg soil) had a negative
effect on total soil microbial biomass and metabolic enzymatic activities and
functions (respiration, phosphatase and urease). In addition to this, IC was also
reported to negatively affect soil nitrification rates by altering the community
structure of ammonia oxidising microorganisms, thus impacting the global N-cycle
and compromising on the soil quality (Cycoń and Piotrowska-Seget, 2015b).
15
In other studies, IC has also been found to have short-term or no effects on soil
enzymatic activities (urease, dehydrogenase and alkaline phosphomonoesterase) in
groundnut fields and turfgrass management, respectively (Ingram et al., 2005, Singh
and Singh, 2005b); however, IC application had adverse effects on fungi and
actinomycetes population composition at field rates of 2.8 g active ingredient/kg seed
in another study (Singh and Singh, 2005a). Likewise, Tu (1995) reported inhibitory
effect of IC on fungal population at 10µg active ingredient per gram of soil. In
general, xenobiotics (OC and pesticides) have a negative impact on soil microbial
populations and activities but the effect is moderated by environmental factors, such
as soil properties, as well as the persistence, toxicity and concentration of the applied
xenobiotics, and its bioavailability to the soil microorganisms (Hussain et al., 2009).
1.3 Transformation of xenobiotics by soil microbial communities
Microorganisms are ubiquitous in soil, with a large biomass ranging from 2-806 g C
m-2 (Curtis et al., 2002, Fierer et al., 2009), and represent a substantial proportion of
Earth’s diversity. For example, one gram of soil contains upto 10 billion microbial
cells, representing more than 10,000 genomes (Torsvik and Øvreås, 2002). They
possess highly specialized metabolic systems and catalytic mechanisms (Chen et al.,
1999, Paul et al., 2005) to degrade and utilise various toxic compounds. These
compounds can be used as a source of energy for their growth via aerobic respiration,
anaerobic respiration, anoxic processes, fermentation, and co-metabolism in normal
as well as more extreme conditions (Mishra and Lal, 2001, Watanabe, 2001).
Biodegradation of xenobiotics can be broadly categorised into aerobic and anaerobic.
In aerobic biodegradation, microorganisms use oxygen as the final electron acceptor
in the degradation process. Anaerobic degradation, on the other hand, occurs in the
16

absence of oxygen. Under these conditions manganese and iron ions, and elements
like sulphur, sulphate, nitrate and carbon dioxide, may function as an electron
acceptor in biotransformation (Bosma et al., 2001).
Xenobiotic compounds can be degraded in the environment as part of the natural
biogeochemical processes. Growth-linked degradation processes occur when micro-
organisms degrade organic compounds for energy and growth. Organochlorine
compounds, however, tend to be resistant to biodegradation due to the presence of
the highly electronegative halogen substituent, which provide stability to the
molecule. Some of these persistent organic compounds are mainly transformed by a
mechanism known as co-metabolism. Co-metabolism is the process in which a
microorganism transforms a substance, without being able to utilise the energy
derived from this transformation, in the obligate presence of a growth substrate.
Figure 1-4 summarises different biodegradation approaches undertaken by the
microorganisms (in the presence and absence of oxygen) (Singh et al., 2009).
17

Figure 1-4 Flow-diagram outlining the main degradation mechanisms in microbe-assisted biodegradation.
Anthropogenic compounds can be degraded in the environment as part of the natural biogeochemical processes. Growth-linked degradation occurs when micro-organisms degrade organic compounds as a source of energy. Organochlorine compounds, however, tend to be resistant to biodegradation due to the presence of the highly electronegative halogen substituent, which provide stability to the molecule. Persistent organic compounds are, however, transformed by a mechanism known as co-metabolism. Co-metabolism is the process in which a microorganism transforms a substance, without being able to utilise the energy derived from this transformation, in the obligate presence of growth substrate.
Biodegradation
Growth-linked Co-metabolism
Aerobic Anaerobic
ExamplesPetroleum HydrocarbonsBenzene,Toluene, Phenol,Dichloroethane etc.
Sulfate respiration
Denitrification Mn/Fe respiration
Methanogenesis/Acetogenesis
Fermentation Halorespiration
ExampleBTEX
ExampleBenzene
ExampleToluene
ExampleCO2 reducedto methane/acetic acid
ExampleGlucose oxidised to O2.Intermediate acetaldehydepartly reduced to ethanol.
ExampleTCE
Aerobic Anaerobic
Hydrolysis
RCl+H2O ROH+ Cl
Dehydrohalogenation
Cl-C-C-H C=C + HCl
Dichloroelimination
Cl-C-C-Cl +2e- C=C + 2Cl-
Reductive dechlorinationRCl+ H++2e- RH+ Cl-
ExamplesChlorinated compounds suchas TCE, PCE, VC,hydrocarbons, chloroform etc
18

Microbial degradation has proved to be versatile as it offers a natural, inexpensive
and environmentally friendly strategy to detoxify xenobiotics like TCE and
pesticides (Kosaric, 2001, Furukawa, 2003, Finley et al., 2010). Most of the research
regrading biodegradation of pesticide and TCE have primarily focused on bacteria
because bacteria are easy to culture, generally grow faster than most of the other
microbes and are more susceptible to genetic modification (Ortiz-Hernández et al.,
2011). Bacteria are considered to produce enzymes such as oxygenases, transferases,
isomerases, hydrolases and ligases that efficiently catalyse the biodegradation of
pesticides (Singh and Singh, 2005b, Sharma et al., 2006, Pizzul et al., 2009, Van
Eerd et al., 2009, Semrau et al., 2010). Here we will focus on microbial degradation
(transformation) of the two most widely used xenobiotics; OC compounds (TCE) and
pesticides (CP and IC)
1.3.1 Biological transformation of organochlorine compound (TCE)
Concern about the environment and human health hazards have led to the
development of new approaches for TCE remediation. Several physico-chemical
remedial methods like air stripping (Rabideau et al., 1999), active carbon adsorption
(Miyake et al., 2003), advanced oxidation (Yuan et al., 2012) and the pump and treat
process (Bazzazieh, 1996) have been developed and implemented for TCE
decontamination but are relatively slow, costly and inefficient (Bankston et al.,
2002). By contrast, biological treatment or bioremediation has emerged as an
effective tool because of its low cost and its potential for complete degradation of
pollutant (Arp et al., 2001). For example, biological remediation treatment generally
costs between $7-250/tonne soils when compared to other physio-chemical
19

treatments ($20-700/tonne soils) (Juwarkar et al., 2010). Biodegradation of TCE can
take place under both aerobic and anaerobic conditions through different pathways.
1.3.1.1 Anaerobic degradation
The process of removing chlorines under anaerobic conditions, generally occurs
through reductive dechlorination (Holliger et al., 1998, Smidt and de Vos, 2004)
where the chlorinated compound is used as an electron acceptor and dechlorinated
stepwise (Figure 1-5). The reductive dechlorination of TCE primarily occurs through
two processes: a) co-metabolism and b) halorespiration, where the chlorinated
compound (TCE) is metabolised to ethylene through 1,2-dichloroethene (cis-1,2-
DCE or trans-1,2-DCE) and vinyl chloride (VC) as intermediates (Mohn and Tiedje,
1992, Wohlfarth and Diekert, 1997, Ferguson and Pietari, 2000, Wang and Tseng,
2009, Tiehm and Schmidt, 2011). While co-metabolic dechlorination is a non-
specific side reaction, halorespiration is a specific enzymatic reaction in which a
chlorinated compound is used as a terminal electron acceptor for generation of
metabolic energy (Middeldorp et al., 1999). In recent times, biochemical basis for
the halorespiration is becoming better understood with the purification of
dehalogenases (Neumann et al., 1995, Magnuson et al., 1998, Holliger et al., 2003)
and it seems to be a major mechanism in the natural attenuation of TCE at many
contaminated sites (Yong and Mulligan, 2003, Tiehm et al., 2007). However, a
serious concern of the application of anaerobic TCE degradation is the incomplete
dechlorination of the compound resulting in the accumulation of undesirable by-
products, for example VC, which are more toxic and carcinogenic than the parent
compound (Carter and Jewell, 1993, Anguish and Maymo-Gatell, 1999, Byl and
20

Williams, 2000, Griffin et al., 2004). Therefore, anaerobic degradation cannot be
relied upon as a single treatment system for the complete dechlorination of
chlorinated compounds in contaminated environments.
1.3.1.2 Aerobic degradation
Aerobic degradation of chlorinated compounds, like TCE, has been widely examined
as an alternative to the anaerobic degradation because it is much faster and does not
favour the production of undesirable metabolites, like VC. Aerobic degradation
involves an oxygenation reaction catalysed by mono- or dioxygenase enzymes to
yield epoxides or dihydrodiols of the chlorinated compound (Lee et al., 2006, Van
Beilen and Funhoff, 2007, Lee et al., 2008). The heavily chlorinated compound,
TCE, is considered resistant to biodegradation and co-metabolism is the only aerobic
mode of degradation in which the microorganisms degrade the compound without
gaining any energy or growth benefit (Ensley, 1991, Ryoo et al., 2000, Futamata et
al., 2001). There have been several reports on co-metabolism of chloroethenes by
bacterial communities using another primary substrate such as methane (CH4) (Lee et
al., 2006, Shukla et al., 2009), ethene (Coleman et al., 2010, Le and Coleman, 2011),
propane (Chang and Alvarez-Cohen, 1995, Frascari et al., 2008), toluene (Cox et al.,
1998, Yeager et al., 2004), butane (Kim et al., 2000, Halsey et al., 2007), ammonia
(Yang et al., 1999, Kocamemi and Cecen, 2010), methanol (Lee et al., 2003, Shukla
et al., 2010a) or phenol (Bielefeldt and Stensel, 1999, Futamata et al., 2005) to
induce specific oxygenase for degradation. Although various microorganisms have
shown promising results in co-metabolizing TCE, CH4-assisted degradation of TCE
by methanotrophs are of interest because they are non-pathogenic and exist in a
21

variety of habitats. They degrade a broad spectrum of highly toxic organic
compounds and have higher TCE oxidation rates than other degraders. A list of
microorganisms involved in aerobic and anaerobic degradation of TCE is given in
Table 1-3
Figure 1-5 Anaerobic degradation pathways for trichloroethylene. Modified from Lorah and Olsen
(1999) Anguish and Maymo-Gatell (1999) and Pant and Pant (2010). Abbreviations:
TCE=trichloroethene, DCE= dichloroethene and VC=vinyl chloride.
TCE
trans-1,2-DCE cis-1,2-DCE
VC
Ethylene
To Acetylene pathway
C=CCl
Cl
Cl
H
C=CH
Cl
Cl
HC=C
H
Cl
H
Cl
C=CH
Cl
H
H
C=CH
H
H
H
22

Table 1-3 List of microorganisms involved in aerobic and anaerobic degradation of TCE
Microorganisms Mode of degradation Enzymes References Dehalospirullum sp. Anaerobic Dehalogenase (Miller et al., 1996)
Desulfuromonas sp. Anaerobic Dehalogenase (Krumholz, 1997)
Sulfurospirillum sp. Anaerobic Dehalogenase (Luijten et al., 2003)
Desulfitobacterium sp. Anaerobic Dehalogenase (Furukawa et al., 2005)
Clostridium sp. Anaerobic Dehalogenase (Kim et al., 2006)
Dehalococcoides sp. Anaerobic Dehalogenase (Zhang et al., 2011c)
Propionibacterium sp. Anaerobic Dehalogenase (Chang et al., 2011)
Nitrosomonas sp. Aerobic Ammonia
monooxygenase (Arciero et al., 1989)
Pseudomonas sp. Aerobic Toluene mono- dioxygenase
(Clingenpeel et al., 2012)
Mycobacterium sp. Aerobic Propane monooxygenase
(Wackett et al., 1989)
Diazotrophs Aerobic Nitrogenase (Shukla et al., 2010b)
1.3.1.3 Methanotrophic degradation of TCE (co-metabolism)
Methanotrophs or CH4 oxidising Gram-negative bacteria (MOB) are a subset of a
physiological group of bacteria known as methylotrophic bacteria (Hanson and
Hanson, 1996) that utilise CH4 for energy and a C-source (Semrau et al., 2010)
(Figure 1-6). All methanotrophs belong to the phyla Alpha- and Gamma -
proteobacteria and oxidise CH4 to carbon dioxide. Methanotrophs have been
classified into three major groups based on morphological differences, their pathway
of C assimilation, intra-cytoplamic membrane (ICM) structure and other
physiological characteristics (Whittenbury et al., 1970, Whittenbury and Dalton,
1981, Hanson and Hanson, 1996, Jiang et al., 2010, Semrau et al., 2010).
23

Gamma-proteobacteria or Type I methanotrophs utilise a ribulose monophosphate
pathway (RuMP) for C-assimilation, has predominant 16-C phospholipid fatty acids
(PLFAs) and the bundles of vesicular discs of membrane are distributed throughout
the organism. Alpha-proteobacteria or Type II possess serine pathway for C-
assimilation, contain a high level of 18-C PLFAs and paired membranes around the
periphery of the cell. On the other hand, the genus Methylococcus and Methylocadum
possess the characteristics of both Type I and Type II and belonged to Type X
methanotrophs, but are now reclassified as a subset of Type I methanotrophs
(Bowman et al., 1993b). Further-more, filamentous methanotrophs have been
discovered within the genera Clonothrix and Crenothrix (Stoecker et al., 2006,
Vigliotta et al., 2007) but these are considered to be Type I methanotrophs. Another
recently discovered acidophilic methanotroph of the Verrucomicrobia phylum
represents a unique group of methanotrophs (Dunfield et al., 2007, Islam et al., 2008,
Semrau et al., 2008), although it shares many characteristics Type II methanotrophs.
The general characteristics of the different types of methanotrophs are given in Table
1-4.
The biodegradation of TCE by methanotrophs was first demonstrated in 1985
(Wilson and Wilson, 1985) using a sand column inoculated with methanotrophs.
Since then significant advancement has been made in the application of
methanotrophic bacteria in bioremediation of TCE (Erwin et al., 2005, Wymore et
al., 2007, Yu, 2008). Interest in methanotrophic bacteria as biocatalysts for synthetic
chemistry and bioremediation stems almost exclusively from the unique catalytic
properties of the two CH4 monooxygenase (MMO) systems, most importantly their
ability (a) to oxidize CH4 to methanol and (b) to co-oxidize a wide range of
organochlorine substrates (like TCE), where the enzyme induces the formation of
24

epoxides that are extremely unstable and spontaneously breaks down to simpler
compounds (Figure 1-7). Methanotrophs possess two forms of MMO: the
cytoplasmic soluble form (sMMO) and membrane bound particulate form (pMMO)
(Burrows et al., 1984, Murrell et al., 2000b, Shukla et al., 2014). All methanotrophs
express pMMO, except for Methylocella and Methyloferula sp. (Dedysh et al., 2005,
Vorobev et al., 2011); while sMMO is expressed mainly by Type II and Type X
methanotrophs (Hanson and Hanson, 1996, McDonald et al., 2006) in the absence of
copper (Koh et al., 1993, Nielsen et al., 1997, Grosse et al., 1999, Semrau et al.,
2010).
Figure 1-6 Aerobic oxidation of methane. Abbreviations: FAD- formate dehydrogenase, FADH-
formaldehyde dehydrogenase, MDH- methanol dehydrogenase and MMO-methane monooxygenase
(s=soluble, p=particulate). Adapted from Hanson and Hanson (1996)
CH4
CH3OH(methanol)
HCHO(formaldehyde)
HCOOH(formate)
CO2
NADH+H+
NAD+
O2
H2OsMMO/pMMO
MDH
RuMP pathwayType I methanotrophs
Serine pathwayType II methanotrophs
FADH
NAD+
NADH+H+
FAD
25

Table 1-4 General characteristics of aerobic methanotrophic bacteria. Adapted from Semrau et al. (2010)
Characteristics Gamma-proteobacteria+ (Type I) Alpha-propteobacteria (Type II) Verrucomicrobia Genera Methylobacter, Methylococcus*, Methylocadum*,
Methylohalobius, Methylomicrobium, Methylomonas, Methylosoma, Methylosphaera, Methylosarcina, Methylothermus, Methylovulum
Methylocystis, Methylosinus, Methylocapsa, Methylocella,
Methyloferula
Methylacidiphilum
Cell morphology cocci-rods, cocci and rods pyriform, vibroid, curved cocci or rods
C-assimilation pathway RuMP serine serine
IMC vesicular discs parallel to cell periphery vesicular discs
Cyst formation varies between genera varies between genera absent
pMMO Present present, except Methylocella, Methyloferula
present
sMMO absent, except Methylococcus varies between genera absent
Major PLFAs 14:0, 16:0, 16:1, 18:1 18:1 14:0, 15:0, 18:0
G+C content (mol %) 43-65 60-67 40.8-45.5
* Type X methanotrophic genera. They possess the characteristics of both Type I and Type II but are now reclassified as a subset of Type I methanotrophs + with the exception of Clonothrix and Crenothrix
26

Figure 1-7 Proposed mechanism for TCE co-metabolism by methane monooxygenase (MMO).
Adapted from Brigmon (2002)
Soluble methane monooxygenase (sMMO) is a non-heme, iron containing enzyme
complex consisting of three components: hydroxylase (245 kDa), B component (15.8
kDa) and reductase (38.4 kDa). The most well characterised and highly conserved
sMMO are purified from Methylosinus trichosporium OB3b and Methylococcus
capsulatus (Lipscomb, 1994, Gassner and Lippard, 1999, Lee and Lipscomb, 1999).
Soluble MMO possess a wide range of substrate specificity and can degrade a wider
C=CCl
Cl
Cl
H
MMO + O2
C---CCl
Cl
Cl
HO
(TCE epoxide)
DichloroacetateTCE diol
Glyoxylic acid
CO2
27

variety of compounds, such as chlorinated aliphatic compounds and aromatics
(Shigematsu et al., 1999, Hesselsoe et al., 2005). The detailed structure of the sMMO
molecule is described by Murrell et al. (2000a) By comparison, information on the
structure of pMMO was limited until the crystal structure of pMMO was obtained
(Lieberman and Rosenzweig, 2005). Particulate methane monooxygenase (pMMO)
consists of three polypeptide subunits with molecular weights; α~27 kDa, β~45 kDa
and γ~45 kDa encoded by pmoA, pmoB and pmoC genes respectively. The active site
of the enzyme is thought to lie within α and β subunit as specific inhibition of these
subunits by acetylene, a suicide substrate for MMO, has been demonstrated (Semrau
et al., 2010).
Unlike sMMO, pMMO has a relatively narrower substrate specificity but is more
suitable for in situ bioremediation because it is produced by all methanotrophs
(Hakemian and Rosenzweig, 2007). An early study showed that the ability of
methanotrophs to degrade TCE substantially increased with increasing copper
availability (Smith et al., 1997, Lontoh and Semrau, 1998). In methanotrophs, for
example Methylosinus trichosporium OB3b, that possess both pMMO and sMMO,
copper ion regulates the expression of the particular enzyme type (Nielsen et al.,
1997, Murrell et al., 2000b, Semrau et al., 2010). In copper starved condition (as low
as 1 µM) only sMMO is expressed. Further-more, copper is thought to affect the
MMO expression at the genetic level by activating pmo gene transcription cluster,
with no detectable sMMO expression (Murrell et al., 2000b). The model of copper-
dependent transcription and regulation of pMMO/ sMMO is described in details
elsewhere (Knapp et al., 2007, Kenney and Rosenzweig, 2011)
28

1.3.2 Biological transformation of pesticides (CP and IC)
The metabolic fate of persistent toxic pesticides that are released into the
environment is dependent on the abiotic environmental factors (temperature, pH,
moisture, etc.), microbial community composition and chemical characteristic of the
pesticide. Abiotic biotransformation of the pesticide occurs by processes such as
photolysis (Tsogas et al., 2006, Ramezani, 2008, Tajeddine et al., 2010), hydrolysis
(Katagi, 2002) and re-dox rearrangements (Chaplain et al., 2011). However,
enzymatic transformation mediated by indigenous soil microorganisms is by far the
most common type of transformation (Ortiz-Hernández et al., 2011).
Currently, among the various groups of pesticides, OP pesticides form the most
widely used group of agrochemicals. The OP pesticides share a similar general
structure consisting mainly of ester or thiol derivatives of phosphoric, phosphonic or
phosphoramidic acids (Singh, 2009). Most of the OP pesticides are degraded by
indigenous microbes, in the environment, as a sole energy and C- or P-source. Both
co-metabolic and mineralisation of OP pesticides by mixed and isolated bacterial
strains have however also been reported (Singh and Walker, 2006, Chishti and
Arshad, 2013).
In general, degradation of OP compounds starts with hydrolysis of P-O alkyl or P-O
aryl bonds followed by oxidation, alkylation and dealkylation (Singh et al., 1999,
DeFrank and White, 2002, Sogorb and Vilanova, 2002, Kanekar et al., 2004, Theriot
and Grunden, 2011). Hydrolases are a broad group of enzymes that catalyses the
hydrolysis, a fundamental step for the complete degradation of the molecule. Several
genes encoding for different hydrolase activity have been described earlier from a
number of microorganisms, for example, organophosphate hydrolases (OPH;
29

encoded by opd gene) that was first isolated from Brevundimonas diminuta and later
from Flavobacterium sp. (Serdar et al., 1982, Siddavattam et al., 2003).
Organophosphate hydrolases have shown to degrade a wide range of toxic OP
compounds (Cho et al., 2002, Ortiz‐Hernández et al., 2003, Efremenko et al., 2005)
including chemical warfare nerve agents (Rastogi et al., 1997, Chen et al., 2000,
Gopal et al., 2000, Raushel, 2002). A similar enzyme, organophosphorus acid
anhydrolase (OPAA; encoded by opaA gene) was isolated from Alteromonas sp.
(Cheng et al., 1993). Another OP degrading enzyme OpdA (encoded by opdA gene)
with broad substrate specificity to cleave P-CN and P-F bonds in addition to P-O
bonds (Scott et al., 2008, Blatchford et al., 2012).was isolated from Agrobacterium
radiobacter (Horne et al., 2002) In addition to this, the microbial enzyme, methyl
parathion hydrolase (MPH; encoded by mpd gene), originally isolated from
Plesiomonas sp. (Zhongli et al., 2001) have also been found in several
phylogenetically unrelated bacteria like Achromobacter, Pseudaminobacter,
Ochrobactrum and Brucella (Zhang et al., 2005).
Studies have shown the capacity of the microorganisms Flavobacterium,
Pseudomonas and Sphingomonas to degrade OP pesticides, such as parathion,
cadusafos and ethoprophos (Karpouzas and Walker, 2000, Karpouzas et al., 2000b,
Karpouzas et al., 2004). Bacterial strains belonging to Serratia (Pakala et al., 2007)
and Burkholderia (Zhang et al., 2006c) have moreover been reported to utilise
methyl parathion and fenitrothion as a sole source of C and energy. Another
bacterium with a capacity to transform parathion and methyl parathion into amino
acid derivatives (reductive transformation) has also been identified (Yang et al.,
2007). Wang et al. (2010b) and Pravin et al. (2012) also reported isolation of
Hyphomicrobacterium sp. and Nacardiopsis sp., respectively, with the capability to
30

degrade methamidophos and other OP and OC pesticides. For microorganisms, the
advantage of degradation activities is to get access to the additional sources of
nutrients (C, N and P) for growth; while the degrading enzymes have the potential in
bioremediation (Russell et al., 2011). The (bio) availability and (bio) degradation of
a pesticide is interlinked and is mainly determined by its adsorption to and desorption
from soil colloids. The binding of pesticides to soil matrix is often considered to
reduce bioavailability and therefore limits potential biodegradation of the compound
(Guerin and Boyd, 1992, Singh and Sharma, 2013). This pesticide-soil interaction is
affected by various factors, such as soil properties, concentration and chemical
characteristics of the pesticide. For example, pesticides are strongly adsorbed to soils
that are high in clay or organic matter, are less readily released from such soils and
therefore become more persistent (Dalla Valle et al., 2005). Moreover, studies have
shown that sites with a long history of pesticide contamination and constrained
release of aging pesticide may increase the resistance of the compound to
biodegradation in soils (Hatzinger and Alexander, 1995, Alexander, 2000). Ahmad et
al. (2004) reported that the aging reduced availability of pesticide, carbaryl, in a long
term contaminated (i.e., aged) soil (>12 years). Similar reports concerning the effects
of aging are available for other pesticides, such as DDT (49 years) (Morrison et al.,
2000), 1, 2-dibromoethane (3 years) (Steinberg et al., 1987) and simazine (20 years)
(Scribner et al., 1992).
In addition to this, extensive and repeated use of OP pesticides has shown to increase
microbial degradation of the pesticide, due to the development of enhanced
degradation in soils under field conditions, resulting in the lack of efficacy of the
pesticide against target pests. This phenomenon is known as accelerated or enhanced
degradation, caused by an adaptation of one or more species of indigenous
31

microorganisms to metabolise the pesticide (Racke and Coats, 1990). For example, a
lack of efficacy of the pesticide phorate in UK carrot fields was reported due to
accelerated degradation (Suett et al., 1996). The author also reported that 12 out of
13 pesticides that were available in the UK for soil application were susceptible to
undergo enhanced microbial degradation. Previous literature has also reported
enhanced degradation and failure of many other OP and carbamate pesticides (e.g.
diazion and carbofuran) to provide adequate control against their target pests
(Sethunathan, 1971, Williams et al., 1976, Felsot et al., 1981).
A range of biotic and abiotic factors has been shown to influence the stability of the
pesticide and induction of enhanced degradation in soils (Felsot and Shelton, 1993,
Bending et al., 2003, Singh et al., 2003a, Singh et al., 2003b). The problem of
enhanced degradation becomes more significant when the degradation of pesticide in
a soil is induced by another pesticide from the same group of chemicals (cross-
enhancement) (Singh et al., 2005). Cross-enhancement of accelerated degradation of
several OP pesticides and one nematicide was observed under lab conditions, in
Australian soils that showed enhanced degradation of fenamiphos or CP in the fields
(Singh et al., 2005). This phenomenon has also been reported within many other
groups of pesticides, for example, carbamates, thiocarbamates, dicarboximides and
isothiocyanates (Wilson, 1984, Horng and Kaufman, 1987, Mitchell and Cain, 1996,
Morel-Chevillet et al., 1996, Warton et al., 2003).
The degradation of CP (an OP pesticide) by soil microorganisms has been studied
extensively with 3,5,6-trichloro-2-pyridinol (TCP) as the major degradation product
(Xu et al., 2007). Repeated applications of CP have shown inconsistent results from
enhanced degradation by soil microbial communities (Fang et al., 2008) to no effects
(Singh et al., 2002a) in lab controlled conditions. However, the first report on the
32

loss of efficacy of CP, after extensive and repeated application of the pesticide, came
from Australian sugarcane farms due to the development of enhanced biodegradation
(Robertson et al., 1998, Singh et al., 2003a).
Most of the studies on biodegradation of CP have reported aerobic transformation of
CP by hydrolysis to produce TCP and diethylthiophosphoric acid (DETP) (Figure 1-
8). Chlorpyrifos is reported to be degraded co-metabolically in a liquid media by
Flavobacterium sp. (initially isolated from diazinon treated fields) and Arthrobacter
sp. (Mallick et al., 1999). The first report on CP mineralisation was reported for
Enterobacter strain B-14 which was isolated from Australian agricultural soils with
the ability to degrade CP to DETP and TCP and to utilise DETP as a source of C and
P (Singh et al., 2003a, Singh et al., 2004).
Two other bacterial strains, Stenotrophomonas sp. YC-1 (Yang et al., 2006), and
Sphingomonas sp. Dsp-2 (Li et al., 2007), isolated from a waste-water treatment
facility of a pesticide manufacturer, degraded 100% CP (100 mg/kg) within 24 h as a
sole source of C and P. Synechocystis sp. PUPCCC 64, isolated from agricultural
waste-water, also have been shown to degrade 93% of 5 mg/l CP within 5d (Singh et
al., 2011a). Similarly, a number of bacterial strains capable of utilising both CP and
its primary degradation product, TCP, in liquid culture as well as soil have been
reported. These include Alcaligenes faecalis DSP3 (Yang et al., 2005), Paracoccus
sp. TRP (Xu et al., 2008), Bacillus sp. (Anwar et al., 2009, Liu et al., 2012, Eissa et
al., 2014), Pseudomonas sp. (Lakshmi et al., 2009), Ralstonia sp. T6 (Li et al., 2010)
and Mesorhizobium sp. HN3 (Jabeen et al., 2014) that have been isolated from
different parts of the world. Many researchers have also successfully isolated
bacterial strains from pesticide-treated agricultural soils with CP degrading
capabilities (Kumar, 2011, Sasikala et al., 2012).
33

Figure 1-8 Proposed pathways for degradation of chlorpyrifos (CP) by microorganisms. The scheme
is adapted from (Singh and Walker, 2006) and (Lu et al., 2013). Abbreviations: TCP=3,5,6-trichloro-
2-pyridinol, DETP=diethylthiophosphate.
On the other hand, while metabolism of IC has been extensively studied in
mammalian systems (Tomizawa and Casida, 2005, Ford and Casida, 2006), the
environmental fate of the compound is poorly understood. Recently a pathway for
the transformation of IC in Pseudomonas sp. was proposed (Pandey et al., 2009)
where the pesticide was transformed to nitrosoguanidine (=N-NO), desnitro (=NH)
and urea (=O) metabolites (Figure 1-9). Very little literature is available to date
Hydrolase
TCP + DETP
Ethanol + Phosphorothioic acid
Dechlorination
+ 6-chloro-2-pyridinol
Dechlorination
2-pyridinol
Pyridinol ring cleavage
C-source for growth of microorganisms
5,6-dichloropyridinol Ethanol + Phosphorothioates
Phosphatase
Phosphatase
N O P
S
OO
CH3
CH3
Cl
Cl Cl
34

describing mineralisation of IC by bacterial isolates which is limited to Leifsonia sp.
(Anhalt et al., 2007), Stenotrophomonas maltophilia (Dai et al., 2006) and
Pseudomonas sp. (Pandey et al., 2009). Other than these, bacterial strains belonging
to genera Ensifer, Stenotrophomonas and Pigmentiphaga have been reported with the
ability to degrade other neonicotinods, such as thiamethoxam, thiacloprid and
acetamiprid, respectively (Zhao et al., 2009, Yang et al., 2013, Zhou et al., 2013).
However, the genes and enzymes responsible for the microbial degradation of IC
(and other neonicotinods) are currently unknown.
Figure 1-9 Proposed metabolic pathway for transformation of imidacloprid in Pseudomonas sp.1G.
Adapted from Pandey et al. (2009). Dotted arrow indicates that the conversion occurs through a series
of intermediates.
Imidacloprid
AminoguanidineNitrosoguanidineNitroimine
Urea metabolite
N
Cl
N NH
N NO2
35
1.4 Methods to determine impacts of xenobiotics on soil microbial
communities
Extensive amount of research have been conducted to understand the effects of
xenobiotics on soil microbial communities and how these microbes respond to the
anthropogenic stressors. This research has ranged from using the traditional
cultivation dependent and independent analyses to state-of-art emerging
metagenomics approaches. Some of the techniques used in this study include both
broad (e.g. MicrorespTM) fine-scale (e.g. stable isotope probing) analytical methods
and are briefly described below.
1.4.1 Community level physiological profiles (CLPPs)
Community level physiological profiles (CLPPs) approach is widely used to
determine the activity of the soil microflora involved in carbon cycling (functional
diversity). This is usually assessed by carbon substrate utilization and MicroRespTM
method (Campbell et al., 2003) is widely used method as it was designed to be a
‘whole soil’ technique that increases the specificity and sensitivity of the assay.
MicrorespTM consists of two micro-titre plates, one of which is a 96 deep-well plate
for soil and carbon substrate; the other plate is designed for carbon dioxide (CO2)
detection. The detection plate contains a gel-based bicarbonate buffer with indicator
dye (Rowell, 1995) that responds to a change in pH when evolved CO2 from
substrate (carbon) utilization gets adsorbed onto the gel; also known as colorimetric
method of detection. The change in colour is quantified after six hours incubation
using the plate reader (Campbell et al., 2003). This method has been widely applied
to monitor the microbial soil functions in response to pesticide contamination (Wang
36

et al., 2006, Wakelin et al., 2008, Dutta et al., 2010, Cycoń and Piotrowska-Seget,
2015a), metal contamination (Bérard et al., 2014, Singh et al., 2014, Wakelin et al.,
2014) and hydrocarbon contamination (Kaufmann et al., 2006).
1.4.2 Terminal restriction fragment length polymorphism (T-RFLP)
Terminal restriction fragment length polymorphism (T-RFLP) is an automated,
sensitive and popular high-throughput fingerprinting technique used to assess
changes in the microbial community structure (Liu et al., 1997, Schütte et al., 2008).
The technique involves the restriction digestion of fluorescently end labelled PCR
products to produce terminal restriction fragments (T-RFs). The digested fragments
(T-RFs) are then separated out, based on size, using either gel or capillary based
systems and detected by an automated analyser (Osborn et al., 2000). Since the
differences in the T-RFs reflect phylogenetically distinct populations, this analyses
method has been used to determine the impacts of xenobiotics on microbial
community structure.
Studies by Dai et al. (2015) and (Luo et al., 2009a) compared the abundances of
individual T-RFs (T-RFLP analysis) and illustrated the remarkable increase in the
proportion of a particular bacterial population in 2,4-dichlorophenoxyacetic acid
(2,4-D) and another population in toluene contaminated sites, respectively. Zhang et
al. (2008) reported that the pyrethroid insecticide cypermethrin significantly altered
the bacterial community structure within the cucumber phyllosphere. In another
similar study, Vázquez et al. (2009) utilised T-RFLP to interpret temporal microbial
community dynamics during bioremediation of diesel oil-contaminated Antarctic soil
and reported the differences in microbial community composition in treated and
37

control plots. Despite providing high throughput analysis of highly complex
microbial communities (Dunbar et al., 2000, Lukow et al., 2000, Pesaro et al., 2004),
T-RFLP approach suffers from a major drawback as each T-RF can be a
representative of multiple organisms or different strains of the same microbial
species can produce different sized T-RFs (Kaplan and Kitts, 2003, Schmitt-Wagner
et al., 2003).
1.4.3 Stable isotope probing (SIP)
Stable isotope probing is a widely used technique that relies on the incorporation of a
highly enriched substrate in a stable isotope, such as 13C or 15N (Paterson et al.,
2009), and the identification of active microorganisms by analysis of isotope
enriched cellular components (DNA, RNA, PLFA, protein) (Dumont and Murrell,
2005). Thus, SIP can be used to monitor the specific biological function of
microorganisms in a particular environment or conditions; for example, to monitor
the effects of pesticides on soil microbes or to understand the chemical/ biological
(active degraders) aspects of pesticide fate within the environmental conditions. This
approach has been successfully used to characterise Beta-proteobacteria where the
use of 13C labelled 2,4-D (DNA-SIP) facilitated the characterisation and subsequent
amplification of soil degrading community (Cupples and Sims, 2007). Building on
this, Lerch et al. (2009) used SIP coupled with fatty acid methyl esters (FAME-SIP)
and confirmed Proteobacteria as the principal degraders of 2,4-D in soil during a 6
month incubation study. In addition to these studies, SIP has been also applied to
identify aerobic and/ or anaerobic naphthalene, anthracene (Zhang et al., 2012a),
38

MTBE/ TBA (Key et al., 2013), RDX (Cho et al., 2013), and toluene degraders
(Fowler et al., 2014).
1.4.4 Next generation sequencing
Next generation sequencing has seen a rapid advancement in recent years. The
considerably increased amount of data (at finer levels) has improved the ability to
assess the overall structure, function and dynamics of the microbial population in
environmental samples (Christen, 2008, Wooley and Ye, 2010). The procedure
involves isolation of DNA from environmental samples followed by sequencing of
the whole metagenome. Data generated provides key information not only on
community composition and diversity but also the relative abundance of functional
genes; and therefore the potential capability of ecosystem, from where samples are
obtained (Rastogi and Sani, 2011). This approach has already been applied to a range
of soil systems including contaminated sites (Ono et al., 2007, Lu et al., 2011).
However, studies applying next generation sequencing technique to explore pesticide
impacts on agri-ecosystems are limited. (Sangwan et al., 2012, Smith et al., 2013)
39

1.5 Knowledge gaps
While previous literature has provided some insight into the impact of xenobiotics on
soil microbial communities, there is still limited knowledge on the impact of the
three widely used compounds (TCE, CP and IC) on soil microbial communities,
particularly in Australian ecosystems. Australia is a geographically isolated and
biologically diverse continent. It is home to more than one million endemic species,
which is shared by no other country in the world. Several characteristics of soils here
is different from the rest of the world (Paton et al., 1995) which mainly consist of
weathered rocks with poor in nutrient levels. Thus, a more global view of soils is
needed, with focus on soil microbial communities, which will enhance the ecological
knowledge of the continent and contribute to land management strategies. Details on
knowledge gaps in particular areas (highlighted here) are described in appropriate
experimental chapters.
• Trichloroethene has been known to adversely impact the structure and functions
of the soil communities; however, no such study has been conducted on soil
microbial communities in Australian systems. While some studies have examined
the distribution and diversity of aerobic TCE dechlorinating bacteria (Coleman et
al., 2010, Le and Coleman, 2011), there is no information on whether TCE would
impact the presence or abundance of potential TCE degraders (methanotrophs)
that can be used for bioremediation. Given that the degradation of TCE by
methanotrophs is co-metabolic in nature, evidence on linking active
methanotrophs to degradation of TCE is limited. Thus, DNA-SIP approach can
be applied to achieve this.
40

• Most of studies on the interaction between the pesticides CP and IC and soil
microbial communities have been short-term and carried out on single
application of the particular pesticide thus, limited information is available about
the effects of repeated application of the pesticides, which is the general
agricultural practice. While previous studies have mainly used crude DNA
fingerprinting techniques (e.g. T-RFLP), very limited information on the
community structure of the environmental micro-biota could be obtained. Next
generation sequencing approach can offer a more global view of the soil
microbial communities, allowing the better assessment (at finer resolutions) of
phylogenetic diversity and potential metabolic pathways.
• Repeated applications of some pesticides have been known to influence the rate
of degradation, but there is still a lack of information on the legacy effects of CP
and IC. For example, after the loss of efficacy due to development of enhanced
degradation in soils, no CP was applied to Australian sugarcane farms (about 13
years ago); we have no knowledge of whether the microbial community with CP
degrading abilities still survive in absence of selection pressure from CP.
• Moreover, it has been observed, that enhanced degradation generally develops in
response to the repeated application of pesticide; information about the duration
of the phenomenon, and for soils to return to normal state, vary widely among
pesticides, soils and climatic conditions (Anderson et al., 1992), yet, no such
study has been conducted on CP and IC globally. This information is critical for
development of the pest management strategy. Since pesticides’ efficacy could be
compromised due to enhanced degradation it would cause adverse effect on the
production of any crop and significant economic loss of pesticide companies.
41

1.6 Aims and objectives
The overarching aim of the thesis was to determine the two-way interactions between
the xenobiotics and soil microbial communities in Australian soils using
organochlorine (TCE) and pesticides (CP, IC) as model compounds. A schematic
diagram of the approaches to achieve aims of this project related to pesticides
(Chapter 3-5) is given in Figure 1-10. On the other hand, the impact of TCE was
determined only on a specific group of soil microorganisms, namely methanotrophs
and thus a different approach was undertaken (described in Chapter 2). The work
presented here is split into four experimental chapters each with their own defined
aims, methods, results and discussion.
Chapter 2 aimed to determine the effects of CH4 concentration on CH4-assisted TCE
degradation as well as to characterise the active methanotrophs involved in the
biodegradation of TCE. This chapter tested the hypothesis that the high CH4
concentrations are required to maximise the production of MMO for efficient TCE
removal. This was accomplished using a modified stable isotope probing (SIP)
technique coupled with cloning and sequencing. The objectives of this chapter were:
a) To identify and characterise novel methanotrophs that promote TCE
degradation in Australian soils.
b) To determine that a positive relationship exists between CH4 concentration
and the rate of TCE biodegradation.
Chapter 3 aimed to determine the impacts of repeated pesticide (CP, IC)
applications on soil bacterial community composition and the rate of
biodegradation, in pesticide-treated and non-treated soils. This study tested the
hypothesis that the soils which have shown enhanced CP degradation previously,
42

will maintain their pesticide degrading capability due to legacy effect of the
pesticide. Secondly, repeated application of pesticides will have limited impact
on soil microbial communities due to rapid loss of pesticide via enhanced
biodegradation. The objectives of this chapter were:
a) To determine the response of soil microbial communities to CP and IC
treatments.
b) To identify potential long-term effects (legacy) of pesticides application on
metabolic capabilities of microbial communities
Chapter 4 aimed to enrich pesticide degraders (only CP) from Australian soils that
showed enhanced CP degradation under lab conditions (Chapter 3), followed by the
isolation and identification of the potential degraders. This chapter tested the
hypothesis that the enhanced CP degrading soils will enrich/select for bacterial
strains adapted to utilise CP and its primary metabolite, TCP, as a source of C and
nutrients. The objectives of this chapter were:
a) To identify the physiological characteristics of pesticide (CP) degraders.
b) To assess the potential of the isolated pesticide degraders for the degradation
of CP and its primary by-product (TCP) as a source of C, N and/or P.
Chapter 5 aimed to investigate, at high resolution, the impact of OP pesticide (CP)
on the soil microbial community and functional capabilities using next generation
sequencing technique approach. This chapter tested the hypothesis that legacy effect
of OP pesticide would negatively impact bacterial community structure and
metabolic functions in pesticide-treated sites. In light of this, the P-metabolism genes
will be over-expressed, relative to other genes, in pesticide-treated sites as many
43

bacteria are reported for their ability to utilise OP pesticide as P-source. The
objectives of this chapter were:
a) To determine the impact of pesticides on soil microbial diversity and
community composition
b) To identify the legacy impact of CP application on functional capabilities
with a focus on phosphate metabolisms.
44

Figure 1-10 Schematic diagram of approaches used to achieve aims of the project (Chapter 3-5). Xenobiotic-induced stress (when released into the environment) is thought to
affect the dynamics of the soil microbial community by: a) an extinction response where the sensitive microbial population gets eliminated from the system or b) development
of the microbial communities with innate capabilities to resist pollution and proliferate by direct utilisation of the compound for energy and nutrients (biodegradation).A
separate approach (described in Chapter 2) was undertaken to determine impact of TCE on soil microbial communities.
Pesticide-treated soils Non-treated soils
Physio-chemical properties
MicroRespTM T-RFLP
Biodegradation and environmental fate of xenobiotics
Impact on microbial metabolic capabilities and activities
q-PCR
Next-generation sequencing
Degradation studies Isolation of degraders
Microbial activitycarbon, nitrogen, pH and moisture
Community structure
Community abundance
Metabolic capabilities of community
45

Chapter 2: Characterisation of active methanotrophs involved in the methane-assisted biodegradation of trichloroethene (TCE) in three Australian soils
2.1 Introduction
Trichloroethene (TCE) is one of the most abundantly used organochlorine (OC)
solvents used as a degreaser in vapour degreasing, for cold cleaning metals and
various other industrial applications (Hazen et al., 2009). The primary sources of
TCE emissions are the industries that manufacture it or use it in production such as
chemical industry, rubber manufactures, pharmaceutical industries etc. As a result of
improper disposal, TCE enters the environment posing a serious concern of air, water
and soil contamination. Based on assessments by the National Industrial Chemical
Notification and Assessments Scheme (NICNAS, 2000), any product containing
more than 0.1% TCE is classified as a hazardous substance. The International
Agency for Research on Cancer (IARC, WHO) has also classified TCE as a
‘probable human carcinogen’.
In recent years there has been an increased interest in the use of microorganisms for
removal of chlorinated compounds, including TCE from the environment. One such
class of organisms, methanotrophic bacteria (also called methanotrophs), are
particularly well suited to facilitate the degradation of halogenated organic
compounds. Trichloroethene (TCE) bioremediation using methanotrophs is
considered one of the most efficient approaches because of their higher oxidation
rates of TCE than other degraders (Moran and Hickey, 1997). These bacteria utilise
methane (CH4) as their sole carbon (C) and energy source and have long been shown
to co-metabolise TCE by methane monooxygenase (MMO) enzymatic systems, both
46

the soluble (sMMO) and membrane bound particulate (pMMO) enzyme (Uchiyama
et al., 1995, Hanson and Hanson, 1996, Erwin et al., 2005, Wymore et al., 2007,
Semrau et al., 2010). This has drawn significant attention and various laboratories
(Lee et al., 2006, Shukla et al., 2009, Shukla et al., 2010a) and field studies (Conrad
et al., 2010) have established the effectiveness of the oxidative reactions mediated by
MMO in degradation of halogenated compounds (McCue et al., 2003). However, the
ability of the methanotrophs to sustain TCE degradation is critical. The degradative
enzyme MMO prefers its physiological substrate (i.e., CH4) and presence of CH4
may inhibit the TCE degradation by competitive inhibition (for active enzyme sites)
(Hanson and Hanson, 1996). This competitive relationship between TCE and CH4 as
the substrate thus plays a major role in the efficiency of biodegradation of TCE
(Strandberg et al., 1989, Oldenhuis et al., 1991). In this context, the effect of enzyme
competitive inhibition on TCE degradation has been observed previously (Mu and
Scow, 1994, Shih et al., 1996, Mars et al., 1998, Futamata et al., 2003); however,
there still remains limited knowledge on CH4 feeding operation strategies on the
competitive behaviour of methanotrophs that would eventually influence TCE
degradation.
Remediation processes using methanotrophs have been applied both in situ and ex
situ. In situ methods involve the bio-stimulation of indigenous methanotrophic
communities by adding methane and other nutrients to enhance the co-metabolic
degradation of halogenated organic compounds (Sutfin and Ramey, 1997, Eguchi et
al., 2001, Wymore et al., 2007). On the other hand, Shukla et al. (2010a) enriched
and isolated a mixed methanotrophic culture from uncontaminated soil to use for the
degradation of TCE in batch and continuous modes for ex situ bioremediation. The
47

authors reported that the methanotroph Methylocystis sp. was highly effective in TCE
degradation.
Most of the earlier studies on degradation of TCE were conducted with pure
methanotrophic cultures belonging to the genera Methylocystis, Methylomonas,
Methylomicrobium and Methylosinus (Oldenhuis et al., 1989, Koh et al., 1993, Im
and Semrau, 2011). For example, in a bioreactor-based study, pure cultures of
Methylosinus trichosporium and Methylocystic sp. were observed to degrade TCE
(Aziz et al., 1995). However, most of the methanotrophs are uncultivable under lab
conditions and the role of uncultivable methanotrophs to degrade halogenated
organic compounds remains limited. In order to combat the problems associated with
culture-dependent analyses, culture-independent molecular techniques allows
studying the uncultivable methanotrophs and their role in degradation.
Various functional genes, pmoA (encodes for pMMO), mmoX (encodes for sMMO
hydroxylase) and mxaF (encodes for methanol dehydrogenase), are available for
targeting methanotrophs. However, the pmoA gene has been found to be an excellent
functional marker as all the methanotrophs possess this gene except for the genera
Methylocella (Dedysh et al., 2000) and Methyloferula (Vorobev et al., 2011).
Methanotrophic diversity has been assessed in various environments using culture-
independent techniques like cloning, denaturing gradient gel electrophoresis
(DGGE), terminal restriction fragment length polymorphism (T-RFLP),
phospholipid-derived fatty acids (PLFA) and DNA microarrays (Newby et al., 2004,
Tresse et al., 2005, Qiu et al., 2008, Hazen et al., 2009, Vishwakarma and Dubey,
2010, Chiang et al., 2012).
48

Stable isotope linked to molecular and biochemical approaches have increasingly
gained attention as a novel tool for tracing the fate of labelled substrates (13C) and
linking function with taxonomic identification for complex environmental
communities (known as stable isotope probing, SIP) (Chen and Murrell, 2010). For
example, DNA-SIP has been widely employed to identify active CH4 oxidising
microorganisms in freshwater, marine sediments, terrestrial caves, soils and artic
lakes (Radajewski et al., 2000, Hutchens et al., 2004, Friedrich, 2006, Cébron et al.,
2007, Dumont et al., 2011, He et al., 2012, Kumaresan et al., 2014). For example,
one study where a DNA-SIP based technique was employed to detect the response of
methanotrophs to different temperatures showed that the identity and relative
abundance of active methanotrophs differed with incubation temperature (He et al.,
2012). Similarly, SIP of phospholipid fatty acids (PLFA-SIP) has been used to study
the activity and composition of methanotrophic communities in various ecosystems
(Singh and Tate, 2007, Chen et al., 2008b, Qiu et al., 2008, Murase et al., 2011,
Nazaries et al., 2011). SIP has been also applied to identify aerobic and/or anaerobic
naphthalene, anthracene (Zhang et al., 2012a), MTBE/TBA (Key et al., 2013), RDX
(Cho et al., 2013), and toluene degraders (Fowler et al., 2014). However, DNA-SIP
has not been applied to study TCE degradation by aerobic methanotrophs.
Hence, this study aims to identify and characterise novel uncultivable
methanotrophic consortia in Australian soils using SIP that promote biodegradation
of TCE in mixed microbial communities under different CH4 concentrations.
Although isolating pure methanotrophic TCE degraders from contaminated sites
provides an insight into linking functions to the biodegradation, the general
framework of this study was to assess the ability of whole communities (both
isolated and enriched cortium) to degrade TCE that would provide stronger evidence
49

for this relationship. For example, a potential TCE degrader in the lab does not
necessarily reveal the actual degradation reactions or the key microbial TCE
degrader in the field. Additionally, expanded knowledge on mode of TCE
biodegradation mechanisms would be useful for the development of strategies for
efficient bioremediation of the contaminated sites. In addition to this, CH4
concentration would also effect TCE transformation, and thus, I hypothesised, in
studies with longer incubation periods (e.g. field trials, bioreactors), high CH4
concentrations are needed to maximise MMO production and minimise competitive
inhibition for higher TCE removal efficiencies.
Mixed methanotrophic cultures were enriched from three Australian soils using
nitrate minimal salt (NMS) media, and their capacity for CH4 and TCE oxidation was
evaluated under different CH4 concentrations (1%, 10% and 33%). DNA-SIP was
used together with pmoA-based cloning and sequencing to better understand the link
between TCE degradation and the methanotrophic community. Labelled CH4 (13CH4)
was used as a substrate to track the activity and community structure of the active
methanotrophs (in microcosm) in response to TCE.
50

2.2 Materials and methods
2.2.1 Site description and sample collection
For this work several field sites were initially chosen in NSW (total=7). Three out of
seven sites were located at the Hawkesbury Forest Experiment (HFE), representing
forest, non-grazing pasture and grassland (latitude -33.61111o, longitude
150.74069o). The other four sites consisted of grassland and were located at
EucFACE driftway (latitude -33.61781o, longitude 150.74057o), Sydney University
ground (latitude -33.887551o, longitude 151.18734o), Victoria Park (latitude -
33.88611o, longitude 151.19274o) and the Botany Industrial Park (latitude -
33.95596°, longitude 151.21652°), respectively. All the sites, except for Botany
Industrial Park, were under vegetation and had never been exposed to high
concentration of halogenated organic compounds, particularly TCE. The site at
Botany Industrial Park, on the other hand, has a long history of chlorinated
hydrocarbon (hexachlorobenzene, chloroform, TCE) contamination. Contamination
of groundwater at Botany Industrial Park was first reported in 1990
(http://www.orica.com/).
At each site, four replicate soil samples were randomly collected. Each replicate was
composed of three soil cores taken by a soil corer by digging a hole about 10 cm
deep. The soil corer was sterilized with 70% ethanol each time a new
replicate/sample was collected within the same or different sites. Soil samples from
Botany Industrial Park were provided by School of Molecular Biosciences, the
University of Sydney, Australia. Fresh soil samples were wet-sieved through a 2mm
sieve to remove vegetation and other coarse particles from the soil.
51

2.2.2 Methane oxidation activity of soils
A microcosm study for CH4 consumption was performed on all the soils collected in
120 ml serum glass bottles. Five gram of each soil was added to 30 ml of NMS
media (Section 2.2.3) in serum glass bottles. Initial CH4 concentration in the
headspace was adjusted to 1% v/v of air headspace by injecting the appropriate
volume of pure CH4 (purity ≥ 99.0%; Sigma Aldrich, USA). The microcosms were
then incubated at 20oC in the dark and continuously shaken at 150 rpm. Gas samples
(250 µl) were collected periodically using a 250 µl gas-tight syringe. CH4 oxidation
activity was determined from the change in initial concentration of CH4. Soils
showing significant CH4 consumption (Sydney University, Victoria Park and Botany
Industrial Park) were further used in microcosm studies of TCE degradation.
Soil properties were also determined for the soils that showed CH4 oxidation activity.
The soils were analysed for total C and nitrogen (N) content, pH and moisture. For
determining soils total C and N, the samples were milled into a fine powder by using
a Retsch mill at frequency of 20 hertz for 2 mins. Total C and N content was then
quantified with a CHN analyser according to the manufacturer’s instructions (Leco
TruSpec Micro, USA). pH was determined in 1:2.5 (wt/vol.) diluted water
suspension and measured with a pH meter (Mettler Toledo, Australia). Soil moisture
content was assessed by measuring the difference of weight of soil samples before
and after oven drying at 105°C for 24 hours, and expressed as percentage of soil
weight.
52

2.2.3 Preparation of media
Unless otherwise specified, all media and buffers prepared were sterilised via wet
cycle autoclaving at 120oC, and 15 psi for 15 mins. Milli-Q (MQ) water was used for
preparation of all media, buffers and other molecular biology reagents. A nitrate
mineral salt (NMS) medium adapted from Whittenbury et al. (1970), was used in
both the enrichment and degradation studies. The NMS medium is mineral-based
with added N and contained (g/l):
Solution I: 1.00 g KNO3, 1.00 g MgSO4.6H2O, 0.2 g CaCl2 (anhydrous);
Iron EDTA: 3.8 g FeEDTA; Sodium molybdate: 0.26 g Na2MoO4.2H2O;
Trace elements solution: 0.2 g CuSO4.5H2O, 0.5 g FeSO4.7H2O, 0.4 g ZnSO4.7H2O,
0.015 g H3BO3, 0.05 g CoCl2.6H2O, 0.25 g EDTA di sodium salt, 0.02 g
MnCl2.4H2O, 0.01 g NiCl2.6H2O (solution stored in dark); Phosphate buffer:
Na2HPO4.12H2O, KH2PO4.
During the preparation of 1X NMS medium pH was adjusted to 6.8 with H2SO4.
Sodium molybdate (0.1% v/v), trace elements (0.1% v/v), Fe EDTA (0.01% v/v) and
phosphate buffer (1% v/v) were added aseptically after autoclaving to avoid
precipitation of salts. The C-source was provided in the form of gaseous hydrocarbon
(CH4 1% or 33% v/v of air headspace); filtered through 0.22 µm filters (Millipore,
USA). For the preparation of 5 mM TCE stock solution, 45 µl of TCE (purity ≥
99.5%; Sigma Aldrich, USA) was added to 100 ml Milli-Q (MQ) water in a 120 ml
serum glass bottle containing a magnetic flea. Following this, serum bottles were
sealed with a PTFE-lined butyl septum and aluminium crimp-top cap (Sigma, U.S.A)
and the stock solution was stirred until TCE globules were completely dissolved and
equilibrated (Cohen and Mccarty, 1991). The stock solution was wrapped in
53

aluminium foil and stored in darkness upside down. The TCE–saturated solution was
removed with a gas-tight syringe through the septum, avoiding bubbles, and added to
NMS media to get a final concentration of 50 µM along with CH4. Each serum bottle
(NMS+CH4/TCE) was shaken at 150 rpm for 30 minutes at room temperature (RT)
to equilibrate CH4 and TCE before analysis on the gas chromatograph (GC).
2.2.4 Headspace analysis
Methane and TCE concentrations in the microcosm headspace were measured on a
gas chromatograph (GC; Agilent Technologies, USA) using an analytical capillary
column HP-PLOT/Q (30 m x 0.53 mm ID x 40 µm; Agilent technologies), equipped
with a flame ionisation detector (FID), and run in splitless mode. Two hundred and
fifty µl headspace samples were injected onto the column using a Precision Pressure-
Lok® gas-tight syringe (VICI Precision Sampling, Inc.) with a stainless steel needle
cone tip, side port, point style 5 (Sigma, U.S.A) and analysed using a five minute
isocratic run. Operating temperatures for GC runs were set at 180oC for the oven,
200oC for the injector and 250oC for the detector at constant pressure (60 kPa). Ultra-
high purity nitrogen was used as a carrier gas, while the FID was supplied with high-
purity hydrogen, nitrogen and instrumental grade air. The retention times of CH4 and
TCE were 0.64 and 3.4 mins, respectively. Quantification of the analytes was done
via peak area, by referring to the external standard curves constructed from five data
points, using triplicates at each point.
54

2.2.5 Enrichment of methanotrophic consortia
The soils from the three sites Sydney University (SU), Victoria Park (VP) and
Botany Industrial Park (BI) actively oxidised CH4 (Section 2.3.1) and thus were used
for enrichment of mixed methanotrophic communities. Soil microcosms were set up
in triplicates similarly as described in Section 2.2.2 and enriched with CH4 as a
source of C (33% v/v of air headspace). The mixed methanotrophic cultures were
initially grown to the late exponential phase (OD600~ 1.2, nanodrop) and headspace
CH4 concentrations were determined regularly by GC. After >90% of CH4 was
consumed, the microcosm was flushed and re-equilibrated with air to ensure that the
microcosm remained aerobic. Further CH4 was added (33% v/v of air headspace) and
incubated until an OD600~ 1.2 was reached (Choi et al., 2013). The enriched
methanotrophic culture was also used to isolate cells by plating on NMS agar plates
and incubating under 33% CH4 concentration in a glass desiccator.
2.2.6 Effect of different CH4 concentrations on TCE degradation by
methanotrophic consortia
To determine the effect of CH4 concentrations on TCE degradation, two different
CH4 concentrations (1% and 33% v/v of air headspace) with TCE was added to each
microcosm (in NMS) to achieve a final concentration of 50 µM of TCE with the
desired CH4 concentration. The microcosms were incubated on a rotary shaker (150
rpm, 20oC) for 30 mins to equilibrate. Pre-grown cultures were then aseptically
transferred to equilibrating microcosms to a get a final OD600~ 0.2 (Lontoh and
Semrau, 1998). The microcosms were shaken vigorously for 5-10 seconds.
Immediately after that 250 µl headspace samples were taken for confirmation of
55

initial concentration of TCE and CH4 at 0 hr for all soil types (Section 2.2.4). The
degradation of substrates was monitored by taking samples at different time points
followed by GC analysis. Controls with and without CH4/TCE and abiotic control
(without culture) were also maintained for each TCE degradation assay set up.
Growth was also monitored via OD600 over the period of the degradation assay.
Stable isotope probing (SIP) incubations for the characterisation of enriched TCE-
degrading methanotrophic consortia were done as described in Section 2.2.2 and
2.2.4 except for that the microcosms were incubated with labelled CH4 (13CH4) (10%
v/v air headspace; Cambridge isotope laboratories, USA). A non-labelled 12CH4
exposed microcosm was also set up as a control for SIP. The microcosms were
incubated until all the CH4 had been consumed by each microcosm (two injections of
10% v/v air headspace).
2.2.7 Characterisation of enriched TCE degrading methanotrophic consortia
by molecular methods
2.2.7.1 DNA extraction and SIP fractionation
DNA was extracted from 30 ml of enriched culture (13C and 12C) in a sterile
environment. The enriched media was filtered via 0.22 µm pore size membrane filter
units (Stericup filter units, Millipore) by vacuum. The filters were removed in sterile
conditions from the disposable filter unit and DNA was extracted using
PowerWater® DNA isolation kit (Mobio, USA) following the manufacturer’s
protocol. The DNA was eluted in 50 µl and not in 100 µl as suggested by the
manufacturer. After DNA isolation, the concentration and purity of DNA was
56

confirmed by NanoDrop™ 2000C spectrophotometer (ThermoScientific) and DNA
was stored at -20oC until further analysis.
Cesium Chloride (CsCl) density gradient centrifugation and fractionation were
modified from a previously described method described (Zhang et al., 2011a).
Extracted DNA (~1 µg) from both labelled and control samples were added to CsCl
gradients with an initial density of 1.72 g/ml. Ultracentrifugation was done at
140,000 gav (70,000 rpm) in a S120VT vertical rotor (Hitachi, Japan) at 20oC with
vacuum for 60 h. Centrifuged gradients were fractionated from bottom to top into 18
equal volumes (~100 μl per fraction) by displacing the CsCl medium with sterile
water, using a hand-made fraction recovery system and a LSP02-1B syringe infusion
pump at a flow rate of 100 μl min-1 (Baoding Longer Precision Pump Co. Ltd.,
China). The buoyant density of each collected fraction was measured by weighing
the fractions from the blank gradient on a digital microbalance. DNA was
precipitated from CsCl overnight by adding two volumes of polyethylene glycol
(PEG) 6000 in 1.6M NaCl, washed with 70% ethanol and eluted in 30 µl of
nuclease-free water (Griffiths et al., 2000, Sharp et al., 2012). The primer sets used
in this study for the characterisation of methanotrophs are listed in Table 2-1.
57

Table 2-1 PCR and sequencing primers used in this study
Target Gene Fluorescent labeld Primer set Sequence (5’ to 3’)e References
pmoA (All methanotrophs)a
none 6-FAMTM
none
A189F A189F
Mb661R
GGNGACTGGGACTTCTGG GGNGACTGGGACTTCTGG
CCGGMGCAACGTCYTTACC
(Paszczynski et al., 2011)
16S rRNA (TypeII methanotrophs)
none none
VIC®
TypeII F TypeII R TypeII R
GGGAMGATAATGACGGTACCWGGA GTCAARAGCTGGTAAGGTTC GTCAARAGCTGGTAAGGTTC
(Chen et al., 2007)
pGEM®-T Easyb
+cloned productc none none
T7 SP6
TAATACGACTCACTATAGGG TATTTAGGTGACACTATAG
(Zhou et al., 2008)
aExcept Methylocella and Methyloferula sp. bVector kit (Promega Corporation, USA) cAmplified pmoA, cloned into the vector. d6-FAM™: 6-carboxyfluorescein; VIC®: registered trademark of Life Technologies Corporation eN represents A, C, T or G; M represents A or C; Y represents C or T; W represents A or T; R represents A or G
58
2.2.7.2 q-PCR of pmoA genes
The abundance of pmoA was determined on a rotor-type thermocycler (Corbett
Research; Splex) using the primer pairs A189F and Mb661R (Martineau et al., 2010,
Paszczynski et al., 2011). These primers can amplify the pmoA gene of most known
methanotrophs, with some exceptions (Dunfield et al., 2003, Stralis‐Pavese et al.,
2004). Each reaction was performed in a 20 µl volume using SensiFAST™ SYBR®
No-ROX Kit (Bioline Reagents Ltd). Reactions were set up as per the manufacturer’s
instruction (except 0.75 mg ml-1 bovine serum albumin was added to each reaction)
with 0.4 µM of each primer and 2 µl of fractioned DNA (heavy and light). Standards
were made from a 10-fold dilution of DNA template extracted from a pure culture
Methylosinus trichosporium, obtained from NCIMB following the manufacturer’s
instruction (Wizard® Genomic DNA Purification Kit, Promega).
After the initial denaturation at 95oC for 3 mins, PCR amplification conditions were
as follows: 40 cycles of 10 sec at 95oC, 10 sec at 53oC and 20 sec at 72oC. An
additional 15 sec reading step at 83oC was added at the end of each cycle. Melting
curve analysis was performed at the end of real-time PCR to check the specificity of
each reaction. After the range of fractions containing 13C-labeled DNA or unlabelled
(12C) DNA were identified by quantitative PCR (q-PCR), the fractions were
combined to compose a ‘heavy’ fraction and ‘light’ fraction, from each sample for
further molecular analysis (e.g. PCR, T-RFLP).
59

2.2.7.3 PCR amplification and T-RFLP analysis
Polymerase chain reaction (PCR) amplification of pmoA and 16S rRNA was
achieved using the primers A189F/ Mb661R and TypeII F/Type II R respectively
(Table 2.1). To minimise bias when amplifying genes from ‘light’ and ‘heavy’
fractions of the gradients, the sub-fractions in each gradient fraction from 13C-DNA
and 12C-DNA were pooled. CsCl gradient sub-fractions with densities between 1.65-
1.67 g ml-1 were considered light fractions and those between 1.70-1.73 g ml-1 were
considered heavy fractions (Dumont et al., 2011).
pmoA-based PCR reaction mixture contained (final concentration) 1X NH4+ reaction
buffer, 6 mM MgCl2, 200 μM of deoxynucleotide mix, 0.02U µl-1 BioTaq™ DNA
polymerase (all reagents from Bioline, UK), 0.3 μM of each primer (Sigma-Aldrich),
0.3 mg ml-1 bovine serum albumin (New England Biolabs, USA) and 2µl of DNA
template. For 16S rRNA-based PCR reaction (final concentration) 1X NH4+ reaction
buffer, 3 mM MgCl2, 200 μM of deoxynucleotide mix, 0.5 U µl-1 BioTaq™ DNA
polymerase (all reagents from Bioline, UK), 0.2 μM of each primer (Sigma-Aldrich),
0.3 mg ml-1 bovine serum albumin (New England Biolabs, USA) and 2 µl of DNA
template were used (Chen et al., 2007).
Both pmoA and Type II 16S rRNA genes (to cover genera that does not contain
pmoA gene) were amplified using PCR. For 16S rRNA the annealing temperature
was set at 60oC and 35 cycles were performed. For pmoA the annealing temperature
was set at 56oC and 30 cycles were performed. After initial denaturation at 96ºC for 5
min (95oC in case of Type II 16S rRNA), each PCR cycle consisted of 1 min at 94ºC,
1 min at the annealing temperature, 1 min at 72oC and a final extension at 72oC for
10 mins (Bodrossy et al., 2003). Amplification was performed in a total volume of
60

50 µl, for both target genes, in a DNA Engine Dyad® Peltier Thermal Cycler (Bio-
Rad, USA). Aliquots of the amplicons (3 µl) were checked by electrophoresis on 1%
(w/v) agarose gel stained with SYBR® Safe (Life Technologies, USA) and observed
using a Gel Doc XR+ system.
For profiling of the pmoA and 16S rRNA genes using T-RFLP analysis, labelled
primers were used (Table 2-1) and target genes were amplified by PCR as described
above. PCR products were purified using Wizard® SV Gel and PCR clean-up system
as per the recommendation by the supplier (Promega Corporation, USA). Purified
PCR products were then quantified with NanoDrop 2000C spectrophotometer
(Thermo Scientific) and approximately 200 ng of purified target gene was digested in
a 20 µl volume containing 1X NEB buffer with 0.2 mg ml-1 bovine serum albumin
and 10 U of restriction endonucleases: HhaI (pmoA) and MboI (16S rRNA) (all
reagents from New England Biolabs, USA). The reactions were incubated at 37oC
for three hours in a DNA Engine Dyad® Peltier Thermal Cycler (Bio-Rad, USA) and
the enzymatic reaction was stopped by incubation at 95oC for 10 mins.
Aliquots of digested PCR products (2 µl) were mixed with 7.7 μl of Hi-Di™
formamide and 0.3 μl of GeneScan™-600 LIZ® internal size standards (Applied
Biosystems, UK). The mixtures were denatured at 95°C for 3 min and then chilled on
ice. T-RFLP analysis was performed on an automated genetic analyzer ABI3500
(Applied Biosystems, UK). Terminal restriction fragments (T-RFs) generated by the
sequencer were analysed using the size-calling software GeneMapper™ 4.0 (Applied
Biosystems, UK) and quantified by advanced mode using second order algorithm. T-
RFs in a T-RFLP profile were selected by the software if their minimum peak height
was above 25 relative fluorescence units. Only TRFs between 25-600 bp were
considered in order to avoid peaks caused by primer-dimers and to obtain fragments
61

within the linear range of the internal size standard (Singh et al., 2007). T-RFs with
peak height comprising less than 0.5% were removed before downstream analysis
and the peaks that differed by less than 1 bp were binned into the same fragment. The
relative abundance of a T-RF in a profile was calculated as a proportion of the total
peak height of all the T-RFs in a profile for further analysis.
2.2.7.4 pmoA-based cloning, sequencing and phylogenetic analysis
The phylogenetic assignments of individual pmoA T-RF was confirmed using a
cloning and sequencing approach. This was performed only on the 13C-DNA
fragments from the SU soils to identify the methanotrophic community involved in
the TCE degradation. The pmoA gene was amplified, purified (as described in
Section 2.2.7.3), cloned using the pGEM®-T Easy Vector System (Promega
Corporation, USA) and transformed into E. coli JM109 competent cells (Promega).
To minimise PCR bias and sample variation, replicates from SU soil were pooled
prior to cloning. About 25 clones were selected from SU soil cloned library and
screened for pmoA gene inserts with the vector-specific SP6/T7 primers. PCR
amplicons were purified as described in Section 2.2.7.3.
Sequencing was performed using the BigDye Terminator cycle sequencing reaction
kit (v3.1 kit, Applied Biosystems). The quality of sequences were checked (edited,
assembled and aligned) using Sequencher 4.10.1 (Gene Codes Corporation),
excluding the primer regions that were present in all sequences. The good-quality
sequences thus obtained were then exported to ExPASy (http://web.expasy.org) to
translate nucleotide sequences of pmoA gene to confirm the presence of functional
proteins and no stop codons. Sequences were analysed for phylogenetic similarity in
62

the NCBI database (http://www.ncbi.nlm.nih.gov) using BLAST and related
sequences were included in alignments and compared with MUSCLE (MEGA 6). A
phylogenetic tree was constructed using MEGA 6 (Molecular Evolutionary Genetics
Analysis) (Tamura et al., 2013) by performing maximum likelihood tree analysis
with 1000 bootstrap replicates using Kimura-2 with the gamma distribution
algorithm (K2+G).
Furthermore, sequences obtained from individual clones were virtually digested
(HhaI recognition sequence) to predict T-RF size in Microsoft Office® Word. The
size of the in silico T-RFs was confirmed experimentally to match individual clones
with specific T-RFs in the 13C SU soil mixed cultures T-RFLP profiles. To do so,
DNA from the selected clones was amplified using labelled pmoA primers (Table 2-
1) and digested with HhaI as described previously in Section 2.2.7.3
2.2.8 Statistical analysis
Statistical data analysis was carried out with the software package IBM SPSS
Statistics 17 (SPSS, Inc.). To investigate the differences in the methane oxidation and
TCE degradation between different types of soils, an independent samples t-test was
carried out. Level of significance (p value) was set to at 0.05. The Univariate test
(SPSS, Inc.) was also used to determine the main soil properties (pH, moisture, total
C and total N) that would affect the methanotrophic community structure. Bacterial
community analysis was conducted using PRIMER v.6 (PRIMER-E Ltd, UK).
Relative T-RFLP abundance data (pmoA and 16S rRNA) that had been square root
transformed prior to analysis was used to generate a Bray-Curtis similarity matrix.
Multivariate analysis (PERMANOVA) was used to determine the influence of soil
63

type and methane type (12CH4/13CH4) on the methanotrophic community structure. A
non-metric multidimensional scaling (MDS) analysis was carried out using the
default programme settings to obtain an ordination diagram.
64

2.3 Results
2.3.1 Methane oxidation activity of soils
During 15 days of incubation, CH4 oxidation was rapid in three soil samples, namely
SU, VP and BI (Figure 2-1). A significant decrease in CH4 concentration was
observed within 5 days (VP soil) and 7 days (SU soil, BI soil) incubation at 20oC (p
<0.001). By contrast, no CH4 consumption was observed in the soils from HFE
forest, non-grazing pasture, grassland and EucFACE driftway even after 15 days of
incubation (p>0.05). Therefore, all further degradation experiments were carried out
on SU, VP and BI soils that showed active oxidation of CH4. Selected soil properties
of the methane-oxidising soils are given in Table 2-2.
Figure 2-1 Methane (CH4) oxidation by enriched methanotrophic consortia from different soils in
nitrate mineral salt (NMS) liquid media over time. Error bars represent standard error of the mean
(n=3). Legends: SU=Sydney university, VP=Victoria Park, BI= Botany Industrial Park, HFE=
Hawkesbury forest experiment
0%
30%
60%
90%
120%
150%
0 2 5 7 9 11 15
Met
hane
con
cent
ratio
n
Time (days)
SU
VP
BI
HFE Forest
HFE Grassland
HFE Pasture
EucFACEDriftway
65

Table 2-2 Selected soil properties of the soils from Sydney University (SU), Victoria Park (VP) and
Botany Industrial Park (BI) that showed methane oxidation activity.
Soil Properties pH Carbon
(%) Nitrogen
(%) Moisture
(%)
SU 7.1±0.2 3.3±0.1 0.2±0.0 1.4±0.1 VP 6.6±0.2 5.5±0.6 0.3±0.0 2.4±0.1 BI 7.2±0.0 1.3±0.1 0.02±0.0 5.8±0.0
2.3.2 Effect of different methane concentration on TCE degradation by a
methanotrophic consortium
Only the soils that showed CH4 oxidation activity (Figure 2-1) were selected for the
assessment of the effect of CH4 concentration on TCE degradation. When incubated
with 33% CH4 concentration, pre-grown cultures from all three selected soils
oxidised CH4 at a similar rate (p<0.001) (Figure 2-2a); however, only the SU
methanotrophic consortium was able to degrade (up to 30%) the added TCE (p<0.05)
(Figure 2-2b). Victoria park (VP) soil appeared to have some TCE degrading
capabilities but this was not statistically significant from the control (p>0.05),
whereas BI soils appeared unable to degrade TCE. The degradation of CH4 and TCE
started simultaneously in SU soil consortium (Figure 2.2a, b). The maximum
degradation of TCE by the SU soil methanotrophic consortium occurred during the
active phase of cell growth (Figure 2-2c) and stopped after two days, and no further
depletion of CH4 or TCE occurred (Figure 2-2 a, b) during the 8 day incubation
period.
66

Since TCE degradation stopped after two days, the experiment was repeated on
degrading SU soils with frequent sampling (hourly) to observe the TCE degradation
trend. The results suggested that the degradation of TCE started after 24 hours of the
incubation under 33% methane and the maximum degradation was observed at 36th
hour (Figure A-1a, b). The TCE concentration after this remained constant and no
further decrease was seen till the end the of incubation period. The degradation trend
was similar to the one when sampling was done every two days (Figure 2-2b).
All the enriched cultures were accompanied with an increase in biomass and SU
cultures show a sharp decrease in OD600 after 10 days of incubation (Figure 2.2c). No
decrease in the OD600 was observed in SU soil control where no TCE was added to
the microcosm (data not shown). When CH4 wasn’t added to the headspace gas of
the degrading soil microcosm (SU), neither TCE degradation (Figure 2-2d) nor cell
growth (data not shown) was observed.
On the other hand, although the pre-grown cultures from all the three soil types
completely oxidised 1% CH4 (p<0.001) (spiked 2 times) at the same rate, no
degradation of TCE (p>0.05) was observed, in this case, during 10 days of
incubation period (Figure 2-3a, b). 1% CH4 was completely consumed by the
growing cultures within two days of incubation (Figure 2.3a). Due to this rapid
decrease in CH4 concentration the microcosm were spiked with 1% CH4 another two
times. To maintain aerobic conditions, the microcosms were flushed with air before
injecting CH4, which also resulted in spiking the microcosm with TCE too (in total
three injections). No degradation of TCE can be ascribed to the low CH4
concentration resulting in decrease in biomass (Figure 2-3c) and operational stability
to degrade TCE.
67

Multiple injections of TCE resulted in declining CH4 consumption rates of the
consortium. Between days 0 and 6 CH4 was consumed within two days, but after the
second TCE spike on the 6th day the CH4 uptake rate decreased (Figure 2-3a). The
additive toxic effect of TCE might have caused this decline. Degradation of TCE and
no cell growth was also observed with any of the soil types in absence of CH4 (data
not shown). No loss of TCE and CH4 was observed in the abiotic controls (33% and
1% experiments, Figure 2-2, 2-3, respectively) suggesting the degradation occurred
due to microbial activity
Figure 2-2 (a-c) Methane oxidation (33%), TCE degradation and corresponding growth of mixed
cultures (control not shown) from three Australian soils; d) TCE degradation in SU cultures in
absence of CH4. Error bars represent standard error of the mean (n=3). The symbol (*) represents
statistically significant p values (when compared with controls). Legends: SU=Sydney University,
VP=Victoria Park, BI= Botany Industrial Park.
50%
80%
110%
0 2 4 6 8
Met
hane
con
cent
ratio
n
Time (days)
SU VPBI Control
50%
80%
110%
0 2 4 6 8
TC
E c
once
ntra
tion
Time (days)
50%
80%
110%
0 2 4 6 8
TC
E c
once
ntra
tion
Time (days)
0.2
0.5
0.8
1.1
0 2 4 6 8 10
Opt
ical
den
sity
(OD
600)
Time (days)
a
dc
b
**
*
*
* * *
**
*
* *
**
**
68

Figure 2-3 (a-c) Methane (CH4) oxidation (1%), TCE degradation and corresponding growth of mixed
cultures (control not shown) from three Australian soils where arrow represents re-spiking of the
cultures with CH4 and TCE. Error bars represent standard error of the mean (n=3). The symbol (*)
represents statistically significant p values (when compared with controls). Legends: SU=Sydney
University, VP=Victoria Park, BI= Botany Industrial Park.
0%
40%
80%
120%
0 2 2 4 6 6 8
Met
hane
con
cent
ratio
n
Time (days)
SU VP BI Controla
0
0.2
0.4
0.6
0.8
0 2 4 6 8 10
Opt
ical d
ensit
y (O
D 600)
Time (days)
c
60%
80%
100%
120%
0 2 2 4 6 6 8
TCE
conc
entr
atio
n
Time (days)
b
1st
appl
icatio
n
2nd
appl
icatio
n
3rd
appl
icatio
n
1st
appl
icatio
n
2nd
appl
icatio
n
3rd
appl
icatio
n
*** *** ***
**
69

The experiment was repeated with SU soil at 10% CH4 headspace concentration
based on the results of the TCE degradation experiments under 33% and 1% CH4
concentration. The addition of 10% CH4 promoted TCE degradation (up to 20%)
within 5 days of the incubation period (Figure 2-4). The degradation of TCE at 10%
CH4 was, however, lesser than in 33% CH4 (Figure 2-2b) further indicating that an
optimal CH4 concentration is required for high-density biomass production of
methanotrophs resulting in increased TCE degradation.
Figure 2-4 TCE degradation by the methanotrophic consortium from Sydney University (SU) soil at
10% methane (CH4) concentration in nitrate mineral salt (NMS) liquid media over time. Error bars
represent standard errors (n=3). Different letters indicate values that are significantly different
(p < 0.05)
50%
80%
110%
0 1 3 5
TC
E c
once
ntra
tion
Time (days)
TCEa
a
ab
b
70

2.3.3 Characterisation of enriched TCE degrading methanotrophic consortia
2.3.3.1 13C-labelling and q-PCR
The incorporation of 13C into DNA of the pre-grown cultures (SU, VP and BI soil,
Section 2.2.7.1) was measured by quantification of the relative abundance of pmoA
gene copies in each SIP fraction (Figure 2-5). The mixed cultures, from all soil types
grown in presence of 13CH4+TCE, showed an increase in DNA density and a clear
shift in the distribution of pmoA genes towards the heavy fraction (13C-DNA) when
compared with unlabelled DNA (12C-DNA) suggesting an incorporation of labelled
CH4 as a C-source. However, one of the replicate from SU soil was lost during SIP
incubation and further molecular analysis on SU soil was done using two replicates.
71

Figure 2-5 Distribution of the relative abundance of pmoA gene in CsCl gradient for 13CH4 and 12CH4
treatments during DNA-SIP microcosm of mixed cultures from three selected Australian soils: a)
Sydney University (SU) b) Victoria Park and (VP) and c) Botany Industrial Park (BI). A total of
eighteen fractions were recovered after CsCl ultracentrifugation of the 13C- and 12C-DNA. Relative
abundances rather than absolute pmoA gene counts were used to facilitate comparison. The y-axis
indicates relative abundance at each gradient fraction, with the total quantity detected from a gradient
(12C-DNA or 13C-DNA) equal to 1.0. Error bars represent standard errors (n=3 for VP, BI and n=2 for
SU soils)
0
0.1
0.2
0.3
0.4
0.5
1.64 1.66 1.68 1.7 1.72 1.74 1.76 1.78 1.8 1.82
Rel
ativ
e pm
oAco
pies
CsCl density (g ml-1)
12C 13C
0
0.1
0.2
0.3
0.4
0.5
1.64 1.66 1.68 1.7 1.72 1.74 1.76 1.78 1.8 1.82
Rel
ativ
e pm
oAco
pies
CsCl density (g ml-1)
0
0.1
0.2
0.3
0.4
0.5
1.64 1.66 1.68 1.7 1.72 1.74 1.76 1.78 1.8 1.82
Rel
ativ
e pm
oAco
pies
CsCl density (g ml-1)
a
c
b
72

2.3.3.2 T-RFLP analysis
Most of the replicates produced similar pmoA-based T-RFLP profiles of the
methanotrophic community, but there was a marked difference between the profiles
from BI, VP and SU soils on the whole. The most dominant pmoA T-RF that was
present in all the soil types was of size 124 bp, which dominated VP soil (82%) and
was well represented in SU soil (50%) and BI soil (35%) (Table 2-3). Another pmoA
T-RF of size 53 bp was abundant in SU soil (40%). The pmoA T-RF 53 was present
in VP soil but accounted for only 0.8% and it was not found in BI soil. On the other
hand, 16S rRNA-based T-RFLP profiles showed that one dominant T-RF of size
402-bp was present in BI soil (30%) and VP soil (32%) (Table 2-3). A list of other
dominant T-RFs associated with pmoA and 16S rRNA-based T-RFLP profiles in the
particular soils is given in Table 2.3.
PERMANOVA analysis revealed that the methanotrophic community structure
differed between soil samples from the three sites (Table 2-4). There was no
significant effect of methane type (total 12CH4 and active 13CH4) on the
methanotrophic populations. A univariate test (SPSS, Inc.) was also performed to
examine the effect of main environmental factors affecting the methanotrophic
community. It was observed that pmoA-based methanotrophic community differ
based on soil type where total C (p<0.05), total nitrogen (p<0.01) and moisture
(p<0.001) were found to be significant. However, for 16S rRNA-based, only soil pH
(p<0.05) was found to be significant factor.
73

Table 2-3 Relative abundances of T-RFs (%) produced after digestion of the pmoA and 16S rRNA genes with the restriction enzymes HhaI and MboI respectively for Sydney
University (SU), Victoria Park (VP) and Botany Industrial (BI) park soils. The sign (-) indicates absence or less than 1% dominance of the T-RF in the sample.
Soil type pmoA (HhaI) 16S rRNA (MboI)
TRF-35 TRF-53 TRF-77 TRF-124 TRF-402 TRF-522 TRF-524
Phylogenetic
assignment USC α
related
Methylococcaceae Methylococcaceae/
Methylocystaceae
Methylococcaceae/
Methylocystaceae
Methylocystaceae Unknown Unknown
SU - 40% - 50% - 35% 50%
VP - - 7% 82% 32% 35% -
BI 34% - 16% 35% 30% 40% 25%
74

Table 2-4 PERMANOVA table of results for the T-RFLP data versus different factors and their
interactions. (* 95% significance)
The results of the PERMANOVA analyses were supported by MDS biplot, which
showed that despite a significant impact of soil type, no noticeable influence of
methane type was observed for any of the site for both pmoA and 16S rRNA T-
RFLP data (Table 2-4). There were notable differences in the methanotrophic
communities (pmoA-based T-RFLP) associated with SU and BI soils, however,
methanotrophic communities from VP soil clustered with both SU and BI on the
MDS biplot (Figure 2-6). On the other hand, for 16S rRNA-based T-RFLP all the
three soil types (SU, VP, and BI) clustered separately from each other (Figure 2-7)
Factors p value
pmoA 16S rRNA
Soil type 0.007* 0.011*
Methane type (12CH4/ 13CH4) 0.939 0.967
Soil type*Methane type (12CH4/ 13CH4) 0.986 0.988
75
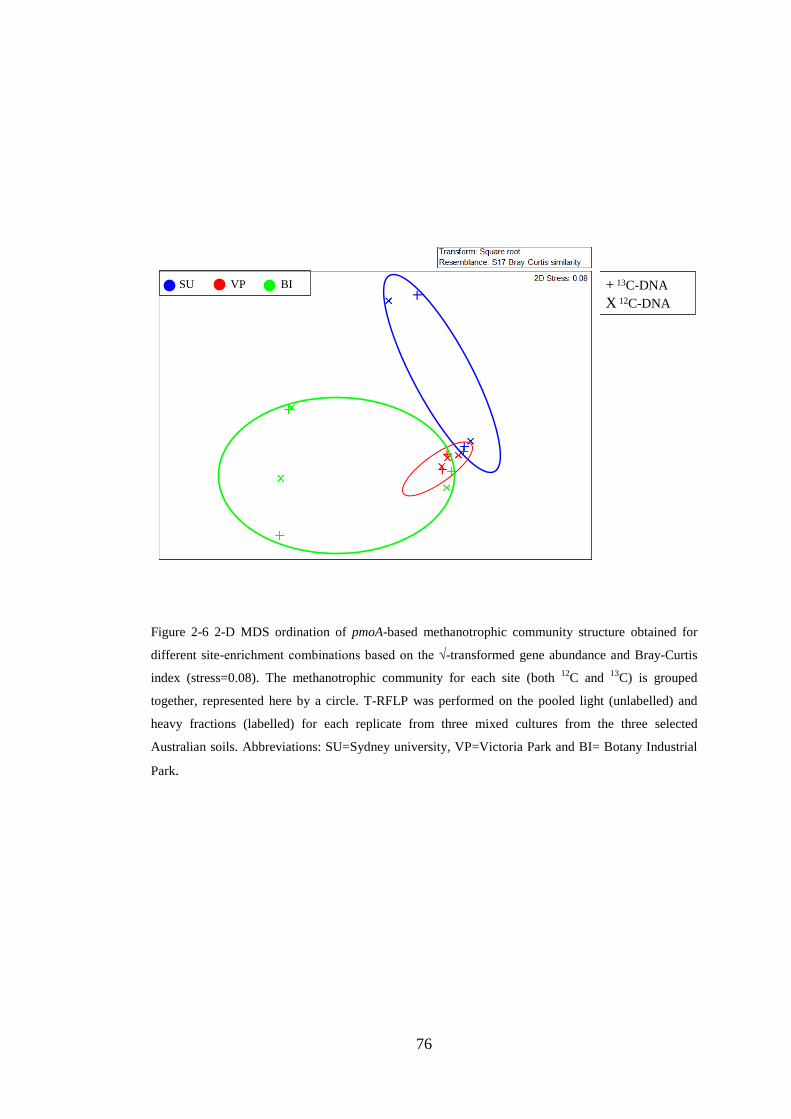
Figure 2-6 2-D MDS ordination of pmoA-based methanotrophic community structure obtained for
different site-enrichment combinations based on the √-transformed gene abundance and Bray-Curtis
index (stress=0.08). The methanotrophic community for each site (both 12C and 13C) is grouped
together, represented here by a circle. T-RFLP was performed on the pooled light (unlabelled) and
heavy fractions (labelled) for each replicate from three mixed cultures from the three selected
Australian soils. Abbreviations: SU=Sydney university, VP=Victoria Park and BI= Botany Industrial
Park.
+ 13C-DNA X 12C-DNA
SU VP BI
76

Figure 2-7 2-D MDS ordination of 16S rRNA-based methanotrophic community structure obtained
for different site-enrichment combinations based on the √-transformed gene abundance and Bray-
Curtis index (stress=0.09). The methanotrophic community of each site (both 12C and 13C) is
represented here by a circle. T-RFLP was performed on the pooled light (unlabelled) and heavy
fractions (labelled) for each replicate from three mixed cultures from the three selected Australian
soils. Abbreviations: SU=Sydney university, VP=Victoria Park and BI= Botany Industrial Park
2.3.3.3 pmoA-based cloning, sequencing and phylogenetic analysis
A total of 25 clones (numbered from 1 to 25) from 13C SU soil were selected for
further analyses, but 3 clones (13, 18, and 25) failed to produce the expected PCR
product and hence were excluded from further analysis. The remaining 22 clones
were all identified as pmoA gene sequences. Alignment of the pmoA sequences from
all 22 clones with the GenBank database showed that they were all related to pmoA
from Type I methanotrophs (Figure 2-8). Three major clone groups were identified;
thirteen clones (groups G1 and G2 with T-RFs 130 and 57 respectively) clustered
+ 13C-DNAX 12C-DNA
SU VP BI
77

within the genus Methylovulum showing 88% identity with Methylovulum
miyakonense HT12 (GenBank Accession no. AB501285) as the most closely related
cultured methanotroph. Seven clones (group G3 with T-RF 130) and one clone
(clone 14 with T-RF 130) clustered with the genus Methylobacter with 89%
similarity (GenBank Accession no. AF016982). Clone 4 showed 92% similarity with
Methylomicrobium album (GenBank Accession no. FJ713039). Different clustering
groups (G1, G2 and G3) were seen but they all belonged to the family
Methylococcaceae (Type I methanotrophs) (Figure 2-8). Although the clones showed
similarity to methanotrophic species from soil, sediments and TCE oxidation studies,
they were not closely related to any pure isolated culture. In contrast, most of the
pmoA sequences were closely related to uncultured methanotrophs/clones.
Clonal group G1 was 99% similar to an uncultured methanotroph from liquid manure
crusts (GenBank Accession no. JN790620), group G2 showed 99% similarity with
uncultured methanotrophs obtained from grassland soil (GenBank Accession no.
JF798628) and 98% similarity from landfill cover soil (GenBank Accession no.
EU292155) and group G3 was closely related (97%) to uncultured methanotrophs
from rice rhizosphere soil (GenBank Accession no. JQ671236). Likewise, clone 4
showed 99% similarity with uncultured methanotrophs from wetland soil (GenBank
Accession no. JQ038171), landfill soil (GenBank Accession no. EU275104), and rice
paddy soil (GenBank Accession no. JX113066), and clone 14 showed 96% similarity
with uncultured methanotrophs from landfill soil (GenBank Accession no.
EF472939) and lake sediments (GenBank Accession no. HQ383760). Thus, it
appeared that all the pmoA clones represented unknown/uncultured methanotrophs.
The in silico digestion of the clonal pmoA sequences with HhaI enzyme showed the
presence of two dominant T-RFs of 57 and 130 bp present among the different clonal
78

groups; only clone 14 did not contain a HhaI restriction site (Figure 2-8). Theoretical
T-RFs of the clones (T-RFs 57 and 130) were experimentally verified and showed
slight differences in size (T-RFs 53 and 124, respectively). This was considered to be
a normal drift due to capillary migration during electrophoresis. The slight difference
between the measured and predicted fragment lengths data has also been previously
reported (Xie et al., 2010b, Xie et al., 2011b). The T-RFs profile of the clones (in
silico and experimentally) confirmed the identity of T-RFs 53 and 124 as being two
distinct operational taxonomic units (OTUs) and distantly related to cultured
methanotrophs Methylomonas sp. as shown in Figure 2-8. Only the dominant T-RFs
were identified from the T-RFLP profile as the number of clones sequenced was
small (25) indicating the dominance of Type I methanotrophs in SU soil samples.
79

Figure 2-8 Maximum likelihood phylogenetic tree representing pmoA gene sequences derived from
the 13C fractions of mixed methanotrophic cultures from the SU soil that received 13CH4 and related
species based on the pmoA gene sequences retrieved from NCBI. The tree was rooted with
Nitrosomonas europaea. The Bootstrap values expressed as randomisation of 1000. The scale bar
represents the evolutionary distance of 0.1. The symbol ( ) indicates that the clone did not possess a
HhaI restriction site. Boxes represent the three different clonal groups (G1, G2 and G3) along with
their respective in silico-determined T-RF size.
T-RF 130
G1
T-RF 57
G2
T-RF 130
G3
Type
I m
etha
notr
ophs
Type
II m
etha
notr
ophs
80
2.4 Discussion
2.4.1 Methane oxidation activity of soil
The immediate and complete oxidation of 1% v/v CH4 in the SU, VP and BI soils
indicated the presence of microorganisms in soils that were actively consuming CH4
as a C-source, which resulting in the selective enrichment of low affinity
methanotrophic communities. The other four soils used in this study (HFE forest,
pasture, grassland and EucFACE driftway) did not show any signs of CH4 oxidation
during the 15 days of incubation presumably due to the absence of active
methanotrophs, slower rates of developing methanotrophic capacities and/or the high
concentrations of CH4 that the soils were exposed to. Methanotrophic communities
and activities are greatly affected by soil properties and environmental conditions
(Reeve et al., 2010), but as the environmental conditions were similar for all soil
microcosms (soil+NMS) the differences in the CH4 oxidation could be attributed to
the differences in composition of the microbial communities due to different soil
properties between sites (field conditions).
Previous studies have also reported the influence of soil organic matter (SOM)
content on CH4 oxidation rates, along with other parameters (Czepiel et al., 1995).
Since the methanotrophic communities were enriched from soil types that varied in
SOM content [0.7% in HFE soils (Barton et al., 2010); 0.5% in EucFACE], and the
soils with higher OM content (Table 2.2) showed accelerated CH4 oxidation, it could
thus suggest that there could be a link between the SOM content and maximal CH4
oxidation activity of soils (Börjesson and Svensson, 1997, Christophersen et al.,
2000, Merino et al., 2004). On the other hand, in the present study the BI soil had a
low SOM content like that of HFE and EucFACE soils, but showed similar CH4
81

oxidation activity to SU and VP soils. This could be due to the presence of an active
indigenous methanotrophic community in this soil (as those present in SU soil and
VP soil). BI is one of the many contaminated sites in the Sydney region and has a
long history of chlorinated hydrocarbon contamination. Studies on the microbial
community structure in hydrocarbon-contaminated areas have also shown greater
presence of methanotrophs compared with non-contaminated soils (Bowman et al.,
1993a, Yan et al., 2006, Allen et al., 2007). Thus it can be concluded that despite of
low soil OM content, BI soil showed an accelerated CH4 oxidation capacity due to
the presence of active methanotrophic communities.
2.4.2 Effect of methane concentration on TCE degradation by a
methanotrophic consortia
Mixed methanotrophic consortia were obtained from three different Australian soils,
grown under similar environmental conditions and different CH4 concentrations
(33% v/v and 1% v/v). The decrease in CH4 concentration (at both 33% and 1%
initial CH4 concentration) and an increase in cell growth (OD600), in all three mixed
consortia, suggested that CH4 was utilised as a source of C and energy. A time course
experiment established to determine the TCE degradation under 33% CH4
concentration showed degradation only with methanotrophic consortium in SU soils.
The degradation was fast enough in those soils to result in significant removal within
the set incubation time. Since all three consortia were grown under the same growth
conditions and could utilize CH4, the difference in TCE degradation could be
attributed to different inherent abilities of the particular methanotrophic populations
in degrading TCE. Similar results were reported previously where only three out of
82

eight mixed cultures of CH4-oxidising bacteria, from seven different water systems,
were able to degrade TCE in the presence of CH4 or methanol as a growth substrate
(Broholm et al., 1993).
The methanotrophic consortium from SU could not consume TCE as a source of
energy and growth, suggesting a co-metabolic mechanism of TCE degradation. This
was supported by incubating the methanotrophic consortium from SU under 1% CH4
or no added CH4 (control) where TCE was not consumed, while growth, as indicated
by turbidity (OD600), took place only in CH4 amended microcosm. Co-metabolic
degradation of TCE and other chlorinated organic compounds, with any organisms
having active oxygenases, has been widely reported (Ward, 1997, Suttinun et al.,
2013). For example, Methylosinus trichosporium OB3b expressing MMO is reported
to be involved in TCE co-metabolism (Oldenhuis et al., 1989, Fox et al., 1990, Chu
and Alvarez-Cohen, 1998). Other studies on TCE degradation by Pseudomonas
putida (Guo et al., 2001), degradation of chlorinated aliphatic hydrocarbons by
methanotrophs (Powell et al., 2014), and a field study on TCE removal from
groundwater (Conrad et al., 2010) also reported the co-metabolic degradation of
TCE.
CH4 oxidation and TCE degradation was accompanied by an increase in initial cell
OD600 but stopped after two days and remained constant through-out the incubation
period. This could be because of non-availability of oxygen as the system was
already saturated with a high concentration of CH4 (initial concentration of 33%) and
increased cell density (2 days) exhausted the oxygen supply more quickly. This was
also supported by incubating the methanotrophic consortium from SU under 10%
CH4 concentration where a gradual decrease in the TCE concentration was seen over
a period of 5 days (Figure 2.4). Since TCE is a volatile substrate, to avoid the loss by
83

evaporation the experiment was designed in a closed system and no oxygen loss
could be replaced. The oxygenase enzymes generally requires oxygen molecules
during the oxidation of both energy generating and co-metabolic substrates (Arp et
al., 2001) and thus lack of oxygen would have caused the inhibition of CH4 or TCE
degradation. This also resulted in the reduction in microbial growth, and eventually
death, in all three methanotrophic consortia. These results were in agreement with a
study where the increase in Pseudomonas fluorescens cell density resulted in
exhaustion of oxygen and leading to the reduction in micro-organism activity and
even death (Li et al., 2014).
A steep decrease in OD600 seen only for the SU consortium could be the result of
product toxicity resulting from TCE co-metabolism. Previous studies have reported
toxicity resulting from co-metabolic oxidation of chlorinated solvents (Alvarez-
Cohen and McCarty, 1991, Rasche et al., 1991, Ensign et al., 1992, Heald and
Jenkins, 1994, Field and Sierra-Alvarez, 2004, Jiang et al., 2010). This toxicity could
result in damage to the oxidative enzyme itself or damaging the cellular respiration
and viability of the bacterial community (Halsey et al., 2005). In another study Heald
and Jenkins (1994) showed similar results where TCE oxidation by Pseudomonas
putida containing toluene dioxygenase caused a decrease in the growth rate of
cultures and rapid cell death. A number of studies with methanotrophs have reported
either linear (Anderson and McCarty, 1994, Ely et al., 1995, Chang and Criddle,
1997) or exponential (Van Hylckama et al., 1996) inactivation of cells due to
chlorinated solvent oxidation. Tompson et al. (1994) showed that during a two-week
experiment, both linear and exponential inactivation models adequately fitted their
experimental data describing the degradation of TCE by resting cells of Methylosinus
trichosporium OB3b. The author also observed that cell inactivation was not solely
84
due to toxicity, but also due to starvation, deprivation of reductant and endogenous
cell decay.
It is worth pointing out that the degradation of both CH4 and TCE, in this study,
began simultaneously indicating a) the degrading enzyme(s) were co-ordinately
regulated or b) substrate competition for binding at the active site of the enzyme.
Substrate competition between primary and co-substrate has been reported earlier
where the rate of primary substrate utilisation was compared to the rate of TCE co-
metabolism. It has been shown that for CH4 degrading bacteria the rates of TCE
transformation are comparable to CH4 utilisation (Semprini, 1997). Some studies
reported that low TCE and high CH4 concentration have resulted in the inhibition of
TCE transformation as all the active sites on the MMO are occupied with CH4
(Strandberg et al., 1989, Alvarez-Cohen and McCarty, 1991, Landa et al., 1994,
Kang et al., 2001, Suttinun et al., 2013).
A previous study that tested the effect of CH4 on the degradation of TCE by
Methylosinus trichosporium OB3b found that the TCE degradation rate decreased in
the presence of CH4 (Oldenhuis et al., 1991). Similar results were observed with the
degradation of TCE and trans-1,2 dichloroethylene (DCE) by a methanotrophic
consortium in a fixed-film packed-bed bioreactor (Strandberg et al., 1989). The
authors also suggested that if there was a substrate competition between CH4 and
TCE/DCE for the MMO enzyme, then the restriction of the CH4 supply might have
improved the TCE degradation rate. However, it should be noted that the duration of
experiments in those studies ranged from few minutes to hours. In experiments with
longer incubations (e.g. in reactors), it should be noted that the rate of degradation
depends greatly on the amount of biomass present and thus increasing TCE
concentration would not help as it will decrease the growth of the active cells and
85

eventually leading to no degradation. This is also supported by a study in which a
model incorporated cell growth and decay to understand the mechanism of co-
metabolic degradation of TCE and phenol by Pseudomonas putida (Chen et al.,
2008a). The study reported that growth of cells decreased under higher TCE and
declined to zero in low phenol concentration. Similar observations were made in a
study that evaluated a model for co-metabolism of TCE and CH4 by methanotrophic
mixed cultures (Chang and Criddle, 1997). The model suggested that the amount of
CH4 needed to sustain transformation of TCE was related to the incubation time in a
system and microorganisms could not sustain TCE transformation when TCE
concentration was too high relative to CH4. Another study also reported an increase
in the rate of TCE degradation when the initial OD600 of the culture increased (Li et
al., 2014). Our results demonstrated that SU consortium under high CH4
concentration resulted in higher cell density of the methanotrophic community and
degraded more TCE when compared to 10% and 1% CH4 concentration. Thus for
maximum TCE degradation to occur optimal biomass, CH4/TCE ratio and oxygen is
required. These findings provide additional information about the interaction
between CH4 and TCE degradation (based on the competitive inhibition), which
often limits the efficacy of the in situ bioremediation process, and thus could be
useful in engineering models or tools for the effective in situ bioremediation of TCE
contaminated areas.
2.4.3 Characterisation of TCE degrading methanotrophic communities
The effect of microbial community structure on TCE degradation was tested by
fingerprinting of the pmoA and 16s rRNA genes using T-RFLP. 16S rRNA genes T-
86

RFLP was performed to identify the relative abundance of methanotrophs that do not
possess pmoA genes (Methylocella and Methyloferula). The analyses of T-RFLP
profiles of pmoA and 16S rRNA genes using PERMANOVA showed that the TCE
degrading methanotrophic community from SU soil was different from that of VP
and BI soils. T-RFLP result of SU replicates (pmoA and 16S rRNA) showed some
differences in their profiles, which might have resulted from an inherent spatial
variability. This was also evident from the difference in TCE degradation by the
replicates (data not shown). Soil is one of the most complex and species-rich
environments on Earth and there is often significant variability in community
composition even at very fine scales within sites (Nielsen et al., 2012). In a recent a
recent study, Ramirez et al. (2014) showed that soil samples collected in Central
Park (New York City, USA) per unit sampling effort harboured nearly as many
distinct soil microbial phylotypes and types of communities as found in biomes
across the globe further indicating substantial within-site heterogeneity.
Comparison of the pmoA-based T-RFLP profiles, confirmed the dominance of T-RF
53 (distantly related to Type I methanotrophs) only well-represented in TCE
degrading SU soil. On the other hand, the 16S rRNA results showed the complete
absence of T-RF 402 in the SU soil, suggesting the enrichment of Type I
methanotrophs in SU soil in presence of TCE. The pmoA-based cloning data together
with T-RFLP data supported that Type I methanotrophs were potential degraders of
TCE in SU soils.
TCE can be degraded by a diversity of bacteria such as methanotrophs and species of
Pseudomonas (Landa et al., 1994, Cox et al., 1998). In this study, TCE was likely
degraded by a methanotrophic consortium from SU soil as evident from no
degradation of TCE in absence or low concentration of CH4. However, all attempts
87

to culture methanotrophs from SU soil were unsuccessful. Therefore, 13C pmoA-
based molecular analyses coupled with SIP approach was applied to identify the
active TCE degraders (Radajewski et al., 2000). From the pmoA-based cloning and
sequencing data two dominant T-RFs (57 and 130 bp) were identified, indicating the
dominance of two distinct types of methanotrophs. The pmoA data (though limited)
showed that the sequences of the unclassified bacteria obtained in this study were not
closely related to any cultured methanotrophs. Most of the sequences only showed
88-89% similarity with any other cultured sequence in the GenBank database. The
clones also showed a low similarity with a cultured sequence obtained from estuary
sediment (AF016982) capable of TCE oxidation (Smith et al., 1997). The most
closely related sequences came from several uncultured and unclassified species.
Therefore, the microorganisms represented by fragments 57 and 130 bp (HhaI
digest) could be novel candidate degraders of TCE. No pmoA sequences affiliated
with Type II methanotrophs were found.
Although the clones were not closely related to any of cultured methanotrophic
species, they clustered together within the family Methylococcaceae indicating the
dominance of Type I methanotrophs in the SU soil. A similar observation was
reported where Type I methanotrophs dominated in a nutrient rich soil and played an
important role in the TCE degradation (Baker et al., 2001, Knief et al., 2006, Kong et
al., 2014). Thus in this study, the abundance of Type I methanotrophs might be
attributed to the high CH4 mixing ratio and nutrient condition such as organic content
(3.3%) of the soil from which the communities were isolated/enriched. In addition to
this, the higher abundance of T-RF 53 (SU soil),belonging to Type I methanotroph,
exposed to TCE suggested that this particular TRF might be tolerant to TCE and play
an important role in TCE degradation. No previous work has reported the role of this
88

methanotrophic strain (T-RF 53) in TCE degradation. Although uncultivable, the
enrichment for this strain from the SU soil can be used for mesocosm and field
studies to confirm its capability to remove TCE from the polluted environment.
89

2.5 Conclusion
This study aimed to characterise the novel methanotrophs in CH4-assisted
degradation of TCE. Activity and community structure of methanotrophs varied in
the three soils (SU, VP and BI) exposed to TCE. Type I methanotrophs, in particular
pmoA T-RF 53 dominated the SU soil and seemed tolerant to TCE, and is likely to
play an important role in TCE degradation. Further assessments of uncultivable
(while enriched) microbes related to this T-RF (53) would provide better
understanding of the activity and community structure of methanotrophs in TCE
contaminated soils and their degrading ability can be harnessed for successful
removal of the compound. It was observed that maximum degradation of TCE was
achieved at high CH4 concentrations (33%). The higher methane concentration
resulted in high-density biomass production of degrading methanotroph and thus, the
feeding strategies can be used to manipulate indigenous methanotrophs in natural
environment to improve the efficiency of in situ bioremediation. Furthermore, an
additional insight on the microbial ecology of aerobic TCE degradation in mixed
culture consortia was obtained and an important link between metabolic activity and
phylogeny, which is often lacking in mixed culture studies, was illustrated.
90

Chapter 3: Effects of chlorpyrifos (CP) and imidacloprid (IC) on soil bacterial community composition
3.1 Introduction
Synthetic pesticides are purposely introduced and extensively used in agriculture as
part of control strategies to protect crops against weeds, insects, fungi and other pests
(Yang et al., 2007). According to the guidelines for the approval of pesticides, they
should be used in a way that their residues don’t build-up in the environment and
have minimal effect on the non-target organisms (Lo, 2010). However, the amount of
pesticides applied that reaches the target organism is only about 0.1%, with the
remaining bulk contaminating Earth’s ecosystems and affecting public health by
entering the food chain (Carriger et al., 2006). On the other hand, some of the
important cash crops like sugarcane require repeated application of different types of
pesticide (Singh et al., 2002b), raising the concern on its possible long term negative
side-effect on the soil microbial communities.
Soil microorganisms play a vital role in important nutrient cycling and organic
matter decomposition, contaminant removal and overall soil health (Wainwright,
1978, Lo, 2010). As pesticides are designed to be biologically active (Schuster and
Schröder, 1990), extensive and excessive application often harm and influence the
activities of the soil microbial communities (Omar and Abdel-Sater, 2001, Singh and
Singh, 2005a), causing soil pollution (Antonious, 2003) and effecting the
sustainability of agro-ecosystems. A lot of research have been conducted that
focused on the use of pesticides alone (Getenga et al., 2000, Xie et al., 2004, Gundi
91

et al., 2005) or in combination (Singh et al., 2002b, Wang et al., 2007a, Chu et al.,
2008) to study the adverse impacts on soil microbial diversity and activities (Ingram
et al., 2005, Wang et al., 2006, Littlefield-Wyer et al., 2008). However, studies often
report idiosyncratic effects of pesticides on soil microorganisms and soil enzymes
(Sannino and Gianfreda, 2001, Jjemba, 2002, Singh and Singh, 2005b). Certain
pesticides stimulate the growth of microorganisms, but others suppress or have no
effects when applied at normal rates. Hence, it is difficult to predict the relationship
between pesticide and its impact on various groups of soil microorganisms.
Likewise, some microbial groups are capable of utilising pesticides as a source of
energy, whereas the pesticide might be toxic to other groups (Johnsen et al., 2001).
Detailed research has also shown that repeated application of pesticides results in the
increased rate of microbial degradation leading to the loss of the efficacy of the
pesticide against target pests (Roeth et al., 1990, Arbeli and Fuentes, 2007).
Chlorpyrifos (CP) is one of the most widely used organophosphorus (OP) pesticide
against a broad spectrum of insect pests of economically important crops, like cotton
and sugarcane (Kale et al., 1999, Mallick et al., 1999, Fang et al., 2006, Singh and
Walker, 2006, Wang et al., 2007b). The half-life of CP is generally between 10 and
120 days in soil but can be up to one year depending on soil type, soil moisture, pH,
climate and other environmental factors (Howard, 1991, Singh and Walker, 2006)
with 3,5,6-trichloro-2-pyridinol (TCP) as the major degradation product. Between
the years 2002-2006, the average annual global use of CP was 25 million kg active
ingredients (AI) (Pengphol et al., 2012). In Australia itself, CP has gained wide
usage in agriculture dating from mid 1960s and currently there are 164 CP-
containing products registered in Australia (http://apvma.gov.au/).
92

Unlike other OP pesticides (e.g. diazinon) that failed to provide adequate control
against target pests due to the enhanced degradation in the soil (Sethunathan, 1971),
CPs stability and effectiveness against a wide range of pests has resulted in large
scale use of CP across the globe. It was suggested that the accumulation of TCP, the
major degradation product of CP, has antimicrobial properties preventing the
proliferation of CP degrading microorganism resulting in lack of development of
enhanced CP degradation (Racke et al., 1990). However, following the repeated use
of CP, an increased number of crop failures have been linked to CP inadequacy to
control pests in Australian sugarcane farms since 1992. The failure of CP to control
pests in those soils, as a result of enhanced degradation, was first reported by
Robertson et al. (1998). The report found that CP was abiotically hydrolysed to TCP
in the alkaline soils and the enhanced microbial degradation of TCP was associated
with the loss of the efficacy of CP in the soils. Although soil pH has been shown to
be associated to the hydrolysis of CP, no consistent relationship between high pH
and chemical lysis of CP has been confirmed (Racke et al., 1996, Singh et al.,
2003a). It was not until later in 2003 that the role of microorganisms in the enhanced
degradation of CP was first reported from Australian soils with a history of CP use
(Singh et al., 2003a). This study highlighted the adaptation of soil microorganisms to
the repeated exposure of CP (for more than 14 years) and development of capabilities
to degrade CP as a source of energy.
Following the enhanced degradation and loss of efficacy in most of the Australian
sugarcane farm soils (about 13 years ago) CP was replaced by imidacloprid (IC) as a
choice of pesticide and IC is now widely used for the control of insects including
termites, white grubs and beetles. Due to its high insecticidal activity at low
application rates and long residual activity, IC is regarded as a promising broad-
93

spectrum pesticide. Half-lives of this pesticide in soils usually ranges from 40 days in
an unamended soil to 124 days for soils recently amended with organic fertilizers
(Rouchaud et al., 1994), and for the most common seed treatments the half-life
reported range from 28 to 1250 days in soils (Goulson, 2013). However, there have
been no reports about the impacts of repeated IC applications on their persistence
(enhanced degradation) and soil microbial communities. While studies have shown
the influence of the repeated application on degradation rates of CP and impact on
soil microbial activities, legacy effects of CP on the soils that showed enhanced
degradation has not been investigated. There is also no knowledge on whether the
previously CP-treated soils (with enhanced degradation capability) has restored to
their original state (in terms of functional capabilities) after they were not exposed to
CP post loss in efficacy (13 years ago).
The aim of this study was to determine the effects of two selected pesticides (CP and
IC) on soil microbial community and activity in two soil treatments; one without
previous history of pesticide application and the one that has been repeatedly
exposed to pesticides (both CP and IC, showed enhanced CP degradation). These
pesticides were selected to reflect current commercial applications, for they are
widely used (in rotation) to curb grubs in the Australian sugarcane farms. Although
previous literature has provided some insight into the interaction between pesticides
and soil microbial communities, there is a lack of complete information on the effect
of long-term CP and IC exposure on adaptation responses associated with functional
stability and structural composition of soil microorganisms. Long-term studies on
agro-ecosystem are important as they provide opportunities to study the impacts of
various biological interactions on soil quality, which is important in projecting long
term productivity of soils (Rasmussen et al., 1998).
94
In this study, I hypothesised that soils which have previously shown enhanced
degradation of CP, will maintain their capability to degrade pesticides even in the
absence of any application of the compounds for 13 years (legacy effect). In addition
to this, in soils with enhanced degradation, repeated application of CP will have
limited impact on soil microbial community due to rapid loss of pesticides. It can be
argued that in the absence of selection pressure or nutritional advantage (e.g. in
absence of CP application), microbes could lose their genetic ability to degrade
pesticides, and hence enhanced (CP) degradation capability would be lost; however,
no experimental evidence is available for any legacy impacts of enhanced
degradation of any pesticide. Such knowledge is not only important for advancement
of ecological science but also for economic reasons. For example, developing and
manufacturing of chemical pesticides need significant investment and loss of
efficacy can lead to a significant economic burden on the manufacturer.
Particular emphasis was placed on bacteria as they are the most abundant and
important part of soil micro-flora because of their key role in the biogeochemical
cycles of important elements like carbon (C), nitrogen (N), and sulphur (S). The soil
bacterial diversity was analysed before and after repeated applications of CP and IC.
As it has been estimated that only 0.1% of bacteria can be cultured (Amann et al.,
1995), a cultivation-independent approach was taken to understand the
interrelationship between bacteria and their pesticide environments. The response of
bacterial respiration rate to pesticides was measured and the effect on the bacterial
community composition evaluated using soils from five sugarcane farms. Soil
bacterial communities were compared by q-PCR and T-RFLP analysis of 16S rRNA
gene, amplified from total community DNA to evaluate the impact of pesticides on
the bacterial soil community.
95
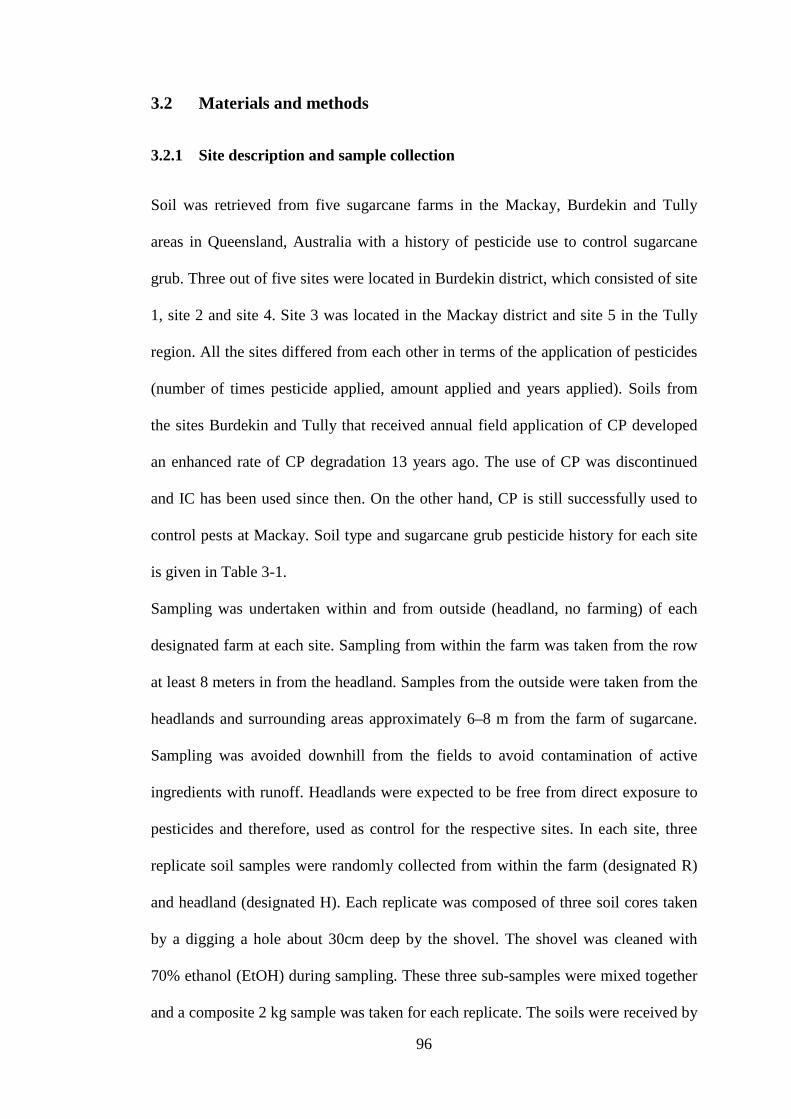
3.2 Materials and methods
3.2.1 Site description and sample collection
Soil was retrieved from five sugarcane farms in the Mackay, Burdekin and Tully
areas in Queensland, Australia with a history of pesticide use to control sugarcane
grub. Three out of five sites were located in Burdekin district, which consisted of site
1, site 2 and site 4. Site 3 was located in the Mackay district and site 5 in the Tully
region. All the sites differed from each other in terms of the application of pesticides
(number of times pesticide applied, amount applied and years applied). Soils from
the sites Burdekin and Tully that received annual field application of CP developed
an enhanced rate of CP degradation 13 years ago. The use of CP was discontinued
and IC has been used since then. On the other hand, CP is still successfully used to
control pests at Mackay. Soil type and sugarcane grub pesticide history for each site
is given in Table 3-1.
Sampling was undertaken within and from outside (headland, no farming) of each
designated farm at each site. Sampling from within the farm was taken from the row
at least 8 meters in from the headland. Samples from the outside were taken from the
headlands and surrounding areas approximately 6–8 m from the farm of sugarcane.
Sampling was avoided downhill from the fields to avoid contamination of active
ingredients with runoff. Headlands were expected to be free from direct exposure to
pesticides and therefore, used as control for the respective sites. In each site, three
replicate soil samples were randomly collected from within the farm (designated R)
and headland (designated H). Each replicate was composed of three soil cores taken
by a digging a hole about 30cm deep by the shovel. The shovel was cleaned with
70% ethanol (EtOH) during sampling. These three sub-samples were mixed together
and a composite 2 kg sample was taken for each replicate. The soils were received by
96

post and kept at 4oC in the dark until use in degrading experiments. Fresh soil
samples were sieved through 2 mm sieve to separate vegetation and other coarse
particles from the soil. Figure 3-1 illustrates an example of the sampling pattern for
each of the five sites.
Figure 3-1 A schematic diagram of sampling pattern for each sugarcane farm site. R represents the
samples collected from within the farm with previous pesticide history. H represents the samples
collected from headland with no previous pesticide history. ss1, ss2 and ss3 represent the three sub-
samples of each replicate.
R
HHeadland
R1ss1
ss2
ss3
R2ss1 ss2
ss3
R3ss1 ss2
ss3
H3ss1
ss2
ss3
H2
ss1ss2 ss3
H1
ss1ss2
ss3
FIELD
Road
Next farm of sugarcane
Headland
97

Table 3-1 Pesticide history of five sugarcane farms in Queensland used in this study.
Site Region History of use of sugarcane grub control products*
(past pesticide treatment) 1 Burdekin
(latitude -19.59683o, longitude 147.38606o)
Clay loam soil that had rapid degradation/greyback grub failures following use of suSCon
Bluea in 1990’s. suSCon Maxic (15 kg/ha) subsequently used 3 times per year since
permitted in 2002
2 Burdekin (latitude -19.86424o,
longitude 147.24409o)
River loam soil that had rapid degradation/greyback grub failures following use of suSCon
Plusb in 1990’s. suSCon Maxi (14 kg/ha) subsequently used 2 times per year since permitted
in 2002
3 Mackay (latitude -21.12813o,
longitude 149.06880o)
Red clay soil where suSCon Blue is still successfully used for French’s sugarcane grub
control and has been used at least 2-3 times per year in the last 12 years.
4 Burdekin (latitude -19.86424o,
longitude 147.24409o)
River loam where there has been use of suSCon Blue in 1990’s. suSCon Maxi (15 kg/ha)
subsequently used 2 times per year since permitted.
5 Tully (latitude -19.59683o,
longitude 145.94784o)
Sandy loam soil with history of suSCon Blue treatment in 1998 and 2001. suSCon Maxi (15
kg/ha) subsequently used 3 times per year since permitted.
(*) data available till the year 2012 suSCon is the commercial product name of Crop Care (Australia) aactive ingredient chlorpyrifos (140 g/kg) bactive ingredient chlorpyrifos (75 g/kg) cingredient imidacloprid (50 g/kg).
98

3.2.2 Soil properties
All the soils were analysed for total C and N content pH and moisture. All soil
parameters measured are given in Table 3-2. Details of the methods of analysis are
described in Section 2.2.2.
3.2.3 Experimental design and pesticide treatment
Commercial formulation of CP 500 EC (500 g/L, Nufarm) and IC 350 SC (350 g/L,
Apparent Pty Ltd) were used in this study. About 250 g of soil (both R & H type)
from all the five sites were placed into plastic jars and mixed with solutions of CP or
IC to a final concentration of 10 mg/kg. Soils treated with the pesticide were left for
3 to 4 hours in a fume hood for drying. The water holding capacity of the soil was
adjusted to 40% and was maintained by regular addition of Milli Q water. Each
treatment including the control was performed in triplicate.
The screw cap plastic jars containing the treated soil were incubated and maintained
under aerobic conditions, in the dark at room temperature. All the soil-pesticide
combinations were sampled periodically upto 105d for CP/ 102d for IC to determine
the microbial properties and degradation of pesticides. After 45d CP/ 43d IC, or
when more than 75% of the initial concentration of the pesticides disappeared,
another spike of the appropriate pesticide was applied to the soil at final
concentration of 10 mg/kg. The soils were retreated with the third application of
pesticide (10 mg/kg) on 50d CP/ 55d IC after the second treatment, when maximum
degradation of pesticide took place. In addition to this, soil samples (25 g) treated
with antibacterial and antifungal agents, chloramphenicol and cycloheximide (1 ml
99
each; 5 mg/ml in water), respectively (Singh et al., 2003a) were also maintained. All
the soil-pesticide combinations described above, with their untreated controls, were
investigated to determine the effect of pesticides on soil bacterial communities.
3.2.4 Determination of CP and IC
Pesticides and their metabolites were extracted from soil (2.5 g) by mixing with
acetonitrile:water (90:10, 5 ml) in McCartney glass vials. The vials were vortexed
and the pesticide extraction was done by shaking the mix for one hour on a shaker
(130 rpm). The samples were centrifuged for five minutes at 15000 rpm and the
supernatant was filter sterilized through a 0.22 µm nylon syringe filter for HPLC
analysis using Agilent 1260 Infinity HPLC system. CP and IC were separated on
Agilent Poroshell 120 column (4.6 x 50 mm, 2.7 µm) with Agilent ZORBAX Eclipse
Plus-C18 guard column (4.6 x 12.5 mm, 5 µm). The injection volume was 10 µl and
the mobile phase was acetonitrile:water (75:25), acidified with 1% phosphoric acid.
The analytes were eluted at 40 °C with isocratic mobile phase flow rate of 0.8
ml/min for 4.5 min. The pesticides were detected spectrophotometrically at 230 nm
(CP) or 270 nm (IC).
3.2.5 Community respiration and substrate induced respiration (SIR)
Functional activities (basal respiration and SIR) of two pesticides (CP and IC) treated
soils were measured using MicroRespTM (Macaulay Scientific Consulting, UK), as
described by Campbell et al. (2003) and compared with their untreated controls after
first pesticide application (45d CP/ 43d IC). Approximately 0.3 g of the soil samples
100

were delivered to each well in the 96- deep well microplates. The microplates were
incubated for 24 hours at room temperature (RT) in the dark before the assay was
carried out. To measure the SIR, filter sterilized glucose (Sigma Aldrich, USA) was
supplied at 30 mg ml-1 of water contained by the soils, to the wells. Sterile deionised
water was delivered to the wells to measure the basal respiration. All the additions,
for both basal and SIR, were done in replicates (n=3). Prior to addition of
glucose/deionised water, CO2 detection plates were read (T0). The deep-well plates
were sealed with the pre-read CO2 detection plates and incubated at 25°C for 6 hours
in the dark, as per the manufacturer’s protocol. The change in optical density was
then measured on a spectrophotometer microplate reader (EnSpire® 2300 Multilabel
Reader, Perkin Elmer, USA) at a wavelength of 570 nm (T6). The rate of CO2
respiration expressed per gram of soil per well was determined using the formula
provided in the MicroResp™ manual:
�%𝐶𝐶𝐶𝐶2100� x vol x � 44
22.4� x �1244� x � 273
273 + T�soil fwt x (soil % dwt/100)
incubation time
where, vol is the headspace volume, soil fwt and dwt is the soil fresh weight and dry
weight respectively and T is the room temperature (25oC).
The SIR responses were calculated by subtracting the basal response (water) from
glucose response.
101

3.2.6 Total community DNA extraction and quantitative PCR (q-PCR) of
bacterial 16S rRNA gene
To determine the abundance (copy number) of 16S rRNA gene during three
applications of pesticides (sampling days; 0, 45d CP/ 43d IC and 105d CP/ 103d IC),
total community DNA was extracted from 0.25 g of soil sample after a harsh lysis
step (Retsch Tissue lyser, Qiagen) using PowerSoil®- 96 well soil DNA Isolation Kit
(MO BIO laboratories, USA) following the manufacturer’s protocol. After total
community DNA isolation, the concentration and purity was confirmed by
NanoDrop™ 2000C spectrophotometer (ThermoScientific, USA) and DNA was
stored at -20oC until further analysis. Abundance of bacterial community was
determined by amplifying 16S rRNA gene on a rotor-type thermocycler (Corbett
Research; Splex) using primer pair Eub338F (5’ACTCCTACGGGAGGCAGCAG 3’)
and Eub518R (5’ATTACCGCGGCTGCTGG 3’) (Fierer et al., 2005). This primer set
targets and amplifies the 16S rRNA gene present in all the soil bacterial groups.
Reactions were performed in 20µl volumes using ™ SYBR® No-ROX Kit (Bioline
Reagents Ltd) as described in Section 2.2.6 with changes in PCR conditions. After
initial denaturation at 95oC for 3 mins, PCR conditions were as follows: 40 cycles of
10 sec at 95oC, 20 sec at 53oC and 20 sec at 72oC. An additional 15 sec reading step
at 83oC was added at the end of each cycle.
3.2.7 PCR amplification of 16S rRNA gene and T-RFLP analysis
Soils were sub-sampled at time zero, 45d CP/ 43d IC and 105d CP/ 102d IC for both
pesticides and controls, and analysed for community composition changes by T-
RFLP. For profiling of 16S rRNA gene composition using T-RFLP analysis, a
102

similar protocol as given in section 2.2.7.3 was followed. For 16S rRNA gene -based
PCR reaction (final concentration) 1X NH4+ reaction buffer, 2 mM MgCl2, 400 μM
of deoxynucleotide mix, 2.5 U µl-1 BioTaq™ DNA polymerase (all reagents from
Bioline, UK), 0.2 mg ml-1 bovine serum albumin (New England Biolabs, USA) and 1
µl of DNA template were used. Forward bacterial primer labelled 63F-VIC® (5’
AGGCCTAACACATGCAAGTC 3’) and 1087R (5’CTCGTTGCGGGACTTAACCC 3’)
(Marchesi et al., 1998) were used at a concentration of 0.2 μM of each primer
(Sigma-Aldrich, USA) and the target gene was amplified by PCR in triplicate; initial
denaturation at 95oC for 5 mins, followed by 30 cycles of 30 sec at 94oC, 30 sec at
55oC and 1 min at 72oC, and a last cycle of 10 mins extension period at 72oC.
The PCR products were purified (section 2.2.7.3) and digestion of the purified PCR
products was carried out with 10 U of restriction endonucleases, HhaI (section
2.2.73). Aliquots of digested PCR products (2 µl) were mixed with 7.7 μl of Hi-Di™
formamide (Applied Biosystems, UK) and 0.3 μl of GeneScan™-600 LIZ® internal
size standard (Applied Biosystems, UK). The mixtures were denatured at 95°C for 3
min and then chilled on ice. T-RFLP analysis was performed on an automated
genetic analyser ABI3500 (Applied Biosystems, UK). Terminal restriction fragments
(T-RFs) generated by the sequencer were analysed using the size-calling software
GeneMapper™ 4.0 (Applied Biosystems, UK) and quantified by advanced mode
using second order algorithm. T-RFs in a T-RFLP profile were selected using similar
protocol as given in section 2.2.7.3 except for T-RFs present in between 30-600 bp
were considered in order to avoid T-RFs caused by primer-dimers and to obtain
fragments within the linear range of the internal size standard.
103

3.2.8 Diversity Measures
The T-RFLP data was used to calculate the richness, evenness and diversity of the
bacterial communities after three applications of CP/ IC. Richness (S) represented
the number of unique taxa present in the sample (represented here by number of
peaks in T-RFLP profile). Diversity and evenness was calculated using T-RFLP
relative abundance data. The Simpson’s index (D) was calculated as a measure of
diversity that combines information about richness and evenness (Simpson, 1949).
The diversity index was computed as:
where, n is the total number of organisms of a particular species (here TRFs) and N
is the total number of organisms of all the species (total TRFs). To represent the
diversity of the assemblage this value was expressed as the reciprocal (1/D). The
evenness (E) of the community structure was calculated as E1/D= (1/D)/S, where S
represented the richness of the community.
3.2.9 Statistical analysis
To determine a degradation rate constant (k), individual decay curves for the parent
compound (and sites) were fitted to a first order kinetics model by linear regression
analysis of the logarithm of the residual concentration against incubation time. The
half-life (t1/2) of CP/IC was calculated using a first order function expressed as
t1/2=ln2/k. Bacterial community analysis was conducted using PRIMER v.6
(PRIMER-E Ltd, UK). Relative T-RFLP abundance data that had been square root
𝐷𝐷 =∑𝑛𝑛 (𝑛𝑛 − 1)𝑁𝑁 (𝑁𝑁 − 1)
104

transformed prior to analysis was used to generate a Bray-Curtis similarity matrix.
PERMANOVA was used to determine the influence of site and pesticide treatment
(both in fields and lab) on the bacterial community structure. A non-metric
multidimensional scaling (MDS) analysis was carried out using the default
programme settings and a scatter plot was produced to display the relationship
between bacterial community structure with different factors, e.g. sites and field
and/or lab pesticide treatments. To analyse the relationship between bacterial
community structure and respiration (function), the MDS axes coordinates (MDS1
and MDS2) were exported and linear regression (SPSS, Inc.) was performed (along
MDS axis 1). Similarly, to analyse the relationship between bacterial diversity
indices (diversity, richness and evenness), bacterial abundances and respiration
(function) diversity, richness and evenness were exported and linear regression was
performed. The bacterial abundance, SIR and basal respiration values were
normalised by taking the natural log before analysis. Univariate analysis was
performed to analyse the lab pesticide treatment effect (CP/ IC) in shaping the
bacterial community attribute when compared with their untreated controls.
A Univariate test (general linear model; IBM SPSS 17, Inc.) seemed to be the most
appropriate approach for this data. Environmental factors (soil properties) and a
history of pesticide use (past pesticide) that would affect the bacterial abundance,
community structure (diversity, evenness and richness) and function (respiration)
were determined. Initially all the environmental factors were selected in the analysis
but later on the factors found to be significant were used for further analysis. This
analysis method was performed separately on the two pesticides (CP and IC), at a
given incubation time, and compared with their untreated controls to determine the
105

lab pesticide treatment effect (CP/ IC) in shaping the bacterial community and
function. Level of significance (p value) was set at 0.05.
106

3.3 Results
3.3.1 Soil properties
Soil pH for all the five sites ranged from slightly acidic to neutral with soil moisture
ranging mostly within 1-2%. Nutrient parameter values also differed among sites.
Table 3-2 shows the physical and chemical properties of all the five sites.
Table 3-2 Soil properties measured for all the five sites (sugarcane farms). Carbon (%) and Nitrogen
(%) represents the total carbon and nitrogen of the soil sample. Each data point represents the mean of
three experimental replicates (n=3).
Site No.
Site Name Soil type pH % Carbon % Nitrogen %Moisture
1 Burdekin I R 6.8±0.1 1.12±0.2 0.05±0.0 1.88±0.2 H 7.0±0.1 1.27±0.1 0.02±0.0 1.95±0.1
2 Burdekin II R 6.5±0.0 1.49±0.1 0.08±0.0 1.96±0.0 H 6.6±0.0 0.88±0.04 0.06±0.0 1.53±0.0
3 Mackay R 5.1±0.1 1.85±0.1 0.08±0.0 2.24±0.1 H 5.7±0.0 2.36±0.0 0.02±0.0 2.35±0.0
4 Burdekin III R 6.51±0.1 1.18±0.1 0.06±0.0 1.85±0.1 H 6.9±0.1 1.05±0.1 0.06±0.0 2.26±0.3
5 Tully R 6.4±0.1 0.96±0.0 0.04±0.0 1.04±0.0 H 5.0±0.2 0.87±0.0 0.05±0.0 1.09±0.0
3.3.2 Degradation of CP/IC in soil
The degradation patterns of CP/ IC after repeated lab treatments with CP/IC in soils
are shown in Figure 3.2 and 3.3. The half-life of CP/IC, calculated by first order
function, differed between test sites. The kinetic data of CP/ IC degradation of all the
sites are given in Table 3-3 and 3-4. The results indicated an overall decrease in the
half-life of CP during sequential treatment, therefore suggesting enhanced
degradation of the compound in all the test sites except for site 3 (Mackay) where
107

half-life of CP remained similar after second and third treatment. Among the
different sites, the disappearance of CP after three applications was particularly rapid
in 4H, 4R and 5R (Figure 3-2; Table 3-3 and 3-4). On the other hand, repeated
application of IC was associated with reduced rates of degradation (Figure 3-3; Table
3-3 and 3-4). Depending on the test site, the overall half-life of IC was about 30-65
days for the first treatment and this was extended to 45-65 days for the second dose.
Also, there was a very little change in the IC concentration following the third
treatment (Figure 3-3) further suggesting that the sequential treatment of IC
considerably slowed down the degradation of IC. In addition to this, there was no
significant influence of soil types on the degradation rates of pesticides (Table 3-3
and 3-4). However, addition of chloramphenicol and cycloheximide to soils inhibited
CP/IC degradation (>90 %, data not shown)
Figure 3-2 Degradation of chlorpyrifos (CP) in the different sites (soils) after three repeated
applications (10 mg/kg). R represents the sites treated with pesticides in the fields and H represents
headland not treated with pesticides. Error bars represent standard error of the mean (n=3).
0
3
6
9
12
15
0 20 40 60 80 100 120
CP
conc
entr
atio
n (m
g/kg
)
Time (days)
1R 1H2R 2H3R 3H4R 4H5R 5H
1stap
plic
atio
n
2ndap
plic
atio
n
3rdap
plic
atio
n
108

Figure 3-3 Degradation of imidacloprid (IC) in the different sites (soils) after three repeated
applications (10 mg/kg). R represents the sites treated with pesticides in the fields and H represents
headland not treated with pesticides. Error bars represent standard error of the mean (n=3).
3.3.3 Community respiration and SIR
Basal respiration rates in untreated controls (Figure 3.4a) ranged from 1.39 to 2.12
µg g-1 h-1 CO2-C, whereas pesticide-treated soils (lab treatment) displayed basal
respiration between 0.95 to 1.34 and 0.88 to 1.28 µg g-1 h-1 CO2-C for CP and IC,
respectively (Figure 3-4a). The effects of site and pesticide (lab treatment) were
significant for both CP (both p<0.001) and IC (both p<0.001) when incubated for
45d CP and 43d IC. A significant interaction of pesticide (lab treatment) and site was
also observed (p<0.001 and p=0.014 for CP and IC, respectively). A significant
interaction of IC lab treatment, site and past pesticide (in fields) was also observed
4
8
12
16
20
0 20 40 60 80 100 120
IC c
once
ntra
tion
(mg/
kg)
Time (days)
1R 1H
2R 2H
3R 3H
4R 4H
5R 5H
1stap
plic
atio
n
2ndap
plic
atio
n
3rdap
plic
atio
n
109

(p<0.001), whereas past pesticide (in field) treatment alone was not significant
(p=0.431 and p=0.515 in CP and IC lab-treated soils, respectively). The response of
SIR within untreated controls was highly variable between different soils (Figure 3-
4b). Overall, untreated controls displayed higher respiration rates (between 1.48 and
14.86 µg g-1 h-1 CO2-C) than CP lab-treated samples (between 0.34 and 1.73 µg g-1 h-
1 CO2-C) and IC lab-treated samples (between 0.21 and 1.94 µg g-1 h-1 CO2-C). In all
soil samples, both CP and IC significantly decreased SIR when applied (45d CP, 43d
IC; p<0.001) to different degrees in the various soil types. Suppression of soil
respiration was between 7-76% with the lowest respiration found in 5R and highest
in 1R after the pesticides treatment. Univariate analysis also showed a significant
effect of site and past pesticide (under field conditions) treatment on SIR response
when soils were lab-treated with CP (p<0.001 and p<0.027). On the other hand, a
significant effect of site (p<0.001) and but no past pesticide (in fields; p=0.144)
treatment on SIR response were observed when soils were lab-treated with IC. There
was a significant interaction between pesticide lab treatment (CP/IC) and sites
(CP/IC lab treatment*sites, p<0.001); and a three-way interaction between pesticide
lab treatment, site and past pesticide (in fields) treatment (CP lab treatment*site*past
pesticide, p=0.021; IC lab treatment*site*past pesticide, p=0.003). However, there
was no significant interaction between sites and past pesticide (in fields) treatments
(p>0.05) (Table 3-5).
110

Table 3-3 Kinetics data of the two pesticides (CP/ IC) in five different sites. The degradation of the pesticides (from Figure 3-2 and 3-3) was ascribed by the first-order
function (Ct=Co x e-kt). The half-lives of the pesticides were obtained by function t1/2 = ln2/k. Each value is a mean of three replicates (n=3). Here, H represents the headland
area with no past history of pesticide application.
Site Applications R2 Rate constant, k (day-1) Half-life, t1/2 (days) CP IC CP IC CP IC 1H 1 0.848 0.949 0.024 0.013 28.4 50.7 2 0.750 0.961 0.043 0.011 15.8 62.0 3 0.832 0.063 10.9 2H 1 0.924 0.991 0.024 0.017 28.5 39.4 2 0.750 0.928 0.050 0.011 13.7 62.5 3 0.995 0.110 6.2 3H 1 0.873 0.989 0.023 0.012 29.9 57.7 2 0.578 0.990 0.045 0.010 15.1 65.7 3 0.939 0.043 15.8 4H 1 0.864 0.960 0.029 0.013 23.1 41.5 2 0.546 0.989 0.084 0.012 8.1 55.8 3 0.887 0.237 2.9 5H 1 0.915 0.969 0.016 0.023 41.2 29.5 2 0.971 0.957 0.033 0.015 20.7 46.0 3 0.940 0.051 13.5
111

Table 3-4 Kinetics data of the two pesticides (CP/ IC) in five different sites. The degradation of the pesticides (from Figure 3-2 and 3-3) was ascribed by the first-order
function (Ct=Co x e-kt). The half-lives of the pesticides were obtained by function t1/2 = ln2/k. Each value is a mean of three replicates (n=3). Here, R represents the farm site
with past history of pesticide application.
Site Applications R2 Rate constant, k (day-1) Half-life, t1/2 (days) CP IC CP IC CP IC 1R 1 0.852 0.767 0.014 0.016 47.3 43.0 2 0.772 0.983 0.041 0.013 16.6 49.5 3 0.944 0.096 7.1 2R 1 0.905 0.931 0.016 0.010 41.3 64.7 2 0.783 0.994 0.044 0.011 15.4 57.7 3 0.997 0.087 7.9 3R 1 0.881 0.975 0.022 0.014 31.3 46.6 2 0.935 0.984 0.035 0.013 19.4 50.4 3 0.991 0.040 17.2 4R 1 0.907 0.972 0.030 0.016 23.0 42.7 2 0.442 0.972 0.068 0.012 10.0 53.5 3 0.886 0.180 3.8 5R 1 0.898 0.975 0.024 0.020 27.9 33.8 2 0.943 0.978 0.060 0.012 11.4 55.7 3 0.834 0.211 3.2
112

Figure 3-4 Microbial respiration in soil samples after lab pesticide treatment (45d CP/ 43d IC) with
their untreated controls a) Basal respiration and b) Substrate Induced respiration (SIR). Error bars
represent standard error of the mean (n=3). Legends: CP=chlorpyrifos and IC=imidacloprid.
0
0.5
1
1.5
2
2.5
1R 1H 2R 2H 3R 3H 4R 4H 5R 5H
CO
2pr
oduc
tion
rate
(µg
CO
2-C/g
/h)
Sites
control CP IC
0
4
8
12
16
1R 1H 2R 2H 3R 3H 4R 4H 5R 5H
CO
2pr
oduc
tion
rate
(µg
CO
2-C/g
/h)
Sites
a
b
113

Table 3-5 Results of the univariate analysis for basal and substrate induced respiration after 45d CP and 43d IC treatment. The values in bold shows significant effect of treatment and/or interactions (p≤0.05). Abbreviations: CP=chlorpyrifos, IC=imidacloprid
Variables Basal_CP (p values) SIR_CP (p values) Basal_IC (p values) SIR_IC (p values) CP_lab treatment 0.000 0.000 n/a n/a Site 0.001 0.000 n/a n/a Past_pesticide 0.431 0.027 n/a n/a CP_lab treatment*Site 0.000 0.001 n/a n/a CP_lab treatment*Past_Pesticide 0.963 0.009 n/a n/a Site*Past_pesticide 0.073 0.091 n/a n/a CP_lab treatment*Site*Past_Pesticide 0.113 0.021 n/a n/a IC_lab treatment n/a n/a 0.000 0.000 Site n/a n/a 0.000 0.000 Past_pesticide n/a n/a 0.515 0.144 IC_lab treatment*Site n/a n/a 0.014 0.000 IC_lab treatment*Pesticide n/a n/a 0.711 0.053 Site*Past_pesticide n/a n/a 0.066 0.188 IC_lab treatment*Site*Past_Pesticide n/a
n/a
0.000 0.003
114

3.3.4 Quantitative PCR (q-PCR) of bacterial 16S rRNA genes
Bacterial communities in the soils were quantified by means of q-PCR. The average
bacterial abundances for CP- or IC-treated samples was similar to that of control
samples for 0d (Figure 3-5a, 3-6a), 45d CP/ 43d IC (data not shown), 105d CP/ 102d
IC (Figure 3-5b, 3-6b) and ranged between 107 to 108 16S rRNA gene copies g-1 soil.
The q-PCR of the bacterial 16S rRNA gene copies showed that there was no
significant impact of CP (p=0.188) or IC (p=0.092) on the bacterial abundance, as
determined by univariate analysis. However, a strong three-way interaction between
site*past pesticide*CP lab treatment was seen on 105d (p=0.024) and the responses
were related to site characteristics (p=0.029) (Table 3-6). In addition to this, a weak
but significant interaction effect between site*past pesticide*IC lab treatment
(p=0.050) was observed on 102d, suggesting that the bacterial communities
responded differently depending on the site, past pesticide and IC lab treatment
(Table 3-7).
115

Figure 3-5 Bacterial 16S rRNA gene copies g-1 soils amended with pesticides CP in the lab a) 0d and
b) 105d recorded as a log10 scale for each site. R represents the sites treated with pesticides in the
fields and H represents headland not treated with pesticides (in fields). Error bars represent standard
error of the mean (n=3). Legends: CP=chlorpyrifos.
1.00E+07
1.00E+08
1.00E+09
1R 1H 2R 2H 3R 3H 4R 4H 5R 5H
16S
rRN
Aco
pies
/g so
il (lo
g 10
)
Sites
control CPa
1.00E+07
1.00E+08
1.00E+09
1R 1H 2R 2H 3R 3H 4R 4H 5R 5H
16S
rRN
Aco
pies
/g so
il (lo
g 10
)
Sites
b
116

Figure 3-6 Bacterial 16S rRNA gene copies g-1 soils amended with pesticides IC in the lab a) 0d and
b) 102d recorded as a log10 scale for each site. R represents the sites treated with pesticides in the
fields and H represents headland not treated with pesticides. Error bars represent standard error of the
mean (n=3). Legends: IC=imidacloprid.
1.00E+07
1.00E+08
1.00E+09
1R 1H 2R 2H 3R 3H 4R 4H 5R 5H
16S
rRN
A c
opie
s/g
soil
(log
10)
Sites
control IC
1.00E+07
1.00E+08
1.00E+09
1R 1H 2R 2H 3R 3H 4R 4H 5R 5H
16S
rRN
A c
opie
s/g
soil
(log
10)
Sites
a
b
117

3.3.5 T-RFLP analysis and diversity measures
Univariate analyses demonstrated that there was no difference in diversity, evenness
and richness between CP lab-treated and control samples at the start of the
experiment (0d). However, the addition of CP (in lab) had a significant negative
impact on bacterial diversity (p<0.001), richness (p=0.037) and evenness (p<0.001).
At time 0 the diversity, richness and evenness were 35.28±2.03, 59.37±2.5 and
0.61±0.02, respectively (Figure 3-7a, b and c, respectively). After the 105d
incubation period there was a loss in diversity, evenness and richness in the treated
samples, which were then 22.51±1.7, 54.43±1.8 and 0.41±0.02 respectively (Figure
3-7a, b and c, respectively). In the case of Simpson’s diversity, a strong 2-way
interaction site*CP lab treatment (p<0.001) and a 3-way interaction of site*CP lab
treatment*past pesticide (in fields) (p=0.005) was also significant and the responses
here were related to both site characteristics and lab treatment effect (Table 3-6,
Appendix Figure A-2). However, a weak 3-way interaction of site*CP lab
treatment*field treatment on bacterial richness and evenness was observed on 105d,
suggesting that the bacterial communities responded differently depending on the
sites (Appendix Figure A-3 and A-4, respectively).
.
118

Figure 3-7 Results of the T-RFLP analysis showing effect of chlorpyrifos (CP) on a) Simpson’s
diversity, b) Richness and c) Evenness for soil treated with CP at 0d and 105d with their respective
untreated controls. Error bars represent standard error of the mean (n=3).
Table 3-6 Results of the univariate analysis for diversity indices and abundances after CP treatment
for 105 days. The values in bold shows significant effect of treatment and/or interactions (p≤0.05).
Variables q-PCR (p values)
Diversity (p values)
Evenness (p values)
Richness (p values)
Site 0.029 0.297 0.107 0.870 Past_pesticide 0.965 0.127 0.661 0.263 CP_lab treatment 0.188 0.000 0.000 0.037 Site*Past_pesticide 0.094 0.200 0.242 0.806 Site*CP_lab treatment 0.885 0.000 0.091 0.153 Past_pesticide*CP_labTreatment 0.600 0.957 0.835 0.768 Site*past_pesticide*CP_lab treatment 0.024 0.005 0.191 0.550
15
25
35
Control CP
Sim
pson
's d
iver
sity
Treatment
0d 105d
35
45
55
65
Control CP
Ric
hnes
s
Treatment
0
0.2
0.4
0.6
Control CP
Eve
nnes
s
Treatment
a
c
b
119

PERMANOVA analysis showed that there was a significant site (p=0.001) and past
pesticide application (in fields; p=0.001) effect on the bacterial community on 0 day.
No effect of CP lab treatment (p=0.441) on the structure of bacterial communities
was observed on 0 day. However, after 105d there was a significant CP lab treatment
effect on the bacterial community (p=0.001). These analyses also showed a
significant site*CP lab treatment (p=0.033) and a site*past pesticide*CP lab
treatment effect (p=0.023) on bacterial community at 105d when compared to 0 day,
indicating that the bacterial communities in the CP-treated soils differed from the
control communities on 105d. Simpson’s diversity measures and PERMANOVA
analysis were only measured for 0d and 105d CP/ 103d IC since at days 45d CP/ 43d
IC the bacterial community structure was similar to 105d CP/ 103d IC on MDS
biplot (3-8b and c; Figure 3-9b and c, respectively).
The results of the PERMANOVA were also backed up by MDS analysis, which
showed CP addition changed the bacterial community composition at 45d in
comparison with 0d (Figure 3-8a and b, respectively). No recovery was observed
during the experimental period (105d) (Figure 3-8c), indicating that CP application
caused a long-term change in the structure of the bacterial communities. Despite a
significant impact of past application of pesticide (in fields) on the bacterial
community structure (p=0.001), no noticeable influence of past pesticide application
on CP lab treatment was observed within a particular site (between R and H) for both
0d (p=0.619) and 105d (p=0.094). However, a noticeable change in the grouping of
bacterial community representing the 45d and 105d site*past pesticide*CP lab
treatment indicate a significant difference in bacterial community composition
(p<0.05, Figure 3-8b and c, respectively) when compared to 0d, (Figure 3-8a). This
was most notable in the bacterial communities associated with site 3 and 5, which
120
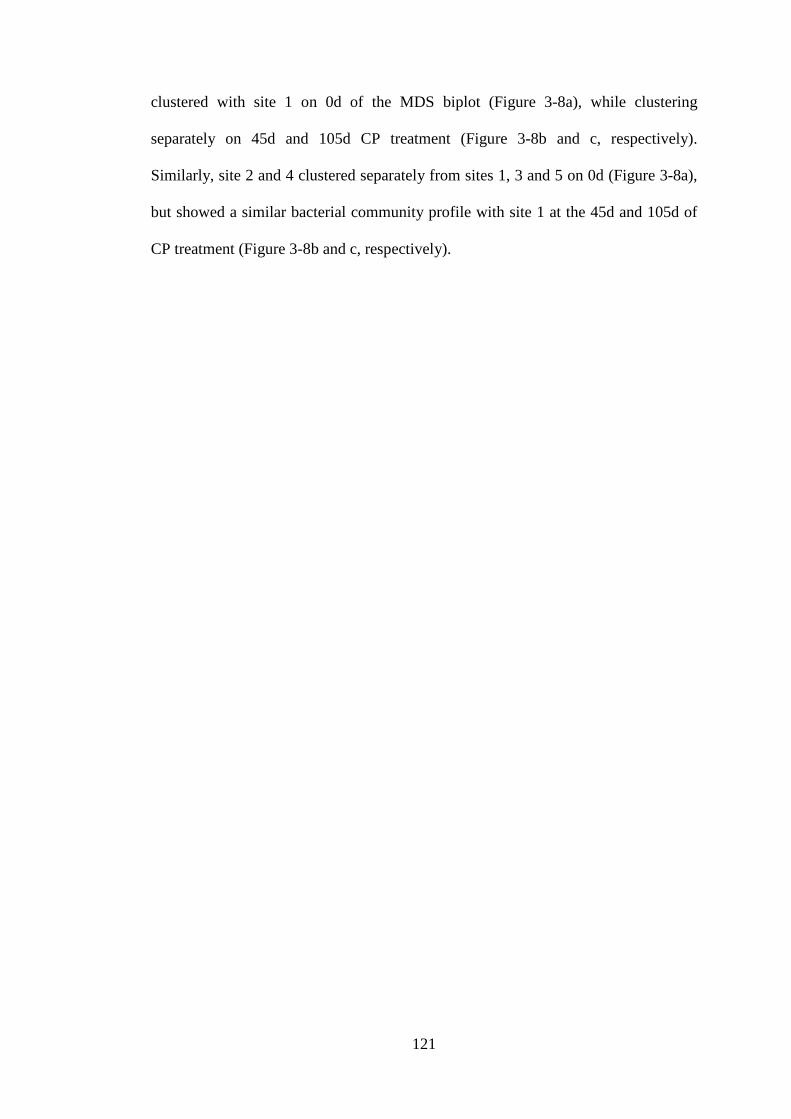
clustered with site 1 on 0d of the MDS biplot (Figure 3-8a), while clustering
separately on 45d and 105d CP treatment (Figure 3-8b and c, respectively).
Similarly, site 2 and 4 clustered separately from sites 1, 3 and 5 on 0d (Figure 3-8a),
but showed a similar bacterial community profile with site 1 at the 45d and 105d of
CP treatment (Figure 3-8b and c, respectively).
121

Figure 3-8 MDS ordination of bacterial community structure grouped on site, past pesticide and
chlorpyrifos (CP) lab treatment a) 0d, b) 45d and c) 105d based on the √-transformed T-RF peak
abundance and Bray-Curtis index (stress=0.13). Legends: R_ctrl=past pesticide treatment (in fields)
and no CP lab treatment (control), H_CP=no past pesticide treatment (in fields) but CP lab treatment,
H_ctrl=no past pesticide treatment (in fields) and no CP lab treatment (control), R_CP=past pesticide
treatment (in fields) and CP lab treatment.
R_ctrlH_ctrlR_CPH_CP
Site 1 Site 2+ Site 3 × Site 4○ Site 5
a
b
c
122

On the other hand, although no main effect of IC lab treatment was found significant
(p>0.05), a general trend of decreasing microbial diversity indices (diversity,
richness and evenness) was observed (Figure 3-9a, b and c, respectively). Moreover,
the interaction between the incubation time and IC lab treatment significantly
affected the diversity (p<0.001), richness (p<0.01) and evenness (p<0.001) index
value. The analysis also showed an interaction of site and IC lab treatment had an
effect on microbial diversity (p<0.001) and evenness (p<0.001) but richness wasn’t
affected by the interaction (p=0.525) (Table 3-7). Effect of IC on diversity indices
was also measured for each site which differed among sites, suggesting that the
bacterial communities responded differently depending on the sites (Appendix Figure
A-5, A-6 and A-7)
Table 3-7 Results of the univariate analysis for diversity indices and abundances after IC treatment for
102 days. The values in bold shows significant effect of treatment and/or interactions (p≤0.05).
Variables q-PCR (p values)
Diversity (p values)
Evenness (p values)
Richness (p values)
Site 0.000 0.230 0.953 0.118 Time 0.008 0.000 0.000 0.174 Past_pesticide 0.518 0.067 0.047 0.879 IC_lab treatment 0.445 0.094 0.057 0.932 Site*Time 0.000 0.001 0.000 0.024 Site*Past_pesticide 0.525 0.003 0.018 0.730 Site*IC_lab treatment 0.211 0.000 0.001 0.525 Time*Past_pesticide 0.226 0.000 0.002 0.108 Time*IC_lab treatment 0.094 0.000 0.000 0.009 Past_pesticide*IC_labTreatment 0.666 0.997 0.811 0.607 Site*Time*Past_pesticide 0.005 0.150 0.004 0.333 Site*Time*IC_lab treatment 0.273 0.910 0.221 0.571 Site*past_pesticide*IC_lab treatment 0.000 0.468 0.096 0.889 Time*past_pesticide*IC_lab treatment 0.797 0.509 0.427 0.895 Site*Time*past_peaticide*IC_lab treatment 0.000 0.006 0.163 0.219
123

Figure 3-9 Results of the T-RFLP analysis showing effect of imidacloprid (IC) on a) Simpson’s
diversity, b) Richness and c) Evenness for soil treated with imidacloprid at 0d and 103d with their
respective untreated controls. Error bars represent standard error of the mean (n=3).
In addition to this, T-RFLP patterns assessed using a MDS biplot revealed that
bacterial communities were affected by IC treatment during 103d experimental
period (Figure 3-10a, b and c). Similar to CP lab treatment, an overall change in the
bacterial community was observed at 43d in comparison with 0d (Figure 3-10a and
b, respectively). The community remained altered throughout the experiment (103d)
(Figure 3-10c), indicating that IC application caused a long-term changes in the
structure of the bacterial communities.
15
25
35
45
control IC
Sim
pson
's d
iver
sity
Treatment
0 d 103 da
0
0.3
0.6
0.9
control IC
Eve
nnes
s
Treatment
c
35
45
55
65
control IC
Ric
hnes
s
Treatment
b
124

Figure 3-10 MDS ordination of bacterial community structure grouped on site, past pesticide and
imidacloprid (IC) lab treatment a) 0d, b) 45d and c) 105d based on the √-transformed T-RF peak
abundance and Bray-Curtis index. Legends: R_ctrl=past pesticide treatment (in fields) and no IC lab
treatment (control), H_IC=no past pesticide treatment (in fields) but IC lab treatment, H_ctrl=no past
pesticide treatment (in fields) and no IC lab treatment (control), R_IC=past pesticide treatment (in
fields) and IC lab treatment.
R_ctrlH_ctrlR_ICH_IC
aSite 1 Site 2
+ Site 3 × Site 4○ Site 5
b
c
125

3.3.6 Linking microbial community structure to functions
Persistence of the residues of the pesticides in soil may have a significant impact on
soil microbial communities and their functions. Microbial respiration (basal and SIR)
is a useful indicator to determine the impact of pesticides on soil microbial activity,
which in turn is considered linked to soil health and fertility. The changes in the
microbial community structure (measured as MDS1 axis of T-RFLP data) were
correlated with the differences in the microbial activity (measured as microbial
respiration). The relationships between soil microbial respiration (basal and SIR) and
microbial community structure in pesticide lab-treated (CP/IC) and control soils are
shown in (Figure 3-11) which indicate that the community functioning was highly
correlated with the bacterial community structure (CPbasal, R2=0.016; ICbasal,
R2=0.004 and CPSIR, R2=0.233; ICSIR, R2=0.21). On the other hand, no relationship
between bacterial abundances and bacterial community indices (diversity, richness
and evenness) of pesticide (CP/IC) treated soils’ with soil respiration was observed
(data not shown), indicating that the differences in the bacterial microbial activity
were mainly driven by change in the community structure. However, there seemed to
be some general trend in the respiration data such that the pesticide lab-treated soil
(CP/ IC) were associated with lower SIR indicating that the community function was
adversely affected by the application of CP/ IC. Both the pesticides (CP/IC) were
shown to alter microbial community structure and functions.
126
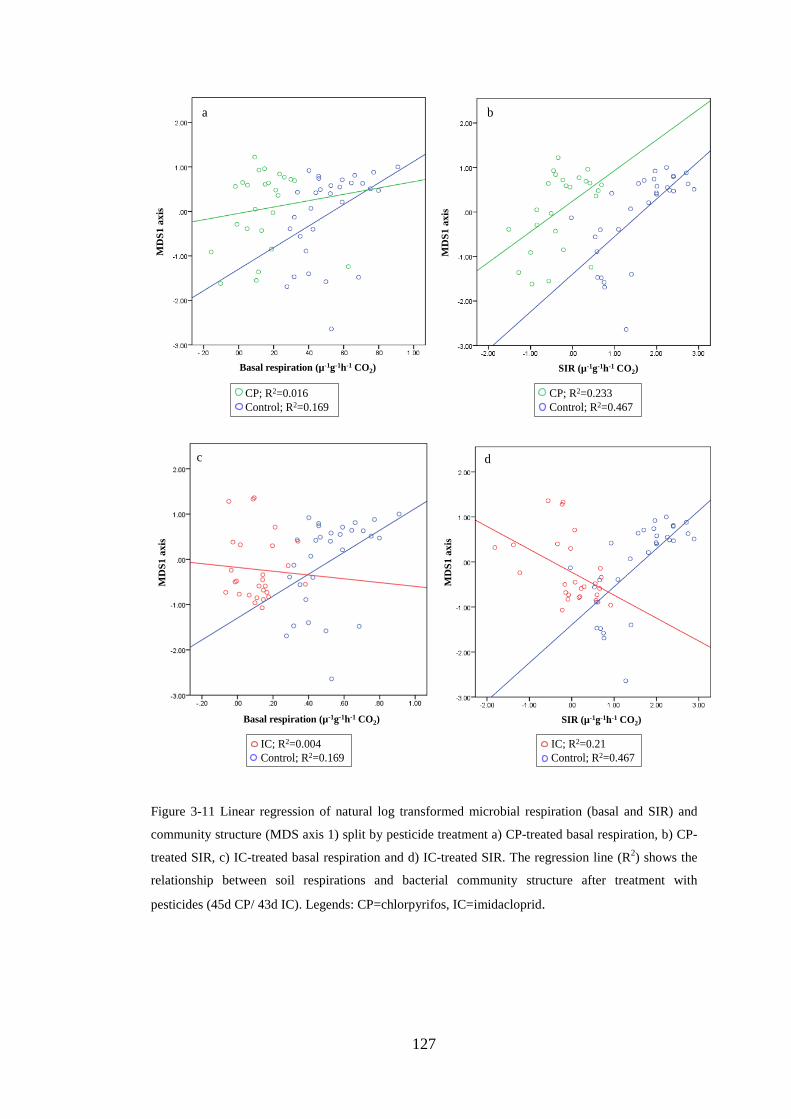
Figure 3-11 Linear regression of natural log transformed microbial respiration (basal and SIR) and
community structure (MDS axis 1) split by pesticide treatment a) CP-treated basal respiration, b) CP-
treated SIR, c) IC-treated basal respiration and d) IC-treated SIR. The regression line (R2) shows the
relationship between soil respirations and bacterial community structure after treatment with
pesticides (45d CP/ 43d IC). Legends: CP=chlorpyrifos, IC=imidacloprid.
Basal respiration (µ-1g-1h-1 CO2)
MD
S1 a
xis
a b
SIR (µ-1g-1h-1 CO2)
MD
S1 a
xis
CP; R2=0.016Control; R2=0.169
CP; R2=0.233Control; R2=0.467
Basal respiration (µ-1g-1h-1 CO2)
MD
S1 a
xis
SIR (µ-1g-1h-1 CO2)
MD
S1 a
xis
IC; R2=0.004Control; R2=0.169
IC; R2=0.21Control; R2=0.467
dc
127

3.4 Discussion
3.4.1 Degradation of pesticides (CP and IC) by soil bacterial communities
Assessing the degradation of pesticides (CP and IC) in soils would help to improve
understanding of the impact of pesticides on target and non-target organisms. In this
study, the half-lives of CP were in between 23-47, 8-20 and 3-17 days for the first,
second and third application respectively, which is consistent with the half-lives
reported earlier (Singh et al., 2002a, Fang et al., 2006, Chu et al., 2008) indicating
less persistence of CP in the soil with repeated applications. Moreover, the results
suggested that repeated application of CP resulted in an enhanced degradation
phenomenon (except for site 3), where an increased soil microbial population could
utilise CP as a readily available source of C and energy. The limited ability of site 3
to develop enhanced degradation (in lab) is consistent with the fact that this site have
not shown enhanced CP degradation under field conditions and the pesticide is still
in use at this site. Previous literature showed similar results where repeated
application of pesticides significantly accelerated its degradation in the some field
but not others (Robertson et al., 1998, Baxter and Cummings, 2008, Fang et al.,
2008), suggesting a role of intrinsic soil biotic and abiotic properties in enhanced
degradation (Singh et al., 2002a)
The rapid development of enhanced degradation of CP (under lab conditions) could
be attributed to the potential legacy effect of CP on soil microbial communities,
allowing for the survival of CP degraders in pesticide-treated soils-even after the
sites (site 1R, site 2R, site 4R and site 5R) were not exposed to CP, following its
efficacy loss due to development of enhanced degradation in the soils (about 13 years
ago). The results suggested that the degradation capability of soil microbial
128

communities were preserved even in the absence of CP and the microbial population
quickly recover the ability to degrade CP as this became readily available. This
supported the hypothesis that a legacy of CP application would allow soil microbes
to maintain or at least recover enhanced degradation even in the absence of CP
availability. In addition to this, soils from site 1H, site 2H, site 4H and site 5H also
showed enhanced CP degradation irrespective of no previous direct CP applications
(in fields). The enhanced degradation of CP in those soils could possibly be due to
the transport of potential CP degraders from pesticide-treated sites (1R, 2R, 4R and
5R) to non-pesticide treated sites (1H, 2H, 4H and 5H) through for example, flooding
as these sites were located just outside the pesticide applied fields. This might have
later led to the enrichment of CP degraders during lab treatments eventually resulting
in CP degradation. Moreover, pesticide biodegradation is a ubiquitous environmental
process. The responsible microorganisms are present or evolve in most ecosystems
(e.g. soils, sediments, water and sewage sludge) where the contaminants (here, CP)
may serve as a source of C and energy resulting in enrichment of the degrading
microbial communities soon after they are exposed to the contaminant (Margesin et
al., 2000, Karunya and Saranraj, 2014). Six bacterial strains capable of utilising CP
were isolated from the CP-treated soils (lab) after three successive treatments with
CP (Chapter 4), resulting in CP degradation, which confirmed the finding of this
chapter.
Once a soil developed enhanced degradation for CP, it persisted for many years as
was demonstrated with the soils from site 1, site 2, site 4 and site 5. For example, the
degradation of CP was still accelerated 13 years after the last applications in the
fields. Similar observations for short-term effects were reported earlier for
thiocarbamate where the accelerated degradation persisted for 1-2 years (Roeth,
129

1986), and for aldicarb, and oxamyl where persistent accelerated degradation was
found for more than 5 years (Suett et al., 1993, Smelt et al., 1996). However, in the
last 10 years studies on accelerated degradation of pesticides in soils has declined
considerably and there is limited knowledge on the duration of the phenomenon
(Arbeli and Fuentes, 2007) and this is the first study to examine the long-term legacy
impact of CP.
On the other hand, IC exhibited high persistence in soil where repeated application
was associated with reduced rates of degradation. The half-life of IC was between
30-60 days for the first for the first treatment and 45-65 days for second treatment.
The half-lives of IC were in accordance with those reported earlier (Sarkar et al.,
2001, Liu et al., 2011, Cycoń et al., 2013) and confirmed that the repeated
application of IC exhibited even longer persistence in soils. This observation was in
accordance with the impact of IC on bacterial community (section 3.4.2) where
persistence and accumulation over time influenced the bacterial community
composition. To the best of my knowledge no study has been done so far to
determine the response of the soil microorganisms on repeated application of IC and
this is important because IC are currently repeatedly used in agriculture globally.
Moreover, there was no significant difference between the degradation kinetics of
different sites (except for site 3), despite different soil types, indicating that soil type
did not influence degradation of pesticides in this study. However, further in-depth
study on the nature of soil would provide more realistic approach on pesticides
degradation. Further, experiments with chloramphenicol and cycloheximide
indicated considerable impact on degradation of both CP and IC. This may be
explained by the fact that these agents can inhibit microorganisms that degrade
130

CP/IC, indicating a direct role of soil microbial community in degradation (Singh et
al., 2003a).
Although previous studies have reported the fate and ecotoxicology of CP and IC on
soil microbial processes, they have been mostly carried out using single application
of pesticides (Wang et al., 2010a, Maya et al., 2011, Cycoń et al., 2013). In practice,
however, these pesticides may be applied repeatedly over a growing season. Thus,
the results from this study are more realistic and have provided strong insight into the
interaction between the pesticides (CP and IC) and soil microbial communities in
field conditions.
3.4.2 Impact of pesticides (CP and IC) on soil bacterial communities
The impacts of CP and IC were determined on soil bacterial abundances and
community structure over a 105d CP and 103d IC incubation period (after three
successive applications). A q-PCR analysis was performed to determine the effects
of the two pesticides on the abundance of 16S rRNA gene copy number in pesticide-
treated and untreated (control) soils. In general, no detectable differences in the
bacterial abundances (both 0 and 105d CP/ 102d IC) were observed among the
pesticide-treated and control soils. The maintenance of 16S rRNA gene copies
indicated no reduction of bacterial population and/or adaption of the bacteria in the
pesticide-treated soils forming stable bacterial communities.
These findings were consistent with previous reports where no change in the
abundance of bacterial population, expressed as 16S rRNA gene, was observed in OP
pesticide-treated and control soils (Kwak et al., 2012, Tortella et al., 2014). Similar
observations were also reported on the impact of a paenimyxin (a biopesticide) on
131

the soil bacterial communities where despite of significant reduction in the count of
viable bacteria, the numbers of 16S rDNA sequences did not differ significantly in
control and paenimyxin-treated soils (Selim et al., 2007). Thus, this study provides
evidence that bacterial abundances were not impacted by either CP or IC repeated lab
treatments.
Although q-PCR indicated that there was no effect on bacterial abundances, the
structure of the soil bacterial community was remarkably affected by three
successive applications of CP or IC. The diversity indices (diversity, richness and
evenness) were used to evaluate the dominance, richness and homogeneity of the
bacterial population present in the soil. Compared to the control, the diversity and
evenness indices in the soil treated with CP (three repeated applications) decreased
significantly. The decrease in the bacterial diversity community indices could be
attributed to an inhibition effect of CP on the soil bacterial communities at this
application frequency. This might have caused the change in the relative abundance
of certain species, including dominance by a certain groups of organisms, eventually
reducing the bacterial community evenness. The loss of diversity over the 105d
experimental period suggested that the bacterial community had a low level of
resistance to CP. Similar findings have been demonstrated by Zhang et al. (2006b)
who found a decrease in microbial diversity in soils that has been contaminated with
methyl parathion for more than 20 years. A decrease in microbial diversity and
evenness was also observed in CP-treated soil where the diversity indices were
temporarily reduced during the initial days after CP application (Fang et al., 2008,
Wang et al., 2009, Chen et al., 2014). However, contrasting results were reported
Singh et al. (2002a) where the overall soil microbial diversity and evenness were
little affected by CP application at the concentration of 10 mg/kg (lab incubation).
132

A significant decrease in richness was also observed following the application of CP,
suggesting that some bacterial species were not tolerant to pesticide application and
failed to adapt. In contrast to this result, little or no fluctuation in soil microbial
richness was observed by Singh et al. (2002a) and Fang et al. (2008). Moreover,
other lab studies with pesticides such as glyphosate and atrazine concluded that the
application of those pesticides had significant positive effects on the richness of soil
microbial communities (Mijangos et al., 2009, Tortella et al., 2013).
By contrast, although statistical analysis did not reveal significant effects of IC
application on the microbial community indices, a general pattern of decrease in
diversity, richness and evenness of bacterial indices were observed. Moreover,
incubation time and a two-way interaction between incubation time and IC lab
treatment explained most of the differences. This indicated that addition of IC
influences the soil microbial diversity over time. In a recent study, similar results
were demonstrated where the microbial diversity indices were significantly affected
not only by incubation time but also directly by IC treatment at 10 mg/kg
concentration (Cycoń et al., 2013) however, there was no direct influence of IC on
microbial diversity when added at the concentration of 1 mg/kg. It is worth
mentioning here that the impact of pesticides on soil microbial communities not only
depends on environmental variables (e.g. soil properties) but also on the pesticide
types, mode of action and the concentration of the particular pesticide.
MDS analyses of the bacterial community structure (based on T-RFLP) post 105d
CP/ 103d IC application further supported that pesticide application caused a
significant shift in bacterial community composition. A comparison of the
community profiles between lab treatments (CP or IC) over time indicated that
repeated pesticide application could affect the soil bacterial community rapidly and
133
persistently. Overall, my results showed a lack of resilience and robustness of
bacterial communities in soil towards the repeated application of the pesticides (CP
or IC). In addition to the results above, both pesticides markedly influenced the
microbial functional activity by reducing basal respiration and SIR (45d CP/ 43d IC).
The changes in the microbial community composition along MDS axis 1 following
CP and IC treatment suggested that broad microbial functions (microbial respiration)
were compromised in stressed conditions. The low respiration (basal and SIR)
observed in the soils that showed the enhanced degradation of CP, suggested that the
microbial community functions were compromised even at the shorter exposure time.
This is contrary to the hypothesis that lab treatment with pesticide would have less or
no effect on soil microbial activities in soils with pesticide enhanced degradation
history (in fields).
Assessing microbial functions are important because they are critical to crop
production, environmental sustainability, and soil quality (Topp, 2003). The decrease
in soil respiration activity with pesticides use may be associated with high toxicity of
the parent compound or their intermediate metabolites after degradation negatively
affecting the metabolic activity and integrity of microbial cells. Similar results have
been reported from other studies where pesticides negatively affected SIR (Taiwo
and Oso, 1997, Das et al., 2005, Cycoń and Piotrowska-Seget, 2009, Cycoń and
Piotrowska-Seget, 2015a). In turn, stimulatory effect (Wang et al., 2008, Wu et al.,
2015) or no effect (Lupwayi et al., 2009, Dutta et al., 2010) on soil respiration
treated with pesticides has also been reported. The variable effect of pesticides on the
cellular metabolism of soil microbial community is largely because of the nature of
the agro-chemical and the soil type. Some microorganisms could utilise the pesticide
as a source of C and energy resulting in the stimulating effect of the microbial
134

respiration, while others cannot utilise pesticide resulting in decrease or no effect on
the broad metabolic functions (Cycoń and Piotrowska-Seget, 2015a).
The responses of soil microbial communities (resistance and resilience) to various
pesticides have been documented earlier. However, to my knowledge this study
provides novel evidence that pesticide impact on soil function is mainly mediated by
the shift in microbial community structure but not abundance. This is also a first
report that demonstrates the magnitude of long-term CP and IC contamination on soil
microbial diversity and functions in Australian agricultural soils. There is lack of
information on the toxicology assessment of pesticides on below-ground organisms;
the findings of this study provide a quantitative time-response relationship regarding
pesticide application in the agricultural practice and more accurate assessments of
both short and long-term pesticide impacts. However further studies are required to
assess the impact of CP and IC in other soils of different characteristics because the
trend and patterns of pesticides impact on microbial diversity also depends on soil
properties (Sigler and Turco, 2002).
.
135

3.5 Conclusion
The main aim of this work was to ascertain the interactions of widely used broad-
spectrum pesticides (CP and IC) and bacterial community composition, biomass and
activity. In summary, the results supports the hypothesis that despite no exposure to
CP for 13 years, the enhanced degradation capacities of soil microbial community
were retained due to the legacy effect of previous use of the compound. However,
repeated application of CP and IC (in lab) was associated with the reduction in
microbial respiration, even in the soils that had developed enhanced degradation
capacity (in fields), indicating the adverse impact of the pesticides on broad
metabolic functions even when exposed to short period of time. The study also
demonstrated that the repeated application of 10 mg/kg of CP or IC reduced the
bacterial diversity, richness and evenness. The inhibitory effects were maintained
throughout the experiment and the bacterial population did not recover. Further
research using isolation and meta-genomic approaches would greatly improve our
understanding of changes in microbial community structure or expression of genes
involved in stress response in response to the CP/ IC application.
136

Chapter 4: Isolation and molecular characterisation of chlorpyrifos (CP) and 3,5,6-trichloro-2-pyridinol degrading (TCP) degrading bacteria from Australian sugarcane farm soils
4.1 Introduction
Pesticides are applied in agro-ecosystems to reduce the impact of plant pests and
pathogens on crop yield in an effort to meet the increased demand of food for Earth’s
growing population. Among the various groups of pesticides applied,
organophosphorus (OP) pesticides are the most commonly used agrochemicals. The
OP pesticides have been extensively used for its high effectiveness against target
pests and being relatively less persistent than organochlorine and carbamate
pesticides in the environment (Ortiz-Hernández et al., 2011).
Chlorpyrifos (CP) is one of the most widely used OP pesticides against a broad
spectrum of insect pests of economically important crops (Kale et al., 1999, Mallick
et al., 1999, Fang et al., 2006, Singh and Walker, 2006, Wang et al., 2007b). CP is
regarded as less persistent and of more moderate toxicity to mammals, than other
organochlorine (OC) and OP pesticides; however, its extensive use in the agricultural
sector have resulted in contamination of soil, air and ground- and surface-water
(Sapozhnikova et al., 2004, Yang et al., 2005, Yu et al., 2006). The half-life of CP
generally ranges between 10 and 120 days in soil but can be up to one year
depending on the abiotic factors (Howard, 1991, Singh and Walker, 2006). There is
also a growing concern of widespread contamination of the environment leading to
potential risks to non-target organism because of its entry into the food chain (Aysal
et al., 2004, Chandra et al., 2010, Muhammad et al., 2010) and undesirable health
issues (Ragnarsdottir, 2000, Furlong et al., 2006, Rauh et al., 2011, Alavanja et al.,
137

2013). In humans, CP does not build up or persist in body tissues; however, studies
involving continuous CP exposure do show a significant degree of bioaccumulation
in the tissues of a number of aquatic organisms (Tilak et al., 2004, Jantunen et al.,
2008, Singh and Singh, 2008)
In the environment, CP is degraded to 3,5,6-trichloro-2-pyridinol (TCP), which is the
primary and major degradation product (Singh et al., 2003a, Yang et al., 2005, Singh
et al., 2006, Kim and Ahn, 2009, Li et al., 2010). TCP is classified as a persistent
metabolite by the US Environmental Protection Agency (US EPA) with a half-life
ranging from 65 to 360 days in soil (Armbrust, 2001). The presence of three chloride
atoms on the N-aromatic ring contributes to increased resistance of this metabolite to
degradation (Singh et al., 2003a, Chishti and Arshad, 2013, Jabeen et al., 2014).
When accumulating in the environment, TCP that has antimicrobial activity, prevents
the proliferation of CP-degrading bacteria (Racke, 1993).
Owing to TCPs’ greater persistence and water solubility compared to its parent
compound, it leaches into the ground and water bodies causing widespread
contamination of soils and aquatic environments (Feng et al., 1997, Vogel et al.,
2008, Xu et al., 2008, Grzelak et al., 2012, Watts, 2012). The Australian Pesticides
and Veterinary Medicines Authority (APVMA) has identified CP and its metabolites
to be assessed for spray drift risks due to human health and environmental concerns
(Immig, 2010). Other sources of contamination are industrial effluents, disposal by
consumers, leakages and accidental spills that require large-scale decontamination.
Therefore, developing technologies to remove CP and TCP from contaminated areas
or disposal of manufacturing wastes are needed in order to minimise their impact on
human health, non-target organisms and the environment.
138
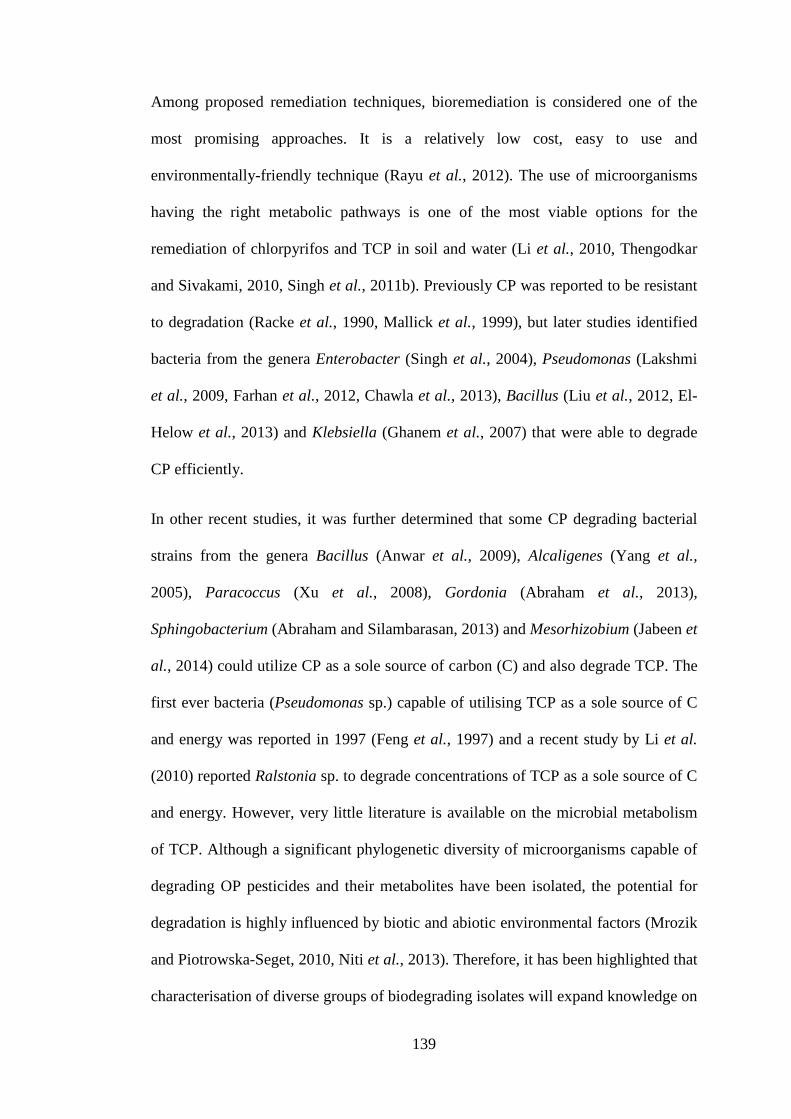
Among proposed remediation techniques, bioremediation is considered one of the
most promising approaches. It is a relatively low cost, easy to use and
environmentally-friendly technique (Rayu et al., 2012). The use of microorganisms
having the right metabolic pathways is one of the most viable options for the
remediation of chlorpyrifos and TCP in soil and water (Li et al., 2010, Thengodkar
and Sivakami, 2010, Singh et al., 2011b). Previously CP was reported to be resistant
to degradation (Racke et al., 1990, Mallick et al., 1999), but later studies identified
bacteria from the genera Enterobacter (Singh et al., 2004), Pseudomonas (Lakshmi
et al., 2009, Farhan et al., 2012, Chawla et al., 2013), Bacillus (Liu et al., 2012, El-
Helow et al., 2013) and Klebsiella (Ghanem et al., 2007) that were able to degrade
CP efficiently.
In other recent studies, it was further determined that some CP degrading bacterial
strains from the genera Bacillus (Anwar et al., 2009), Alcaligenes (Yang et al.,
2005), Paracoccus (Xu et al., 2008), Gordonia (Abraham et al., 2013),
Sphingobacterium (Abraham and Silambarasan, 2013) and Mesorhizobium (Jabeen et
al., 2014) could utilize CP as a sole source of carbon (C) and also degrade TCP. The
first ever bacteria (Pseudomonas sp.) capable of utilising TCP as a sole source of C
and energy was reported in 1997 (Feng et al., 1997) and a recent study by Li et al.
(2010) reported Ralstonia sp. to degrade concentrations of TCP as a sole source of C
and energy. However, very little literature is available on the microbial metabolism
of TCP. Although a significant phylogenetic diversity of microorganisms capable of
degrading OP pesticides and their metabolites have been isolated, the potential for
degradation is highly influenced by biotic and abiotic environmental factors (Mrozik
and Piotrowska-Seget, 2010, Niti et al., 2013). Therefore, it has been highlighted that
characterisation of diverse groups of biodegrading isolates will expand knowledge on
139

the different metabolic routes of degradation of these compounds. It will also give
flexibility to use efficient bioremedial agents (isolate) for the development of
effective bioremediation technologies based on the environmental conditions (e.g.
pH, nutrients, moisture level) (Singh, 2010).
The present study aimed to isolate bacterial strains, from Australian sugarcane farm
soil, that were able to rapidly degrade not only CP but also TCP. In addition to this,
the study also aimed to identify the mode of biodegradation (mineralisation or co-
metabolism) and nutritional requirements of the isolates, in order to provide
comprehensive knowledge for future use in bioremediation. To achieve this aim,
isolation was done from sugarcane farm soils that showed an enhanced degradation
of CP in a lab-based study due to the legacy effect of the compound (Chapter 3). The
driving hypothesis of this study was that the enhanced CP degrading soils would
select for bacterial strains with specialised functions via positive selective pressure
that utilise CP and its metabolite (TCP) as a source of C, nitrogen (N) or phosphorus
(P); thus promoting their efficiency for bioremediation of contaminated sites . In
addition to this, isolating and utilising indigenous bacterial strains capable of
metabolising OP compounds, for in situ bioremediation, are favourable given that
they are well adapted to the local conditions. This also avoids the risk of introducing
foreign microflora for decontamination, which can have unintended consequences on
the environment.
Through repetitive enrichment and successive culturing indigenous bacterial strains
were examined for their potential to degrade CP and TCP (alone and together) in
liquid media under various nutritional conditions. Bacterial strains capable of
degrading both CP and TCP (Australian soils) can be exploited to enhance the
140

efficiency of bioremediation as they will be able to completely mineralise CP for
source energy.
141

4.2 Material and methods
4.2.1 Site description and sample collection
Pesticide degrading bacteria were isolated from soils collected at five different
sugarcane farms in the Mackay, Burdekin and Tully areas in Queensland that had
almost 20 year history of pesticide use to control sugarcane grub. The history of
pesticide application differed between sites (Figure 3-1). The description of soil
sample collection, preparation and soil properties (Table 3-2) is given in section 3.2.1
and 2.2.2.
4.2.2 Preparation of media
Two different media, a mineral salt medium (MSM) and a soil extract medium
(SEM) were used for liquid enrichments and isolation of CP and TCP degraders.
MSM was mineral based media with no added C but supplemented with nitrogen
(MSM+N) and contained g/l Milli-Q (MQ) water:
Solution-1: 2.27 g KH2PO4, 5.97 g Na2HPO4, 1.00 g NaCl, 1.00 g NH4Cl;
Solution-2: 0.5 g MgSO4·7H2O, 0.01 g CaCl2·2H2O, 0.02 g MnSO4·4H2O;
Solution-3: 0.025 g FeSO4.
During the preparation of media, solution 1 and solution 2 were autoclaved
separately for 15 minutes at 121oC and combined when cool, to avoid the
precipitation of metal ions as insoluble phosphate compounds. Solution 3 was filter-
sterilized (0.22 µm pore size, Millipore) prior to adding to the cool medium. The C-
source was provided in the form of formulated CP (500 mg/ml, Nufarm; Australia)
142

or TCP (Sigma Aldrich, USA) dissolved in an organic solvent (20 mg/ml in
methanol; Sigma Aldrich, USA) and was added aseptically to MSM+N and SEM
after autoclaving to achieve a concentration of 20 mg/l (Cullington and Walker,
1999). A commercial grade CP was used throughout the experimental studies
because it may closely resemble the compounds (active agents and formulation) that
microorganisms were likely to be exposed to in the soil environment. TCP was used
for the screening process to isolate bacteria that assist in the complete mineralisation
of CP and TCP (in liquid or soil).
Soil extract media (SEM) was prepared using soils from the field sites in Sydney
(latitude -33.887551o, longitude 151.18734o). Soil and MQ water were mixed in a
1:2 (w/v) ratio and sterilised for 15 minutes at 121oC. The slurry was centrifuged at
4000 rpm for 10 minutes to remove soil particles and the supernatant was recovered
and autoclaved for 15 mins at 121oC. SEM was allowed to cool and CP and TCP
solutions were added aseptically at a final concentration of 20 mg/l (Karpouzas et al.,
2000b, Singh et al., 2004). The pH of both the media (MSM+N and SEM) was
maintained at 7.0±0.2 to allow the growth of indigenous degraders of pesticides
present in the pesticide-treated soils. MSM+N agar and SE media agar containing CP
or TCP were prepared in a similar way as above, except that agar was added at the
concentration of 15 g/l. LB plates (Sigma) were also prepared according to the
manufacturer’s instruction.
4.2.3 Enrichment of CP and TCP degraders
Enrichment of the potential CP and TCP degraders was done from the soils 4H, 4R
and 5R that showed enhanced degradation of CP in lab-based degradation study, post
143

three successive CP applications (Figure 3-2). Out of these soils (4H, 4R and 5R);
one soil (5R) was further treated separately with TCP (10 mg/kg) to enrich for TCP
degraders. The experimental set up for the pesticide treatment is described in section
3.2.3. The enhanced degrading soils (4R, 4H and 5R) were used to set up the liquid
enrichment cultures to select CP and/or TCP degraders (section 4.2.5) and
degradation of the pesticide was monitored every two days. Pesticides and their
metabolites were extracted from liquid culture (1 ml) by mixing with 100%
acetonitrile (5 ml). The tubes were vortexed and the pesticide extraction was done by
shaking the mix for one hour on a shaker (130 rpm). The samples were centrifuged
for ten minutes at 15000 rpm, after which a sub-samples of the clear supernatant
were analysed directly by HPLC. The HPLC conditions used were the same as those
described in section 3.2.4. Both CP and TCP were detected spectrophotometrically at
230 nm.
4.2.4 Isolation of CP and TCP degraders
The isolation of CP and TCP degraders was attempted from soils that showed the
greatest degradation rates in previous study (Figure 3-2): CP degraders from 4R and
4H (only CP-spiked soil samples); TCP degraders from 4R and 4H (only CP-spiked
soil samples) and from 5R (CP- and TCP-spiked soil samples). These variations were
set up to screen for strains that could degrade CP and/or TCP alone or together.
Approximately 1.5 g soil (wet weight) from each soil replicate was added to 10 ml of
MSM+N with sterile glass beads and vortexed for 1 minute. About 2 ml of the
supernatant was then used to inoculate separate bottles containing 40 ml of MSM+N
and 20 mg/l of pesticide (CP or TCP). In MSM+N, CP or TCP were the only sources
144

of C. All the replicates from a particular soil sample were treated separately for
isolation purposes. Un-inoculated sterile controls were also prepared in triplicate
along with the inoculated samples. Pesticide degraders were enriched in the dark on a
shaker at 180 rpm for four days at 28°C. A second enrichment was done by
transferring 1 ml of pre-grown culture from each replicate to respective media (40
ml) and the same incubation conditions were followed for another four days.
Appropriate un-inoculated sterile controls were also maintained throughout the
experiment (Singh et al., 2004).
Following the second enrichment, 10-fold dilution series were prepared and 0.1 ml of
these dilutions were spread in triplicate on MSM+N agar plates (with 20 mg/l CP or
TCP concentration) and incubated for 2 days at 28oC. Purity streaking for isolated
colonies was done on SE media and LB agar plates. To check the ability to degrade
CP and TCP in their purified state, the isolates were inoculated separately in SE and
MSM+N liquid media supplemented with 20 mg/l of CP or TCP. The bacterial
growth was monitored by measuring the optical density at 600 nm (OD600) based on
the turbidity of the cell suspension.
4.2.5 Identification of isolated bacteria by DNA based methods
4.2.5.1 Colony DNA extraction and amplification by polymerase chain reaction
(PCR)
Well-isolated bacterial cells (from soil cultures) were picked with sterile tooth picks
and carefully resuspended in 10 µl of nuclease-free water. DNA was extracted by
boiling the cells at 95oC for three minutes and then cooling on ice for one minute.
The resuspended mix was then centrifuged for five minutes at 15000 rpm. 1 µl of the
145

supernatant was directly used for PCR amplification, targeting the bacterial 16S
rRNA gene. The PCR conditions used were 0.5 µl of each primer (20 pmol), 1 µl of
poly deoxynucleoside triphosphate mix (dNTPs, 20 mM), 5 µl 10X NH+4 PCR
buffer, 2 µl of MgCl2 (50mM), 1 µl BSA (20mg/ml), 0.5 µl of Taq polymerase (all
reagents from Bioline, USA) and 38.5 µl of sterile nuclease-free water to make the
reaction volume 50 µl. Negative controls, with 1 µl of molecular grade water as a
template, were included in all sets of PCR reactions to provide a contamination
check. The primer set used for the amplification of 16S rRNA gene was 27f (5’-
AGAGTTTGATCMTGGCTCAG-3’) and 1492r (5’-
TACGGYTACCTTGTTACGACTT-3’) (Lane, 1991, Dees and Ghiorse, 2001,
Martin-Laurent et al., 2001). This primer set amplifies a >1400 bp region. All
amplifications were carried out in a DNA Engine Dyad® Peltier Thermal Cycler
(Bio-Rad, USA). The PCR protocol began with a denaturation step at 95oC for 4 min
followed by 29 cycles of denaturation at 94oC for 30 s, annealing at 55oC for 1 min
and extension at 72oC for 1 min. The protocol was concluded with an additional final
extension at 72oC for 10 mins. After amplification, 3 µl of PCR products were
electrophoretically separated and visualised in 1X TBE, 1% (w/v) agarose gel stained
with SYBR® Safe (Life technologies, USA) to confirm the size (HyperLadder™ 100
bp, Bioline; USA) and purity of DNA. The DNA was then purified (described in
section 2.2.7.3) and quantified with NanoDrop 2000C spectrophotometer (Thermo
Fisher, USA) before submitting samples for sequencing.
146

4.2.5.2 Sequencing
Purified DNA samples were sequenced using the BigDye Terminator v3.1 kit
(Applied Biosystems). About 15 ng of DNA as template and 3 pmol of both forward
(27f) and reverse primer (1492r) were used per 20 µl reaction mixture in separate
reactions. 16S rRNA gene was amplified with the above primer set resulting in
product length of ~1400 bp. The amplified products were collected, purified and
sequenced. The quality of the sequence was checked using Sequencher 4.10.1 (Gene
Codes Corporation) where both forward and reverse strands were edited, assembled
and aligned together to generate contig for further analyses
All 16S rRNA gene partial sequences (>1200 bp) were compared with those
available on BLAST search of the GenBank database (blast.ncbi.nlm.nih.gov/).
Sequences with the greatest similarity were extracted and compared with MUSCLE
(MEGA 6). Those aligned DNA sequences were then used to construct a
phylogenetic tree using MEGA 6 (Molecular Evolutionary Genetics Analysis)
(Tamura et al., 2013) by performing the maximum likelihood tree analysis with 1000
bootstrap replicates using Kimura-2-parameter model with Gamma distribution
(K2+G).
4.2.6 Degradation of CP and TCP as a source of carbon (C), nitrogen (N) and
phosphorus (P)
The capacity of the isolates to degrade CP and TCP as C-, N- and P-source was
determined. For this purpose, MSM (described in section 4.2.2) was modified and
adapted from Coleman et al. (2002) recipe. The media was supplemented with CP or
147

TCP (20 mg/l). The following solutions/components were used to make up the media
(g/l MQ water):
Solution-1: 2.27 g K2HPO4, 0.95 g KH2PO4, 0.67 g (NH4)2SO4;
Vitamin Supplement (ATCC®, USA);
Trace salt solution: This consisted of 6.37 g Na2EDTA.2H2O, 1.0 g ZnSO4.7H2O, 0.5
g CaCl2.2H2O, 2.5 g FeSO4.7H2O, 0.1 g NaMoO4.2H2O, 0.1 g CuSO4.5H2O, 0.2 g
CoCl2.6H2O, 0.52 g MnSO4.H2O, and 29.30 g MgSO4. pH of the trace salt solution
was adjusted to 6.4±0.2, which is very critical for all the trace salts to dissolve and
form homogenous solution. The solution was filter-sterilized (0.22 µm pore size,
Millipore) and stored at 4oC in a foil-wrapped bottle.
For preparation of MSM, vitamin supplement (0.5% v/v) and trace salt solution
(0.2% v/v) were added aseptically to solution-1 after autoclaving, to avoid
precipitation of salts. Four variations of MSM were set up: CP/TCP as a sole source
of C (+N +P –C); CP/TCP as a sole source of N (–N+P+C); CP/TCP as a source of P
(+N-P+C) and CP/TCP as sole C and N source (-N+P-C). Bulk media was
autoclaved and 10mM glucose (C6H12O6) was added as an alternative C-source
where required. The MSM without N was prepared simply by omitting ammonium
sulfate [(NH4)2SO4] and for P-free media K2HPO4 and KH2PO4 were replaced with
20 mM 3-(N-morpholino)propanesulfonic acid (MOPS). No glucose or ammonium
sulphate was added to prepare a C- and N-free media. The final pH of the media was
adjusted to 7.0±0.2.
For all the further degradation studies, the isolates from different bacterial families
that could degrade CP and/or TCP were selected. Those bacterial isolates were first
grown in SEM supplemented with CP or TCP (20 mg/l) to get an increased active
148

biomass of the degrading culture before inoculating them into MSM with different
nutrient compositions. The cultures were centrifuged at 14,000 rpm for five minutes.
The supernatant was discarded and the pellet was then washed three times and
resuspended in autoclaved tap water before inoculating in different media. Media
with different compositions (in terms of C, N and P) were used to understand the
ability, physiology and kinetics of degrading bacterium. Triplicate samples (20 ml)
of each media were inoculated with actively growing isolates of CP or TCP
degraders (1 ml). The bacterial growth was monitored by measuring the optical
density at 600 nm (OD600) based on the turbidity of the cell suspension. Triplicate
sets of each media combination without inoculation were maintained in all the
experiments as controls.
4.2.7 Statistical analyses
To investigate the differences in the pesticide degradation between different isolates,
an independent samples t-test was carried out. Level of significance (p value) was set
at 0.05. Statistical analyses were carried out with the software package IBM SPSS
Statistics 17 (SPSS, Inc.).
149

4.3 Results
4.3.1 Isolation of CP and TCP degraders
Degradation of CP in MSM+N (liquid enrichment media) supplemented with soil
microbial inoculums from 4R (4R1, 4R2, and 4R3) and 4H (4H1, 4H2 and 4H3) soils
are shown in Figure 4-1a. For the first CP application (enrichment), CP degradation
rate occurred more rapidly in 4R3 and in 4H1 as complete degradation of CP took
place in just 3 and 4 days, respectively. After 4 days of incubation, soil samples 4R1
and 4R2 showed only 20% and 38% CP degradation, respectively, whereas no
degradation was seen with microbial inoculum from 4H2 and 4H3. The primary
metabolite of CP, TCP, was found in all samples displaying CP degradation. (Figure
4-1b).
A second application of CP further increased the degradation rate for both 4R3 and
4H1, with most CP degraded in two days. Degradation rates also increased/started
earlier for other soil samples (4R1, 4R2). The second enrichment also led to the
degradation of CP in 4H2 and 4H1, degrading 20% and 30% CP respectively. TCP
was also produced following a second application of CP due to CP degradation
(Figure 4-1c). However, no degradation of accumulated TCP was seen in any of the
soil samples. No significant degradation of CP was seen in any of the un-inoculated
controls as shown in Figure 4-1a. It was surprising to see that one of the replicates
from both soil types showed an accelerated degradation during first application,
which could be attributed to the biological variations. However, all replicates (both
4R and 4H) showed an increased rate of degradation after the second application,
likely due to the increase in the degrading microbial population size (Figure 4-1a).
As this study’s primary aim was to isolate potential CP and/or TCP degraders, the
150

replicates that showed enhanced degradation (4R3 and 4H1) in MSM+N liquid
media were used for isolation purpose.
Various attempts to isolate single colonies with CP-degrading bacterial colonies from
enriched cultures were made. A total of six potential degraders were obtained after
successive sub-culturing from 4R3 and 4H1 soils and named 4H1-M1, 4H1-M2,
4H1-M3, 4H1-M4, 4R3-M1 and 4R3-M2. The isolates 4R3-M1, 4R3-M2, 4H1-M2
and 4H1-M4 were medium sized circular colonies whereas isolates 4H1-M3 and
4H1-M1 were small sized circular and medium sized irregular colonies, respectively.
No fungal growth was seen in any of the plate types (data not shown).
On the other hand, no detectable degradation of TCP was seen with any of the soil
types (4H, 4R and 5R) when added externally in MSM+N (data not shown). There
was no effect of repeated transfer on TCP degradation rates. Despite no degradation
of added TCP in liquid MSM+N media, the microbial inoculum from soils
enrichments of 4H, 4R and 5R (section 4.2.3) were plated on MSM+N agar plates to
check for their ability to grow in presence of added TCP on solid media. However,
microbial inoculum failed to grow from any of the enriched soils (4H, 4R and 5R) on
MSM+N agar when TCP was added externally, during the set incubation time. Thus,
they were dropped from further analyses and only the CP-degrading isolated
bacterial strains (4H1-M1, 4H1-M2, 4H1-M3, 4H1-M4, 4R3-M1 and 4R3-M2) were
further analysed for their ability to degrade a) CP, b) TCP, as an accumulated
metabolite, and c) TCP, when added externally.
151

Figure 4-1 Degradation of chlorpyrifos (CP) and production of TCP following two successive
applications of CP in MSM+N inoculated with bacterial communities (4R and 4H) and control
samples; a) CP degradation, b) TCP production after the first CP application (enrichment), and c) TCP
production after second CP application (enrichment). For isolation purpose, all the replicates of 4R
and 4H were plotted individually here. Error bars on control (un-inoculated treatment) represents
standard error of the mean (n=3). Abbreviation: TCP= 3,5,6-trichloro-2-pyridinol
A quick preliminary experiment to check the ability of pure strains in degradation of
CP and TCP was conducted. Minimal degradation of CP were seen when the six
isolates were inoculated in MSM+N supplemented with CP (20 mg/l) (Appendix
Figure A-8) when compared to SEM (Appendix Figure A-9a-f). In SEM all isolates
completely degraded CP within two days except for isolate 4H1-M1, which degraded
50% of CP in two days and complete degradation taking place by day six (Appendix
0%
40%
80%
120%
0 2 4 6 8
CP
conc
entr
atio
n
Time (days)
4R1 4R24R3 4H14H2 4H3Control
1st application
2ndap
plic
atio
n
0
4
8
12
0 1 2 3 4
TC
P pr
oduc
ed (p
pm)
Time (days)
0
4
8
12
4 6 8
TC
P pr
oduc
ed (p
pm)
Time (days)
1st application 2nd application
a
cb
152

Figure A-9c). During the degradation of CP by the isolates, TCP, as the primary
metabolite, accumulated in MSM+N (data not shown) but it was mostly degraded in
SEM (Appendix Figure A-9a-f). Following the successful degradation of CP and its
primary metabolite, TCP in SEM, the six isolates were then re-inoculated separately
into fresh SEM supplemented externally with TCP (20 mg/l). All the isolates, except
for 4H1-M1 (Appendix Figure A-10c) efficiently degraded almost 80% of externally
added TCP in SEM (Appendix Figure A-10a-f). No biotic or abiotic degradation of
TCP was observed in un-inoculated controls (data not shown)
4.3.2 Molecular characterisation of isolated CP and TCP degraders
All six isolated bacteria were found capable of degrading chlorpyrifos and TCP (as
accumulated metabolite or added externally) in SEM, except for 4H1-M1which did
not degrade TCP when added externally. To assess the phylogeny of the isolates, a
BLASTN analysis (16S rRNA sequence) was carried out through GenBank
(http://www.ncbi.nlm.nih.gov). This showed that all the six isolates clustered into the
Proteobacteria group but belonged to four different genera. The 16S rRNA gene
sequences of the isolates 4R3-M1, 4R3-M2 and 4H1-M4 illustrated a high similarity
to the reference sequence from members of the genus Xanthomonas, showing 99%
similarity with Xanthomonas sp. R9-741 (GenBank Accession no. JQ660016),
Xanthomonas sp. RP-B14 (GenBank Accession no. FM997990), Xanthomonas sp.
33DCP (GenBank Accession no. HQ891021), Xanthomonas campestris (GenBank
Accession no. NR074936) and Xanthomonas sp. Y4 (GenBank Accession no.
KC708559).
153

Strain 4H1-M3 clustered with genus Pseudomonas showing 100% similarity with
Pseudomonas putida (GenBank Accession no. KF815695, KC189961, GQ200822),
Pseudomonas plecoglossicida BF-1 (GenBank Accession no. FJ592171) and other
Pseudomonas species (GenBank Accession no. KJ733977, HM748053, EU851056,
EU375660, DQ079062).
Isolate 4H1-M2 clustered within the clade of genus Lysobacter showing 99%
similarity with uncultured bacteria (GenBank Accession no. DQ404715, JX236701,
AB234277) and Lysobacter sp. ITP09 (GenBank Accession no. FR667176). This
strain also showed 98% similarity with Lysobacter sp. BUT-8 (GenBank Accession
no. KJ008918) and other uncultured bacteria (GenBank Accession no. HM438549,
JQ426704).
Isolate 4H1-M1 showed 99% similarity with Rhizobium gallicum S109 (GenBank
Accession no. AY509211), Rhizobium alamii (GenBank Accession no. NR042687),
Rhizobium sp. CHNTR53 (GenBank Accession no. DQ337578), Rhizobium sp. 1NP2
(GenBank Accession no. KJ000027), Rhizobium sp. CC-RB302 (GenBank
Accession no. GQ161992) and Rhizobium sp. I29 (GenBank Accession no.
HM008945). A phylogenetic tree that depicts the position of all the six isolates and
their related species is presented in Figure 4-2. Based on these observations, the
strains were designated as Xanthomonas sp. 4R3-M1, Xanthomonas sp. 4R3-M2,
Xanthomonas sp. 4H1-M4, Lysobacter sp. 4H1-M2, Pseudomonas sp. 4H1-M3 and
Rhizobium sp. 4H1-M1.
154

Figure 4-2 Maximum likelihood tree showing the phylogenetic relationship between all six isolates (in
bold) and related species based on the 16S rRNA gene sequences retrieved from NCBI. The tree was
rooted with Bacillus thuringiensis. Bootstrap values are expressed as randomisation of 1000. The
scale bar represents the evolutionary distance of 0.05.
155

4.3.3 Degradation of CP and TCP as a source of carbon (C), nitrogen (N) and
phosphorus (P)
4.3.3.1 CP degradation
Isolates representing three bacterial families were selected for further CP and TCP
degradation study. (Xanthomonas sp. 4R3-M1, Pseudomonas sp. 4H1-M3 and
Rhizobium sp. 4H1-M1), and were screened to determine their ability to degrade CP
in SEM and MSM with different nutrient compositions (+N+P–C, –N+P+C, +N-P+C
and –N+P-C) (Figure 4-3a-d, 4-4). The CP-degrading ability of all the strains was
greater in the media MSM without C (+N+P-C; p<0.05) (Figure 4-3a), MSM without
N (–N+P+C; p<0.05) (Figure 4-3b) and SEM (p<0.05) (Figure 4-3d) when compared
to MSM without P (+N-P+C; p>0.05) (Figure 4-3c).
The strains Xanthomonas sp. 4R3-M1, Pseudomonas sp. 4H1-M3 and Rhizobium sp.
4H1-M1 utilised 80%, 90% and 75% of CP in MSM (+N+P-C), respectively. About
90% CP degradation was observed in SEM when inoculated with Xanthomonas sp.
4R3-M1 and Pseudomonas sp. 4H1-M3 (Figure 4.3d). By contrast, Rhizobium sp.
4H1-M1 utilised only 60% of the CP within 6 days of incubation. These results were
consistent with the previous SEM inoculations (preliminary results) where
degradation rates for 4H1-M1 were lower than the other strains (Appendix Figure A-
9c).
Degradation rates of CP were lower in MSM (–N+P+C) (Figure 4-3b) for all
bacterial strains (Xanthomonas sp. 4R3-M1-60%, Pseudomonas sp. 4H1-M3-70%
and Rhizobium sp. 4H1-M1-50%) compared to MSM (+N+P-C) and SEM (Figure 4-
3a, d respectively). TCP accumulated at approximately the same rate as that of
decrease in CP in a particular media (Figure 4-3a-d). TCP yields for Xanthomonas
156

sp. 4R3-M1 and Pseudomonas sp. 4H1-M3 were highest in SEM (Figure 4-3d)
followed by MSM (+N+P-C) (Figure 4-3a) and MSM (–N+P+C) (Figure 4-3b). No
TCP degradation was observed during initial accumulation, which may be considered
a lag phase required to induce the production of TCP degrading enzymes. However,
CP degradation by Rhizobium sp. 4H1-M1 did not result in the
production/accumulation of TCP in any of the media, which wasn’t consistent with
the other two strains. Conversely, TCP produced as a result of CP degradation by
Xanthomonas sp. 4R3-M1 and Pseudomonas sp. 4H1-M3 was also degraded in all
media types (Figure 4-3). It was difficult to conclude TCP utilisation in MSM (+N-
P+C), because CP degradation was reduced in this media resulting in lower TCP
production (Figure 4-3c).
In this experiment, bacterial growth could not be determined accurately due to the
turbidity caused in the media by adding commercially available CP (data not shown).
No degradation of CP or production of TCP was seen in any of the un-inoculated
controls (Figure 4-3).
157

Figure 4-3 Degradation of CP (%) and production of TCP (ppm) by Xanthomonas sp. 4R3-M1,
Rhizobium sp. 4H1-M1 and Pseudomonas sp. 4H1-M3 in different media: a) MSM (+N+P-C), b)
MSM (-N+P+C), c) MSM (+N-P+C) and d) SEM. Error bars represent standard error of the mean
(n=3).
0
2
4
6
0 2 4 6
TC
P pr
oduc
ed (p
pm)
Time (days)
0%
50%
100%
150%
0 2 4 6
CP
conc
entr
atio
n
Time (days)
0
1
2
3
0 2 4 6
TC
P pr
oduc
ed (p
pm)
Time (days)
b
0%
50%
100%
150%
0 2 4 6
CP
conc
entr
atio
n
Time (days)
0.0
0.2
0.4
0.6
0.8
0 2 4 6
TC
P pr
oduc
ed (p
pm)
Time (days)
c
0%
50%
100%
150%
0 2 4 6
CP
conc
entr
atio
n
Time (days)
0
3
6
9
0 2 4 6
TC
P pr
oduc
ed (p
pm)
Time (days)
d
0%
50%
100%
150%
0 2 4 6
CP
conc
entr
atio
n
Time (days)
Xanthomonas sp. 4R3-M1Rhizobium sp. 4H1-M1Pseudomonas sp. 4H1-M3control
a
158

From the above results, Xanthomonas sp. 4R3-M1 and Pseudomonas sp. 4H1-M3
seemed to be versatile CP degraders and were used to study the effect on CP
degradation in MSM (-N+P-C; i.e., without carbon and nitrogen). Xanthomonas sp.
4R3-M1 and Pseudomonas sp. 4H1-M3 showed similar degradation patterns utilising
70% and 80% of CP, respectively. TCP was also consumed in the process (Figure 4-
4).
Figure 4-4 Degradation of CP (%) and production of TCP (ppm) by Xanthomonas sp. 4R3-M1and
Pseudomonas sp. 4H1-M3 in MSM (-N+P-C). Error bars represent standard error of the mean (n=3).
4.3.3.2 TCP degradation
The TCP degradation pattern by all three strains in different media composition is
shown in Figure 4-5. The degradation dynamics of TCP, in different media
compositions, were almost similar for Xanthomonas sp. 4R3-M1 and Pseudomonas
sp. 4H1-M3. Both strains could degrade 100% TCP in MSM (+N+P-C; p<0.001) as
C-source within 4 days and MSM (-N+P+C; p<0.001) as N-source within 6 days
(Figure 4-5a and 4-5b, respectively). After 8 days of incubation, TCP utilisation for
Xanthomonas sp. 4R3-M1 were 20% (not statistically significant from control)
0
2
4
0 2 4 6
TC
P pr
oduc
ed (p
pm)
Time (days)
0%
50%
100%
0 2 4 6
CP
conc
entr
atio
n
Time (days)
Xanthomonas sp. 4R3-M1Pseudomonas sp. 4H1-M3control
159

(MSMP+N-P+C; p>0.05), 54% (SEM; p<0.01) and that of Pseudomonas sp. 4H1-
M3 were 67% (MSM+N-P+C; p<0.05) and 40% (SEM; p<0.01) (Figure 4-5c and 4-
5d, respectively). The degradation of TCP was slower in MSM (+N-P+C) and SEM
showing an effect of media on degradation. The degraded amount (%) of TCP in
SEM was relatively less than the previous SEM inoculations (Appendix Figure A-
10). In all cases, TCP degradation was accompanied by an increase in bacterial
OD600. In contrast, Rhizobium sp. 4H1-M1 did not degrade TCP in any of the media
assessed (p>0.05) and no degradation was observed in un-inoculated controls (Figure
4-5).
160

Figure 4-5 Degradation of TCP (%) and corresponding growth (OD600) of Xanthomonas sp. 4R3-M1,
Rhizobium sp. 4H1-M1and Pseudomonas sp. 4H1-M3 in different media: a) MSM (+N+P-C), b)
MSM (-N+P+C), c) MSM (+N-P+C), and d) SEM. Error bars represent standard error of the mean
(n=3).
0%
30%
60%
90%
120%
0 2 4 6 8
TCP
conc
entr
atio
n
Time (days)
Xanthomonas sp. 4R3-M1Rhizobium sp. 4H1-M1Pseudomonas sp. 4H1-M3control
a
0%
30%
60%
90%
120%
0 2 4 6 8
TCP
conc
entr
atio
n
Time (days)
0
0.4
0.8
1.2
0 2 4 6 8
Opt
ical
den
sity
(OD
600)
Time (days)
b
0%
30%
60%
90%
120%
0 2 4 6 8
TCP
conc
entr
atio
n
Time (days)-0.01
0.04
0.09
0.14
0.19
0 2 4 6 8
Opt
ical
den
sity
(OD
600)
Time (days)
c
0%
30%
60%
90%
120%
0 2 4 6 8
TCP
conc
entr
atio
n
Time (days)
0
0.2
0.4
0.6
0 2 4 6 8
Opt
ical
den
sity
(OD
600)
Time (days)
d
0
0.2
0.4
0.6
0 2 4 6 8
Opt
ical
den
sity
(OD
600)
Time (days)
161

Since Rhizobium sp. 4H1-M1 did not show any TCP degradation when added
externally, Xanthomonas sp. 4R3-M1 and Pseudomonas sp. 4H1-M3 were further
studied for their role in TCP degradation in C and N deficient media. Both strains
showed similar degradation patterns consuming 90% of TCP in 6 days (p<0.01);
however, degradation of TCP by Xanthomonas sp. 4R3-M1 was accompanied by a
higher bacterial growth (Figure 4-6).
Figure 4-6 Degradation of TCP (%) and corresponding OD600 of Xanthomonas sp. 4R3-M1and
Pseudomonas sp. 4H1-M3 in MSM (-N+P-C). Error bars represent standard error of the mean (n=3).
0%
30%
60%
90%
120%
0 2 4 6 8
TC
P co
ncen
trat
ion
Time (days)
Pseudomonas sp. 4H1-M3Xanthomonas sp. 4R3-M1control
0
0.2
0.4
0.6
0 2 4 6 8
Opt
ical
den
sity
(OD
600)
Time (days)
162

4.4 Discussion
4.4.1 Isolation of CP and TCP degraders
In order to isolate potential microorganisms that degrade CP and TCP, bacterial
consortia were established from sugarcane farm soils using a selective enrichment
technique, providing CP and/or TCP as a sole source of C. The ability of bacterial
cultures to efficiently degrade CP in consortia with MSM+N, and not individually in
pure cultures, may be attributed to the synergistic effect of various bacterial isolates
in the consortium (Sasikala et al., 2012). However, the microbial consortia stopped
degrading CP in MSM+N after 4 days of incubation. This could be due to the
accumulation of TCP in the media that prevented the proliferation of CP degrading
bacteria (Racke et al., 1990) or due to the limitation of growth factors, like vitamins.
Degradation of both CP and TCP (the primary metabolite of CP degradation) was
observed in SEM suggesting that an alternative C-source was utilised by degrading
bacteria resulting in an active cell biomass that overall led to the degradation of those
compounds. On the other hand, bacterial consortium also degraded TCP (when added
externally) only in the SEM but not in MSM+N providing evidence that the soil
organic material might contain some soluble growth factors that would have
stimulated TCP degradation. A study on biodegradation of 2,4,6-tribromophenol
(TBP) by Achromobacter piechaudii strain TBPZ showed similar results where soil
extracts assisted in TBP degradation in comparison with the mineral medium control
(Ronen et al., 2005). In addition to this, when isolated bacterial strains were
inoculated in MSM (+N-P+C, +N+P-C, -N+P+C) supplemented with vitamins it
resulted in the degradation of TCP as a source of energy. This suggested that growth
factors, like vitamins, are essential substances that were required by the bacterial
163

cells to fulfil their biosynthetic role. Certain bacteria cannot synthesize vitamins on
their own and require such growth factors to be added in culture media in order to
grow. Although, at a low concentration in media (0.5% v/v here), vitamins are not
metabolised as a direct source of C and energy, they are assimilated by cells to carry
out specific metabolism (Todar, 2012). Thus, the addition of vitamins in this
degradation study, not only promoted the growth but also the activity of the bacterial
strains responsible for the degradation (He et al., 2007).
Previous studies have reported dehalogenation of chlorine to be an important
microbial mechanism for degrading TCP (Feng et al., 1998, Van Pee and
Unversucht, 2003, Math et al., 2010, Cao et al., 2013). However, there is still limited
information about the pathway involved in the microbial metabolism of TCP. On the
basis of what is available in the literature and the results from the current study, it
can be suggested that the bacterial strains attacked the TCP ring structure for C and
N only in vitamin-supplemented media. Oxygenases involved in the dehalogenation
of the aromatic compounds generally require a reducing co-factor (NADH or
NADPH) in addition to Fe (II) and aerobic environment (Mason and Cammack,
1992). Thus, it can be hypothesized that vitamin solution, which contained nicotinic
acid might be involved in the activity of oxygenases/or other basic enzymes
responsible for TCP degradation by bacterial isolates in MSM (+N-P+C, +N+P-C, -
N+P+C) media. Hence no degradation was seen in MSM media without vitamins.
These findings provide additional insight to the limited information about microbial
TCP degradation mechanism and could be utilised for maximum degradation of both
CP and TCP.
164

4.4.2 Molecular characterisation of isolated CP and TCP degraders
In the present study, six indigenous CP- and TCP-degrading isolates were obtained
from Australian sugarcane farm soils. The phylogenetic relationships of the isolated
CP-degrading bacteria was analysed by sequencing the 16S rRNA gene and their
degrading abilities. Among them four isolates (4R3-M1, 4R3-M2, 4H1-M2 and 4H1-
M4) showed similarities to members of the Xanthomonadaceae family and the other
two isolates (4H1-M3 and 4H1-M1) showed similarities to the members of the
families Pseudomonadaceae and Rhizobiacea, respectively. This indicated that the
genus Xanthomonas dominated the soil samples and were easily culturable in the set
lab conditions. Results of phylogenetic diversity revealed that the isolated degrading
strains were closely related to species previously isolated from polluted or
contaminated sites. Xanthomonas sp. 4R3-M1, Xanthomonas sp. 4R3-M2 and
Xanthomonas sp. 4H1-M4 showed 99% similarity with a degrader of
chorophenoxyalconoic acid (GenBank Accession no. HQ891021) that was isolated
from contaminated soils in an industrial area.
Pseudomonas sp. 4H1-M3 showed 100% similarities to P. putida (GenBank
Accession no. KF815695, KC189961) and P. plecoglossicida BF-1 (GenBank
Accession no. FJ592171) that have been identified as degraders of
organophosphates, such as paraoxon, and aromatic compounds like phenols and
nitro-phenols in soils. Rhizobium sp. 4H1-M1 showed 99% similarity with
exopolysaccharide producing Rhizobium species (GenBank Accession no.
NR042687, KJ000027 and GQ161992) and with those harbouring antibiotic
resistance genes isolated from swine effluent impacted environments (GenBank
Accession no. DQ337578 and AY509211). A 99% similarity was also seen with
Rhizobium sp. I29 (GenBank Accession no. HM008945) suggesting that the isolated
165

strain might have phosphate solubilising properties and could be used as bio-
inoculant to facilitate the nutrient supply to plants and preventing negative side-
effects such as eutrophication.
Different species of Xanthomonas, Pseudomonas and Rhizobium have been reported
to degrade OP compounds catabolically as C-, N- or P-sources or co-metabolically
(Rosenberg and Alexander, 1979, Liu et al., 1991, Bano and Musarrat, 2003, Cycoń
et al., 2009, Jabeen et al., 2014). However, this is the first time bacteria from the
genus Rhizobium have been shown to degrade CP and its primary metabolite, TCP.
Munnecke et al. (1974) and Tchelet et al. (1993) reported isolates of Pseudomonas
sp. and Xanthomonas sp. that were adapted to grow on parathion by hydrolysing it.
In another recent study, Xanthomonas and Pseudomonas species were isolated from
leaf surfaces in the rape phyllosphere with activity for the biodegradation of
dichlorvos, an OP pesticide (Ning et al., 2010). Several Pseudomonas species alone
or in consortia have also shown to degrade chlorpyrifos (Lakshmi et al., 2009,
Sasikala et al., 2012) and its primary metabolite TCP (Feng et al., 1997, Lakshmi et
al., 2009) in soil and liquid media. Recently Chawla et al. (2013) isolated
Xanthomonas sp. that degraded chlorpyrifos. In this study, (isolated) bacterial strains
that belonged to the genus Xanthomonas degraded both CP and its primary
metabolite TCP simultaneously, a finding that was not reported before.
Lysobacter sp. 4H1-M2, family Xanthomonadaceae, showed similarities of 98%-
99% to cultured and uncultured strains previously isolated from various
contaminated environments; for example, contaminated sediments (GenBank
Accession no. DQ404715), dioxins contaminated soils (GenBank Accession no.
JX236701) and other polychlorinated contaminated soil (GenBank Accession no.
AB234277). Lysobacter sp. 4H1-M2 showed 98% similarity with Lysobacter sp.
166

BUT-8 strain (GenBank Accession no. KJ008918) isolated from the sludge of the
pesticide manufacturing factory and Lysobacter sp. ITP09 strain (99%), which is a
potential chlorophenol degrader isolated from an agricultural Mediterranean
calcareous soil (GenBank Accession no. FR667176). The strain isolated in this study
also showed 98% similarity to an uncultured Lysobacter identified from anthracene
contaminated soils (GenBank Accession no. HM438549, JQ426704) thus making
this Lysobacter sp. 4H1-M2 a probable degrader of a wide range of contaminants.
Not many members of genus Lysobacter with the ability to degrade xenobiotics had
been reported before Wang et al. (2011a) and Caliz et al. (2011) isolated Lysobacter
strains that could degrade chlorothalonil and chlorophenols respectively. However, to
the best of our knowledge, no chlorpyrifos and TCP degrading bacterium has been
reported from the genus Lysobacter.
4.4.3 Degradation of CP and TCP as a source of carbon (C), nitrogen (N) and
phosphorus (P)
4.4.3.1 CP degradation
One of the important factors that influence the ability of microorganisms to degrade
pesticide is the availability of C and nutrients. This study revealed that Xanthomonas
sp. 4R3-M1, Rhizobium sp. 4H1-M1 and Pseudomonas sp. 4H1-M3 were able to
degrade CP over a wide variation of media composition, including MSM (+N+P-C),
MSM (-N+P+C) and MSM (-N+P-C), suggesting that these strains could utilize CP
as a source of both C and N. Bacterial species have been reported earlier to utilise OP
compounds as a source of C or N (Singh and Walker, 2006). Initial slower rate of CP
degradation observed in SEM might be related to soil properties but once the isolates
167

acclimated, the degradation was greater in the SEM than MSM (+N-P+C, +N+P-C, -
N+P+C and -N+P-C). This can prove to be important features of these strains for
application in bioremediation because SEM is more similar to real field conditions in
terms of nutrient types. These strains utilised CP as a sole source of C and N
indicating that the pyridinyl ring of CP had been cleaved and utilised as a source of C
for growth and cellular activities.
The degrading capability of all of the three strains was not markedly influenced by
the presence of an alternative C-source (glucose) in the MSM (-N+P+C). Karpouzas
and Walker (2000) found similar results with ethoprophos degradation by
Pseudomonas putida, in which the presence of other C-sources had no effect on the
degrading ability of the bacteria. The strains in this study preferred to utilise CP even
in nutrient rich media potentially due to the constitutive expression of CP degrading
enzymes even in the presence of readily available C-sources (Anwar et al., 2009,
Farhan et al., 2012). This result contrasts with previous findings of Singh et al.
(2004) who reported that with addition of C-sources, an Enterobacter strain stopped
degrading CP and only after 3 days of incubation started utilising CP again. Further,
supplementation of MSM (+N+P-C) with N improved the degradation of CP when
compared to MSM (-N+P+C). Similar results have been reported earlier by Li et al.
(2007) and Chawla et al. (2013) where addition of N in the media resulted in higher
biomass density eventually resulting in higher CP utilisation.
There was visual evidence of a slight reduction of CP concentration in MSM without
P (+N-P+C) suggesting a capacity of the bacterial strains to degrade CP as a source
of P but this was not statistically significant, despite the fact that the same enzyme
phosphotriesterase catalyses the hydrolysis of P-O-C linkage of OP compounds (as
evident from TCP accumulation). In one study, Shelton (1988) isolated a bacterial
168

consortium that could use diethylthiophosphoric acid as a C-source only and was
unable to degrade it as a P- or sulphur (S)-source. A possible explanation is that most
often a particular compound is used to supply only a single element and the way in
which the metabolism (degradation) is regulated depends strongly on the organism
and OP compound studied (Kertesz et al., 1994). The results suggested that the
bacterial isolates could utilise CP and its primary metabolite (TCP) as both C- and N-
sources but not as a source of P. This is the first time species of Xanthomonas,
Pseudomonas and Rhizobium is shown to be able to utilise CP as a source of both C
and N.
Previous research on CP degradation reported that the removal of CP resulted in the
formation of metabolites like CP-oxon, 3, 5, 6‐trichloro‐2‐methoxypyridine, 2-
chloro-6-hydroxypyridine (Singh et al., 2006, Yu et al., 2006). Although
Enterobacter strain B-14 degraded 40% of 25 mg/l CP within 48 h (Singh et al.,
2004), Stenotrophomonas sp. YC-1 degraded 100% of 100 mg/l within 24 h (Yang et
al., 2006) and Synechocystis sp. PUPCCC 64 degraded 93.8% of 5 mg/l CP within 5
d (Singh et al., 2011a), these strains failed to utilise TCP for growth and energy.
However, previous literature has reported certain bacterial strains capable of also
degrading TCP produced as a primary CP degradation product. Alcaligenes faecalis
DSP3 degraded 100% and 93.5% of 100 mg/l CP and TCP within 12 d (Yang et al.,
2005), Paracoccus sp. TRP degraded 50 mg/l CP and TCP in 4 d (Xu et al., 2008),
Bacillus pumilus C2A1 degraded 89% of 1000 mg/l CP within 15 d and 90% of 300
mg/l TCP within 8 d (Anwar et al., 2009), Mesorhizobium sp. HN3 degraded 100%
of 50 mg/l CP and TCP (Jabeen et al., 2014). In the present study, only transient
accumulation of TCP was observed by Xanthomonas sp. 4R3-M1 and Pseudomonas
sp. indicating degradation of both CP (20 mg/l) and TCP were achieved by the same
169
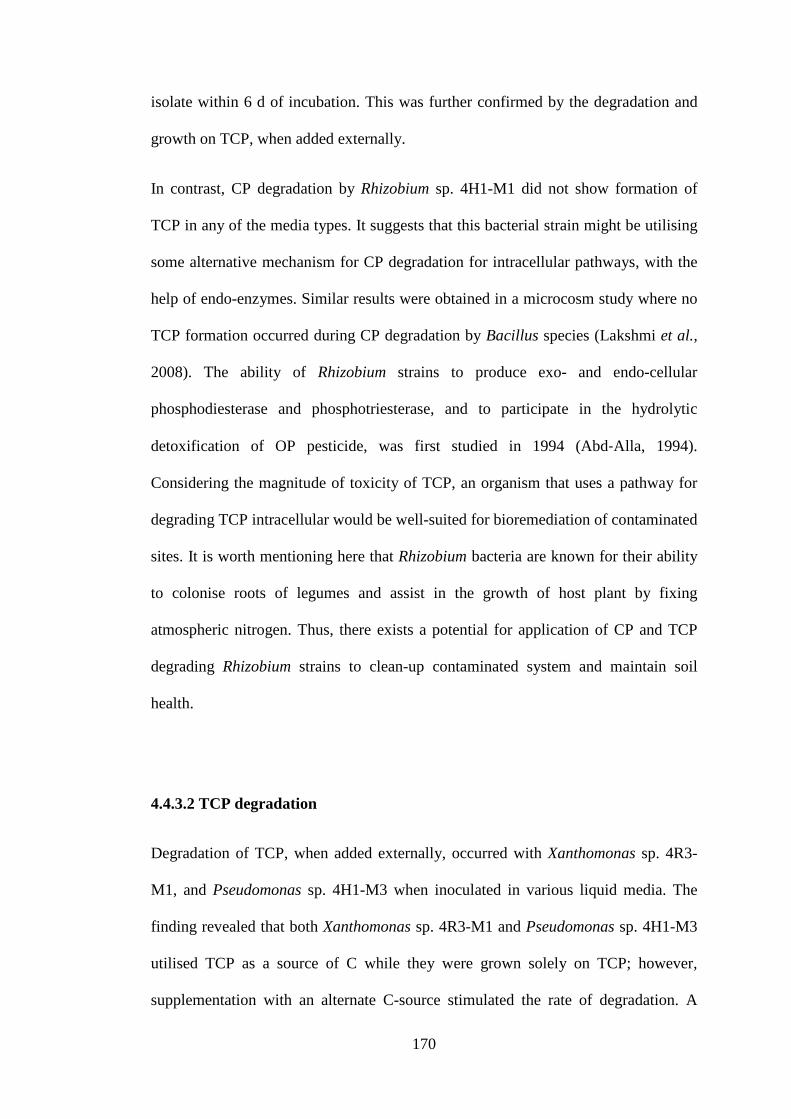
isolate within 6 d of incubation. This was further confirmed by the degradation and
growth on TCP, when added externally.
In contrast, CP degradation by Rhizobium sp. 4H1-M1 did not show formation of
TCP in any of the media types. It suggests that this bacterial strain might be utilising
some alternative mechanism for CP degradation for intracellular pathways, with the
help of endo-enzymes. Similar results were obtained in a microcosm study where no
TCP formation occurred during CP degradation by Bacillus species (Lakshmi et al.,
2008). The ability of Rhizobium strains to produce exo- and endo-cellular
phosphodiesterase and phosphotriesterase, and to participate in the hydrolytic
detoxification of OP pesticide, was first studied in 1994 (Abd‐Alla, 1994).
Considering the magnitude of toxicity of TCP, an organism that uses a pathway for
degrading TCP intracellular would be well-suited for bioremediation of contaminated
sites. It is worth mentioning here that Rhizobium bacteria are known for their ability
to colonise roots of legumes and assist in the growth of host plant by fixing
atmospheric nitrogen. Thus, there exists a potential for application of CP and TCP
degrading Rhizobium strains to clean-up contaminated system and maintain soil
health.
4.4.3.2 TCP degradation
Degradation of TCP, when added externally, occurred with Xanthomonas sp. 4R3-
M1, and Pseudomonas sp. 4H1-M3 when inoculated in various liquid media. The
finding revealed that both Xanthomonas sp. 4R3-M1 and Pseudomonas sp. 4H1-M3
utilised TCP as a source of C while they were grown solely on TCP; however,
supplementation with an alternate C-source stimulated the rate of degradation. A
170

similar result was observed for an isolate of Pseudomonas sp. capable of TCP
degradation (Feng et al., 1997). The disappearance of TCP occurred in all MSM
media except for MSM without phosphorus (+N-P+C) with increases in OD600
indicating that TCP was utilised as sources of N and C for growth by Xanthomonas
sp. 4R3-M1 and Pseudomonas sp. 4H1-M3 (discussed above), even when added
externally to the media. However, the degraded amount (%) of TCP in SEM was
relatively less than the preliminary SEM inoculations. This might be due to the soil
properties (a different soil was used here; HFE soil-latitude -33.61111o, longitude
150.74069o) that may play a major role in the degradation of OP compounds
(Baskaran et al., 2003).
The strains showed reduced degradation of TCP in MSM (+N-P+C) accompanied by
poor microbial growth. These results suggested that although the strains were
utilising TCP for C and N, the limitation of phosphorus in the media caused the
biomass to decrease (Todar, 2012). Rhizobium sp. 4H1-M1 appeared to be a potential
degrader of CP (and its primary metabolite) but failed to utilise TCP for growth and
energy when TCP was added externally into the liquid media. These observations
were consistent with the preliminary CP and TCP degradation study in SEM (section
4.3.1) where this particular isolate showed TCP degradation only when present as a
primary metabolite of CP but failed to degrade it when added externally (Appendix
Figure A-9c and A-10c, respectively). Since very little literature is available about
TCP metabolism it is difficult to conclude anything. However, it can be hypothesised
that in this particular strain, CP enters the cell and is intracellularly degraded as a C
and N-source along with its primary metabolite, TCP. It is possible that this strain
does not possess mechanisms or enzyme-linked receptors to transport externally
added TCP for intracellular degradation and thus no degradation of externally added
171

TCP was observed. However, further work is required to confirm this. Similar to CP
degradation, this is the first study to report bacterial strains from genera
Xanthomonas and Pseudomonas to utilise TCP as source of both C and N.
172

4.5 Conclusion
In the present work, novel CP and TCP degrading bacterial strains were isolated
from Australian sugarcane farm soils that showed enhanced degradation of CP in a
lab-based study. All strains isolated were able to grow in the presence of CP and/or
TCP and were able to degrade CP and/or TCP in a broad range of media with
different C, N and P additions. The use of such efficient indigenous bacterial strains
promises to be effective in the practical application of bioremediation of both CP and
TCP since the microbes have already adapted to the localised habitat conditions. The
isolated strains can also be added to other soils as microbial inoculants (bio-
augmentation) for their potential to degrade pesticides to improve soil quality in
order to create a more sustainable agriculture and environment. Although this study
provide significant insights and promising organisms for bioremediation, the
application of such organisms require further research and understanding to be
implemented. Characterisation and identification of the OP degrading genes,
enzymes and pathways are other areas for further investigation.
173

Chapter 5: Impact of pesticides on soil microbial community structure and functional capabilities
5.1 Introduction
Soil microbial communities are highly diverse, dominate belowground biomass and
play critical roles in ecosystem functions by maintaining biogeochemical cycles and
plant productivity (Nannipieri et al., 2003, Fierer et al., 2012). Intensive land-use
practices may directly or indirectly alter soil biological properties (Johnsen et al.,
2001, Lo, 2010) and in turn influence ecosystem processes. It is, therefore, important
to evaluate the soil microbial diversity and the metabolic processes performed by
them in response to anthropogenic stressors (e.g. pesticide) for better understanding
of ecosystem functioning. Pesticides represent a diverse group of organic and
inorganic chemicals used in agriculture to protect crops against pests in order to
improve crop yield and quality. Ecosystems across the globe are receiving pesticides
at an increasing rate to meet the rising demand for food with the ongoing global rise
in population size (Popp et al., 2013). Among all the chemical pesticides used
chlorpyrifos (CP), an organophosphorus (OP) pesticide, is the most widely used
pesticide worldwide.
The impact of pesticides (e.g. chlorpyrifos (CP)) on soil microorganisms has become
a serious concern as microbial community structure, diversity and functional
characteristics moderate crop production, environmental sustainability and soil
quality (Topp, 2003). Although, it is well established that the application of
pesticides effect soil microbial community structure and diversity (Zhang et al.,
2006b, Fang et al., 2008, Chen et al., 2014), far less is known about how long-term
pesticide input (under typical field condition) influence the structure and potential
174

function of the below-ground microbial community. In addition to this, there is a
large knowledge gap of whether changes in the microbial community structure and
diversity translate to functional characteristics of the community, especially the
specialised functions that may be impacted even with a moderate loss of diversity
(Singh et al., 2014). In recent years, various studies have provided important insights
in predicting the relationship between pesticides and its effect on soil
microorganisms, particularly in the context of exposure to pesticide concentrations
and mixtures (Bünemann et al., 2006, Imfeld and Vuilleumier, 2012). However, the
consequences of long-term repeated pesticide use on key metabolic functions and
microbial taxa remains poorly understood. In addition to this, the observations from
previous studies to understand the effects of pesticide input on soil ecological
parameters, such as microbial community shifts and pesticide resistance/degradation,
microbial, polymerase chain reaction (PCR)-based molecular and statistical tools
were applied. However, such indicators are increasingly criticised for being biased
(e.g. PCR) and difficult to interpret. For example, a study by Hong et al. (2006) has
highlighted the limitation of available statistical tools to estimate species diversity
indices, therefore, resulting in uncertainties in the calculated diversity indices.
Advances in metagenomic technologies has allowed for the direct sequencing of
collective genomes found in a given environmental sample (Simon and Daniel, 2011)
increasing the potential to understand and monitor the dynamics of overall and active
microbial communities under different conditions, which are often very difficult to
measure using traditional biogeochemical or culture-based approaches (Tringe and
Rubin, 2005). Metagenomics has already been applied to a range of soil systems
(Ginolhac et al., 2004, Demaneche et al., 2008, Rajendhran and Gunasekaran, 2008)
including contaminated sites (Ono et al., 2007, Lu et al., 2011). For example, recent
175

studies have used metagenomic sequencing technologies to characterise the structure
and metabolic functions of an active soil microbial community in a hydrocarbon
contaminated environment (Sangwan et al., 2012, Yergeau et al., 2012, Smith et al.,
2013). However, to my knowledge such tools have not yet been used to directly
compare microbial metagenomes across different soil types to determine pesticide
impacts on agro-ecosystems. To accomplish this goal, shotgun sequencing was used
on soil samples (in replicates) from sugarcane farms with a long-term history (Table
3-1) of pesticide application (CP and imidacloprid) along with non-treated
counterparts as controls. However, the use of CP was discontinued after it showed
efficacy loss 13 years ago. My working hypothesis was that long-term pesticide
application (legacy effect), which was established in Chapter 3, would negatively
impact bacterial diversity as well as functional capabilities at pesticide-treated sites. I
also hypothesised that functional genes involved in the phosphorus (P)-metabolism
will be over-represented relative to other genes in pesticide-treated samples because
OP pesticides were reported to be used as P-source by many bacteria (Singh and
Walker, 2006).
The main aim of the study was to identify the impact of pesticide on soil microbial
diversity and potential functional capabilities. Additionally, having replicates in the
analysis would provide deeper and more realistic information to model the changes
in the functional diversity affected by the presence of stressor (e.g. pesticide) in the
soil, which are often lacking in metagenomic studies (Prosser, 2010). Thus this
study, presents a highly desirable option for the future as it provides far more
comprehensive identification of defining metabolic profiles and microbial taxa. It
would allow a better understanding of how the microbial community are adapting
and responding to the environmental changes, (Gianoulis et al., 2009) by eliminating
176

the inherent biases associated with any PCR-dependent method (e.g. T-RFLP,
cloning).
177

5.2 Materials and method
5.2.1 Site description and sampling
Soil was collected from five sugarcane farms in the Mackay, Burdekin and Tully
areas in Queensland, Australia. A description of the sites, soil type and sugarcane
curb pesticide application history can be found in the method section of Chapter 3
(Table 3-1). Soils were collected and prepared as described in Section 3.2.1. Soil
samples (from sites) that had previously shown enhanced pesticide degradation
capabilities, in sugarcane farms (Table 3-1) or lab-based degradation (Table 3-3 and
3-4), were selected for sequencing. The selected soils were 1R, 2R (enhanced CP
degradation in fields), 4R, 5R (enhanced degradation in fields and lab-based study)
and 4H, 5H (enhanced degradation in lab-based study). For sequencing, DNA was
extracted directly from field soils (where R represented pesticide-treated sites and H
represented non-treated sites, Figure 3-1), without any lab amendments with
pesticides, of the selected soil samples
5.2.2 DNA extraction and sequencing
DNA was extracted from 10 g homogenised soil using bead beating and chemical
lysis (PowerMax® soil DNA Isolation Kit Mobio, USA) following the
manufacturer’s protocol. Genomic DNA concentration was quantified using a Qubit
2.0 fluorometer (Invitrogen). A shotgun metagenomic library was generated and
sequenced using Illumina® HiSeqTM at the Hawkesbury Institute for Environment
NGS research centre. Sequencing utilized the TruSeq DNA PCR-free HT
(Illumina®) library preparation. The process involves fragmentation of genomic
178

dsDNA with 3’ or 5’ overhangs. The fragmentation process was optimised to obtain
final libraries with the average insert size of 550 bp (DNA input per sample=2 µg).
The overhangs resulting from fragmentation were repaired by removing 3’
overhangs. Following the end repair, the appropriate library size was selected for
sample (DNA) purification. The purified DNA was then adenylated at 3’ ends to
prevent ligating to each other during the adapter ligation reaction. A corresponding
‘T’ nucleotide on the adaptor 3’ end (multiple indexing adaptors) provided a
complementary overhang for ligation (adaptor and fragment), preparing them for
hybridisation onto a flow cell. The libraries were then validated and quantified by
using Eco Real-Time PCR system (Illumina®, USA) and KAPA library
quantification kit (Kapa Biosystems, USA) and were used for Illumina® sequencing
platform (for three runs). The libraries were multiplexed during sequencing and
analysed individually. The details of each step followed can be found on
http://supportres.illumina.com/
5.2.3 Bioinformatics and statistical analysis
To determine the functionality of microbial communities inhabiting the pesticide-
treated and non-treated environments, unassembled DNA sequences from each site
were annotated using the Meta Genome Rapid Annotation using Subsystems
Technology (MG-RAST, Version 3) pipeline (Meyer et al., 2008). Within MG-
RAST, metabolic assignments were annotated to the SEED subsystems database
(Overbeek et al., 2005) and taxonomic identification was based on the top BLAST
hits to the m5nr taxonomy (Wilke et al., 2012). The SEED subsystems database
contains enzymes grouped into metabolic pathways and organised into three
179

hierarchical levels for metabolic profile organization and six for taxonomy and
allows the data to be exported at each level.
Metabolic and taxonomic reconstruction generated using MG-RAST with an E-value
cut off of 1x10⁻⁵ and a 50 bp minimum alignment length were imported into the
STatistical Analysis of Metagenomic Profiles (STAMP) package to test for
statistically significant abundance differences in taxonomic and metabolic groupings
(Parks and Beiko, 2010). These were investigated at the first (level 1), second (level
2) and third level (level 3) of the MG-RAST metabolic hierarchy and the genus level
of the MG-RAST taxonomic hierarchy.
The statistical hypothesis tests were performed using the Welch’s t test (Bluman,
2007) while confidence intervals were calculated using the Welch’s inverted method
with a Storey’s FDR multiple test correction applied (Agresti, 1999, Storey and
Tibshirani, 2003), as recommended by the STAMP user manual. Hence, all quoted q-
values represent corrected values (equating to q) with results filtered to display only
categories with a q-value of <0.05. Non-metric multi-dimensional scaling (MDS,
PRIMER) of Bray-Curtis similarities was performed as an unconstrained ordination
method to graphically visualise the patterns in the taxonomy and metabolic processes
associated with pesticide-treated and non-treated sites metagenomes.
To further elucidate the relative enrichment of functional genes, characteristics of
metagenomic profile within site were investigated to remove the effect of site
variation. For this purpose Site 4 and Site 5 were chosen (R and H). Analysis of
similarities (ANOSIM) was used to test the significant differences between pesticide-
treated and non-treated groups both at taxonomical and level 2 of metabolic
functions.
180

An additional focus was put on phosphorus (P) metabolism (at all three hierarchical
levels) to enhance the understanding/role of this particular pathway since the sites
used in this experiment had a previous history of OP pesticide (CP) application. The
percent contribution of genes associated with P-metabolism between pesticide-
treated and non-treated were assessed using similarity percentage (SIMPER) analysis
to determine the shifts between the two groups (Clarke, 1993, Smith et al., 2013). A
dissimilarity/standard (Diss/SD) deviation ratio of 1.4 and higher indicated the key
distinguishing genes (of P-metabolism) (Clarke and Warwick, 2001).
181

5.3 Results
5.3.1 Metagenomic sequences
The average number of sequences, derived from shotgun dataset, varied among
different samples and ranged in between 2.3x10⁶- 5.9x10⁹, totalling 5.6x10⁸-1.4x10⁹
base-pairs (bps), with an average length of 212-239 bps. The average sequences that
passed quality control (QC) test ranged in between 2.3x10⁶-5.8x10⁶, totalling
5.2x10⁸-1.3x10⁹ bps with an average of 202-227 bps among different sites. Of the
sequences that passed a QC test, total predicted protein features ranged in between
2.2x10⁶-5.5x10⁶ and the sequences 6.7x10⁵-1.7x10⁶ were assigned to functional
categories. A summary of the obtained metagenomes (replicates, n=3) from
pesticide-treated and non-treated sites is given in Table 5-1. In addition to this, the
predicted protein features sequences were annotated with similarity to a protein of
known functions and functional hierarchy. Table 5-2 summaries the number of
features that were annotated by the different databases across pesticide-treated and
non-treated sites (n=3).
The average sequences obtained and annotated for each replicate is given in
Appendix Table A-1 and Appendix Table A-2, respectively.
182

Table 5-1 Summary of metagenomes (bp) obtained across sites, where 4H and 5H are non-treated sites and 4R, 5R, 1R and 2R are pesticide-treated sites. ± indicate standard
deviation (n=3).
Sample Name 4H 5H 4R 5R 1R 2R Upload: bp Count 8.2E+08 ±
3.48E+08 1E+09 ± 9.42E+08
7.7E+08 ± 1.63E+08
1.4E+09 ± 1.79E+08
5.6E+08 ± 1.42E+08
7.8E+08 ± 1.52E+08
Upload: Sequences Count 4.02E+06 ± 2.26E+06
5.84E+06 ± 6.61E+06
3.27E+06 ± 6.74E+05
5.94E+06 ± 7.50E+05
2.35E+06 ± 6.04E+05
3.24E+06 ± 6.24E+05
Upload: Mean Sequence Length 213 ± 43 212 ± 48 237 ± 43 231 ± 42 236 ± 43 239 ± 42 Upload: Mean GC percent 63 ± 9% 61 ± 9% 62 ± 9% 62 ± 9 % 62 ± 9% 62 ± 9% Artificial Duplicate Reads: Sequence Count
3.15E+04 ± 5.07E+04
3.98E+04 ± 6.36E+04
4.65E+03 ± 1.52E+03
4.53E+03 ± 6.50E+02
3.04E+03 ± 5.94E+02
3.12E+03 ± 6.63E+02
Post QC: bp Count 7.63E+08 ± 3.13E+08
9.6E+08 ± 8.71E+08
7.3E+08 ± 1.53E+08
1.3E+09 ± 1.69E+08
5.2E+08 ± 1.34E+08
7.3E+08 ± 1.42E+08
Post QC: Sequences Count 3.90E+06 ± 2.12E+06
5.66E+06 ± 6.35E+06
3.22E+06 ± 6.63E+05
5.86E+06 ± 7.40E+05
2.31E+06 ± 5.95E+05
3.19E+06 ± 6.15E+05
Post QC: Mean Sequence Length 204.66 ± 50 202.66 ± 45 227 ± 51 223 ± 49 225 ± 52 224 ± 51 Post QC: Mean GC percent 63 ± 9 % 61 ± 9% 63 ± 9% 62 ± 9% 62 ± 9% 62 ± 9% Processed: Predicted Protein Features 3.64E+06 ±
1.91E+06 5.14E+06 ± 5.64E+06
2.95E+06 ± 8.45E+05
5.53E+06 ± 7.12E+05
2.21E+06 ± 5.69E+05
3.05E+06 ± 5.79E+05
Processed: Predicted rRNA Features 3.43E+04 ± 2.34E+04
4.63E+04 ± 5.62E+04
2.54E+04 ± 5.68E+03
4.33E+04 ± 5.11E+03
1.79E+04 ± 4.80E+03
2.45E+04 ± 4.71E+03
Alignment: Identified Protein Features 1.32E+06 ± 5.79E+05
1.77E+06 ± 1.75E+06
1.23E+06 ± 2.66E+05
2.21E+06 ± 2.97E+05
8.75E+05 ± 2.25E+05
1.22E+06 ± 2.29E+05
Alignment: Identified rRNA Features 808.33 ± 375.79
909.33 ± 797.50
833.33 ± 214.43
1399 ± 194.31
621 ± 194.73
828 ± 181.34
Annotation: Identified functional categories
1.02E+06 ± 4.49E+05
1.36E+06 ± 1.34E+06
9.56E+05 ± 2.09E+05
1.74E+06 ± 2.45E+05
6.75E+05 ± 1.75E+05
9.42E+05 ± 1.75E+05
183

Table 5-2 Summary of the features that were annotated by the different databases across sites, for non-
treated sites (4H and 5H) and pesticide-treated sites (4R, 5R, 1R and 2R). These include protein
databases, protein databases with functional hierarchy information, and ribosomal RNA databases. ±
indicate standard deviation (n=3)
Sample Name
4H (bp) 5H (bp) 4R (bp) 5R (bp) 1R (bp) 2R (bp)
GenBank 1.15E+06 ±
2.76E+05
1.92E+06 ±
1.92E+06
1.30E+06 ±
2.83E+05
2.34E+06 ±
3.16E+05
9.20E+05 ±
2.32E+05
1.28E+06 ±
2.42E+05 IMG 1.13E+06
± 2.68E+05
1.85E+06 ±
1.85E+06
1.28E+06 ±
2.82E+05
2.32E+06 ±
3.17E+05
9.08E+05 ±
2.32E+05
1.27E+06 ±
2.39E+05 KEGG 1.04E+06
± 2.45E+05
1.70E+06 ±
1.69E+06
1.18E+06 ±
2.59E+05
2.14E+06 ±
2.93E+05
8.36E+05 ±
2.16E+05
1.17E+06 ±
2.20E+05 PATRIC 1.12E+06
± 2.65E+05
1.86E+06 ±
1.88E+06
1.28E+06 ±
2.80E+05
2.31E+06 ±
3.12E+05
9.00E+05 ±
2.31E+05
1.26E+06 ±
2.39E+05 RefSeq 1.17E+06
± 2.76E+05
1.95E+06 ±
1.96E+06
1.33E+06 ±
2.92E+05
2.40E+06 ±
3.21E+05
9.36E+05 ±
2.39E+05
1.31E+06 ±
2.48E+05 SEED 9.94E+05
± 2.36E+05
1.63E+06 ±
1.61E+06
1.13E+06 ±
2.48E+05
2.04E+06 ±
2.84E+05
7.99E+05 ±
2.03E+05
1.12E+06 ±
2.09E+05 SwissProt 4.82E+05
± 5.62E+05
2.81E+05 ±
2.86E+05
2.48E+05 ±
4.34E+04
3.62E+05 ±
5.72E+04
1.36E+05 ±
3.46E+04
1.88E+05 ±
3.50E+04 TrEMBL 1.16E+06
± 2.76E+05
1.92E+06 ±
1.92E+06
1.31E+06 ±
2.86E+05
2.36E+06 ±
3.18E+05
9.27E+05 ±
2.35E+05
1.29E+06 ±
2.44E+05 Eggnog 9.28E+05
± 2.22E+05
1.52E+06 ±
1.50E+06
1.06E+06 ±
2.29E+05
1.94E+06 ±
2.74E+05
7.42E+05 ±
1.91E+05
1.04E+06 ±
1.94E+05 COG 7.91E+05
± 1.88E+05
1.28E+06 ±
1.27E+06
9.03E+05 ±
1.96E+05
1.66E+06 ±
2.35E+05
6.33E+05 ±
1.64E+05
8.85E+05 ±
1.65E+05 KO 4.07E+05
± 9.37E+04
6.71E+05 ±
6.84E+05
4.63E+05 ±
1.01E+05
8.53E+05 ±
1.23E+05
3.23E+05 ±
8.39E+04
4.52E+05 ±
8.43E+04 NOG 4.61E+04
± 1.23E+04
7.68E+04 ±
7.07E+04
5.15E+04 ±
1.09E+04
9.49E+04 ±
1.28E+04
3.71E+04 ±
9.50E+03
5.21E+04 ±
9.74E+03 Subsystems 1.39E+06
± 3.24E+05
2.29E+06 ±
2.33E+06
1.59E+06 ±
3.49E+05
2.93E+06 ±
4.38E+05
1.11E+06 ±
2.86E+05
1.54E+06 ±
2.84E+05 Greengenes 282.6 ±
78.5 479.6 ± 516.6
358.3 ± 97.2
665.6 ± 82.9
279 ± 92.7
361.3 ± 86.5
SILVA LSU
390.3 ± 70.4
682 ± 627.2
617.6 ± 109.0
1004.6 ± 88.3
392.6 ± 149.1
578.3 ± 118.4
RDP 303.3 ± 89.4
527.6 ± 566.8
375 ± 103.1
705.6 ± 88.5
296 ± 93.6
391 ± 89.3
SILVA SSU
393 ± 93.5
765 ± 733.5
569.6 ± 195.5
1003.6 ± 71.5
383.3 ± 120.1
537 ± 106.6
184

5.3.2 Taxonomic profiling of pesticide-treated and non-treated sites
The taxonomic profiles of soils from pesticide-treated and non-treated sites were
investigated to determine the influence of pesticide application on sites. One of the
replicates from site 1 (1R3) failed the quality control of MG-RAST at the genus level
and hence was not included in any analyses of microbial community composition.
Substantial treatment specific differences between the pesticide-treated and non-
treated sites were evident from the taxonomic data at the genus level (Figure 5-1).
Pesticide-treated sites harboured communities that were distinct and clustered apart
from non-treated when community differences were measured by ANOSIM (R=0.55,
p=0.005).
Figure 5-1 MDS ordination of bacterial community structure, based on the relative gene abundances
of metagenomic taxonomic data, in pesticide-treated and non-treated sites derived from Bray-Curtis
distance matrix.
Pesticide-treatedNon-treated
+ Site 1 x Site 2Site 4 Site 5
185
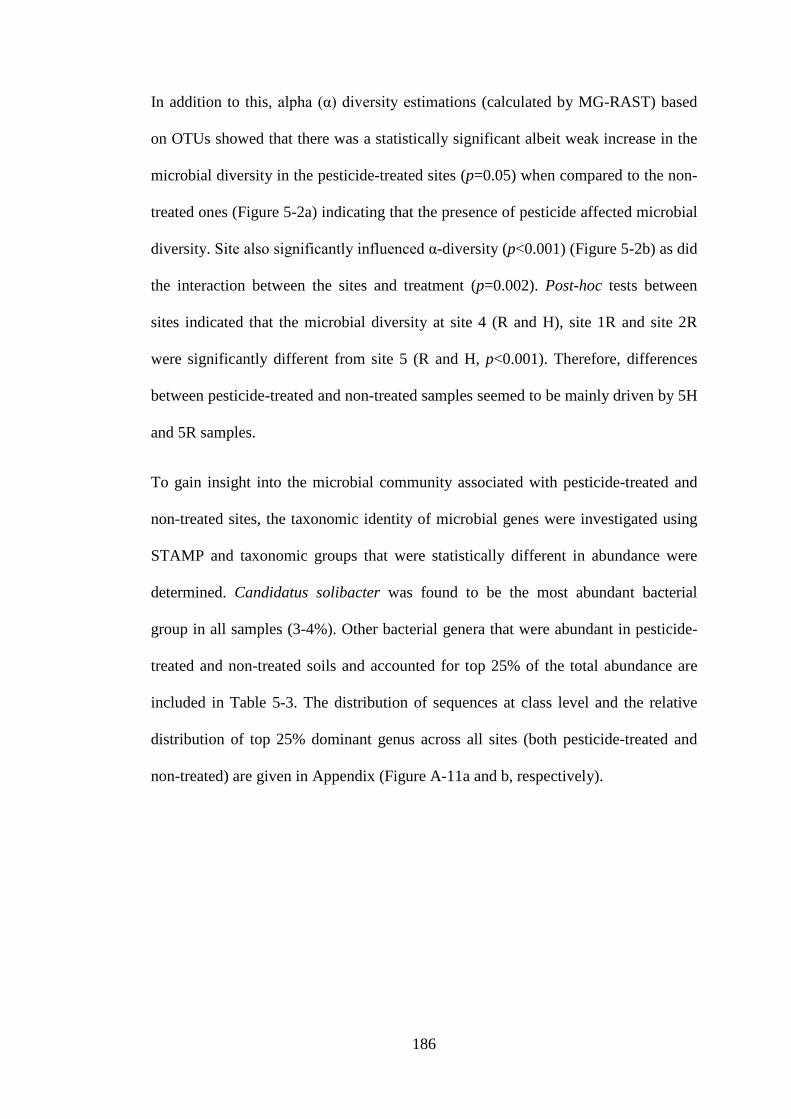
In addition to this, alpha (α) diversity estimations (calculated by MG-RAST) based
on OTUs showed that there was a statistically significant albeit weak increase in the
microbial diversity in the pesticide-treated sites (p=0.05) when compared to the non-
treated ones (Figure 5-2a) indicating that the presence of pesticide affected microbial
diversity. Site also significantly influenced α-diversity (p<0.001) (Figure 5-2b) as did
the interaction between the sites and treatment (p=0.002). Post-hoc tests between
sites indicated that the microbial diversity at site 4 (R and H), site 1R and site 2R
were significantly different from site 5 (R and H, p<0.001). Therefore, differences
between pesticide-treated and non-treated samples seemed to be mainly driven by 5H
and 5R samples.
To gain insight into the microbial community associated with pesticide-treated and
non-treated sites, the taxonomic identity of microbial genes were investigated using
STAMP and taxonomic groups that were statistically different in abundance were
determined. Candidatus solibacter was found to be the most abundant bacterial
group in all samples (3-4%). Other bacterial genera that were abundant in pesticide-
treated and non-treated soils and accounted for top 25% of the total abundance are
included in Table 5-3. The distribution of sequences at class level and the relative
distribution of top 25% dominant genus across all sites (both pesticide-treated and
non-treated) are given in Appendix (Figure A-11a and b, respectively).
186

Figure 5-2 Difference in alpha diversity levels (Shannon diversity index calculated by MG-RAST),
between pesticide-treated and non-treated sites based on the relative gene abundances of metagenomic
taxonomic data a) Treatment and b) Sites. Bars indicate standard deviation (s.d.), n=6 for non-treated
sites (a), n=11 for pesticide-treated sites (a) and n=3 for sites (b). Different letters and * indicate
values that are significantly different (p < 0.05).
Despite their predominance across all samples (pesticide-treated and non-treated),
analysis of relative abundances revealed that the dominant genera were not
significant drivers (q>0.05) of variation in the community composition between
pesticide-treated and non-treated soils. On the contrary, several ‘rare’ genera with
comparatively lower abundances (0.03-0.50%) accounted for notable differences
between pesticide-treated and non-treated sites. For example, Pedobacter (q=0.017),
Methylibium (q=7.34e-3), Sphingomonas (q=0.02), Parabacteroides (q=0.048),
400
450
500
550
600
Non-treated Pesticide-treated
Alph
a-di
vers
ity (S
hann
on)
Treatment
400
450
500
550
600
4H 4R 5H 5R 1R 2R
Alph
a-di
vers
ity (S
hann
on)
Sites
a
b
*
a a a a
b
c
187

Novosphingobium (q=0.020), Sphingobium (q=0.032), Marivirga (q=0.029),
Phenylobacterium (q=0.032), Maricaulis (q=0.032), Paludibacter (q=0.040),
Rubrivivax (q=0.010) and Leptothrix (q=0.020) were a few of the genera statistically
more abundant in the pesticide-treated sites (Figure 5.3). Out of 33 genera that
contributed significantly to differences in community composition between the
metagenomes in pesticide-treated and non-treated sites, only five of them were
statistically predominant in non-treated sites (Figure 5-3) and included
Methanococcus (q=7.34e-3), Methanothermobacter (q=0.016), Methanopyrus
(q=0.032), Archaeoglobus (q=0.033) and Thermococcus (q=0.039).
Table 5-3 Average relative frequency of top 25% bacterial genera in pesticide-treated and non-treated
sites. ± indicates standard deviation (s.d) where n=6 for non-treated sites and n=11 for pesticide-
treated sites.
Bacterial genus Non-treated sites Pesticide-treated sites Mean relative frequency
(%) Mean relative frequency
(%) Candidatus solibacter 4.68±1.29 3.41±0.38 Streptomyces 3.18±0.40 2.38±0.40 Candidatus koribacter 2.98±1.45 2.05±0.89 Burkholderia 2.26±0.25 2.26±0.18 Bradyrhizobium 2.11±0.58 1.81±0.24 Mycobacterium 1.59±0.18 1.27±0.12 Anaeromyxobacter 1.52±0.45 1.73±0.17 Sorangium 1.43±0.29 1.95±0.14 Frankia 1.41±0.22 1.02±0.12 Geobacter 1.34±0.35 1.49±0.26 Rhodopseudomonas 1.31±0.32 1.14±0.15 Methylobacterium 1.21±0.14 1.12±0.07 Conexibacter 1.14±0.42 0.93±0.32 Acidobacterium 1.11±0.56 0.74±0.26 Myxococcus 1.10±0.18 1.37±0.08 Pseudomonas 1.07±0.20 1.15±0.05
188

Figure 5-3 Taxa enriched or depleted in pesticide-treated (R) and non-treated (H) sites at genus level
of MG-RAST taxonomic hierarchy. Corrected q-values were calculated using Storey’s FDR approach.
Pesticide-treated (R)Non-treated (R)
189

5.3.3 Overall shift in soil functional and metagenomic profiles
The metabolic gene abundance profile was investigated to determine the influence of
pesticide application on potential functionality of sites. MDS analysis (at hierarchical
level 2) revealed a clear separation of the data between pesticide-treated and non-
treated sites metagenomes (Figure 5-4). Pesticide-treated sites harboured metabolic
gene profiles that were distinct, and clustered apart, from non-treated soils when
measured by ANOSIM (R=0.61, p=0.002). Metagenomes derived from pesticide-
treated sites showed a higher degree of similarity to each other than to the non-
treated sites for function identity.
Figure 5-4 MDS ordination of the metabolic gene abundance profile, based on metagenomic
metabolic processes data (at hierarchical level 2), in pesticide-treated and non-treated sites derived
from Bray-Curtis distance matrix.
+ Site 1 x Site 2Site 4 Site 5
Pesticide-treatedNon-treated
190

Sequences involved in basic metabolic processes comprised the most abundant hits
in both pesticide-treated and non-treated metagenomes. These genes, often referred
as house-keeping genes, were associated with respiration and carbohydrate, amino
acid, protein, RNA and DNA metabolism. Despite their predominance in pesticide-
treated and non-treated sites, analysis of differential abundances (at hierarchical level
1) revealed that the variation across the house-keeping genes did not contribute to the
significant differences between the metagenomes (data not shown).
Analysis at a finer sub-system level resolution (hierarchical level 2; Figure 5-5)
indicated that non-treated sites had an over-representation of house-keeping genes
associated with carbohydrate metabolism (one-carbon metabolism, CO2 fixation and
central carbohydrate metabolism), respiration (sodium ion-coupled energetic), DNA
metabolism (CRISPs) and protein metabolism (selenoproteins, proteosomes related
genes) when compared with pesticide-treated metagenomes. By comparison, RNA
metabolism genes, especially genes associated with RNA processing and
modification was higher in the pesticide-treated sites than in non-treated sites.
Further analysis of metagenomic data indicated that microbial communities that were
well adapted to the pesticide-treated sites had metabolic categories that were
typically related to more specialised function and were over-represented in the
pesticide-treated sites (Figure 5-5). These included genes responsible for the bacterial
motility and chemotaxis (flagella protein, chemotaxis response regulators), pathways
for iron acquisition and metabolism (siderophores), membrane transport (protein
secretion system III) and cell signalling. Phage-associated genes (in particular genes
affiliated with gene transfer agent), stress response genes (oxidative, periplasmic)
were also significantly more abundant in contaminated sites. These metabolic
categories were comparatively in lower abundances than house-keeping genes but
191

were also responsible for the variation in functional potential between pesticide-
treated and non-treated metagenomes.
Figure 5-5 Metabolic processes over-and under-represented in pesticide-treated (R) metagenomes
relative to the non-treated metagenomes (H) at metabolic hierarchical level 2 of MG-RAST. Corrected
q-values were calculated using Storey’s FDR approach.
Pesticide-treated (R)Non-treated (H)
192

Interestingly, analysis of metagenomes between pesticide-treated and non-treated
(across sites) also revealed sequences responsible for P-metabolism and were found
to be abundant in pesticide-treated sites (Figure 5-6). Phosphorus metabolism genes
were significantly higher in pesticide-treated sites, at level 1 (p=0.02, Figure 5-6a),
and ranged in between 0.847% to 0.872% when compared to non-treated sites
(0.830% to 0.8585%). Similarly, at level 3, P-metabolism genes were significantly
higher (p=0.052, Figure 5-6c) and ranged in between 0.565% to 0.584% when
compared to the non-treated sites (0.538% to 0.574%) However, no significant
differences between the relative abundances of the P-metabolism genes were
observed between metagenomes of pesticide-treated and non-treated sites (p=0.055,
Figure 5-6b) at level 2 of metabolic hierarchy. Similarity percent (SIMPER) analysis
revealed that the main genes associated with P-metabolism (at level 3) contributing
to the differences between the pesticide-treated and non-treated sites were alkaline
phosphatase, inorganic phosphate transporter, inorganic pyrophosphatase, phosphate
ABC transporter and phosphate transport ATP-binding proteins, together accounting
for 45% of the overall differences (Table 5-4). Average dissimilarity between the
pesticide-treated and non-treated sites was 5.25%
193

Figure 5-6 Box plot showing the distribution in the proportion of phosphorus metabolism sequences
assigned to samples from pesticide-treated and non-treated sites a) at metabolic hierarchical level 1 b)
at metabolic hierarchical level 2 and c) at metabolic hierarchical level 3. The median value is shown
as a line within the box and the mean value as a star.
p=0.020
Prop
ortio
n of
sequ
ence
s (%
)
a
p=0.055
Prop
ortio
n of
sequ
ence
s (%
)
b
p=0.052
Prop
ortio
n of
sequ
ence
s (%
)
Non-treated Pesticide-treated
c
194

Table 5-4 Phosphorus metabolism associated genes (at level 3) contributing to the dissimilarity of pesticide-treated and non-treated sites metagenomes. The larger value in
each case is shown in bold. * indicates the genes consistent with Diss/SD >1.4. Abundance values are the square root transformed data. ‘Others’ indicate genes contributing <
2% cumulative percentage of overall dissimilarity with Diss/SD <1.4. Abbreviations: Diss=dissimilarity; SD=standard deviation.
Genes Average abundance (non-treated)
Average abundance (pesticide-treated)
Diss/SD Cumulative (%)
Alkaline phosphatase 1.48 1.9 1.33 9.02 Secreted alkaline phosphatase 0.92 1.34 2.07* 17 Probable low-affinity inorganic phosphate transporter 2.07 2.26 1.24 22.07 Low-affinity inorganic phosphate transporter 0.67 0.56 1.62* 27.02 Inorganic pyrophosphatase 2.23 2.11 1.43* 31.49 PhoQ 1.21 1.06 1.05 35.65 Phosphate ABC transporter, periplasmic phosphate-binding protein PstS 2.42 2.28 1.97* 39.03 Response regulator in two-component regulatory system with PhoQ 1.14 0.97 0.85 42.29 Phosphate transport ATP-binding protein PstB 2.62 2.47 1.85* 45.28 Exopolyphosphatase 1.82 1.93 1.27 48.23 Polyphosphate kinase 3.00 2.99 1.35 51.1 Soluble pyridine nucleotide transhydrogenase 1.63 1.62 0.97 53.94 Phosphate transport system permease protein PstA 2.16 2.05 1.34 56.73 Phosphate transport regulator (distant homolog of PhoU) 1.28 1.41 0.75 59.42 Predicted ATPase related to phosphate starvation-inducible protein PhoH 1.28 1.41 0.75 62.11 NAD(P) transhydrogenase alpha subunit 2.35 2.21 1.13 64.78 Phosphate starvation-inducible ATPase PhoH with RNA binding motif 0.93 0.88 0.56 67.44 Pyrophosphate-energized proton pump 3.06 2.99 1.20 70.05 Phosphate regulon transcriptional regulatory protein PhoB 2.80 2.86 1.25 72.61 Alkaline phosphatase synthesis transcriptional regulatory protein PhoP 1.06 1.07 0.69 75.00 NAD(P) transhydrogenase subunit beta 2.35 2.26 1.14 77.27 Phosphate regulon sensor protein PhoR (SphS) 2.38 2.47 0.95 79.26 Others 4.30 4.29 <1.4 90.81
195

5.3.4 Shifts in functional potential in pesticide-treated and non-treated soils
within site
Within site 4 and site 5, MDS analysis at metabolic profile hierarchical level 2,
revealed a separation between pesticide-treated (4R and 5R) and non-treated (4H and
5H) metagenomes (Figure 5-4). STAMP analysis of the metabolic profile
(hierarchical level 2) of site 4 (4R and 4H) showed that the metagenomes derived
from 4R and 4H differed statistically only in protein secretion system, Type III (data
not shown).
By contrast, the metagenomes derived from 5R were distinct from 5H, and the sub-
set of specific gene categories that was found abundant in pesticide-treated sites
(Section 5.3.3) was also found to be higher in 5R. These included genes associated
with chemotaxis and flagellar motility, iron acquisition, stress responses, RNA
modification and phage-associated genes (Figure 5-7) suggesting that some of the
soil metagenomic profile responses to the pesticide addition are similar across or
within sites.
196

Figure 5-7 Metabolic processes over- and under-represented within site 5 in pesticide-treated (5R)
metagenomes relative to the non-treated metagenomes (5H) at metabolic hierarchical level 2 of MG-
RAST. The top 40 functional genes are presented here out of total 89 significantly different functional
genes. Corrected q-values were calculated using Storey’s FDR approach.
Mean proportion (%)Scale (0.0 to 5.1)
Difference in mean proportion (%)Scale (-0.3 to 0.4)
q-va
lue
(cor
rect
ed)
5H (non-treated)5R (pesticide-treated)
197

Analysis for P-metabolism genes was also performed within site 4 (4H and 4R) and
site 5 (5H and 5R). Phosphorus (P) metabolism genes were significantly higher in 5R
(0.850% to 0.851%), than 5H (0.830%-0.831%) at level 1 (p<0.001, Figure 5-8a);
however, the P-metabolism genes contributed less to the observed difference
between metagenomes of 5H and 5R sites (p=0.069, Figure 5-8b) at level 2. In
addition to this, P-metabolism genes were also significantly higher in 5R than 5H
(5R=0.565% to 0.567%; 5H=0.538%-0.545%; p=0.028, Figure 5-8c) at level 3 of
metabolic hierarchy.
Although no significant difference was observed, the abundance of P-metabolism
genes appeared slightly higher in 4R than 4H at level 1 and level 3 (Figure 5-9a and
c, respectively). Similarity percent (SIMPER) analysis revealed that the main genes
associated with P-metabolism (at level 3) contributing to the differences within site 4
and site 5 was similar to the ones found across all sites (Table 5-4) (data not shown).
198

Figure 5-8 Box plot showing the distribution in the proportion of phosphorus metabolism sequences
assigned to samples from 5H and 5R a) at metabolic hierarchical level 1 b) at metabolic hierarchical
level 2 and c) at metabolic hierarchical level 3. The median value is shown as a line within the box
and the mean value as a star.
p=0.069b
Prop
ortio
nof
sequ
ence
s (%
)
5H 5R
Prop
ortio
n of
sequ
ence
s (%
)
p=0.028c
Prop
ortio
nof
sequ
ence
s (%
)
a p<0.001
199

Figure 5-9 Box plot showing the distribution in the proportion of phosphorus metabolism sequences
assigned to samples from 4H and 4R a) at metabolic hierarchical level 1 b) at metabolic hierarchical
level 2 and c) at metabolic hierarchical level 3. The median value is shown as a line within the box
and the mean value as a star.
a p=0.102
Prop
ortio
n of
sequ
ence
s (%
)
p=0.665b
Prop
ortio
n of
sequ
ence
s (%
)
4H 4R
Prop
ortio
n of
sequ
ence
s (%
)
c p=0.176
200

5.4 Discussion
5.4.1 Taxonomy
Shifts in microbial communities were observed between pesticide-treated and non-
treated sites. Pesticide-treated sites harboured a slightly higher α-diversity than the
non-treated sites indicating a marginal effect of past pesticide treatment (in fields).
These results were contrary to findings in previous chapter (Chapter 3), where past
pesticide application (in fields) did not have significant effect on the bacterial
diversity. This difference might have occurred because of the higher resolution
approach used here (shotgun sequencing) and also the number of soil samples that
were not same. However, the general trend of diversity remained the same.
Contrasting to the general pattern of reduction in diversity in stressed/contaminated
environments (Sutton et al., 2013), the higher diversity might indicate that pesticide
treatment suppress or otherwise dominant species relative to the rare species to
maintain the stability of soil function during the stress (pesticide-treatment).
However, it should be noted that microbial diversity is also influenced by the soil
chemistry (Adamidis et al., 2014). The contrary diversity pattern observed here
might be because the soils varied in a variety of ways and especially because the
pesticide driven increase in diversity was mainly contributed by site 5.
In addition to this, the dominant bacterial genera were similar across sites but
statistically significant differences in the relative abundance of the less abundant
genera (rare) were observed. The results obtained, showed a strong response of ‘rare’
but not dominant bacteria to pesticide treatment which has also been observed
elsewhere (Sangwan et al., 2012). Based on the relative abundances, at the pesticide-
treated sites there was an increase in the abundance of Proteobacteria (Methylibium,
201

Sphingomonas, Novosphingobium, Sphingobium, Phenylobacterium, Maricaulis,
Rubrivivax and Leptothrix) and Bacteroidetes (Pedobacter, Parabacteroides,
Marivirga and Paludibacter). Dominance of Proteobacteria is consistent with the
phylogenetic diversity observed in contaminated environments (Reddy et al., 2011,
Beazley et al., 2012, Fang et al., 2014) and many Proteobacteria have been noted for
their ability to degrade and transform poly aromatic hydrocarbons (PAHs) (Ramana
et al., 2006, Kane et al., 2007, Kertesz and Kawasaki, 2010, Reddy et al., 2014),
pesticides (Li et al., 2007, Yan et al., 2007, Li et al., 2008, Hussain et al., 2011, Chu
et al., 2014) and organochlorine compounds (Böltner et al., 2005, Neufeld et al.,
2006, Nagata et al., 2011). Although Bacteroidetes are not known to degrade
xenobiotics, several related genera inhabit contaminated environments (Chanika et
al., 2011) and some have been reported to degrade pesticides. For example,
Pedobacter is able to degrade carbofuran (Karpouzas et al., 2000a), Marivirga and
Paludibacter can degrade the pesticides endosulfan, chlorpyrifos and cypermethrin
(Naphade et al., 2013) and fluazifop-P-butyl (herbicide) (Darine et al., 2015),
respectively. Another genus, Parabacteroides, has been isolated from ecosystems
with a history of polyaromatic hydrocarbon (PAHs) and polychlorinated biphenyl
(PCB) (Braun et al., 2015) pollution, and thus their significance in the degradation of
xenobiotic compounds cannot be ruled out.
By contrast, the Archaeal-related genera (Methanococcus, Methanothermobacter,
Methanopyrus, Archaeoglobus and Thermococcus) were enriched in the non-treated
sites relative to pesticide-treated sites, indicating that these genera are sensitive to
pesticide (OP) application. These results suggest that these microorganisms might be
used as potential bio-indicators for monitoring pesticide-contamination of soils. This
is in accordance with the study of taxonomical diversity in pesticide-treated soils
202

(e.g. imidacloprid, dazomet and mancozeb) where the ammonia-oxidising archaeal
community was negatively affected by the pesticide-treatment (Cycoń and
Piotrowska-Seget, 2015b, Feld et al., 2015) implying that this domain might be
vulnerable to pesticide-stress. This study provides the first metagenomic analysis
focusing on the impact of OP pesticide application on the soil microbial communities
and the relationship between the pesticide treatment and the distribution of the
microbial taxa. Thus, these finding provide novel insight into predicting the
responses of the soil bacterial diversity to long-term pesticide applications.
5.4.2 Predicted metabolic functions
Unconstrained MDS ordination showed a clear separation of samples from pesticide-
treated and non-treated sites (Figure 5.4) suggesting consistent effect of pesticide
application across sites on metabolic gene profiles. The composition of the metabolic
profile (hierarchical level 3) responded similarly to the structural community
composition and there was a significant pesticide impact on functional gene profiles.
Several other studies have likewise shown that anthropogenic disturbances
(contamination) have caused a shift in microbial community functionality (Hemme et
al., 2010, Smith et al., 2012). For example, studies on soil microbial communities
and functional gene diversity in a hydrocarbon-based study similarly showed
differences in microbial community structure in contaminated versus non-
contaminated sites (Liang et al., 2011, Sangwan et al., 2012, Smith et al., 2013).
A comparison of metagenomic data between pesticide-treated and non-treated sites
(both across and within) showed that genes affiliated with core metabolic functions
were the most abundant across all the metagenomes analysed. These included
203

general metabolic functions like respiration, carbohydrate, amino acid, protein, RNA
and DNA metabolism, which are essential for the survival of microbes and are
maintained across all habitats. These observations were in line with metagenomic
studies in the marine environment (Dinsdale et al., 2008, Hewson et al., 2009, Smith
et al., 2012, Tout et al., 2014). However, less abundant gene categories associated
with more specialised metabolic processes (iron acquisition and metabolism,
motility, cell signalling, stress response) accounted for greater relative gene
abundances in pesticide-treated sites than in non-treated sites. Similar patterns have
been documented in other stressed or contaminated environments (Ford, 2000, Paul
et al., 2005, Ahmed and Holmström, 2014).
Microbial communities should adapt to the sudden loss of the key micro-nutrients
like P and iron occurring due to pesticide addition or unintentional contamination.
The increase in genes associated with iron acquisition (siderophores) and phosphorus
metabolism in pesticide-treated soils indicated the potential of the indigenous
microbial communities to adapt and survive in nutrient limited environments by
allowing for an effective scavenging mechanism. Furthermore, pathways associated
with carbohydrate and protein metabolism were reduced in the pesticide-treated sites
indicating that the microbial communities are allocating more of their energy to
acquisition of key nutrients, particularly iron and phosphorus, needed for
biodegradation of the chemical pesticides. This eventually leads to a decrease in the
complex carbohydrates and proteins pathways for growth. Siderophores related
genes were relatively abundant indicating greater siderophores production by the
bacterial community. The role of siderophores in several other sectors, like
agriculture, bioremediation, bio-sensing and medicine is also documented (Saha et
al., 2015). The observations that toxic environments induce the production of
204

siderophores potentially allows siderophore-producing bacteria to assist in the
detoxification of various heavy metals (Nair et al., 2007, Rajkumar et al., 2010,
Wang et al., 2011b, O'Brien et al., 2014), mobilising metals from mine wastes
(Edberg et al., 2010), removal of OP compounds (Rani and Juwarkar, 2012) and
hydrocarbons from contaminated sites (Barbeau et al., 2002).
The genes related to bacterial motility and chemotaxis were relatively abundant in
pesticide-treated sites and contributed to consistent differences in bacterial
community composition within and across sites. The success of the microbial
degradation of chemical pollutants is often limited by the inability of the bacteria to
come in direct contact with the pollutants (Fernández-Luqueño et al., 2011, Niti et
al., 2013). Therefore, bacterial chemotaxis provides a distinct advantage to the motile
bacteria in finding their substrate and degrade them at higher rates (Pandey and Jain,
2002). Several studies on the isolation and characterisation of chemotactic
microorganisms capable of catabolising a variety of hazardous environmental
pollutants including nitroaromatic compounds, OP pesticides, hydrocarbons and
atrazine have reported that flagellum dependent motility and chemotaxis are crucial
factors in the process of degradation of xenobiotics (Parales et al., 2000, Parales and
Harwood, 2002, Law and Aitken, 2003, Paul et al., 2006, Guo et al., 2009, Pandey et
al., 2012). It is likely that motility and chemotaxis are particularly important for
microbial communities in contaminated sites where the chemical products are often
strong chemo-attractants (Samanta et al., 2002, Parales, 2004, Kato et al., 2008,
Ahemad and Khan, 2011). It is also suggested that the degradation ability of bacteria
is enhanced by initiation of biofilm formation that requires flagellar attachment
(Ortega-Calvo et al., 2003, Gordillo et al., 2007, Banat et al., 2010), which increase
the availability of the chemical pollutant in the soil (Mohan et al., 2006). Thus, the
205

higher relative abundance of flagellar genes suggests that the microbial communities
in pesticide-treated sites have metabolic pathways that will allow for direct contact
with pesticides for degradation.
Genes associated with phage-like gene transfer agents (GTA) were also more
abundant in pesticide-treated site suggesting an increase in genetic mobility due to
pollution. Studies have shown that phages move between environments and carry
‘mobile genes’ to manipulate host metabolisms (Canchaya et al., 2003, Edgell et al.,
2010) allowing microbial communities to rapidly adapt to the presence of
xenobiotics, such as OP compounds (Zhang et al., 2006a, Singh, 2009),
organochlorine compounds (Dogra et al., 2004), and herbicides (Devers et al., 2005)
through horizontal gene transfer (Top et al., 2002, Top and Springael, 2003).
Pesticide-treated sites were also found to have a high abundance of genes related to
stress responses indicating that the microbial communities possessed mechanisms to
tolerate and overcome oxidative stress. Pollution degrading microbial communities
often experience oxidative stress that is generated during biodegradation (Park et al.,
2004), but could adapt and adjust their physiology with the stress response (Chávez
et al., 2006, Zhang et al., 2012b).
The data indicated an over-representation of genes associated with P-metabolism in
pesticide-treated sites (both across and within) suggesting that the microbial
communities degraded OP compound as an alternative source of inorganic P to
survive P limiting conditions at that site. This indicates the presence of uncultivable
microorganisms in pesticide-treated sites since no isolated bacterial strains (Chapter
4) from these soils were capable of utilising CP (OP pesticide) as a source of P.
Previous literature has also reported that some bacterial communities have evolved
complex systems to survive under phosphorus starvation conditions, accomplished
206

through hydrolytic cleavage of phosphate ester bonds in OP compounds (Chen et al.,
1990, Singh and Walker, 2006, White and Metcalf, 2007, Hirota et al., 2010).
Additional, it should be noted that the abundances in the genes associated with P-
metabolism were prevalent enough to mark the difference between pesticide-treated
and non-treated sites at all the three metabolic hierarchical levels. This is in
agreement with the results of previous chapter (Chapter 3) where the enhanced
degradation of CP was maintained in soils despite no exposure to CP after its
efficacy loss (about 13 years ago). These results suggested that genes associated with
P-metabolism were still enriched in those soils due to the legacy effect of the
compound. Likewise, a study by (Singh et al., 2004) reported the isolation of
Enterobacter strain B-14 from the same sugarcane farm soils (Australian) with the
ability to mineralise CP as a source of C and P indicating the presence of P degrading
genes in the soils. Thus, the hypothesis that a significantly higher abundance of genes
associated with P-metabolism would be expected in pesticide-treated comply with
the observed results.
In addition to this, SIMPER analysis revealed that the main distinguishing gene
associated with P-metabolism at pesticide-treated sites was that of alkaline
phosphatase. This enzyme is involved in hydrolysing the ester bonds between P and
carbon (C) (C-O-P ester bonds), releasing inorganic P (Rahmansyah et al., 2009)
thus playing a role in P-metabolism. Alkaline phosphatase has been reported for their
role in the degradation of the OP pesticides by hydrolysing monoalkyl phosphates
(Singh and Walker, 2006, Luo et al., 2009b, Thengodkar and Sivakami, 2010,
Falguni and Sharma, 2014) and for their application in biological waste water
treatment processes (Xie et al., 2010a). In addition their role as biosensors in the
detection of pesticides (Chouteau et al., 2005) and other heavy metals contamination
207

also has been studied (Awasthi, 2012, Tekaya et al., 2013). The higher abundance of
alkaline phosphatase in pesticide-treated sites suggested the enrichment of
phosphatase gene and a role of alkaline phosphatase in scavenging inorganic P, under
stressed conditions, by degrading OP compounds. However, further analyses at
higher resolution is required to tease apart the role of other tri- and bi-ester phosphate
metabolising gene(s)/enzyme(s) for they play a direct role in degrading OP
compounds. However, above findings should be interpreted with caution because this
study suffers from an inherent limitation of field-based studies. It is possible that the
differences observed here may be explained by the agricultural practices employed in
farm (e.g. fertilisation applications and no cultivation in headland soils). These
limitations may have an effect in assessing the metabolic functions, making the
estimation less accurate. For example, it is worth mentioning here that apart from
pesticide effect, the abundance of alkaline phosphate at pesticide-treated sites could
also be attributed to the land-use (farming) history and use of phosphorus fertilisers.
Thus, metagenomic data needs to be further explored using more soil samples, e.g.
3R and 3H (no enhanced CP degradation in fields), to better differentiate the impact
of agricultural practices from pesticide treatments. Nonetheless, this study not only
provides the information about the relative abundance of the microbial communities
in the pesticide-treated sites but also on the distribution of functional genes important
for the catabolism of the OP pesticides.
Microbial communities are known to respond to pesticide treatments at the functional
level, whereby a shift in the community structure and/or metabolic potential can be
observed (Baxter and Cummings, 2008, Wang et al., 2008, Floch et al., 2011,
Zabaloy et al., 2012). A major goal in any xenobiotics-microorganisms interaction
study is to identify the response of key functional roles being undertaken by the
208

indigenous soil microbial communities. This study therefore provides additional
evidence for developing accurate predictions or ecological theories on relationship
between soil microbial diversity and functions into ecosystem models (Allison and
Martiny, 2008, Reich et al., 2012). Furthermore, our results based on replicated
sampling provide strong confidence in the validity of the observed pattern, which is
usually missing in metagenomic studies where differences in characteristics of
metagenomes are not necessarily reliable. However, future work is required to
investigate temporal-point relationships between soil microorganisms and functional
profile in other biomes to assess whether the interaction influences overall ecosystem
functioning.
209
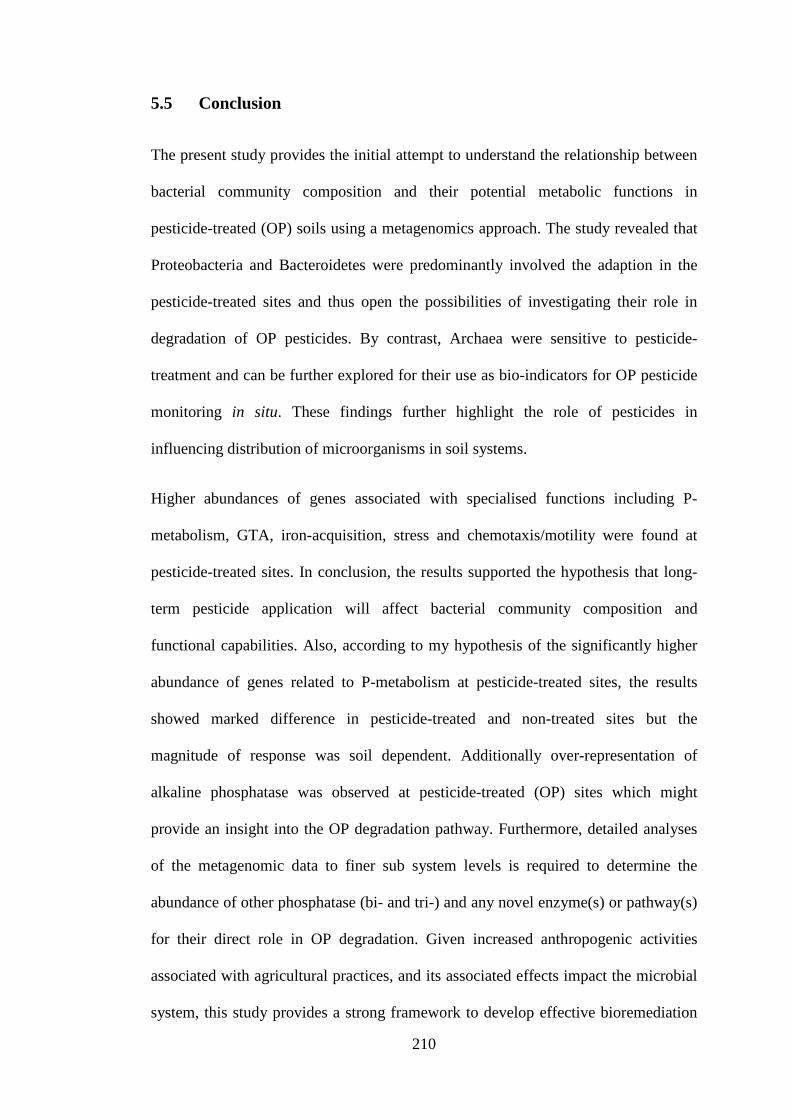
5.5 Conclusion
The present study provides the initial attempt to understand the relationship between
bacterial community composition and their potential metabolic functions in
pesticide-treated (OP) soils using a metagenomics approach. The study revealed that
Proteobacteria and Bacteroidetes were predominantly involved the adaption in the
pesticide-treated sites and thus open the possibilities of investigating their role in
degradation of OP pesticides. By contrast, Archaea were sensitive to pesticide-
treatment and can be further explored for their use as bio-indicators for OP pesticide
monitoring in situ. These findings further highlight the role of pesticides in
influencing distribution of microorganisms in soil systems.
Higher abundances of genes associated with specialised functions including P-
metabolism, GTA, iron-acquisition, stress and chemotaxis/motility were found at
pesticide-treated sites. In conclusion, the results supported the hypothesis that long-
term pesticide application will affect bacterial community composition and
functional capabilities. Also, according to my hypothesis of the significantly higher
abundance of genes related to P-metabolism at pesticide-treated sites, the results
showed marked difference in pesticide-treated and non-treated sites but the
magnitude of response was soil dependent. Additionally over-representation of
alkaline phosphatase was observed at pesticide-treated (OP) sites which might
provide an insight into the OP degradation pathway. Furthermore, detailed analyses
of the metagenomic data to finer sub system levels is required to determine the
abundance of other phosphatase (bi- and tri-) and any novel enzyme(s) or pathway(s)
for their direct role in OP degradation. Given increased anthropogenic activities
associated with agricultural practices, and its associated effects impact the microbial
system, this study provides a strong framework to develop effective bioremediation
210

strategies and ecotoxicology impacts of OP contamination, which could be harnessed
for future work.
211

Chapter 6: Final conclusion and future work
6.1 Conclusion
The overarching aim of this study was to investigate various aspects of interactions
between model compounds, trichloroethene (TCE), chlorpyrifos (CP) and
imidacloprid (IC), and the soil microbial community structure, diversity and
functional characteristics. Assessing the impact of xenobiotics on soil microbial
communities and their response is of importance because soil microorganisms play a
vital role in several biogeochemical cycles and maintain soil health, which are basic
requirements for crop production and environmental sustainability. The most
important findings of this study were:
• The methanotrophic consortium from Sydney University (SU) soil could co-
oxidize TCE in presence of high methane (CH4) concentration (33%)
suggesting a co-metabolic mode of TCE degradation. Of particular interest
was the observation that a decrease in CH4 concentration resulted in the
decreased or removal of methanotrophic consortium ability to degrade TCE.
The result highlighted the importance of optimum CH4 feeding strategy to
maximise TCE removal and reduce metabolite toxicity effects, which often
limits the efficacy of the in situ bioremediation process. This finding may
provide a framework to engineering models or tools for the effective in situ
bioremediation of TCE contaminated areas.
• The application of TCE also resulted in the enrichment of T-RF 53, identified
as a novel uncultivable indigenous Type I methanotroph (distantly related to
212

Methylovulum-88%) TCE degrader from Australian soils. Expanded
knowledge about the diversity of microorganisms involved in TCE would
likely lead to the discovery of novel mechanisms for biodegradation of TCE
and new bioremediation technologies based on those mechanisms can be
developed for the successful removal of the compound.
• The repeated application of CP and IC at 10 mg/kg in soils with no history of
pesticide application (non-treated) and soils with ~20 years pesticide
application (pesticide-treated) affected indigenous soil bacterial community
composition and broad functions (e.g. soil respiration) under lab conditions.
The inhibitory effects on microbial community composition persisted for the
entire incubation period suggesting that the bacterial community had a low
resistance to both CP and IC application.
• Additionally, high rates of CP degradation highlighted the potential risk of
reduced pesticide efficacy associated with the repeated application of the
pesticides due to the development of enhanced degradation. This could
potentially have detrimental impact on sustainability of agro-economy and
food security due to loss of pesticide efficacy. Despite no exposure to CP for
13 years (in fields), this study provide evidence that even after 13 years,
enhanced degradation capacity of soil microbial community was maintained
due to the legacy effect of previous use of the compound. Owing to the
widespread use of CP worldwide, this study provide a strong evidence of
legacy effects of pesticide on soil microbial communities and the importance
of considering long-term management practices in agro-ecosystems.
213

• The novel CP and TCP degrading bacterial strains, Xanthomonas sp. 4R3-
M1, Pseudomonas sp. 4H1-M3 and Rhizobium sp. 4H1-M1 were isolated
from Australian soils. These strains retained their degrading ability in a range
of different media utilising CP and its primary degradation product (TCP) as
a source of carbon (C) and nitrogen (N). However, only Xanthomonas sp.
4R3-M1 and Pseudomonas sp. 4H1-M3 degraded TCP as a sole C- and N-
source when provided externally. The results indicate a promising
bioremediation potential of the bacterial strains that remains largely
untapped. The efficacy of microorganisms to degrade a certain compound at
any particular site is influenced by biotic and abiotic factors and thus is
difficult to predict. Therefore, isolation and characterisation of
microorganisms with different physiologies and degrading capabilities would
likely lead to the discovery of novel mechanisms of degradation and
improved knowledge on the degradation process. The expanded knowledge
on the biochemical and ecological nature of microbial transformation of the
xenobiotics would allow for the development of new and improved
bioremediation technologies based on those mechanisms.
• The investigation of impact of pesticides on microbial communities, in soils
with no history of pesticide application (non-treated) and soils with ~20 years
pesticide application (pesticide-treated) using next-generation sequencing
indicated taxonomic and functional adaptations in the soil microbial
communities following pesticide treatment. This study represents one of the
most comprehensive analyses of soil metagenomes focusing on the impact of
pesticide application on the soil microbial communities and the relationship
214
between the pesticide treatment and the distribution of the microbial taxa and
functional genes. The functional diversity was highly correlated with
taxonomic diversity across all sites (non-treated and pesticide-treated). The
Proteobacteria and Bacteroidetes were predominantly in these adaptions (at
pesticide-treated sites), and thus open possibilities to investigate their role in
degradation. In addition to this, genes associated with specialised functions
(e.g. iron-acquisition, stress, motility) were found in higher abundances at
pesticide-treated sites. These findings provide novel insights into the
responses of soil microbial diversity and functional capabilities to long-term
pesticide applications.
• The legacy of CP application on functional capabilities, with particular focus
on genes associated with phosphorus (P)-metabolism, was investigated
between soil metagenomes of pesticide-treated and non-treated sites. The
analyses indicated that there were differences in abundance of P-metabolism
genes. Despite generating >520 Mbp shotgun metagenomic data no
significant difference on the abundance of organophosphorus (OP) degrading
genes was observed. These results indicated the next-generation sequencing
did not precisely determine the difference in OP degrading genes and further
improvised tools (without need of amplification), e.g. metatranscriptomics are
required for analysing the profile of expressed genes effectively. In addition
to this, alkaline phosphatase associated genes were over-represented in
pesticide-treated sites suggesting the capacity of the soil microbial
communities to biodegrade simple monoalkyl phosphates which may also
215

play a role in OP compound degradation. More work is required (at finer
hierarchical levels) to tease apart the role of other tri- and bi-ester phosphate.
Overall, this study provides novel insight into the interaction between xenobiotics
and the soil microbial communities both at structural and functional levels. The
findings from this study should be explicitly considered in developments in
xenobiotic regulation and pesticide use in terms of application frequency.
6.2 Future work
As presented in this study, under an optimum CH4 concentration a novel indigenous
uncultivable methanotroph (T-RF 53) was identified from Australian soils with the
potential to degrade TCE. Future work should focus on the successful development
of TCE bioremedial strategies in field-based research to verify the efficacy of this
uncultivable methanotroph (T-RF 53) under natural conditions. If consistent trends
are observed, this study can be extended to bioremediate TCE contaminated site in
situ. Furthermore, future work should include isolating pure methanotrophic cultures
from soils under different enrichment conditions because there still remains a lot to
be unveiled about their physiology, genetics and genomics.
Whilst this study illustrated the significant impact of application of CP and IC on soil
bacterial communities and functional capabilities, further research is required to
determine impacts on other microbial communities (e.g. fungi) and functional groups
at different application concentrations. Given that the impact of pesticides is strongly
influenced by abiotic conditions, including soil type, temperature and pH, more
research can provide required knowledge to establish guidelines for best practices.
216

For example, soil type can be a major factor in determining the fate of pesticide in
the environment, affecting the bioavailability of the compound.
Novel CP and TCP degrading bacterial strains were isolated from Australian
sugarcane farm soils through lab screening. Future work could, therefore, focus to
determine the optimum pH and temperature of the isolates at different concentrations
of CP and TCP for maximum degradation of the compounds. In addition to this,
further work is required to study the capacities (activity and survival) of these
isolates in contaminated fields by means of bioaugmentation. Scale-up studies (for
example using bioreactors) could feasibly be used to assess the potential of the
strains to perform as desired at field-conditions treatment facilities. However, it is
worth mentioning that most of the microorganisms are uncultivable under laboratory
conditions and therefore, the knowledge of their role in degradation remains limited.
The use of stable isotope probing (SIP) could be adapted to monitor CP and TCP
degrading communities in natural mixed populations. Additionally, characterisation
and identification of the degradation pathways, enzymes and genes are other areas
for further investigation.
Furthermore, this work reported increased abundance of alkaline phosphatase at
pesticide-treated sites and future work should focus investigating the presence of
other phosphatases (at finer hierarchical levels) and determining their role in suitable
in situ bioremediation of organophosphorus contaminated sites.
217

Appendix A.
Chapter 2 Figure A-1 Activity of methanotrophic mixed culture in Sydney University (SU) soil under
33% methane concentration. a) Reduction in methane concentration and b) Reduction in TCE
concentration. Error bars represent standard error of the mean (n=3). Legends: TCE=trichloroethene
50%
80%
110%
0 8 12 24 36 48 96 144 192
TCE
conc
entr
atio
n
Time (hrs)
TCE Controlb
50%
80%
110%
0 8 12 24 36 48 96 144 192
Met
hane
conc
entr
atio
n
Time (hrs)
Methane Controla
218

Chapter 3 Figure A-2 Simpson’s diversity in soils amended with pesticide CP in the lab a) 0 day and
b) 105d with their respective controls. R represents the sites with a history of past pesticides
application in the fields and H represents headland not treated with pesticides (in fields). Error bars
represent standard error of the mean (n=3). Legends: CP=chlorpyrifos
0
20
40
60
1H 1R 2H 2R 3H 3R 4H 4R 5H 5R
Sim
pson
's d
iver
sity
Sites
CP controla
0
20
40
60
1H 1R 2H 2R 3H 3R 4H 4R 5H 5R
Sim
pson
's d
iver
sity
Sites
b
219

Chapter 3 Figure A-3 Bacterial richness in soils amended with pesticide CP in the lab a) 0 day and b)
105d with their respective controls. R represents the sites with a history of past pesticides application
in the fields and H represents headland not treated with pesticides (in fields). Error bars represent
standard error of the mean (n=3). Legends: CP=chlorpyrifos
0
30
60
90
1H 1R 2H 2R 3H 3R 4H 4R 5H 5R
Ric
hnes
s
Sites
CP controla
0
30
60
90
1H 1R 2H 2R 3H 3R 4H 4R 5H 5R
Ric
hnes
s
Sites
b
220

Chapter 3 Figure A-4 Bacterial evenness in soils amended with pesticide CP in the lab a) 0
day and b) 105d with their respective controls. R represents the sites with a history of past
pesticides application in the fields and H represents headland not treated with pesticides (in
fields). Error bars represent standard error of the mean (n=3). Legends: CP=chlorpyrifos
0
0.3
0.6
0.9
1.2
1H 1R 2H 2R 3H 3R 4H 4R 5H 5R
Eve
nnes
s
Sites
CP controla
0
0.3
0.6
0.9
1.2
1H 1R 2H 2R 3H 3R 4H 4R 5H 5R
Eve
nnes
s
Sites
b
221

Chapter 3 Figure A-5 Simpson’s diversity in soils amended with pesticide IC in the lab a) 0
day and b) 103d with their respective controls. R represents the sites with a history of past
pesticides application in the fields and H represents headland not treated with pesticides (in
fields). Error bars represent standard error of the mean (n=3). Legends: IC=imidacloprid
0
30
60
90
1H 1R 2H 2R 3H 3R 4H 4R 5H 5R
Sim
pson
's d
iver
sity
Sites
IC controla
0
30
60
90
1H 1R 2H 2R 3H 3R 4H 4R 5H 5R
Sim
pson
's d
iver
sity
Sites
b
222

Chapter 3 Figure A-6 Bacterial richness in soils amended with pesticide IC in the lab a) 0 day and b)
103d with their respective controls. R represents the sites with a history of past pesticides application
in the fields and H represents headland not treated with pesticides (in fields). Error bars represent
standard error of the mean (n=3). Legends: IC=imidacloprid
0
30
60
90
1H 1R 2H 2R 3H 3R 4H 4R 5H 5R
Ric
hnes
s
Sites
IC controla
0
30
60
90
1H 1R 2H 2R 3H 3R 4H 4R 5H 5R
Ric
hnes
s
Sites
b
223

Chapter 3 Figure A-7 Bacterial evenness in soils amended with pesticide IC in the lab a) 0 day and b)
103d with their respective controls. R represents the sites with a history of past pesticides application
in the fields and H represents headland not treated with pesticides (in fields). Error bars represent
standard error of the mean (n=3). Legends: IC=imidacloprid
0
0.4
0.8
1.2
1H 1R 2H 2R 3H 3R 4H 4R 5H 5R
Eve
nnes
s
Sites
IC controla
0
0.4
0.8
1.2
1H 1R 2H 2R 3H 3R 4H 4R 5H 5R
Eve
nnes
s
Sites
b
224

Chapter 4 Figure A-8 Degradation of chlorpyrifos (CP) in MSM+N (without vitamins) when
inoculated with six bacterial isolates. After five days of incubation, no degradation was seen in any of
the inoculations and in un-inoculated controls (data not shown). Isolates 4R3-M1, 4R3-M2 and 4H1-
M4 illustrated a high similarity to members of the genus Xanthomonas. 4H1-M3, 4H1-M2 and 4H1-
M1 belonged to members of the genus Pseudomonas, Lysobacter and Rhizobium, respectively.
0%
30%
60%
90%
120%
4R3-M1 4R3-M2 4H1-M1 4H1-M2 4H1-M3 4H1-M4
CP
conc
entr
atio
n
Microbial cultures
0 day 4 day 5 day
225

0
0.05
0.1
0.15
0.2
0.25
0.3
0%
20%
40%
60%
80%
100%
0 2 4 6
Opt
ical
den
sity
(OD
600)
CP
conc
entr
atio
n
Time (days)
a CP Optical density
0
5
10
15
0 2 4 6
TC
P pr
oduc
ed (p
pm)
Time (days)
TCP
0
0.05
0.1
0.15
0.2
0.25
0.3
0%
20%
40%
60%
80%
100%
0 2 4 6
Opt
ical
den
sity
(OD
600)
CP
conc
entr
atio
n
Time (days)
b
0
5
10
15
0 2 4 6
TC
P pr
oduc
ed (p
pm)
Time (days)
0
0.05
0.1
0.15
0.2
0.25
0.3
0%
20%
40%
60%
80%
100%
0 2 4 6
Opt
ical
den
sity
(OD
600)
CP
conc
entr
atio
n
Time (days)
c
0
5
10
15
0 2 4 6
TC
P pr
oduc
ed (p
pm)
Time (days)
226

Continued..
Chapter 4 Figure A-9 Bacterial growth, degradation of CP (%) and production of TCP (ppm) in soil
extract media (SEM); a) 4R3-M1 (Xanthomonas sp.), b) 4R3-M2 (Xanthomonas sp.), c) 4H1-M1
(Rhizobium sp.), d) 4H1-M2 (Lysobacter sp.), e) 4H1-M3 (Pseudomonas sp.), and f) 4H1-M4
(Xanthomonas sp.). No degradation of CP and TCP production was observed in un-inoculated samples
(data not shown). Legends: CP=chlorpyrifos and TCP=3,5,6-trichloro-2-pyridinol
0
0.05
0.1
0.15
0.2
0.25
0.3
0%
20%
40%
60%
80%
100%
0 2 4 6
Opt
ical
den
sity
(OD
600)
CP
conc
entr
atio
n
Time (days)
d
0
5
10
15
0 2 4 6
TC
P pr
oduc
ed (p
pm)
Time (days)
0
0.05
0.1
0.15
0.2
0.25
0.3
0%
20%
40%
60%
80%
100%
0 2 4 6
Opt
ical
den
sity
(OD
600)
CP
conc
entr
atio
n
Time (days)
e
0
5
10
15
0 2 4 6
TC
P pr
oduc
ed (p
pm)
Time (days)
0
0.05
0.1
0.15
0.2
0.25
0.3
0%
20%
40%
60%
80%
100%
0 2 4 6
Opt
ical
den
sity
(OD
600)
CP
conc
entr
atio
n
Time (days)
f
0
5
10
15
0 2 4 6
TC
P pr
oduc
ed (p
pm)
Time (days)
227

Chapter 4 Figure A-10 Bacterial growth and degradation of TCP in SEM; a) 4R3-M1 (Xanthomonas
sp.), b) 4R3-M2 (Xanthomonas sp.), c) 4H1-M1 (Rhizobium sp.), d) 4H1-M2 (Lysobacter sp.), e)
4H1-M3 (Pseudomonas sp.), and f) 4H1-M4 (Xanthomonas sp.). No degradation of TCP was
observed in un-inoculated controls (data not shown). Legends: TCP=3,5,6-trichloro-2-pyridinol
-0.2
0
0.2
0.4
0.6
0.8
1
0%
20%
40%
60%
80%
100%
0 2 4 6
Opt
ical
den
sity
(OD
600)
TC
P co
ncen
trat
ion
Time (days)
a TCP Optical density
-0.2
0
0.2
0.4
0.6
0.8
1
0%
20%
40%
60%
80%
100%
0 2 4 6
Opt
ical
den
sity
(OD
600)
TC
P co
ncen
trat
ion
Time (days)
b
-0.2
0
0.2
0.4
0.6
0.8
1
0%
20%
40%
60%
80%
100%
0 2 4 6
Opt
ical
den
sity
(OD
600)
TC
P co
ncen
trat
ion
Time (days)
c
-0.2
0
0.2
0.4
0.6
0.8
1
0%
20%
40%
60%
80%
100%
0 2 4 6
Opt
ical
den
sity
(OD
600)
TC
P co
ncen
trat
ion
Time (days)
d
-0.2
0
0.2
0.4
0.6
0.8
1
0%
20%
40%
60%
80%
100%
0 2 4 6
Opt
ical
den
sity
(OD
600)
TC
P co
ncen
trat
ion
Time (days)
e
-0.2
0
0.2
0.4
0.6
0.8
1
0%
20%
40%
60%
80%
100%
0 2 4 6
Opt
ical
den
sity
(OD
600)
TC
P co
ncen
trat
ion
Time (days)
f
228
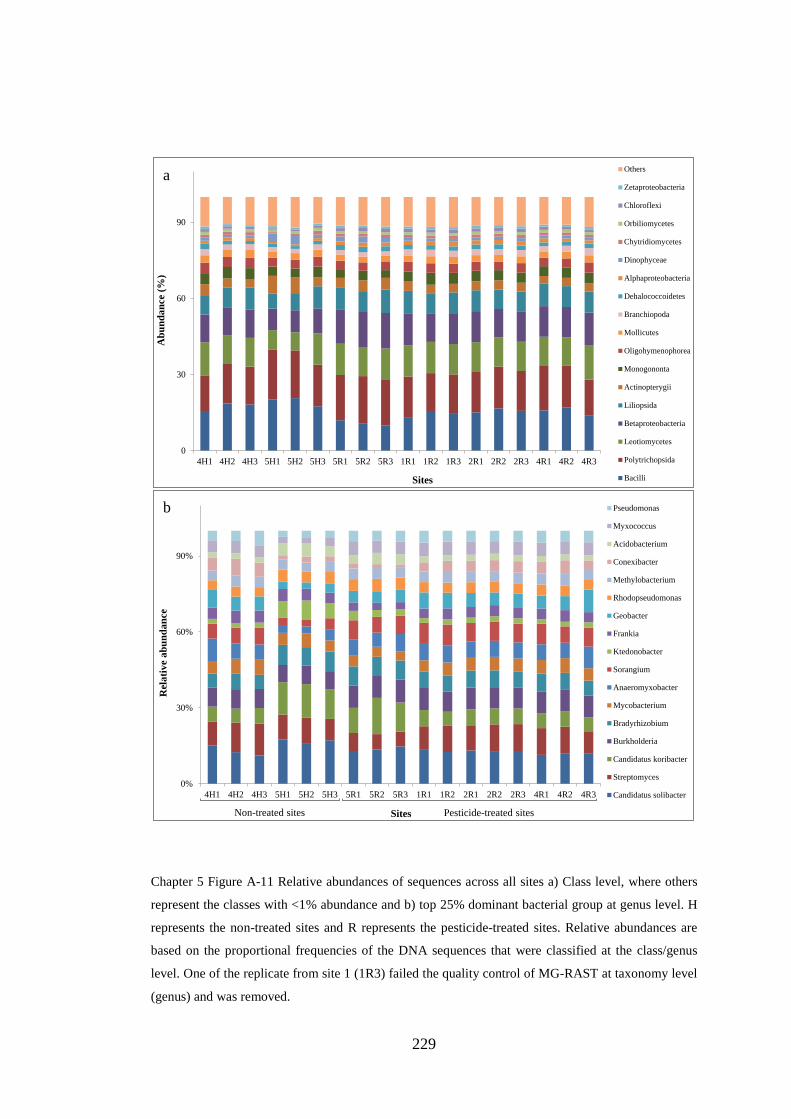
Chapter 5 Figure A-11 Relative abundances of sequences across all sites a) Class level, where others
represent the classes with <1% abundance and b) top 25% dominant bacterial group at genus level. H
represents the non-treated sites and R represents the pesticide-treated sites. Relative abundances are
based on the proportional frequencies of the DNA sequences that were classified at the class/genus
level. One of the replicate from site 1 (1R3) failed the quality control of MG-RAST at taxonomy level
(genus) and was removed.
0
30
60
90
4H1 4H2 4H3 5H1 5H2 5H3 5R1 5R2 5R3 1R1 1R2 1R3 2R1 2R2 2R3 4R1 4R2 4R3
Abu
ndan
ce (%
)
Sites
Others
Zetaproteobacteria
Chloroflexi
Orbiliomycetes
Chytridiomycetes
Dinophyceae
Alphaproteobacteria
Dehalococcoidetes
Branchiopoda
Mollicutes
Oligohymenophorea
Monogononta
Actinopterygii
Liliopsida
Betaproteobacteria
Leotiomycetes
Polytrichopsida
Bacilli
0%
30%
60%
90%
4H1 4H2 4H3 5H1 5H2 5H3 5R1 5R2 5R3 1R1 1R2 2R1 2R2 2R3 4R1 4R2 4R3
Rel
ativ
e ab
unda
nce
Sites
Pseudomonas
Myxococcus
Acidobacterium
Conexibacter
Methylobacterium
Rhodopseudomonas
Geobacter
Frankia
Ktedonobacter
Sorangium
Anaeromyxobacter
Mycobacterium
Bradyrhizobium
Burkholderia
Candidatus koribacter
Streptomyces
Candidatus solibacter
Non-treated sites Pesticide-treated sites
a
b
229

Chapter 5 Table A-1 Summary of metagenomic data (bp) obtained across sites from each replicate, where H is non-treated sites and R is pesticide-treated sites.
Sample Name 4H1 4H2 4H3 5H1 5H2 5H3
Upload: bp Count 784,365,040 488,929,003 1,182,103,036 552,087,739 2,115,024,565 423,031,308
Upload: Sequences Count
3,405,113 2,128,311 6,524,711 2,233,079 13,466,304 1,820,346
Upload: Mean Sequence Length
230 ± 43 bp 229 ± 42 bp 181 ± 46 bp 247 ± 38 bp 157 ± 24 bp 232 ± 43 bp
Upload: Mean GC percent
63 ± 9 % 63 ± 8 % 63 ± 9 % 61 ± 8 % 61 ± 9 % 61 ± 9 %
Artificial Duplicate Reads: Sequence Count
3,397 994 90,024 2,764 113,225 3,337
Post QC: bp Count 742,496,014 459,900,773 1,085,829,922 518,402,254 1,963,944,299 399,468,284
Post QC: Sequences Count
3,357,636 2,095,947 6,238,415 2,199,615 12,993,485 1,792,924
Post QC: Mean Sequence Length
221 ± 50 bp 219 ± 50 bp 174 ± 52 bp 235 ± 51 bp 151 ± 31 bp 222 ± 50 bp
Post QC: Mean GC percent
63 ± 9 % 63 ± 8 % 63 ± 9 % 61 ± 8 % 61 ± 9 % 61 ± 9 %
Processed: Predicted Protein Features
3,184,241 2,010,166 5,737,824 2,057,643 11,648,094 1,705,129
Processed: Predicted rRNA Features
25,221 16,814 60,955 14,275 111,166 13,483
Alignment: Identified Protein Features
1,235,895 790,282 1,938,380 847,312 3,794,844 673,990
Alignment: Identified rRNA Features
715 488 1,222 466 1,830 432
Annotation: Identified functional Categories
952,405 612,016 1,501,863 656,196 2,902,759 516,076
230

Continued..
Sample Name 4H1 4H2 4H3 5H1 5H2 5H3
Upload: bp Count 784,365,040 488,929,003 1,182,103,036 552,087,739 2,115,024,565 423,031,308
Upload: Sequences Count
3,405,113 2,128,311 6,524,711 2,233,079 13,466,304 1,820,346
Upload: Mean Sequence Length
230 ± 43 bp 229 ± 42 bp 181 ± 46 bp 247 ± 38 bp 157 ± 24 bp 232 ± 43 bp
Upload: Mean GC percent
63 ± 9 % 63 ± 8 % 63 ± 9 % 61 ± 8 % 61 ± 9 % 61 ± 9 %
Artificial Duplicate Reads: Sequence Count
3,397 994 90,024 2,764 113,225 3,337
Post QC: bp Count 742,496,014 459,900,773 1,085,829,922 518,402,254 1,963,944,299 399,468,284
Post QC: Sequences Count
3,357,636 2,095,947 6,238,415 2,199,615 12,993,485 1,792,924
Post QC: Mean Sequence Length
221 ± 50 bp 219 ± 50 bp 174 ± 52 bp 235 ± 51 bp 151 ± 31 bp 222 ± 50 bp
Post QC: Mean GC percent
63 ± 9 % 63 ± 8 % 63 ± 9 % 61 ± 8 % 61 ± 9 % 61 ± 9 %
Processed: Predicted Protein Features
3,184,241 2,010,166 5,737,824 2,057,643 11,648,094 1,705,129
Processed: Predicted rRNA Features
25,221 16,814 60,955 14,275 111,166 13,483
Alignment: Identified Protein Features
1,235,895 790,282 1,938,380 847,312 3,794,844 673,990
Alignment: Identified rRNA Features
715 488 1,222 466 1,830 432
Annotation: Identified functional Categories
952,405 612,016 1,501,863 656,196 2,902,759 516,076
231

Continued..
Sample Name 1R1 1R2 1R3 2R1 2R2 2R3
Upload: bp Count 551,722,225 416,295,850 700,158,168 619,531,604 790,158,586 922,747,281
Upload: Sequences Count
2,350,931 1,743,361 2,951,993 2,605,365 3,253,772 3,853,883
Upload: Mean Sequence Length
234 ± 43 bp 238 ± 42 bp 237 ± 42 bp 237 ± 42 bp 242 ± 40 bp 239 ± 42 bp
Upload: Mean GC percent
62 ± 9 % 62 ± 9 % 62 ± 9 % 62 ± 9 % 62 ± 9 % 62 ± 9 %
Artificial Duplicate Reads: Sequence Count
2,908 3,691 2,526 2,506 3,021 3,822
Post QC: bp Count 519,109,689 390,402,344 657,669,970 583,482,725 744,009,960 867,615,159
Post QC: Sequences Count
2,313,565 1,714,557 2,905,315 2,566,028 3,206,595 3,795,241
Post QC: Mean Sequence Length
224 ± 51 bp 227 ± 52 bp 226 ± 51 bp 227 ± 51 bp 232 ± 51 bp 228 ± 51 bp
Post QC: Mean GC percent
62 ± 9 % 62 ± 9 % 62 ± 9 % 62 ± 9 % 62 ± 9 % 62 ± 9 %
Processed: Predicted Protein Features
2,217,986 1,643,489 2,782,451 2,458,394 3,072,861 3,615,555
Processed: Predicted rRNA Features
18,071 13,048 22,654 19,717 24,576 29,140
Alignment: Identified Protein Features
877,144 648,439 1,098,139 978,386 1,250,095 1,433,420
Alignment: Identified rRNA Features
610 432 821 625 885 974
Annotation: Identified functional Categories
681,383 496,864 845,787 757,266 963,516 1,104,912
232

Chapter 5 Table A-2 Summary of number of features that were annotated by the different databases across sites from each replicate, where H is non-treated sites and R is pesticide-treated sites. These include protein databases, protein databases with functional hierarchy information, and ribosomal RNA databases.
Sample Name 4H1 4H2 4H3 5H1 5H2 5H3 4R1 4R2 4R3
GenBank 1308814 831581 1308814 904997 4127758 714977 1517130 1408229 981952
IMG 1285612 820996 1285612 876331 3989100 692090 1500518 1386520 965773 KEGG 1180285 755905 1180285 810018 3652733 635339 1382521 1277636 890287
PATRIC 1275977 816938 1275977 878269 4028041 687470 1489951 1376903 958813
RefSeq 1327814 848937 1327814 917476 4211500 722065 1548286 1432943 994901
SEED 1130116 721725 1130116 783399 3485704 615298 1325577 1224662 853983
SwissProt 192171 124641 1130116 127645 611020 103315 227504 213808 146464
TrEMBL 1315749 838379 1315749 908020 4138590 716527 1530475 1417603 988609
Eggnog 1056012 671788 1056012 737112 3251446 573542 1228975 1142408 795388
COG 899624 574721 899624 619249 2750473 482732 1051753 976253 681532 KO 460845 298538 460845 308450 1460085 243558 537723 503141 347525
NOG 53240 31930 53240 41355 158119 30792 60517 54496 39357
Subsystems 1572382 1010836 1572382 1060262 4980418 840642 1848709 1717882 1189058
Greengenes 328 192 328 196 1076 167 416 413 246
SILVA LSU 431 309 431 336 1406 304 586 739 528
RDP 355 200 355 216 1182 185 438 431 256
SILVA SSU 447 285 447 305 1611 379 602 747 360
233

Continued..
Sample Name 5R1 5R2 5R3 1R1 1R2 1R3 2R1 2R2 2R3
GenBank 2118436 2202439 2703729 925788 685220 1148554 1028166 1315531 1508872
IMG 2092458 2181483 2680436 912616 673244 1137534 1014925 1300623 1489901 KEGG 1929073 2014483 2473794 840756 618175 1049231 935977 1195841 1374176
PATRIC 2087407 2169726 2664991 904945 666557 1128728 1006425 1292292 1481821
RefSeq 2167844 2255531 2762670 940718 694600 1172524 1045455 1342173 1537422
SEED 1844070 1921045 2369234 806209 592088 998508 895494 1143826 1310994
SwissProt 321493 336283 427091 139668 100220 169222 151963 191294 221878
TrEMBL 2138988 2223129 2726349 932133 689167 1159340 1035667 1325531 1520540
Eggnog 1737624 1821151 2248403 750949 546038 928102 830934 1059860 1216644
COG 1490497 1562528 1929187 642767 465083 792436 710864 904421 1040006 KO 764617 800181 993413 327966 236778 404364 363794 459262 531932
NOG 84822 90691 109250 36911 27678 46680 41554 53930 60774
Subsystems 2618226 2740144 3429647 1123846 812310 1383000 1246705 1573378 1813186 Greengenes 588 656 753 265 194 378 266 383 435 SILVA LSU 979 932 1103 355 266 557 443 629 663 RDP 616 708 793 291 205 392 293 412 468
SILVA SSU 938 993 1080 369 271 510 418 569 624
234

References
ABD‐ALLA, M. 1994. Phosphodiesterase and phosphotriesterase in Rhizobium and Bradyrhizobium strains and their roles in the degradation of organophosphorus pesticides. Letters in Applied Microbiology, 19, 240-243.
ABDULLAH, N. Z., ISHAKA, A., SAMSUDDIN, N., MOHD RUS, R. & MOHAMED, A. H. 2011. Chronic organophosphate pesticide exposure and coronary artery disease: finding a bridge. IIUM Research, Invention and Innovation Exhibition (IRIIE).
ABRAHAM, J., SHANKER, A. & SILAMBARASAN, S. 2013. Role of Gordonia sp JAAS1 in biodegradation of chlorpyrifos and its hydrolysing metabolite 3, 5, 6‐trichloro‐2‐pyridinol. Letters in Applied Microbiology, 57, 510-516.
ABRAHAM, J. & SILAMBARASAN, S. 2013. Biodegradation of chlorpyrifos and its hydrolyzing metabolite 3, 5, 6-trichloro-2-pyridinol by Sphingobacterium sp. JAS3. Process Biochemistry, 48, 1559-1564.
ABRAHAMSSON, K., CHOO, K.-S., PEDERSÉN, M., JOHANSSON, G. & SNOEIJS, P. 2003. Effects of temperature on the production of hydrogen peroxide and volatile halocarbons by brackish-water algae. Phytochemistry, 64, 725-734.
ADAMIDIS, G. C., KAZAKOU, E., BAKER, A. J., REEVES, R. D. & DIMITRAKOPOULOS, P. G. 2014. The effect of harsh abiotic conditions on the diversity of serpentine plant communities on Lesbos, an eastern Mediterranean island. Plant Ecology & Diversity, 7, 433-444.
AGARWAL, R. & SRINIVAS, R. 2007. Severe neuropsychiatric manifestations and rhabdomyolysis in a patient with imidacloprid poisoning. The American Journal of Emergency Medicine, 25, 844-845.
AGRESTI, A. 1999. On logit confidence intervals for the odds ratio with small samples. Biometrics, 55, 597-602.
AHEMAD, M. & KHAN, M. S. 2011. Pesticide interactions with soil microflora: importance in bioremediation. Microbes and Microbial Technology. Springer.
AHMAD, R., KOOKANA, R. S., MEGHARAJ, M. & ALSTON, A. M. 2004. Aging reduces the bioavailability of even a weakly sorbed pesticide (carbaryl) in soil. Environmental Toxicology and Chemistry, 23, 2084-2089.
AHMED, E. & HOLMSTRÖM, S. J. 2014. Siderophores in environmental research: roles and applications. Microbial Biotechnology, 7, 196-208.
AHMED, G., ANAWAR, H., TAKUWA, D., CHIBUA, I., SINGH, G. & SICHILONGO, K. 2015. Environmental assessment of fate, transport and persistent behavior of dichlorodiphenyltrichloroethanes and hexachlorocyclohexanes in land and water ecosystems. International Journal of Environmental Science and Technology, 1-16.
235

ALAVANJA, M. C., ROSS, M. K. & BONNER, M. R. 2013. Increased cancer burden among pesticide applicators and others due to pesticide exposure. CA: A Cancer Journal for Clinicians, 63, 120-142.
ALEXANDER, M. 2000. Aging, bioavailability, and overestimation of risk from environmental pollutants. Environmental Science & Technology, 34, 4259-4265.
ALEXANDRATOS, N. & BRUINSMA, J. 2012. World agriculture towards 2030/2050: the 2012 revision. ESA Work. Pap, 3.
ALLEN, J. P., ATEKWANA, E. A., ATEKWANA, E. A., DURIS, J. W., WERKEMA, D. D. & ROSSBACH, S. 2007. The microbial community structure in petroleum-contaminated sediments corresponds to geophysical signatures. Applied and Environmental Microbiology, 73, 2860-2870.
ALLISON, S. D. & MARTINY, J. B. 2008. Resistance, resilience, and redundancy in microbial communities. Proceedings of the National Academy of Sciences, 105, 11512-11519.
ALVAREZ-COHEN, L. & MCCARTY, P. 1991. Effects of toxicity, aeration, and reductant supply on trichloroethylene transformation by a mixed methanotrophic culture. Applied and Environmental Microbiology, 57, 228-235.
AMANN, R. I., LUDWIG, W. & SCHLEIFER, K.-H. 1995. Phylogenetic identification and in situ detection of individual microbial cells without cultivation. Microbiological Reviews, 59, 143-169.
ANDERSON, J., LAFUERZA, A., ANDERSON, J., ARNOLD, D., LEWIS, F. & TORSTENSSON, L. Microbiological aspects of accelerated pesticide degradation. Proceedings of the International Symposium on Environmental Aspects of Pesticide Microbiology. Uppsala, Sweden: Department of Microbiology, Swedish University of Agricultural Sciences, 1992. 184-192.
ANDERSON, J. E. & MCCARTY, P. L. 1994. Model for treatment of trichloroethylene by methanotrophic biofilms. Journal of Environmental Engineering, 120, 379-400.
ANGUISH, T. & MAYMO-GATELL, X. 1999. Reductive dechlorination of chlorinated ethenes and 1, 2-dichloroethane by Dehalococcoides. Applied and Environmental Microbiology, 65, 3108-3113.
ANHALT, J. C., MOORMAN, T. B. & KOSKINEN, W. C. 2007. Biodegradation of imidacloprid by an isolated soil microorganism. Journal of Environmental Science and Health Part B, 42, 509-514.
ANTONIOUS, G. F. 2003. Impact of soil management and two botanical insecticides on urease and invertase activity. Journal of Environmental Science and Health, Part B, 38, 479-488.
ANWAR, S., LIAQUAT, F., KHAN, Q. M., KHALID, Z. M. & IQBAL, S. 2009. Biodegradation of chlorpyrifos and its hydrolysis product 3, 5, 6-trichloro-2-pyridinol by Bacillus pumilus strain C2A1. Journal of Hazardous Materials, 168, 400-405.
236

ARBELI, Z. & FUENTES, C. L. 2007. Accelerated biodegradation of pesticides: An overview of the phenomenon, its basis and possible solutions; and a discussion on the tropical dimension. Crop Protection, 26, 1733-1746.
ARCIERO, D., VANNELLI, T., LOGAN, M. & HOPPER, A. B. 1989. Degradation of trichloroethylene by the ammonia-oxidizing bacterium Nitrosomonas europaea. Biochemical and Biophysical Research Communications, 159, 640-643.
ARMBRUST, K. L. 2001. Chlorothalonil and chlorpyrifos degradation products in golf course leachate. Pest Management Science, 57, 797-802.
ARMSTRONG, J. L., FENSKE, R. A., YOST, M. G., GALVIN, K., TCHONG-FRENCH, M. & YU, J. 2013. Presence of organophosphorus pesticide oxygen analogs in air samples. Atmospheric Environment, 66, 145-150.
ARP, D. J., YEAGER, C. M. & HYMAN, M. R. 2001. Molecular and cellular fundamentals of aerobic cometabolism of trichloroethylene. Biodegradation, 12, 81-103.
AWASTHI, M. 2012. Relevance of Alkaline Phosphatase activity of immobilized green algae and cyanobacteria for heavy metal toxicity monitoring. Journal of Material and Environmental Science, 3, 446-51.
AYSAL, P., TIRYAKI, O. & TUNCBILEK, A. 2004. 14C-Dimethoate Residues in Tomatoes and Tomato Products. Bulletin of Environmental Contamination and Toxicology, 73, 351-357.
AZIZ, C. E., FITCH, M. W., LINQUIST, L. K., PRESSMAN, J. G., GEORGIOU, G. & SPEITEL, G. E. 1995. Methanotrophic biodegradation of trichloroethylene in a hollow fiber membrane bioreactor. Environmental Science & Technology, 29, 2574-2583.
BAKER, P., FUTAMATA, H., HARAYAMA, S. & WATANABE, K. 2001. Bacterial populations occurring in a trichloroethylene‐contaminated aquifer during methane injection. Environmental Microbiology, 3, 187-193.
BALE, A. S., BARONE, S., SCOTT, C. S. & COOPER, G. S. 2011. A review of potential neurotoxic mechanisms among three chlorinated organic solvents. Toxicology and Applied Pharmacology, 255, 113-126.
BANAT, I. M., FRANZETTI, A., GANDOLFI, I., BESTETTI, G., MARTINOTTI, M. G., FRACCHIA, L., SMYTH, T. J. & MARCHANT, R. 2010. Microbial biosurfactants production, applications and future potential. Applied Microbiology and Biotechnology, 87, 427-444.
BAND, P. R., ABANTO, Z., BERT, J., LANG, B., FANG, R., GALLAGHER, R. P. & LE, N. D. 2011. Prostate cancer risk and exposure to pesticides in British Columbia farmers. The Prostate, 71, 168-183.
BANKSTON, J. L., SOLA, D. L., KOMOR, A. T. & DWYER, D. F. 2002. Degradation of trichloroethylene in wetland microcosms containing broad-leaved cattail and eastern cottonwood. Water Research, 36, 1539-1546.
237

BANO, N. & MUSARRAT, J. 2003. Isolation and characterization of phorate degrading soil bacteria of environmental and agronomic significance. Letters in Applied Microbiology, 36, 349-353.
BARBEAU, K., ZHANG, G., LIVE, D. H. & BUTLER, A. 2002. Petrobactin, a photoreactive siderophore produced by the oil-degrading marine bacterium Marinobacter hydrocarbonoclasticus. Journal of the American Chemical Society, 124, 378-379.
BARTON, C. V., ELLSWORTH, D. S., MEDLYN, B. E., DUURSMA, R. A., TISSUE, D. T., ADAMS, M. A., EAMUS, D., CONROY, J. P., MCMURTRIE, R. E. & PARSBY, J. 2010. Whole-tree chambers for elevated atmospheric CO2 experimentation and tree scale flux measurements in south-eastern Australia: The Hawkesbury Forest Experiment. Agricultural and Forest Meteorology, 150, 941-951.
BASKARAN, S., KOOKANA, R. S. & NAIDU, R. 2003. Contrasting behaviour of chlorpyrifos and its primary metabolite, TCP (3, 5, 6-trichloro-2-pyridinol), with depth in soil profiles. Soil Research, 41, 749-760.
BAXTER, J. & CUMMINGS, S. 2008. The degradation of the herbicide bromoxynil and its impact on bacterial diversity in a top soil. Journal of applied microbiology, 104, 1605-1616.
BAZZAZIEH, N. 1996. Groundwater treatment technology. Water Environment and Technology, 8, 61-65.
BEAZLEY, M. J., MARTINEZ, R. J., RAJAN, S., POWELL, J., PICENO, Y. M., TOM, L. M., ANDERSEN, G. L., HAZEN, T. C., VAN NOSTRAND, J. D. & ZHOU, J. 2012. Microbial community analysis of a coastal salt marsh affected by the Deepwater Horizon oil spill. PLoS ONE, 7, e41305.
BENDING, G. D., LINCOLN, S. D., SØRENSEN, S. R., MORGAN, J. A. W., AAMAND, J. & WALKER, A. 2003. In-field spatial variability in the degradation of the phenyl-urea herbicide isoproturon is the result of interactions between degradative Sphingomonas spp. and soil pH. Applied and Environmental Microbiology, 69, 827-834.
BÉRARD, A., MAZZIA, C., SAPPIN-DIDIER, V., CAPOWIEZ, L. & CAPOWIEZ, Y. 2014. Use of the MicroResp™ method to assess pollution-induced community tolerance in the context of metal soil contamination. Ecological Indicators, 40, 27-33.
BHARDWAJ, S., SRIVASTAVA, M., KAPOOR, U. & SRIVASTAVA, L. 2010. A 90 days oral toxicity of imidacloprid in female rats: morphological, biochemical and histopathological evaluations. Food and Chemical Toxicology, 48, 1185-1190.
BIELEFELDT, A. R. & STENSEL, H. D. 1999. Biodegradation of aromatic compounds and TCE by a filamentous bacteria-dominated consortium. Biodegradation, 10, 1-13.
BLATCHFORD, P. A., SCOTT, C., FRENCH, N. & REHM, B. H. 2012. Immobilization of organophosphohydrolase OpdA from Agrobacterium radiobacter
238

by overproduction at the surface of polyester inclusions inside engineered Escherichia coli. Biotechnology and Bioengineering, 109, 1101-1108.
BLEISE, A., DANESI, P. & BURKART, W. 2003. Properties, use and health effects of depleted uranium (DU): a general overview. Journal of Environmental Radioactivity, 64, 93-112.
BLUMAN, A. G. 2007. Elementary Statistics: A Step-by-Step Approach, McGraw Hill Higher Education, New York.
BODROSSY, L., STRALIS‐PAVESE, N., MURRELL, J. C., RADAJEWSKI, S., WEILHARTER, A. & SESSITSCH, A. 2003. Development and validation of a diagnostic microbial microarray for methanotrophs. Environmental Microbiology, 5, 566-582.
BÖLTNER, D., MORENO‐MORILLAS, S. & RAMOS, J. L. 2005. 16S rDNA phylogeny and distribution of lin genes in novel hexachlorocyclohexane‐degrading Sphingomonas strains. Environmental Microbiology, 7, 1329-1338.
BOONE, M. D., SEMLITSCH, R. D., LITTLE, E. E. & DOYLE, M. C. 2007. Multiple stressors in amphibian communities: effects of chemical contamination, bullfrogs, and fish. Ecological Applications, 17, 291-301.
BÖRJESSON, G. & SVENSSON, B. H. 1997. Seasonal and diurnal methane emissions from a landfill and their regulation by methane oxidation. Waste Management & Research, 15, 33-54.
BOSMA, T. N., HARMS, H. & ZEHNDER, A. J. 2001. Biodegradation of xenobiotics in environment and technosphere. Springer,163-202.
BOWMAN, J., JIMENEZ, L., ROSARIO, I., HAZEN, T. & SAYLER, G. 1993a. Characterization of the methanotrophic bacterial community present in a trichloroethylene-contaminated subsurface groundwater site. Applied and Environmental Microbiology, 59, 2380-2387.
BOWMAN, J. P., SLY, L. I., NICHOLS, P. D. & HAYWARD, A. C. 1993b. Revised taxonomy of the methanotrophs: description of Methylobacter gen. nov., emendation of Methylococcus, validation of Methylosinus and Methylocystis species, and a proposal that the family Methylococcaceae includes only the group I methanotrophs. International Journal of Systematic Bacteriology 43, 735-753.
BRADLEY, P. M. 2003. History and ecology of chloroethene biodegradation: a review. Bioremediation Journal, 7, 81-109.
BRAUN, F., HAMELIN, J., BONNAFOUS, A., DELGENÈS, N., STEYER, J.-P. & PATUREAU, D. 2015. Similar PAH Fate in Anaerobic Digesters Inoculated with Three Microbial Communities Accumulating Either Volatile Fatty Acids or Methane. PLoS ONE, 10, e0125552.
BRIGMON, R. L. 2002. Methanotrophic bacteria: use in bioremediation. Encyclopedia of Environmental Microbiology.
239
BROHOLM, K., CHRISTENSEN, T. H. & JENSEN, B. K. 1993. Different abilities of eight mixed cultures of methane-oxidizing bacteria to degrade TCE. Water Research, 27, 215-224.
BULL, R. J. 2000. Mode of action of liver tumor induction by trichloroethylene and its metabolites, trichloroacetate and dichloroacetate. Environmental Health Perspectives, 108, 241.
BÜNEMANN, E., SCHWENKE, G. & VAN ZWIETEN, L. 2006. Impact of agricultural inputs on soil organisms—a review. Soil Research, 44, 379-406.
BURROWS, K. J., CORNISH, A., SCOTT, D. & HIGGINS, I. J. 1984. Substrate specificities of the soluble and particulate methane mono-oxygenases of Methylosinus trichosporium OB3b. Journal of General Microbiology, 130, 3327-3333.
BYL, T. D. & WILLIAMS, S. D. 2000. Biodegradation of chlorinated ethenes at a karst site in Middle Tennessee. Water Resources Investigations Report, 99, 4285.
CÁCERES, T. P., HE, W., MEGHARAJ, M. & NAIDU, R. 2008. Effect of insecticide fenamiphos on soil microbial activities in Australian and Ecuadorean soils. Journal of Environmental Science and Health, Part B, 44, 13-17.
CALIZ, J., VILA, X., MARTÍ, E., SIERRA, J., NORDGREN, J., LINDGREN, P.-E., BAÑERAS, L. & MONTSERRAT, G. 2011. The microbiota of an unpolluted calcareous soil faces up chlorophenols: evidences of resistant strains with potential for bioremediation. Chemosphere, 83, 104-116.
CAMPBELL, C. D., CHAPMAN, S. J., CAMERON, C. M., DAVIDSON, M. S. & POTTS, J. M. 2003. A rapid microtiter plate method to measure carbon dioxide evolved from carbon substrate amendments so as to determine the physiological profiles of soil microbial communities by using whole soil. Applied and Environmental Microbiology, 69, 3593-3599.
CANCHAYA, C., FOURNOUS, G., CHIBANI-CHENNOUFI, S., DILLMANN, M.-L. & BRÜSSOW, H. 2003. Phage as agents of lateral gene transfer. Current Opinion in Microbiology, 6, 417-424.
CAO, L., XU, J., WU, G., LI, M., JIANG, J., HE, J., LI, S. & HONG, Q. 2013. Identification of two combined genes responsible for dechlorination of 3, 5, 6-trichloro-2-pyridinol (TCP) in Cupriavidus pauculus P2. Journal of Hazardous Materials, 260, 700-706.
CARRIGER, J. F., RAND, G. M., GARDINALI, P. R., PERRY, W. B., TOMPKINS, M. S. & FERNANDEZ, A. M. 2006. Pesticides of potential ecological concern in sediment from south Florida canals: an ecological risk prioritization for aquatic arthropods. Soil & Sediment Contamination, 15, 21-45.
CARTER, S. R. & JEWELL, W. J. 1993. Biotransformation of tetrachloroethylene by anaerobic attached-films at low temperatures. Water Research, 27, 607-615.
CÉBRON, A., BODROSSY, L., STRALIS-PAVESE, N., SINGER, A. C., THOMPSON, I. P., PROSSER, J. I. & MURRELL, J. C. 2007. Nutrient amendments
240

in soil DNA stable isotope probing experiments reduce the observed methanotroph diversity. Applied and Environmental Microbiology, 73, 798-807.
CHANDRA, S., MAHINDRAKAR, A. N. & SHINDE, L. 2010. Determination of cypermethrin and chlorpyrifos in vegetables by GC-ECD. International Journal of ChemTech Research, 2, 908-911.
CHANG, H.-L. & ALVAREZ-COHEN, L. 1995. Model for the cometabolic biodegradation of chlorinated organics. Environmental Science & Technology, 29, 2357-2367.
CHANG, W. & CRIDDLE, C. S. 1997. Experimental evaluation of a model for cometabolism: prediction of simultaneous degradation of trichloroethylene and methane by a methanotrophic mixed culture. Biotechnology and Bioengineering, 56, 492-501.
CHANG, Y.-C., IKEUTSU, K., TOYAMA, T., CHOI, D. & KIKUCHI, S. 2011. Isolation and characterization of tetrachloroethylene-and cis-1, 2-dichloroethylene-dechlorinating propionibacteria. Journal of Industrial Microbiology & Biotechnology, 38, 1667-1677.
CHANIKA, E., GEORGIADOU, D., SOUEREF, E., KARAS, P., KARANASIOS, E., TSIROPOULOS, N. G., TZORTZAKAKIS, E. A. & KARPOUZAS, D. G. 2011. Isolation of soil bacteria able to hydrolyze both organophosphate and carbamate pesticides. Bioresource Technology, 102, 3184-3192.
CHAPLAIN, V., MOUGIN, C., BARRIUSO, E., MAMY, L., VIEUBLÉ-GONOD, L., BENOIT, P. & NÉLIEU, S. 2011. Fate of pesticides in soils: Toward an integrated approach of influential factors, INTECH Open Access Publisher.
CHÁVEZ, F. P., GORDILLO, F. & JEREZ, C. A. 2006. Adaptive responses and cellular behaviour of biphenyl-degrading bacteria toward polychlorinated biphenyls. Biotechnology Advances, 24, 309-320.
CHAWLA, N., SUNEJA, S. & KUKREJA, K. 2013. Isolation and characterization of chlorpyriphos degrading bacteria. Indian Journal of Agricultural Research, 47, 381-391.
CHEN, C.-M., YE, Q.-Z., ZHU, Z., WANNER, B. & WALSH, C. 1990. Molecular biology of carbon-phosphorus bond cleavage. Cloning and sequencing of the phn (psiD) genes involved in alkylphosphonate uptake and CP lyase activity in Escherichia coli B. Journal of Biological Chemistry, 265, 4461-4471.
CHEN, L.-Z., LI, Y.-L. & YU, Y.-L. 2014. Soil bacterial and fungal community successions under the stress of chlorpyrifos application and molecular characterization of chlorpyrifos-degrading isolates using ERIC-PCR. Journal of Zhejiang University Science B, 15, 322-332.
CHEN, W., BRUHLMANN, F., RICHINS, R. D. & MULCHANDANI, A. 1999. Engineering of improved microbes and enzymes for bioremediation. Current Opinion in Biotechnology, 10, 137-141.
CHEN, W., RICHINS, R., MULCHANDANI, P., KANEVA, I. & MULCHANDANI, A. 2000. Biodegradation of organophosphorus nerve agents by
241

surface expressed organophosphorus hydrolase. Enzymes in Action. Springer, 33, 211-221.
CHEN, Y.-M., LIN, T.-F., HUANG, C. & LIN, J.-C. 2008a. Cometabolic degradation kinetics of TCE and phenol by Pseudomonas putida. Chemosphere, 72, 1671-1680.
CHEN, Y., DUMONT, M. G., CÉBRON, A. & MURRELL, J. C. 2007. Identification of active methanotrophs in a landfill cover soil through detection of expression of 16S rRNA and functional genes. Environmental Microbiology, 9, 2855-2869.
CHEN, Y., DUMONT, M. G., MCNAMARA, N. P., CHAMBERLAIN, P. M., BODROSSY, L., STRALIS‐PAVESE, N. & MURRELL, J. C. 2008b. Diversity of the active methanotrophic community in acidic peatlands as assessed by mRNA and SIP‐PLFA analyses. Environmental Microbiology, 10, 446-459.
CHEN, Y. & MURRELL, J. C. 2010. When metagenomics meets stable-isotope probing: progress and perspectives. Trends in Microbiology, 18, 157-163.
CHENG, T.-C., HARVEY, S. P. & STROUP, A. N. 1993. Purification and properties of a highly active organophosphorus acid anhydrolase from Alteromonas undina. Applied and Environmental Microbiology, 59, 3138-3140.
CHIANG, S.-Y. D., MORA, R., DIGUISEPPI, W. H., DAVIS, G., SUBLETTE, K., GEDALANGA, P. & MAHENDRA, S. 2012. Characterizing the intrinsic bioremediation potential of 1, 4-dioxane and trichloroethene using innovative environmental diagnostic tools. Journal of Environmental Monitoring, 14, 2317-2326.
CHISHTI, Z. & ARSHAD, M. 2013. Growth Linked Biodegradation of Chlorpyrifos by Agrobacterium and Enterobacter spp. International Journal of Agriculture and Biology 15, 19-26.
CHIU, W. A., JINOT, J., SCOTT, C. S., MAKRIS, S. L., COOPER, G. S., DZUBOW, R. C., BALE, A. S., EVANS, M. V., GUYTON, K. Z. & KESHAVA, N. 2012. Human health effects of trichloroethylene: key findings and scientific issues. Environmental Health Perspectives, 121, 303-311.
CHIU, W. A., JINOT, J., SCOTT, C. S., MAKRIS, S. L., COOPER, G. S., DZUBOW, R. C., BALE, A. S., EVANS, M. V., GUYTON, K. Z. & KESHAVA, N. 2013. Human health effects of trichloroethylene: key findings and scientific issues. Environmental Health Perspectives, 121, 303-311.
CHO, C. M.-H., MULCHANDANI, A. & CHEN, W. 2002. Bacterial cell surface display of organophosphorus hydrolase for selective screening of improved hydrolysis of organophosphate nerve agents. Applied and Environmental Microbiology, 68, 2026-2030.
CHO, K.-C., LEE, D. G., ROH, H., FULLER, M. E., HATZINGER, P. B. & CHU, K.-H. 2013. Application of 13C-stable isotope probing to identify RDX-degrading microorganisms in groundwater. Environmental Pollution, 178, 350-360.
242

CHOI, S.-A., LEE, E.-H. & CHO, K.-S. 2013. Effect of trichloroethylene and tetrachloroethylene on methane oxidation and community structure of methanotrophic consortium. Journal of Environmental Science and Health, Part A, 48, 1723-1731.
CHOUTEAU, C., DZYADEVYCH, S., DURRIEU, C. & CHOVELON, J.-M. 2005. A bi-enzymatic whole cell conductometric biosensor for heavy metal ions and pesticides detection in water samples. Biosensors and Bioelectronics, 21, 273-281.
CHRISTEN, R. 2008. Global sequencing: a review of current molecular data and new methods available to assess microbial diversity. Microbes and Environments, 23, 253-268.
CHRISTOPHERSEN, M., LINDERØD, L., JENSEN, P. E. & KJELDSEN, P. 2000. Methane oxidation at low temperatures in soil exposed to landfill gas. Journal of Environmental Quality, 29, 1989-1997.
CHU, C., YUAN, C., LIU, X., YAO, L., ZHU, J., HE, J., KWON, S.-W. & HUANG, X. 2014. Phenylobacterium kunshanense sp. nov., isolated from the sludge of pesticide manufacturing factory. International journal of Systematic and Evolutionary Microbiology, ijs. 0.063644-0.
CHU, K.-H. & ALVAREZ-COHEN, L. 1998. Effect of nitrogen source on growth and trichloroethylene degradation by methane-oxidizing bacteria. Applied and Environmental Microbiology, 64, 3451-3457.
CHU, X., HUA, F., XUEDONG, P., XIAO, W., MIN, S., BO, F. & YUNLONG, Y. 2008. Degradation of chlorpyrifos alone and in combination with chlorothalonil and their effects on soil microbial populations. Journal of Environmental Sciences, 20, 464-469.
CLARKE, K. & WARWICK, R. 2001. Change in marine communities: An approach to statistical analysis and interpretation. PRIMER-E Ltd: Plymouth 2.
CLARKE, K. R. 1993. Non-parametric multivariate analyses of changes in community structure. Australian Journal of Ecology, 18, 117-117.
CLINGENPEEL, S. R., MOAN, J. L., MCGRATH, D. M., HUNGATE, B. A. & WATWOOD, M. E. 2012. Stable carbon isotope fractionation in chlorinated ethene degradation by bacteria expressing three toluene oxygenases. Frontiers in Microbiology, 3.
COCCO, P., SATTA, G., DUBOIS, S., PILI, C., PILLERI, M., ZUCCA, M., MARTINE‘T MANNETJE, A., BECKER, N., BENAVENTE, Y. & DE SANJOSÉ, S. 2012. Lymphoma risk and occupational exposure to pesticides: results of the Epilymph study. Occupational and Environmental Medicine, oemed-2012-100845.
COHEN, L. A. & MCCARTY, P. L. 1991. Effects of toxicity, aeration, and reductant supply on trichloroethylene transformation by a mixed methanotrophic culture. Applied and Environmental Microbiology, 57, 228-235.
COLEMAN, N. V., MATTES, T. E., GOSSETT, J. M. & SPAIN, J. C. 2002. Biodegradation of cis-dichloroethene as the sole carbon source by a β-proteobacterium. Applied and Environmental Microbiology, 68, 2726-2730.
243

COLEMAN, N. V., YAU, S., WILSON, N. L., NOLAN, L. M., MIGOCKI, M. D., LY, M. A., CROSSETT, B. & HOLMES, A. J. 2010. Untangling the multiple monooxygenases of Mycobacterium chubuense strain NBB4, a versatile hydrocarbon degrader. Environmental Microbiology Reports, 3, 297-307.
CONRAD, M. E., BRODIE, E. L., RADTKE, C. W., BILL, M., DELWICHE, M. E., LEE, M. H., SWIFT, D. L. & COLWELL, F. S. 2010. Field evidence for co-metabolism of trichloroethene stimulated by addition of electron donor to groundwater. Environmental Science & Technology, 44, 4697-4704.
COOPER, G. S., MAKRIS, S. L., NIETERT, P. J. & JINOT, J. 2009. Evidence of autoimmune-related effects of trichloroethylene exposure from studies in mice and humans. Environmental Health Perspect, 117, 696-702.
COX, C. D., WOO, H.-J. & ROBINSON, K. 1998. Cometabolic biodegradation of trichloroethylene (TCE) in the gas phase. Water Science and Technology, 37, 97-104.
CREAMER, R. E., BRENNAN, F., FENTON, O., HEALY, M. G., LALOR, S. T., LANIGAN, G., REGAN, J. & GRIFFITHS, B. S. 2010. Implications of the proposed Soil Framework Directive on agricultural systems in Atlantic Europe–a review. Soil Use and Management, 26, 198-211.
CULLINGTON, J. E. & WALKER, A. 1999. Rapid biodegradation of diuron and other phenylurea herbicides by a soil bacterium. Soil Biology and Biochemistry, 31, 677-686.
CUPPLES, A. M. & SIMS, G. K. 2007. Identification of in situ 2,4-dichlorophenoxyacetic acid-degrading soil microorganisms using DNA-stable isotope probing. Soil Biology and Biochemistry, 39, 232-238.
CURTIS, T. P., SLOAN, W. T. & SCANNELL, J. W. 2002. Estimating prokaryotic diversity and its limits. Proceedings of the National Academy of Sciences, 99, 10494.
CYCOŃ, M., MARKOWICZ, A., BORYMSKI, S., WÓJCIK, M. & PIOTROWSKA-SEGET, Z. 2013. Imidacloprid induces changes in the structure, genetic diversity and catabolic activity of soil microbial communities. Journal of Environmental Management, 131, 55-65.
CYCOŃ, M. & PIOTROWSKA-SEGET, Z. 2009. Changes in bacterial diversity and community structure following pesticides addition to soil estimated by cultivation technique. Ecotoxicology, 18, 632-642.
CYCOŃ, M. & PIOTROWSKA-SEGET, Z. 2015a. Biochemical and microbial soil functioning after application of the insecticide imidacloprid. Journal of Environmental Sciences, 27, 147-158.
CYCOŃ, M. & PIOTROWSKA-SEGET, Z. 2015b. Community structure of ammonia-oxidizing archaea and ammonia-oxidizing bacteria in soil treated with the insecticide imidacloprid. BioMed Research International, 2015, 12 pages.
CYCOŃ, M., WÓJCIK, M. & PIOTROWSKA-SEGET, Z. 2009. Biodegradation of the organophosphorus insecticide diazinon by Serratia sp. and Pseudomonas sp. and their use in bioremediation of contaminated soil. Chemosphere, 76, 494-501.
244

CZEPIEL, P., CRILL, P. & HARRISS, R. 1995. Environmental factors influencing the variability of methane oxidation in temperate zone soils. Journal of Geophysical Research: Atmospheres 100, 9359-9364.
DAI, Y.-J., YUAN, S., GE, F., CHEN, T., XU, S.-C. & NI, J.-P. 2006. Microbial hydroxylation of imidacloprid for the synthesis of highly insecticidal olefin imidacloprid. Applied Microbiology and Biotechnology, 71, 927-934.
DAI, Y., LI, N., ZHAO, Q. & XIE, S. 2015. Bioremediation using Novosphingobium strain DY4 for 2,4-dichlorophenoxyacetic acid-contaminated soil and impact on microbial community structure. Biodegradation, 26, 161-170.
DALLA VALLE, M., JURADO, E., DACHS, J., SWEETMAN, A. J. & JONES, K. C. 2005. The maximum reservoir capacity of soils for persistent organic pollutants: implications for global cycling. Environmental Pollution, 134, 153-164.
DARINE, T., ALAEDDINE, C., FETHI, B. & RIDHA, M. 2015. Fluazifop-P-butyl (herbicide) affects richness and structure of soil bacterial communities. Soil Biology and Biochemistry, 81, 89-97.
DAS, A. C., CHAKRAVARTY, A., SEN, G., SUKUL, P. & MUKHERJEE, D. 2005. A comparative study on the dissipation and microbial metabolism of organophosphate and carbamate insecticides in orchaqualf and fluvaquent soils of West Bengal. Chemosphere, 58, 579-584.
DAVIES, O. A., ALLISON, M. E. & UYI, H. S. 2006. Bioaccumulation of heavy metals in water, sediment and periwinkle (Tympanotonus fuscatus var radula) from the Elechi Creek, Niger Delta. Africal Journal of Biotechnology, 5, 968-973.
DE, A., BOSE, R., KUMAR, A. & MOZUMDAR, S. 2014. Targeted Delivery of Pesticides Using Biodegradable Polymeric Nanoparticles, Springer, New York, NY, USA
DEDYSH, S. N., KNIEF, C. & DUNFIELD, P. F. 2005. Methylocella species are facultatively methanotrophic. Journal of Bacteriology, 187, 4665-4670.
DEDYSH, S. N., LIESACK, W., KHMELENINA, V. N., SUZINA, N. E., TROTSENKO, Y. A., SEMRAU, J. D., BARES, A. M., PANIKOV, N. S. & TIEDJE, J. M. 2000. Methylocella palustris gen. nov., sp. nov., a new methane-oxidizing acidophilic bacterium from peat bogs, representing a novel subtype of serine-pathway methanotrophs. International Journal of Systematic and Evolutionary Microbiology, 50, 955-969.
DEES, P. M. & GHIORSE, W. C. 2001. Microbial diversity in hot synthetic compost as revealed by PCR‐amplified rRNA sequences from cultivated isolates and extracted DNA. FEMS Microbiology Ecology, 35, 207-216.
DEFRANK, J. J. & WHITE, W. E. 2002. Phosphofluoridates: biological activity and biodegradation. Organofluorines. Springer.
DEMANECHE, S., SANGUIN, H., POTÉ, J., NAVARRO, E., BERNILLON, D., MAVINGUI, P., WILDI, W., VOGEL, T. M. & SIMONET, P. 2008. Antibiotic-
245

resistant soil bacteria in transgenic plant fields. Proceedings of the National Academy of Sciences, 105, 3957-3962.
DEMSIA, G., VLASTOS, D., GOUMENOU, M. & MATTHOPOULOS, D. P. 2007. Assessment of the genotoxicity of imidacloprid and metalaxyl in cultured human lymphocytes and rat bone-marrow. Mutation Research/Genetic Toxicology and Environmental Mutagenesis, 634, 32-39.
DEVERS, M., HENRY, S., HARTMANN, A. & MARTIN‐LAURENT, F. 2005. Horizontal gene transfer of atrazine‐degrading genes (atz) from Agrobacterium tumefaciens St96‐4 pADP1:Tn5 to bacteria of maize‐cultivated soil. Pest Management Science, 61, 870-880.
DINSDALE, E. A., EDWARDS, R. A., HALL, D., ANGLY, F., BREITBART, M., BRULC, J. M., FURLAN, M., DESNUES, C., HAYNES, M. & LI, L. 2008. Functional metagenomic profiling of nine biomes. Nature, 452, 629-632.
DOGRA, C., RAINA, V., PAL, R., SUAR, M., LAL, S., GARTEMANN, K.-H., HOLLIGER, C., VAN DER MEER, J. R. & LAL, R. 2004. Organization of lin genes and IS6100 among different strains of hexachlorocyclohexane-degrading Sphingomonas paucimobilis: evidence for horizontal gene transfer. Journal of Bacteriology, 186, 2225-2235.
DOUCETTE, W. J., CHARD, J. K., FABRIZIUS, H., CROUCH, C., PETERSEN, M. R., CARLSEN, T. E., CHARD, B. K. & GORDER, K. 2007a. Trichloroethylene uptake into fruits and vegetables: Three-year field monitoring study. Environmental science & technology, 41, 2505-2509.
DOUCETTE, W. J., CHARD, J. K., FABRIZIUS, H., CROUCH, C., PETERSEN, M. R., CARLSEN, T. E., CHARD, B. K. & GORDER, K. 2007b. Trichloroethylene uptake into fruits and vegetables: Three-year field monitoring study. Environmental Science and Technology, 2505-2509.
DUMONT, M. G. & MURRELL, J. C. 2005. Stable isotope probing—linking microbial identity to function. Nature Reviews Microbiology, 3, 499-504.
DUMONT, M. G., POMMERENKE, B., CASPER, P. & CONRAD, R. 2011. DNA-, rRNA- and mRNA-based stable isotope probing of aerobic methanotrophs in lake sediment. Environmental Microbiology, 13, 1153-1167.
DUNBAR, J., TICKNOR, L. O. & KUSKE, C. R. 2000. Assessment of microbial diversity in four southwestern United States soils by 16S rRNA gene terminal restriction fragment analysis. Applied and Environmental Microbiology, 66, 2943-2950.
DUNFIELD, P. F., KHMELENINA, V. N., SUZINA, N. E., TROTSENKO, Y. A. & DEDYSH, S. N. 2003. Methylocella silvestris sp. nov., a novel methanotroph isolated from an acidic forest cambisol. International Journal of Systematic and Evolutionary Microbiology, 53, 1231-1239.
DUNFIELD, P. F., YURYEV, A., SENIN, P., SMIRNOVA, A. V., STOTT, M. B., HOU, S., LY, B., SAW, J. H., ZHOU, Z. & REN, Y. 2007. Methane oxidation by an
246

extremely acidophilic bacterium of the phylum Verrucomicrobia. Nature, 450, 879-882.
DUTTA, M., SARDAR, D., PAL, R. & KOLE, R. K. 2010. Effect of chlorpyrifos on microbial biomass and activities in tropical clay loam soil. Environmental Monitoring and Assessment, 160, 385-391.
ECOBICHON, D. J. 2001. Pesticide use in developing countries. Toxicology, 160, 27-33.
EDBERG, F., KALINOWSKI, B. E., HOLMSTRÖM, S. J. & HOLM, K. 2010. Mobilization of metals from uranium mine waste: the role of pyoverdines produced by Pseudomonas fluorescens. Geobiology, 8, 278-292.
EDGELL, D. R., GIBB, E. A. & BELFORT, M. 2010. Mobile DNA elements in T4 and related phages. Virology Journal, 7, 1-15.
EFREMENKO, E., PEREGUDOV, A., KILDEEVA, N., PERMINOV, P. & VARFOLOMEYEV, S. 2005. New enzymatic immobilized biocatalysts for detoxification of organophosphorus compounds. Biocatalysis and Biotransformation, 23, 103-108.
EGUCHI, M., KITAGAWA, M., SUZUKI, Y., NAKAMUARA, M., KAWAI, T., OKAMURA, K., SASAKI, S. & MIYAKE, Y. 2001. A field evaluation of in situ biodegradation of trichloroethylene through methane injection. Water Research, 35, 2145-2152.
EISSA, F. I., MAHMOUD, H. A., MASSOUD, O. N., GHANEM, K. M. & GOMAA, I. M. 2014. Biodegradation of chlorpyrifos by microbial strains isolated from agricultural wastewater. Journal of American Science, 10, 98-108.
EL-HELOW, E. R., BADAWY, M. E., MABROUK, M. E., MOHAMED, E. A. & EL-BESHLAWY, Y. M. 2013. Biodegradation of chlorpyrifos by a newly isolated Bacillus subtilis strain, Y242. Bioremediation Journal, 17, 113-123.
ELY, R. L., HYMAN, M. R., ARP, D. J., GUENTHER, R. B. & WILLIAMSON, K. J. 1995. A cometabolic kinetics model incoroporating enzyme inhibition, inactivation, and recovery: II. Trichloroethylene degradation experiments. Biotechnology and Bioengineering, 46, 232-245.
ENSIGN, S., HYMAN, M. & ARP, D. 1992. Cometabolic degradation of chlorinated alkenes by alkene monooxygenase in a propylene-grown Xanthobacter strain. Applied and Environmental Microbiology, 58, 3038-3046.
ENSLEY, B. D. 1991. Biochemical diversity of trichloroethylene metabolism. Annual Reviews in Microbiology, 45, 283-299.
ERWIN, D. P., ERICKSON, I. K., DELWICHE, M. E., COLWELL, F. S., STRAP, J. L. & CRAWFORD, R. L. 2005. Diversity of oxygenase genes from methane-and ammonia-oxidizing bacteria in the Eastern Snake River Plain aquifer. Applied and Environmental Microbiology, 71, 2016-2025.
FALGUNI, R. P. & SHARMA, M. C. 2014. Novel organophosphate pesticide utilizing alkaline phosphatase producing polyextremophile Bacillus flexus from lake
247

ecosystem of North Gujarat, India. International Journal of Innovative Research in Science, Engineering and Technology, 3, 16695-16702.
FANG, H., CAI, L., YANG, Y., JU, F., LI, X., YU, Y. & ZHANG, T. 2014. Metagenomic analysis reveals potential biodegradation pathways of persistent pesticides in freshwater and marine sediments. Science of the Total Environment, 470, 983-992.
FANG, H., YU, Y.-L., WANG, X., SHAN, M., WU, X.-M. & YU, J.-Q. 2006. Dissipation of chlorpyrifos in pakchoi-vegetated soil in a greenhouse. Journal of Environmental Sciences, 18, 760-764.
FANG, H., YU, Y., CHU, X., WANG, X., YANG, X. & YU, J. 2009. Degradation of chlorpyrifos in laboratory soil and its impact on soil microbial functional diversity. Journal of Environmental Sciences, 21, 380-386.
FANG, H., YU, Y., WANG, X., CHU, X., PAN, X. & YANG, X. 2008. Effects of repeated applications of chlorpyrifos on its persistence and soil microbial functional diversity and development of its degradation capability. Bulletin of Environmental Contamination and Toxicology, 81, 397-400.
FARHAN, M., KHAN, A., WAHID, A., AHMAD, M. & AHMAD, F. 2012. Biodegradation of chlorpyrifos using indigenous Pseudomonas sp. isolated from industrial drain. Pakistan Journal of Nutrition, 11, 1183-89.
FAVARI, L., LÓPEZ, E., MARTı́NEZ-TABCHE, L. & DıAZ-PARDO, E. 2002. Effect of insecticides on plankton and fish of Ignacio Ramirez reservoir (Mexico): a biochemical and biomagnification study. Ecotoxicology and Environmental Safety, 51, 177-186.
FELD, L., HJELMSØ, M. H., NIELSEN, M. S., JACOBSEN, A. D., RØNN, R., EKELUND, F., KROGH, P. H., STROBEL, B. W. & JACOBSEN, C. S. 2015. Pesticide side effects in an agricultural soil ecosystem as measured by amoA expression quantification and bacterial diversity changes. PLoS ONE, 10, e0126080.
FELSOT, A., MADDOX, J. V. & BRUCE, W. 1981. Enhanced microbial degradation of carbofuran in soils with histories of Furadan® use. Bulletin of Environmental Contamination and Toxicology, 26, 781-788.
FELSOT, A. S. & SHELTON, D. R. 1993. Enhanced biodegradation of soil pesticides: interactions between physicochemical processes and microbial ecology. Sorption and Degradation 227-251.
FENG, Y., MINARD, R. D. & BOLLAG, J. M. 1998. Photolytic and microbial degradation of 3, 5, 6‐trichloro‐2‐pyridinol. Environmental Toxicology and Chemistry, 17, 814-819.
FENG, Y., RACKE, K. D. & BOLLAG, J. 1997. Isolation and characterization of a chlorinated-pyridinol-degrading bacterium. Applied and Environmental Microbiology, 63, 4096-4098.
FERGUSON, J. & PIETARI, J. 2000. Anaerobic transformations and bioremediation of chlorinated solvents. Environmental Pollution, 107, 209-215.
248

FERNÁNDEZ-LUQUEÑO, F., VALENZUELA-ENCINAS, C., MARSCH, R., MARTÍNEZ-SUÁREZ, C., VÁZQUEZ-NÚÑEZ, E. & DENDOOVEN, L. 2011. Microbial communities to mitigate contamination of PAHs in soil—possibilities and challenges: a review. Environmental Science and Pollution Research, 18, 12-30.
FETZNER, S. 2010. Aerobic degradation of halogenated aliphatics. Handbook of Hydrocarbon and Lipid Microbiology. Springer, Berlin, 865-885.
FIELD, J. & SIERRA-ALVAREZ, R. 2004. Biodegradability of chlorinated solvents and related chlorinated aliphatic compounds. Reviews in Environmental Science and Bio/Technology, 3, 185-254.
FIERER, N., JACKSON, J. A., VILGALYS, R. & JACKSON, R. B. 2005. Assessment of soil microbial community structure by use of taxon-specific quantitative PCR assays. Applied and Environmental Microbiology, 71, 4117-4120.
FIERER, N., LEFF, J. W., ADAMS, B. J., NIELSEN, U. N., BATES, S. T., LAUBER, C. L., OWENS, S., GILBERT, J. A., WALL, D. H. & CAPORASO, J. G. 2012. Cross-biome metagenomic analyses of soil microbial communities and their functional attributes. Proceedings of the National Academy of Sciences, 109, 21390-21395.
FIERER, N., STRICKLAND, M. S., LIPTZIN, D., BRADFORD, M. A. & CLEVELAND, C. C. 2009. Global patterns in belowground communities. Ecology Letters, 12, 1238-1249.
FINLEY, S. D., BROADBELT, L. J. & HATZIMANIKATIS, V. 2010. In silico feasibility of novel biodegradation pathways for 1, 2, 4-trichlorobenzene. BMC Systems Biology, 4, 7.
FLOCH, C., CHEVREMONT, A.-C., JOANICO, K., CAPOWIEZ, Y. & CRIQUET, S. 2011. Indicators of pesticide contamination: soil enzyme compared to functional diversity of bacterial communities via Biolog® Ecoplates. European Journal of Soil Biology, 47, 256-263.
FORD, K. A. & CASIDA, J. E. 2006. Unique and common metabolites of thiamethoxam, clothianidin, and dinotefuran in mice. Chemical Research in Toxicology, 19, 1549-1556.
FORD, T. E. 2000. Response of marine microbial communities to anthropogenic stress. Journal of Aquatic Ecosystem Stress and Recovery, 7, 75-89.
FOWLER, S. J., GUTIERREZ-ZAMORA, M.-L., MANEFIELD, M. & GIEG, L. M. 2014. Identification of toluene degraders in a methanogenic enrichment culture. FEMS Microbiology Ecology, 89, 625-636.
FOX, B., BORNEMAN, J., WACKETT, L. & LIPSCOMB, J. 1990. Haloalkene oxidation by the soluble methane monooxygenase from Methylosinus trichosporium OB3b: mechanistic and environmental applications. . Biochemistry, 29, 6419-6427.
FRASCARI, D., PINELLI, D., NOCENTINI, M., BALEANI, E., CAPPELLETTI, M. & FEDI, S. 2008. A kinetic study of chlorinated solvent cometabolic biodegradation by propane-grown Rhodococcus sp. PB1. Biochemical Engineering Journal, 42, 139-147.
249

FRIEDRICH, M. W. 2006. Stable-isotope probing of DNA: insights into the function of uncultivated microorganisms from isotopically labeled metagenomes. Current Opinion in Biotechnology, 17, 59-66.
FURLONG, C. E., HOLLAND, N., RICHTER, R. J., BRADMAN, A., HO, A. & ESKENAZI, B. 2006. PON1 status of farmworker mothers and children as a predictor of organophosphate sensitivity. Pharmacogenetics and Genomics, 16, 183-190.
FURUKAWA, K. 2003. ‘Super bugs’ for bioremediation. Trends in Biotechnology, 21, 187-190.
FURUKAWA, K., SUYAMA, A., TSUBOI, Y., FUTAGAMI, T. & GOTO, M. 2005. Biochemical and molecular characterization of a tetrachloroethene dechlorinating Desulfitobacterium sp. strain Y51: a review. Journal of Industrial Microbiology and Biotechnology, 32, 534-541.
FUTAMATA, H., HARAYAMA, S., HIRAISHI, A. & WATANABE, K. 2003. Functional and structural analyses of trichloroethylene-degrading bacterial communities under different phenol-feeding conditions: laboratory experiments. Applied Microbiology and Biotechnology, 60, 594-600.
FUTAMATA, H., HARAYAMA, S. & WATANABE, K. 2001. Diversity in kinetics of trichloroethylene-degrading activities exhibited by phenol-degrading bacteria. Applied Microbiology and Biotechnology, 55, 248-253.
FUTAMATA, H., NAGANO, Y., WATANABE, K. & HIRAISHI, A. 2005. Unique kinetic properties of phenol-degrading Variovorax strains responsible for efficient trichloroethylene degradation in a chemostat enrichment culture. Applied and Environmental Microbiology, 71, 904-911.
GASSNER, G. T. & LIPPARD, S. J. 1999. Component interactions in the soluble methane monooxygenase system from Methylococcus capsulatus (Bath). Biochemistry, 38, 12768-12785.
GETENGA, Z., JONDIKO, J., WANDIGA, S. & BECK, E. 2000. Dissipation behavior of malathion and dimethoate residues from the soil and their uptake by garden pea (Pisum sativum). Bulletin of Environmental Contamination and Toxicology, 64, 359-367.
GHANEM, I., ORFI, M. & SHAMMA, M. 2007. Biodegradation of chlorphyrifos by Klebsiella sp. isolated from an activated sludge sample of waste water treatment plant in damascus. Folia Microbiologica, 52, 423-427.
GIANFREDA, L. & RAO, M. A. 2008. Interactions between xenobiotics and microbial and enzymatic soil activity. Critical Reviews in Environmental Science and Technology, 38, 269-310.
GIANOULIS, T. A., RAES, J., PATEL, P. V., BJORNSON, R., KORBEL, J. O., LETUNIC, I., YAMADA, T., PACCANARO, A., JENSEN, L. J. & SNYDER, M. 2009. Quantifying environmental adaptation of metabolic pathways in metagenomics. Proceedings of the National Academy of Sciences, 106, 1374-1379.
250

GILL, R. J., RAMOS-RODRIGUEZ, O. & RAINE, N. E. 2012. Combined pesticide exposure severely affects individual-and colony-level traits in bees. Nature, 491, 105-108.
GILLER, K. E., WITTER, E. & MCGRATH, S. P. 1998. Toxicity of heavy metals to microorganisms and microbial processes in agricultural soils: a review. Soil Biology and Biochemistry, 30, 1389-1414.
GINOLHAC, A., JARRIN, C., GILLET, B., ROBE, P., PUJIC, P., TUPHILE, K., BERTRAND, H., VOGEL, T. M., PERRIERE, G. & SIMONET, P. 2004. Phylogenetic analysis of polyketide synthase I domains from soil metagenomic libraries allows selection of promising clones. Applied and Environmental Microbiology, 70, 5522-5527.
GOPAL, S., RASTOGI, V., ASHMAN, W. & MULBRY, W. 2000. Mutagenesis of organophosphorus hydrolase to enhance hydrolysis of the nerve agent VX. Biochemical and Biophysical Research Communications, 279, 516-519.
GORDILLO, F., CHÁVEZ, F. P. & JEREZ, C. A. 2007. Motility and chemotaxis of Pseudomonas sp. B4 towards polychlorobiphenyls and chlorobenzoates. FEMS Microbiology Ecology, 60, 322-328.
GOULSON, D. 2013. Review: An overview of the environmental risks posed by neonicotinoid insecticides. Journal of Applied Ecology, 50, 977-987.
GREENLEE, A. R., ARBUCKLE, T. E. & CHYOU, P.-H. 2003. Risk factors for female infertility in an agricultural region. Epidemiology, 14, 429-436.
GRENNI, P. 2011. Effects of pesticides and pharmaceuticals on soil and water bacterial communities. PhD thesis in Environmental Science. University of Milano-Bicocca, Italy.
GRIBBLE, G. W. 2003. The diversity of naturally produced organohalogens. Chemosphere, 52, 289-297.
GRIFFIN, B. M., TIEDJE, J. M. & LÖFFLER, F. E. 2004. Anaerobic microbial reductive dechlorination of tetrachloroethene to predominately trans-1, 2-dichloroethene. Environmental science & technology, 38, 4300-4303.
GRIFFITHS, R. I., WHITELEY, A. S., O'DONNELL, A. G. & BAILEY, M. J. 2000. Rapid method for coextraction of DNA and RNA from natural environments for analysis of ribosomal DNA-and rRNA-based microbial community composition. Applied and Environmental Microbiology, 66, 5488-5491.
GROSSE, S., LARAMEE, L., WENDLANDT, K.-D., MCDONALD, I. R., MIGUEZ, C. B. & KLEBER, H.-P. 1999. Purification and characterization of the soluble methane monooxygenase of the Type II methanotrophic bacterium Methylocystis sp. strain WI 14. Applied and Environmental Microbiology, 65, 3929-3935.
GRZELAK, B., MICHAŁOWICZ, J. & DUKOWSKA, M. 2012. Bioaccumulation of Phenol, Guaiacol and Some Chlorophenols by Selected Freshwater Species of Leeches. Bulletin of Environmental Contamination and Toxicology, 88, 976-984.
251

GUERIN, W. F. & BOYD, S. A. 1992. Differential bioavailability of soil-sorbed naphthalene to two bacterial species. Applied and Environmental Microbiology, 58, 1142-1152.
GUERRERO, I., MORALES, M. B., OÑATE, J. J., GEIGER, F., BERENDSE, F., DE SNOO, G., EGGERS, S., PÄRT, T., BENGTSSON, J. & CLEMENT, L. W. 2012. Response of ground-nesting farmland birds to agricultural intensification across Europe: landscape and field level management factors. Biological Conservation, 152, 74-80.
GUNDI, V. A., NARASIMHA, G. & REDDY, B. 2005. Interaction effects of insecticides on microbial populations and dehydrogenase activity in a black clay soil. Journal of Environmental Science and Health, 40, 69-283.
GUO, G.-L., TSENG, D.-H. & HUANG, S.-L. 2001. Co-metabolic degradation of trichloroethylene by Pseudomonas putida in a fibrous bed bioreactor. Biotechnology Letters, 23, 1653-1657.
GUO, X., CHEN, K., WEN, Y., LI, R., LI, S. & JIANG, J. 2009. Comparison of in-situ biodegrading abilities of Pseudomonas putida mutants: leuB− auxotroph, fliC− non-motility, and cheA− non-chemotaxis. International Biodeterioration & Biodegradation, 63, 576-581.
HAEST, P. J., SPRINGAEL, D. & SMOLDERS, E. 2010. Dechlorination kinetics of TCE at toxic TCE concentrations: Assessment of different models. Water Research, 44, 331-339.
HAKEMIAN, A. S. & ROSENZWEIG, A. C. 2007. The biochemistry of methane oxidation. Annual Review of Biochemistry, 76, 223-241.
HALSEY, K. H., DOUGHTY, D. M., SAYAVEDRA-SOTO, L. A., BOTTOMLEY, P. J. & ARP, D. J. 2007. Evidence for modified mechanisms of chloroethene oxidation in Pseudomonas butanovora mutants containing single amino acid substitutions in the hydroxylase α-subunit of butane monooxygenase. Journal of Bacteriology, 189, 5068-5074.
HALSEY, K. H., SAYAVEDRA-SOTO, L. A., BOTTOMLEY, P. J. & ARP, D. J. 2005. Trichloroethylene degradation by butane-oxidizing bacteria causes a spectrum of toxic effects. Applied Microbiology and Biotechnology, 68, 794-801.
HANSON, R. S. & HANSON, T. E. 1996. Methanotrophic Bacteria. Microbiological Reviews, 60, 439-471.
HATZINGER, P. B. & ALEXANDER, M. 1995. Effect of aging of chemicals in soil on their biodegradability and extractability. Environmental Science & Technology, 29, 537-545.
HAYDEN, K. M., NORTON, M. C., DARCEY, D., ØSTBYE, T., ZANDI, P. P., BREITNER, J. & WELSH-BOHMER, K. 2010. Occupational exposure to pesticides increases the risk of incident AD The Cache County Study. Neurology, 74, 1524-1530.
HAZEN, T. C., CHAKRABORTY, R., FLEMING, J. M., GREGORY, I. R., BOWMAN, J. P., JIMENEZ, L., ZHANG, D., PFIFFNER, S. M., BROCKMAN, F.
252

J. & SAYLER, G. S. 2009. Use of gene probes to assess the impact and effectiveness of aerobic in situ bioremediation of TCE. Archives of Microbiology, 191, 221-232.
HE, J., HOLMES, V. F., LEE, P. K. & ALVAREZ-COHEN, L. 2007. Influence of vitamin B12 and cocultures on the growth of Dehalococcoides isolates in defined medium. Applied and Environmental Microbiology, 73, 2847-2853.
HE, R., WOOLLER, M. J., POHLMAN, J. W., QUENSEN, J., TIEDJE, J. M. & LEIGH, M. B. 2012. Shifts in identity and activity of methanotrophs in Arctic lake sediments in response to temperature changes. Applied and Environmental Microbiology, 78, 4715-4723.
HEALD, S. & JENKINS, R. 1994. Trichloroethylene removal and oxidation toxicity mediated by toluene dioxygenase of Pseudomonas putida. Applied and Environmental Microbiology, 60, 4634-4637.
HEMME, C. L., DENG, Y., GENTRY, T. J., FIELDS, M. W., WU, L., BARUA, S., BARRY, K., TRINGE, S. G., WATSON, D. B. & HE, Z. 2010. Metagenomic insights into evolution of a heavy metal-contaminated groundwater microbial community. The ISME Journal, 4, 660-672.
HESSELSOE, M., BOYSEN, S., IVERSEN, N., JØRGENSEN, L., MURRELL, J. C., MCDONALD, I., RADAJEWSKI, S., THESTRUP, H. & ROSLEV, P. 2005. Degradation of organic pollutants by methane grown microbial consortia. Biodegradation, 16, 435-448.
HEWSON, I., PAERL, R. W., TRIPP, H. J., ZEHR, J. P. & KARL, D. M. 2009. Metagenomic potential of microbial assemblages in the surface waters of the central Pacific Ocean tracks variability in oceanic habitat. Limnology and Oceanography, 54, 1981-1994.
HIROTA, R., KURODA, A., KATO, J. & OHTAKE, H. 2010. Bacterial phosphate metabolism and its application to phosphorus recovery and industrial bioprocesses. Journal of Bioscience and Bioengineering, 109, 423-432.
HOLLIGER, C., REGEARD, C. & DIEKERT, G. 2003. Dehalogenation by anaerobic bacteria. In: Haggblom MH & Bossert ID (Ed) Dehalogenation: Microbial processes and environmental applications. Kluwer Academic Press, Boston.
HOLLIGER, C., WOHLFARTH, G. & DIEKERT, G. 1998. Reductive dechlorination in the energy metabolism of anaerobic bacteria. FEMS Microbiology Reviews, 22, 383-398.
HONG, S.-H., BUNGE, J., JEON, S.-O. & EPSTEIN, S. S. 2006. Predicting microbial species richness. Proceedings of the National Academy of Sciences of the United States of America, 103, 117-122.
HOPPIN, J. A., UMBACH, D. M., LONDON, S. J., HENNEBERGER, P. K., KULLMAN, G. J., COBLE, J., ALAVANJA, M. C., FREEMAN, L. B. & SANDLER, D. P. 2009. Pesticide use and adult-onset asthma among male farmers in the Agricultural Health Study. European Respiratory Journal, 34, 1296-1303.
HORNE, I., SUTHERLAND, T. D., HARCOURT, R. L., RUSSELL, R. J. & OAKESHOTT, J. G. 2002. Identification of an opd (organophosphate degradation)
253

gene in an Agrobacterium isolate. Applied and environmental microbiology, 68, 3371-3376.
HORNG, L. & KAUFMAN, D. Accelerated biodegradation of several organophosphate insecticides. 1987. American Chemical Society, 44 pages.
HOWARD, P. H. 1991. Handbook of Environmental Fate and Exposure Data: For Organic Chemicals, Volume III Pesticides, CRC press.
HUBERT, C., SHEN, Y. & VOORDOUW, G. 2005. Changes in soil microbial community composition induced by cometabolism of toluene and trichloroethylene. Biodegradation, 16, 11-22.
HUMPHRIES, J., ASHE, A. M., SMILEY, J. & JOHNSTON, C. 2005. Microbial community structure and trichloroethylene degradation in groundwater. Canadian Journal of Microbiology, 51, 433-439.
HUSSAIN, S., DEVERS-LAMRANI, M., EL AZHARI, N. & MARTIN-LAURENT, F. 2011. Isolation and characterization of an isoproturon mineralizing Sphingomonas sp. strain SH from a French agricultural soil. Biodegradation, 22, 637-650.
HUSSAIN, S., SIDDIQUE, T., SALEEM, M., ARSHAD, M. & KHALID, A. 2009. Impact of pesticides on soil microbial diversity, enzymes, and biochemical reactions. Advances in Agronomy, 102, 159-200.
HUTCHENS, E., RADAJEWSKI, S., DUMONT, M. G., MCDONALD, I. R. & MURRELL, J. C. 2004. Analysis of methanotrophic bacteria in Movile Cave by stable isotope probing. Environmental Microbiology, 6, 111-120.
IM, J. & SEMRAU, J. D. 2011. Pollutant degradation by a Methylocystis strain SB2 grown on ethanol: bioremediation via facultative methanotrophy. FEMS Microbiology Letters, 318, 137-142.
IMFELD, G. & VUILLEUMIER, S. 2012. Measuring the effects of pesticides on bacterial communities in soil: a critical review. European Journal of Soil Biology, 49, 22-30.
IMMIG, J. 2010. A list of Australia's most dangerous pesticides. http://awsassets.wwf.org.au/. Accessed on 12 March 2015.
IMO, T., TAMAKI, F., SHEIKH, M., MIYAGI, T. & OOMORI, T. 2013. Spatial and monthly behaviour of selective organochlorine pesticides in subtropical estuarine ecosystems, INTECH Open Access Publisher.
INGRAM, C., COYNE, M. S. & WILLIAMS, D. W. 2005. Effects of commercial diazinon and imidacloprid on microbial urease activity in soil and sod. Journal of Environmental Quality, 34, 1573-1580.
ISLAM, T., JENSEN, S., REIGSTAD, L. J., LARSEN, Ø. & BIRKELAND, N.-K. 2008. Methane oxidation at 55 C and pH 2 by a thermoacidophilic bacterium belonging to the Verrucomicrobia phylum. Proceedings of the National Academy of Sciences, 105, 300-304.
254

JABEEN, H., IQBAL, S. & ANWAR, S. 2014. Biodegradation of chlorpyrifos and 3, 5, 6‐trichloro‐2‐pyridinol by a novel rhizobial strain Mesorhizobium sp. HN3. Water and Environment Journal.
JANTUNEN, A., TUIKKA, A., AKKANEN, J. & KUKKONEN, J. 2008. Bioaccumulation of atrazine and chlorpyrifos to Lumbriculus variegatus from lake sediments. Ecotoxicology and Environmental Safety, 71, 860-868.
JIANG, H., CHEN, Y., JIANG, P., ZHANG, C., SMITH, T. J., MURRELL, J. C. & XING, X.-H. 2010. Methanotrophs: Multifunctional bacteria with promising applications in environmental bioengineering. Biochemical Engineering Journal, 49, 277-288.
JJEMBA, P. K. 2002. The effect of chloroquine, quinacrine, and metronidazole on both soybean plants and soil microbiota. Chemosphere, 46, 1019-1025.
JOHNSEN, K., JACOBSEN, C. S., TORSVIK, V. & SØRENSEN, J. 2001. Pesticide effects on bacterial diversity in agricultural soils–a review. Biology and Fertility of Soils, 33, 443-453.
JUWARKAR, A., SINGH, S. & MUDHOO, A. 2010. A comprehensive overview of elements in bioremediation. Reviews in Environmental Science and Biotechnology, 9, 215-288.
KALE, S., CARVALHO, F., RAGHU, K., SHERKHANE, P., PANDIT, G., MOHAN RAO, A., MUKHERJEE, P. & MURTHY, N. 1999. Studies on degradation of 14C-chlorpyrifos in the marine environment. Chemosphere, 39, 969-976.
KANE, S. R., CHAKICHERLA, A. Y., CHAIN, P. S., SCHMIDT, R., SHIN, M. W., LEGLER, T. C., SCOW, K. M., LARIMER, F. W., LUCAS, S. M. & RICHARDSON, P. M. 2007. Whole-genome analysis of the methyl tert-butyl ether-degrading beta-proteobacterium Methylibium petroleiphilum PM1. Journal of Bacteriology, 189, 1931-1945.
KANEKAR, P. P., BHADBHADE, B. J., DESHPANDE, N. M. & SARNAIK, S. S. 2004. Biodegradation of organophosphorus pesticides. Proceedings-Indian National Science Academy Part B, 70, 57-70.
KANG, J., LEE, E. Y. & PARK, S. 2001. Co-metabolic biodegradation of trichloroethylene by Methylosinus trichosporium is stimulated by low concentrations methane or methanol. Biotechnology Letters, 23, 1877-1882.
KAPLAN, C. W. & KITTS, C. L. 2003. Variation between observed and true terminal restriction fragment length is dependent on true TRF length and purine content. Journal of Microbiological Methods, 54, 121-125.
KARPOUZAS, D., MORGAN, J. & WALKER, A. 2000a. Isolation and characterization of 23 carbofuran‐degrading bacteria from soils from distant geographical areas. Letters in Applied Microbiology, 31, 353-358.
KARPOUZAS, D. & WALKER, A. 2000. Factors influencing the ability of Pseudomonas putida strains epI and II to degrade the organophosphate ethoprophos. Journal of Applied Microbiology, 89, 40-48.
255

KARPOUZAS, D. G., KARANASIOS, E. & MENKISSOGLU-SPIROUDI, U. 2004. Enhanced microbial degradation of cadusafos in soils from potato monoculture: demonstration and characterization. Chemosphere, 56, 549-559.
KARPOUZAS, D. G., MORGAN, J. A. W. & WALKER, A. 2000b. Isolation and characterisation of ethoprophos‐degrading bacteria. FEMS Microbiology Ecology, 33, 209-218.
KARUNYA, S. K. & SARANRAJ, P. 2014. Toxic effects of pesticide pollution and its biological control by microorganisms: A review. Applied Journal of Hygiene, 3, 1-10.
KATAGI, T. 2002. Abiotic hydrolysis of pesticides in the aquatic environment. Reviews of Environmental Contamination and Toxicology, 175, 79-262.
KATO, J., KIM, H.-E., TAKIGUCHI, N., KURODA, A. & OHTAKE, H. 2008. Pseudomonas aeruginosa as a model microorganism for investigation of chemotactic behaviors in ecosystem. Journal of Bioscience and Bioengineering, 106, 1-7.
KAUFMANN, K., CHAPMAN, S. J., CAMPBELL, C. D., HARMS, H. & HÖHENER, P. 2006. Miniaturized test system for soil respiration induced by volatile pollutants. Environmental Pollution, 140, 269-278.
KENNEY, G. E. & ROSENZWEIG, A. C. 2011. Chemistry and biology of the copper chelator methanobactin. ACS Chemical Biology, 7, 260-268.
KERTESZ, M. & KAWASAKI, A. 2010. Hydrocarbon-degrading Sphingomonads: Sphingomonas, Sphingobium, Novosphingobium, and Sphingopyxis. Handbook of hydrocarbon and lipid microbiology. Springer, Berlin, 1693-1705.
KERTESZ, M. A., COOK, A. M. & LEISINGER, T. 1994. Microbial metabolism of sulfurand phosphorus-containing xenobiotics. FEMS Microbiology Reviews, 15, 195-215.
KEY, K. C., SUBLETTE, K. L., DUNCAN, K., MACKAY, D. M., SCOW, K. M. & OGLES, D. 2013. Using DNA‐stable isotope probing to identify MTBE‐and TBA‐degrading microorganisms in contaminated groundwater. Groundwater Monitoring & Remediation, 33, 57-68.
KIM, E.-S., NOMURA, I., HASEGAWA, Y. & TAKAMIZAWA, K. 2006. Characterization of a newly isolatedcis-1, 2-dichloroethylene and aliphatic compound-degrading bacterium, Clostridium sp. strain KYT-1. Biotechnology and Bioprocess Engineering, 11, 553-556.
KIM, J.-R. & AHN, Y.-J. 2009. Identification and characterization of chlorpyrifos-methyl and 3, 5, 6-trichloro-2-pyridinol degrading Burkholderia sp. strain KR100. Biodegradation, 20, 487-497.
KIM, Y., ARP, D. J. & SEMPRINI, L. 2000. Chlorinated solvent cometabolism by butane-grown mixed culture. Journal of Environmental Engineering, 126, 934-942.
KING, A. M. & AARON, C. K. 2015. Organophosphate and Carbamate Poisoning. Emergency Medicine Clinics of North America, 33, 133-151.
256

KNAPP, C. W., FOWLE, D. A., KULCZYCKI, E., ROBERTS, J. A. & GRAHAM, D. W. 2007. Methane monooxygenase gene expression mediated by methanobactin in the presence of mineral copper sources. Proceedings of the National Academy of Sciences, 104, 12040-12045.
KNIEF, C., KOLB, S., BODELIER, P. L., LIPSKI, A. & DUNFIELD, P. F. 2006. The active methanotrophic community in hydromorphic soils changes in response to changing methane concentration. Environmental Microbiology, 8, 321-333.
KOCAMEMI, B. A. & CECEN, F. 2010. Biological removal of the xenobiotic trichloroethylene (TCE) through cometabolism in nitrifying systems. Bioresource Technology, 101, 430-433.
KOH, S. C., BOWMAN, J. P. & SAYLER, G. S. 1993. Soluble methane monooxygenase production and trichloroethylene degradation by a type I methanotroph, Methylomonas methanica 68-1. Applied and Environmental Microbiology, 59, 960-967.
KONG, J.-Y., BAI, Y., SU, Y., YAO, Y. & HE, R. 2014. Effects of trichloroethylene on community structure and activity of methanotrophs in landfill cover soils. Soil Biology and Biochemistry, 78, 118-127.
KOSARIC, N. 2001. Biosurfactants and their application for soil bioremediation. Food Technology and Biotechnology, 39, 295-304.
KRUMHOLZ, L. R. 1997. Desulfuromonas chloroethenica sp. nov. uses tetrachloroethylene and trichloroethylene as electron acceptors. International Journal of Systematic Bacteriology, 47, 1262-1263.
KULKARNI, A., SOPPIMATH, K., DAVE, A., MEHTA, M. & AMINABHAVI, T. 2000. Solubility study of hazardous pesticide (chlorpyrifos) by gas chromatography. Journal of Hazardous Materials, 80, 9-13.
KUMAR, S. 2011. Bioremediation of chlorpyrifos by bacteria isolated from the cultivated soils. International Journal of Pharma and Bio Sciences, 2, 359-66.
KUMARESAN, D., WISCHER, D., STEPHENSON, J., HILLEBRAND-VOICULESCU, A. & MURRELL, J. C. 2014. Microbiology of Movile Cave—a chemolithoautotrophic ecosystem. Geomicrobiology Journal, 31, 186-193.
KWAK, Y., KIM, S.-J., RHEE, I.-K. & SHIN, J.-H. 2012. Application of quantitative real-time polymerase chain reaction on the assessment of organophosphorus compound degradation in in situ soil. Journal of the Korean Society for Applied Biological Chemistry, 55, 757-763.
LAKSHMI, C. V., KUMAR, M. & KHANNA, S. 2008. Biotransformation of chlorpyrifos and bioremediation of contaminated soil. International Biodeterioration & Biodegradation, 62, 204-209.
LAKSHMI, C. V., KUMAR, M. & KHANNA, S. 2009. Biodegradation of chlorpyrifos in soil by enriched cultures. Current Microbiology, 58, 35-38.
LANDA, A. S., SIPKEMA, E. M., WEIJMA, J., BEENACKERS, A., DOLFING, J. & JANSSEN, D. B. 1994. Cometabolic degradation of trichloroethylene by
257

Pseudomonas cepacia G4 in a chemostat with toluene as the primary substrate. Applied and Environmental Microbiology, 60, 3368-3374.
LANE, D. 1991. Nucleic acid techniques in bacterial systematics Wiley, United Kingdom, 115-175.
LARSON, S. J., CAPEL, P. D. & MAJEWSKI, M. 2010. Pesticides in surface waters: Distribution, trends, and governing factors, CRC Press.
LASH, L. H., PARKER, J. C. & SCOTT, C. S. 2000. Modes of action of trichloroethylene for kidney tumorigenesis. Environmental Health Perspectives, 108, 225.
LAW, A. M. & AITKEN, M. D. 2003. Bacterial chemotaxis to naphthalene desorbing from a nonaqueous liquid. Applied and Environmental Microbiology, 69, 5968-5973.
LE, N. B. & COLEMAN, N. V. 2011. Biodegradation of vinyl chloride, cis-dichloroethene and 1, 2-dichloroethane in the alkene/alkane-oxidising Mycobacterium strain NBB4. Biodegradation, 22, 1095-1108.
LEE, E. Y., YE, B. D. & PARK, S. 2003. Development and operation of a trickling biofilter system for continuous treatment of gas-phase trichloroethylene. Biotechnology Letters, 25, 1757-1761.
LEE, M. H., CLINGENPEEL, S. C., LEISER, O. P., WYMORE, R. A., SORENSON, K. S. & WATWOOD, M. E. 2008. Activity-dependent labeling of oxygenase enzymes in a trichloroethene-contaminated groundwater site. Environmental Pollution, 153, 238-246.
LEE, S.-K. & LIPSCOMB, J. D. 1999. Oxygen activation catalyzed by methane monooxygenase hydroxylase component: proton delivery during the O-O bond cleavage steps. Biochemistry, 38, 4423-4432.
LEE, S. W., KEENEY, D. R., LIM, D. H., DISPIRITO, A. A. & SEMRAU, J. D. 2006. Mixed pollutant degradation by Methylosinus trichosporium OB3b expressing either soluble or particulate methane monooxygenase: can the tortoise beat the hare? Applied and Environmental Microbiology, 72, 7503-9.
LERCH, T. Z., DIGNAC, M.-F., NUNAN, N., BARDOUX, G., BARRIUSO, E. & MARIOTTI, A. 2009. Dynamics of soil microbial populations involved in 2,4-D biodegradation revealed by FAME-based stable isotope probing. Soil Biology and Biochemistry, 41, 77-85.
LI, J., LIU, J., SHEN, W., ZHAO, X., HOU, Y., CAO, H. & CUI, Z. 2010. Isolation and characterization of 3, 5, 6-trichloro-2-pyridinol-degrading Ralstonia sp. strain T6. Bioresource Technology, 101, 7479-7483.
LI, X., HE, J. & LI, S. 2007. Isolation of a chlorpyrifos-degrading bacterium, Sphingomonas sp. strain Dsp-2, and cloning of the mpd gene. Research in Microbiology, 158, 143-149.
258

LI, X., JIANG, J., GU, L., ALI, S. W., HE, J. & LI, S. 2008. Diversity of chlorpyrifos-degrading bacteria isolated from chlorpyrifos-contaminated samples. International Biodeterioration & Biodegradation, 62, 331-335.
LI, Y., LI, B., WANG, C.-P., FAN, J.-Z. & SUN, H.-W. 2014. Aerobic Degradation of trichloroethylene by co-metabolism using phenol and gasoline as growth Substrates. International Journal of Molecular Sciences, 15, 9134-9148.
LIANG, Y., VAN NOSTRAND, J. D., DENG, Y., HE, Z., WU, L., ZHANG, X., LI, G. & ZHOU, J. 2011. Functional gene diversity of soil microbial communities from five oil-contaminated fields in China. The ISME Journal, 5, 403-413.
LIEBERMAN, R. L. & ROSENZWEIG, A. C. 2005. Crystal structure of a membrane-bound metalloenzyme that catalyses the biological oxidation of methane. Nature, 434, 177-182.
LIPSCOMB, J. D. 1994. Biochemistry of the soluble methane monooxygenase. Annual Reviews in Microbiology, 48, 371-399.
LITTLEFIELD-WYER, J., BROOKS, P. & KATOULI, M. 2008. Application of biochemical fingerprinting and fatty acid methyl ester profiling to assess the effect of the pesticide Atradex on aquatic microbial communities. Environmental Pollution, 153, 393-400.
LIU, C.-M., MCLEAN, P., SOOKDEO, C. & CANNON, F. 1991. Degradation of the herbicide glyphosate by members of the family Rhizobiaceae. Applied and Environmental Microbiology, 57, 1799-1804.
LIU, W.-T., MARSH, T. L., CHENG, H. & FORNEY, L. J. 1997. Characterization of microbial diversity by determining terminal restriction fragment length polymorphisms of genes encoding 16S rRNA. Applied and Environmental Microbiology, 63, 4516-4522.
LIU, Z., DAI, Y., HUANG, G., GU, Y., NI, J., WEI, H. & YUAN, S. 2011. Soil microbial degradation of neonicotinoid insecticides imidacloprid, acetamiprid, thiacloprid and imidaclothiz and its effect on the persistence of bioefficacy against horsebean aphid Aphis craccivora Koch after soil application. Pest Management Science, 67, 1245-1252.
LIU, Z. Y., CHEN, X., SHI, Y. & SU, Z. C. 2012. Bacterial degradation of chlorpyrifos by Bacillus cereus. Advanced Materials Research, 356, 676-680.
LO, C.-C. 2010. Effect of pesticides on soil microbial community. Journal of Environmental Science and Health Part B, 45, 348-359.
LONTOH, S. & SEMRAU, J. D. 1998. Methane and trichloroethylene degradation by Methylosinus trichosporium OB3b expressing particulate methane monooxygenase. Applied and Environmental Microbiology, 64, 1106-1114.
LORAH, M. M. & OLSEN, L. D. 1999. Degradation of 1, 1, 2, 2-tetrachloroethane in a freshwater tidal wetland: field and laboratory evidence. Environmental Science and Technology, 33, 227-234.
259

LU, P., LI, Q., LIU, H., FENG, Z., YAN, X., HONG, Q. & LI, S. 2013. Biodegradation of chlorpyrifos and 3, 5, 6-trichloro-2-pyridinol by Cupriavidus sp. DT-1. Bioresource Technology, 127, 337-342.
LU, Y., YU, Y., ZHOU, R., SUN, W., DAI, C., WAN, P., ZHANG, L., HAO, D. & REN, H. 2011. Cloning and characterisation of a novel 2, 4-dichlorophenol hydroxylase from a metagenomic library derived from polychlorinated biphenyl-contaminated soil. Biotechnology Letters, 33, 1159-1167.
LUIJTEN, M. L., DE WEERT, J., SMIDT, H., BOSCHKER, H. T., DE VOS, W. M., SCHRAA, G. & STAMS, A. J. 2003. Description of Sulfurospirillum halorespirans sp. nov., an anaerobic, tetrachloroethene-respiring bacterium, and transfer of Dehalospirillum multivorans to the genus Sulfurospirillum as Sulfurospirillum multivorans comb. nov. International Journal of Systematic and Evolutionary Microbiology, 53, 787-793.
LUKOW, T., DUNFIELD, P. F. & LIESACK, W. 2000. Use of the T-RFLP technique to assess spatial and temporal changes in the bacterial community structure within an agricultural soil planted with transgenic and non-transgenic potato plants. FEMS Microbiology Ecology, 32, 241-247.
LUO, C., XIE, S., SUN, W., LI, X. & CUPPLES, A. M. 2009a. Identification of a novel toluene-degrading bacterium from the candidate phylum TM7, as determined by DNA stable isotope probing. Applied and Environmental Microbiology, 75, 4644-4647.
LUO, H., BENNER, R., LONG, R. A. & HU, J. 2009b. Subcellular localization of marine bacterial alkaline phosphatases. Proceedings of the National Academy of Sciences, 106, 21219-21223.
LUPWAYI, N. Z., HARKER, K. N., DOSDALL, L. M., TURKINGTON, T. K., BLACKSHAW, R. E., O’DONOVAN, J. T., CÁRCAMO, H. A., OTANI, J. K. & CLAYTON, G. W. 2009. Changes in functional structure of soil bacterial communities due to fungicide and insecticide applications in canola. Agriculture, Ecosystems and Environment, 130, 109-114.
MAGNUSON, J. K., STERN, R. V., GOSSETT, J. M., ZINDER, S. H. & BURRIS, D. R. 1998. Reductive dechlorination of tetrachloroethene to ethene by a two-component enzyme pathway. Applied and Environmental Microbiology, 64, 1270-1275.
MAITI, P. P., DUBEY, S. & SAHA, P. 2011. Study of Various Poisoning: A Review. Indo Global Journal of Pharmaceutical Sciences, 1.
MALLICK, K., BHARATI, K., BANERJI, A., SHAKIL, N. & SETHUNATHAN, N. 1999. Bacterial degradation of chlorpyrifos in pure cultures and in soil. Bulletin of Environmental Contamination and Toxicology, 62, 48-54.
MARCHESI, J. R., SATO, T., WEIGHTMAN, A. J., MARTIN, T. A., FRY, J. C., HIOM, S. J. & WADE, W. G. 1998. Design and evaluation of useful bacterium-specific PCR primers that amplify genes coding for bacterial 16S rRNA. Applied and Environmental Microbiology, 64, 795-799.
260

MARGESIN, R., ZIMMERBAUER, A. & SCHINNER, F. 2000. Monitoring of bioremediation by soil biological activities. Chemosphere, 40, 339-346.
MARONPOT, R. R. 2009. Biological basis of differential susceptibility to hepatocarcinogenesis among mouse strains. Journal of Toxicologic Pathology, 22, 11.
MARS, A. E., PRINS, G. T., WIETZES, P., DE KONING, W. & JANSSEN, D. B. 1998. Effect of trichloroethylene on the competitive behavior of toluene-degrading bacteria. Applied and Environmental Microbiology, 64, 208-215.
MARTIN-LAURENT, F., PHILIPPOT, L., HALLET, S., CHAUSSOD, R., GERMON, J., SOULAS, G. & CATROUX, G. 2001. DNA extraction from soils: old bias for new microbial diversity analysis methods. Applied and environmental microbiology, 67, 2354-2359.
MARTINEAU, C., WHYTE, L. G. & GREER, C. W. 2010. Stable isotope probing analysis of the diversity and activity of methanotrophic bacteria in soils from the Canadian High Arctic. Applied and Environmental Microbiology, 76, 5773-5784.
MARTINEZ-TOLEDO, M., SALMERON, V. & GONZALEZ-LOPEZ, J. 1992. Effect of the insecticides methylpyrimifos and chlorpyrifos on soil microflora in an agricultural loam. Plant and Soil, 147, 25-30.
MASON, J. R. & CAMMACK, R. 1992. The electron-transport proteins of hydroxylating bacterial dioxygenases. Annual Reviews in Microbiology, 46, 277-305.
MATH, R., ASRAFUL ISLAM, S., CHO, K., HONG, S., KIM, J., YUN, M., CHO, J., HEO, J., LEE, Y., KIM, H. & YUN, H. 2010. Isolation of a novel gene encoding a 3,5,6-trichloro-2-pyridinol degrading enzyme from a cow rumen metagenomic library. Biodegradation, 21, 565-573.
MATSUDA, K., BUCKINGHAM, S. D., KLEIER, D., RAUH, J. J., GRAUSO, M. & SATTELLE, D. B. 2001. Neonicotinoids: insecticides acting on insect nicotinic acetylcholine receptors. Trends in Pharmacological Sciences, 22, 573-580.
MATSUDA, K., KANAOKA, S., AKAMATSU, M. & SATTELLE, D. B. 2009. Diverse actions and target-site selectivity of neonicotinoids: structural insights. Molecular Pharmacology, 76, 1-10.
MAYA, K., SINGH, R., UPADHYAY, S. & DUBEY, S. K. 2011. Kinetic analysis reveals bacterial efficacy for biodegradation of chlorpyrifos and its hydrolyzing metabolite TCP. Process Biochemistry, 46, 2130-2136.
MCCUE, T., HOXWORTH, S. & RANDALL, A. Degradation of halogenated aliphatic compounds utilizing sequential anaerobic/aerobic treatments. 3 rd World Water Congress: Industrial Wastewater Treatment, 2003. 79-84.
MCDONALD, I. R., MIGUEZ, C. B., ROGGE, G., BOURQUE, D., WENDLANDT, K. D., GROLEAU, D. & MURRELL, J. C. 2006. Diversity of soluble methane monooxygenase-containing methanotrophs isolated from polluted environments. FEMS Microbiology Letters, 255, 225-232.
261

MENON, P., GOPAL, M. & PARSAD, R. 2005. Effects of chlorpyrifos and quinalphos on dehydrogenase activities and reduction of Fe 3+ in the soils of two semi-arid fields of tropical India. Agriculture, Ecosystems and Environment, 108, 73-83.
MERINO, A. N., PÉREZ-BATALLÓN, P. & MACı́AS, F. 2004. Responses of soil organic matter and greenhouse gas fluxes to soil management and land use changes in a humid temperate region of southern Europe. Soil Biology and Biochemistry, 36, 917-925.
MESNAGE, R., CLAIR, E., DE VENDÔMOIS, J. S. & SERALINI, G.-E. 2010. Two cases of birth defects overlapping Stratton-Parker syndrome after multiple pesticide exposure. Occupational and Environmental Medicine, 67, 359-359.
MEYER, F., PAARMANN, D., D'SOUZA, M., OLSON, R., GLASS, E. M., KUBAL, M., PACZIAN, T., RODRIGUEZ, A., STEVENS, R. & WILKE, A. 2008. The metagenomics RAST server–a public resource for the automatic phylogenetic and functional analysis of metagenomes. BMC Bioinformatics, 9, 386.
MICHEREFF-FILHO, M., GUEDES, R., DELLA-LUCIA, T., MICHEREFF, M. & CRUZ, I. 2004. Non-target impact of chlorpyrifos on soil arthropods associated with no-tillage cornfields in Brazil. International Journal of Pest Management, 50, 91-99.
MIDDELDORP, P. J., LUIJTEN, M. L., PAS, B. A. V. D., EEKERT, M. H. V., KENGEN, S. W., SCHRAA, G. & STAMS, A. J. 1999. Anaerobic microbial reductive dehalogenation of chlorinated ethenes. Bioremediation Journal, 3, 151-169.
MIJANGOS, I., BECERRIL, J. M., ALBIZU, I., EPELDE, L. & GARBISU, C. 2009. Effects of glyphosate on rhizosphere soil microbial communities under two different plant compositions by cultivation-dependent and -independent methodologies. Soil Biology & Biochemistry, 41, 505-513.
MILLER, E., WOHLFARTH, G. & DIEKERT, G. 1996. Studies on tetrachloroethene respiration in Dehalospirillum multivorans. Archives of Microbiology, 166, 379-387.
MISHRA, V. & LAL, R. 2001. Enzymes and operons mediating xenobiotic degradation in bacteria. Critical Reviews in Microbiology, 27, 133-166.
MITCHELL, J. A. & CAIN, R. B. 1996. Rapid onset of the accelerated degradation of dicarboximide fungicides in a UK soil with a long history of agrochemical exclusion. Pesticide Science, 48, 1-11.
MIYAKE, Y., SAKODA, A., YAMANASHI, H., KANEDA, H. & SUZUKI, M. 2003. Activated carbon adsorption of trichloroethylene (TCE) vapor stripped from TCE-contaminated water. Water Research, 37, 1852-1858.
MOHAN, S. V., KISA, T., OHKUMA, T., KANALY, R. A. & SHIMIZU, Y. 2006. Bioremediation technologies for treatment of PAH-contaminated soil and strategies to enhance process efficiency. Reviews in Environmental Science and Bio/Technology, 5, 347-374.
262

MOHN, W. W. & TIEDJE, J. M. 1992. Microbial reductive dehalogenation. Microbiological Reviews, 56, 482-507.
MORAN, B. & HICKEY, W. 1997. Trichloroethylene biodegradation by mesophilic and psychrophilic ammonia oxidizers and methanotrophs in groundwater microcosms. Applied and Environmental Microbiology, 63, 3866-3871.
MOREL-CHEVILLET, C., PAREKH, N. R., PAUTREL, D. & FOURNIER, J.-C. 1996. Cross-enhancement of carbofuran biodegradation in soil samples previously treated with carbamate pesticides. Soil Biology and Biochemistry, 28, 1767-1776.
MORRISON, D. E., ROBERTSON, B. K. & ALEXANDER, M. 2000. Bioavailability to earthworms of aged DDT, DDE, DDD, and dieldrin in soil. Environmental Science & Technology, 34, 709-713.
MROZIK, A. & PIOTROWSKA-SEGET, Z. 2010. Bioaugmentation as a strategy for cleaning up of soils contaminated with aromatic compounds. Microbiological Research, 165, 363-375.
MU, D. Y. & SCOW, K. M. 1994. Effect of trichloroethylene (TCE) and toluene concentrations on TCE and toluene biodegradation and the population density of TCE and toluene degraders in soil. Applied and Environmental Microbiology, 60, 2661-2665.
MUHAMMAD, F., AKHTAR, M., RAHMAN, Z., FAROOQ, H., KHALIQ, T. & ANWAR, M. 2010. Multi-residue determination of pesticides in the meat of cattle in Faisalabad-Pakistan. Egyptian Academic Journal of Biological Sciences, 2, 19-28.
MUNNECKE, D. M. & HSIEH, D. P. 1974. Microbial decontamination of parathion and p-nitrophenol in aqueous media. Applied Microbiology, 28, 212-217.
MUÑOZ-LEOZ, B., RUIZ-ROMERA, E., ANTIGÜEDAD, I. & GARBISU, C. 2011. Tebuconazole application decreases soil microbial biomass and activity. Soil Biology and Biochemistry, 43, 2176-2183.
MURASE, J., HORDIJK, K., TAYASU, I. & BODELIER, P. L. 2011. Strain‐specific incorporation of methanotrophic biomass into eukaryotic grazers in a rice field soil revealed by PLFA‐SIP. FEMS Microbiology Ecology, 75, 284-290.
MURRELL, J. C., GILBERT, B. & MCDONALD, I. R. 2000a. Molecular biology and regulation of methane monooxygenase. Archives of Microbiology, 173, 325-332.
MURRELL, J. C., MCDONALD, I. R. & GILBERT, B. 2000b. Regulation of expression of methane monooxygenases by copper ions. Trends in Microbiology, 8, 221-225.
NAGATA, Y., NATSUI, S., ENDO, R., OHTSUBO, Y., ICHIKAWA, N., ANKAI, A., OGUCHI, A., FUKUI, S., FUJITA, N. & TSUDA, M. 2011. Genomic organization and genomic structural rearrangements of Sphingobium japonicum UT26, an archetypal γ-hexachlorocyclohexane-degrading bacterium. Enzyme and Microbial Technology, 49, 499-508.
263

NAIR, A., JUWARKAR, A. A. & SINGH, S. K. 2007. Production and characterization of siderophores and its application in arsenic removal from contaminated soil. Water, Air, and Soil Pollution, 180, 199-212.
NANNIPIERI, P., ASCHER, J., CECCHERINI, M., LANDI, L., PIETRAMELLARA, G. & RENELLA, G. 2003. Microbial diversity and soil functions. European Journal of Soil Science, 54, 655-670.
NAPHADE, S. R., DURVE, A. A., BHOT, M., VARGHESE, J. & CHANDRA, N. 2013. Role of chromosomal genes in bioremedial potential by soil bacteria. Pelagia Research Library: Advances in Applied Science Research, 4, 150-157.
NAZARIES, L., TATE, K. R., ROSS, D. J., SINGH, J., DANDO, J., SAGGAR, S., BAGGS, E. M., MILLARD, P., MURRELL, J. C. & SINGH, B. K. 2011. Response of methanotrophic communities to afforestation and reforestation in New Zealand. The ISME Journal, 5, 1832-1836.
NEUFELD, J. D., MOHN, W. W. & DE LORENZO, V. 2006. Composition of microbial communities in hexachlorocyclohexane (HCH) contaminated soils from Spain revealed with a habitat‐specific microarray. Environmental Microbiology, 8, 126-140.
NEUMANN, A., WOHLFARTH, G. & DIEKERT, G. 1995. Properties of tetrachloroethene and trichloroethene dehalogenase of Dehalospirillum multivorans. Archives of Microbiology, 163, 276-281.
NEWBY, D. T., REED, D. W., PETZKE, L., IGOE, A., DELWICHE, M. E., ROBERTO, F. F., MCKINLEY, J. P., WHITICAR, M. & COLWELL, F. 2004. Diversity of methanotroph communities in a basalt aquifer. FEMS Microbiology Ecology, 48, 333-344.
NIEDERLEHNER, B., CAIRNS, J. & SMITH, E. P. 1998. Modeling acute and chronic toxicity of nonpolar narcotic chemicals and mixtures to Ceriodaphnia dubia. Ecotoxicology and environmental safety, 39, 136-146.
NIELSEN, A. K., GERDES, K. & MURRELL, J. C. 1997. Copper‐dependent reciprocal transcriptional regulation of methane monooxygenase genes in Methylococcus capsulatus and Methylosinus trichosporium. Molecular Microbiology, 25, 399-409.
NIELSEN, U. N., OSLER, G. H., CAMPBELL, C. D., BURSLEM, D. F. & VAN DER WAL, R. 2012. Predictors of fine-scale spatial variation in soil mite and microbe community composition differ between biotic groups and habitats. Pedobiologia, 55, 83-91.
NING, J., BAI, Z., GANG, G., JIANG, D., HU, Q., HE, J., ZHANG, H. & ZHUANG, G. 2010. Functional assembly of bacterial communities with activity for the biodegradation of an organophosphorus pesticide in the rape phyllosphere. FEMS Microbiology Letters, 306, 135-143.
NITI, C., SUNITA, S., KAMLESH, K. & RAKESH, K. 2013. Bioremediation: an emerging technology for remediation of pesticides. Research Journal of Chemistry and Environment 17, 88-105.
264

O'BRIEN, S., HODGSON, D. J. & BUCKLING, A. 2014. Social evolution of toxic metal bioremediation in Pseudomonas aeruginosa. Proceedings of the Royal Society B: Biological Sciences, 281, 6 pages.
OHLEN, K., CHANG, Y., HEGEMANN, W., YIN, C.-R. & LEE, S.-T. 2005. Enhanced degradation of chlorinated ethylenes in groundwater from a paint contaminated site by two-stage fluidized-bed reactor. Chemosphere, 58, 373-377.
OLDENHUIS, R., OEDZES, J. Y., VAN DER WAARDE, J. & JANSSEN, D. B. 1991. Kinetics of chlorinated hydrocarbon degradation by Methylosinus trichosporium OB3b and toxicity of trichloroethylene. Applied and Environmental Microbiology, 57, 7-14.
OLDENHUIS, R., VINK, R., JANSSEN, D. B. & WITHOLT, B. 1989. Degradation of chlorinated aliphatic hydrocarbons by Methylosinus trichosporium OB3b expressing soluble methane monooxygenase. Applied and Environmental Microbiology, 55, 2819-2826.
OMAR, S. & ABDEL-SATER, M. 2001. Microbial populations and enzyme activities in soil treated with pesticides. Water, Air and Soil Pollution, 127, 49-63.
ONO, A., MIYAZAKI, R., SOTA, M., OHTSUBO, Y., NAGATA, Y. & TSUDA, M. 2007. Isolation and characterization of naphthalene-catabolic genes and plasmids from oil-contaminated soil by using two cultivation-independent approaches. Applied Microbiology and Biotechnology, 74, 501-510.
ORTEGA-CALVO, J., MARCHENKO, A., VOROBYOV, A. & BOROVICK, R. 2003. Chemotaxis in polycyclic aromatic hydrocarbon-degrading bacteria isolated from coal-tar-and oil-polluted rhizospheres. FEMS Microbiology Ecology, 44, 373-381.
ORTIZ-HERNÁNDEZ, M. L., SÁNCHEZ-SALINAS, E., OLVERA-VELONA, A. & FOLCH-MALLOL, J. L. 2011. Pesticides in the environment: impacts and their biodegradation as a strategy for residues treatment. Pesticides-formulations, effects, fate. ISBN, 978-953.
ORTIZ‐HERNÁNDEZ, M., QUINTERO‐RAMÍREZ, R., NAVA‐OCAMPO, A. & BELLO‐RAMÍREZ, A. 2003. Study of the mechanism of Flavobacterium sp. for hydrolyzing organophosphate pesticides. Fundamental & Clinical Pharmacology, 17, 717-723.
OSBORN, A. M., MOORE, E. R. B. & TIMMIS, K. N. 2000. An evaluation of terminal-restriction fragment length polymorphism (T-RFLP) analysis for the study of microbial community structure and dynamics. Environmental Microbiology, 2, 39-50.
OVERBEEK, R., BEGLEY, T., BUTLER, R. M., CHOUDHURI, J. V., CHUANG, H.-Y., COHOON, M., DE CRÉCY-LAGARD, V., DIAZ, N., DISZ, T. & EDWARDS, R. 2005. The subsystems approach to genome annotation and its use in the project to annotate 1000 genomes. Nucleic Acids Research, 33, 5691-5702.
PAKALA, S. B., GORLA, P., PINJARI, A. B., KROVIDI, R. K., BARU, R., YANAMANDRA, M., MERRICK, M. & SIDDAVATTAM, D. 2007.
265

Biodegradation of methyl parathion and p-nitrophenol: evidence for the presence of a p-nitrophenol 2-hydroxylase in a Gram-negative Serratia sp. strain DS001. Applied Microbiology and Biotechnology, 73, 1452-1462.
PALMA, P., PALMA, V., FERNANDES, R., SOARES, A. & BARBOSA, I. 2008. Acute toxicity of atrazine, endosulfan sulphate and chlorpyrifos to Vibrio fischeri, Thamnocephalus platyurus and Daphnia magna, relative to their concentrations in surface waters from the Alentejo region of Portugal. Bulletin of Environmental Contamination and Toxicology, 81, 485-489.
PANDEY, G., DORRIAN, S. J., RUSSELL, R. J. & OAKESHOTT, J. G. 2009. Biotransformation of the neonicotinoid insecticides imidacloprid and thiamethoxam by Pseudomonas sp. 1G. Biochemical and Biophysical Research Communications, 380, 710-714.
PANDEY, G. & JAIN, R. K. 2002. Bacterial chemotaxis toward environmental pollutants: role in bioremediation. Applied and Environmental Microbiology, 68, 5789-5795.
PANDEY, J., SHARMA, N. K., KHAN, F., GHOSH, A., OAKESHOTT, J. G., JAIN, R. K. & PANDEY, G. 2012. Chemotaxis of Burkholderia sp. strain SJ98 towards chloronitroaromatic compounds that it can metabolise. BMC Microbiology, 12, 19.
PANDEY, S. & SINGH, D. K. 2004. Total bacterial and fungal population after chlorpyrifos and quinalphos treatments in groundnut (Arachis hypogaea L.) soil. Chemosphere, 55, 197-205.
PANT, P. & PANT, S. 2010. A review: Advances in microbial remediation of trichloroethylene (TCE). Journal of Environmental Sciences, 22, 116-126.
PARALES, R. E. 2004. Nitrobenzoates and aminobenzoates are chemoattractants for Pseudomonas strains. Applied and Environmental Microbiology, 70, 285-292.
PARALES, R. E., DITTY, J. L. & HARWOOD, C. S. 2000. Toluene-degrading bacteria are chemotactic towards the environmental pollutants benzene, toluene, and trichloroethylene. Applied and Environmental Microbiology, 66, 4098-4104.
PARALES, R. E. & HARWOOD, C. S. 2002. Bacterial chemotaxis to pollutants and plant-derived aromatic molecules. Current Opinion in Microbiology, 5, 266-273.
PARK, W., JEON, C., CADILLO, H., DERITO, C. & MADSEN, E. 2004. Survival of naphthalene-degrading Pseudomonas putida NCIB 9816-4 in naphthalene-amended soils: toxicity of naphthalene and its metabolites. Applied Microbiology and Biotechnology, 64, 429-435.
PARKS, D. H. & BEIKO, R. G. 2010. Identifying biologically relevant differences between metagenomic communities. Bioinformatics, 26, 715-721.
PASZCZYNSKI, A. J., PAIDISETTI, R., JOHNSON, A. K., CRAWFORD, R. L., COLWELL, F. S., GREEN, T., DELWICHE, M., LEE, H., NEWBY, D. & BRODIE, E. L. 2011. Proteomic and targeted qPCR analyses of subsurface microbial communities for presence of methane monooxygenase. Biodegradation, 22, 1045-1059.
266

PATERSON, E., MIDWOOD, A. J. & MILLARD, P. 2009. Through the eye of the needle: a review of isotope approaches to quantify microbial processes mediating soil carbon balance. New Phytologist, 184, 19-33.
PATON, T. R., HUMPHREYS, G. S. & MITCHELL, P. B. 1995. Soils: a new global view, Yale University Press, New Haven, Connecticut, USA.
PAUL, D., PANDEY, G., PANDEY, J. & JAIN, R. K. 2005. Accessing microbial diversity for bioremediation and environmental restoration. Trends in Biotechnology, 23, 135-142.
PAUL, D., SINGH, R. & JAIN, R. K. 2006. Chemotaxis of Ralstonia sp. SJ98 towards p‐nitrophenol in soil. Environmental Microbiology, 8, 1797-1804.
PELOSI, C., BAROT, S., CAPOWIEZ, Y., HEDDE, M. & VANDENBULCKE, F. 2014. Pesticides and earthworms. A review. Agronomy for Sustainable Development, 34, 199-228.
PENGPHOL, S., UTHAIBUTRA, J., ARQUERO, O.-A., NOMURA, N. & WHANGCHAI, K. 2012. Oxidative degradation and detoxification of Chlorpyrifos by ultrasonic and ozone treatments. Journal of Agricultural Science, 4, 164-172.
PESARO, M., NICOLLIER, G., ZEYER, J. & WIDMER, F. 2004. Impact of soil drying-rewetting stress on microbial communities and activities and on degradation of two crop protection products. Applied and Environmental Microbiology, 70, 2577-2587.
PIRRONE, N., CINNIRELLA, S., FENG, X., FINKELMAN, R., FRIEDLI, H., LEANER, J., MASON, R., MUKHERJEE, A., STRACHER, G. & STREETS, D. 2010. Global mercury emissions to the atmosphere from anthropogenic and natural sources. Atmospheric Chemistry and Physics, 10, 5951-5964.
PIZZUL, L., DEL PILAR CASTILLO, M. & STENSTRÖM, J. 2009. Degradation of glyphosate and other pesticides by ligninolytic enzymes. Biodegradation, 20, 751-759.
POPP, J., PETŐ, K. & NAGY, J. 2013. Pesticide productivity and food security. A review. Agronomy for Sustainable Development, 33, 243-255.
POWELL, C., GOLTZ, M. & AGRAWAL, A. 2014. Degradation kinetics of chlorinated aliphatic hydrocarbons by methane oxidizers naturally-associated with wetland plant roots. Journal of Contaminant Hydrology, 170, 68-75.
PRAVIN, D., SANDIP, B., SHREYASH, B. & ANJANA, G. 2012. Degradation of organophosphate and organochlorine pesticides in liquid culture by marine isolate Nocardiopsis species and its bioprospectives. Journal of Environmental Research And Development, 7, 995-1001.
PROSSER, J. I. 2010. Replicate or lie. Environmental Microbiology, 12, 1806-1810.
QIU, Q., NOLL, M., ABRAHAM, W.-R., LU, Y. & CONRAD, R. 2008. Applying stable isotope probing of phospholipid fatty acids and rRNA in a Chinese rice field to study activity and composition of the methanotrophic bacterial communities in situ. The ISME Journal, 2, 602-614.
267

RABIDEAU, A. J., BLAYDEN, J. M. & GANGULY, C. 1999. Field performance of air-sparging system for removing TCE from groundwater. Environmental Science and Technology, 33, 157-162.
RACKE, K. D. 1993. Environmental fate of chlorpyrifos. Reviews of Environmental Contamination and Toxicology, 131, 1-154.
RACKE, K. D. & COATS, J. R. Enhanced biodegradation of pesticides in the environment. ACS Symposium series, 1990. American Chemical Society.
RACKE, K. D., LASKOWSKI, D. A. & SCHULTZ, M. R. 1990. Resistance of chlorpyrifos to enhanced biodegradation in soil. Journal of Agricultural and Food Chemistry, 38, 1430-1436.
RACKE, K. D., STEELE, K. P., YODER, R. N., DICK, W. A. & AVIDOV, E. 1996. Factors affecting the hydrolytic degradation of chlorpyrifos in soil. Journal of Agricultural and Food Chemistry, 44, 1582-1592.
RADAJEWSKI, S., INESON, P., PAREKH, N. R. & MURRELL, J. C. 2000. Stable-isotope probing as a tool in microbial ecology. Nature, 403, 646-649.
RAGNARSDOTTIR, K. V. 2000. Environmental fate and toxicology of organophosphate pesticides. Journal of the Geological Society, 157, 859-876.
RAHMANSYAH, M., ANTONIUS, S. & SULISTINAH, N. 2009. Phosphatase and urease instability caused by pesticides present in soil improved by grounded rice straw. ARPN Journal of Agricultural and Biological Science, 4, 56-62.
RAJENDHRAN, J. & GUNASEKARAN, P. 2008. Strategies for accessing soil metagenome for desired applications. Biotechnology Advances, 26, 576-590.
RAJKUMAR, M., AE, N., PRASAD, M. N. V. & FREITAS, H. 2010. Potential of siderophore-producing bacteria for improving heavy metal phytoextraction. Trends in Biotechnology, 28, 142-149.
RAMANA, C. V., SASIKALA, C., ARUNASRI, K., KUMAR, P. A., SRINIVAS, T., SHIVAJI, S., GUPTA, P., SÜLING, J. & IMHOFF, J. F. 2006. Rubrivivax benzoatilyticus sp. nov., an aromatic, hydrocarbon-degrading purple betaproteobacterium. International Journal of Systematic and Evolutionary Microbiology, 56, 2157-2164.
RAMEZANI, M. 2008. Environmental fate of imidazolinone herbicides and their enantiomers in soil and water. PhD thesis. School of Agriculture, Food and Wine. University of Adelaide, Australia.
RAMIREZ, K. S., LEFF, J. W., BARBERÁN, A., BATES, S. T., BETLEY, J., CROWTHER, T. W., KELLY, E. F., OLDFIELD, E. E., SHAW, E. A. & STEENBOCK, C. 2014. Biogeographic patterns in below-ground diversity in New York City's Central Park are similar to those observed globally. Proceedings of the Royal Society B: Biological Sciences, 281, 20141988.
RANI, R. & JUWARKAR, A. 2012. Biodegradation of phorate in soil and rhizosphere of Brassica juncea (L.)(Indian Mustard) by a microbial consortium. International Biodeterioration & Biodegradation, 71, 36-42.
268

RASCHE, M. E., HYMAN, M. R. & ARP, D. J. 1991. Factors limiting aliphatic chlorocarbon degradation by Nitrosomonas europaea: cometabolic inactivation of ammonia monooxygenase and substrate specificity. Applied and Environmental Microbiology, 57, 2986-2994.
RASMUSSEN, P. E., GOULDING, K. W., BROWN, J. R., GRACE, P. R., JANZEN, H. H. & KÖRSCHENS, M. 1998. Long-term agroecosystem experiments: Assessing agricultural sustainability and global change. Science, 282, 893-896.
RASTOGI, G. & SANI, R. K. 2011. Molecular techniques to assess microbial community structure, function, and dynamics in the environment. Microbes and Microbial Technology. Springer, 29-57.
RASTOGI, V. K., DEFRANK, J. J., CHENG, T.-C. & WILD, J. R. 1997. Enzymatic hydrolysis of Russian-VX by organophosphorus hydrolase. Biochemical and Biophysical Research Communications, 241, 294-296.
RATTNER, B. A. 2009. History of wildlife toxicology. Ecotoxicology, 18, 773-783.
RAUH, V., ARUNAJADAI, S., HORTON, M., PERERA, F., HOEPNER, L., BARR, D. B. & WHYATT, R. 2011. Seven-year neurodevelopmental scores and prenatal exposure to chlorpyrifos, a common agricultural pesticide. Environmental Health Perspectives, 119, 1196.
RAUSHEL, F. M. 2002. Bacterial detoxification of organophosphate nerve agents. Current Opinion in Microbiology, 5, 288-295.
RAYU, S., KARPOUZAS, D. G. & SINGH, B. K. 2012. Emerging technologies in bioremediation: constraints and opportunities. Biodegradation, 23, 917-926.
REDDY, G. K. K., NANCHARAIAH, Y. & VENUGOPALAN, V. 2014. Biodegradation of dibutyl phosphite by Sphingobium sp. AMGD5 isolated from aerobic granular biomass. International Biodeterioration and Biodegradation, 91, 60-65.
REDDY, M. V., DEVI, M. P., CHANDRASEKHAR, K., GOUD, R. K. & MOHAN, S. V. 2011. Aerobic remediation of petroleum sludge through soil supplementation: microbial community analysis. Journal of Hazardous Materials, 197, 80-87.
REDONDO, M., RUIZ, M., FONT, G. & BOLUDA, R. 1997. Dissipation and distribution of atrazine, simazine, chlorpyrifos, and tetradifon residues in citrus orchard soil. Archives of Environmental Contamination and Toxicology, 32, 346-352.
REEVE, J. R., SCHADT, C. W., CARPENTER-BOGGS, L., KANG, S., ZHOU, J. & REGANOLD, J. P. 2010. Effects of soil type and farm management on soil ecological functional genes and microbial activities. The ISME Journal, 4, 1099-1107.
REICH, P. B., TILMAN, D., ISBELL, F., MUELLER, K., HOBBIE, S. E., FLYNN, D. F. & EISENHAUER, N. 2012. Impacts of biodiversity loss escalate through time as redundancy fades. Science, 336, 589-592.
RICHTER, E. 2002. Acute human pesticide poisonings. Encyclopedia of Pest Management, 3-6.
269

RILEY, R. G. & ZACHARA, J. 1992. Chemical contaminants on DOE lands and selection of contaminant mixtures for subsurface science research. Pacific Northwest Lab., Richland, WA (United States).
ROBERTSON, L., CHANDLER, K., STICKLEY, B., COCCO, R. & AHMETAGIC, M. 1998. Enhanced microbial degradation implicated in rapid loss of chlorpyrifos from the controlled-release formulation suSCon® Blue in soil. Crop Protection, 17, 29-33.
ROETH, F. 1986. Enhanced hericide degradation in soil with repeated application. Weed Science, 2, 45-65.
ROETH, F., WILSON, R., MARTIN, A. & SHEA, P. Enhanced carbamothioate herbicide degradation: research in Nebraska. ACS Symposium series-American Chemical Society (USA), 1990.
RONEN, Z., VISNOVSKY, S. & NEJIDAT, A. 2005. Soil extracts and co-culture assist biodegradation of 2, 4, 6-tribromophenol in culture and soil by an auxotrophic Achromobacter piechaudii strain TBPZ. Soil Biology and Biochemistry, 37, 1640-1647.
ROSENBERG, A. & ALEXANDER, M. 1979. Microbial cleavage of various organophosphorus insecticides. Applied and Environmental Microbiology, 37, 886-891.
ROSSBERG, M., LENDLE, W., PFLEIDERER, G., TÖGEL, A., DREHER, E. L., LANGER, E., RASSAERTS, H., KLEINSCHMIDT, P., STRACK, H. & COOK, R. 2006. Chlorinated hydrocarbons. Ullmann's Encyclopedia of Industrial Chemistry.
ROUCHAUD, J., GUSTIN, F. & WAUTERS, A. 1994. Soil biodegradation and leaf transfer of insecticide imidacloprid applied in seed dressing in sugar beet crops. Bulletin of Environmental Contamination and Toxicology, 53, 344-350.
ROWELL, M. J. 1995. Colorimetric method for CO2 measurement in soils. Soil Biology and Biochemistry, 27, 373-375.
RUSSELL, R. J., SCOTT, C., JACKSON, C. J., PANDEY, R., PANDEY, G., TAYLOR, M. C., COPPIN, C. W., LIU, J. W. & OAKESHOTT, J. G. 2011. The evolution of new enzyme function: lessons from xenobiotic metabolizing bacteria versus insecticide‐resistant insects. Evolutionary Applications, 4, 225-248.
RUSYN, I., CHIU, W. A., LASH, L. H., KROMHOUT, H., HANSEN, J. & GUYTON, K. Z. 2014. Trichloroethylene: Mechanistic, epidemiologic and other supporting evidence of carcinogenic hazard. Pharmacology and Therapeutics, 141, 55-68.
RYOO, D., SHIM, H., CANADA, K., BARBIERI, P. & WOOD, T. K. 2000. Aerobic degradation of tetrachloroethylene by toluene-o-xylene monooxygenase of Pseudomonas stutzeri OX1. Nature Biotechnology, 18, 775-778.
SAHA, M., SARKAR, S., SARKAR, B., SHARMA, B. K., BHATTACHARJEE, S. & TRIBEDI, P. 2015. Microbial siderophores and their potential applications: a review. Environmental Science and Pollution Research, 1-16.
270
SAMANTA, S. K., SINGH, O. V. & JAIN, R. K. 2002. Polycyclic aromatic hydrocarbons: environmental pollution and bioremediation. TRENDS in Biotechnology, 20, 243-248.
SANGWAN, N., LATA, P., DWIVEDI, V., SINGH, A., NIHARIKA, N., KAUR, J., ANAND, S., MALHOTRA, J., JINDAL, S. & NIGAM, A. 2012. Comparative metagenomic analysis of soil microbial communities across three hexachlorocyclohexane contamination levels. PLoS ONE, 7, e46219.
SANNINO, F. & GIANFREDA, L. 2001. Pesticide influence on soil enzymatic activities. Chemosphere, 45, 417-425.
SAPOZHNIKOVA, Y., BAWARDI, O. & SCHLENK, D. 2004. Pesticides and PCBs in sediments and fish from the Salton Sea, California, USA. Chemosphere, 55, 797-809.
SARDAR, D. & KOLE, R. K. 2005. Metabolism of chlorpyrifos in relation to its effect on the availability of some plant nutrients in soil. Chemosphere, 61, 1273-1280.
SARKAR, M. A., ROY, S., KOLE, R. K. & CHOWDHURY, A. 2001. Persistence and metabolism of imidacloprid in different soils of West Bengal. Pest Management Science, 57, 598-602.
SASIKALA, C., JIWAL, S., ROUT, P. & RAMYA, M. 2012. Biodegradation of chlorpyrifos by bacterial consortium isolated from agriculture soil. World Journal of Microbiology and Biotechnology, 28, 1301-1308.
SCHMITT-WAGNER, D., FRIEDRICH, M. W., WAGNER, B. & BRUNE, A. 2003. Axial dynamics, stability, and interspecies similarity of bacterial community structure in the highly compartmentalized gut of soil-feeding termites (Cubitermes spp.). Applied and Environmental Microbiology, 69, 6018-6024.
SCHULTZ, P. & URBAN, N. R. 2008. Effects of bacterial dynamics on organic matter decomposition and nutrient release from sediments: a modeling study. Ecological Modelling, 210, 1-14.
SCHUSTER, E. & SCHRÖDER, D. 1990. Side-effects of sequentially-applied pesticides on non-target soil microorganisms: field experiments. Soil Biology and Biochemistry, 22, 367-373.
SCHÜTTE, U. M., ABDO, Z., BENT, S. J., SHYU, C., WILLIAMS, C. J., PIERSON, J. D. & FORNEY, L. J. 2008. Advances in the use of terminal restriction fragment length polymorphism (T-RFLP) analysis of 16S rRNA genes to characterize microbial communities. Applied Microbiology and Biotechnology, 80, 365-380.
SCOTT, C., PANDEY, G., HARTLEY, C. J., JACKSON, C. J., CHEESMAN, M. J., TAYLOR, M. C., PANDEY, R., KHURANA, J. L., TEESE, M. & COPPIN, C. W. 2008. The enzymatic basis for pesticide bioremediation. Indian Journal of Microbiology, 48, 65-79.
271

SCRIBNER, S. L., BENZING, T. R., SUN, S. & BOYD, S. A. 1992. Desorption and unavailability of aged simazine residues in soil from a continuous corn field. Journal of Environmental Quality, 21, 115-120.
SELIM, S., MARTIN‐LAURENT, F., ROUARD, N., GIANINAZZI, S. & VAN TUINEN, D. 2007. Impact of a new biopesticide produced by Paenibacillus sp. strain B2 on the genetic structure and density of soil bacterial communities. Pest Management Science, 63, 269-275.
SEMPRINI, L. 1997. Strategies for the aerobic co-metabolism of chlorinated solvents. Current Opinion in Biotechnology, 8, 296-308.
SEMRAU, J. D., DISPIRITO, A. A. & MURRELL, J. C. 2008. Life in the extreme: thermoacidophilic methanotrophy. Trends in Microbiology, 16, 190-193.
SEMRAU, J. D., DISPIRITO, A. A. & YOON, S. 2010. Methanotrophs and copper. FEMS Microbiology Reviews, 34, 496-531.
SEN, R. & CHAKRABARTI, S. 2009. Biotechnology- applications to environmental remediation in resource exploitation. Current Science, 97, 768-775.
SERDAR, C. M., GIBSON, D. T., MUNNECKE, D. M. & LANCASTER, J. H. 1982. Plasmid involvement in parathion hydrolysis by Pseudomonas diminuta. Applied and Environmental Microbiology, 44, 246-249.
SETHUNATHAN, N. 1971. Biodegradation of diazinon in paddy field as a cause of loss of its efficiency for controlling brown planthoppers in rice fields. Pest Articles News Summaries, 17, 18-19.
SHAN, M., FANG, H., WANG, X., FENG, B., CHU, X.-Q. & YU, Y.-L. 2006. Effect of chlorpyrifos on soil microbial populations and enzyme activities. Journal of Environmental Sciences-Amsterdam, 18, 4-5.
SHARMA, C. M., ROSSELAND, B. O., ALMVIK, M. & EKLO, O. M. 2009. Bioaccumulation of organochlorine pollutants in the fish community in Lake Årungen, Norway. Environmental Pollution, 157, 2452-2458.
SHARMA, P., RAINA, V., KUMARI, R., MALHOTRA, S., DOGRA, C., KUMARI, H., KOHLER, H.-P. E., BUSER, H.-R., HOLLIGER, C. & LAL, R. 2006. Haloalkane dehalogenase LinB is responsible for β-and δ-hexachlorocyclohexane transformation in Sphingobium indicum B90A. Applied and Environmental Microbiology, 72, 5720-5727.
SHARP, C. E., STOTT, M. B. & DUNFIELD, P. F. 2012. Detection of autotrophic Verrucomicrobial methanotrophs in a geothermal environment using stable isotope probing. Frontiers in Microbiology, 3.
SHELTON, D. R. 1988. Mineralization of diethylthiophosphoric acid by an enriched consortium from cattle dip. Applied and Environmental Microbiology, 54, 2572-2573.
SHIGEMATSU, T., HANADA, S., EGUCHI, M., KAMAGATA, Y., KANAGAWA, T. & KURANE, R. 1999. Soluble methane monooxygenase gene clusters from trichloroethylene-degrading Methylomonas sp. strains and detection of
272

methanotrophs during in situ bioremediation. Applied and Environmental Microbiology, 65, 5198-5206.
SHIH, C., DAVEY, M. E., ZHOU, J., TIEDJE, J. M. & CRIDDLE, C. S. 1996. Effects of phenol feeding pattern on microbial community structure and cometabolism of trichloroethylene. Applied and Environmental Microbiology, 62, 2953-2960.
SHUKLA, A. K., SINGH, R., UPADHYAY, S. & DUBEY, S. K. 2010a. Kinetics of bio-filtration of trichloroethylene by methanotrophs in presence of methanol. Bioresource Technology, 101, 8119-8126.
SHUKLA, A. K., UPADHYAY, S. N. & DUBEY, S. K. 2014. Current trends in trichloroethylene biodegradation: a review. Critical Reviews in Biotechnology, 34, 101-114.
SHUKLA, A. K., VISHWAKARMA, P., SINGH, R., UPADHYAY, S. & DUBEY, S. K. 2010b. Bio-filtration of trichloroethylene using diazotrophic bacterial community. Bioresource Technology, 101, 2126-2133.
SHUKLA, A. K., VISHWAKARMA, P., UPADHYAY, S. N., TRIPATHI, A. K., PRASANA, H. C. & DUBEY, S. K. 2009. Biodegradation of trichloroethylene (TCE) by methanotrophic community. Bioresource Technology, 100, 2469-74.
SIDDAVATTAM, D., KHAJAMOHIDDIN, S., MANAVATHI, B., PAKALA, S. B. & MERRICK, M. 2003. Transposon-like organization of the plasmid-borne organophosphate degradation (opd) gene cluster found in Flavobacterium sp. Applied and Environmental Microbiology, 69, 2533-2539.
SIGLER, W. V. & TURCO, R. F. 2002. The impact of chlorothalonil application on soil bacterial and fungal populations as assessed by denaturing gradient gel electrophoresis. Applied Soil Ecology, 21, 107-118.
SIMON, C. & DANIEL, R. 2011. Metagenomic analyses: past and future trends. Applied and Environmental Microbiology, 77, 1153-1161.
SIMPSON, E. H. 1949. Measurement of diversity. Nature.
SINGH, A., KUHAD, R. C. & WARD, O. P. 2009. Advances in Applied Bioremediation, Springer, Berlin.
SINGH, B., WALKER, A. & WRIGHT, D. 2002a. Persistence of chlorpyrifos, fenamiphos, chlorothalonil, and pendimethalin in soil and their effects on soil microbial characteristics. Bulletin of Environmental Contamination and Toxicology, 69, 181-188.
SINGH, B. K. 2009. Organophosphorus-degrading bacteria: ecology and industrial applications. Nature Reviews Microbiology, 7, 156-164.
SINGH, B. K. 2010. Exploring microbial diversity for biotechnology: The way forward. Trends in Biotechnology, 28, 111-116.
273

SINGH, B. K., KUHAD, R. C., SINGH, A., LAL, R. & TRIPATHI, K. 1999. Biochemical and molecular basis of pesticide degradation by microorganisms. Critical Reviews in Biotechnology, 19, 197-225.
SINGH, B. K. & NAIDU, R. 2012. Cleaning contaminated environment: a growing challenge. Biodegradation, 23, 785-786.
SINGH, B. K., QUINCE, C., MACDONALD, C. A., KHACHANE, A., THOMAS, N., AL‐SOUD, W. A., SØRENSEN, S. J., HE, Z., WHITE, D. & SINCLAIR, A. 2014. Loss of microbial diversity in soils is coincident with reductions in some specialized functions. Environmental Microbiology, 16, 2408-2420.
SINGH, B. K. & TATE, K. 2007. Biochemical and molecular characterization of methanotrophs in soil from a pristine New Zealand beech forest. FEMS Microbiology Letters, 275, 89-97.
SINGH, B. K., TATE, K. R., KOLIPAKA, G., HEDLEY, C. B., MACDONALD, C. A., MILLARD, P. & MURRELL, J. C. 2007. Effect of afforestation and reforestation of pastures on the activity and population dynamics of methanotrophic bacteria. Applied and Environmental Microbiology, 73, 5153-5161.
SINGH, B. K. & WALKER, A. 2006. Microbial degradation of organophosphorus compounds. FEMS microbiology reviews, 30, 428-471.
SINGH, B. K., WALKER, A., MORGAN, J. A. W. & WRIGHT, D. J. 2003a. Effects of soil pH on the biodegradation of chlorpyrifos and isolation of a chlorpyrifos-degrading bacterium. Applied and Environmental Microbiology, 69, 5198-5206.
SINGH, B. K., WALKER, A., MORGAN, J. A. W. & WRIGHT, D. J. 2003b. Role of soil pH in the development of enhanced biodegradation of fenamiphos. Applied and Environmental Microbiology, 69, 7035-7043.
SINGH, B. K., WALKER, A., MORGAN, J. A. W. & WRIGHT, D. J. 2004. Biodegradation of chlorpyrifos by Enterobacter strain B-14 and its use in bioremediation of contaminated soils. Applied and Environmental Microbiology, 70, 4855-4863.
SINGH, B. K., WALKER, A. & WRIGHT, D. J. 2002b. Degradation of chlorpyrifos, fenamiphos, and chlorothalonil alone and in combination and their effects on soil microbial activity. Environmental Toxicology and Chemistry, 21, 2600-2605.
SINGH, B. K., WALKER, A. & WRIGHT, D. J. 2005. Cross-enhancement of accelerated biodegradation of organophosphorus compounds in soils: Dependence on structural similarity of compounds. Soil Biology and Biochemistry, 37, 1675-1682.
SINGH, B. K., WALKER, A. & WRIGHT, D. J. 2006. Bioremedial potential of fenamiphos and chlorpyrifos degrading isolates: influence of different environmental conditions. Soil Biology and Biochemistry, 38, 2682-2693.
SINGH, D., KHATTAR, J., NADDA, J., SINGH, Y., GARG, A., KAUR, N. & GULATI, A. 2011a. Chlorpyrifos degradation by the cyanobacterium Synechocystis sp. strain PUPCCC 64. Environmental Science and Pollution Research, 18, 1351-1359.
274

SINGH, D. K. 2012. Pesticide Chemistry and Toxicology, Bentham Science Publishers, 114-122.
SINGH, J. & SHARMA, Y. C. 2013. Effect of adsorption on degradation of the pesticide aldicarb in the soil. International Review of Chemical Engineering, 5, 88-101.
SINGH, J. & SINGH, D. K. 2005a. Bacterial, azotobacter, actinomycetes, and fungal population in soil after diazinon, imidacloprid, and lindane treatments in groundnut (Arachis hypogaea L.) fields. Journal of Environmental Science and Health Part B, 40, 785-800.
SINGH, J. & SINGH, D. K. 2005b. Dehydrogenase and phosphomonoesterase activities in groundnut (Arachis hypogaea L.) field after diazinon, imidacloprid and lindane treatments. Chemosphere, 60, 32-42.
SINGH, J. S., ABHILASH, P., SINGH, H., SINGH, R. P. & SINGH, D. 2011b. Genetically engineered bacteria: An emerging tool for environmental remediation and future research perspectives. Gene, 480, 1-9.
SINGH, P. B. & SINGH, V. 2008. Pesticide bioaccumulation and plasma sex steroids in fishes during breeding phase from north India. Environmental Toxicology and Pharmacology, 25, 342-350.
SMELT, J. H., VAN DE PEPPEL-GROEN, A. E., VAN DER PAS, L. J. & DIJKSTERHUIS, A. 1996. Development and duration of accelerated degradation of nematicides in different soils. Soil Biology and Biochemistry, 28, 1757-1765.
SMIDT, H. & DE VOS, W. M. 2004. Anaerobic microbial dehalogenation. Annual Review of Microbiology, 58, 43-73.
SMITH, K. S., COSTELLO, A. M. & LIDSTROM, M. E. 1997. Methane and trichloroethylene oxidation by an estuarine methanotroph, Methylobacter sp. strain BB5. 1. Applied and Environmental Microbiology, 63, 4617-4620.
SMITH, R. J., JEFFRIES, T. C., ADETUTU, E. M., FAIRWEATHER, P. G. & MITCHELL, J. G. 2013. Determining the metabolic footprints of hydrocarbon degradation using multivariate analysis. PLoS ONE, 8, e81910.
SMITH, R. J., JEFFRIES, T. C., ROUDNEW, B., FITCH, A. J., SEYMOUR, J. R., DELPIN, M. W., NEWTON, K., BROWN, M. H. & MITCHELL, J. G. 2012. Metagenomic comparison of microbial communities inhabiting confined and unconfined aquifer ecosystems. Environmental Microbiology, 14, 240-253.
SOGORB, M. A. & VILANOVA, E. 2002. Enzymes involved in the detoxification of organophosphorus, carbamate and pyrethroid insecticides through hydrolysis. Toxicology Letters, 128, 215-228.
STEINBERG, S. M., PIGNATELLO, J. J. & SAWHNEY, B. L. 1987. Persistence of 1, 2-dibromoethane in soils: entrapment in intraparticle micropores. Environmental Science & Technology, 21, 1201-1208.
STOECKER, K., BENDINGER, B., SCHÖNING, B., NIELSEN, P. H., NIELSEN, J. L., BARANYI, C., TOENSHOFF, E. R., DAIMS, H. & WAGNER, M. 2006.
275

Cohn’s Crenothrix is a filamentous methane oxidizer with an unusual methane monooxygenase. Proceedings of the National Academy of Sciences of the United States of America, 103, 2363-2367.
STOREY, J. D. & TIBSHIRANI, R. 2003. Statistical significance for genomewide studies. Proceedings of the National Academy of Sciences, 100, 9440-9445.
STRALIS‐PAVESE, N., SESSITSCH, A., WEILHARTER, A., REICHENAUER, T., RIESING, J., CSONTOS, J., MURRELL, J. C. & BODROSSY, L. 2004. Optimization of diagnostic microarray for application in analysing landfill methanotroph communities under different plant covers. Environmental Microbiology, 6, 347-363.
STRANDBERG, G. W., DONALDSON, T. L. & FARR, L. L. 1989. Degradation of trichloroethylene and trans-1, 2-dichloroethylene by a methanotrophic consortium in a fixed-film, packed-bed bioreactor. Environmental Science & Technology, 23, 1422-1425.
SUETT, D., JUKES, A. & PHELPS, K. 1993. Stability of accelerated degradation of soil-applied insecticides: laboratory behaviour of aldicarb and carbofuran in relation to their efficacy against cabbage root fly (Delia radicum) in previously treated field soils. Crop Protection, 12, 431-442.
SUETT, D. L., FOURNIER, J.-C., PAPADOPOULOU-MOURKIDOU, E., PUSSEMIER, L. & SMELT, J. 1996. Accelerated degradation: the European dimension. Soil Biology and Biochemistry, 28, 1741-1748.
SUTFIN, J. A. & RAMEY, D. 1997. In situ biological treatment of TCE‐impacted soil and groundwater: Demonstration results. Environmental Progress, 16, 287-296.
SUTTINUN, O., LUEPROMCHAI, E. & MÜLLER, R. 2013. Cometabolism of trichloroethylene: concepts, limitations and available strategies for sustained biodegradation. Reviews in Environmental Science and Bio/Technology, 12, 99-114.
SUTTON, N. B., MAPHOSA, F., MORILLO, J. A., AL-SOUD, W. A., LANGENHOFF, A. A., GROTENHUIS, T., RIJNAARTS, H. H. & SMIDT, H. 2013. Impact of long-term diesel contamination on soil microbial community structure. Applied and Environmental Microbiology, 79, 619-630.
TAIWO, L. & OSO, B. 1997. The influence of some pesticides on soil microbial flora in relation to changes in nutrient level, rock phosphate solubilization and P release under laboratory conditions. Agriculture, Ecosystems and Environment, 65, 59-68.
TAJEDDINE, L., NEMMAOUI, M., MOUNTACER, H., DAHCHOUR, A. & SARAKHA, M. 2010. Photodegradation of fenamiphos on the surface of clays and soils. Environmental Chemistry Letters, 8, 123-128.
TAKEUCHI, I., MIYOSHI, N., MIZUKAWA, K., TAKADA, H., IKEMOTO, T., OMORI, K. & TSUCHIYA, K. 2009. Biomagnification profiles of polycyclic aromatic hydrocarbons, alkylphenols and polychlorinated biphenyls in Tokyo Bay elucidated by 13C and 15N isotope ratios as guides to trophic web structure. Marine Pollution Bulletin, 58, 663-671.
276

TAMURA, K., STECHER, G., PETERSON, D., FILIPSKI, A. & KUMAR, S. 2013. MEGA6: molecular evolutionary genetics analysis version 6.0. Molecular Biology and Evolution, 30, 2725-2729.
TCHELET, R., LEVANON, D., MINGELGRIN, U. & HENIS, Y. 1993. Parathion degradation by a Pseudomonas sp. and a Xanthomonas sp. and by their crude enzyme extracts as affected by some cations. Soil Biology and Biochemistry, 25, 1665-1671.
TEKAYA, N., SAIAPINA, O., OUADA, H. B., LAGARDE, F., OUADA, H. B. & JAFFREZIC-RENAULT, N. 2013. Ultra-sensitive conductometric detection of heavy metals based on inhibition of alkaline phosphatase activity from Arthrospira platensis. Bioelectrochemistry, 90, 24-29.
TERRY, A. 2012. Functional consequences of repeated organophosphate exposure: potential non-cholinergic mechanisms. Pharmacology and Therapeutics, 134, 355-365.
THENGODKAR, R. R. M. & SIVAKAMI, S. 2010. Degradation of chlorpyrifos by an alkaline phosphatase from the cyanobacterium Spirulina platensis. Biodegradation, 21, 637-644.
THERIOT, C. M. & GRUNDEN, A. M. 2011. Hydrolysis of organophosphorus compounds by microbial enzymes. Applied Microbiology and Biotechnology, 89, 35-43.
TIEHM, A. & SCHMIDT, K. R. 2011. Sequential anaerobic/aerobic biodegradation of chloroethenes—aspects of field application. Current Opinion in Biotechnology, 22, 415-421.
TIEHM, A., SCHMIDT, K. R., STOLL, C., MÜLLER, A., LOHNER, S., HEIDINGER, M., WICKERT, F. & KARCH, U. 2007. Assessment of natural microbial dechlorination. Italian Journal of Engineering Geology and Environment, 1, 71-77.
TILAK, K., VEERAIAH, K. & RAO, D. K. 2004. Toxicity and bioaccumulation of chlorpyrifos in Indian carp Catla catla (Hamilton), Labeo rohita (Hamilton), and Cirrhinus mrigala (Hamilton). Bulletin of Environmental Contamination and Toxicology, 73, 933-941.
TIŠLER, T., JEMEC, A., MOZETIČ, B. & TREBŠE, P. 2009. Hazard identification of imidacloprid to aquatic environment. Chemosphere, 76, 907-914.
TODAR, K. 2012. Todar's online textbook of bacteriology, http://textbookofbacteriology.net/nutgro_2.html. Accessed on 3 March 2015.
TOMIZAWA, M. & CASIDA, J. E. 2005. Neonicotinoid insecticide toxicology: mechanisms of selective action. Annual Review of Pharmacology and Toxicology, 45, 247-268.
TOMPSON, A., KNAPP, R., HANNA, M. & TAYLOR, R. 1994. Simulation of TCE migration and biodegradation in a porous medium under conditions of finite degradation capacity. Advances in Water Resources, 17, 241-249.
277

TOP, E. M. & SPRINGAEL, D. 2003. The role of mobile genetic elements in bacterial adaptation to xenobiotic organic compounds. Current Opinion in Biotechnology, 14, 262-269.
TOP, E. M., SPRINGAEL, D. & BOON, N. 2002. Catabolic mobile genetic elements and their potential use in bioaugmentation of polluted soils and waters. FEMS Microbiology Ecology, 42, 199-208.
TOPP, E. 2003. Bacteria in agricultural soils: Diversity, role and future perspectives. Canadian Journal of Soil Science, 83, 303-309.
TORSVIK, V. & ØVREÅS, L. 2002. Microbial diversity and function in soil: from genes to ecosystems. Current Opinion in Microbiology, 5, 240-245.
TORTELLA, G., MELLA-HERRERA, R., SOUSA, D., RUBILAR, O., ACUÑA, J., BRICEÑO, G. & DIEZ, M. 2013. Atrazine dissipation and its impact on the microbial communities and community level physiological profiles in a microcosm simulating the biomixture of on-farm biopurification system. Journal of Hazardous Materials, 260, 459-467.
TORTELLA, G., SALGADO, E., CUOZZO, S., MELLA-HERRERA, R., PARRA, L., DIEZ, M. & RUBILAR, O. 2014. Combined microbiological test to assess changes in an organic matrix used to avoid agricultural soil contamination, exposed to an insecticide. Journal of Soil Science and Plant Nutrition, 0-0.
TOUT, J., JEFFRIES, T. C., WEBSTER, N. S., STOCKER, R., RALPH, P. J. & SEYMOUR, J. R. 2014. Variability in microbial community composition and function between different niches within a coral reef. Microbial Ecology, 67, 540-552.
TRESSE, O., MOUNIEN, F., LÉVESQUE, M. J. & GUIOT, S. 2005. Comparison of the microbial population dynamics and phylogenetic characterization of a CANOXIS reactor and a UASB reactor degrading trichloroethene. Journal of Applied Microbiology, 98, 440-449.
TRINGE, S. G. & RUBIN, E. M. 2005. Metagenomics: DNA sequencing of environmental samples. Nature Reviews Genetics, 6, 805-814.
TSOGAS, G. Z., GIOKAS, D. L., NIKOLAKOPOULOS, P. G., VLESSIDIS, A. G. & EVMIRIDIS, N. P. 2006. Determination of the pesticide carbaryl and its photodegradation kinetics in natural waters by flow injection–direct chemiluminescence detection. Analytica Chimica Acta, 573, 354-359.
TU, C. 1995. Effect of five insecticides on microbial and enzymatic activities in sandy soil. Journal of Environmental Science and Health Part B, 30, 289-306.
TUZMEN, N., CANDAN, N., KAYA, E. & DEMIRYAS, N. 2008. Biochemical effects of chlorpyrifos and deltamethrin on altered antioxidative defense mechanisms and lipid peroxidation in rat liver. Cell Biochemistry and Function, 26, 119-124.
UCHIYAMA, H., OGURI, K., NISHIBAYASHI, M., KOKUFUTA, E. & YAGI, O. 1995. Trichloroethylene degradation by cells of a methane-utilizing bacterium, Methylocystis sp. M, immobilized in calcium alginate. Journal of Fermentation and Bioengineering, 79, 608-613.
278

VAN BEILEN, J. B. & FUNHOFF, E. G. 2007. Alkane hydroxylases involved in microbial alkane degradation. Applied Microbiology and Biotechnology, 74, 13-21.
VAN EERD, L. L., HOAGLAND, R. E., ZABLOTOWICZ, R. M. & HALL, J. C. 2009. Pesticide metabolism in plants and microorganisms. Weed Science, 51, 472-495.
VAN HYLCKAMA, V. J., DE KONING, W. & JANSSEN, D. B. 1996. Transformation kinetics of chlorinated ethenes by Methylosinus trichosporium OB3b and detection of unstable epoxides by on-line gas chromatography. Applied and Environmental Microbiology, 62, 3304-3312.
VAN PEE, K.-H. & UNVERSUCHT, S. 2003. Biological dehalogenation and halogenation reactions. Chemosphere, 52, 299-312.
VÁZQUEZ, S., NOGALES, B., RUBERTO, L., HERNÁNDEZ, E., CHRISTIE-OLEZA, J., BALBO, A. L., BOSCH, R., LALUCAT, J. & MAC CORMACK, W. 2009. Bacterial community dynamics during bioremediation of diesel oil-contaminated Antarctic soil. Microbial Ecology, 57, 598-610.
VIGLIOTTA, G., NUTRICATI, E., CARATA, E., TREDICI, S. M., DE STEFANO, M., PONTIERI, P., MASSARDO, D. R., PRATI, M. V., DE BELLIS, L. & ALIFANO, P. 2007. Clonothrix fusca Roze 1896, a filamentous, sheathed, methanotrophic γ-proteobacterium. Applied and Environmental Microbiology, 73, 3556-3565.
VISCHETTI, C., MONACI, E., CARDINALI, A., CASUCCI, C. & PERUCCI, P. 2008. The effect of initial concentration, co-application and repeated applications on pesticide degradation in a biobed mixture. Chemosphere, 72, 1739-1743.
VISHWAKARMA, P. & DUBEY, S. K. 2010. DNA microarray analysis targeting pmoA gene reveals diverse community of methanotrophs in the rhizosphere of tropical rice soils. Current Science (00113891), 99.
VOGEL, J. R., MAJEWSKI, M. S. & CAPEL, P. D. 2008. Pesticides in rain in four agricultural watersheds in the United States. Journal of Environmental Quality, 37, 1101-1115.
VOROBEV, A. V., BAANI, M., DORONINA, N. V., BRADY, A. L., LIESACK, W., DUNFIELD, P. F. & DEDYSH, S. N. 2011. Methyloferula stellata gen. nov., sp. nov., an acidophilic, obligately methanotrophic bacterium that possesses only a soluble methane monooxygenase. International Journal of Systematic and Evolutionary Microbiology, 61, 2456-2463.
WACKETT, L. P., BRUSSEAU, G. A., HOUSEHOLDER, S. R. & HANSON, R. S. 1989. Survey of microbial oxygenases: trichloroethylene degradation by propane-oxidizing bacteria. Applied and Environmental Microbiology, 55, 2960-2964.
WAINWRIGHT, M. 1978. A review of the effects of pesticides on microbial activity in soils. Journal of Soil Science, 29, 287-298.
WAKELIN, S., GERARD, E., BLACK, A., HAMONTS, K., CONDRON, L., YUAN, T., VAN NOSTRAND, J., ZHOU, J. & O'CALLAGHAN, M. 2014.
279

Mechanisms of pollution induced community tolerance in a soil microbial community exposed to Cu. Environmental Pollution, 190, 1-9.
WAKELIN, S., MACDONALD, L., ROGERS, S., GREGG, A. L., BOLGER, T. & BALDOCK, J. A. 2008. Habitat selective factors influencing the structural composition and functional capacity of microbial communities in agricultural soils. Soil Biology and Biochemistry, 40, 803-813.
WANG, F., YAO, J., CHEN, H., CHEN, K., TREBŠE, P. & ZARAY, G. 2010a. Comparative toxicity of chlorpyrifos and its oxon derivatives to soil microbial activity by combined methods. Chemosphere, 78, 319-326.
WANG, G.-L., WANG, L., CHEN, H.-H., SHEN, B., LI, S.-P. & JIANG, J.-D. 2011a. Lysobacter ruishenii sp. nov., a chlorothalonil-degrading bacterium isolated from a long-term chlorothalonil-contaminated soil. International Journal of Systematic and Evolutionary Microbiology, 61, 674-679.
WANG, J., LU, Y. & SHEN, G. 2007a. Combined effects of cadmium and butachlor on soil enzyme activities and microbial community structure. Environmental Geology, 51, 1221-1228.
WANG, L., WEN, Y., GUO, X., WANG, G., LI, S. & JIANG, J. 2010b. Degradation of methamidophos by Hyphomicrobium species MAP-1 and the biochemical degradation pathway. Biodegradation, 21, 513-523.
WANG, M.-C., GONG, M., ZANG, H.-B., HUA, X.-M., YAO, J., PANG, Y.-J. & YANG, Y.-H. 2006. Effect of methamidophos and urea application on microbial communities in soils as determined by microbial biomass and community level physiological profiles. Journal of Environmental Science and Health Part B, 41, 399-413.
WANG, M.-C., LIU, Y.-H., WANG, Q., GONG, M., HUA, X.-M., PANG, Y.-J., HU, S. & YANG, Y.-H. 2008. Impacts of methamidophos on the biochemical, catabolic, and genetic characteristics of soil microbial communities. Soil Biology and Biochemistry, 40, 778-788.
WANG, Q., XIONG, D., ZHAO, P., YU, X., TU, B. & WANG, G. 2011b. Effect of applying an arsenic‐resistant and plant growth–promoting rhizobacterium to enhance soil arsenic phytoremediation by Populus deltoides LH05‐17. Journal of Applied Microbiology, 111, 1065-1074.
WANG, S.-M. & TSENG, S.-K. 2009. Reductive dechlorination of trichloroethylene by combining autotrophic hydrogen-bacteria and zero-valent iron particles. Bioresource Technology, 100, 111-117.
WANG, X.-D., LIU, X.-J., YANG, S., LI, A.-L. & YANG, Y.-L. 2007b. Removal and toxicological response of triazophos by Chlamydomonas reinhardtii. Bulletin of Environmental Contamination and Toxicology, 78, 67-71.
WANG, X., MIN, S., CHUNMING, G., BIN, D., ZHANG, Q., HUA, F. & YUNLONG, Y. 2009. Carbendazim induces a temporary change in soil bacterial community structure. Journal of Environmental Sciences, 21, 1679-1683.
WARD, C. H. 1997. Subsurface restoration, CRC Press.
280

WARTON, B., MATTHIESSEN, J. N. & SHACKLETON, M. A. 2003. Cross-enhancement: enhanced biodegradation of isothiocyanates in soils previously treated with metham sodium. Soil Biology and Biochemistry, 35, 1123-1127.
WATANABE, K. 2001. Microorganisms relevant to bioremediation. Current Opinion in Biotechnology, 12, 237-241.
WATTS, M. 2012. Chlorpyrifos as a possible global POP. Pesticide Action Network North America, Oakland, CA. .
WHITACRE, D. M. & GUNTHER, F. A. 2012. Reviews of environmental contamination and toxicology, Springer, New York, NY, 197, 1-197.
WHITE, A. K. & METCALF, W. W. 2007. Microbial metabolism of reduced phosphorus compounds. Annual Review of Microbiology, 61, 379-400.
WHITTENBURY, R. & DALTON, H. 1981. The methylotrophic bacteria. The Prokaryotes, 894-902.
WHITTENBURY, R., PHILLIPS, K. C. & WILKINSON, J. F. 1970. Enrichment, isolation and some properties of methane-utilizing bacteria. Journal of General Microbiology, 61, 205-218.
WHYATT, R. 2011. 7-Year neurodevelopmental scores and prenatal exposure to chlorpyrifos, a common agricultural pesticide. Environmenal Health Perspectives, 119, 11961201Rees.
WILKE, A., HARRISON, T., WILKENING, J., FIELD, D., GLASS, E. M., KYRPIDES, N., MAVROMMATIS, K. & MEYER, F. 2012. The M5nr: a novel non-redundant database containing protein sequences and annotations from multiple sources and associated tools. BMC Bioinformatics, 13, 141.
WILLIAMS, I., PEPIN, H. & BROWN, M. 1976. Degradation of carbofuran by soil microorganisms. Bulletin of Environmental Contamination and Toxicology, 15, 244-249.
WILSON, J. T. & WILSON, B. H. 1985. Biotransformation of trichloroethylene in soil. Applied and Environmental Microbiology, 49, 242-243.
WILSON, R. G. 1984. Accelerated degradation of thiocarbamate herbicides in soil with prior thiocarbamate herbicide exposure. Weed Science, 264-268.
WOHLFARTH, G. & DIEKERT, G. 1997. Anaerobic dehalogenases. Current Opinion in Biotechnology, 8, 290-295.
WOOLEY, J. C. & YE, Y. 2010. Metagenomics: facts and artifacts, and computational challenges. Journal of Computer Science and Technology, 25, 71-81.
WU, J. Y., SMART, M. D., ANELLI, C. M. & SHEPPARD, W. S. 2012. Honey bees (Apis mellifera) reared in brood combs containing high levels of pesticide residues exhibit increased susceptibility to Nosema (Microsporidia) infection. Journal of Invertebrate Pathology, 109, 326-329.
281
WU, X.-H., JUN, X., LIU, Y.-Z., DONG, F.-S., LIU, X.-G., ZHANG, W.-W. & ZHENG, Y.-Q. 2015. Impact of fluxapyroxad on the microbial community structure and functional diversity in the silty-loam soil. Journal of Integrative Agriculture, 14, 114-124.
WYMORE, R. A., LEE, M. H., KEENER, W. K., MILLER, A. R., COLWELL, F. S., WATWOOD, M. E. & SORENSON JR, K. S. 2007. Field evidence for intrinsic aerobic chlorinated ethene cometabolism by methanotrophs expressing soluble methane monooxygenase. Bioremediation Journal, 11, 125-139.
XAVIER, R., REKHA, K. & BAIRY, K. 2004. Health perspective of pesticide exposure and dietary management. Malaysian Journal of Nutrition, 10, 39-51.
XIE, C., LU, R., HUANG, Y., WANG, Q. & XU, X. 2010a. Effects of ions and phosphates on alkaline phosphatase activity in aerobic activated sludge system. Bioresource Technology, 101, 3394-3399.
XIE, H., GAO, F., TAN, W. & WANG, S.-G. 2011a. A short-term study on the interaction of bacteria, fungi and endosulfan in soil microcosm. Science of the Total Environment, 412, 375-379.
XIE, S., SUN, W., LUO, C. & CUPPLES, A. M. 2010b. Stable isotope probing identifies novel m-xylene degraders in soil microcosms from contaminated and uncontaminated sites. Water, Air, & Soil Pollution, 212, 113-122.
XIE, S., SUN, W., LUO, C. & CUPPLES, A. M. 2011b. Novel aerobic benzene degrading microorganisms identified in three soils by stable isotope probing. Biodegradation, 22, 71-81.
XIE, X.-M., LIAO, M., HUANG, C.-Y., LIU, W.-P. & ABID, S. 2004. Effects of pesticides on soil biochemical characteristics of a paddy soil. Journal of Environmental Sciences, 16, 252-255.
XU, G., LI, Y., ZHENG, W., PENG, X., LI, W. & YAN, Y. 2007. Mineralization of chlorpyrifos by co-culture of Serratia and Trichosporon spp. Biotechnology Letters, 29, 1469-1473.
XU, G., ZHENG, W., LI, Y., WANG, S., ZHANG, J. & YAN, Y. 2008. Biodegradation of chlorpyrifos and 3, 5, 6-trichloro-2-pyridinol by a newly isolated Paracoccus sp. strain TRP. International Biodeterioration and Biodegradation, 62, 51-56.
XU, X., DAILEY, A. B., TALBOTT, E. O., ILACQUA, V. A., KEARNEY, G. & ASAL, N. R. 2010. Associations of serum concentrations of organochlorine pesticides with breast cancer and prostate cancer in US adults. Environmental Health Perspectives, 60-66.
YAN, Q.-X., HONG, Q., HAN, P., DONG, X.-J., SHEN, Y.-J. & LI, S.-P. 2007. Isolation and characterization of a carbofuran-degrading strain Novosphingobium sp. FND-3. FEMS Microbiology Letters, 271, 207-213.
YAN, T., YE, Q., ZHOU, J. & ZHANG, C. L. 2006. Diversity of functional genes for methanotrophs in sediments associated with gas hydrates and hydrocarbon seeps in the Gulf of Mexico. FEMS Microbiology Ecology, 57, 251-259.
282
YANG, C.-L., SUN, T.-H., HE, W.-X., ZHOU, Q.-X. & CHEN, S. 2007. Single and joint effects of pesticides and mercury on soil urease. Journal of Environmental Sciences, 19, 210-216.
YANG, C., LIU, N., GUO, X. & QIAO, C. 2006. Cloning of mpd gene from a chlorpyrifos‐degrading bacterium and use of this strain in bioremediation of contaminated soil. FEMS Microbiology Letters, 265, 118-125.
YANG, H., WANG, X., ZHENG, J., WANG, G., HONG, Q., LI, S., LI, R. & JIANG, J. 2013. Biodegradation of acetamiprid by Pigmentiphaga sp. D-2 and the degradation pathway. International Biodeterioration and Biodegradation, 85, 95-102.
YANG, L., CHANG, Y.-F. & CHOU, M.-S. 1999. Feasibility of bioremediation of trichloroethylene contaminated sites by nitrifying bacteria through cometabolism with ammonia. Journal of Hazardous Materials, 69, 111-126.
YANG, L., ZHAO, Y. H., ZHANG, B. X., YANG, C. H. & ZHANG, X. 2005. Isolation and characterization of a chlorpyrifos and 3, 5, 6‐trichloro‐2‐pyridinol degrading bacterium. FEMS Microbiology Letters, 251, 67-73.
YAUCK, J. S., MALLOY, M. E., BLAIR, K., SIMPSON, P. M. & MCCARVER, D. G. 2004. Proximity of residence to trichloroethylene‐emitting sites and increased risk of offspring congenital heart defects among older women. Birth Defects Research Part A: Clinical and Molecular Teratology, 70, 808-814.
YEAGER, C. M., ARTHUR, K. M., BOTTOMLEY, P. J. & ARP, D. J. 2004. Trichloroethylene degradation by toluene-oxidizing bacteria grown on non-aromatic substrates. Biodegradation, 15, 19-28.
YERGEAU, E., SANSCHAGRIN, S., BEAUMIER, D. & GREER, C. W. 2012. Metagenomic analysis of the bioremediation of diesel-contaminated Canadian high arctic soils. PLoS ONE, 7, e30058.
YOKOUCHI, Y., BARRIE, L., TOOM, D. & AKIMOTO, H. 1996. The seasonal variation of selected natural and anthropogenic halocarbons in the Arctic troposphere. Atmospheric Environment, 30, 1723-1727.
YONG, R. N. & MULLIGAN, C. N. 2003. Natural attenuation of contaminants in soils, CRC Press, Boca Raton, FL.
YU, Y. 2008. Application of a methanotrophic immobilized soil bioreactor to trichloroethylene degradation. PhD thesis. Queen's University, Canada.
YU, Y. L., FANG, H., WANG, X., WU, X. M., SHAN, M. & YU, J. Q. 2006. Characterization of a fungal strain capable of degrading chlorpyrifos and its use in detoxification of the insecticide on vegetables. Biodegradation, 17, 487-494.
YUAN, S., MAO, X. & ALSHAWABKEH, A. N. 2012. Efficient degradation of TCE in groundwater using Pd and electro-generated H2 and O2: a shift in pathway from hydrodechlorination to oxidation in the presence of ferrous ions. Environmental Science and Technology, 46, 3398-3405.
283

ZABALOY, M. C., GÓMEZ, E., GARLAND, J. L. & GÓMEZ, M. A. 2012. Assessment of microbial community function and structure in soil microcosms exposed to glyphosate. Applied Soil Ecology, 61, 333-339.
ZHANG, B., ZHANG, H., BO, J., LING, T., JIANZHOU, Y., BAOJU, L., ZHUANG, G. & ZHIHUI, B. 2008. Effect of cypermethrin insecticide on the microbial community in cucumber phyllosphere. Journal of Environmental Sciences, 20, 1356-1362.
ZHANG, L.-M., HU, H.-W., SHEN, J.-P. & HE, J.-Z. 2011a. Ammonia-oxidizing archaea have more important role than ammonia-oxidizing bacteria in ammonia oxidation of strongly acidic soils. The ISME Journal, 6, 1032-1045.
ZHANG, R., CUI, Z., JIANG, J., HE, J., GU, X. & LI, S. 2005. Diversity of organophosphorus pesticide-degrading bacteria in a polluted soil and conservation of their organophosphorus hydrolase genes. Canadian Journal of Microbiology, 51, 337-343.
ZHANG, R., CUI, Z., ZHANG, X., JIANG, J., GU, J.-D. & LI, S. 2006a. Cloning of the organophosphorus pesticide hydrolase gene clusters of seven degradative bacteria isolated from a methyl parathion contaminated site and evidence of their horizontal gene transfer. Biodegradation, 17, 465-472.
ZHANG, R., JIANG, J., GU, J.-D. & LI, S. 2006b. Long term effect of methylparathion contamination on soil microbial community diversity estimated by 16S rRNA gene cloning. Ecotoxicology, 15, 523-530.
ZHANG, S., WANG, Q. & XIE, S. 2012a. Stable isotope probing identifies anthracene degraders under methanogenic conditions. Biodegradation, 23, 221-230.
ZHANG, W., JIANG, F. & OU, J. 2011b. Global pesticide consumption and pollution: with China as a focus. Proceedings of the International Academy of Ecology and Environmental Sciences, 1, 125-144.
ZHANG, Y., HU, M., JIANG, Z. & LIU, Y. 2011c. Effect of anthraquinone-2, 6-disulfonate on the trichloroethene degradation by Dehalococcoides-containing consortium. Journal of Hazardous Materials, 192, 1896-1899.
ZHANG, Y., MENG, D., WANG, Z., GUO, H., WANG, Y., WANG, X. & DONG, X. 2012b. Oxidative stress response in atrazine-degrading bacteria exposed to atrazine. Journal of Hazardous Materials, 229, 434-438.
ZHANG, Z., HONG, Q., XU, J., ZHANG, X. & LI, S. 2006c. Isolation of fenitrothion-degrading strain Burkholderia sp. FDS-1 and cloning of mpd gene. Biodegradation, 17, 275-283.
ZHAO, Y.-J., DAI, Y.-J., YU, C.-G., LUO, J., XU, W.-P., NI, J.-P. & YUAN, S. 2009. Hydroxylation of thiacloprid by bacterium Stenotrophomonas maltophilia CGMCC1. 1788. Biodegradation, 20, 761-768.
ZHONGLI, C., SHUNPENG, L. & GUOPING, F. 2001. Isolation of methyl parathion-degrading strain M6 and cloning of the methyl parathion hydrolase gene. Applied and Environmental Microbiology, 67, 4922-4925.
284

ZHOU, G.-C., WANG, Y., ZHAI, S., GE, F., LIU, Z.-H., DAI, Y.-J., YUAN, S. & HOU, J.-Y. 2013. Biodegradation of the neonicotinoid insecticide thiamethoxam by the nitrogen-fixing and plant-growth-promoting rhizobacterium Ensifer adhaerens strain TMX-23. Applied Microbiology and Biotechnology, 97, 4065-4074.
ZHOU, X.-Q., WANG, Y.-F., HUANG, X.-Z., HAO, Y.-B., TIAN, J.-Q. & WANG, J.-Z. 2008. Effects of grazing by sheep on the structure of methane-oxidizing bacterial community of steppe soil. Soil Biology and Biochemistry, 40, 258-261.
285