microbial interkingdom interactions in roots promote
TRANSCRIPT
Article
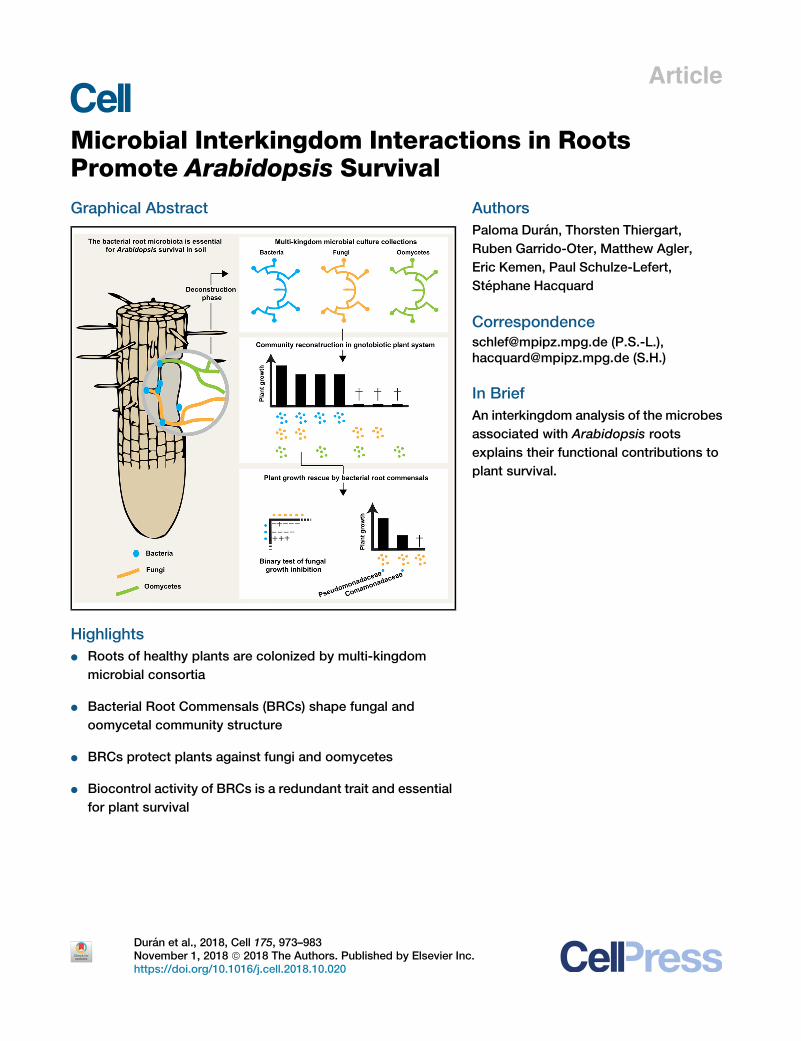
Microbial Interkingdom Interactions in Roots
Promote Arabidopsis SurvivalGraphical Abstract
Highlights
d Roots of healthy plants are colonized by multi-kingdom
microbial consortia
d Bacterial Root Commensals (BRCs) shape fungal and
oomycetal community structure
d BRCs protect plants against fungi and oomycetes
d Biocontrol activity of BRCs is a redundant trait and essential
for plant survival
Duran et al., 2018, Cell 175, 973–983November 1, 2018 ª 2018 The Authors. Published by Elsevier Inchttps://doi.org/10.1016/j.cell.2018.10.020
Authors
Paloma Duran, Thorsten Thiergart,
Ruben Garrido-Oter, Matthew Agler,
Eric Kemen, Paul Schulze-Lefert,
Stephane Hacquard
[email protected] (P.S.-L.),[email protected] (S.H.)
In Brief
An interkingdom analysis of the microbes
associated with Arabidopsis roots
explains their functional contributions to
plant survival.
.
Article
Microbial Interkingdom Interactionsin Roots Promote Arabidopsis SurvivalPalomaDuran,1,5 Thorsten Thiergart,1,5 RubenGarrido-Oter,1,2 MatthewAgler,1,3 Eric Kemen,1,2,4 Paul Schulze-Lefert,1,2,*and Stephane Hacquard1,6,*1Max Planck Institute for Plant Breeding Research, 50829 Cologne, Germany2Cluster of Excellence on Plant Sciences (CEPLAS), Max Planck Institute for Plant Breeding Research, 50829 Cologne, Germany3Present address: Institute of Microbiology, Friedrich Schiller University, 07743 Jena, Germany4Present address: Department of Microbial Interactions, IMIT/ZMBP, University of Tubingen, 72076 Tubingen, Germany5These authors contributed equally6Lead Contact*Correspondence: [email protected] (P.S.-L.), [email protected] (S.H.)
https://doi.org/10.1016/j.cell.2018.10.020
SUMMARY
Roots of healthy plants are inhabited by soil-derivedbacteria, fungi, and oomycetes that have evolvedindependently in distinct kingdoms of life. How thesemicroorganisms interact and to what extent thoseinteractions affect plant health are poorly under-stood. We examined root-associated microbial com-munities from threeArabidopsis thaliana populationsand detected mostly negative correlations betweenbacteria and filamentous microbial eukaryotes. Weestablished microbial culture collections for recon-stitution experiments using germ-free A. thaliana. Inplants inoculated with mono- or multi-kingdom syn-thetic microbial consortia, we observed a profoundimpact of the bacterial root microbiota on fungaland oomycetal community structure and diversity.We demonstrate that the bacterial microbiota isessential for plant survival and protection againstroot-derived filamentous eukaryotes. Deconvolutionof 2,862 binary bacterial-fungal interactions ex situ,combined with community perturbation experimentsin planta, indicate that biocontrol activity of bacterialroot commensals is a redundant trait that maintainsmicrobial interkingdom balance for plant health.
INTRODUCTION
Similar to the guts of vertebrates, the roots of soil-grown plants
are inhabited by taxonomically structured bacterial communities
that provide fitness benefits to their respective hosts (Hacquard
et al., 2015). A possibly unique feature of plant roots is their ca-
pacity to host simultaneously, besides the bacterial microbiota
(Lebeis et al., 2015; Bai et al., 2015; Castrillo et al., 2017), a range
of soil-borne filamentous eukaryotic microbes such as fungi and
oomycetes that have evolved independently in distinct king-
doms of life (Mycota and Chromista; Ruggiero et al., 2015).
The dynamics of microbe-microbe interactions have recently
emerged as an important feature of the phyllosphere (Agler
Cell 175, 973–983, NovThis is an open access article under the CC BY-N
et al., 2016), and such interactions are now acknowledged to
carry out important functions for plant health, including synergis-
tic effects on plant growth (van der Heijden et al., 2016), protec-
tion against microbial pathogens (Santhanam et al., 2015), and
promotion of mycorrhizal symbiosis (Garbaye, 1994). Neverthe-
less, the interplay between prokaryotic and eukaryotic microbes
along the soil-root continuum and the relevance of interkingdom
microbe-microbe interactions for structuring root-associated
microbial communities have received little attention so far
(Hassani et al., 2018).
By profiling three microbial groups (bacteria, fungi, oomy-
cetes) in the roots of natural A. thaliana populations and
establishing reference microbial culture collections for micro-
biota reconstitution experiments, we provide community-level
evidence that negative interactions between prokaryotic and
eukaryotic root microbiota members are critical for plant host
survival and maintenance of host-microbiota balance.
RESULTS
Root-Associated Microbial AssemblagesWe collected A. thaliana plants from natural populations at two
neighboring sites in Germany (Geyen and Pulheim; 5 km apart)
and a more distant location in France (Saint-Die; �350 km
away) (Figure S1A and Table S1). For each population, four rep-
licates, each consisting of four pooled A. thaliana individuals,
were prepared together with corresponding bulk soils. Root
samples were fractionated into episphere and endosphere com-
partments, enriching for microbes residing on the root surface or
inside roots, respectively (Figure S1B). We characterized the
multi-kingdommicrobial consortia along the soil-root continuum
by simultaneous DNA amplicon sequencing of the bacterial 16S
rRNA gene and fungal, as well as oomycetal, internal transcribed
spacer (ITS) regions (Agler et al., 2016) (Table S2). Alpha diversity
indices (within-sample diversity) indicated a gradual decrease of
microbial diversity from bulk soil to the root endosphere (Krus-
kal-Wallis test, p < 0.01; Figure S1C). Profiles of microbial class
abundance between sample types (Figure 1A) and operational
taxonomic unit (OTU) enrichment tests conducted using a linear
model between soil, root episphere, and root endosphere sam-
ples (p < 0.05; Figure 1B) identified 96 bacterial OTUs, 24 fungal
ember 1, 2018 ª 2018 The Authors. Published by Elsevier Inc. 973C-ND license (http://creativecommons.org/licenses/by-nc-nd/4.0/).
A B C
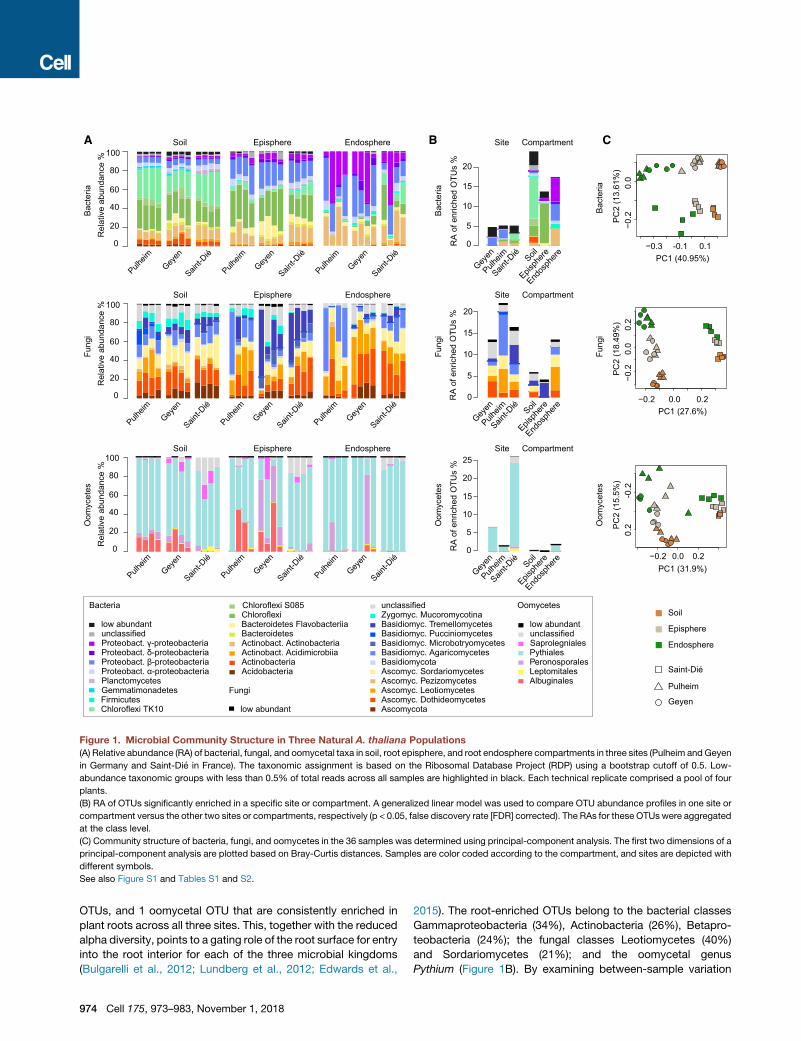
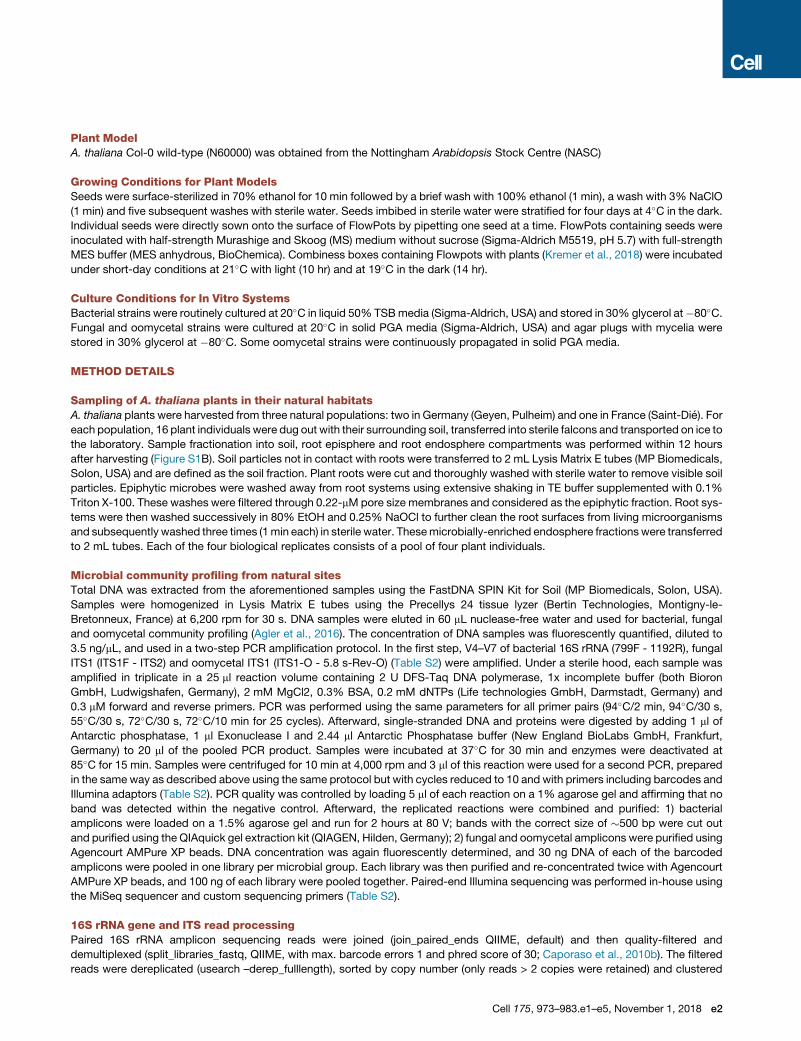
Figure 1. Microbial Community Structure in Three Natural A. thaliana Populations
(A) Relative abundance (RA) of bacterial, fungal, and oomycetal taxa in soil, root episphere, and root endosphere compartments in three sites (Pulheim andGeyen
in Germany and Saint-Die in France). The taxonomic assignment is based on the Ribosomal Database Project (RDP) using a bootstrap cutoff of 0.5. Low-
abundance taxonomic groups with less than 0.5% of total reads across all samples are highlighted in black. Each technical replicate comprised a pool of four
plants.
(B) RA of OTUs significantly enriched in a specific site or compartment. A generalized linear model was used to compare OTU abundance profiles in one site or
compartment versus the other two sites or compartments, respectively (p < 0.05, false discovery rate [FDR] corrected). The RAs for these OTUs were aggregated
at the class level.
(C) Community structure of bacteria, fungi, and oomycetes in the 36 samples was determined using principal-component analysis. The first two dimensions of a
principal-component analysis are plotted based on Bray-Curtis distances. Samples are color coded according to the compartment, and sites are depicted with
different symbols.
See also Figure S1 and Tables S1 and S2.
OTUs, and 1 oomycetal OTU that are consistently enriched in
plant roots across all three sites. This, together with the reduced
alpha diversity, points to a gating role of the root surface for entry
into the root interior for each of the three microbial kingdoms
(Bulgarelli et al., 2012; Lundberg et al., 2012; Edwards et al.,
974 Cell 175, 973–983, November 1, 2018
2015). The root-enriched OTUs belong to the bacterial classes
Gammaproteobacteria (34%), Actinobacteria (26%), Betapro-
teobacteria (24%); the fungal classes Leotiomycetes (40%)
and Sordariomycetes (21%); and the oomycetal genus
Pythium (Figure 1B). By examining between-sample variation
A B D
C
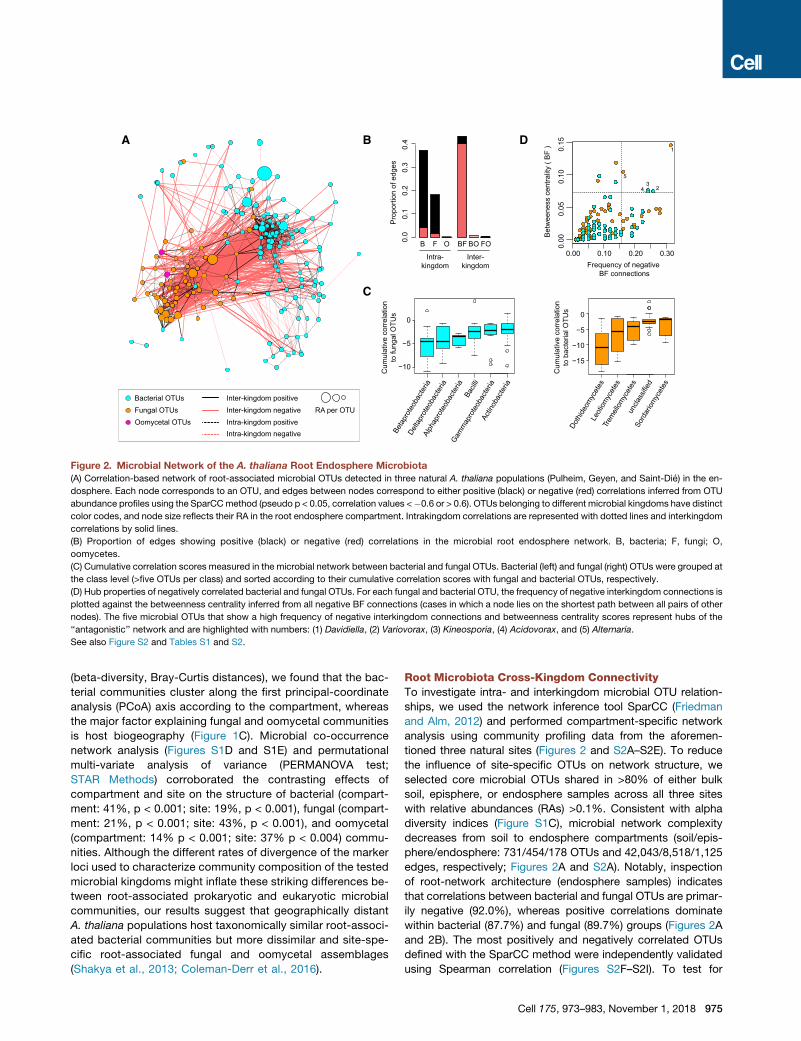
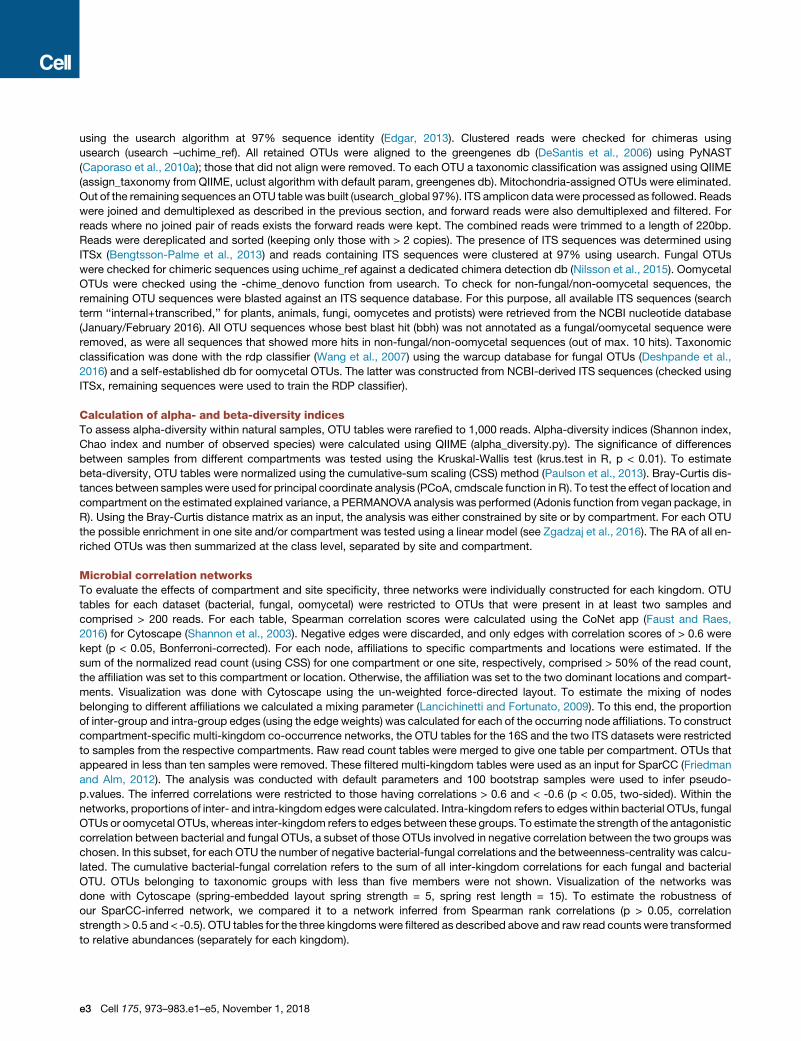
Figure 2. Microbial Network of the A. thaliana Root Endosphere Microbiota
(A) Correlation-based network of root-associated microbial OTUs detected in three natural A. thaliana populations (Pulheim, Geyen, and Saint-Die) in the en-
dosphere. Each node corresponds to an OTU, and edges between nodes correspond to either positive (black) or negative (red) correlations inferred from OTU
abundance profiles using the SparCCmethod (pseudo p < 0.05, correlation values <�0.6 or > 0.6). OTUs belonging to different microbial kingdoms have distinct
color codes, and node size reflects their RA in the root endosphere compartment. Intrakingdom correlations are represented with dotted lines and interkingdom
correlations by solid lines.
(B) Proportion of edges showing positive (black) or negative (red) correlations in the microbial root endosphere network. B, bacteria; F, fungi; O,
oomycetes.
(C) Cumulative correlation scores measured in the microbial network between bacterial and fungal OTUs. Bacterial (left) and fungal (right) OTUs were grouped at
the class level (>five OTUs per class) and sorted according to their cumulative correlation scores with fungal and bacterial OTUs, respectively.
(D) Hub properties of negatively correlated bacterial and fungal OTUs. For each fungal and bacterial OTU, the frequency of negative interkingdom connections is
plotted against the betweenness centrality inferred from all negative BF connections (cases in which a node lies on the shortest path between all pairs of other
nodes). The five microbial OTUs that show a high frequency of negative interkingdom connections and betweenness centrality scores represent hubs of the
‘‘antagonistic’’ network and are highlighted with numbers: (1) Davidiella, (2) Variovorax, (3) Kineosporia, (4) Acidovorax, and (5) Alternaria.
See also Figure S2 and Tables S1 and S2.
(beta-diversity, Bray-Curtis distances), we found that the bac-
terial communities cluster along the first principal-coordinate
analysis (PCoA) axis according to the compartment, whereas
the major factor explaining fungal and oomycetal communities
is host biogeography (Figure 1C). Microbial co-occurrence
network analysis (Figures S1D and S1E) and permutational
multi-variate analysis of variance (PERMANOVA test;
STAR Methods) corroborated the contrasting effects of
compartment and site on the structure of bacterial (compart-
ment: 41%, p < 0.001; site: 19%, p < 0.001), fungal (compart-
ment: 21%, p < 0.001; site: 43%, p < 0.001), and oomycetal
(compartment: 14% p < 0.001; site: 37% p < 0.004) commu-
nities. Although the different rates of divergence of the marker
loci used to characterize community composition of the tested
microbial kingdoms might inflate these striking differences be-
tween root-associated prokaryotic and eukaryotic microbial
communities, our results suggest that geographically distant
A. thaliana populations host taxonomically similar root-associ-
ated bacterial communities but more dissimilar and site-spe-
cific root-associated fungal and oomycetal assemblages
(Shakya et al., 2013; Coleman-Derr et al., 2016).
Root Microbiota Cross-Kingdom ConnectivityTo investigate intra- and interkingdom microbial OTU relation-
ships, we used the network inference tool SparCC (Friedman
and Alm, 2012) and performed compartment-specific network
analysis using community profiling data from the aforemen-
tioned three natural sites (Figures 2 and S2A–S2E). To reduce
the influence of site-specific OTUs on network structure, we
selected core microbial OTUs shared in >80% of either bulk
soil, episphere, or endosphere samples across all three sites
with relative abundances (RAs) >0.1%. Consistent with alpha
diversity indices (Figure S1C), microbial network complexity
decreases from soil to endosphere compartments (soil/epis-
phere/endosphere: 731/454/178 OTUs and 42,043/8,518/1,125
edges, respectively; Figures 2A and S2A). Notably, inspection
of root-network architecture (endosphere samples) indicates
that correlations between bacterial and fungal OTUs are primar-
ily negative (92.0%), whereas positive correlations dominate
within bacterial (87.7%) and fungal (89.7%) groups (Figures 2A
and 2B). The most positively and negatively correlated OTUs
defined with the SparCC method were independently validated
using Spearman correlation (Figures S2F–S2I). To test for
Cell 175, 973–983, November 1, 2018 975
potential phylogenetic signal(s) in the correlation network, we
calculated the strength of bacterial-fungal correlations for taxo-
nomic groups comprising at least five OTUs (Figure 2C). This
revealed that bacterial OTUs belonging to the classes Betapro-
teobacteria, Bacilli, and Deltaproteobacteria, as well as fungal
OTUs belonging to the classes Dothideomycetes, Leotiomy-
cetes, and Tremellomycetes, display the strongest negative
correlations with fungal and bacterial OTUs, respectively.
Further inspection of fungal and bacterial OTUs that display
the highest betweenness centrality scores and the highest nega-
tive cross-kingdom connection frequencies identified five OTUs
belonging to the fungal genera Davidiella and Alternaria and the
bacterial genera Variovorax, Kineosporia, and Acidovorax that
might represent keystone taxa driving fungal-bacterial balance
in A. thaliana roots (Figure 2D). Collectively, our network analysis
indicates strong negative correlations between several bacterial
and fungal taxa in plant roots.
Root-Derived Microbial Culture CollectionsTo test whether cross-kingdom microbe-microbe competition is
relevant along the soil-root continuum, we first deconstructed
the microbiota of A. thaliana roots by generating microbial
culture collections of root-associated bacteria, fungi, and oomy-
cetes. For bacteria, we used the recently established A. thaliana
root-derived bacterial culture collection, in which 54%–65% of
bacterial root-enriched OTUs have one or several isolates in
pure culture (Bai et al., 2015). To complement this collection,
we conducted a large-scale isolation of filamentous eukaryotic
microbes from the roots of 24 A. thaliana Col-0 individuals at
three developmental stages and A. thaliana relatives grown in
Cologne agricultural soil (CAS), the same soil that was used to
establish the root-derived bacterial culture collection (Bai et al.,
2015). Additionally, two to six plant individuals grown in the
Geyen, Pulheim, and Saint-Die natural sites were used for the
isolation of root-associated fungi and oomycetes. In total,
�12,000 surface-sterilized root segments (�5 mm each) were
placed on five agar-based growth media, resulting in the purifi-
cation of 202 filamentous eukaryotes (Table S3). Taxonomic
assignment based on Sanger sequencing of the fungal or oomy-
cetal ITS was successful for 176 isolates, of which 93% are fungi
and 7% oomycetes (Table S3). After elimination of potential
clonal duplicates, defined as microbes with 100% identical ITS
retrieved from plant roots grown in the same soil, the fungal cul-
ture collection comprises 69 isolates that belong mainly to the
classes Sordariomycetes (65%), Dothideomycetes (24%), and
Agaricomycetes (4%), whereas the oomycete collection con-
tains 11 isolates that exclusively belong to the genus Pythium
(Figures S3A and S3B). The results from our culture-dependent
approach resemble the taxonomic composition of root-associ-
ated fungal and oomycetal communities from natural
A. thaliana populations determined using culture-independent
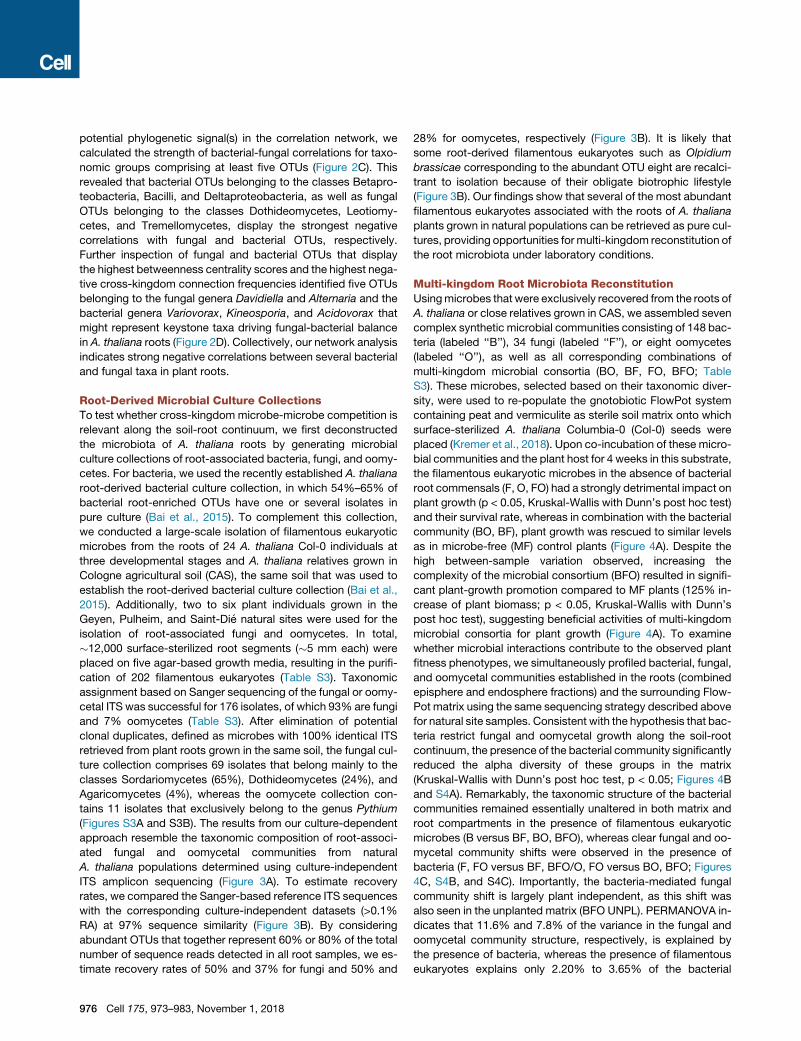
ITS amplicon sequencing (Figure 3A). To estimate recovery
rates, we compared the Sanger-based reference ITS sequences
with the corresponding culture-independent datasets (>0.1%
RA) at 97% sequence similarity (Figure 3B). By considering
abundant OTUs that together represent 60% or 80% of the total
number of sequence reads detected in all root samples, we es-
timate recovery rates of 50% and 37% for fungi and 50% and
976 Cell 175, 973–983, November 1, 2018
28% for oomycetes, respectively (Figure 3B). It is likely that
some root-derived filamentous eukaryotes such as Olpidium
brassicae corresponding to the abundant OTU eight are recalci-
trant to isolation because of their obligate biotrophic lifestyle
(Figure 3B). Our findings show that several of the most abundant
filamentous eukaryotes associated with the roots of A. thaliana
plants grown in natural populations can be retrieved as pure cul-
tures, providing opportunities formulti-kingdom reconstitution of
the root microbiota under laboratory conditions.
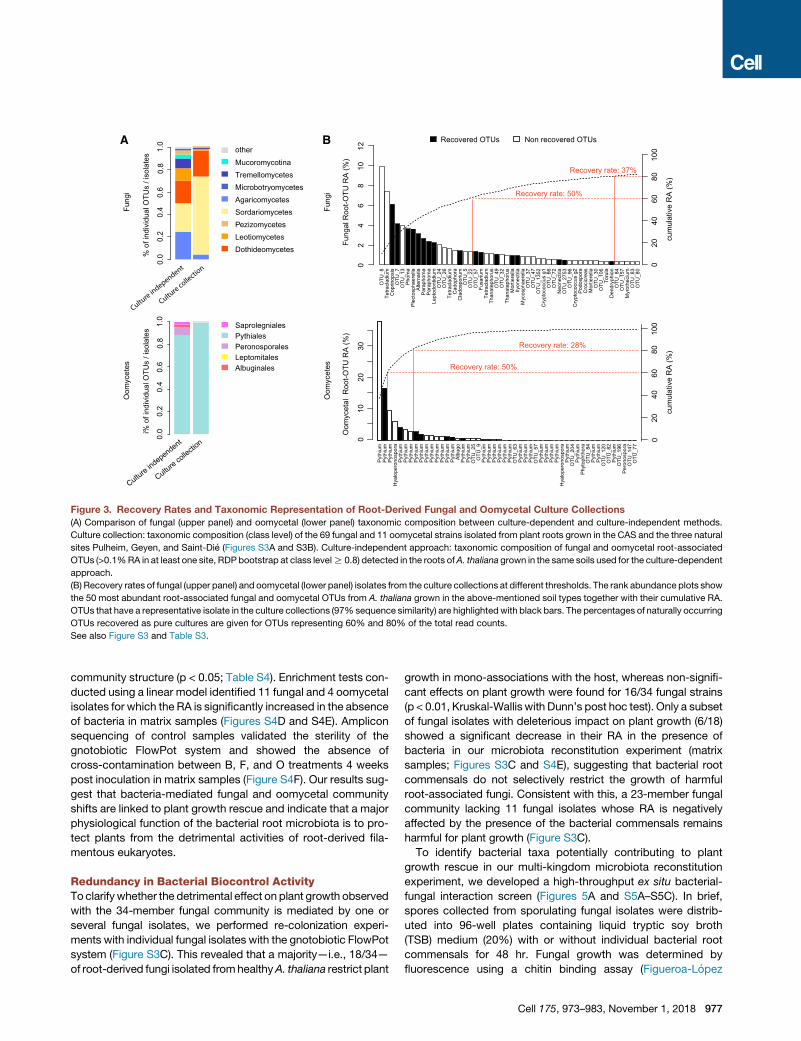
Multi-kingdom Root Microbiota ReconstitutionUsingmicrobes that were exclusively recovered from the roots of
A. thaliana or close relatives grown in CAS, we assembled seven
complex synthetic microbial communities consisting of 148 bac-
teria (labeled ‘‘B’’), 34 fungi (labeled ‘‘F’’), or eight oomycetes
(labeled ‘‘O’’), as well as all corresponding combinations of
multi-kingdom microbial consortia (BO, BF, FO, BFO; Table
S3). These microbes, selected based on their taxonomic diver-
sity, were used to re-populate the gnotobiotic FlowPot system
containing peat and vermiculite as sterile soil matrix onto which
surface-sterilized A. thaliana Columbia-0 (Col-0) seeds were
placed (Kremer et al., 2018). Upon co-incubation of these micro-
bial communities and the plant host for 4 weeks in this substrate,
the filamentous eukaryotic microbes in the absence of bacterial
root commensals (F, O, FO) had a strongly detrimental impact on
plant growth (p < 0.05, Kruskal-Wallis with Dunn’s post hoc test)
and their survival rate, whereas in combination with the bacterial
community (BO, BF), plant growth was rescued to similar levels
as in microbe-free (MF) control plants (Figure 4A). Despite the
high between-sample variation observed, increasing the
complexity of the microbial consortium (BFO) resulted in signifi-
cant plant-growth promotion compared to MF plants (125% in-
crease of plant biomass; p < 0.05, Kruskal-Wallis with Dunn’s
post hoc test), suggesting beneficial activities of multi-kingdom
microbial consortia for plant growth (Figure 4A). To examine
whether microbial interactions contribute to the observed plant
fitness phenotypes, we simultaneously profiled bacterial, fungal,
and oomycetal communities established in the roots (combined
episphere and endosphere fractions) and the surrounding Flow-
Pot matrix using the same sequencing strategy described above
for natural site samples. Consistent with the hypothesis that bac-
teria restrict fungal and oomycetal growth along the soil-root
continuum, the presence of the bacterial community significantly
reduced the alpha diversity of these groups in the matrix
(Kruskal-Wallis with Dunn’s post hoc test, p < 0.05; Figures 4B
and S4A). Remarkably, the taxonomic structure of the bacterial
communities remained essentially unaltered in both matrix and
root compartments in the presence of filamentous eukaryotic
microbes (B versus BF, BO, BFO), whereas clear fungal and oo-
mycetal community shifts were observed in the presence of
bacteria (F, FO versus BF, BFO/O, FO versus BO, BFO; Figures
4C, S4B, and S4C). Importantly, the bacteria-mediated fungal
community shift is largely plant independent, as this shift was
also seen in the unplanted matrix (BFO UNPL). PERMANOVA in-
dicates that 11.6% and 7.8% of the variance in the fungal and
oomycetal community structure, respectively, is explained by
the presence of bacteria, whereas the presence of filamentous
eukaryotes explains only 2.20% to 3.65% of the bacterial
A B
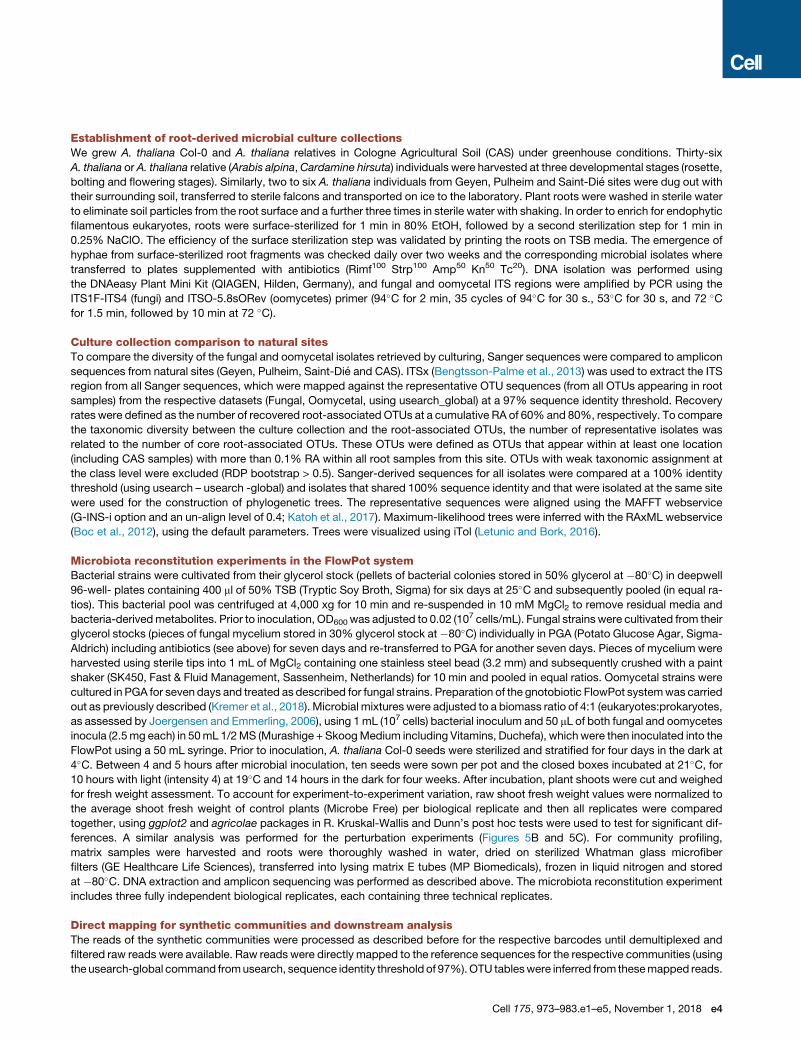
Figure 3. Recovery Rates and Taxonomic Representation of Root-Derived Fungal and Oomycetal Culture Collections
(A) Comparison of fungal (upper panel) and oomycetal (lower panel) taxonomic composition between culture-dependent and culture-independent methods.
Culture collection: taxonomic composition (class level) of the 69 fungal and 11 oomycetal strains isolated from plant roots grown in the CAS and the three natural
sites Pulheim, Geyen, and Saint-Die (Figures S3A and S3B). Culture-independent approach: taxonomic composition of fungal and oomycetal root-associated
OTUs (>0.1%RA in at least one site, RDP bootstrap at class levelR 0.8) detected in the roots ofA. thaliana grown in the same soils used for the culture-dependent
approach.
(B) Recovery rates of fungal (upper panel) and oomycetal (lower panel) isolates from the culture collections at different thresholds. The rank abundance plots show
the 50 most abundant root-associated fungal and oomycetal OTUs from A. thaliana grown in the above-mentioned soil types together with their cumulative RA.
OTUs that have a representative isolate in the culture collections (97% sequence similarity) are highlightedwith black bars. The percentages of naturally occurring
OTUs recovered as pure cultures are given for OTUs representing 60% and 80% of the total read counts.
See also Figure S3 and Table S3.
community structure (p < 0.05; Table S4). Enrichment tests con-
ducted using a linear model identified 11 fungal and 4 oomycetal
isolates for which the RA is significantly increased in the absence
of bacteria in matrix samples (Figures S4D and S4E). Amplicon
sequencing of control samples validated the sterility of the
gnotobiotic FlowPot system and showed the absence of
cross-contamination between B, F, and O treatments 4 weeks
post inoculation in matrix samples (Figure S4F). Our results sug-
gest that bacteria-mediated fungal and oomycetal community
shifts are linked to plant growth rescue and indicate that a major
physiological function of the bacterial root microbiota is to pro-
tect plants from the detrimental activities of root-derived fila-
mentous eukaryotes.
Redundancy in Bacterial Biocontrol ActivityTo clarifywhether the detrimental effect on plant growth observed
with the 34-member fungal community is mediated by one or
several fungal isolates, we performed re-colonization experi-
ments with individual fungal isolates with the gnotobiotic FlowPot
system (Figure S3C). This revealed that a majority—i.e., 18/34—
of root-derived fungi isolated fromhealthyA. thaliana restrict plant
growth in mono-associations with the host, whereas non-signifi-
cant effects on plant growth were found for 16/34 fungal strains
(p < 0.01, Kruskal-Wallis with Dunn’s post hoc test). Only a subset
of fungal isolates with deleterious impact on plant growth (6/18)
showed a significant decrease in their RA in the presence of
bacteria in our microbiota reconstitution experiment (matrix
samples; Figures S3C and S4E), suggesting that bacterial root
commensals do not selectively restrict the growth of harmful
root-associated fungi. Consistent with this, a 23-member fungal
community lacking 11 fungal isolates whose RA is negatively
affected by the presence of the bacterial commensals remains
harmful for plant growth (Figure S3C).
To identify bacterial taxa potentially contributing to plant
growth rescue in our multi-kingdom microbiota reconstitution
experiment, we developed a high-throughput ex situ bacterial-
fungal interaction screen (Figures 5A and S5A–S5C). In brief,
spores collected from sporulating fungal isolates were distrib-
uted into 96-well plates containing liquid tryptic soy broth
(TSB) medium (20%) with or without individual bacterial root
commensals for 48 hr. Fungal growth was determined by
fluorescence using a chitin binding assay (Figueroa-Lopez
Cell 175, 973–983, November 1, 2018 977
A B
C
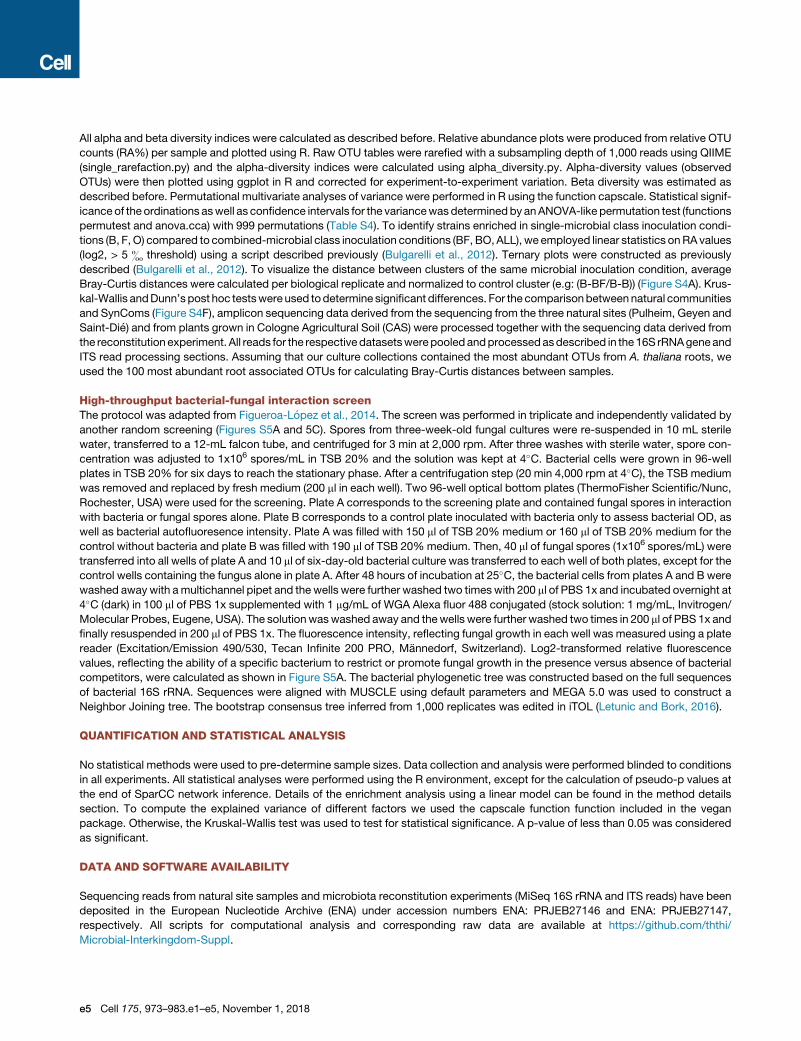
Figure 4. Multi-kingdom Reconstitution of the A. thaliana Root Microbiota(A) Recolonization of germ-free plants with root-derived bacterial (148), fungal (34), and oomycetal (8) isolates in the FlowPot system. Shoot fresh weight of four-
week-old A. thaliana Col-0 inoculated with bacteria (‘‘B’’), fungi (‘‘F’’); oomycetes (‘‘O’’); bacteria and oomycetes (‘‘BO’’); bacteria and fungi (‘‘BF’’); fungi and
oomycetes (‘‘FO’’); and bacteria, fungi, and oomycetes (‘‘BFO’’). MF, microbe-free/control. Shoot fresh weight values were normalized to MF. Significant dif-
ferences are depicted with letters (p < 0.05, Kruskal-Wallis with Dunn’s post hoc test). Survival rate values represent the percentage of germinated plants that
survived. Data are from three biological replicates (represented by different shapes) with three technical replicates each.
(B) Observed species per microbial group in matrix samples for each of the above-mentioned inoculations (p < 0.05, Kruskal Wallis with Dunn’s post hoc test).
Input, initial microbial inoculum; UNPL, unplanted matrix.
(C) RAs of microbial isolates in initial input and output matrix and root samples after 4 weeks. Taxonomic assignment is shown at the phylum level for bacteria and
at the species level for fungi and oomycetes. Numbers in brackets refer to bacterial, fungal, and oomycetal strains specifically enriched inmatrix samples in either
B, BF, or BFO conditions; F, BF, or BFO conditions; or O, BO, or BFO conditions, as depicted in Figure S4E.
See also Figure S4 and Tables S2, S3, and S4.
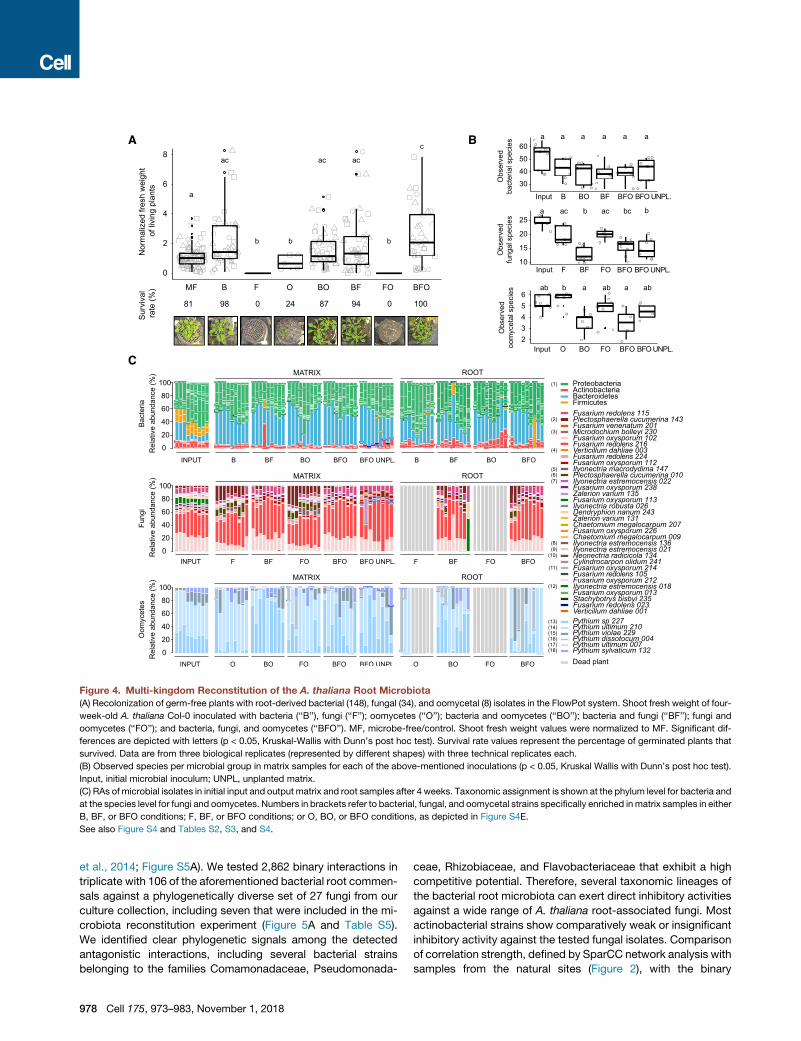
et al., 2014; Figure S5A). We tested 2,862 binary interactions in
triplicate with 106 of the aforementioned bacterial root commen-
sals against a phylogenetically diverse set of 27 fungi from our
culture collection, including seven that were included in the mi-
crobiota reconstitution experiment (Figure 5A and Table S5).
We identified clear phylogenetic signals among the detected
antagonistic interactions, including several bacterial strains
belonging to the families Comamonadaceae, Pseudomonada-
978 Cell 175, 973–983, November 1, 2018
ceae, Rhizobiaceae, and Flavobacteriaceae that exhibit a high
competitive potential. Therefore, several taxonomic lineages of
the bacterial root microbiota can exert direct inhibitory activities
against a wide range of A. thaliana root-associated fungi. Most
actinobacterial strains show comparatively weak or insignificant
inhibitory activity against the tested fungal isolates. Comparison
of correlation strength, defined by SparCC network analysis with
samples from the natural sites (Figure 2), with the binary
A
B C
(legend on next page)
Cell 175, 973–983, November 1, 2018 979
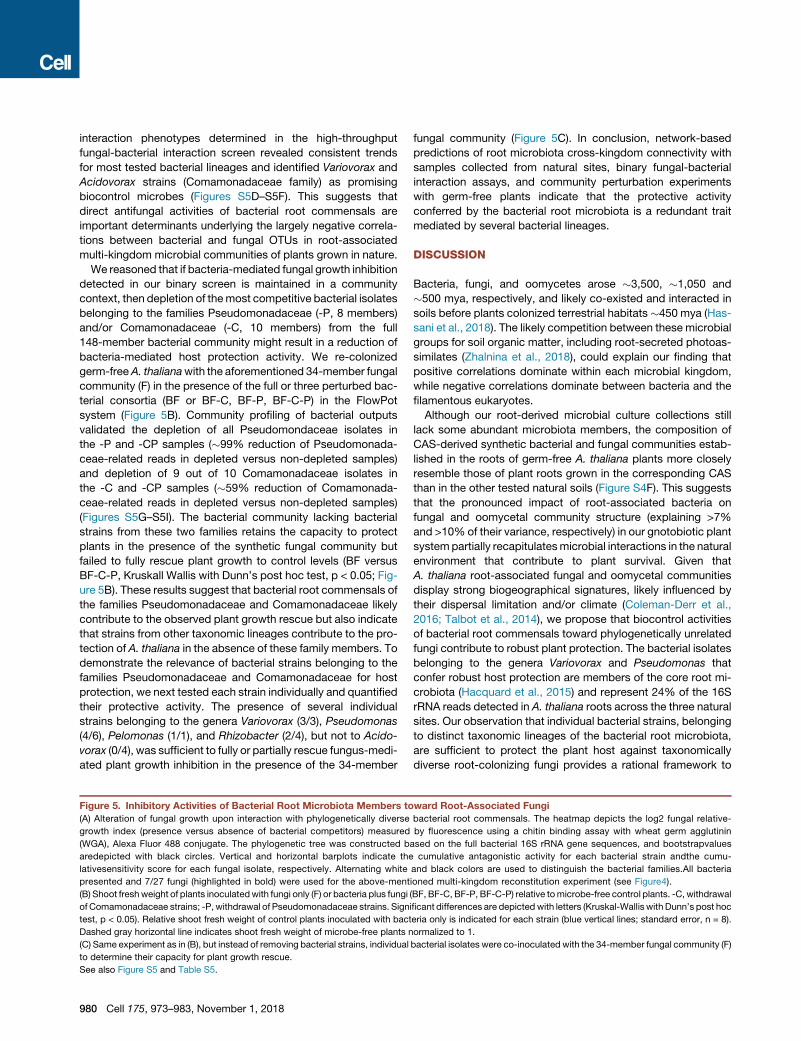
interaction phenotypes determined in the high-throughput
fungal-bacterial interaction screen revealed consistent trends
for most tested bacterial lineages and identified Variovorax and
Acidovorax strains (Comamonadaceae family) as promising
biocontrol microbes (Figures S5D–S5F). This suggests that
direct antifungal activities of bacterial root commensals are
important determinants underlying the largely negative correla-
tions between bacterial and fungal OTUs in root-associated
multi-kingdom microbial communities of plants grown in nature.
We reasoned that if bacteria-mediated fungal growth inhibition
detected in our binary screen is maintained in a community
context, then depletion of themost competitive bacterial isolates
belonging to the families Pseudomonadaceae (-P, 8 members)
and/or Comamonadaceae (-C, 10 members) from the full
148-member bacterial community might result in a reduction of
bacteria-mediated host protection activity. We re-colonized
germ-freeA. thalianawith the aforementioned 34-member fungal
community (F) in the presence of the full or three perturbed bac-
terial consortia (BF or BF-C, BF-P, BF-C-P) in the FlowPot
system (Figure 5B). Community profiling of bacterial outputs
validated the depletion of all Pseudomondaceae isolates in
the -P and -CP samples (�99% reduction of Pseudomonada-
ceae-related reads in depleted versus non-depleted samples)
and depletion of 9 out of 10 Comamonadaceae isolates in
the -C and -CP samples (�59% reduction of Comamonada-
ceae-related reads in depleted versus non-depleted samples)
(Figures S5G–S5I). The bacterial community lacking bacterial
strains from these two families retains the capacity to protect
plants in the presence of the synthetic fungal community but
failed to fully rescue plant growth to control levels (BF versus
BF-C-P, Kruskall Wallis with Dunn’s post hoc test, p < 0.05; Fig-
ure 5B). These results suggest that bacterial root commensals of
the families Pseudomonadaceae and Comamonadaceae likely
contribute to the observed plant growth rescue but also indicate
that strains from other taxonomic lineages contribute to the pro-
tection of A. thaliana in the absence of these family members. To
demonstrate the relevance of bacterial strains belonging to the
families Pseudomonadaceae and Comamonadaceae for host
protection, we next tested each strain individually and quantified
their protective activity. The presence of several individual
strains belonging to the genera Variovorax (3/3), Pseudomonas
(4/6), Pelomonas (1/1), and Rhizobacter (2/4), but not to Acido-
vorax (0/4), was sufficient to fully or partially rescue fungus-medi-
ated plant growth inhibition in the presence of the 34-member
Figure 5. Inhibitory Activities of Bacterial Root Microbiota Members to
(A) Alteration of fungal growth upon interaction with phylogenetically diverse
growth index (presence versus absence of bacterial competitors) measured
(WGA), Alexa Fluor 488 conjugate. The phylogenetic tree was constructed b
aredepicted with black circles. Vertical and horizontal barplots indicate the
lativesensitivity score for each fungal isolate, respectively. Alternating white
presented and 7/27 fungi (highlighted in bold) were used for the above-ment
(B) Shoot freshweight of plants inoculatedwith fungi only (F) or bacteria plus fungi (
of Comamonadaceae strains; -P, withdrawal of Pseudomonadaceae strains. Signi
test, p < 0.05). Relative shoot fresh weight of control plants inoculated with bact
Dashed gray horizontal line indicates shoot fresh weight of microbe-free plants n
(C) Same experiment as in (B), but instead of removing bacterial strains, individual
to determine their capacity for plant growth rescue.
See also Figure S5 and Table S5.
980 Cell 175, 973–983, November 1, 2018
fungal community (Figure 5C). In conclusion, network-based
predictions of root microbiota cross-kingdom connectivity with
samples collected from natural sites, binary fungal-bacterial
interaction assays, and community perturbation experiments
with germ-free plants indicate that the protective activity
conferred by the bacterial root microbiota is a redundant trait
mediated by several bacterial lineages.
DISCUSSION
Bacteria, fungi, and oomycetes arose �3,500, �1,050 and
�500 mya, respectively, and likely co-existed and interacted in
soils before plants colonized terrestrial habitats �450 mya (Has-
sani et al., 2018). The likely competition between these microbial
groups for soil organic matter, including root-secreted photoas-
similates (Zhalnina et al., 2018), could explain our finding that
positive correlations dominate within each microbial kingdom,
while negative correlations dominate between bacteria and the
filamentous eukaryotes.
Although our root-derived microbial culture collections still
lack some abundant microbiota members, the composition of
CAS-derived synthetic bacterial and fungal communities estab-
lished in the roots of germ-free A. thaliana plants more closely
resemble those of plant roots grown in the corresponding CAS
than in the other tested natural soils (Figure S4F). This suggests
that the pronounced impact of root-associated bacteria on
fungal and oomycetal community structure (explaining >7%
and >10% of their variance, respectively) in our gnotobiotic plant
systempartially recapitulatesmicrobial interactions in the natural
environment that contribute to plant survival. Given that
A. thaliana root-associated fungal and oomycetal communities
display strong biogeographical signatures, likely influenced by
their dispersal limitation and/or climate (Coleman-Derr et al.,
2016; Talbot et al., 2014), we propose that biocontrol activities
of bacterial root commensals toward phylogenetically unrelated
fungi contribute to robust plant protection. The bacterial isolates
belonging to the genera Variovorax and Pseudomonas that
confer robust host protection are members of the core root mi-
crobiota (Hacquard et al., 2015) and represent 24% of the 16S
rRNA reads detected in A. thaliana roots across the three natural
sites. Our observation that individual bacterial strains, belonging
to distinct taxonomic lineages of the bacterial root microbiota,
are sufficient to protect the plant host against taxonomically
diverse root-colonizing fungi provides a rational framework to
ward Root-Associated Fungi
bacterial root commensals. The heatmap depicts the log2 fungal relative-
by fluorescence using a chitin binding assay with wheat germ agglutinin
ased on the full bacterial 16S rRNA gene sequences, and bootstrapvalues
cumulative antagonistic activity for each bacterial strain andthe cumu-
and black colors are used to distinguish the bacterial families.All bacteria
ioned multi-kingdom reconstitution experiment (see Figure4).
BF, BF-C, BF-P, BF-C-P) relative tomicrobe-free control plants. -C, withdrawal
ficant differences are depicted with letters (Kruskal-Wallis with Dunn’s post hoc
eria only is indicated for each strain (blue vertical lines; standard error, n = 8).
ormalized to 1.
bacterial isolates were co-inoculated with the 34-member fungal community (F)
explain at least part of the activity of biocontrol bacteria used in
field applications in agricultural contexts.
The observation that bacteria-mediated fungal and oomyce-
tal community shifts occur in the absence of the plant implies
that host-derived cues are dispensable for the antagonistic
activity phenotype (Figure 5C). Given that all tested microbes
were isolated from plant roots, it is likely that direct microbial
competition, detected in the matrix between root-associated
microbes, reflects interkingdom microbial competition taking
place in plant roots. This might explain why in the microbiota
reconstitution system inoculation with the bacteria altered
fungal and oomycetal community profiles similarly in matrix
and root samples (Figure 4C). The lack of comprehensive micro-
bial culture collections from unplanted soil did not allow us to
test whether the bacterial root microbiota, which is horizontally
acquired from a small fraction of the bacterial soil biome
(Bulgarelli et al., 2012; Lundberg et al., 2012), is enriched for
members that restrict root colonization by filamentous eukary-
otes. However, this hypothesis is indirectly supported by our
network-based microbial interkingdom analysis, in which the
ratio of negative to positive correlations between prokaryotic
and filamentous eukaryotic microbes shifted from 4:1 in the
soil network to 12:1 in the root endosphere network (Figures
2B and S2C). Taken together, these results suggest that the
detected microbial interkingdom interactions take place at the
soil-root interface during microbiota establishment and are
maintained inside plant roots.
Given that all bacterial, fungal, and oomycetal strains used in
our study were isolated from roots of healthy A. thaliana plants,
the contrasting effects of synthetic communities comprising
bacteria and filamentous eukaryotes on plant health are surpris-
ing. Loss of mycorrhiza symbiosis in A. thaliana or relatives
appears to have been partly compensated by associations
with other beneficial fungal root endophytes (Almario et al.,
2017; Hiruma et al., 2016; Hacquard et al., 2016). Our data
show that roots of A. thaliana in their natural habitats host a
rich diversity of filamentous eukaryotes, dominated by Ascomy-
cetes, but also demonstrate that in the absence of bacterial
competitors, consortia of filamentous root-derived eukaryotes
(F, O, FO) have chiefly detrimental activities on plant health
and survival. Strikingly, >50% of the fungal isolates restrict plant
growth in mono-associations with the plant host. This is consis-
tent with earlier reports (Keim et al., 2014; Kia et al., 2017) and
suggests that numerous A. thaliana root-associated fungi and
oomycetes cannot be kept at bay by the plant innate immune
system alone. However, re-colonization of A. thaliana with the
most complex multi-kingdom microbial consortium (BFO) re-
sulted in maximal plant growth and survival in our gnotobiotic
plant system. Thus, we propose that mutual selective pressures,
acting on the plant host and its associated microbial assem-
blage, have, over evolutionary timescales, favored interkingdom
microbe-microbe interactions rather than associations with a
single microbial class.
STAR+METHODS
Detailed methods are provided in the online version of this paper
and include the following:
d KEY RESOURCES TABLE
d CONTACT FOR REAGENT AND RESOURCE SHARING
d EXPERIMENTAL MODEL AND SUBJECT DETAILS
B Microbial Strains
B Plant Model
B Growing Conditions for Plant Models
B Culture Conditions for In Vitro Systems
d METHOD DETAILS
B Sampling of A. thaliana plants in their natural habitats
B Microbial community profiling from natural sites
B 16S rRNA gene and ITS read processing
B Calculation of alpha- and beta-diversity indices
B Microbial correlation networks
B Establishment of root-derived microbial culture
collections
B Culture collection comparison to natural sites
B Microbiota reconstitution experiments in the FlowPot
system
B Direct mapping for synthetic communities and down-
stream analysis
B High-throughput bacterial-fungal interaction screen
d QUANTIFICATION AND STATISTICAL ANALYSIS
d DATA AND SOFTWARE AVAILABILITY
SUPPLEMENTAL INFORMATION
Supplemental Information includes five figures and five tables and can be
found with this article online at https://doi.org/10.1016/j.cell.2018.10.020.
ACKNOWLEDGMENTS
We thank J. Kremer and S.Y. He for sharing the FlowPot utilization protocol
before publication. We thank Neysan Donnelly for scientific English editing.
This work was supported by funds to S.H. from a European Research Council
starting grant (MICRORULES) and funds to P.S.-L. from the Max Planck Soci-
ety, a European Research Council advanced grant (ROOTMICROBIOTA), and
the ‘‘Cluster of Excellence on Plant Sciences’’ program funded by the Deut-
sche Forschungsgemeinschaft.
AUTHOR CONTRIBUTIONS
S.H. and P.S.-L. initiated, coordinated, and supervised the project. S.H. and
P.D. collected root material and performed culture-independent community
profiling. S.H. isolated root-associated fungi and oomycetes. T.T. analyzed
culture-independent 16S rRNA and ITS amplicon sequencing data. R.G.-O.
contributed to bioinformatics tools. M.A. and E.K. identified A. thaliana popu-
lations. P.D. performed all microbiota reconstitution experiments in the Flow-
Pot system. T.T. and P.D. analyzed the recolonization data. S.H. developed,
performed, and analyzed the high-throughput bacterial-fungal interaction
screen. P.D., T.T., P.S.-L., and S.H. wrote the manuscript.
DECLARATION OF INTERESTS
P.S.-L. is a co-founder and scientific advisor of AgBiome, Raleigh, NC, USA.
All other authors declare no competing interests.
Received: June 18, 2018
Revised: August 3, 2018
Accepted: October 2, 2018
Published: November 1, 2018
Cell 175, 973–983, November 1, 2018 981

REFERENCES
Agler, M.T., Ruhe, J., Kroll, S., Morhenn, C., Kim, S.T., Weigel, D., and Kemen,
E.M. (2016). Microbial Hub Taxa Link Host and Abiotic Factors to Plant Micro-
biome Variation. PLoS Biol. 14, e1002352.
Almario, J., Jeena, G., Wunder, J., Langen, G., Zuccaro, A., Coupland, G., and
Bucher, M. (2017). Root-associated fungal microbiota of nonmycorrhizal
Arabis alpina and its contribution to plant phosphorus nutrition. Proc. Natl.
Acad. Sci. USA 114, E9403–E9412.
Bai, Y., Muller, D.B., Srinivas, G., Garrido-Oter, R., Potthoff, E., Rott, M., Dom-
browski, N., Munch, P.C., Spaepen, S., Remus-Emsermann, M., et al. (2015).
Functional overlap of the Arabidopsis leaf and root microbiota. Nature 528,
364–369.
Bengtsson-Palme, J., Ryberg, M., Hartmann, M., Branco, S., Wang, Z.,
Godhe, A., De Wit, P., Sanchez-Garcia, M., Ebersberger, I., de Sousa, F.,
et al. (2013). Improved software detection and extraction of ITS1 and ITS2
from ribosomal ITS sequences of fungi and other eukaryotes for analysis of
environmental sequencing data. Methods Ecol. Evol. 4, 914–919.
Boc, A., Diallo, A.B., and Makarenkov, V. (2012). T-REX: a web server for infer-
ring, validating and visualizing phylogenetic trees and networks. Nucleic Acids
Res. 40, W573–W579.
Bulgarelli, D., Rott, M., Schlaeppi, K., Ver Loren van Themaat, E., Ahmadine-
jad, N., Assenza, F., Rauf, P., Huettel, B., Reinhardt, R., Schmelzer, E., et al.
(2012). Revealing structure and assembly cues for Arabidopsis root-inhabiting
bacterial microbiota. Nature 488, 91–95.
Caporaso, J.G., Bittinger, K., Bushman, F.D., DeSantis, T.Z., Andersen, G.L.,
and Knight, R. (2010a). PyNAST: a flexible tool for aligning sequences to a tem-
plate alignment. Bioinformatics 26, 266–267.
Caporaso, J.G., Kuczynski, J., Stombaugh, J., Bittinger, K., Bushman, F.D.,
Costello, E.K., Fierer, N., Pena, A.G., Goodrich, J.K., Gordon, J.I., et al.
(2010b). QIIME allows analysis of high-throughput community sequencing
data. Nat. Methods 7, 335–336.
Castrillo, G., Teixeira, P.J., Paredes, S.H., Law, T.F., de Lorenzo, L., Feltcher,
M.E., Finkel, O.M., Breakfield, N.W., Mieczkowski, P., Jones, C.D., et al.
(2017). Root microbiota drive direct integration of phosphate stress and immu-
nity. Nature 543, 513–518.
Coleman-Derr, D., Desgarennes, D., Fonseca-Garcia, C., Gross, S., Clingen-
peel, S., Woyke, T., North, G., Visel, A., Partida-Martinez, L.P., and Tringe,
S.G. (2016). Plant compartment and biogeography affect microbiome compo-
sition in cultivated and native Agave species. New Phytol. 209, 798–811.
DeSantis, T.Z., Hugenholtz, P., Larsen, N., Rojas, M., Brodie, E.L., Keller, K.,
Huber, T., Dalevi, D., Hu, P., and Andersen, G.L. (2006). Greengenes, a
chimera-checked 16S rRNA gene database and workbench compatible with
ARB. Appl. Environ. Microbiol. 72, 5069–5072.
Deshpande, V., Wang, Q., Greenfield, P., Charleston, M., Porras-Alfaro, A.,
Kuske, C.R., Cole, J.R., Midgley, D.J., and Tran-Dinh, N. (2016). Fungal iden-
tification using a Bayesian classifier and the Warcup training set of internal
transcribed spacer sequences. Mycologia 108, 1–5.
Edgar, R.C. (2013). UPARSE: highly accurate OTU sequences from microbial
amplicon reads. Nat. Methods 10, 996–998.
Edwards, J., Johnson, C., Santos-Medellın, C., Lurie, E., Podishetty, N.K.,
Bhatnagar, S., Eisen, J.A., and Sundaresan, V. (2015). Structure, variation,
and assembly of the root-associated microbiomes of rice. Proc. Natl. Acad.
Sci. USA 112, E911–E920.
Faust, K., and Raes, J. (2016). CoNet app: inference of biological association
networks using Cytoscape. F1000Res. 5, 1519.
Figueroa-Lopez, A.M., Cordero-Ramırez, J.D., Quiroz-Figueroa, F.R., and
Maldonado-Mendoza, I.E. (2014). A high-throughput screening assay to
identify bacterial antagonists against Fusarium verticillioides. J. Basic Micro-
biol. 54 (Suppl 1 ), S125–S133.
Friedman, J., and Alm, E.J. (2012). Inferring correlation networks from genomic
survey data. PLoS Comput. Biol. 8, e1002687.
982 Cell 175, 973–983, November 1, 2018
Garbaye, J. (1994). Helper Bacteria - a New Dimension to the Mycorrhizal
Symbiosis. New Phytol. 128, 197–210.
Hacquard, S., Garrido-Oter, R., Gonzalez, A., Spaepen, S., Ackermann, G.,
Lebeis, S., McHardy, A.C., Dangl, J.L., Knight, R., Ley, R., and Schulze-Lefert,
P. (2015). Microbiota and Host Nutrition across Plant and Animal Kingdoms.
Cell Host Microbe 17, 603–616.
Hacquard, S., Kracher, B., Hiruma, K., Munch, P.C., Garrido-Oter, R., Thon,
M.R., Weimann, A., Damm, U., Dallery, J.F., Hainaut, M., et al. (2016). Survival
trade-offs in plant roots during colonization by closely related beneficial and
pathogenic fungi. Nat. Commun. 7, 11362.
Hassani, M.A., Duran, P., and Hacquard, S. (2018). Microbial interactions
within the plant holobiont. Microbiome 6, 58.
Hiruma, K., Gerlach, N., Sacristan, S., Nakano, R.T., Hacquard, S., Kracher, B.,
Neumann, U., Ramırez, D., Bucher, M., O’Connell, R.J., and Schulze-Lefert, P.
(2016). Root Endophyte Colletotrichum tofieldiae Confers Plant Fitness Bene-
fits that Are Phosphate Status Dependent. Cell 165, 464–474.
Joergensen, R.G., and Emmerling, C. (2006). Methods for evaluating human
impact on soil microorganisms based on their activity, biomass, and diversity
in agricultural soils. J. Plant Nutr. Soil Sci. 169, 295–309.
Katoh, K., Rozewicki, J., and Yamada, K.D. (2017). MAFFT online service: mul-
tiple sequence alignment, interactive sequence choice and visualization. Brief.
Bioinform. https://doi.org/10.1093/bib/bbx108.
Keim, J., Mishra, B., Sharma, R., Ploch, S., and Thines, M. (2014). Root-asso-
ciated fungi of Arabidopsis thaliana and Microthlaspi perfoliatum. Fungal
Divers. 66, 99–111.
Kia, S.H., Glynou, K., Nau, T., Thines, M., Piepenbring, M., and Macia-Vicente,
J.G. (2017). Influence of phylogenetic conservatism and trait convergence on
the interactions between fungal root endophytes and plants. ISME J. 11,
777–790.
Kremer, J.M., Paasch, B.C., Rhodes, D., Thireault, C., Froehlich, J.E., Schulze-
Lefert, P., Tiedje, J.M., and He, S.Y. (2018). FlowPot axenic plant growth
system for microbiota research. bioRxiv. https://doi.org/10.1101/254953.
Lancichinetti, A., and Fortunato, S. (2009). Community detection algorithms: a
comparative analysis. Phys. Rev. E Stat. Nonlin. Soft Matter Phys. 80, 056117.
Lebeis, S.L., Paredes, S.H., Lundberg, D.S., Breakfield, N., Gehring, J.,
McDonald, M., Malfatti, S., Glavina del Rio, T., Jones, C.D., Tringe, S.G.,
and Dangl, J.L. (2015). PLANT MICROBIOME. Salicylic acid modulates colo-
nization of the root microbiome by specific bacterial taxa. Science 349,
860–864.
Letunic, I., and Bork, P. (2016). Interactive tree of life (iTOL) v3: an online tool for
the display and annotation of phylogenetic and other trees. Nucleic Acids Res.
44 (W1), W242–W245.
Lundberg, D.S., Lebeis, S.L., Paredes, S.H., Yourstone, S., Gehring, J., Mal-
fatti, S., Tremblay, J., Engelbrektson, A., Kunin, V., Del Rio, T.G., et al.
(2012). Defining the core Arabidopsis thaliana root microbiome. Nature
488, 86–90.
Nilsson, R.H., Tedersoo, L., Ryberg, M., Kristiansson, E., Hartmann, M., Unter-
seher, M., Porter, T.M., Bengtsson-Palme, J., Walker, D.M., de Sousa, F., et al.
(2015). A Comprehensive, Automatically Updated Fungal ITS Sequence Data-
set for Reference-Based Chimera Control in Environmental Sequencing Ef-
forts. Microbes Environ. 30, 145–150.
Paulson, J.N., Stine, O.C., Bravo, H.C., and Pop, M. (2013). Differential
abundance analysis for microbial marker-gene surveys. Nat. Methods 10,
1200–1202.
Ruggiero, M.A., Gordon, D.P., Orrell, T.M., Bailly, N., Bourgoin, T., Brusca,
R.C., Cavalier-Smith, T., Guiry, M.D., and Kirk, P.M. (2015). A higher level clas-
sification of all living organisms. PLoS ONE 10, e0119248.
Santhanam, R., Luu, V.T., Weinhold, A., Goldberg, J., Oh, Y., and Baldwin, I.T.
(2015). Native root-associated bacteria rescue a plant from a sudden-wilt
disease that emerged during continuous cropping. Proc. Natl. Acad. Sci.
USA 112, E5013–E5020.
Shakya, M., Gottel, N., Castro, H., Yang, Z.K., Gunter, L., Labbe, J., Muchero,
W., Bonito, G., Vilgalys, R., Tuskan, G., et al. (2013). A multifactor analysis of
fungal and bacterial community structure in the root microbiome of mature
Populus deltoides trees. PLoS ONE 8, e76382.
Shannon, P., Markiel, A., Ozier, O., Baliga, N.S., Wang, J.T., Ramage, D., Amin,
N., Schwikowski, B., and Ideker, T. (2003). Cytoscape: a software environment
for integrated models of biomolecular interaction networks. Genome Res. 13,
2498–2504.
Talbot, J.M., Bruns, T.D., Taylor, J.W., Smith, D.P., Branco, S., Glassman, S.I.,
Erlandson, S., Vilgalys, R., Liao, H.L., Smith, M.E., and Peay, K.G. (2014).
Endemism and functional convergence across the North American soil myco-
biome. Proc. Natl. Acad. Sci. USA 111, 6341–6346.
van der Heijden, M.G., de Bruin, S., Luckerhoff, L., van Logtestijn, R.S., and
Schlaeppi, K. (2016). A widespread plant-fungal-bacterial symbiosis promotes
plant biodiversity, plant nutrition and seedling recruitment. ISME J. 10,
389–399.
Wang, Q., Garrity, G.M., Tiedje, J.M., and Cole, J.R. (2007). Naive Bayesian
classifier for rapid assignment of rRNA sequences into the new bacterial tax-
onomy. Appl. Environ. Microbiol. 73, 5261–5267.
Zgadzaj, R., Garrido-Oter, R., Jensen, D.B., Koprivova, A., Schulze-Lefert, P.,
and Radutoiu, S. (2016). Root nodule symbiosis in Lotus japonicus drives the
establishment of distinctive rhizosphere, root, and nodule bacterial commu-
nities. Proc. Natl. Acad. Sci. USA 113, E7996–E8005.
Zhalnina, K., Louie, K.B., Hao, Z., Mansoori, N., da Rocha, U.N., Shi, S., Cho,
H., Karaoz, U., Loque, D., Bowen, B.P., et al. (2018). Dynamic root exudate
chemistry and microbial substrate preferences drive patterns in rhizosphere
microbial community assembly. Nat. Microbiol. 3, 470–480.
Cell 175, 973–983, November 1, 2018 983
STAR+METHODS
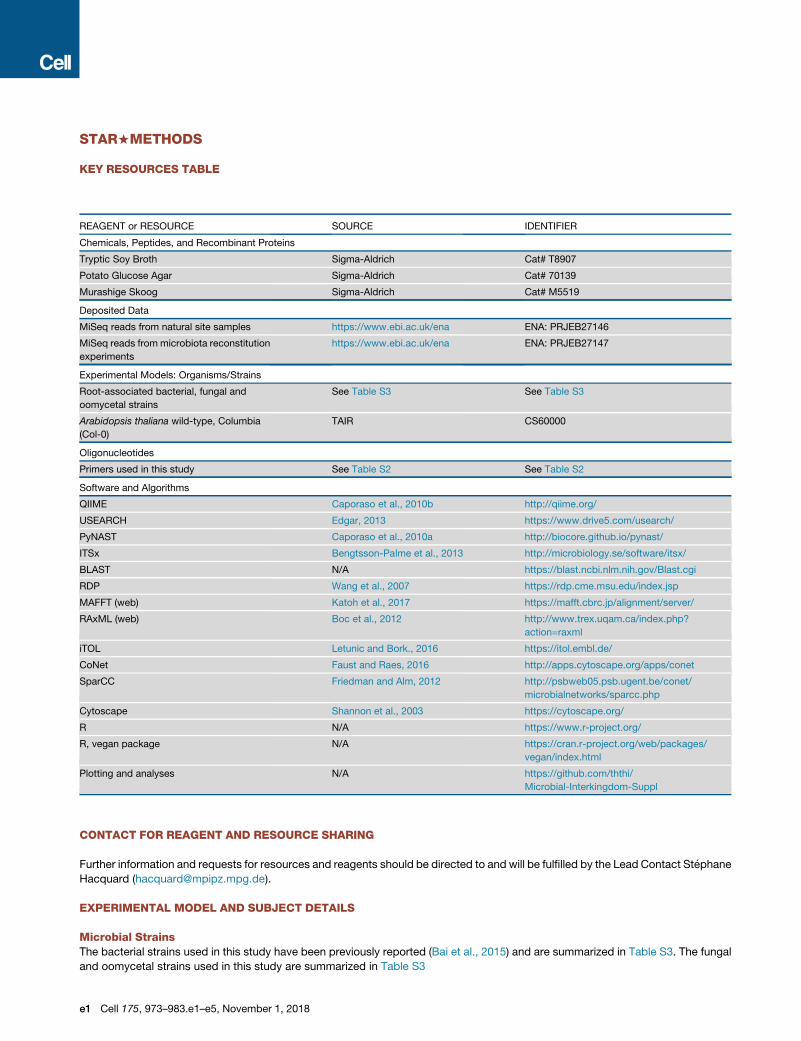
KEY RESOURCES TABLE
REAGENT or RESOURCE SOURCE IDENTIFIER
Chemicals, Peptides, and Recombinant Proteins
Tryptic Soy Broth Sigma-Aldrich Cat# T8907
Potato Glucose Agar Sigma-Aldrich Cat# 70139
Murashige Skoog Sigma-Aldrich Cat# M5519
Deposited Data
MiSeq reads from natural site samples https://www.ebi.ac.uk/ena ENA: PRJEB27146
MiSeq reads frommicrobiota reconstitution
experiments
https://www.ebi.ac.uk/ena ENA: PRJEB27147
Experimental Models: Organisms/Strains
Root-associated bacterial, fungal and
oomycetal strains
See Table S3 See Table S3
Arabidopsis thaliana wild-type, Columbia
(Col-0)
TAIR CS60000
Oligonucleotides
Primers used in this study See Table S2 See Table S2
Software and Algorithms
QIIME Caporaso et al., 2010b http://qiime.org/
USEARCH Edgar, 2013 https://www.drive5.com/usearch/
PyNAST Caporaso et al., 2010a http://biocore.github.io/pynast/
ITSx Bengtsson-Palme et al., 2013 http://microbiology.se/software/itsx/
BLAST N/A https://blast.ncbi.nlm.nih.gov/Blast.cgi
RDP Wang et al., 2007 https://rdp.cme.msu.edu/index.jsp
MAFFT (web) Katoh et al., 2017 https://mafft.cbrc.jp/alignment/server/
RAxML (web) Boc et al., 2012 http://www.trex.uqam.ca/index.php?
action=raxml
iTOL Letunic and Bork., 2016 https://itol.embl.de/
CoNet Faust and Raes, 2016 http://apps.cytoscape.org/apps/conet
SparCC Friedman and Alm, 2012 http://psbweb05.psb.ugent.be/conet/
microbialnetworks/sparcc.php
Cytoscape Shannon et al., 2003 https://cytoscape.org/
R N/A https://www.r-project.org/
R, vegan package N/A https://cran.r-project.org/web/packages/
vegan/index.html
Plotting and analyses N/A https://github.com/ththi/
Microbial-Interkingdom-Suppl
CONTACT FOR REAGENT AND RESOURCE SHARING
Further information and requests for resources and reagents should be directed to and will be fulfilled by the Lead Contact Stephane
Hacquard ([email protected]).
EXPERIMENTAL MODEL AND SUBJECT DETAILS
Microbial StrainsThe bacterial strains used in this study have been previously reported (Bai et al., 2015) and are summarized in Table S3. The fungal
and oomycetal strains used in this study are summarized in Table S3
e1 Cell 175, 973–983.e1–e5, November 1, 2018
Plant ModelA. thaliana Col-0 wild-type (N60000) was obtained from the Nottingham Arabidopsis Stock Centre (NASC)
Growing Conditions for Plant ModelsSeeds were surface-sterilized in 70% ethanol for 10 min followed by a brief wash with 100% ethanol (1 min), a wash with 3% NaClO
(1 min) and five subsequent washes with sterile water. Seeds imbibed in sterile water were stratified for four days at 4�C in the dark.
Individual seeds were directly sown onto the surface of FlowPots by pipetting one seed at a time. FlowPots containing seeds were
inoculated with half-strength Murashige and Skoog (MS) medium without sucrose (Sigma-Aldrich M5519, pH 5.7) with full-strength
MES buffer (MES anhydrous, BioChemica). Combiness boxes containing Flowpots with plants (Kremer et al., 2018) were incubated
under short-day conditions at 21�C with light (10 hr) and at 19�C in the dark (14 hr).
Culture Conditions for In Vitro SystemsBacterial strains were routinely cultured at 20�C in liquid 50% TSBmedia (Sigma-Aldrich, USA) and stored in 30% glycerol at�80�C.Fungal and oomycetal strains were cultured at 20�C in solid PGA media (Sigma-Aldrich, USA) and agar plugs with mycelia were
stored in 30% glycerol at �80�C. Some oomycetal strains were continuously propagated in solid PGA media.
METHOD DETAILS
Sampling of A. thaliana plants in their natural habitatsA. thaliana plants were harvested from three natural populations: two in Germany (Geyen, Pulheim) and one in France (Saint-Die). For
each population, 16 plant individuals were dug out with their surrounding soil, transferred into sterile falcons and transported on ice to
the laboratory. Sample fractionation into soil, root episphere and root endosphere compartments was performed within 12 hours
after harvesting (Figure S1B). Soil particles not in contact with roots were transferred to 2 mL Lysis Matrix E tubes (MP Biomedicals,
Solon, USA) and are defined as the soil fraction. Plant roots were cut and thoroughly washed with sterile water to remove visible soil
particles. Epiphytic microbes were washed away from root systems using extensive shaking in TE buffer supplemented with 0.1%
Triton X-100. These washes were filtered through 0.22-mMpore size membranes and considered as the epiphytic fraction. Root sys-
tems were then washed successively in 80% EtOH and 0.25% NaOCl to further clean the root surfaces from living microorganisms
and subsequently washed three times (1min each) in sterile water. Thesemicrobially-enriched endosphere fractions were transferred
to 2 mL tubes. Each of the four biological replicates consists of a pool of four plant individuals.
Microbial community profiling from natural sitesTotal DNA was extracted from the aforementioned samples using the FastDNA SPIN Kit for Soil (MP Biomedicals, Solon, USA).
Samples were homogenized in Lysis Matrix E tubes using the Precellys 24 tissue lyzer (Bertin Technologies, Montigny-le-
Bretonneux, France) at 6,200 rpm for 30 s. DNA samples were eluted in 60 mL nuclease-free water and used for bacterial, fungal
and oomycetal community profiling (Agler et al., 2016). The concentration of DNA samples was fluorescently quantified, diluted to
3.5 ng/mL, and used in a two-step PCR amplification protocol. In the first step, V4–V7 of bacterial 16S rRNA (799F - 1192R), fungal
ITS1 (ITS1F - ITS2) and oomycetal ITS1 (ITS1-O - 5.8 s-Rev-O) (Table S2) were amplified. Under a sterile hood, each sample was
amplified in triplicate in a 25 ml reaction volume containing 2 U DFS-Taq DNA polymerase, 1x incomplete buffer (both Bioron
GmbH, Ludwigshafen, Germany), 2 mM MgCl2, 0.3% BSA, 0.2 mM dNTPs (Life technologies GmbH, Darmstadt, Germany) and
0.3 mM forward and reverse primers. PCR was performed using the same parameters for all primer pairs (94�C/2 min, 94�C/30 s,
55�C/30 s, 72�C/30 s, 72�C/10 min for 25 cycles). Afterward, single-stranded DNA and proteins were digested by adding 1 ml of
Antarctic phosphatase, 1 ml Exonuclease I and 2.44 ml Antarctic Phosphatase buffer (New England BioLabs GmbH, Frankfurt,
Germany) to 20 ml of the pooled PCR product. Samples were incubated at 37�C for 30 min and enzymes were deactivated at
85�C for 15 min. Samples were centrifuged for 10 min at 4,000 rpm and 3 ml of this reaction were used for a second PCR, prepared
in the same way as described above using the same protocol but with cycles reduced to 10 and with primers including barcodes and
Illumina adaptors (Table S2). PCR quality was controlled by loading 5 ml of each reaction on a 1% agarose gel and affirming that no
band was detected within the negative control. Afterward, the replicated reactions were combined and purified: 1) bacterial
amplicons were loaded on a 1.5% agarose gel and run for 2 hours at 80 V; bands with the correct size of �500 bp were cut out
and purified using the QIAquick gel extraction kit (QIAGEN, Hilden, Germany); 2) fungal and oomycetal amplicons were purified using
Agencourt AMPure XP beads. DNA concentration was again fluorescently determined, and 30 ng DNA of each of the barcoded
amplicons were pooled in one library per microbial group. Each library was then purified and re-concentrated twice with Agencourt
AMPure XP beads, and 100 ng of each library were pooled together. Paired-end Illumina sequencing was performed in-house using
the MiSeq sequencer and custom sequencing primers (Table S2).
16S rRNA gene and ITS read processingPaired 16S rRNA amplicon sequencing reads were joined (join_paired_ends QIIME, default) and then quality-filtered and
demultiplexed (split_libraries_fastq, QIIME, with max. barcode errors 1 and phred score of 30; Caporaso et al., 2010b). The filtered
reads were dereplicated (usearch –derep_fulllength), sorted by copy number (only reads > 2 copies were retained) and clustered
Cell 175, 973–983.e1–e5, November 1, 2018 e2
using the usearch algorithm at 97% sequence identity (Edgar, 2013). Clustered reads were checked for chimeras using
usearch (usearch –uchime_ref). All retained OTUs were aligned to the greengenes db (DeSantis et al., 2006) using PyNAST
(Caporaso et al., 2010a); those that did not align were removed. To each OTU a taxonomic classification was assigned using QIIME
(assign_taxonomy from QIIME, uclust algorithm with default param, greengenes db). Mitochondria-assigned OTUs were eliminated.
Out of the remaining sequences anOTU table was built (usearch_global 97%). ITS amplicon data were processed as followed. Reads
were joined and demultiplexed as described in the previous section, and forward reads were also demultiplexed and filtered. For
reads where no joined pair of reads exists the forward reads were kept. The combined reads were trimmed to a length of 220bp.
Reads were dereplicated and sorted (keeping only those with > 2 copies). The presence of ITS sequences was determined using
ITSx (Bengtsson-Palme et al., 2013) and reads containing ITS sequences were clustered at 97% using usearch. Fungal OTUs
were checked for chimeric sequences using uchime_ref against a dedicated chimera detection db (Nilsson et al., 2015). Oomycetal
OTUs were checked using the -chime_denovo function from usearch. To check for non-fungal/non-oomycetal sequences, the
remaining OTU sequences were blasted against an ITS sequence database. For this purpose, all available ITS sequences (search
term ‘‘internal+transcribed,’’ for plants, animals, fungi, oomycetes and protists) were retrieved from the NCBI nucleotide database
(January/February 2016). All OTU sequences whose best blast hit (bbh) was not annotated as a fungal/oomycetal sequence were
removed, as were all sequences that showed more hits in non-fungal/non-oomycetal sequences (out of max. 10 hits). Taxonomic
classification was done with the rdp classifier (Wang et al., 2007) using the warcup database for fungal OTUs (Deshpande et al.,
2016) and a self-established db for oomycetal OTUs. The latter was constructed from NCBI-derived ITS sequences (checked using
ITSx, remaining sequences were used to train the RDP classifier).
Calculation of alpha- and beta-diversity indicesTo assess alpha-diversity within natural samples, OTU tables were rarefied to 1,000 reads. Alpha-diversity indices (Shannon index,
Chao index and number of observed species) were calculated using QIIME (alpha_diversity.py). The significance of differences
between samples from different compartments was tested using the Kruskal-Wallis test (krus.test in R, p < 0.01). To estimate
beta-diversity, OTU tables were normalized using the cumulative-sum scaling (CSS) method (Paulson et al., 2013). Bray-Curtis dis-
tances between samples were used for principal coordinate analysis (PCoA, cmdscale function in R). To test the effect of location and
compartment on the estimated explained variance, a PERMANOVA analysis was performed (Adonis function from vegan package, in
R). Using the Bray-Curtis distance matrix as an input, the analysis was either constrained by site or by compartment. For each OTU
the possible enrichment in one site and/or compartment was tested using a linear model (see Zgadzaj et al., 2016). The RA of all en-
riched OTUs was then summarized at the class level, separated by site and compartment.
Microbial correlation networksTo evaluate the effects of compartment and site specificity, three networks were individually constructed for each kingdom. OTU
tables for each dataset (bacterial, fungal, oomycetal) were restricted to OTUs that were present in at least two samples and
comprised > 200 reads. For each table, Spearman correlation scores were calculated using the CoNet app (Faust and Raes,
2016) for Cytoscape (Shannon et al., 2003). Negative edges were discarded, and only edges with correlation scores of > 0.6 were
kept (p < 0.05, Bonferroni-corrected). For each node, affiliations to specific compartments and locations were estimated. If the
sum of the normalized read count (using CSS) for one compartment or one site, respectively, comprised > 50% of the read count,
the affiliation was set to this compartment or location. Otherwise, the affiliation was set to the two dominant locations and compart-
ments. Visualization was done with Cytoscape using the un-weighted force-directed layout. To estimate the mixing of nodes
belonging to different affiliations we calculated a mixing parameter (Lancichinetti and Fortunato, 2009). To this end, the proportion
of inter-group and intra-group edges (using the edge weights) was calculated for each of the occurring node affiliations. To construct
compartment-specific multi-kingdom co-occurrence networks, the OTU tables for the 16S and the two ITS datasets were restricted
to samples from the respective compartments. Raw read count tables were merged to give one table per compartment. OTUs that
appeared in less than ten samples were removed. These filtered multi-kingdom tables were used as an input for SparCC (Friedman
and Alm, 2012). The analysis was conducted with default parameters and 100 bootstrap samples were used to infer pseudo-
p.values. The inferred correlations were restricted to those having correlations > 0.6 and < -0.6 (p < 0.05, two-sided). Within the
networks, proportions of inter- and intra-kingdom edgeswere calculated. Intra-kingdom refers to edgeswithin bacterial OTUs, fungal
OTUs or oomycetal OTUs, whereas inter-kingdom refers to edges between these groups. To estimate the strength of the antagonistic
correlation between bacterial and fungal OTUs, a subset of those OTUs involved in negative correlation between the two groups was
chosen. In this subset, for each OTU the number of negative bacterial-fungal correlations and the betweenness-centrality was calcu-
lated. The cumulative bacterial-fungal correlation refers to the sum of all inter-kingdom correlations for each fungal and bacterial
OTU. OTUs belonging to taxonomic groups with less than five members were not shown. Visualization of the networks was
done with Cytoscape (spring-embedded layout spring strength = 5, spring rest length = 15). To estimate the robustness of
our SparCC-inferred network, we compared it to a network inferred from Spearman rank correlations (p > 0.05, correlation
strength > 0.5 and < -0.5). OTU tables for the three kingdomswere filtered as described above and raw read counts were transformed
to relative abundances (separately for each kingdom).
e3 Cell 175, 973–983.e1–e5, November 1, 2018
Establishment of root-derived microbial culture collectionsWe grew A. thaliana Col-0 and A. thaliana relatives in Cologne Agricultural Soil (CAS) under greenhouse conditions. Thirty-six
A. thaliana orA. thaliana relative (Arabis alpina,Cardamine hirsuta) individuals were harvested at three developmental stages (rosette,
bolting and flowering stages). Similarly, two to six A. thaliana individuals from Geyen, Pulheim and Saint-Die sites were dug out with
their surrounding soil, transferred to sterile falcons and transported on ice to the laboratory. Plant roots were washed in sterile water
to eliminate soil particles from the root surface and a further three times in sterile water with shaking. In order to enrich for endophytic
filamentous eukaryotes, roots were surface-sterilized for 1 min in 80% EtOH, followed by a second sterilization step for 1 min in
0.25% NaClO. The efficiency of the surface sterilization step was validated by printing the roots on TSB media. The emergence of
hyphae from surface-sterilized root fragments was checked daily over two weeks and the corresponding microbial isolates where
transferred to plates supplemented with antibiotics (Rimf100 Strp100 Amp50 Kn50 Tc20). DNA isolation was performed using
the DNAeasy Plant Mini Kit (QIAGEN, Hilden, Germany), and fungal and oomycetal ITS regions were amplified by PCR using the
ITS1F-ITS4 (fungi) and ITSO-5.8sORev (oomycetes) primer (94�C for 2 min, 35 cycles of 94�C for 30 s., 53�C for 30 s, and 72 �Cfor 1.5 min, followed by 10 min at 72 �C).
Culture collection comparison to natural sitesTo compare the diversity of the fungal and oomycetal isolates retrieved by culturing, Sanger sequences were compared to amplicon
sequences from natural sites (Geyen, Pulheim, Saint-Die and CAS). ITSx (Bengtsson-Palme et al., 2013) was used to extract the ITS
region from all Sanger sequences, which were mapped against the representative OTU sequences (from all OTUs appearing in root
samples) from the respective datasets (Fungal, Oomycetal, using usearch_global) at a 97% sequence identity threshold. Recovery
rates were defined as the number of recovered root-associated OTUs at a cumulative RA of 60% and 80%, respectively. To compare
the taxonomic diversity between the culture collection and the root-associated OTUs, the number of representative isolates was
related to the number of core root-associated OTUs. These OTUs were defined as OTUs that appear within at least one location
(including CAS samples) with more than 0.1% RA within all root samples from this site. OTUs with weak taxonomic assignment at
the class level were excluded (RDP bootstrap > 0.5). Sanger-derived sequences for all isolates were compared at a 100% identity
threshold (using usearch – usearch -global) and isolates that shared 100% sequence identity and that were isolated at the same site
were used for the construction of phylogenetic trees. The representative sequences were aligned using the MAFFT webservice
(G-INS-i option and an un-align level of 0.4; Katoh et al., 2017). Maximum-likelihood trees were inferred with the RAxML webservice
(Boc et al., 2012), using the default parameters. Trees were visualized using iTol (Letunic and Bork, 2016).
Microbiota reconstitution experiments in the FlowPot systemBacterial strains were cultivated from their glycerol stock (pellets of bacterial colonies stored in 50% glycerol at �80�C) in deepwell
96-well- plates containing 400 ml of 50% TSB (Tryptic Soy Broth, Sigma) for six days at 25�C and subsequently pooled (in equal ra-
tios). This bacterial pool was centrifuged at 4,000 xg for 10 min and re-suspended in 10 mM MgCl2 to remove residual media and
bacteria-derivedmetabolites. Prior to inoculation, OD600 was adjusted to 0.02 (107 cells/mL). Fungal strainswere cultivated from their
glycerol stocks (pieces of fungal mycelium stored in 30% glycerol stock at �80�C) individually in PGA (Potato Glucose Agar, Sigma-
Aldrich) including antibiotics (see above) for seven days and re-transferred to PGA for another seven days. Pieces of mycelium were
harvested using sterile tips into 1 mL of MgCl2 containing one stainless steel bead (3.2 mm) and subsequently crushed with a paint
shaker (SK450, Fast & Fluid Management, Sassenheim, Netherlands) for 10 min and pooled in equal ratios. Oomycetal strains were
cultured in PGA for seven days and treated as described for fungal strains. Preparation of the gnotobiotic FlowPot systemwas carried
out as previously described (Kremer et al., 2018). Microbial mixtures were adjusted to a biomass ratio of 4:1 (eukaryotes:prokaryotes,
as assessed by Joergensen and Emmerling, 2006), using 1mL (107 cells) bacterial inoculum and 50 mL of both fungal and oomycetes
inocula (2.5mg each) in 50mL 1/2MS (Murashige + SkoogMedium including Vitamins, Duchefa), whichwere then inoculated into the
FlowPot using a 50 mL syringe. Prior to inoculation, A. thaliana Col-0 seeds were sterilized and stratified for four days in the dark at
4�C. Between 4 and 5 hours after microbial inoculation, ten seeds were sown per pot and the closed boxes incubated at 21�C, for10 hours with light (intensity 4) at 19�C and 14 hours in the dark for four weeks. After incubation, plant shoots were cut and weighed
for fresh weight assessment. To account for experiment-to-experiment variation, raw shoot fresh weight values were normalized to
the average shoot fresh weight of control plants (Microbe Free) per biological replicate and then all replicates were compared
together, using ggplot2 and agricolae packages in R. Kruskal-Wallis and Dunn’s post hoc tests were used to test for significant dif-
ferences. A similar analysis was performed for the perturbation experiments (Figures 5B and 5C). For community profiling,
matrix samples were harvested and roots were thoroughly washed in water, dried on sterilized Whatman glass microfiber
filters (GE Healthcare Life Sciences), transferred into lysing matrix E tubes (MP Biomedicals), frozen in liquid nitrogen and stored
at �80�C. DNA extraction and amplicon sequencing was performed as described above. The microbiota reconstitution experiment
includes three fully independent biological replicates, each containing three technical replicates.
Direct mapping for synthetic communities and downstream analysisThe reads of the synthetic communities were processed as described before for the respective barcodes until demultiplexed and
filtered raw reads were available. Raw reads were directly mapped to the reference sequences for the respective communities (using
the usearch-global command fromusearch, sequence identity threshold of 97%).OTU tableswere inferred from thesemapped reads.
Cell 175, 973–983.e1–e5, November 1, 2018 e4
All alpha and beta diversity indices were calculated as described before. Relative abundance plots were produced from relative OTU
counts (RA%) per sample and plotted using R. Raw OTU tables were rarefied with a subsampling depth of 1,000 reads using QIIME
(single_rarefaction.py) and the alpha-diversity indices were calculated using alpha_diversity.py. Alpha-diversity values (observed
OTUs) were then plotted using ggplot in R and corrected for experiment-to-experiment variation. Beta diversity was estimated as
described before. Permutational multivariate analyses of variance were performed in R using the function capscale. Statistical signif-
icanceof the ordinations aswell as confidence intervals for the variancewasdeterminedby anANOVA-like permutation test (functions
permutest and anova.cca) with 999 permutations (Table S4). To identify strains enriched in single-microbial class inoculation condi-
tions (B, F,O) compared to combined-microbial class inoculation conditions (BF, BO,ALL), we employed linear statistics onRAvalues
(log2, > 5 & threshold) using a script described previously (Bulgarelli et al., 2012). Ternary plots were constructed as previously
described (Bulgarelli et al., 2012). To visualize the distance between clusters of the same microbial inoculation condition, average
Bray-Curtis distances were calculated per biological replicate and normalized to control cluster (e.g: (B-BF/B-B)) (Figure S4A). Krus-
kal-Wallis andDunn’s post hoc testswereused todetermine significant differences. For the comparisonbetweennatural communities
and SynComs (Figure S4F), amplicon sequencing data derived from the sequencing from the three natural sites (Pulheim, Geyen and
Saint-Die) and from plants grown in Cologne Agricultural Soil (CAS) were processed together with the sequencing data derived from
the reconstitution experiment. All reads for the respectivedatasetswerepooledandprocessedasdescribed in the16S rRNAgeneand
ITS read processing sections. Assuming that our culture collections contained the most abundant OTUs from A. thaliana roots, we
used the 100 most abundant root associated OTUs for calculating Bray-Curtis distances between samples.
High-throughput bacterial-fungal interaction screenThe protocol was adapted from Figueroa-Lopez et al., 2014. The screen was performed in triplicate and independently validated by
another random screening (Figures S5A and 5C). Spores from three-week-old fungal cultures were re-suspended in 10 mL sterile
water, transferred to a 12-mL falcon tube, and centrifuged for 3 min at 2,000 rpm. After three washes with sterile water, spore con-
centration was adjusted to 1x10⁶ spores/mL in TSB 20% and the solution was kept at 4�C. Bacterial cells were grown in 96-well
plates in TSB 20% for six days to reach the stationary phase. After a centrifugation step (20 min 4,000 rpm at 4�C), the TSB medium
was removed and replaced by fresh medium (200 ml in each well). Two 96-well optical bottom plates (ThermoFisher Scientific/Nunc,
Rochester, USA) were used for the screening. Plate A corresponds to the screening plate and contained fungal spores in interaction
with bacteria or fungal spores alone. Plate B corresponds to a control plate inoculated with bacteria only to assess bacterial OD, as
well as bacterial autofluoresence intensity. Plate A was filled with 150 ml of TSB 20% medium or 160 ml of TSB 20% medium for the
control without bacteria and plate B was filled with 190 ml of TSB 20%medium. Then, 40 ml of fungal spores (1x10⁶ spores/mL) were
transferred into all wells of plate A and 10 ml of six-day-old bacterial culture was transferred to each well of both plates, except for the
control wells containing the fungus alone in plate A. After 48 hours of incubation at 25�C, the bacterial cells from plates A and B were
washed awaywith amultichannel pipet and the wells were further washed two timeswith 200 ml of PBS 1x and incubated overnight at
4�C (dark) in 100 ml of PBS 1x supplemented with 1 mg/mL of WGA Alexa fluor 488 conjugated (stock solution: 1 mg/mL, Invitrogen/
Molecular Probes, Eugene, USA). The solutionwaswashed away and thewells were further washed two times in 200 ml of PBS 1x and
finally resuspended in 200 ml of PBS 1x. The fluorescence intensity, reflecting fungal growth in each well was measured using a plate
reader (Excitation/Emission 490/530, Tecan Infinite 200 PRO, Mannedorf, Switzerland). Log2-transformed relative fluorescence
values, reflecting the ability of a specific bacterium to restrict or promote fungal growth in the presence versus absence of bacterial
competitors, were calculated as shown in Figure S5A. The bacterial phylogenetic tree was constructed based on the full sequences
of bacterial 16S rRNA. Sequences were aligned with MUSCLE using default parameters and MEGA 5.0 was used to construct a
Neighbor Joining tree. The bootstrap consensus tree inferred from 1,000 replicates was edited in iTOL (Letunic and Bork, 2016).
QUANTIFICATION AND STATISTICAL ANALYSIS
No statistical methods were used to pre-determine sample sizes. Data collection and analysis were performed blinded to conditions
in all experiments. All statistical analyses were performed using the R environment, except for the calculation of pseudo-p values at
the end of SparCC network inference. Details of the enrichment analysis using a linear model can be found in the method details
section. To compute the explained variance of different factors we used the capscale function function included in the vegan
package. Otherwise, the Kruskal-Wallis test was used to test for statistical significance. A p-value of less than 0.05 was considered
as significant.
DATA AND SOFTWARE AVAILABILITY
Sequencing reads from natural site samples and microbiota reconstitution experiments (MiSeq 16S rRNA and ITS reads) have been
deposited in the European Nucleotide Archive (ENA) under accession numbers ENA: PRJEB27146 and ENA: PRJEB27147,
respectively. All scripts for computational analysis and corresponding raw data are available at https://github.com/ththi/
Microbial-Interkingdom-Suppl.
e5 Cell 175, 973–983.e1–e5, November 1, 2018
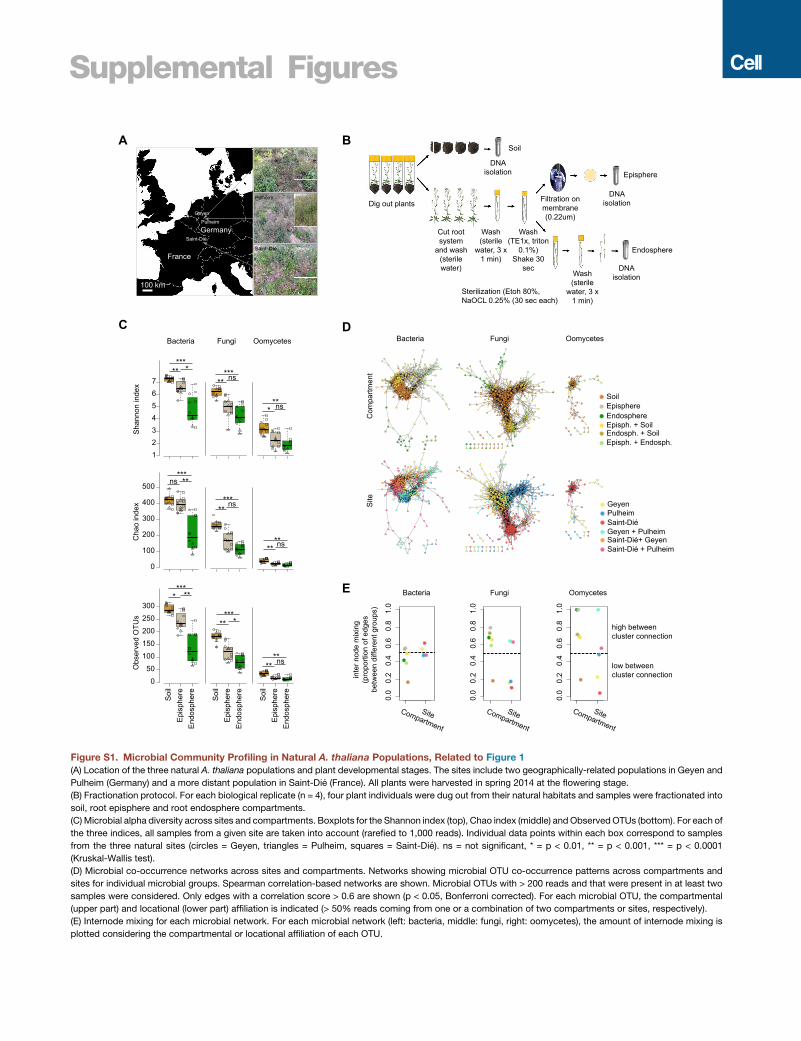
Supplemental Figures
Bacteria Fungi Oomycetes
Geyen
Pulheim
France
Germany
100 km
Geyen
Pulheim
Saint -Dié
Saint-Dié
Endosphere
SoilEpisphere
Episph. + Endosph.Endosph. + SoilEpisph. + Soil
Saint-Dié
GeyenPulheim
Saint-Dié + PulheimSaint-Dié+ GeyenGeyen + Pulheim
Com
partm
ent
Site
Bacteria Fungi Oomycetes
Bacteria Fungi Oomycetes
A B
C D
Dig out plants
Soil
Episphere
Endosphere
DNA isolation
DNA isolation
DNA isolation
Cut root system
and wash (sterile water)
Wash (sterile
water, 3 x 1 min)
Wash (TE1x, triton
0.1%) Shake 30
sec
Filtration on membrane (0.22um)
Sterilization (Etoh 80%, NaOCL 0.25% (30 sec each)
Wash (sterile
water, 3 x 1 min)
E
1234567
Soi
lE
pisp
here
End
osph
ere
Soi
lE
pisp
here
End
osph
ere
Soi
lE
pisp
here
End
osph
ere
0
50
100
150
200
250
300
0
100
200
300
400
500
Sha
nnon
inde
xC
hao
inde
xO
bser
ved
OTU
s
**** ns
*
ns
**
** ns
*
**
** ns
ns
*
**
**
***
***
*****
***
**
**
******
*
ns
0.0
0.2
0.4
0.6
0.8
1.0
inte
r nod
e m
ixin
g (p
ropo
rtion
of e
dges
bet
wee
n di
ffere
nt g
roup
s)
0.0
0.2
0.4
0.6
0.8
1.0
Compartment
0.0
0.2
0.4
0.6
0.8
1.0
Site Compartment
Site Compartment
Site
low between cluster connection
high between cluster connection
Figure S1. Microbial Community Profiling in Natural A. thaliana Populations, Related to Figure 1
(A) Location of the three natural A. thaliana populations and plant developmental stages. The sites include two geographically-related populations in Geyen and
Pulheim (Germany) and a more distant population in Saint-Die (France). All plants were harvested in spring 2014 at the flowering stage.
(B) Fractionation protocol. For each biological replicate (n = 4), four plant individuals were dug out from their natural habitats and samples were fractionated into
soil, root episphere and root endosphere compartments.
(C) Microbial alpha diversity across sites and compartments. Boxplots for the Shannon index (top), Chao index (middle) andObservedOTUs (bottom). For each of
the three indices, all samples from a given site are taken into account (rarefied to 1,000 reads). Individual data points within each box correspond to samples
from the three natural sites (circles = Geyen, triangles = Pulheim, squares = Saint-Die). ns = not significant, * = p < 0.01, ** = p < 0.001, *** = p < 0.0001
(Kruskal-Wallis test).
(D) Microbial co-occurrence networks across sites and compartments. Networks showing microbial OTU co-occurrence patterns across compartments and
sites for individual microbial groups. Spearman correlation-based networks are shown. Microbial OTUs with > 200 reads and that were present in at least two
samples were considered. Only edges with a correlation score > 0.6 are shown (p < 0.05, Bonferroni corrected). For each microbial OTU, the compartmental
(upper part) and locational (lower part) affiliation is indicated (> 50% reads coming from one or a combination of two compartments or sites, respectively).
(E) Internode mixing for each microbial network. For each microbial network (left: bacteria, middle: fungi, right: oomycetes), the amount of internode mixing is
plotted considering the compartmental or locational affiliation of each OTU.
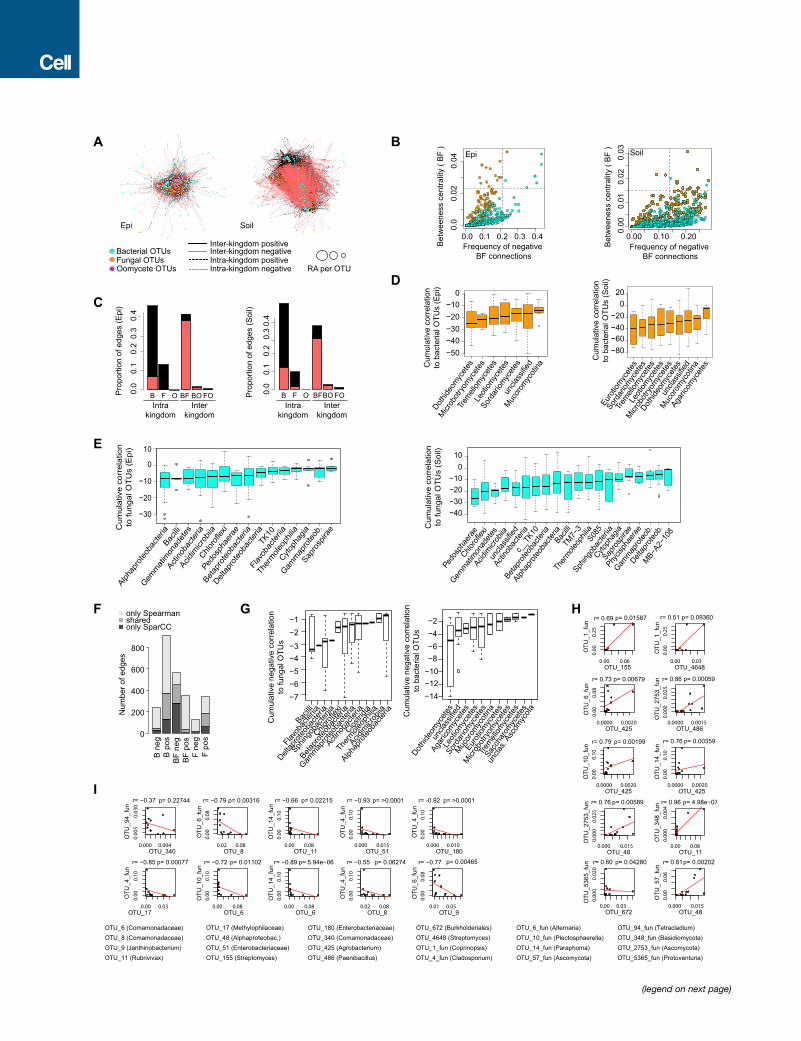
(legend on next page)
Figure S2. Microbial Networks of Soil and A. thaliana Episphere Microbiota, Related to Figure 2
(A) Correlation-based network of microbial episphere-associated (left) and soil-associated (right) OTUs detected in three natural A. thaliana populations (Pulheim,
Geyen, Saint-Die). Each node corresponds to a microbial OTU and edges between nodes correspond to either positive (black) or negative (red) correlations
inferred from OTU abundance profiles using the SparCC method (pseudo p-value > 0.05, correlation values < -0.6 or > 0.6). OTUs belonging to the different
microbial kingdoms have distinct color codes and node size reflects their relative abundance in the episphere compartment. Intra-kingdom correlations are
represented with dotted lines and inter-kingdom correlations by solid lines.
(B) Hub properties of negatively correlated bacterial and fungal OTUs in the episphere (left) and soil (right) networks. For each fungal and bacterial OTU, the
frequency of negative inter-kingdom connections is plotted against the betweenness centrality inferred from all negative BF connections (cases in which a node
lies on the shortest path between all pairs of other nodes).
(C) Proportion of edges showing positive (black) or negative (red) correlations in the microbial episphere (left) and soil (right) networks. B: bacteria, F: fungi, O:
oomycetes.
(D) Cumulative correlation scores measured in the microbial episphere (left) and soil (right) networks between fungal and bacterial OTUs. Fungal OTUs were
grouped at the class level (> five OTUs/class) and sorted according to their cumulative correlation scores with bacterial OTUs.
(E) Cumulative correlation scores measured in the microbial episphere (left) and soil (right) networks between bacterial and fungal OTUs. Bacterial OTUs were
grouped at the class level (> five OTUs/class) and sorted according to their cumulative correlation scores with fungal OTUs. (F-I) Validation of SparCC-defined
(anti-)correlated OTUs using Spearman correlation.
(F) Number of edges that are either unique to one of the two networks or shared by the two (B = connections between bacterial OTUs, F = connections between
fungal OTUs, BF = connections between fungal and bacterial OTUs, pos = positively correlated connections, neg = negatively correlated connections).
(G) Cumulative negative correlations across taxonomic groups inferred by Spearman correlation.
(H) The ten most positively correlated OTUs from the sparCC network and the corresponding correlation inferred by Spearman correlation based on the relative
abundance of the OTUs.
(I) The ten most negatively correlated OTUs from the sparCC network and the corresponding correlation inferred by Spearman correlation based on the relative
abundance of the OTUs.
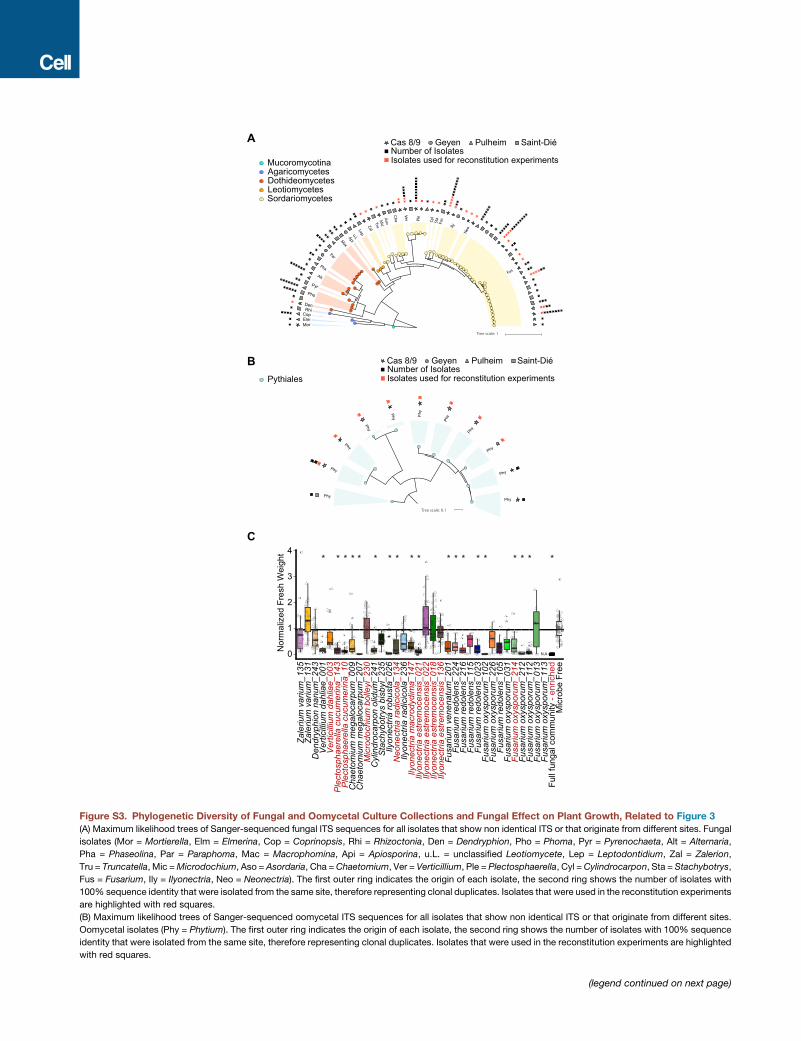
Figure S3. Phylogenetic Diversity of Fungal and Oomycetal Culture Collections and Fungal Effect on Plant Growth, Related to Figure 3
(A) Maximum likelihood trees of Sanger-sequenced fungal ITS sequences for all isolates that show non identical ITS or that originate from different sites. Fungal
isolates (Mor = Mortierella, Elm = Elmerina, Cop = Coprinopsis, Rhi = Rhizoctonia, Den = Dendryphion, Pho = Phoma, Pyr = Pyrenochaeta, Alt = Alternaria,
Pha = Phaseolina, Par = Paraphoma, Mac = Macrophomina, Api = Apiosporina, u.L. = unclassified Leotiomycete, Lep = Leptodontidium, Zal = Zalerion,
Tru = Truncatella, Mic =Microdochium, Aso = Asordaria, Cha =Chaetomium, Ver = Verticillium, Ple = Plectosphaerella, Cyl =Cylindrocarpon, Sta = Stachybotrys,
Fus = Fusarium, Ily = Ilyonectria, Neo = Neonectria). The first outer ring indicates the origin of each isolate, the second ring shows the number of isolates with
100% sequence identity that were isolated from the same site, therefore representing clonal duplicates. Isolates that were used in the reconstitution experiments
are highlighted with red squares.
(B) Maximum likelihood trees of Sanger-sequenced oomycetal ITS sequences for all isolates that show non identical ITS or that originate from different sites.
Oomycetal isolates (Phy = Phytium). The first outer ring indicates the origin of each isolate, the second ring shows the number of isolates with 100% sequence
identity that were isolated from the same site, therefore representing clonal duplicates. Isolates that were used in the reconstitution experiments are highlighted
with red squares.
(legend continued on next page)

(C) Effect of individual fungal isolates on A. thaliana growth in the FlowPot system. The boxplots depict normalized fresh weight of A. thaliana Col-0 plant shoots
after three weeks of incubation with each of the 34 fungal strains used in themulti-kingdommicrobiota reconstitution experiment (see Figure 4). For each boxplot,
three biological replicates (depicted with different shapes) with at least three technical replicates are presented. Significant differences are indicated with an
asterisk (p < 0.01, Kruskal-Wallis with Dunn’s post hoc test). The 11 fungal strains enriched in the absence of bacteria (depicted in Figure S4E) are highlighted in
red and a 23-member fungal community lacking these 11 isolates remains deleterious for plant growth (fungal community-enriched). N.A.: data not available
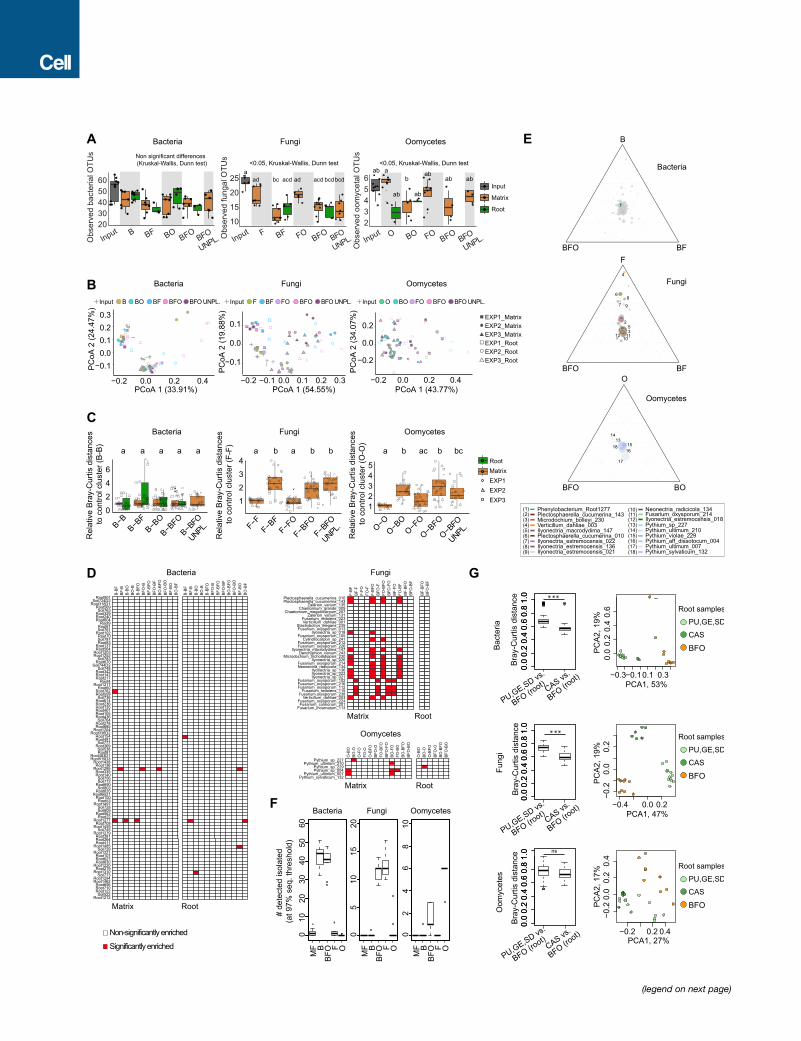
(legend on next page)
Figure S4. Multi-kingdom Microbiota Reconstitution Experiments in the FlowPot System, Related to Figure 4
(A) Microbial alpha diversity in matrix and root compartments in a multi-kingdommicrobiota reconstitution system. Germ-free plants were re-colonized with root-
derived bacterial (148), fungal (34) and oomycetal (8) isolates in the FlowPot system and matrix and root compartments were harvested after four weeks.
Observed bacterial (upper panel), fungal (middle panel) and oomycetal (lower panel) OTUs in matrix (brown) and root (green) samples, as well as in the corre-
sponding microbial input communities inoculated in the FlowPot system at T0 (gray) (p < 0.05, Kruskal-Wallis with Dunn’s post hoc test). Data points are missing
for several root samples due to the absence of living plants in the corresponding treatment. B: bacteria, F: fungi, O: oomycetes, UNPL: unplanted pots. Note the
significant decrease in observed fungal and oomycetal OTUs in the presence versus absence of bacteria.
(B) Microbial community structure in matrix and root compartments in the FlowPot system four weeks after inoculation. PCoA plots of bacterial, fungal and
oomycetal profiles (from left to right); shapes represent three biological replicates and colors depict different microbial combinations. B: bacteria, F: fungi, O:
oomycetes, UNPL: unplanted pots.
(C) Relative Bray-Curtis distances between sample clusters of bacterial, fungal and oomycete profiles (from left to right) of matrix (brown) and root (green samples)
to the control clusters (B-B, F-F andO-O) (i.e., the closer to 1, themore similar to the control cluster; see STARMethods). Significant differences are depicted with
different letters (Kruskal-Wallis with Dunn’s post hoc test, < 0.05).
(D) Effect of co-inoculation on microbial strain enrichment. Pairwise-enrichment tests for bacterial, fungal and oomycetal strains in gnotobiotic experiments
(Generalized Linear Model, p.adj.method = FDR, p value < 0.05) co-inoculated in different combinations (B: bacteria, F: fungi, O: oomycetes). Enriched strains in
one combination compared to another one are depicted with a red block (e.g., Root762 is enriched in B compared to BF).
(E) Ternary plots representing the enriched strains (colored circles) (Generalized linear model, p.adj.method = FDR < 0.05) in each combination versus the other
two combined. The size of the circles indicates the relative abundance of each strain and the closeness to each edge signifies a higher prevalence in that given
condition.
(F) Number of detected bacterial, fungal or oomycetal isolates in microbe-free (MF), B, BFO, F, and O matrix samples (reference sequences mapped at 97%
sequence identity).
(G) Comparison of the abundance of root-associated microbial communities derived from natural sites and synthetic communities. Left: Bray-Curtis distances
between root samples from synthetic communities (BFO) of the reconstitution experiment (see Figure 4) and root samples from the natural sites (PU, GE, SD) or
from plants grown in the Cologne Agricultural Soil (CAS, used to establish the microbial culture collections). Kruskal-Wallis test, ns = not significant, *p < 0.01,
**p < 0,001, ***p < 0.0001. Right: Beta diversity determined using principal component analysis of the aforementioned root samples. Only the 100 most abundant
root-associated OTUs found in the three natural sites and in CAS samples were considered for calculation of distances between samples.
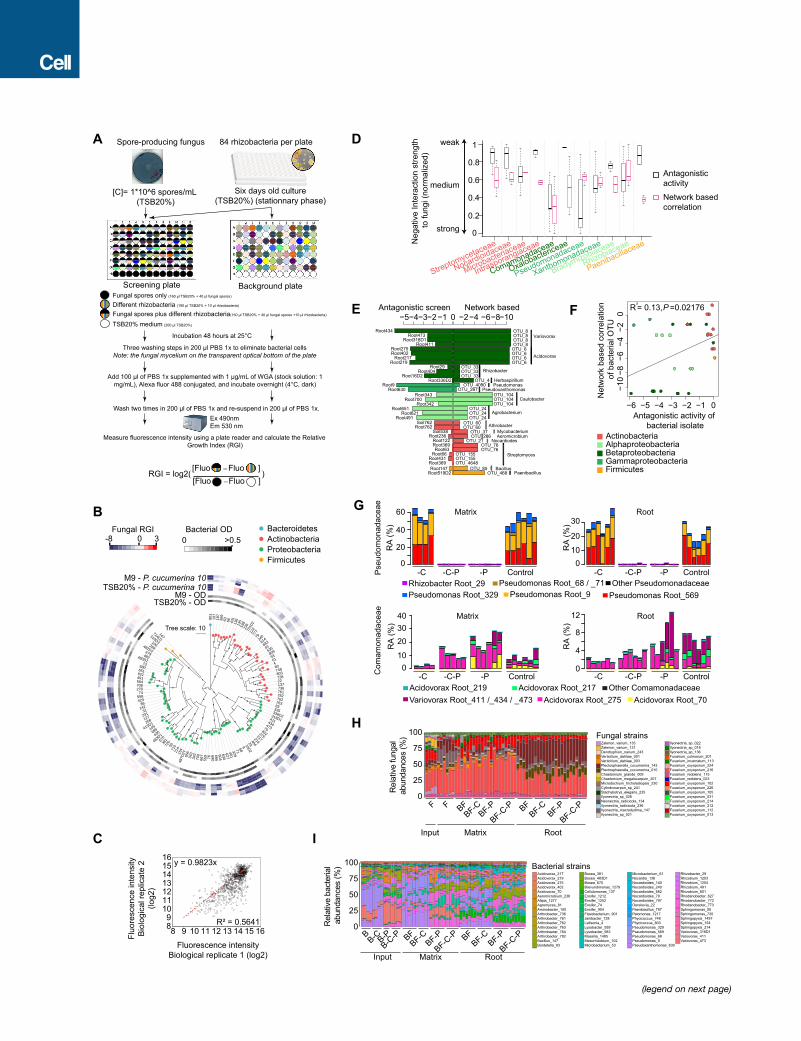
(legend on next page)
Figure S5. High-Throughput Fungal-Bacterial Interaction Screen and Biocontrol Activities of Bacterial Root Commensals, Related to
Figure 5
(A) Schematic overview of the experimental protocol. Fungal spores were equally distributed to the wells of a transparent-bottom 96 well plate and incubated in
the presence or absence of different root-derived bacteria (stationary phase) in liquidmedium (screening plate). Bacteria were also grown in the absence of fungal
spores as a control (background plate). After 48 hours of interaction, three washing steps were used to eliminate bacterial cells in suspension. Note that the fungal
mycelium sticks to the transparent optical bottom of the plate. After overnight incubation in Wheat Germ Agglutinin and two additional washes, the fluorescence
intensity (reflecting fungal growth) was measured using a plate reader. The relative growth index was calculated as illustrated (see STAR Methods).
(B) Alteration of the growth of Plectosphaerella cucumerina isolate 10 upon competition with phylogenetically diverse members of the bacterial root microbiota in
minimummedium (M9) and a carbon-rich medium (20% TSB). The phylogenetic tree was constructed based on the full bacterial 16S rRNA gene sequences and
bootstrap values are depicted with black circles. The heatmap depicts the log2 fungal relative growth index (presence versus absence of bacterial competitors)
measured by fluorescence (see above). Note the similar overall inhibitory activities in minimum and complex media.
(C) Validation experiment, in which the bacterial strains were re-screened against ten randomly-selected fungi. Fluorescence intensities (log2) were compared
with those obtained from the first biological replicate.
(D) Comparison of network-derived correlations and experimentally tested interactions of bacterial families with fungal species. For each bacterial family shared
between antagonistic screening and root-associated OTU network analysis, the average antagonistic activity against fungal isolates and the cumulative cor-
relation to fungal OTUs in the network are represented. Bacterial families with more than two members were considered and values for both measurements were
normalized to be in the same range.
(E) Direct comparison of bacterial OTUs from the root network with bacterial isolates used in the antagonistic screening. Each data point corresponds to a
bacterial OTU-isolate pair (> 97% sequence similarity; only best matching hits are shown). For each pair, the network-derived correlation with fungal OTUs (from
the bacterial OTU) is plotted against the result from the antagonistic screening (from the bacterial isolates).
(F) Same as E) but data are presented in a correlation plot.
(G) Validation of withdrawal of a subset of bacterial strains in the FlowPot microbiota reconstitution system. Relative abundances of isolates of the
Pseudomonadaceae (top) and the Comamonadaceae (bottom) families in output matrix and root samples four weeks after inoculation (direct mapping at 100%
sequence similarity). RA: Relative abundance. -C: withdrawal of ten Comamonadaceae strains, -P: withdrawal of eight Pseudomonadaceae strains. -C-P removal
of 18 Comamonadaceae plus Pseudomonadaceae strains. Control samples were inoculated with the full 148-member bacterial community. Note that one
Acidovorax strain (Acidovorax 275) was unintentionally not removed from the -C depleted samples. This Acidovorax strain is unable to rescue plant growth in the
presence of the fungal community (see Figure 5C).
(H and I) Relative abundance of (H) fungal isolates and (I) bacterial isolates (direct mapping at 100% sequence similarity) is presented for all conditions. B: full
148-member bacterial community. F: 34-member fungal community. -C: depletion of Comamonadaceae isolates. -P: depletion of Pseudomonadaceae
isolates. -C-P: depletion of Comamonadaceae and Pseudomonadaceae isolates.