the influence of neurexin 1 gene variants on...
TRANSCRIPT
i
THE INFLUENCE OF NEUREXIN 1 GENE VARIANTS ON
COGNITIVE ABILITY IN MULTIPLEX SCHIZOPHRENIA FAMILIES
By
WANG KAH WEI
A dissertation submitted to the Department of Chemical Engineering,
Lee Kong Chian Faculty of Engineering and Science,
Universiti Tunku Abdul Rahman,
in partial fulfillment of the requirements for the degree of
Master of Science
February 2017
ii
ABSTRACT
THE INFLUENCE OF NEUREXIN 1 GENE VARIANTS ON
COGNITIVE ABILITY IN MULTIPLEX SCHIZOPHRENIA FAMILIES
WANG KAH WEI
Brain synaptic dysfunction was suggested to play a key role in the cause and
pathogenesis of schizophrenia. NRXN1 gene encode for NRXN1 proteins that act as
pre-synaptic neural adhesion molecules involve in synaptic transmission. Copy number
variations (CNVs) and single nucleotide polymorphisms (SNPs) of NRXN1 confer high
risk of schizophrenia. Multiplex families with more than one affected relatives were
targeted in this study. The objective of this study is to determine the CNVs of NRXN1
gene and its association with brain cognitive function of multiplex schizophrenia
families and study the association of NRXN1 SNPs with first-degree relatives of
schizophrenia families. Thirteen schizophrenia families consisted of twenty eight
patients and twelve healthy families which made up of twenty four healthy individuals
were recruited in this study. Brain cognitive function of samples was studied by using
Trail Making Test Part A (TMT-A) and part B (TMT-B). Seven sites of NRXN1 gene
were targeted and quantified with real time polymerase chain reaction (PCR) and copy
number was measured by CopyCaller™ v2.0 software. Besides that, allele and
genotype frequencies of five NRXN1 SNPs were computed and linkage disequilibrium
between SNPs was determined by using Haploview software. TMT-A (p = 1.45 10-4
)
and TMT-B (p = 1.01 10-5
) scores made by multiplex schizophrenia families patients
were statistically significant higher than healthy families controls. Patients also showed
significantly (p = 0.003) higher TMT B A score than controls. Twenty copy number
iii
alterations (loss/ gain) were detected and 14 (70%) of these alterations occurred in
isolated subjects from different families whereas 6 (30%) came from similar families.
This suggests that the penetrance of CNVs at the targeted NRXN1 regions may be
relatively low in similar families. First-degree schizophrenia patients showed
significant lower copy number mean than CN = 2.0 at Intron 6 (p = 0.003) and Intron
20 (p = 0.001). After false discovery rate (FDR) correction, copy number (CN) mean
was found significantly different between controls and patients at three regions, Intron
6 (p = 0.010), Intron 7 – Exon 7 (p = 0.020) and Intron 20 (p = 0.019). The Spearman‟s
rank correlation test was performed and no significant correlations were found between
copy numbers of respective targeted NRXN1 CNVs regions with the cognitive
performance scores. Among five studied SNPs, rs2024513 allele (p = 0.005) and
genotype (p = 0.002) frequencies were found significantly associated with
schizophrenia. In this study, the results indicate that NRXN1 gene variants as genetic
factors that could contribute to susceptibility of schizophrenia.

iv
ACKWOWLEDGEMENT
I would like to express my appreciation to my supervisor, Dr. Tee Shiau Foon and my
co-supervisor, Dr. Tang Pek Yee for their valuable advice, persistence guidance, and
valuable suggestions. Their unfailing moral support and supervision have enabled the
timely completion of my work successfully.
I am grateful to the psychiatrists and staffs at Hospital Permai Johor Bahru for their
contributions and patience during the lengthy sample collection process. I also wish to
express my thanks to Prof. Emeritus Dr. Yong Hoi Sen and Dr. Song Sze Looi from
University of Malaya for their unfailing assistance in making my research life easier.
I would like to extend my sincere appreciation to Jeff Lee Chien Hoe who provided his
unreserved support. Last but not least, a big bouquet of thanks to my dearest family for
their understanding and moral supports.
v
APPROVAL SHEET
This dissertation entitled “THE INFLUENCE OF NEUREXIN 1 GENE
VARIANTS ON COGNITIVE ABILITY IN MULTIPLEX SCHIZOPHRENIA
FAMILIES” was prepared by WANG KAH WEI and submitted as partial fulfillment
of the requirements for the degree of Master of Science at Universiti Tunku Abdul
Rahman.
Approved by:
___________________________
(Assistant Prof. Dr. TEE SHIAU FOON) Date: ………….
Supervisor
Department of Chemical Engineering
Lee Kong Chian Faculty of Engineering and Science
Universiti Tunku Abdul Rahman
___________________________
(Associate Prof. Dr. TANG PEK YEE) Date: …………
Co-supervisor
Department of Mechatronics and BioMedical Engineering
Lee Kong Chian Faculty of Engineering and Science
Universiti Tunku Abdul Rahman
vi
LEE KONG CHIAN FACULTY OF ENGINEERING AND SCIENCE
UNIVERSITI TUNKU ABDUL RAHMAN
Date: __________________
SUBMISSION OF DISSERTATION
It is hereby certified that WANG KAH WEI (ID No: 14UEM07891) has completed
this dissertation entitled “THE INFLUENCE OF NEUREXIN 1 GENE VARIANTS
ON COGNITIVE ABILITY IN MULTIPLEX SCHIZOPHRENIA FAMILIES”
under the supervision of Dr. Tee Shiau Foon (Supervisor) from the Department of
Chemical Engineering and Dr. Tang Pek Yee (Co-Supervisor) from the Department of
Mechatronics and BioMedical Engineering, Lee Kong Chian Faculty of Engineering
and Science.
I understand that the University will upload softcopy of my dissertation in pdf format
into UTAR Institutional Repository, which may be made accessible to UTAR
community and public.
Yours truly,
__________________
(WANG KAH WEI)

vii
DECLARATION
I, WANG KAH WEI hereby declare that the project report is based on my original
work except for quotations and citations which have been duly acknowledged. I also
declare that it has not been previously or concurrently submitted for any other degree at
UTAR or other institutions.
______________________
(WANG KAH WEI)
viii
TABLE OF CONTENTS
Page
ABSTRACT ii
ACKNOWLEDGEMENT iv
APPROVAL SHEET v
PERMISSION SHEET vi
DECLARATION vii
TABLE OF CONTENTS viii
LIST OF TABLES xii
LIST OF FIGURES xiv
LIST OF ABBREVIATIONS xvi
CHAPTER
1 INTRODUCTION 1
2 LITERATURE REVIEW 4
2.1 Schizophrenia 4
2.1.1 History of Schizophrenia 5
2.1.2 Symptoms of Schizophrenia 6
2.1.3 Diagnosis 7
2.1.4 Brain Cognitive Test 9
2.1.5 Epidemiology of Schizophrenia 11
2.1.5.1 Environmental Factors 12
2.1.5.2 Genetic Factors 13
2.1.6 Multiplex Schizophrenia Families 16
2.2 Synaptic Transmission and Schizophrenia 17
2.2.1 Synapses 18
2.2.2 Synapse Formation and Specialization 20
2.2.3 Synaptic Cell Adhesion Molecules 21
ix
2.3 Neurexin (NRXN) 24
2.3.1 Structure and Role of Neurexin1 (NRXN1) 27
2.3.2 Synaptic Neurexin Neuroligin Complex 29
2.3.3 NRXN1 and Neuropsychiatric Disorder 32
2.4 Identify Copy Number Variations (CNVs) 33
2.4.1 Genomic Effects of CNVs 34
2.4.2 Functional Effects of CNVs 36
2.5 Single Nucleotide Polymorphisms (SNPs) 38
2.5.1 Linkage Disequilibrium and Haplotype 39
2.5.2 SNPs and Schizophrenia 40
2.5.3 NRXN1 SNPs 42
3 MATERIALS AND METHODS 43
3.1 Sample Collection 43
3.2 Trail Making Test (TMT) 44
3.2.1 TMT Part A 45
3.2.2 TMT Part B 45
3.2.3 TMT Derived Score 46
3.2.4 Statistical Analysis 46
3.3 DNA Extraction from Blood 47
3.4 Quantification of DNA Samples 48
3.5 Copy Number Assays 49
3.5.1 Genotyping Master Mix 49
3.5.2 Copy Number Reference Assay 49
3.5.3 NRXN1 Gene Copy Number Assays 50
3.5.4 Preparation of Reaction Mixture 52
3.5.5 Real Time PCR 53
3.5.6 Copy Number Quantification 53
3.5.7 Copy Number Quality Control 54
3.5.8 Statistical Analysis 55
3.6 SNP Assays 56
3.6.1 NRXN1 SNP Genotyping Assays 56
3.6.2 Reaction Mixture Preparation 58
3.6.3 Real Time PCR 59
3.6.4 Statistical Analysis 59
x
3.7 False Discovery Rate (FDR) 60
4 RESULTS 61
4.1 TMT Direct and Derived Scores 61
4.1.1 Descriptive Analysis 61
4.1.2 Correlation 63
4.2 Concentration and Purity of DNA Samples 65
4.3 NRXN1 CNVs 66
4.3.1 Distribution of NRXN1 Copy Number 66
4.3.2 Copy Number Mean of Samples 68
4.4 NRXN1 Copy Number and Brain Cognitive Function 71
4.5 NRXN1 SNPs 73
4.5.1 Allele and Genotype Frequencies 73
4.5.2 Linkage Disequilibrium 75
4.5.3 Haplotype Analysis 76
5 DISCUSSION 77
5.1 Brain Cognitive Function 77
5.2 NRXN1 CNVs 80
5.2.1 Intronic Deletions 80
5.2.2 CNVs Susceptibility Regions 81
5.2.3 CNVs and Cognitive Function 86
5.3 NRXN1 SNPs 89
5.4 Future Studies 93
6 CONCLUSION 95
xi
LIST OF REFERENCES 97
APPENDIX A – MINI INTERNATIONAL NEUROPSYCHIATRIC 117
INTERVIEW (M.I.N.I.)
APPENDIX B – RESEARCH CONSENT FORM 144
APPENDIX C – TRAIL MAKING TEST PART A 147
APPENDIX D – TRAIL MAKING TEST PART B 149
APPENDIX E – COPY NUMBER DATA FILE 151
OF CONTROL AND PATIENT GROUPS AT
NRXN1 INTRON 6, INTRON 7 – EXON 7,
INTORN 9 – EXON 10, INTRON 12 – EXON 13,
INTRON 15 – EXON 15, INTRON 16 – EXON 17,
INTRON 20
APPENDIX F – SNP MARKER RS2024513 DATA FILE 159
xii
LIST OF TABLES
Table Page
2.1 Proposed criteria for schizophrenia in DSM-5. The six criterions of
DSM-4 retained in DSM-5 with minor change in Criterion A and F
(Tandon and Carpenter, 2012).
9
3.1 Details of NRXN1 copy number assays.
51
3.2 Volume per well of component in reaction mixture for copy
number detection.
52
3.3 Five NRXN1 SNP assays and their respective context sequence.
57
3.4 Volume per well of reaction mixture components for SNPs
genotyping.
58
4.1 Mean of TMT scores between healthy controls and schizophrenia
patients.
62
4.2 Correlation matrixes of TMT scores for controls and patients.
64
4.3 Mean standard deviation of A260/A280, A260/A230 and DNA
concentration obtained from controls and patients.
65
4.4 Distribution of NRXN1 gene copy number in healthy controls and
schizophrenia patients.
67
4.5 Mean standard deviation of copy number (CN) in each NRXN1
gene CNV targeted regions.
69
xiii
4.6 Comparison of controls and patients CN mean against CN = 2.0
70
4.7 Correlation between NRXN1 target CNV regions and TMT scores.
72
4.8 Allele and genotype frequencies of five NRXN1 SNPs.
74
4.9 Pairwise linkage disequilibrium of five SNPs. The value of D‟
displayed at right diagonal while r2 value showed at the left
diagonal.
75
4.10 Haplotype associations of rs2024513 – rs12467557 at the NRXN1
gene.
76
xiv
LIST OF FIGURES
Figure Page
2.1 Risk of developing schizophrenia, for relatives of schizophrenia
probands compared to public. The percentages indicated in the key
refer to the proportion of genes shared (Klug et al., 2009).
16
2.2 Synaptic transmission begins with the arrived of nerve impulse
(Cowan et al., 2001).
19
2.3 The illustration of synaptic molecules interaction and the assumed
destinations of synaptic NRXNs and NLGNs. Dendritic structure
with receptors for neurotransmitter indicated on the right while
axons with vesicles of synapses showed on the left (Südhof, 2008).
23
2.4 Domain orientations of α-NRXN and β-NRXN (Reissner et al.,
2013).
24
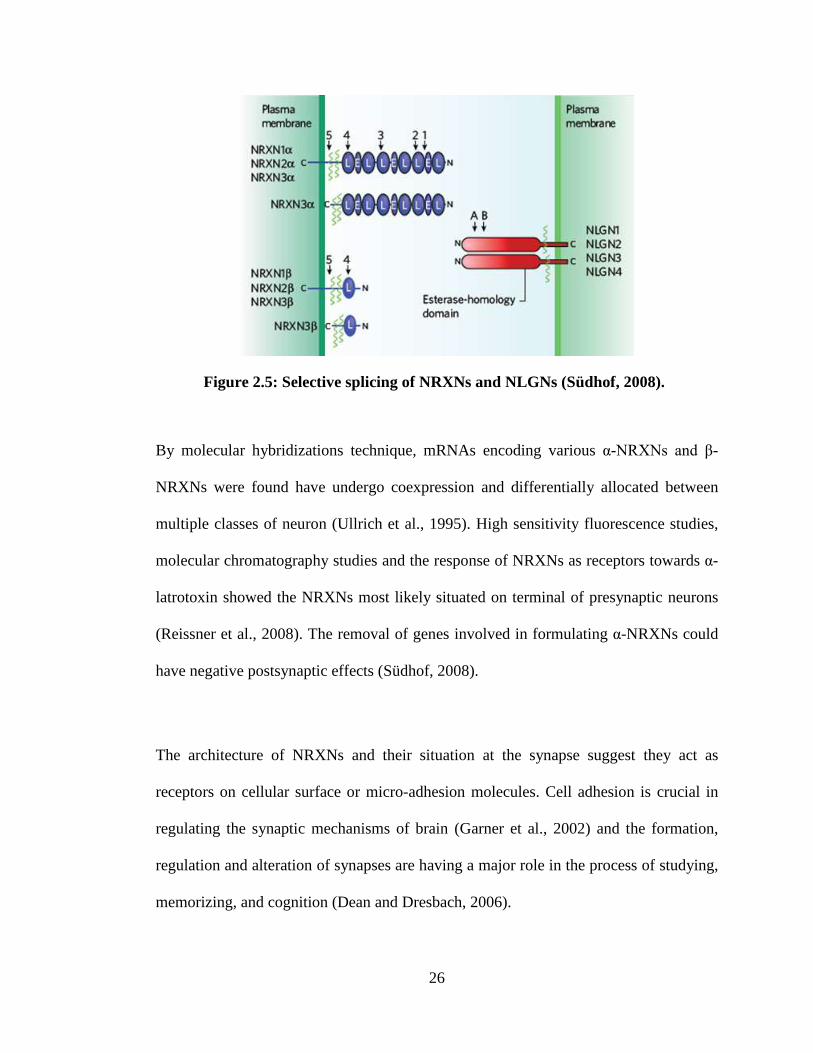
2.5 Selective splicing of NRXNs and NLGNs (Südhof, 2008).
26
2.6 The black panel on top indicates the selected band of chromosome
2p16.3. The blue tracks show the -NRXN1 and -NRXN1 gene
annotations in NCBI RefSeq whereas the red tracks indicate 3
other NRXN1 isoforms annotated in the Ensembl bioinformatics
database. -NRXN1 protein domain showed at the bottom panel
(Ching et al., 2010).
27
xv
2.7 Molecular illustration structure of the synapse interaction exists
between NLGN1 with NRXN1β (Südhof, 2008).
31
2.8 Structural variants involved different classes and formation
mechanisms (Weischenfeldt et al., 2013).
35
2.9 Illustration of CNVs in the genome and examples of outcome on
phenotypic variability (Hooli, 2011).
37
xvi
LIST OF ABBREVIATIONS
CNV Copy Number Variation
CN Copy Number
SNP Single Nucleotide Polymorphisms
NRXN1 Neurexin1 gene
PCR Polymerase Chain Reaction
WHO World Health Organization
ICD International Classification of Disease
DSM Diagnostic and Statistical Manual
TMT Trail Making Test
NRXN Neurexin protein
NLGN Neuroligin protein
PDZ PSD-95/D1g/ZO-1 domain
EGF Epidermal Growth Factor
CASK Calcium/Calmodulin-dependent Serine protein Kinase
SHK SRC Homology 3 domain
GUK Guanylate-Kinase domain
Array-CGH Array of Comparative Genome Hybridization
SV Structural Variation
VNTR Variable Number Tandem Repeat
NAHR Nonallelic Homologous Recombination
FoSTeS Fork Stalling and Template Switching
ASD Autism Spectrum Disorder
xvii
GWAS Genome Wide Association Studies
COMT Catechol-o-methytransferase
dNTPs Deoxyribonucleotide triphosphates
M.I.N.I Mini-International Neuropsychiatric Interview
OR Odds Ratio
CI Confidence Interval
HWE Hardy Weinberg Equilibrium
LD Linkage Disequilibrium
Tm Melting Temperature
HapMap Haplotype Map
NCBI National Center for Biotechnology Information
RefSeq Reference Sequence Database
FDR False Discovery Rate
1
CHAPTER 1
INTRODUCTION
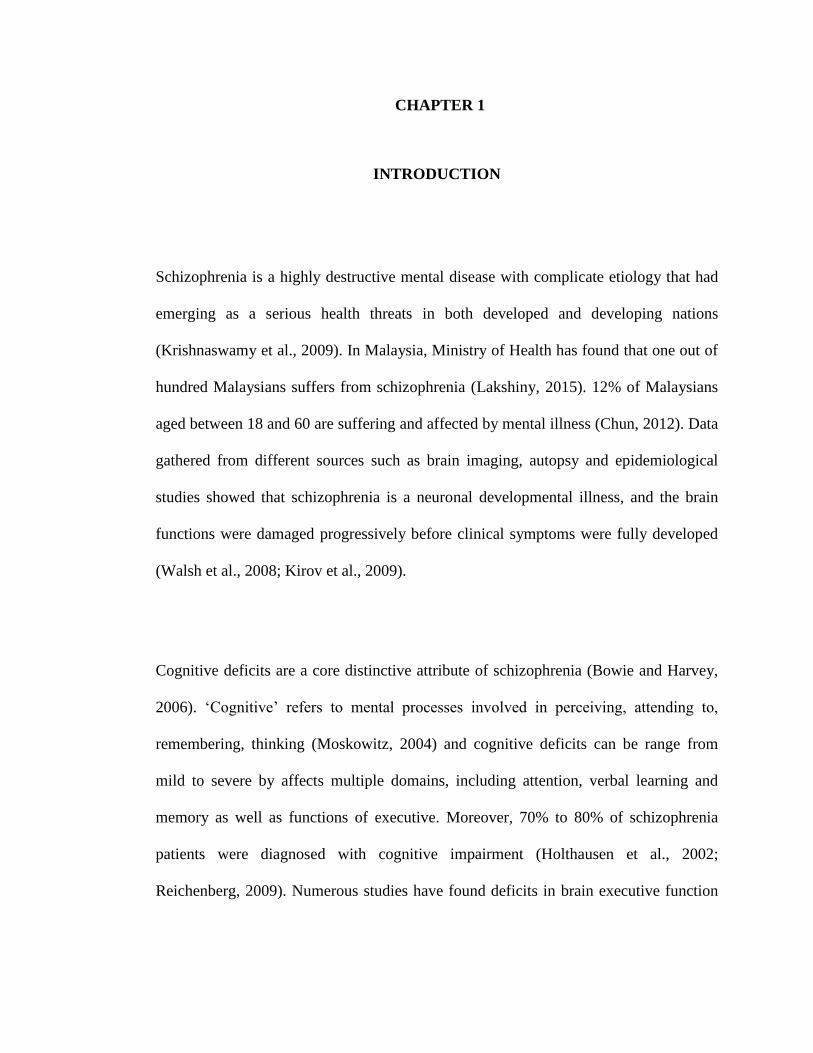
Schizophrenia is a highly destructive mental disease with complicate etiology that had
emerging as a serious health threats in both developed and developing nations
(Krishnaswamy et al., 2009). In Malaysia, Ministry of Health has found that one out of
hundred Malaysians suffers from schizophrenia (Lakshiny, 2015). 12% of Malaysians
aged between 18 and 60 are suffering and affected by mental illness (Chun, 2012). Data
gathered from different sources such as brain imaging, autopsy and epidemiological
studies showed that schizophrenia is a neuronal developmental illness, and the brain
functions were damaged progressively before clinical symptoms were fully developed
(Walsh et al., 2008; Kirov et al., 2009).
Cognitive deficits are a core distinctive attribute of schizophrenia (Bowie and Harvey,
2006). „Cognitive‟ refers to mental processes involved in perceiving, attending to,
remembering, thinking (Moskowitz, 2004) and cognitive deficits can be range from
mild to severe by affects multiple domains, including attention, verbal learning and
memory as well as functions of executive. Moreover, 70% to 80% of schizophrenia
patients were diagnosed with cognitive impairment (Holthausen et al., 2002;
Reichenberg, 2009). Numerous studies have found deficits in brain executive function
2
in schizophrenic patients (Periáñez et al., 2007). Catherine et al. (2010) reported
schizophrenic patients showed more indicators of left hemisphere damage.
One of the great remain challenges in psychiatry is to understanding the cause and
pathogenesis of schizophrenia (Owen et al., 2005). In Malaysia, the commonness of
mental sickness in the population of rural and urban area was 9.6% and 35%
respectively. Schizophrenia had emerged as a serious health threat in our nation and it
is equally serious forms of medical illness that should not be overlooked in a developed
nation (Lakshiny, 2015).
Synaptic dysfunction was suggested act as a key role of schizophrenia. The genetic
architecture of schizophrenia and the evidence for synaptic involvement was examined
in different studies (Rees et al., 2011; Kavanagh et al., 2015). Impairment of
glutamatergic signaling pathways take part in modulating synaptic plasticity could
attribute to the etiology of schizophrenia (Pocklington et al., 2014). Neurexin1
(NRXN1) acts as an important synaptic neuronal adhesion molecule that interacts
intimately with postsynaptic neuroligins in both glutamatergic and Gamma-
Aminobutyric acid-ergic (GABAergic) signaling pathway (Todarello et al., 2014).
Recently, many reports have suggested that chromosomal copy number deletions that
affect the gene Neurexin1 (NRXN1) increase the exposure of developing schizophrenia
(Zahir et al., 2007).
3
Structural alteration of NRXN1 gene in human genome had suggested as risk factor of
causing schizophrenia. Many evidence shown additional copy number variation (CNVs)
contributed to schizophrenia. Kirov et al. (2009) reported 19% cases versus 4% controls
of NRXN1 copy number deletion in case-control studies. Several groups have identified
copy number deletions were disrupting the NRXN1 N-terminal encoding regions
(Vrijenhoek et al., 2008; Rujescu et al., 2009). Moreover, reductions of NRXN1 copy
number were related to the mental retardation and delay of growth (Fredman et al.,
2004).
Single Nucleotide polymorphisms (SNPs) markers in NRXN1 gene region has been
studied to further investigate the role of NRXN1 in schizophrenia susceptibility. In a
Asian population case-control study, significant differences were observed in
frequencies of alleles between controls and patients at four SNPs (rs10490168,
rs2024513, rs13382584, rs1558852) in NRXN1 gene (Yue et al., 2011).
Pharmacogenetic analysis showed notable outcome of NRXN1 rs12467557 marker in
response to neuroleptics drug treatment. Besides that, association also found between
NRXN1 rs10490162 marker with treatment of antipsychotic drug (Jenkins et al., 2014).
Objectives of this study are: (1) to study the copy number variations of NRXN1 gene
and its association with brain cognitive function and (2) to study the association of
NRXN1 single nucleotide polymorphisms with schizophrenia between the subjects of
multiplex schizophrenia families and control families.
4
CHAPTER 2
LITERATURE REVIEW
2.1 Schizophrenia
National Institute of Mental Health reported schizophrenia has a worldwide incidence
of approximately 1 in 4000 people (Sahoo et al., 2011) and it‟s characterized by
psychotic symptoms, disorganized behavior, concern lacking and changed of emotional
reactivity (Sullivan et al., 2008; Sahoo et al., 2011). Besides that, the onset of
behavioral and cognitive symptoms usually exists since early of childhood although the
more significant features usually diagnosed in early twenties or late teens. These
symptoms may lead to impaired functioning in work, study, parenting and loss the
ability of independent living (Owen et al., 2005).
Due to relative common of the associated deficits and often life-long impacts of the
disorder, schizophrenia is one of the top ten important causes of disorder related
disability around the world (Switaj et al., 2012). In Asian country such as Malaysia,
there are rising in cases of schizophrenia patients that were newly diagnosed and proper
psychiatric care and medical treatment been given (Krishnaswamy et al., 2009). Many
patients loss the abilities of normal social functioning and cause distress to the patients
themselves and also to the society (ZamZam et al., 2011). Previous studies concluded
5
that the quality of life of schizophrenia patients were affected due to higher burden of
caregiver burden and their mental health problems (Chen and Greenberg, 2004;
Maruish, 2004).
Schizophrenia patients are usually impotent, isolated and vulnerable peoples in society
(Owen, 2012). Moreover, in addition to the core symptoms which result in impaired
functioning, schizophrenic patients also noticed with increased risk of alcoholic and
illegal use of drugs, violent victimization, post-traumatic stress disorder, instability of
housing, depression and smoking-related illness. Exposure to these risks increase
mortality rate of schizophrenia patients due to killing oneself (estimated at 5%),
accidents, or illness related to heart lung diseases (Mueser and McGurk, 2004).
National Academy of Sciences estimates the total financial costs of schizophrenia have
been account for 2.3% of combined burdens within developed countries (Sahoo et al.,
2011).
2.1.1 History of Schizophrenia
Schizophrenia was first characterized in 1893 by a German psychiatrist Emil Kraepelin,
under the name dementia praecox. Kraepelin characterize dementia praecox by
grouping the patients together according to previously diagnosed syndromes which
included hebephrenia, catatonia and paranoid dementia (Ebert and Bär, 2010).
Kraepelin found that dementia praecox usually began in late teens or early adulthood
unlike other dementia such as Alzheimer‟s disease which occurred later in life. He also
6
described dementia praecox as a deteriorating psychotic disorder whose primary
disturbance on cognition of patients rather than mood (Wing and Agrawal, 2003).
The belief of Kraepelin that dementia praecox was a deteriorating course and no chance
of recovery was being objected by other psychiatrist (Ebert and Bär, 2010). At the early
of the twenty century, dementia praecox was renamed by a Swiss psychiatrist Eugen
Bleuler. Bleuler realised that some patients show improvement after treatment rather
than continue to deteriorate as Kraepelin had suggested. Therefore, with other
observations, Bleuler used the term schizophrenia, from the Greek schizen „to split‟ and
phren „mind‟, to emphasise the feature that a serious fragmentation of thinking and
personality resulted from this illness (Ashok et al., 2012).
2.1.2 Symptoms of Schizophrenia
Schizophrenia is characterized based on a diverse set of symptoms and signs which
arise from almost all domains of brain including language, emotion, reasoning, motor
activity and perception. The indications of schizophrenia can be categorized into
negative, positive and cognitive features. Negative traits are related with normal
emotions and behaviors disruptions (Maat et al., 2012) Patients will show reduced in
expression of emotions via facial expression or voice tone, social withdrawal,
disorganization and will reduce. Positive traits are psychotic actions that unable to be
found in a normal individual (Hallak et al., 2013). The positive symptoms expressed by
patients include disorders of perception (hallucinations), inferential thinking (delusions)
7
and involuntary actions (catatonia). Cognitive features include poor executive
functioning, lacking for focusing abilities and deficit in memory (Green et al., 2015).
2.1.3 Diagnosis
A criterion-based approach for the diagnosis of schizophrenia was produced by the
American Psychiatric Association and World Health Organization (Andreasen, 2010).
Therefore, 10th International Classification of Disease (ICD) and 4th
version of
American Psychiatric Association‟s Diagnostic and Statistical Manual (DSM-IV) had
used as a guideline by physicians to diagnose the schizophrenia features and
impairment traits (First, Spitzer and Gibbon, 2002).
The DSM-IV has been widely used clinically due to high reliability, and legitimate in
diagnosis of schizophrenia (Tandon et al., 2009). Validity of DSM-IV widely supported
by a set of precursor factors (environmental risk factors, familial aggregation) (Bromet
et al., 2011), predictive (stability of diagnosis, response of treatment and illness course)
and validity factors (Korver-Nieberg et al., 2011). DSM-IV offered reliable and stable
diagnosis (Haahr et al., 2008), with more than 80% of individuals receiving an early
diagnosis of remaining that diagnosis between one to ten years (Bromet et al., 2011).
8
Tandon and Carpenter (2012) concluded that DSM-V had retained the central of the
DSM-IV diagnostic principle for schizophrenia. DSM-V was proposed mainly for
addition of updated data regarding the nature of the disease gathered in last twenty
years. Individuals who did (or did not) fulfill the DSM-IV traits for schizophrenia will
proceed to fulfill (or not meet) the DSM-V requirements. The six features (A to F) for
the schizophrenia diagnosis in DSM-IV remained with moderate changes made in
criteria A and F (Table 2.1). In DSM-V, mood disorder symptoms such as mania and
depression that exist during the period of psychotic illness were examined in order to
further diagnose the present of schizoaffective disorder (Tandon and Carpenter, 2012).
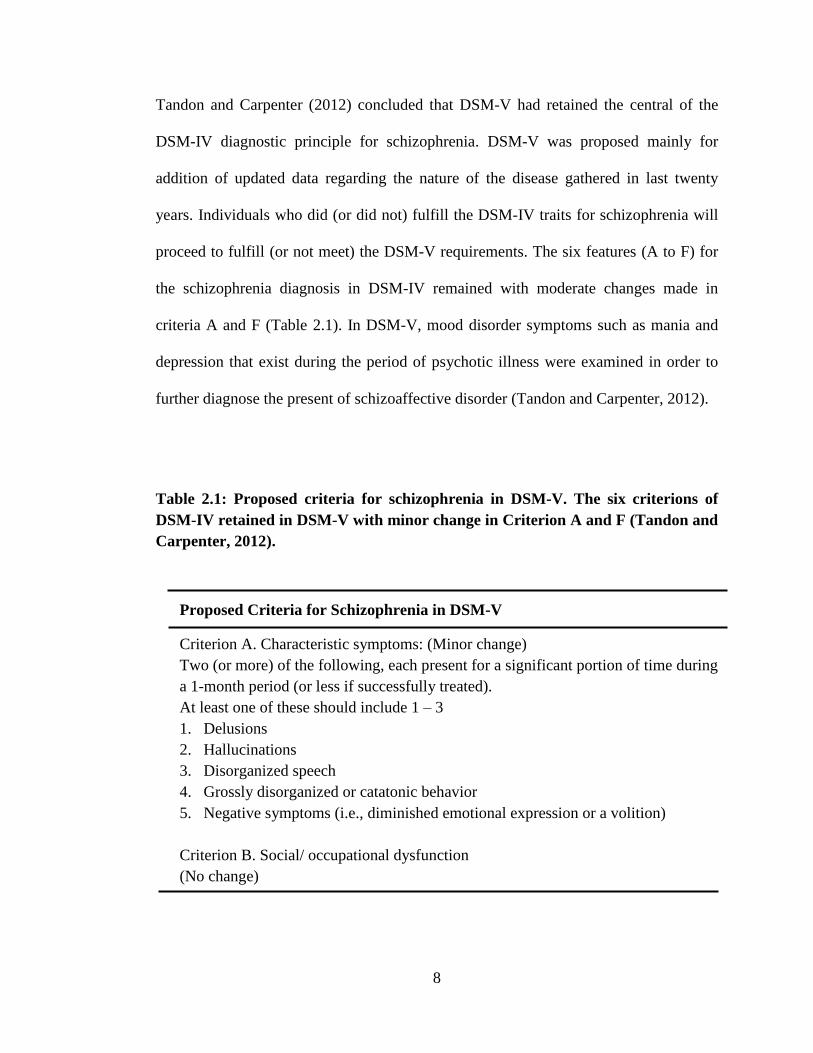
Table 2.1: Proposed criteria for schizophrenia in DSM-V. The six criterions of
DSM-IV retained in DSM-V with minor change in Criterion A and F (Tandon and
Carpenter, 2012).
Proposed Criteria for Schizophrenia in DSM-V
Criterion A. Characteristic symptoms: (Minor change)
Two (or more) of the following, each present for a significant portion of time during
a 1-month period (or less if successfully treated).
At least one of these should include 1 – 3
1. Delusions
2. Hallucinations
3. Disorganized speech
4. Grossly disorganized or catatonic behavior
5. Negative symptoms (i.e., diminished emotional expression or a volition)
Criterion B. Social/ occupational dysfunction
(No change)
9
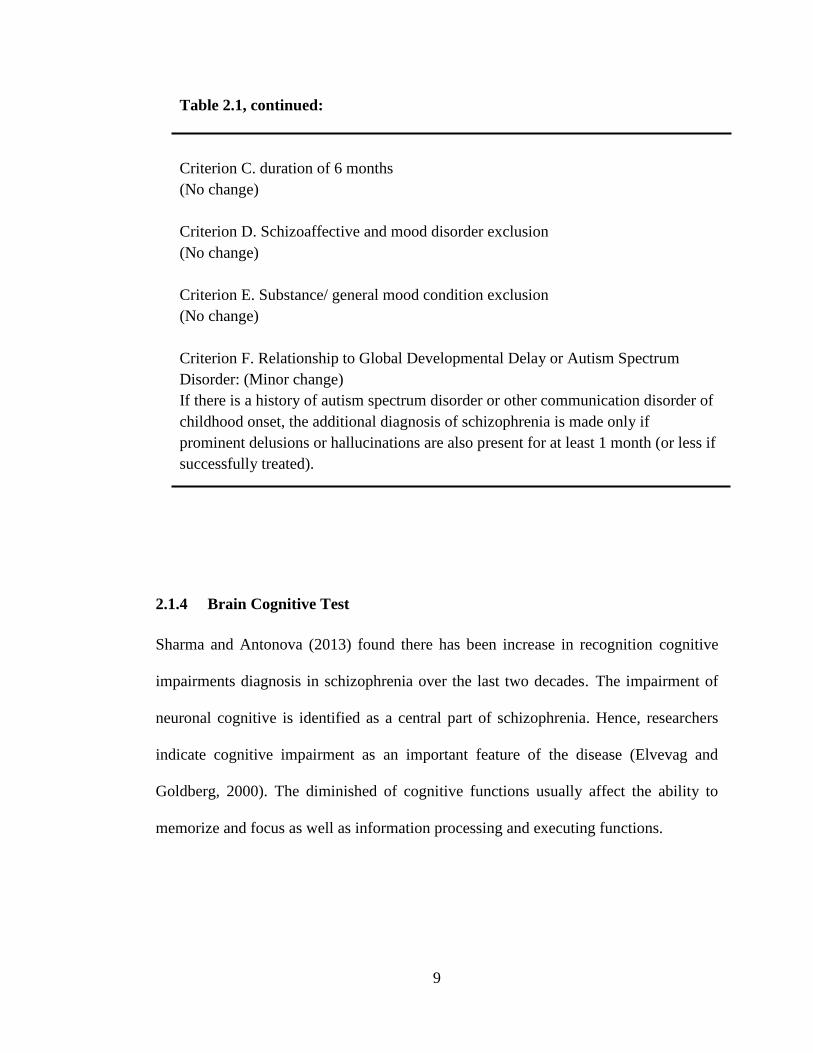
Table 2.1, continued:
Criterion C. duration of 6 months
(No change)
Criterion D. Schizoaffective and mood disorder exclusion
(No change)
Criterion E. Substance/ general mood condition exclusion
(No change)
Criterion F. Relationship to Global Developmental Delay or Autism Spectrum
Disorder: (Minor change)
If there is a history of autism spectrum disorder or other communication disorder of
childhood onset, the additional diagnosis of schizophrenia is made only if
prominent delusions or hallucinations are also present for at least 1 month (or less if
successfully treated).
2.1.4 Brain Cognitive Test
Sharma and Antonova (2013) found there has been increase in recognition cognitive
impairments diagnosis in schizophrenia over the last two decades. The impairment of
neuronal cognitive is identified as a central part of schizophrenia. Hence, researchers
indicate cognitive impairment as an important feature of the disease (Elvevag and
Goldberg, 2000). The diminished of cognitive functions usually affect the ability to
memorize and focus as well as information processing and executing functions.
10
Trail Making Test (TMT) is a neuronal mentality test used to assess the brain cognitive
function. It was initially formulated in military psychological test, and become widely
used indicator of mental damage (Arbuthnott and Frank, 2000). According to different
findings, TMT is useful in assess rapidity of brain processing, order alternation,
flexibility of cognitive function (Ríos et al., 2004), visual search, executive functioning
and execution of movement (Stuss et al., 2001).
The test has two sections (A and B) that should be carried out rapidly with fewer
mistakes made. The outcome from each section represents the number of time needed
to finish the task. Besides the two direct measure results, some researchers have
suggested modified indexes to enhance the illustration of cognitive skills used to
complete the test. The dissimilarity score (B – A) is aim to reduce the speed factor from
the test evaluation (Salthouse et al., 2000). The B/A ratio score serve as a measurement
of executive control ability referring to the correlation with task-switching function
(Periáñez et al., 2007).
Some neuronal psychological finding shows the presence of association between brain
frontal lobe damage resulted from traumatic injury and weak TMT performance. In a
TMT assessment made by Stuss et al. (2001), patients with brain frontal lobe damaged
were classified into separated groups in order to highlight the relations between brain
frontal lobes and specific behavior (Hashimoto et al., 2006). The dorsolateral frontal
11
areas damaged patients were found out had more weakened in TMT-B performance
compared with patients who having damage at inferior medial area of frontal lobes.
2.1.5 Epidemiology of Schizophrenia
In developed nation, schizophrenia is usually life-long threatening and approximately
one in hundred persons have or prone to develop schizophrenia during their duration of
life. Rates of schizophrenia are very identical between Asian and Western countries
with minor regional variations (Schizophrenia Research Institute, 2013). Moreover, the
lifetime relative risk of developing schizophrenia ranges from 0.3 to 2% with an
average recurrence frequency of 0.7% (Saha et al., 2007).
The National Health and Morbidity Survey which conducted by Ministry of Health,
Malaysia shown 20% Malaysians adolescence and adulthood are suffering from
different kinds of psychiatric disorder. In Malaysia, there were more than 7000
schizophrenia cases registered from 2003 to 2005 under Malaysia National Mental
Health Registry (Aziz, 2008). The distribution of schizophrenic patient‟s ethnic group
in Malaysia were 54% Malays, 28% Chinese, 9% Indians and 9% others. This figure is
also constantly matched with the ethnic group distribution in our country.
12
In developed countries, schizophrenia is a leading cause of early death (Lewis et al.,
2003; Krishnaswamy et al., 2009) and the lifetime prevalence of suicide is 10% among
patients (Siris, 2001). There are more than half of schizophrenia patients attempted to
kill own self and 5% had caused their own death. The mortality rate of people with
schizophrenia is almost three times higher than the public population, and life state is
reduced by more than 15 years (Schizophrenia Research Institute, 2013). According to
the registered schizophrenia cases in Malaysia, more than 60% were males. Most of the
patients were developed the illness at the age of 30 and symptoms appeared earlier in
male as compared to female (Ministry of Health Malaysia, 2009).
2.1.5.1 Environmental Risk Factors
Environmental factors might associate with increased incidence of schizophrenia and
they include migrant status, urbanity and economic status (Cantor-Graae et al., 2003).
Substantial evidence has been indicate that individuals live in an urban environment are
more presumably to develop the disorder compare with those who living in rural areas
(Boydell et al., 2003). Migration has also been related with an increased risk of
schizophrenia. Other environmental factors include viruses exposure or malnutrition
before birth and potentially socioeconomic and psychosocial factors. These may play a
role in early death of patients who smoking or illicit drug uses, heart failure and
diabetes mellitus (Saha et al., 2007; Brown et al., 2005).
13
Other known associated environment factors are maternal malnutrition during
pregnancy, maternal infection in uterus (Saha et al., 2007) and obstetrical complications
such as prematurity, low birth weight and complications of delivery (Cannon et al.,
2003). Another potential cause is the effect of early childhood trauma which involves a
range of severe negative experiences, including physical, mentally and sexually abuse
(Boydell et al., 2003). The environment pressure could influence the way of a gene
changes over a lifetime. The epigenetic progress could be thought of as a turn on and
off of functional genes at different stage of life. More general environmental risk
factors include lower social class, social stress, low IQ score and illicit drug abuse
(Cantor-Graae et al., 2003; Saha et al., 2007).
2.1.5.2 Genetic Risk Factors
In the search of unravel the patho-etiology of schizophrenia, genetics candidates
identified in Human Genome Project providing explanatory models that could strongly
support identified environmental factors (Pickers, 2005). The outcomes from clinical
studies indicated that the risk of developing the disorder is largely attributable to strong
genetic risk factors. The problems of genetic causing to this disease may arise from
multiple genes involved in neuronal pathway regulations (Owen et al., 2005; Stefansson
et al., 2008). The heritability of schizophrenia within family has been hard to trace
because of great changes in environment factors and separating genetic cause (Owen,
2012). A research done by Gottesman and Shields were able to show that schizophrenia
runs in families (Gottesman, 1991). The observed chance of developing schizophrenia
14
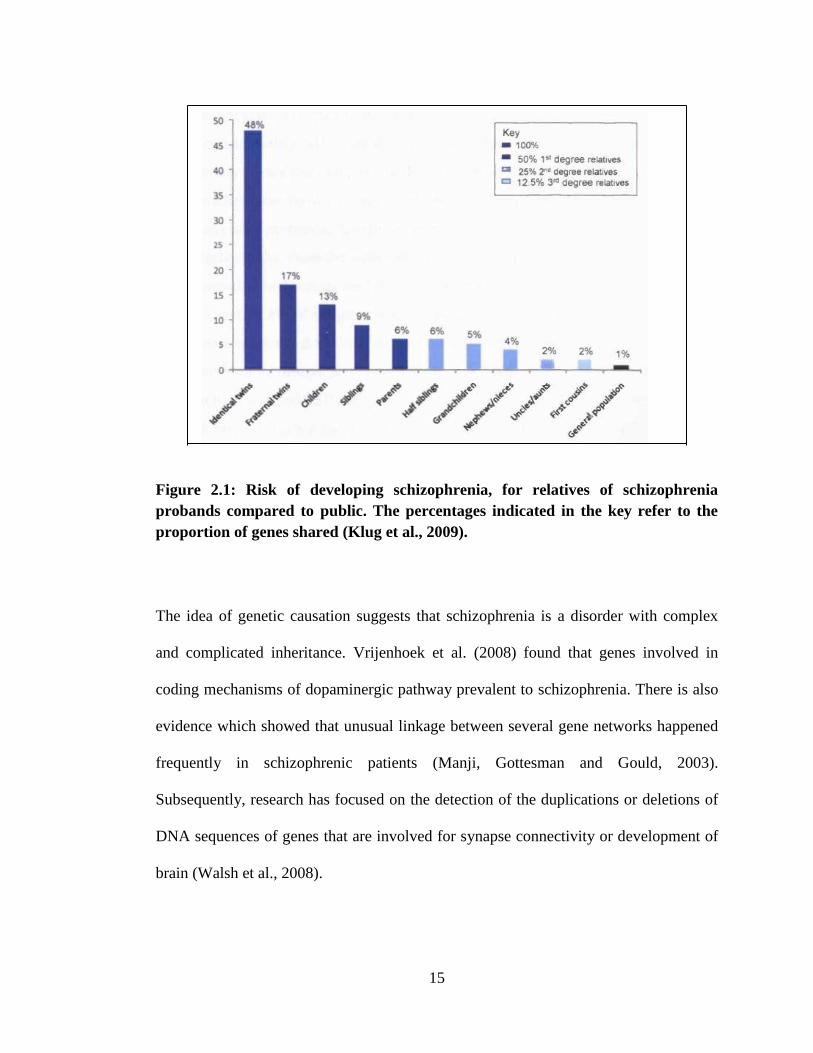
was found to be at a higher prevalence in the relatives of affected individuals. The risk
of schizophrenia developed in general population is approximately ~1% throughout the
lifetime. This contrasts with the average risk to siblings (9%) and offspring (13%) of
affected probands. Furthermore, an identical (monozygotic) twin who shares 100% of
their genes with a proband has a risk of almost 50% (Figure 2.1). Twins were found
that with a higher heritability rate, and implicate that gene factors play a key role of the
disease (Owen, O‟Donovan and Harrison, 2005).
Adoption studies reveal that schizophrenia patients first-degree relatives have 10-fold
increased risk of having the disorder as compared to public population (Hoffman and
McGlashan, 2001). Additionally, offspring born to mothers with schizophrenia, who
are adopted out, still have a significantly elevated chance of encounter the disorder.
When two parents have schizophrenia, there is a 27.3% risk their offspring will develop
the disorder (International Schizophrenia Consortium, 2008).
15
Figure 2.1: Risk of developing schizophrenia, for relatives of schizophrenia
probands compared to public. The percentages indicated in the key refer to the
proportion of genes shared (Klug et al., 2009).
The idea of genetic causation suggests that schizophrenia is a disorder with complex
and complicated inheritance. Vrijenhoek et al. (2008) found that genes involved in
coding mechanisms of dopaminergic pathway prevalent to schizophrenia. There is also
evidence which showed that unusual linkage between several gene networks happened
frequently in schizophrenic patients (Manji, Gottesman and Gould, 2003).
Subsequently, research has focused on the detection of the duplications or deletions of
DNA sequences of genes that are involved for synapse connectivity or development of
brain (Walsh et al., 2008).
16
2.1.6 Multiplex Schizophrenia Families
Study design is a crucial component in the research of human genetics. The major
approaches are case–control studies and pedigree-based studies. Besides that, the
presence of other affected relatives of patients could be focused through the approach
of multiplex families study (Sullivan, Daly and O'Donovan, 2012). „Multiplex‟ refers to
multiple individuals that are affected by a specific disease within families (Sanders,
2013). According to Sullivan, Daly and O'Donovan (2012), multiplex families were
focused in human genetics studies under the assumption that these families are enriched
for causal genetic risk factors with greater penetrance.
Myles-Worsley et al (2007) had figured out the recurrence risk of schizophrenia in
offspring through multiplex families study. The recurrence rate was found to be 23.4%
in the offspring with one affected parent, 6.4% in offspring with one affected aunt/uncle,
and 15.0% in offspring with two or more affected aunts/ uncles. In the association study
of de novo CNVs with schizophrenia, Wang et al (2013) reported that multiplex
families study could accommodate the dependence among family members and the
genetic variation in each family could be further quantified. Besides that, Shedlack et al
(1996) found that schizophrenic siblings were significantly more impaired in cognitive
tests and familial effect was noticed during the reading ability and attention tests.
Moreover, Huepe et al (2012) suggested that multiplex families study was useful in
highlighted the degree of cognitive impairments between schizophrenic patients and
their first degree relatives from respective family.
17
2.2 Synaptic Transmission and Schizophrenia
The sensory inputs are integrated and processed by brain to produce motor outputs
which important for organism to sustain their life. Cascades of synapses in nervous
system responsible for information transformation and the cascades assembled in
overlapping of multiple neural circuits. Synapses take part in all information processing
of brain, and most of the malfunctions of brain function could caused from synaptic
function abnormalities either in direct or indirect effect (Koester and Sakmann, 2000).
Synapse-related deficits appear to be widespread in schizophrenia. Deterioration of
synapses could affect several cortical and subcortical region of brain, such as
GABAergic and glutamatergic transmission pathways (Hashimoto et al., 2006; Shatz,
2009). Schizophrenia could be developed due to abnormal neuronal development and
malfunction of synaptic flexibility and its transmission (Stellwagen and Malenka, 2006).
Structural and functional synaptic impairment are actively contributing elements to the
schizophrenia development and its pathology (Faludi and Mirnics, 2011).
18
2.2.1 Synapses
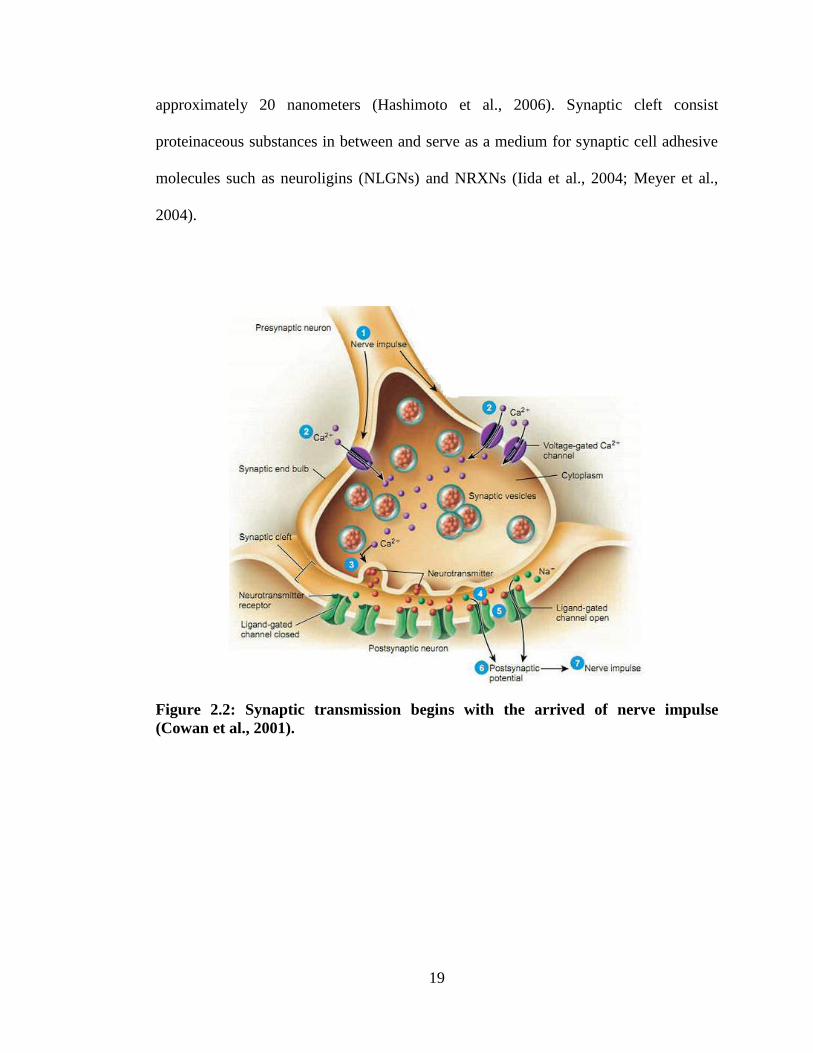
Synapses are group of confined intercellular junctions exclusively in transmission of
electrical or chemical signal from a neuron to another (Figure 2.2). Synapses are
asymmetrically inherited, transferring information with fast mechanism, and are highly
flexible (Chung and Barres, 2011). Synapses have various characteristics that are
categorized by both the pre-transmission synaptic neurons and postsynaptic neurons.
Information transmission of synapses is rapid, accurate, efficient and closely regulated.
When presynaptic terminal invaded by an action potential, calcium ion channels
unlocked and inflowing of calcium ion stimulates the fusion between presynaptic
plasma membrane and synaptic vesicles. Neurotransmitters in the vesicles released into
the synaptic cleft (Missler et al., 2003). Information transfer process completed when
neurotransmitters bind with receptors presence on postsynaptic neurons. The vesicle
fusion occurred in presynaptic neurons and receiving of signals at postsynaptic neurons
are the main steps in the overall process are happened incredibly rapid. The time course
of synaptic transmission initiating in less than 1 millisecond as measured
electrophysiologically (Faludi and Mirnics, 2011).
From the composition, synapses are distinguished by intracellular layer present on
surface of the presynaptic plasma layer and postsynaptic membrane of plasma.
Presynaptic neuron‟s plasma membrane always aligned in intact structure with
postsynaptic neurons, and the membrane are isolated apart by a cleft of synapse
19
approximately 20 nanometers (Hashimoto et al., 2006). Synaptic cleft consist
proteinaceous substances in between and serve as a medium for synaptic cell adhesive
molecules such as neuroligins (NLGNs) and NRXNs (Iida et al., 2004; Meyer et al.,
2004).
Figure 2.2: Synaptic transmission begins with the arrived of nerve impulse
(Cowan et al., 2001).
20
2.2.2 Synapse Formation and Specialization
Synapses existed between neurons in the nervous system through the process of
synaptogenesis. Configuration and specification of synaptic variety are closely
connected and relies mainly to mechanisms of synaptic molecules which involve in
adhesion of cells (Iida et al., 2004; Craig and Kang, 2007). The wide ranges of synapses
are because of dissimilarity in the components of released neurotransmitter and receptor
machineries. Moreover, synapse formation mainly based on differences of machineries
organization. Synapse alignment and specification probably take part in three steps:
neural growth cone by early stage recognition of the target cell, forming junctions of
synaptic with involvement of synaptic elements, and readily of synaptic junctions with
specified localized circuit (Cowan et al., 2001).
More efforts have to be made to understand the biological mechanisms involved
synapse development and the characterization of synapse diversity and processes
facilitating the assembly of synapses into circuits of nervous systems (Chung and
Barres, 2011). For accurate and rapid neuronal pathway function, the development and
synapses characterization is crucial. The information receiving and response properties
remain intact in a neuronal circuit by synaptic connectivity and the multiple roles of
individual synapses in the circuit (Dean and Dresbach, 2006). All individual synapses
comprising the circuit play an important role in the pattern of circuit connectivity.
Alteration in synaptic strength and synaptic flexibility can absolutely modify the
21
corresponding attributions of separated synapses in a neuronal pathway (Faludi and
Mirnics, 2011).
2.2.3 Synaptic Cell-Adhesion Molecules
Vertebrate NRXNs and NLGNs are conceivably the most well-studied synaptic
molecules in adhesion of neuronal cells (Dean and Dresbach, 2006) and they are the
only synaptic molecules that well characterized and a specifically synaptic role has
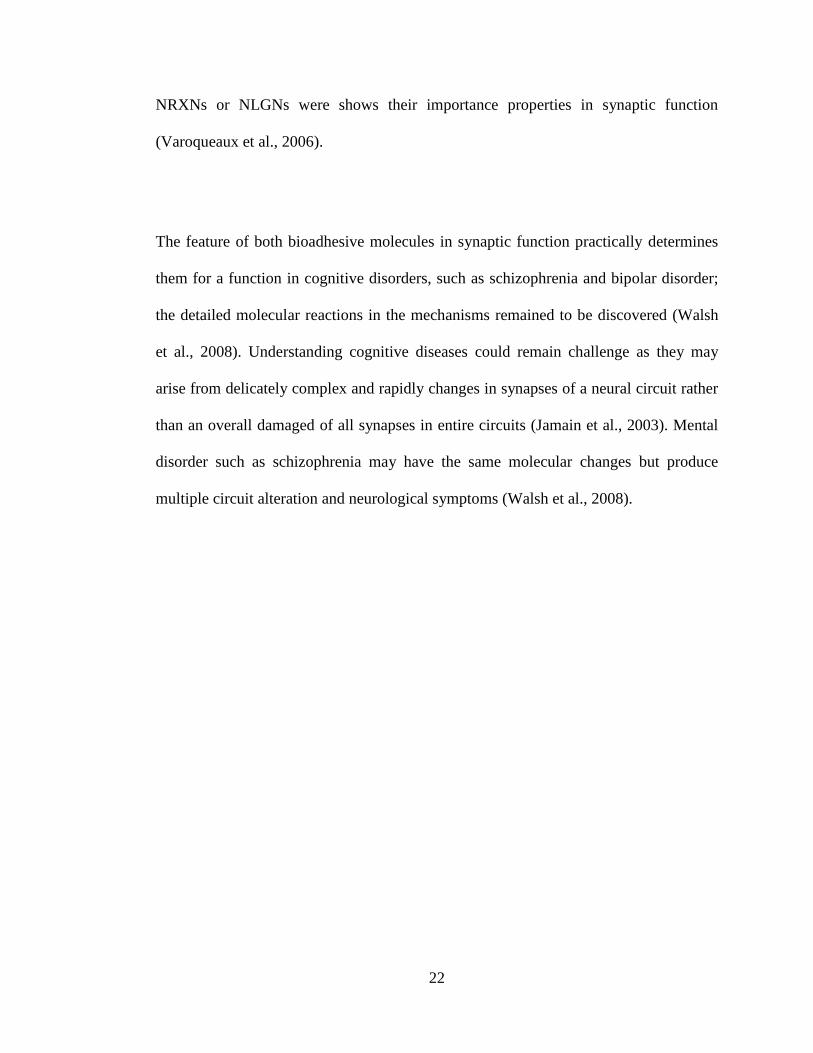
been discovered (Figure 2.3) (Craig and Kang, 2007). NRXNs and NLGNs function as
molecules involved in adhesive of synapses and these molecules are essential for
operative of synapse (Missler et al., 2003). They are mainly affecting trans-synaptic
activation of synaptic transfer of information (Varoqueaux et al., 2006). Dysfunction of
NRXNs and NLGNs disrupts the intactness of synapses and obstruct neural networks
without fully eradicate synaptic transmission (Sheckler et al., 2006).
NLGNs consists a huge domain presence outer membrane that share sequence
homology with acetylcholinesterase and that is important for NRXNs attachments and
synpatogenic events. As molecules involved in bioadhesive of cells, NRXNs and
NLGNs mostly react by attach to one another via interaction with intracellular organic
compounds particularly the PSD-95/Dlg/ZO-1 (PDZ) domain (Dean and Dresbach,
2006). Upon binding NRXNs, NLGNs facilitate synapse signaling, recruit
neurotransmitter receptors, and mediate neural networks and synaptic works. A severe
marked deficit and disrupted in synaptic information transferring of mice deficient of
22
NRXNs or NLGNs were shows their importance properties in synaptic function
(Varoqueaux et al., 2006).
The feature of both bioadhesive molecules in synaptic function practically determines
them for a function in cognitive disorders, such as schizophrenia and bipolar disorder;
the detailed molecular reactions in the mechanisms remained to be discovered (Walsh
et al., 2008). Understanding cognitive diseases could remain challenge as they may
arise from delicately complex and rapidly changes in synapses of a neural circuit rather
than an overall damaged of all synapses in entire circuits (Jamain et al., 2003). Mental
disorder such as schizophrenia may have the same molecular changes but produce
multiple circuit alteration and neurological symptoms (Walsh et al., 2008).
23
Figure 2.3: The illustration of synaptic molecules interaction and the assumed
destinations of synaptic NRXNs and NLGNs. Dendritic structure with receptors
for neurotransmitter indicated on the right while axons with vesicles of synapses
showed on the left (Südhof, 2008).
Recently, various studies have determined genes mutations encoding NRXNs and
NLGNs to be the root of distinct cognitive disorders such as schizophrenia (Feng et al.,
2006; Kim et al., 2008; Zahir et al., 2007). Thus, NRXNs and NLGNs act as essential
molecules for synaptic cell adhesion that induces signaling between presynaptic and
postsynaptic components (Marshall, 2008). The information transfer is core to the
brain‟s capability in processing and is a main cause of cognitive disorders (Yan et al.,
2008). Mutations in NRXNs and NLGNs have been identified to cause malfunctions in
synaptic transmission of neural circuits and result in cognitive diseases, especially
schizophrenia and ASDs (Kirov et al., 2009; Südhof, 2008).
24
2.3 Neurexin (NRXN)
The poison released by black-widow spider made up of a vertebrate targeted toxin
known as α-latrotoxin. This toxin acts as an organic compound that adheres to
presynaptic receptors and mediates a large amount generate of neurotransmitters
(Ushkaryov et al., 1992). NRXNs were found as α-latrotoxin receptors. NRXNs are
type I transmembrane organic compounds with one path transmembrane helix (TM)
that isolates cytosolic intracellular domains and extracellular amino-terminal. It can be
categorized as two kinds: α-NRXNs and β-NRXNs. α-NRXNs are sizable than β-
NRXNs. These two kinds of NRXNs made up of unalike amino end extracellular chain
but with interchangeable carboxyl end transmembrane areas and cytoplasmic tails
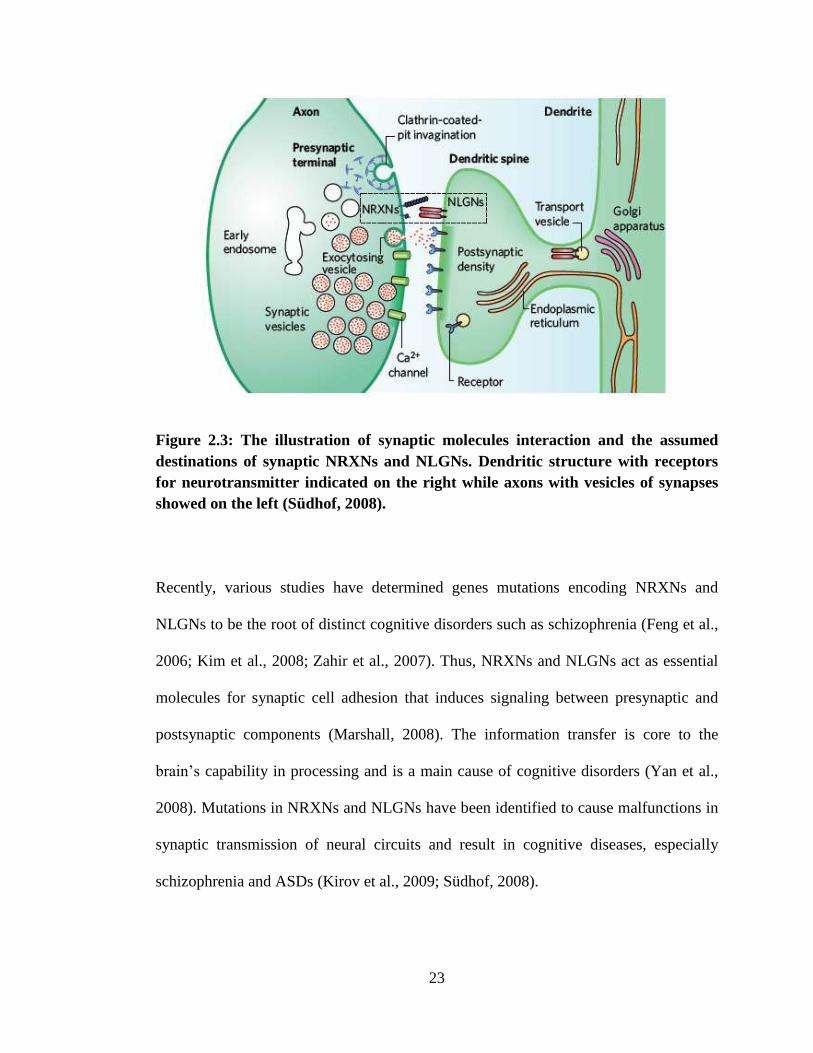
(Figure 2.4). Structurally, α-NRXNs have six laminin/ neurexin/ sex-hormone-binding
(LNS) globulin domains with three epidermal growth factor (EGF)-like domains in
between, whereas β-NRXNs consist only one LNS domain (Ullrich et al., 1995; Jenkins
et al., 2014).
Figure 2.4: Domain orientations of α-NRXN and β-NRXN (Reissner et al., 2008).
25
Neurexin is a sequence of LNS-EGF-LNS with three times replicated in α-neurexin
whereas β-neurexin consists of one exon that encodes unique 37 histidine-rich residues
and a signal peptide (SP), the rest of its structure is similar to α-neurexin initiate from
the last LNS domain (Reissner et al., 2008).
The genome of mammal consists three NRXN genes (NRXN1, NRXN2 and NRXN3),
every one of them making a lengthy mRNA translated to form α-NRXNs and a short
mRNA forming β-NRXNs after transcription from independent promoters (Tabuchi and
Südhof, 2002). Moreover, by depending on different sensory inputs, substantial
selectively joining between encoded organic compounds at distinct canonical junctions
could produce variety kinds of NRXN isoforms (Ullrich et al., 1995) (Figure 2.5).
Therefore, specific NRXNs isoforms standing for independent „code‟ were formed
during synapse transmission.
NRXNs selectively splice reaction is modulated apart and modified through neuronal
events (Ullrich et al., 1995; Tabuchi and Südhof, 2002). α-NRXNs contain five
canonical splicing junction while β-NRXNs only contain two. The first splice region at
C-terminal next to the EGF-parallel region placed at first of sequence. The following
splice junctions are at identical places in another three LNS domains (Figure 2.5). The
last splice site is present in between the transmembrane region and the glycosylated
carboxyl sequence.
26
Figure 2.5: Selective splicing of NRXNs and NLGNs (Südhof, 2008).
By molecular hybridizations technique, mRNAs encoding various α-NRXNs and β-
NRXNs were found have undergo coexpression and differentially allocated between
multiple classes of neuron (Ullrich et al., 1995). High sensitivity fluorescence studies,
molecular chromatography studies and the response of NRXNs as receptors towards α-
latrotoxin showed the NRXNs most likely situated on terminal of presynaptic neurons
(Reissner et al., 2008). The removal of genes involved in formulating α-NRXNs could
have negative postsynaptic effects (Südhof, 2008).
The architecture of NRXNs and their situation at the synapse suggest they act as
receptors on cellular surface or micro-adhesion molecules. Cell adhesion is crucial in
regulating the synaptic mechanisms of brain (Garner et al., 2002) and the formation,
regulation and alteration of synapses are having a major role in the process of studying,
memorizing, and cognition (Dean and Dresbach, 2006).
27
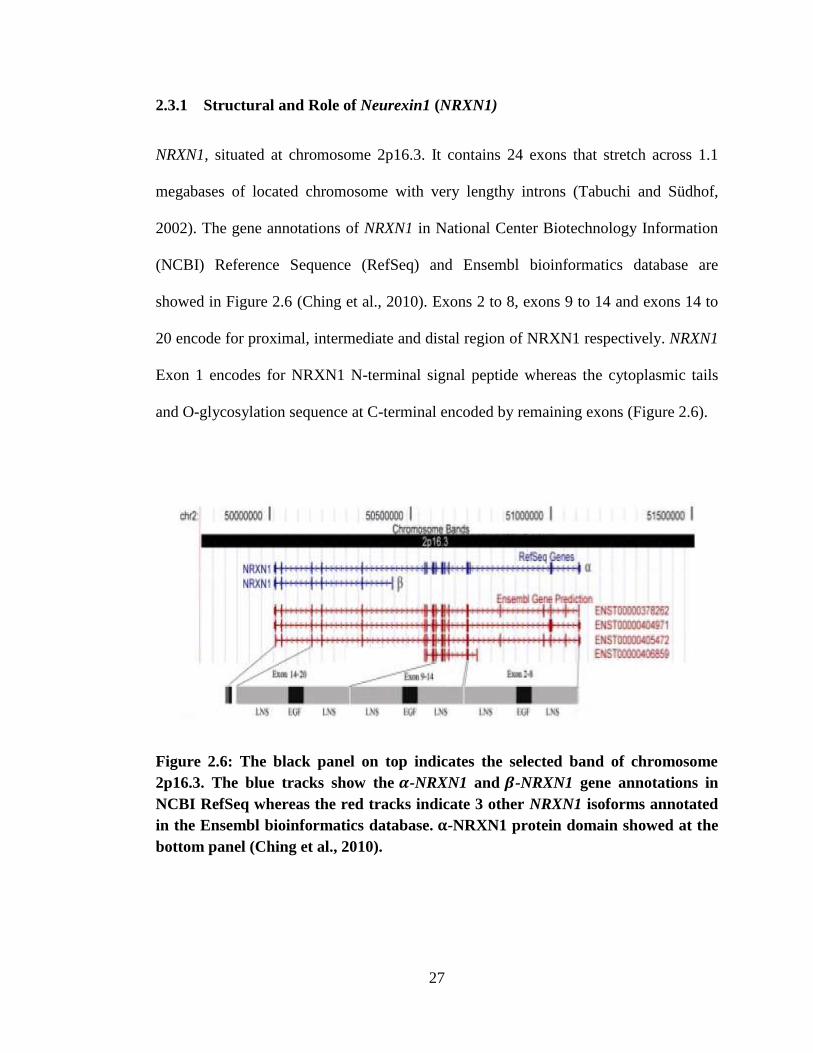
2.3.1 Structural and Role of Neurexin1 (NRXN1)
NRXN1, situated at chromosome 2p16.3. It contains 24 exons that stretch across 1.1
megabases of located chromosome with very lengthy introns (Tabuchi and Südhof,
2002). The gene annotations of NRXN1 in National Center Biotechnology Information
(NCBI) Reference Sequence (RefSeq) and Ensembl bioinformatics database are
showed in Figure 2.6 (Ching et al., 2010). Exons 2 to 8, exons 9 to 14 and exons 14 to
20 encode for proximal, intermediate and distal region of NRXN1 respectively. NRXN1
Exon 1 encodes for NRXN1 N-terminal signal peptide whereas the cytoplasmic tails
and O-glycosylation sequence at C-terminal encoded by remaining exons (Figure 2.6).
Figure 2.6: The black panel on top indicates the selected band of chromosome
2p16.3. The blue tracks show the -NRXN1 and -NRXN1 gene annotations in
NCBI RefSeq whereas the red tracks indicate 3 other NRXN1 isoforms annotated
in the Ensembl bioinformatics database. -NRXN1 protein domain showed at the
bottom panel (Ching et al., 2010).
28
NRXN1 was subjected to large scale alternative splicing, which regulated by regional
neuronal action potential via calcium/calmodulin-dependent kinase IV signaling
cascade either temporally or spatially (Rujescu et al., 2009). NRXN1 is among the
sizable studied human genes and it can be influenced by gene alterations including
point mutation, rearrangement, loss of entire gene, and copy number duplications
(Kirov et al., 2009).
Close and rapid interaction was found between α-NRXN1 and isoforms of neuroligin
and neurexin-attach organic compounds called neurexophilins. This protein located
presynaptically and is needed for calcium-triggered neurotransmitter releasing (Zhang
et al., 2005) and involved in mechanism of electric potential difference calcium
channels at brainstem and neocortex synaptic junction (Dudanova et al., 2007). Mice
knockoffs of the three α-NRXNs cause severe impaired of synaptic function while no
severe malfunctions of axonal path finding in the process of development was
demonstrated (Dudanova et al., 2007). Mice with single removes of α-NRXN genes
have unexceptional reduced in postnatal mortality. Mice with double knockout
encounter high reduction of postnatal viability rate. Triple knockout of α-NRXNs in
mice cause the subjects could not sustain oneself past the very early stage of living
(Missler et al., 2003).
29
-NRXN1 is much smaller than -NRXN1. -NRXN1 has been found interacting with
the cell adhesion organic molecules of neuroligin family (Sugita et al., 2001) and
dystroglycans (Tabuchi and Südhof, 2002; Chen et al., 2008). Moreover, there was no
animal studies with -NRXN1 knockouts, either single or multiple knockouts involved
-NRXN1, have yet been carried out (Südhof, 2008).
2.3.2 Synaptic Neurexin –Neuroligin Complex
A trans synapses composite structure was configured by NRXNs with NLGNs formed
at the middle of the synaptic knob, with the C-terminus amino acid chain protruding
outside the complex in contrary directions (Figure 2.7). The fluorescence stained
organic compound of interaction at membrane layer across synaptic cleft able to be
seen under high resolution electron microscopy. The interaction layers of presynaptic
neurons are differentiated apart from postsynaptic neurons by the glycosyl group
attachment which exists at NLGNs and NRXNs of exterior part of membrane (Südhof,
2008). These glycosylated chains act as an interaction zone that generates a gap
between the membrane of plasma and the interaction layer. It facilitates the outer
cellular chemical interaction to be placed at synaptic cleft apart of the membrane
(Missler et al., 2003).
30
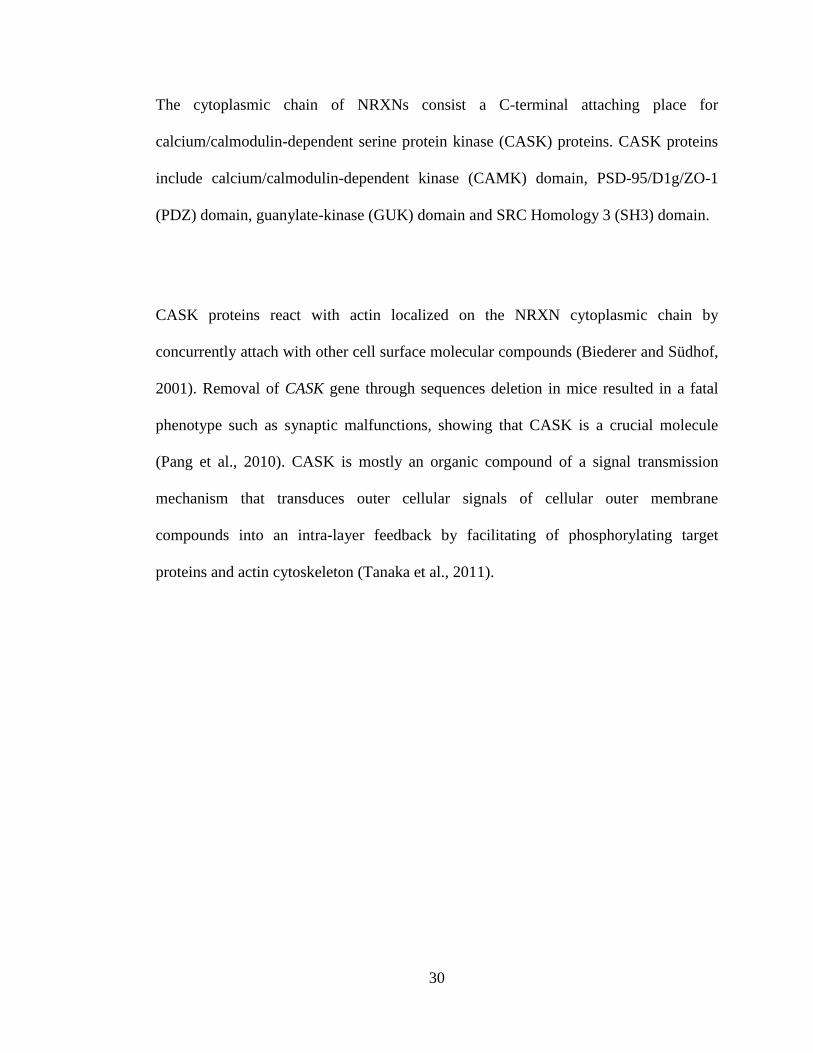
The cytoplasmic chain of NRXNs consist a C-terminal attaching place for
calcium/calmodulin-dependent serine protein kinase (CASK) proteins. CASK proteins
include calcium/calmodulin-dependent kinase (CAMK) domain, PSD-95/D1g/ZO-1
(PDZ) domain, guanylate-kinase (GUK) domain and SRC Homology 3 (SH3) domain.
CASK proteins react with actin localized on the NRXN cytoplasmic chain by
concurrently attach with other cell surface molecular compounds (Biederer and Südhof,
2001). Removal of CASK gene through sequences deletion in mice resulted in a fatal
phenotype such as synaptic malfunctions, showing that CASK is a crucial molecule
(Pang et al., 2010). CASK is mostly an organic compound of a signal transmission
mechanism that transduces outer cellular signals of cellular outer membrane
compounds into an intra-layer feedback by facilitating of phosphorylating target
proteins and actin cytoskeleton (Tanaka et al., 2011).
31
Figure 2.7: Molecular illustration structure of the synapse interaction exists
between NLGN1 with β-NRXN1 (Südhof, 2008).
At the dendritic spine site, postsynaptic density protein 95 (PSD95) domain binds to
intracellular adaptor proteins which then included postsynaptic sites recruitment of
glutamate receptors (Biederer and Südhof, 2001). Postsynaptic adaptor proteins
attached to synaptic junctions through these multiple domains interaction. As the
outcome of the attachment to PDZ domain compounds, the space created by NLGNs
and NRXNs maintain regulated and resembles the structure of close regulated junctions
(Missler et al., 2003).
32
2.3.3 NRXN1 and Neuropsychiatric Disorder
There are many facts that NRXN1 deletions (Glessner et al., 2009), point mutations
(Yan et al., 2008), and disruptions (Kim et al., 2008) are present of association with
psychiatric disorder. NRXN1 gene was early implicated and related to autism spectrum
disorders due to reported cases of heterozygous inactivation. The gene was found
silence resulting from de novo deletion and balanced translocation (Szatmari et al.,
2007) and, subsequently, by numerous copy-number variants (Yan et al., 2008) and
single nucleotides mutations (Zahir et al., 2007).
NRXN1 copy number loss subsequently had been linked to schizophrenia (International
Schizophrenia Consortium, 2008; Kirov et al., 2009; Walsh et al., 2008; Glessner et al.,
2009; Levinson et al., 2011). Besides that, deletions of NRXN1 have been highly
associated with numerous other conditions including language delay, intellectual
impairment, attention deficit disorder and epilepsy (Ching et al., 2010; Schaaf et al.,
2012). These alteration mainly because of deletions confer genetic risk in a wide range
of neuropsychiatric and/or neurodevelopmental disease. On top of such variable
indication, cases of penetrance incompletely and heterozygosity deletions of NRXN1
have also been discovered (Harrison et al., 2011).
„
33
Disparate from repeated deletions at flanking terminal repeats, NRXN1 deletions could
different in their length and position (Harrison et al., 2011). The observation of regular
and rapid rearrangement of NRXN1 suggests that it is usually susceptible to mutational
molecular level mechanisms that lead to copy number imbalance and expose the
individuals to risk of neuropsychiatric disorders (Ikeda et al., 2008). Some findings
have revealed that disruption of the NRXN1 by submicroscopic chromosomal deletions
rising the risk of developing schizophrenia. Array of comparative genome hybridization
(array-CGH) been used to analyze the targeted genomes of schizophrenia subjects with
approximately 35000 probes for chromosomal copy number variantions (CNVs) and
deletion of NRXN1 been identified stretch across the promoter and the exon of the gene
(Kirov et al., 2009).
2.4 Identifying Copy Number Variations (CNVs)
Copy Number Variations (CNVs) are the unbalanced and quantitative alterations in
normal diploid genomic loci. Feuk et al. (2006) defined copy number variations as
changes that more than one kilobase in DNA segment in order to differentiate smaller
variations, such as, segmental duplications (SDs), Variable number tandem repeats
(VNTRs), micro- and mini-satellite repeats etc. CNVs are either deletions, insertion or
tandem duplications which cause quantitatively changes in normal diploid state. Gene
rich regions have been found to have higher frequencies of CNVs as compared to
conserved regions and this is indicating that structural variation is a property of the
functional genome (Szatmari et al., 2007).
34
In the continuous identification for genetic causes of schizophrenia, most of the effort
has been focus on alterations in deoxyribonucleic acid (DNA) sequence that may rising
the risk for the disorder. Moreover, genomic copy number changes are progressively
identified as a cause lead to risk for human diseases (Sahoo et al., 2011). Therefore,
variation in copy number of susceptibility genes which confer higher risk to
schizophrenia was identified (Ching et al., 2010). This in turn will hopefully lead to an
understanding of the biological pathways involved in schizophrenia etiology and as a
result, successful treatment (Kirov et al., 2009). There was fact showed that CNVs
occurred in NRXN1 are associated with cognitive capability (Rujescu et al., 2009),
language development disorders (Magri et al., 2010), autism (Ikeda et al., 2008), and
psychiatric disorders (Dabell et al., 2013).
2.4.1 Genomic Effects of CNVs
CNVs are often reported to be flanked by closely similar blocks of sequence, such as
low-copy repeats, segmental duplications (SDs), and LINE repetitive elements etc.
CNVs also found to be abundant in the centromeric and telomeric regions in most
organisms (Cooper et al., 2007).
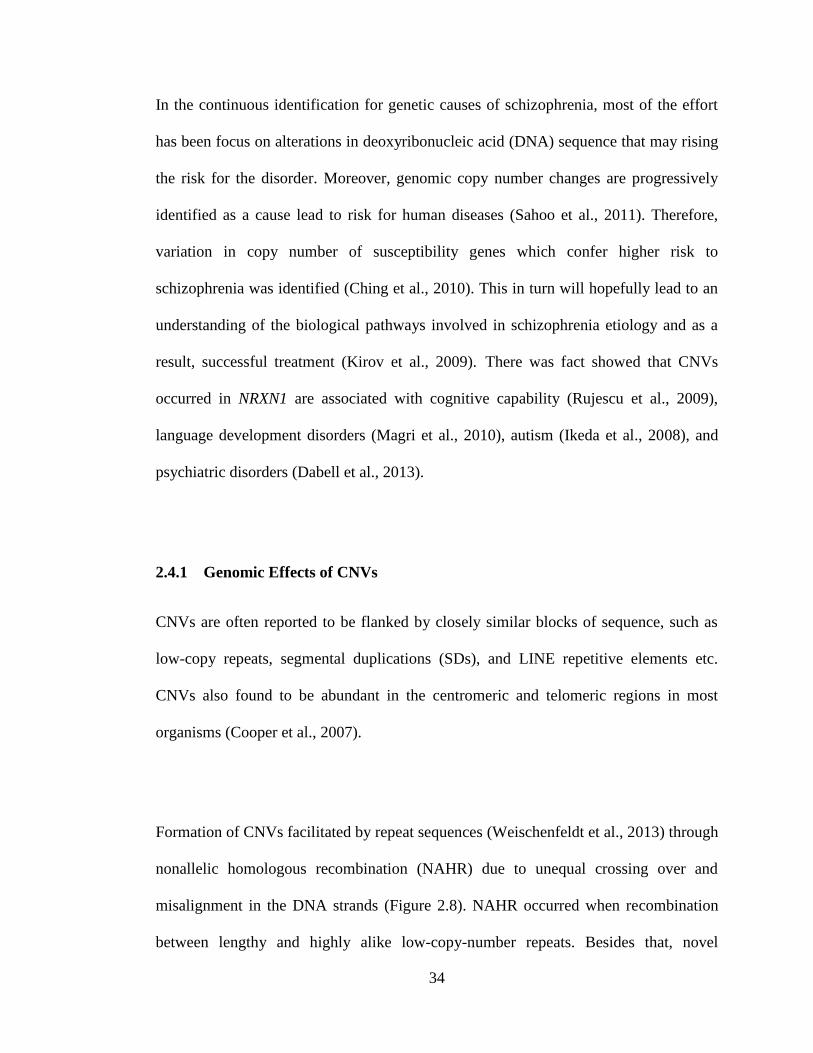
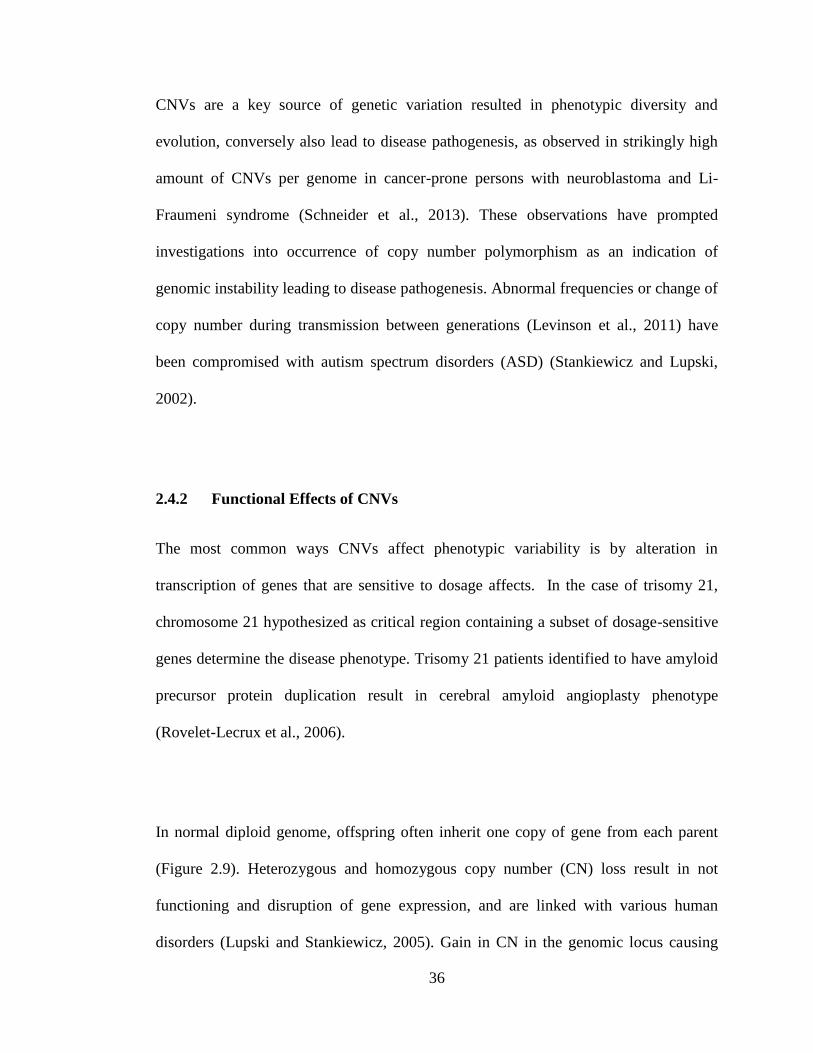
Formation of CNVs facilitated by repeat sequences (Weischenfeldt et al., 2013) through
nonallelic homologous recombination (NAHR) due to unequal crossing over and
misalignment in the DNA strands (Figure 2.8). NAHR occurred when recombination
between lengthy and highly alike low-copy-number repeats. Besides that, novel
35
genomic insertion can resulted from mobile DNA segments insertion of transposable
elements through retrotransposition. The third mechanism is termed, Fork Stalling and
Template Switching (FoSTeS). FoSTeS is found to facilitate mistake in DNA
replication mechanism resulting in CNVs (Stankiewicz and Lupski, 2002). Non-
homologous end joining (NHEJ) is another recombination based occurrence of CNV
formation. It is a procedure of DNA double-strand breaking repairment without large
scale sequence homology and is usually occurred simultaneously with addition or
deletion of several nucleotides. NHEJ occurs when broken DNA strands are bridged,
modified, and ligated incorrectly (Lee et al., 2007).
Figure 2.8: Structural variants involved different classes and formation
mechanisms (Weischenfeldt et al., 2013).
36
CNVs are a key source of genetic variation resulted in phenotypic diversity and
evolution, conversely also lead to disease pathogenesis, as observed in strikingly high
amount of CNVs per genome in cancer-prone persons with neuroblastoma and Li-
Fraumeni syndrome (Schneider et al., 2013). These observations have prompted
investigations into occurrence of copy number polymorphism as an indication of
genomic instability leading to disease pathogenesis. Abnormal frequencies or change of
copy number during transmission between generations (Levinson et al., 2011) have
been compromised with autism spectrum disorders (ASD) (Stankiewicz and Lupski,
2002).
2.4.2 Functional Effects of CNVs
The most common ways CNVs affect phenotypic variability is by alteration in
transcription of genes that are sensitive to dosage affects. In the case of trisomy 21,
chromosome 21 hypothesized as critical region containing a subset of dosage-sensitive
genes determine the disease phenotype. Trisomy 21 patients identified to have amyloid
precursor protein duplication result in cerebral amyloid angioplasty phenotype
(Rovelet-Lecrux et al., 2006).
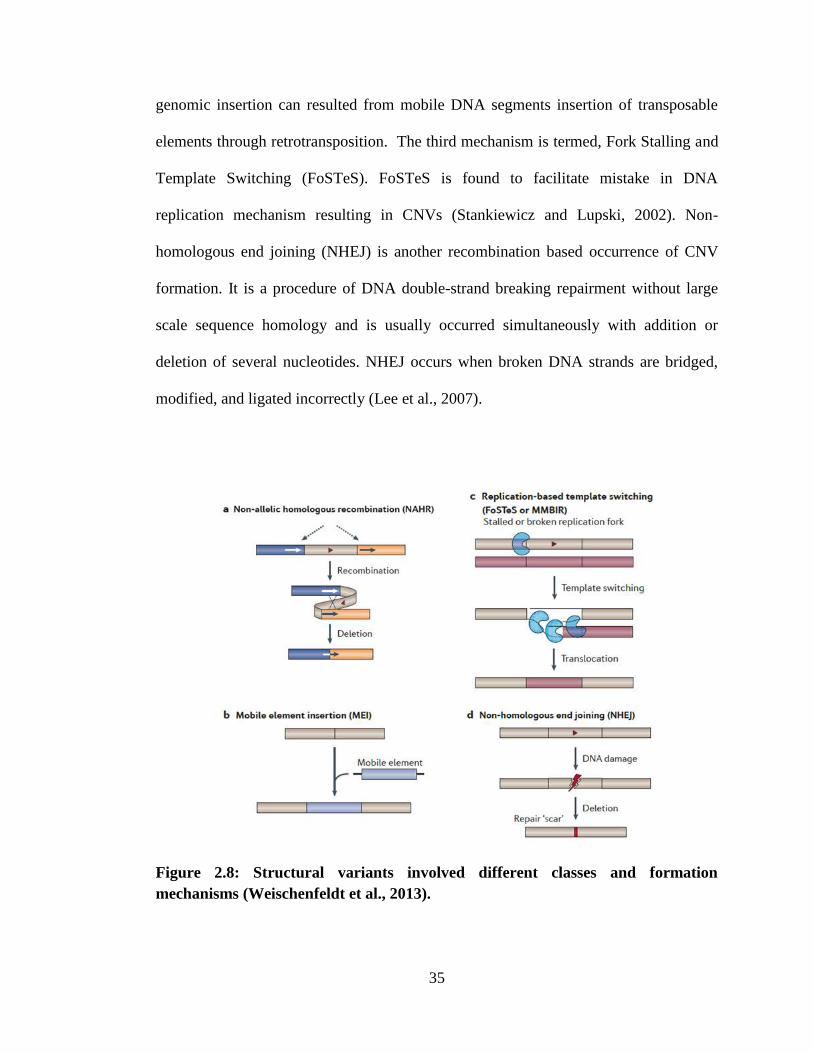
In normal diploid genome, offspring often inherit one copy of gene from each parent
(Figure 2.9). Heterozygous and homozygous copy number (CN) loss result in not
functioning and disruption of gene expression, and are linked with various human
disorders (Lupski and Stankiewicz, 2005). Gain in CN in the genomic locus causing
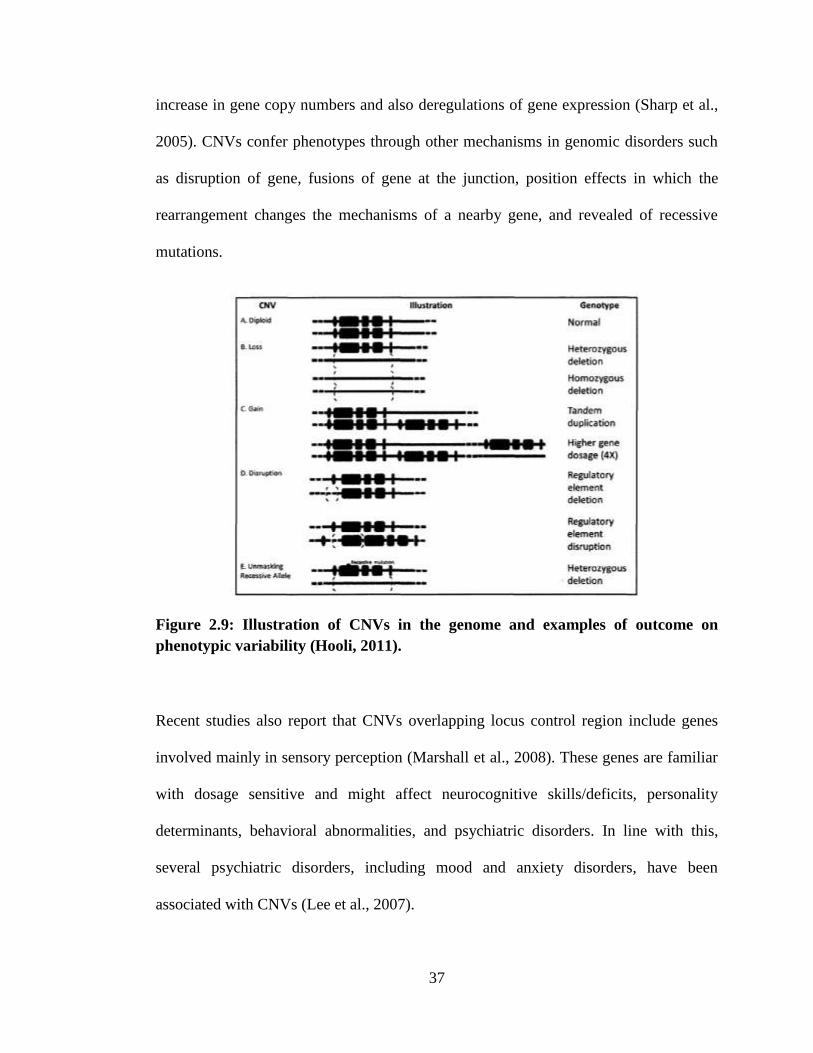
37
increase in gene copy numbers and also deregulations of gene expression (Sharp et al.,
2005). CNVs confer phenotypes through other mechanisms in genomic disorders such
as disruption of gene, fusions of gene at the junction, position effects in which the
rearrangement changes the mechanisms of a nearby gene, and revealed of recessive
mutations.
Figure 2.9: Illustration of CNVs in the genome and examples of outcome on
phenotypic variability (Hooli, 2011).
Recent studies also report that CNVs overlapping locus control region include genes
involved mainly in sensory perception (Marshall et al., 2008). These genes are familiar
with dosage sensitive and might affect neurocognitive skills/deficits, personality
determinants, behavioral abnormalities, and psychiatric disorders. In line with this,
several psychiatric disorders, including mood and anxiety disorders, have been
associated with CNVs (Lee et al., 2007).
38
CNVs confer phenotypes through several mechanisms in genomic disorders. The
increase or decrease in the transcribed protein in a dose dependent manner due to
changes in gene copy number leads to pathogenesis of diseases (Hooli, 2011). In case
of autism and schizophrenia, where the phenotypes in the patients are heterogeneous,
rare complex rearrangements in multiple genomic loci are reported (Stranger et al.,
2007). These include gene dosage effect at the transcription and translational levels or
functional single nucleotide polymorphisms (SNPs) on the existing allele (Stankiewicz
and Lupski, 2002). CNV analysis could hence reveal novel genes and pathways of
functional significance that may not have been obvious from studies of nucleotide level
alterations.
2.5 Single Nucleotide Polymorphisms (SNPs)
With the increasing availability of human genome data, it has become clear that the
differences from one human genome to other often due to single nucleotide base
changes, termed as single nucleotide polymorphisms (SNPs) (McCarthy et al., 2008).
Many SNPs have been identified through genome-wide association studies (GWAS) –
studies that examine frequent variants in huge numbers of individuals in order to
determine whether any association exists between a particular variant and a specific
trait (Manolio, 2008). The SNPs which are found to be associated with a trait are often
merely markers for genomic locations and are selected for their ability to adequately tag
the genome (Kraft and Hunter, 2009).
39
2.5.1 Linkage Disequilibrium and Haplotype
Linkage disequilibrium (LD) is the specific interrelation of alleles at various loci. It is a
sensitive measurement of the population genetic forces within structure of a genome
(Fallin and Schork, 2000). Due to many existing procedures for determine variation of
genetic with a sensitive scale, human geneticists and evolutionary scientists are
gradually utilizing disequilibrium of linkage to study the confluence evolution of
associated sets of genes and mapping the genes that are linked with hereditary diseases
and personal characters (Barrett et al., 2005).
LD at each region of genomes reviews the evolutional natural selection, transmutation
of genes, nonsense alteration and some another factors which manipulate through the
occurrence rate of gene evolution. Local recombination rates affect the linkage
disequilibrium in a genome. Besides that, the inheritance of selective sites of loci by
relies on rates of local recombination (Schaffner et al., 2005).
Most of the time, a single SNP marker does not reveal much information. Hence,
multiple SNPs have to be identified across the DNA strand in order to figure out the
association between SNPs and certain diseases. For example, a chromosome region
with three SNPs could result in eight different SNPs combination. Statistically,
haplotype is the set of SNPs combination on chromosome that tend to associated
together. It is a way of determining these statistical associations and several alleles of a
specific haplotype across the sequence. This technique further allows the identification
40
of all other possible polymorphic sites that are located nearby on same chromosome.
This collective of scientific data is important for identifying the roots of genetics in
most disorders (International HapMap Consortium, 2005).
Each blocks of haplotype in humans different in length from a few kb to more than 100
kb. However, some studies of haplotype found that linkage disequilibrium normally
extended over a much further chromosomal lengths (Barrett et al., 2005). Testing on
SNPs present in haplotype block of selective population for association with certain
disorder might be helpful in figure out the significant nucleotides. Therefore, the
number of studied SNPs within haplotype block is important when tested the haplotype
in case–control studies of disease association (Fallin and Schork, 2000).
2.5.2 SNPs and Schizophrenia
Genome-wide association studies had discovered many susceptible SNPs were
associated with schizophrenia. Previous study had investigated the relationship of gene
encode for a protein constituent of dystrophin-associated protein complex (DPC) of
with mental illness (Numakawa et al., 2004). A study revealed the identified SNPs
markers (rs2619528 and rs2619522) were positively related with schizophrenia in the
Asian people typically in population of Japanese (Numakawa et al., 2004). In
contradictory of the result, the two SNPs were showed no significant correlation in
another study done by Tochigi et al. (2006). However, the result may vary due to
41
different targeted geographical isolated population as the finding in Korea showed
consistent result for rs2619522 (Joo et al., 2006).
Some studies have reported a positive association of AKT1 gene with schizophrenia in
European (Karege et al., 2012), and Japanese population (Ikeda et al., 2004). Another
studied SNP (rs2494732) of AKT1 gene was found associated with schizophrenia in a
Malaysian case-control study (Loh et al., 2013). Dysregulation in the dopaminergic
system has been suggested to play a crucial part in the pathophysiology of
schizophrenia (Utsunomiya et al., 2008). On contrary, Tee, Tang and Loh (2011) found
no significant association of catechol-o-methytransferase (COMT) gene SNPs
(rs165656) with schizophrenia in Malay population of Malaysia.
Shah et al. (2010) genotype the rs2287235 SNP marker, which is approximately 3700
bases apart from the translation starting site of NRXN1 gene through case control study
in European population. The finding showed rs2287235 does not involve in
schizophrenia pathogenesis but it suggested that rs2287235 might play an important
role of potential allele-specific differences in transcription factor attachment. Another
NRXN1 SNP marker, rs1045881 variant was found associated with brain frontal lobe
white matter volume, where homozygous C allele carriers showed reduction of frontal
white matter volumes in schizophrenia subjects compared to homozygous or
heterozygous „T‟ allele carriers (Voineskos et al., 2011).
42
2.5.3 NRXN1 SNPs
Previously, a study on genetic variants of NRXN1 single nucleotide modifications
(rs10490162 and rs12467557) with response to treatment of neuroleptic drug in more
than 50 selected schizophrenia patients was conducted by Jenkins et al. (2014).
Significant associations of rs12467557and rs10490162 with drug response were
revealed in the trial composed of patients and controls with included of placebo in this
pharmacogenetic analysis. They also found that individuals who were carried
homozygous A allele in either rs10490162 and rs12467557 showed observable improve
in terms of overall mental pathology and feeling disturbance. On the other hand,
patients who either homozygous or heterozygous G allele carrier showed no significant
response to the treatment (Jenkins et al., 2014).
Besides that, Souza et al (2010) was reported clinical evidence on association of
polymorphisms rs10490162 and rs12467557 markers with medical treatment response
in schizophrenia patients. Carriers who carry homozygous A alleles at either markers
were found more tentatively in respond to a drug known as clozapine which classified
as atypical antipsychotic medication (Souza et al., 2010). Clinical pharmacogenetic
study showed NRXN1 SNPs have been associated with treatment using clozapine in
schizophrenia subjects (Lett et al, 2011) as well as dependence on nicotine (Bierut et al,
2007) in healthy individuals (Nussbaum et al, 2008).
43
CHAPTER 3
MATERIALS AND METHODS
3.1 Samples Collection
The study sample consisted of twenty eight schizophrenia patients (17 males and 11
females; mean age: 40.75 10.20 years) and twenty four healthy controls (12 males and
12 females; mean age: 38.42 13.21 years). The subjects were ethnically matched and
subsequently divided into three different ethnic groups. The distributions of recruited
patient‟s ethnic group were 50% Malays, 36% Chinese and 14% Indians while control‟s
ethnic group made up of 58% Chinese, 33% Malays and 9% Indians. The twenty eight
schizophrenic patients were originated from thirteen different families. Patients
consisted of nine sibling pairs, two sibling trios and two parent-offspring pairs. Twenty
four healthy controls are from twelve different families. Controls included nine sibling
pairs and three parent-offspring pairs.
The patients were recruited from Psychiatry Department of Hospital Permai Johor
Bharu, Johor, Malaysia. All hospitalized patients were met the Diagnostic and
Statistical Manual of Mental Disorders-Fourth Edition (DSM-IV) diagnostic
measurement scale. They were gone through interview session by experienced
psychiatrists utilized the Mini International Neuropsychiatric Interview (MINI)
44
(Appendix A). MINI is a specific mentality oriented diagnoses examination in
Diagnostic and Statistical Handbook of Mental Disorders-Fourth Edition (DSM-IV)
and International Classification of Diseases-Tenth Edition (ICD 10) mental illness.
Control subjects were required absence of recreational drugs abuse or a family history
of neurodegenerative or psychiatric disorders, extended including first-degree relatives.
Exclusion criteria from being recruited as controls were: subjects with psychiatric
comorbidities, generalized anxiety disorder, antecedent history of illicit substance abuse,
history of mental retardation, neurological disease, or any clinical condition that could
affect cognitive performance. This study was approved under University Malaya
Medical Centre (UMMC) Medical Ethics Committee Institutional Review Board,
Malaysia. The research purposes and procedures of the study were explained to all
participants and written informed consent (Appendix B) was obtained from all
participants.
3.2 Trail Making Test (TMT)
The Trail Making Test composed of duo sections: Part A and B. Each part composed of
25 circles spread over on paper. TMT was performed followed the rules formulated by
Strauss, Sherman and Spreen (2006). The circles have to be connected as fast as
possible, with absence of remove the pencil or pen away from work sheet. The measure
begins to count once the test was started. The direct score of parts A and B are
constituted by the time of completion of the tasks. Total duration measured in seconds
for both sections was documented, representing the TMT Part A (TMT-A) and TMT
45
Part B (TMT-B) direct measure scores. Alternatively, another two scores were derived
and calculated: differential score (B A) and score of ratio (B: A).
3.2.1 TMT Part A
TMT-A is used to determine the visual search, screening and cognitive processing
speed of subjects (Tombaugh, 2004; Ríos et al., 2004). In Part A, the circles that
numbered from 1 to 25 and distributed thoroughly on a sheet of paper. Lines have to be
drawn to link up all the figures in ascending order. First, the subject was given a hard
copy Trail Making Test Part A (Appendix C) writing sheet and a pencil. Next, the
subject was timed as he or she begins to connect the numbers in ascending order. If an
error made, the mistake was pointed out to subject immediately and has he/she
corrected it. The time to correct error was included in completion time for task. Scoring
method of the test was determined by the seconds used to complete the test.
3.2.2 TMT Part B
Besides determine the visual search and processing speed, Part B of TMT plays an
important role in examine the working memory, mental flexibility and task switching
ability of subjects (Tombaugh, 2004; Ríos et al., 2004). In section B, the circles include
both numeral and alphabetical characters. There are 13 numerals (1 to 13) and 12
alphabetical letters (A to L) in TMT Part B. All circles have to be connected with lines
in ascending manner, but with the additional undertaking of alternate switching
46
between the numbers and letters (i.e., 1-A-2-B-3-C, etc.). The subject was given a
hardcopy worksheet of the Trail Making Test Part B (Appendix D) and a pencil. Time
was start to record when subject begin connect alternately between numbers and letters
sequentially. When error happened, the mistake was pointed out and corrected by
subjects immediately. The time to correct error was not excluded and the duration used
to finish the test was documented.
3.2.3 TMT Derived Score
Furthermore, on top of direct scores, the B A dissimilarity result and the B: A ratio
were calculated. Both derived scores had been practically used for clinical assessment
purposes as the indicators of cognitive functions or direct markers of brain damage
(Sanchez-Cubillo et al., 2009). B A minimized visuoperceptual and demand of
working memory, providing a relatively pure measurement index of executive
functioning abilities (Sanchez-Cubillo et al., 2009). Alternatively, the B:A score was
used to examine the divided attention control of subjects (Ríos et al., 2004 ).
3.2.4 Statistical Analysis
Statistical analysis was conducted by using IBM SPSS Statistics (version 20.0, SPSS
Inc., Chicago IL). The TMT direct and derived results conferred as mean and deviation
from standard. Additionally, Mann-Whitney U test was applied to compare differences
between the TMT scores made by controls and patients. Next, Spearman‟s correlation
47
(rs) was employed to measure the strength and association that exists between the
variables of direct and derived TMT scores.
3.3 DNA Extraction from Blood
For the purpose of DNA extraction, a peripheral blood sample (10 ml) was acquired
from every subject and gathered in ethylene diamine tetraacetic acid (EDTA)
anticoagulant tubes (BD Vacutainer®, U.S.A) to prevent clotting. Extraction of DNA
was conducted using the QIAamp DNA Blood Mini Kit (QIAGEN®, Germany) by
centrifugation technique.
Firstly, 20 μl of QIAGEN Protease (proteinase K) was pipetted into the lowest part of a
1.5 ml microcentrifuge tube, followed by 200 µl of whole blood specimen was added to
the microcentrifuge tube. After that, 200 µl of Buffer AL was added to the tube and
mixed up completely by pulse-vortexing for 15 seconds to generate a well-mixed and
homogenous solution. The tube was incubated at 56 °C for 10 minutes in order to have
a maximum DNA yield after break down of blood cells.
The microcentrifuge tube was momentarily centrifuge to get rid of drops from the inner
of the lid. Sample was added with 200 μl of absolute ethanol (98%) and mixed again by
quick pulse-vortexing for 15 seconds. After put the ingredients together, the
microcentrifuge tube was briefly centrifuge to take off drop from the inner of the lid.
48
Next, the mixed up solutions was carefully pipetted to QIAamp Mini spin column (in a
2 ml collection tube). The QIAamp Mini spin column was centrifuged for 1 minute at
8000 rpm. After that, the filtrate was disposed.
The QIAamp Mini spin column was pipetted with with 500 μl Buffer AW1. The
column was centrifuged for 1 minute at 8000 rpm. After centrifugation, the filtrate was
discarded again. Then, QIAamp Mini spin column was add up with 500 μl Buffer AW2
and was further centrifuged with full speed at 14,000 rpm for 3 minutes.
Once centrifugation was done, the filtrate was discarded. Finally, the spin column was
add up with 200 μl Buffer AE and was keep in order at room temperature (15 – 25 °C)
for 5 minutes and subsequently undergo centrifugation at 8000 rpm for exact 1 minute.
The eluted DNA was then stored at –20 °C.
3.4 Quantification of DNA Samples
Nanodrop 1000 spectrophotometer (Thermo Fisher Scientific, U.S.A) was used to
determine the DNA concentration and purity ratios. Firstly, blank measurement was
performed by loading 1μl deionized water. As blank measurement was completed, 1 μl
of DNA sample was pipetted directly onto the measurement pedestal. DNA
concentration was measured and 260 /280 nm, 260/230 nm purity ratios were calculated.
49
The concentrations of DNA samples were standardized. Each DNA sample was diluted
to 5 ng/ μl by using 1x TE buffer (pH 8.0). The pH was adjusted to pH 8.0 and diluted
DNA was then stored at –20 °C.
3.5 Copy Number Assays
3.5.1 Genotyping Master Mix
The TaqMan® genotyping master mix contains AmpliTaq Gold® DNA Polymerase,
ROX™ Passive Reference, deoxyribonucleotide triphosphates (dNTPs), and buffer
components. AmpliTaq Gold® DNA Polymerase used as a key ingredient in Real Time
PCR. ROX™ Passive Reference was used to normalize the well-to-well differences and
gives an internal reference to which the signal of reporter-dye can be normalized during
analysis of data.
3.5.2 Copy Number Reference Assay
TaqMan® Copy Number Reference Assay RNase P was used as the typical reference
assay in analysis copy number of NRXN1. This assay diagnoses the Ribonuclease P
RNA component H1 (H1RNA) gene (RPPH1) located on cytoband 14q11.2 of
chromosome 14 (chr.14:20811565). It has an 87 bp amplicon that maps within the
single exon RPPH1 gene. The reference assays consisted of 4,7,2-trichloro-7-phenyl-6-
carboxyfluorescein (VIC) dye–labeled TAMRA™ probe and reference sequence–
specific forward and reverse primers.
50
3.5.3 NRXN1 Gene Copy Number Assay
Introns and intron-exon boundaries were targeted for NRXN1 CNV genotyping in this
study. Intron consists of regulatory elements which guide the spliceosome whereas
intron-exon junctions act as crucial regions to be recognized by splicing machinery
mechanisms for precise ligated of coding regions prior translated into amino acid
sequence (Ward and Cooper, 2010).
According to NRXN1 deletions detected by Schaaf et al (2012), 30% and 10% of
intronic deletions were found at Intron 6 and Intron 20 respectively. Based on the
outcome of array comparative genomic hybridization (aCGH) done by Dabell et al
(2012), 7.5% NRXN1 deletion was found at region Exon 6 – Exon 8. Besides that,
NRXN1 Exon 9 to Exon 17 was found deleted in 12.5% of deletion samples (Dabell et
al., 2012). Ching et al (2010) reported 25% of NRXN1 deleted samples were found
absence of regions from Exon 6 to Exon 17. Hence, NRXN1 deletions at Intron 6
(Schaaf et al., 2012), Intron 7 – Exon 7, Intron 9 – Exon 10, Intron 12 – Exon 13, Intron
15 – Exon 15, Intron 16–Exon 17 (Ching et al., 2010; Dabell et al., 2012) and Intron 20
(Schaaf et al., 2012) were reported to be associated with schizophrenia. These seven
NRXN1 regions were chosen for CNV genotyping in this study and listed in Table 3.1.
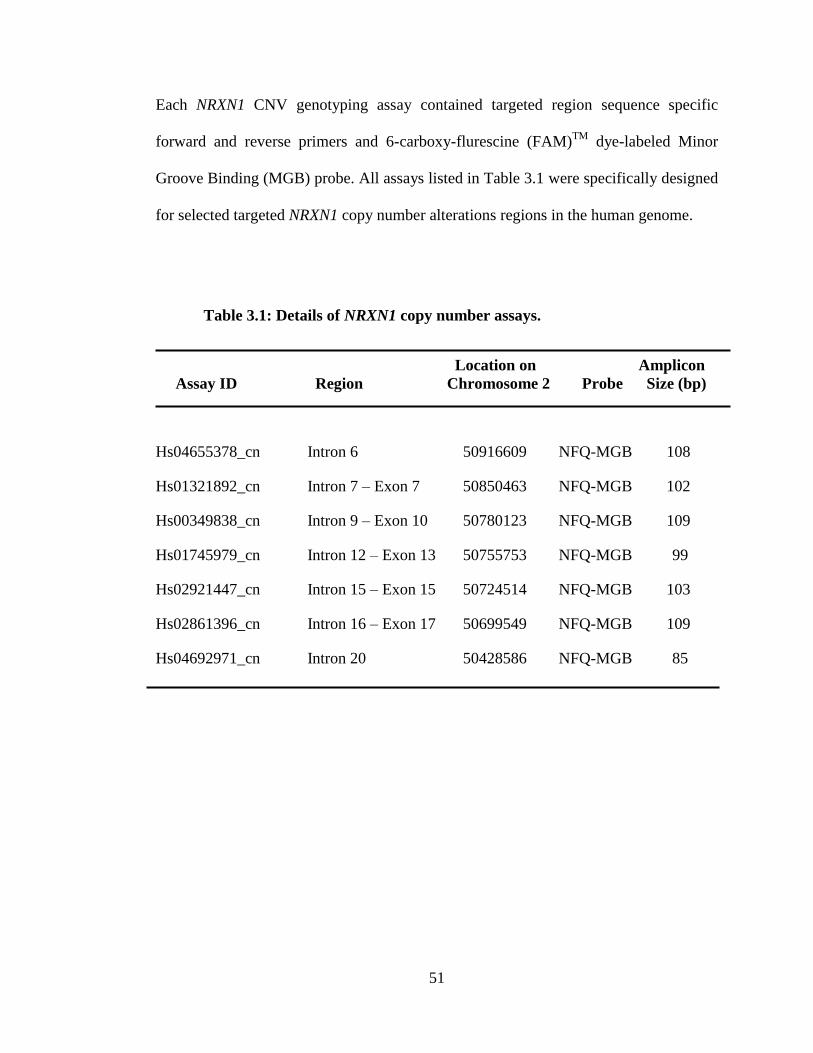
51
Each NRXN1 CNV genotyping assay contained targeted region sequence specific
forward and reverse primers and 6-carboxy-flurescine (FAM)TM
dye-labeled Minor
Groove Binding (MGB) probe. All assays listed in Table 3.1 were specifically designed
for selected targeted NRXN1 copy number alterations regions in the human genome.
Table 3.1: Details of NRXN1 copy number assays.
Location on Amplicon
Assay ID Region Chromosome 2 Probe Size (bp)
Hs04655378_cn Intron 6 50916609 NFQ-MGB 108
Hs01321892_cn Intron 7 – Exon 7 50850463 NFQ-MGB 102
Hs00349838_cn Intron 9 – Exon 10 50780123 NFQ-MGB 109
Hs01745979_cn Intron 12 – Exon 13 50755753 NFQ-MGB 99
Hs02921447_cn Intron 15 – Exon 15 50724514 NFQ-MGB 103
Hs02861396_cn Intron 16 – Exon 17 50699549 NFQ-MGB 109
Hs04692971_cn Intron 20 50428586 NFQ-MGB 85
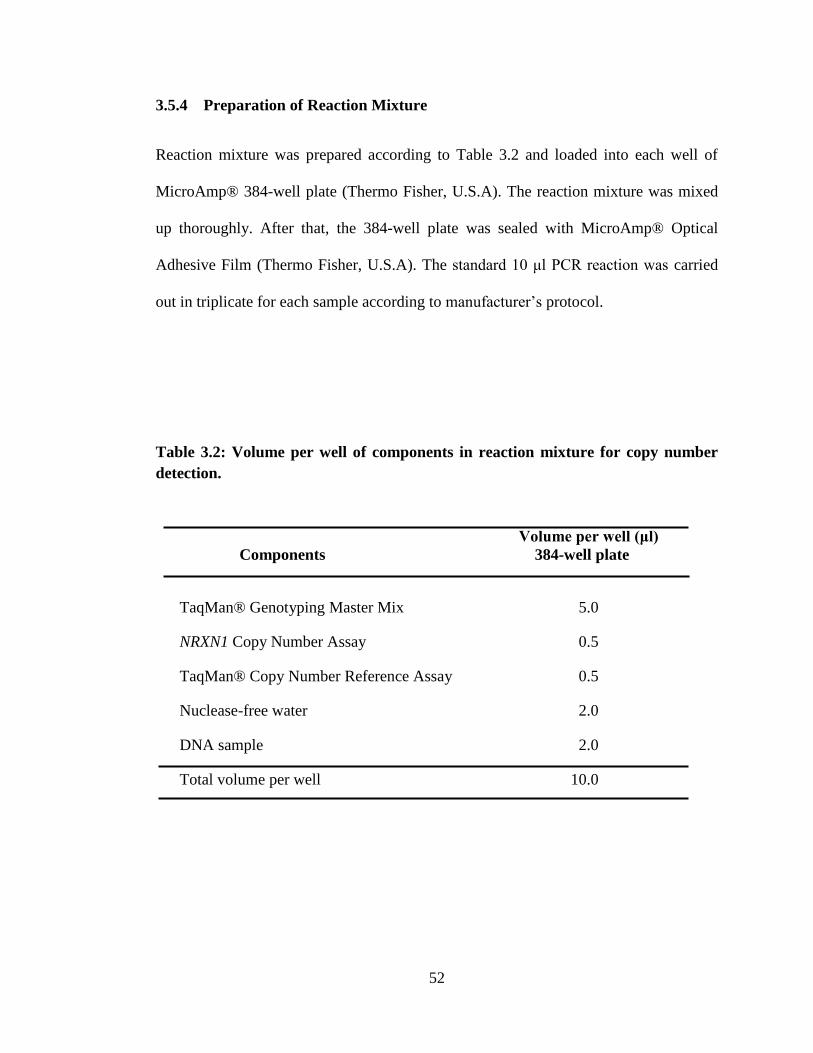
52
3.5.4 Preparation of Reaction Mixture
Reaction mixture was prepared according to Table 3.2 and loaded into each well of
MicroAmp® 384-well plate (Thermo Fisher, U.S.A). The reaction mixture was mixed
up thoroughly. After that, the 384-well plate was sealed with MicroAmp® Optical
Adhesive Film (Thermo Fisher, U.S.A). The standard 10 μl PCR reaction was carried
out in triplicate for each sample according to manufacturer‟s protocol.
Table 3.2: Volume per well of components in reaction mixture for copy number
detection.
Volume per well (μl)
Components 384-well plate
TaqMan® Genotyping Master Mix 5.0
NRXN1 Copy Number Assay 0.5
TaqMan® Copy Number Reference Assay 0.5
Nuclease-free water 2.0
DNA sample 2.0
Total volume per well 10.0
53
3.5.5 Real Time PCR
Amplification of NRXN1 variants was done by polymerase chain reaction (PCR) and
the process was monitored in real time. First, the reaction was initiated with a starting
denaturation at 95°C for 600 seconds. This was come after by exact 40 cycles of
denaturation at 95°C for 15 seconds. Next, the reaction was reduced in temperature for
annealing at 60°C for 60 seconds. QuantStudio™ 12K Flex PCR System (Thermo
Fisher, U.S.A) was used to quantify the amplification of the NRXN1 and RPPH1 copy
number variants.
3.5.6 Copy Number Quantification
The copy number (CN) of each targeted NRXN1 variant measured by Applied
Biosystems CopyCaller® Software (Version 2.1). Confidence metric and absolute z-
score metric were calculated by the software. Copy number cut-off values were
calculated by the gained or losses of sequences larger than 25% of corresponding p or q
arm (Capizzi et al., 2011). The detected copy number with a cut-off value of less than
1.78 copies designated as CN loss, while the copy number with marginal cut-off value
greater than 2.28 are showed as CN gained. Each sample was categorized as normal CN,
CN gain or CN loss.
54
3.5.7 Copy Number Quality Control
In order to perform quality control on collected data, three steps were performed to
filter the copy number of each probe from real time PCR. In the initial phase, the data
from individual real time PCR runs were tested by the software. The following factors
were used to exclude samples that not meet standard requirement from further analysis.
First, exclusion made on VIC Ct value > 32 which due to failure of internal target gene
amplification, FAM Ct value > 40 and any probe with ΔCt > 4.0 resulted from targeted
probes unable to be amplified. In second steps, the mean ΔCt was calculated. The
outliers of mean ΔCt were excluded using 3 standard deviations as cutoff point.
In the third step of copy number quality control, the software statistical formula ΔΔCt
was implied in software statistical formula to measure the copy number of each probe.
A standardized z score and confidence value were established based on copy number
data. Samples that have absolute value of z score > 2.62 and confidence value < 0.9
which will implied greater variation were excluded from further analysis.
55
3.5.8 Statistical Analysis
IBM SPSS Statistics (version 20.0, SPSS Inc., Chicago IL) was used to analyze the
copy number results of controls and patients. The difference of copy number mean
between patients and controls were compared by independent t test. According to
outcome of CNVs identified by quantitative PCR as reported by Wang et al (2009),
CN > 2 had been classified as increase of copy number whereas CN < 2 was
categorized as decrease in copy number. Quantitative PCR results of CN with diploid
number (CN = 2.0) indicated as no copy number change (Wang et al., 2009). Hence,
the detected CN mean of patients and controls group at each targeted NRXN1 regions of
this study was compared with CN = 2.0 through one sample t- test. Spearman‟s rank
correlation (rs) analysis was used to explore the possible effect of NRXN1 copy number
detected at targeted regions and four measures of cognitive function performances
(TMT-A, TMT-B, TMT B A and TMT B: A).
56
3.6 SNP Assays
3.6.1 NRXN1 SNP Genotyping Assays
According to SNPs TaqMan® genotyping outcomes reported by Yue et al (2011),
NRXN1 SNP markers rs10490168, rs2024513 and rs13382584 were found significantly
associated with schizophrenia. Jenkins et al (2014) had conducted an association study
of NRXN1 polymorphisms (rs12467557 and rs10490162) with neuroleptic drug
treatment response. Both SNPs markers revealed a significant association between
schizophrenia and administered antipsychotic drug response. Hence, NRXN1 single
nucleotide alterations of markers rs10490168, rs2024513, rs13382584 (Yue et al.,
2010), rs12467557 and rs10490162 (Jenkins et al., 2014) were reported to be associated
with schizophrenia. These five SNPs markers were selected for SNPs genotyping in this
study and listed in Table 3.3.
Each tube of SNP genotyping assay mix was contained NRXN1 single nucleotide
polymorphisms sequence clearly defined forward and reverse primers with two
TaqMan® MGB probes. VIC® dye labeled probe discover the Allele 1 sequence while
another probe labeled with FAM™ dye identify the sequence of Allele 2. The SNP
assay IDs and respective location on chromosome 2p16.3 were listed in Table 3.3. The
context sequences of each assay and both targeted alleles were listed in same table. Five
SNPs located on intron 6 of NRXN1 gene was targeted. All five assays listed were
specifically designed for targeted NRXN1 single nucleotide variation in human genome.
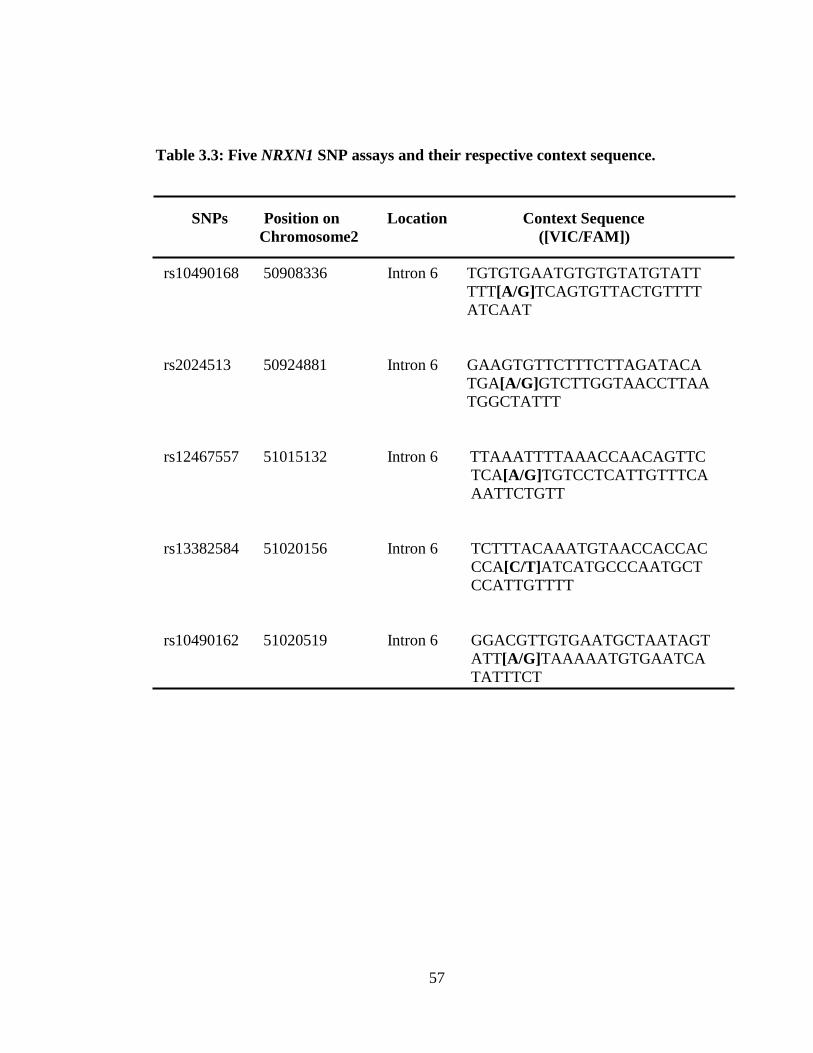
57
Table 3.3: Five NRXN1 SNP assays and their respective context sequence.
SNPs Position on Location Context Sequence
Chromosome2 ([VIC/FAM])
rs10490168 50908336 Intron 6 TGTGTGAATGTGTGTATGTATT
TTT[A/G]TCAGTGTTACTGTTTT
ATCAAT
rs2024513 50924881 Intron 6 GAAGTGTTCTTTCTTAGATACA
TGA[A/G]GTCTTGGTAACCTTAA
TGGCTATTT
rs12467557 51015132 Intron 6 TTAAATTTTAAACCAACAGTTC
TCA[A/G]TGTCCTCATTGTTTCA
AATTCTGTT
rs13382584 51020156 Intron 6 TCTTTACAAATGTAACCACCAC
CCA[C/T]ATCATGCCCAATGCT
CCATTGTTTT
rs10490162 51020519 Intron 6 GGACGTTGTGAATGCTAATAGT
ATT[A/G]TAAAAATGTGAATCA
TATTTCT
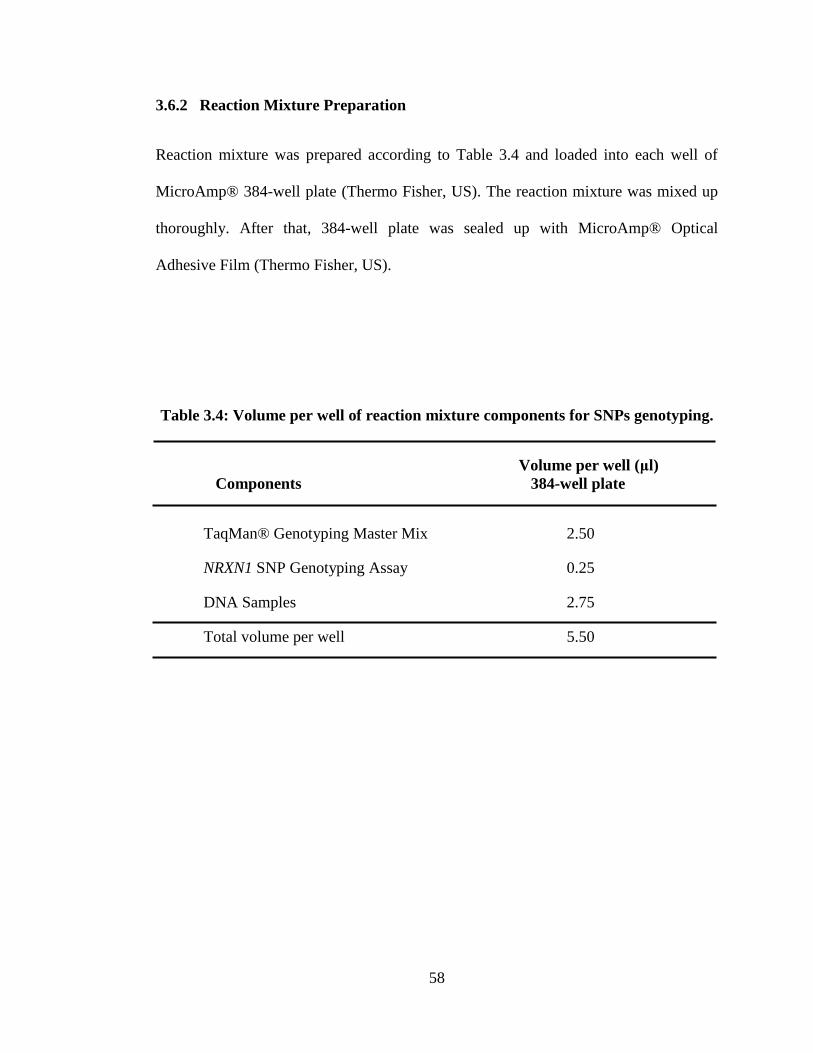
58
3.6.2 Reaction Mixture Preparation
Reaction mixture was prepared according to Table 3.4 and loaded into each well of
MicroAmp® 384-well plate (Thermo Fisher, US). The reaction mixture was mixed up
thoroughly. After that, 384-well plate was sealed up with MicroAmp® Optical
Adhesive Film (Thermo Fisher, US).
Table 3.4: Volume per well of reaction mixture components for SNPs genotyping.
Volume per well (μl)
Components 384-well plate
TaqMan® Genotyping Master Mix 2.50
NRXN1 SNP Genotyping Assay 0.25
DNA Samples 2.75
Total volume per well 5.50
59
3.6.3 Real Time PCR
Real time PCR was used to amplify targeted NRXN1 variants. An initial denaturation at
95°C for 600 seconds aimed to denature the DNA and activate Taq DNA polymerase.
Next, denaturing of DNA for 40 cycles at 92°C for 15 seconds, followed by recombine
DNA into double stranded at 60°C for 60 seconds were done. An endpoint plate
reading was determined through QuantStudio™ 12K Flex PCR System (Thermo Fisher,
U.S.A). Fluorescence (Rn) values plot that contained the signal from each well was
used to determine the specific alleles of each sample for respective SNP marker.
3.6.4 Statistical Analysis
Fisher‟s exact test was used as a statistical significance test to analyze the allele and
genotype frequencies between patients and controls by IBM SPSS Statistics (version
20.0, SPSS Inc., Chicago IL). Arlequin version 3.11 was used to perform the testing of
Hardy-Weinberg Equilibrium (HWE) (Excoffier et al., 2005). Microsoft Excel was
used to generate Haploview data format from SNP raw data. To further analyze the
haplotype structure of samples, pairwise linkage disequilibrium (LD) for all possible
combination of five SNPs were computed using D‟ and r2 values. The linkage
disequilibrium (LD) value were obtained using Haploview version 4.2 (Broad Insititute
of MIT and Harvard, Cambridge) (Barrett et al., 2005).
60
3.7 False Discovery Rate (FDR)
The statistical outcomes of cognitive ability test, NRXN1 CNVs and SNPs genotyping
were further analyzed with multiple testing corrections via false discovery rate (FDR)
estimation. FDR correction was done by followed Benjamini-Hochberg procedure with
α-level set at 0.05 (Benjamini and Hochberg, 1995). According to Glickman, Rao and
Schultz (2014), FDR is a recommended alternative to Bonferroni-type adjustments in
health studies by controlling the false positive rate. The chance of logical
inconsistencies could be minimized in multiplicity test of health studies (Glickman,
Rao and Schultz, 2014). The obtained p-values were sorted in ascending order, and
each observed p-value was divided by its percentile rank respectively (Noble, 2009).
IBM SPSS Statistics (version 20.0, SPSS Inc., Chicago IL) was used as an interface and
the SPSS syntax format of Benjamini-Hochberg FDR estimation was generated
according to the procedure described by Jakab et al (2013).
61
CHAPTER 4
RESULTS
4.1 TMT Direct and Derived Scores
4.1.1 Descriptive Analysis
Descriptive statistics of TMT direct measured and derivative scores of healthy controls
and schizophrenia patients were calculated (Table 4.1). Mean TMT-A score was 30.3
12.39 in controls and 60.53 53.31 in patients, showing a significant difference
between two groups (p = 1.45 10-4
). TMT-B performance score was 61.56 34.12 in
controls while patient‟s score was 141.81 94.58. A significant difference of TMT-B
mean score was found between two groups (p = 1.01 10-5
). The mean outcome
measured by deducting the TMT-A from the TMT-B score (B – A outcome) was 31.53
28.23 in controls and 81.28 78.45 in patients group. Significant difference of B –
A performance shown between two groups (p = 0.003). These results were remains
significant after FDR estimation. The mean of B: A ratio of control was 2.11 0.75
while patients mean score was 2.64 1.28. No significant difference found between
two groups (p = 0.192).
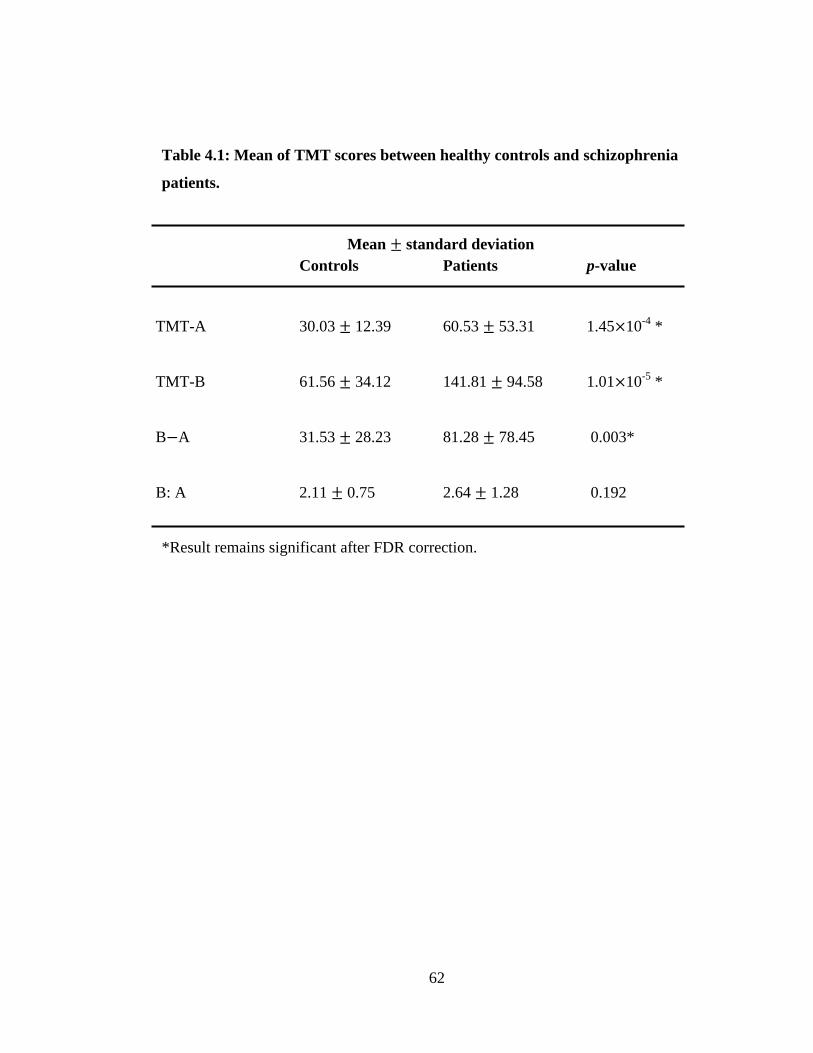
62
Table 4.1: Mean of TMT scores between healthy controls and schizophrenia
patients.
Mean standard deviation
Controls Patients p-value
TMT-A 30.03 12.39 60.53 53.31 1.45 10-4
*
TMT-B 61.56 34.12 141.81 94.58 1.01 10-5
*
B A 31.53 28.23 81.28 78.45 0.003*
B: A 2.11 0.75 2.64 1.28 0.192
*Result remains significant after FDR correction.
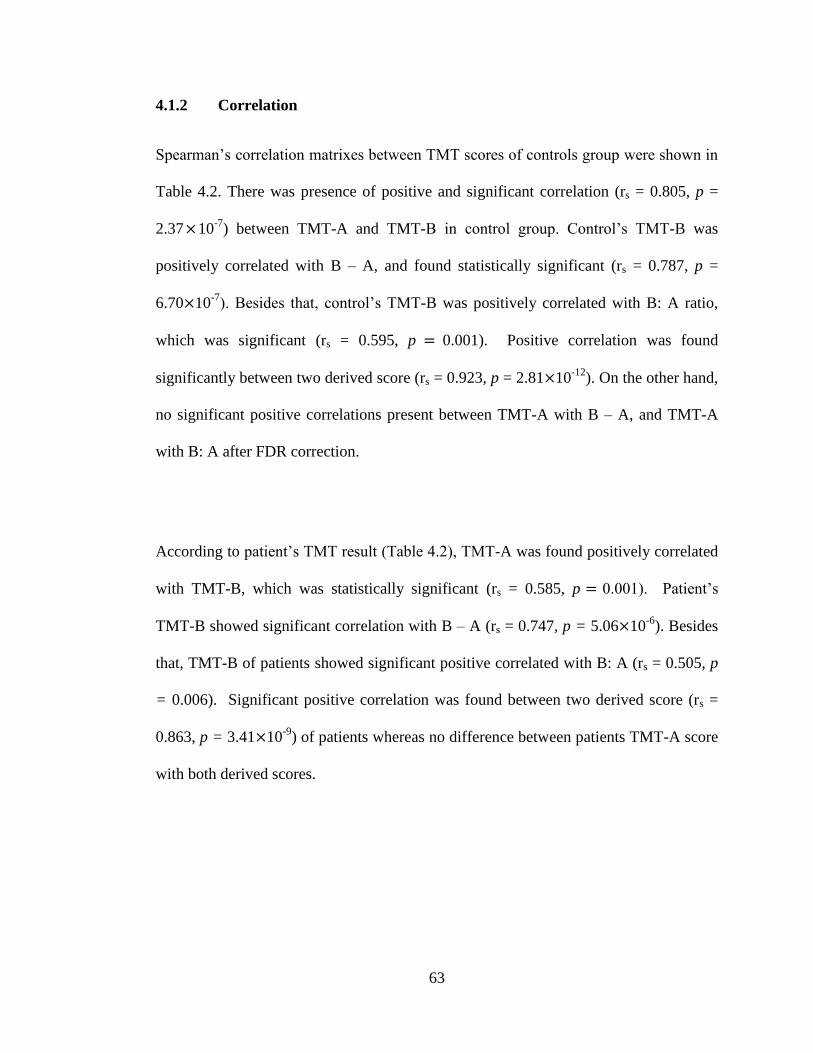
63
4.1.2 Correlation
Spearman‟s correlation matrixes between TMT scores of controls group were shown in
Table 4.2. There was presence of positive and significant correlation (rs = 0.805, p =
2.37 10-7
) between TMT-A and TMT-B in control group. Control‟s TMT-B was
positively correlated with B – A, and found statistically significant (rs = 0.787, p =
6.70 10-7
). Besides that, control‟s TMT-B was positively correlated with B: A ratio,
which was significant (rs = 0.595, p 0.001). Positive correlation was found
significantly between two derived score (rs = 0.923, p = 2.81 10-12
). On the other hand,
no significant positive correlations present between TMT-A with B – A, and TMT-A
with B: A after FDR correction.
According to patient‟s TMT result (Table 4.2), TMT-A was found positively correlated
with TMT-B, which was statistically significant (rs = 0.585, p 0.001). Patient‟s
TMT-B showed significant correlation with B – A (rs = 0.747, p = 5.06 10-6
). Besides
that, TMT-B of patients showed significant positive correlated with B: A (rs = 0.505, p
= 0.006). Significant positive correlation was found between two derived score (rs =
0.863, p = 3.41 10-9
) of patients whereas no difference between patients TMT-A score
with both derived scores.
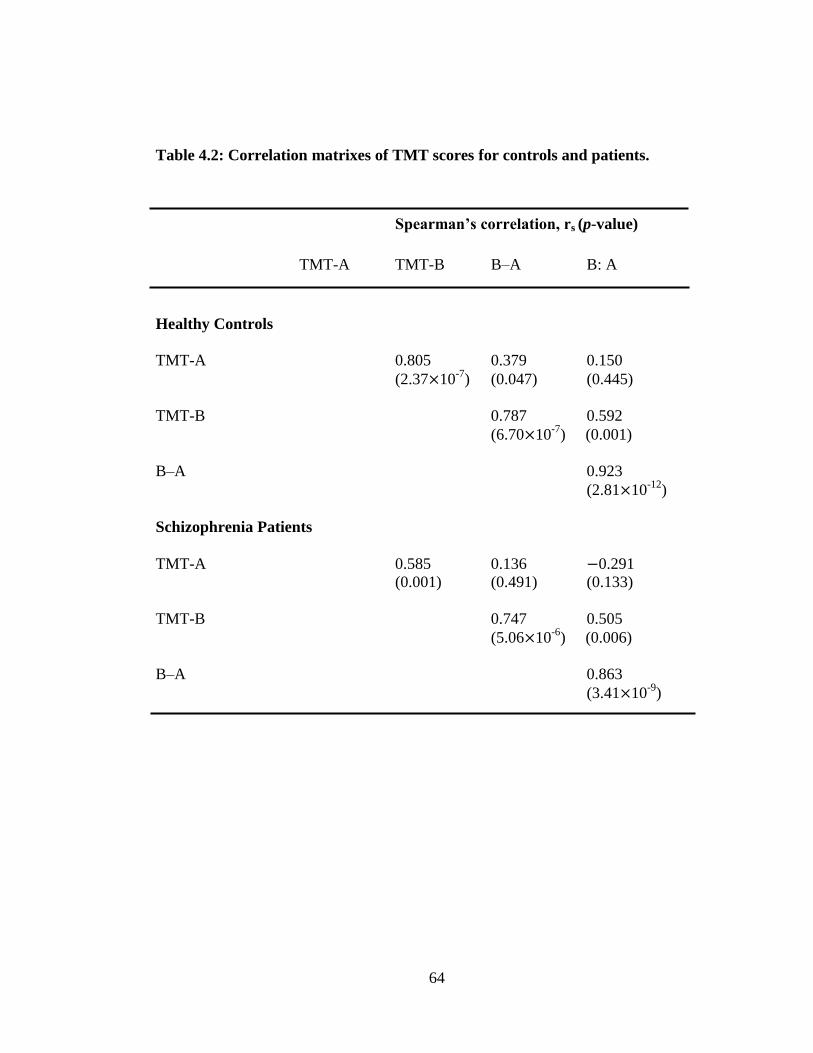
64
Table 4.2: Correlation matrixes of TMT scores for controls and patients.
Spearman’s correlation, rs (p-value)
TMT-A TMT-B B–A B: A
Healthy Controls
TMT-A 0.805 0.379 0.150
(2.37 10-7
) (0.047) (0.445)
TMT-B 0.787 0.592
(6.70 10-7
) (0.001)
B–A 0.923
(2.81 10-12
)
Schizophrenia Patients
TMT-A 0.585 0.136 0.291
(0.001) (0.491) (0.133)
TMT-B 0.747 0.505
(5.06 10-6
) (0.006)
B–A 0.863
(3.41 10-9
)
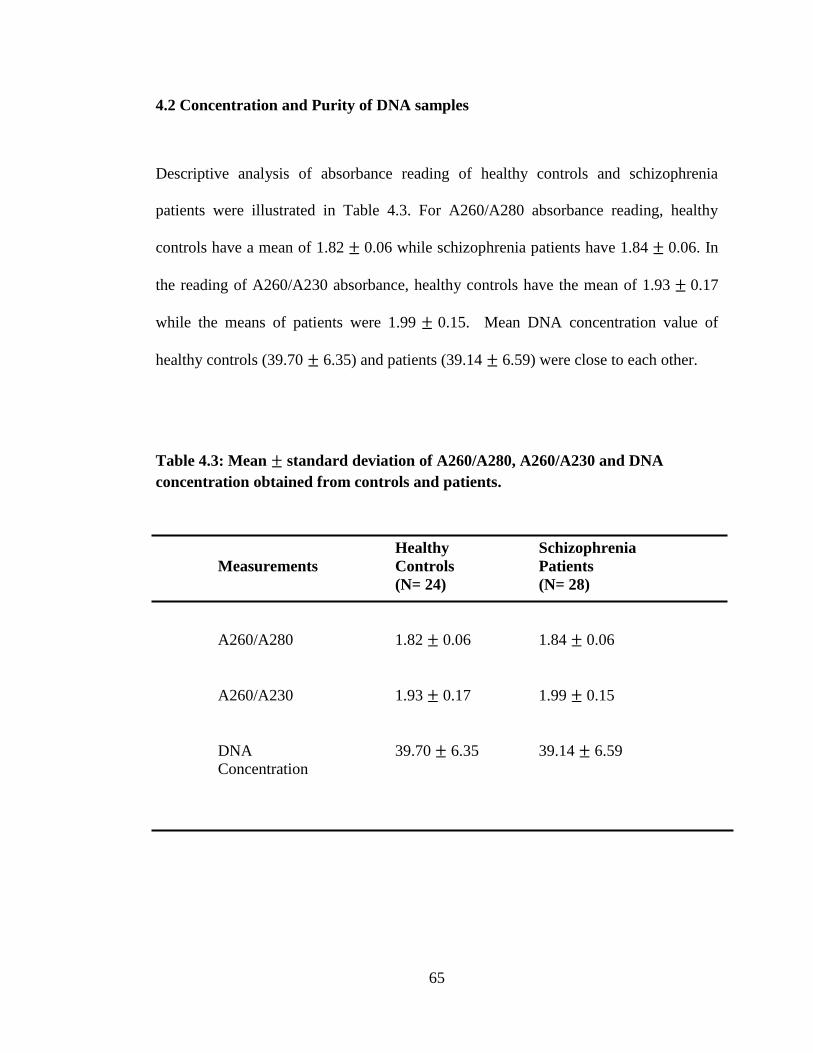
65
4.2 Concentration and Purity of DNA samples
Descriptive analysis of absorbance reading of healthy controls and schizophrenia
patients were illustrated in Table 4.3. For A260/A280 absorbance reading, healthy
controls have a mean of 1.82 0.06 while schizophrenia patients have 1.84 0.06. In
the reading of A260/A230 absorbance, healthy controls have the mean of 1.93 0.17
while the means of patients were 1.99 0.15. Mean DNA concentration value of
healthy controls (39.70 6.35) and patients (39.14 6.59) were close to each other.
Table 4.3: Mean standard deviation of A260/A280, A260/A230 and DNA
concentration obtained from controls and patients.
Healthy Schizophrenia
Measurements Controls Patients
(N= 24) (N= 28)
A260/A280 1.82 0.06 1.84 0.06
A260/A230 1.93 0.17 1.99 0.15
DNA 39.70 6.35 39.14 6.59
Concentration
66
4.3 NRXN1 CNVs
4.3.1 Distribution of NRXN1 Copy Number
The copy number of each sample at seven targeted NRXN1 regions were measured and
determined by CopyCaller® Software v 2.1 (Appendix E). Table 4.4 shows the
distribution of NRXN1 gene copy number in controls and patients across seven targeted
regions. Within Intron 6, there was 1 control (4.2%) with CN loss and 1 control (4.2%)
with CN gain and other 22 controls were normal (median: 2.00; range, 1.70 to 2.33),
while for patients, 4 (14.3%) had CN loss and other patients were normal (median: 1.90;
range, 1.44 to 2.22). At Intron 7 – Exon 7, in controls group, 1 (4.2%) with NRXN1 CN
gain and the other 23 were found normal (median: 2.06; range, 1.80 to 2.43), while in
patients, 5 patients (17.8%) with CN loss, 1 (3.7%) with CN gain and 22 patients had
normal CN (median: 1.98; range, 1.59 to 2.29).
At Intron 9 – Exon 10, all controls were having normal CN (median: 2.03; range, 1.79
to 2.22), while in patients group, one (3.7%) detected with CN loss and the other 27
patients found CN normal (median: 1.99; range, 1.70 to 2.20). At Intron 12 –Exon 13
and Intron 16 – Exon 17, all 24 healthy controls and 28 schizophrenia patients had
shown normal NRXN1 CN. At Intron 15 – Exon 15, 1 controls (4.2%) with CN gain,
others were found CN normal (median: 2.03; range, 1.81 to 2.26). At Intron 20, 1
control (4.2%) had CN loss, 23 controls were found CN normal (median: 2.01; range,
1.65 to 2.20) while in patients group, 4 patients (14.3%) with CN loss and 24 patients
CN were normal (median: 1.90; range: 1.67 to 2.21).
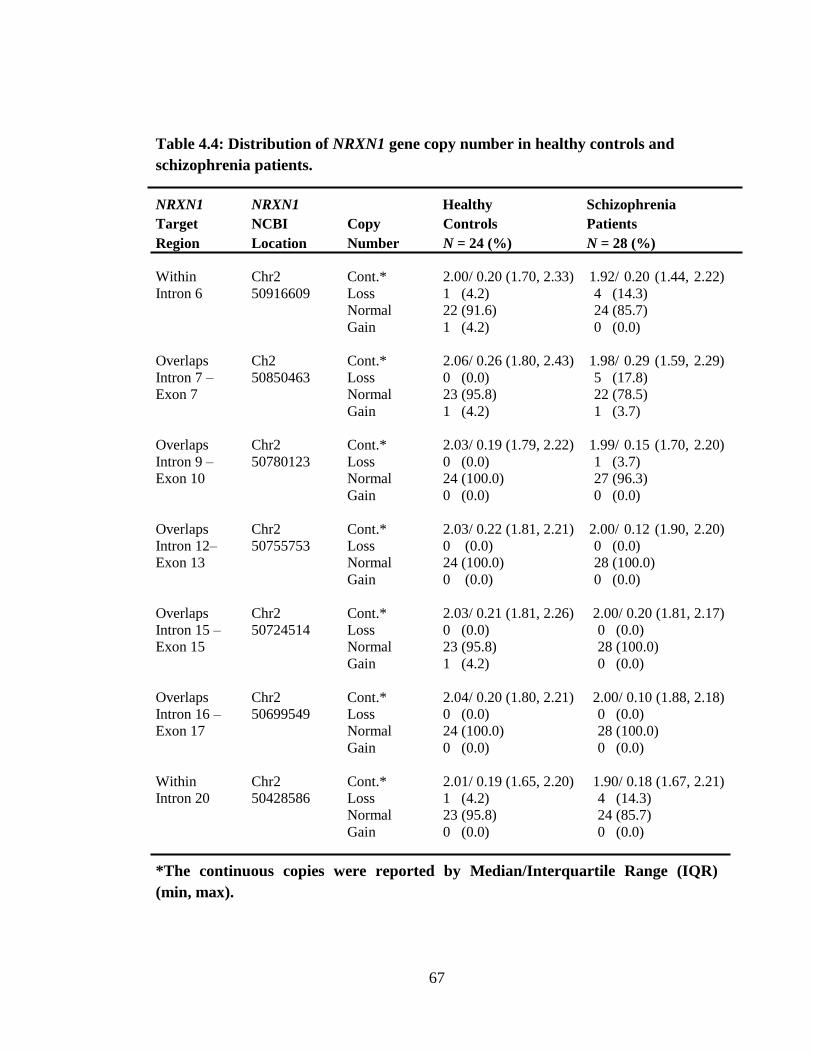
67
Table 4.4: Distribution of NRXN1 gene copy number in healthy controls and
schizophrenia patients.
NRXN1 NRXN1 Healthy Schizophrenia
Target NCBI Copy Controls Patients
Region Location Number N = 24 (%) N = 28 (%)
Within Chr2 Cont.* 2.00/ 0.20 (1.70, 2.33) 1.92/ 0.20 (1.44, 2.22)
Intron 6 50916609 Loss 1 (4.2) 4 (14.3)
Normal 22 (91.6) 24 (85.7)
Gain 1 (4.2) 0 (0.0)
Overlaps Ch2 Cont.* 2.06/ 0.26 (1.80, 2.43) 1.98/ 0.29 (1.59, 2.29)
Intron 7 – 50850463 Loss 0 (0.0) 5 (17.8)
Exon 7 Normal 23 (95.8) 22 (78.5)
Gain 1 (4.2) 1 (3.7)
Overlaps Chr2 Cont.* 2.03/ 0.19 (1.79, 2.22) 1.99/ 0.15 (1.70, 2.20)
Intron 9 – 50780123 Loss 0 (0.0) 1 (3.7)
Exon 10 Normal 24 (100.0) 27 (96.3)
Gain 0 (0.0) 0 (0.0)
Overlaps Chr2 Cont.* 2.03/ 0.22 (1.81, 2.21) 2.00/ 0.12 (1.90, 2.20)
Intron 12– 50755753 Loss 0 (0.0) 0 (0.0)
Exon 13 Normal 24 (100.0) 28 (100.0)
Gain 0 (0.0) 0 (0.0)
Overlaps Chr2 Cont.* 2.03/ 0.21 (1.81, 2.26) 2.00/ 0.20 (1.81, 2.17)
Intron 15 – 50724514 Loss 0 (0.0) 0 (0.0)
Exon 15 Normal 23 (95.8) 28 (100.0)
Gain 1 (4.2) 0 (0.0)
Overlaps Chr2 Cont.* 2.04/ 0.20 (1.80, 2.21) 2.00/ 0.10 (1.88, 2.18)
Intron 16 – 50699549 Loss 0 (0.0) 0 (0.0)
Exon 17 Normal 24 (100.0) 28 (100.0)
Gain 0 (0.0) 0 (0.0)
Within Chr2 Cont.* 2.01/ 0.19 (1.65, 2.20) 1.90/ 0.18 (1.67, 2.21)
Intron 20 50428586 Loss 1 (4.2) 4 (14.3)
Normal 23 (95.8) 24 (85.7)
Gain 0 (0.0) 0 (0.0)
*The continuous copies were reported by Median/Interquartile Range (IQR)
(min, max).
68
In total, 20 copy number alterations (CN loss / CN gain) were detected in controls and
patients (Table 4.4). Five CNVs (3 gains and 2 losses) were found within control‟s
group. All occurred exceptional in distinct healthy sibling pairs at different targeted
sites of NRXN1 gene. In patient‟s group, 15 CNVs (14 losses and 1 gain) were detected.
Eight alterations occurred in isolated subjects from different families across seven
NRXN1 targeted sites. Six variations occurred within full siblings of 3 separated first-
degree schizophrenia families. Two CN losses found in a sibling pair at Intron 20 while
another 4 CN losses were occurred in two independent sibling trio pairs at Intron 6 of
NRXN1.
In these 20 CN alterations, 14 (70%) CNVs were detected in separated subjects from
different families versus 6 (30%) found in full siblings of similar families. Besides that,
16 (80%) CN losses found whereas 4 (20%) CN gains were detected in the finding.
4.3.2 Copy Number Mean of Samples
The CN mean of healthy control and schizophrenic patients at seven targeted NRXN1
site were showed in Table 4.5. After FDR correction, significant differences were found
at three targeted CNV regions, Intron 6 (p = 0.010), Intron 7 – Exon 7 (p = 0.020) and
Intron 20 (p = 0.019). At Intron 9 – Exon 10, the CN mean of patients (1.97 0.11)
was lower than controls (2.03 0.11), it was not significant (p = 0.076). The CN mean
of controls and patients were close to each other and no statistical difference was found
at Intron 12 – Exon 13 (p = 0.389), Intron 15 – Exon 15 (p = 0.293) and Intron 16 –
Exon 17 (p = 0.150).
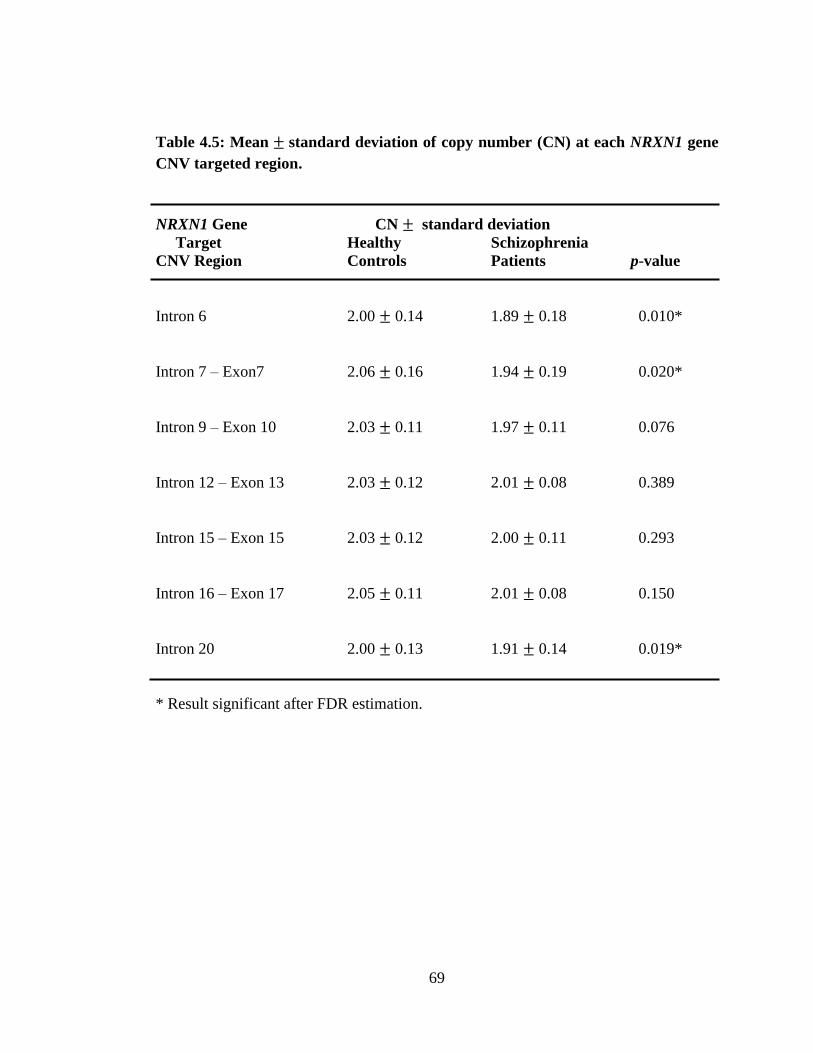
69
Table 4.5: Mean standard deviation of copy number (CN) at each NRXN1 gene
CNV targeted region.
NRXN1 Gene CN standard deviation
Target Healthy Schizophrenia
CNV Region Controls Patients p-value
Intron 6 2.00 0.14 1.89 0.18 0.010*
Intron 7 – Exon7 2.06 0.16 1.94 0.19 0.020*
Intron 9 – Exon 10 2.03 0.11 1.97 0.11 0.076
Intron 12 – Exon 13 2.03 0.12 2.01 0.08 0.389
Intron 15 – Exon 15 2.03 0.12 2.00 0.11 0.293
Intron 16 – Exon 17 2.05 0.11 2.01 0.08 0.150
Intron 20 2.00 0.13 1.91 0.14 0.019*
* Result significant after FDR estimation.
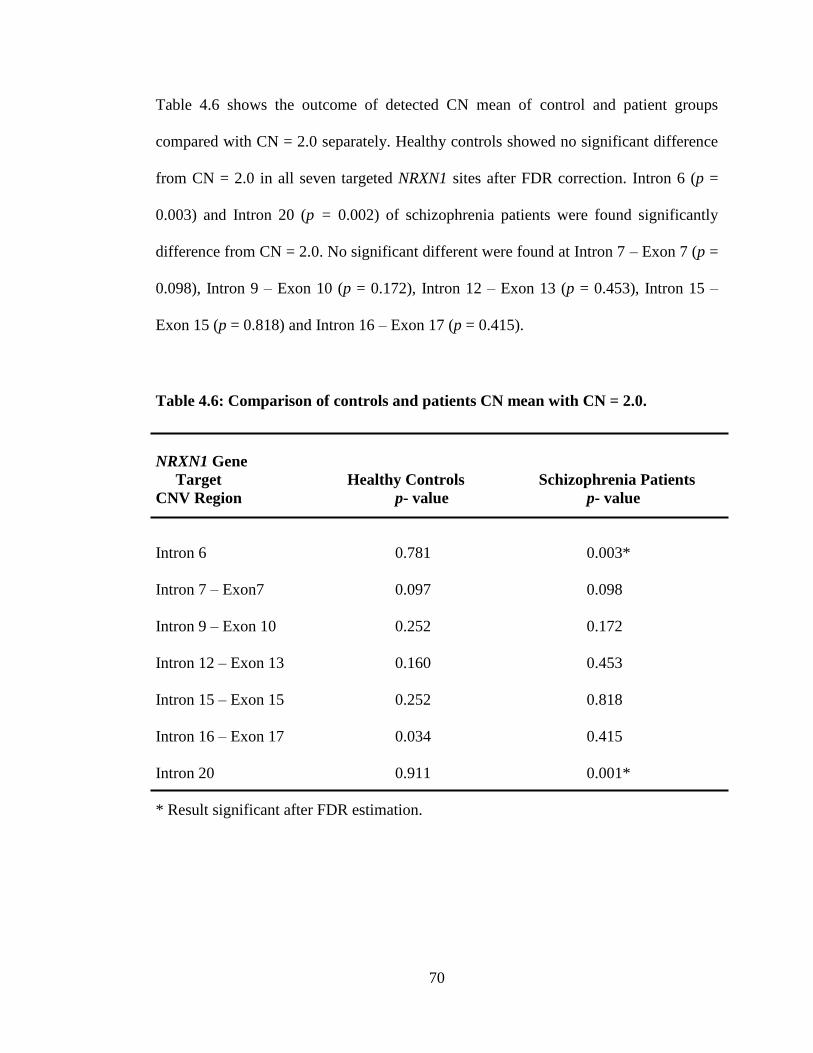
70
Table 4.6 shows the outcome of detected CN mean of control and patient groups
compared with CN = 2.0 separately. Healthy controls showed no significant difference
from CN = 2.0 in all seven targeted NRXN1 sites after FDR correction. Intron 6 (p =
0.003) and Intron 20 (p = 0.002) of schizophrenia patients were found significantly
difference from CN = 2.0. No significant different were found at Intron 7 – Exon 7 (p =
0.098), Intron 9 – Exon 10 (p = 0.172), Intron 12 – Exon 13 (p = 0.453), Intron 15 –
Exon 15 (p = 0.818) and Intron 16 – Exon 17 (p = 0.415).
Table 4.6: Comparison of controls and patients CN mean with CN = 2.0.
NRXN1 Gene
Target Healthy Controls Schizophrenia Patients
CNV Region p- value p- value
Intron 6 0.781 0.003*
Intron 7 – Exon7 0.097 0.098
Intron 9 – Exon 10 0.252 0.172
Intron 12 – Exon 13 0.160 0.453
Intron 15 – Exon 15 0.252 0.818
Intron 16 – Exon 17 0.034 0.415
Intron 20 0.911 0.001*
* Result significant after FDR estimation.
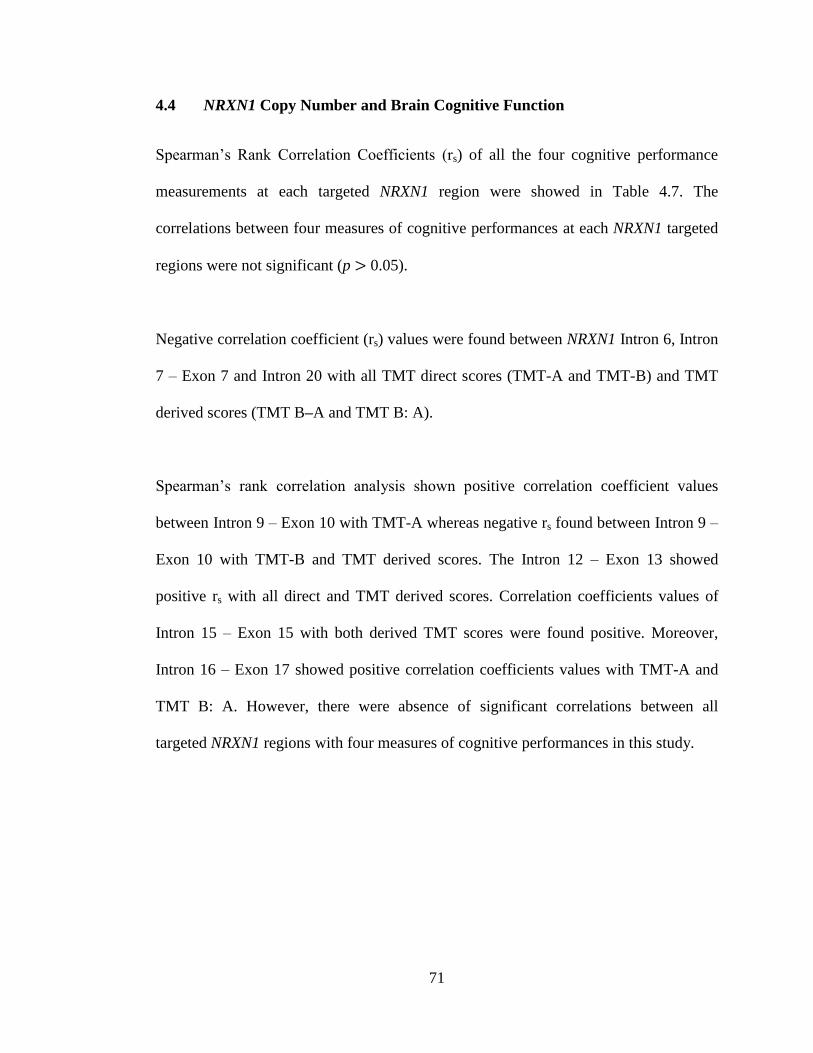
71
4.4 NRXN1 Copy Number and Brain Cognitive Function
Spearman‟s Rank Correlation Coefficients (rs) of all the four cognitive performance
measurements at each targeted NRXN1 region were showed in Table 4.7. The
correlations between four measures of cognitive performances at each NRXN1 targeted
regions were not significant (p 0.05).
Negative correlation coefficient (rs) values were found between NRXN1 Intron 6, Intron
7 – Exon 7 and Intron 20 with all TMT direct scores (TMT-A and TMT-B) and TMT
derived scores (TMT B–A and TMT B: A).
Spearman‟s rank correlation analysis shown positive correlation coefficient values
between Intron 9 – Exon 10 with TMT-A whereas negative rs found between Intron 9 –
Exon 10 with TMT-B and TMT derived scores. The Intron 12 – Exon 13 showed
positive rs with all direct and TMT derived scores. Correlation coefficients values of
Intron 15 – Exon 15 with both derived TMT scores were found positive. Moreover,
Intron 16 – Exon 17 showed positive correlation coefficients values with TMT-A and
TMT B: A. However, there were absence of significant correlations between all
targeted NRXN1 regions with four measures of cognitive performances in this study.
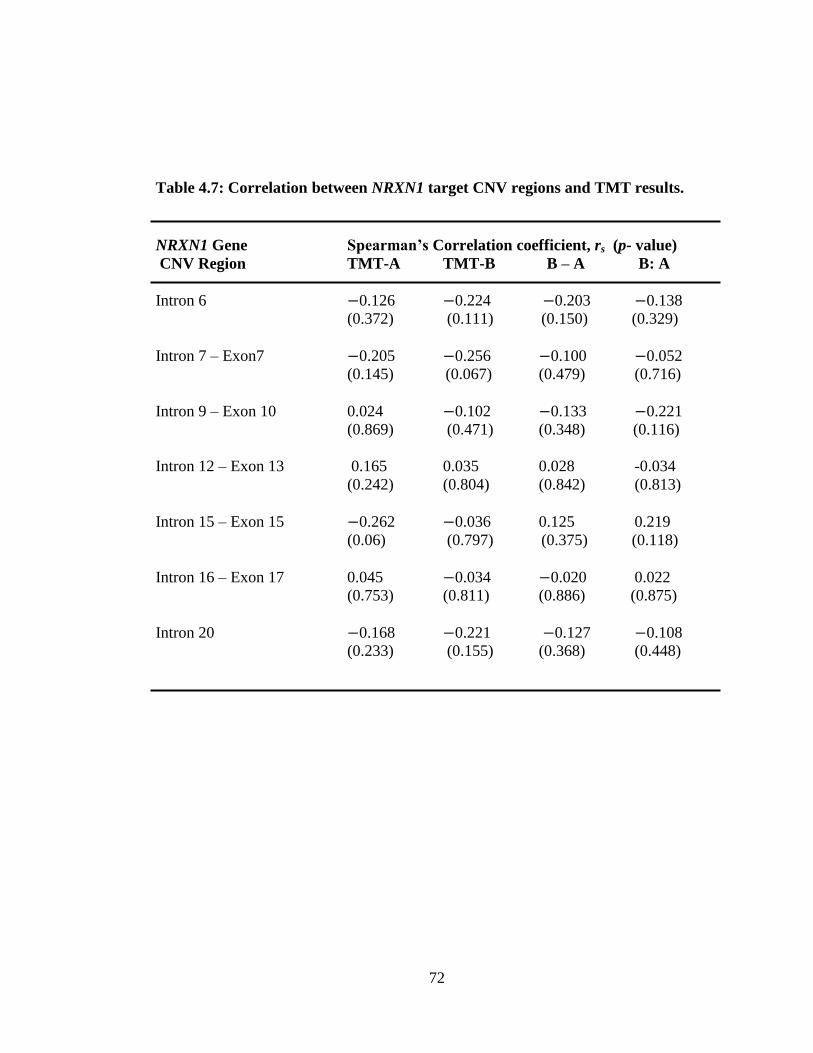
72
Table 4.7: Correlation between NRXN1 target CNV regions and TMT results.
NRXN1 Gene Spearman’s Correlation coefficient, rs (p- value)
CNV Region TMT-A TMT-B B – A B: A
Intron 6 0.126 0.224 0.203 0.138
(0.372) (0.111) (0.150) (0.329)
Intron 7 – Exon7 0.205 0.256 0.100 0.052
(0.145) (0.067) (0.479) (0.716)
Intron 9 – Exon 10 0.024 0.102 0.133 0.221
(0.869) (0.471) (0.348) (0.116)
Intron 12 – Exon 13 0.165 0.035 0.028 -0.034
(0.242) (0.804) (0.842) (0.813)
Intron 15 – Exon 15 0.262 0.036 0.125 0.219
(0.06) (0.797) (0.375) (0.118)
Intron 16 – Exon 17 0.045 0.034 0.020 0.022
(0.753) (0.811) (0.886) (0.875)
Intron 20 0.168 0.221 0.127 0.108
(0.233) (0.155) (0.368) (0.448)
73
4.5 NRXN1 SNPs
4.5.1 Allele and Genotype Frequencies
The frequencies of allele and genotype of five SNPs for subjects were indicated in
Table 4.8. Patients were found deviated from HWE for rs2024513 and rs13382584 after
tested with FDR. Control group of rs10490162 was discovered with HWE deviation.
Among the five studied SNPs, the allele frequency (p = 0.005) and genotype frequency
(p = 0.002) of rs2024513 (Appendix F) were showed significant association with
schizophrenia after FDR correction. At rs2024513, patient found to have more minor G
allele and higher homozygous recessive GG allele than control groups. The other four
SNPs do not showed any significant difference of allele and genotype frequencies
between healthy controls and patients group..
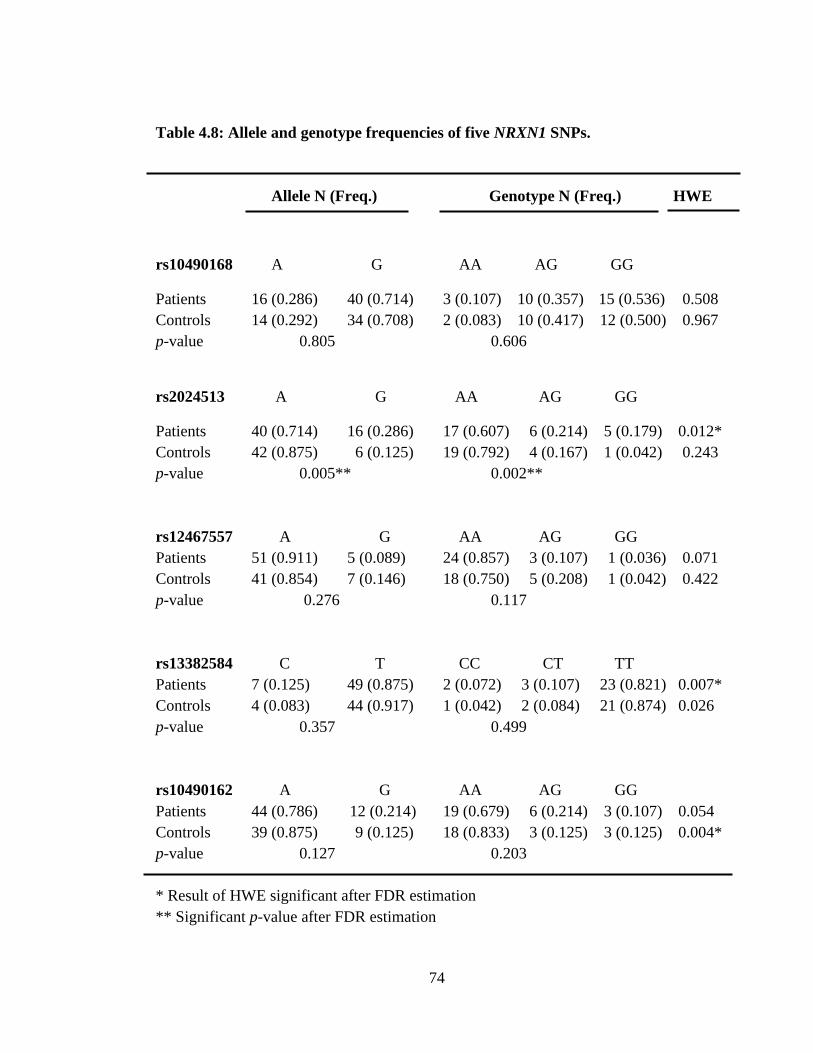
74
Table 4.8: Allele and genotype frequencies of five NRXN1 SNPs.
Allele N (Freq.) Genotype N (Freq.) HWE
rs10490168 A G AA AG GG
Patients 16 (0.286) 40 (0.714) 3 (0.107) 10 (0.357) 15 (0.536) 0.508
Controls 14 (0.292) 34 (0.708) 2 (0.083) 10 (0.417) 12 (0.500) 0.967
p-value 0.805 0.606
rs2024513 A G AA AG GG
Patients 40 (0.714) 16 (0.286) 17 (0.607) 6 (0.214) 5 (0.179) 0.012*
Controls 42 (0.875) 6 (0.125) 19 (0.792) 4 (0.167) 1 (0.042) 0.243
p-value 0.005** 0.002**
rs12467557 A G AA AG GG
Patients 51 (0.911) 5 (0.089) 24 (0.857) 3 (0.107) 1 (0.036) 0.071
Controls 41 (0.854) 7 (0.146) 18 (0.750) 5 (0.208) 1 (0.042) 0.422
p-value 0.276 0.117
rs13382584 C T CC CT TT
Patients 7 (0.125) 49 (0.875) 2 (0.072) 3 (0.107) 23 (0.821) 0.007*
Controls 4 (0.083) 44 (0.917) 1 (0.042) 2 (0.084) 21 (0.874) 0.026
p-value 0.357 0.499
rs10490162 A G AA AG GG
Patients 44 (0.786) 12 (0.214) 19 (0.679) 6 (0.214) 3 (0.107) 0.054
Controls 39 (0.875) 9 (0.125) 18 (0.833) 3 (0.125) 3 (0.125) 0.004*
p-value 0.127 0.203
* Result of HWE significant after FDR estimation
** Significant p-value after FDR estimation
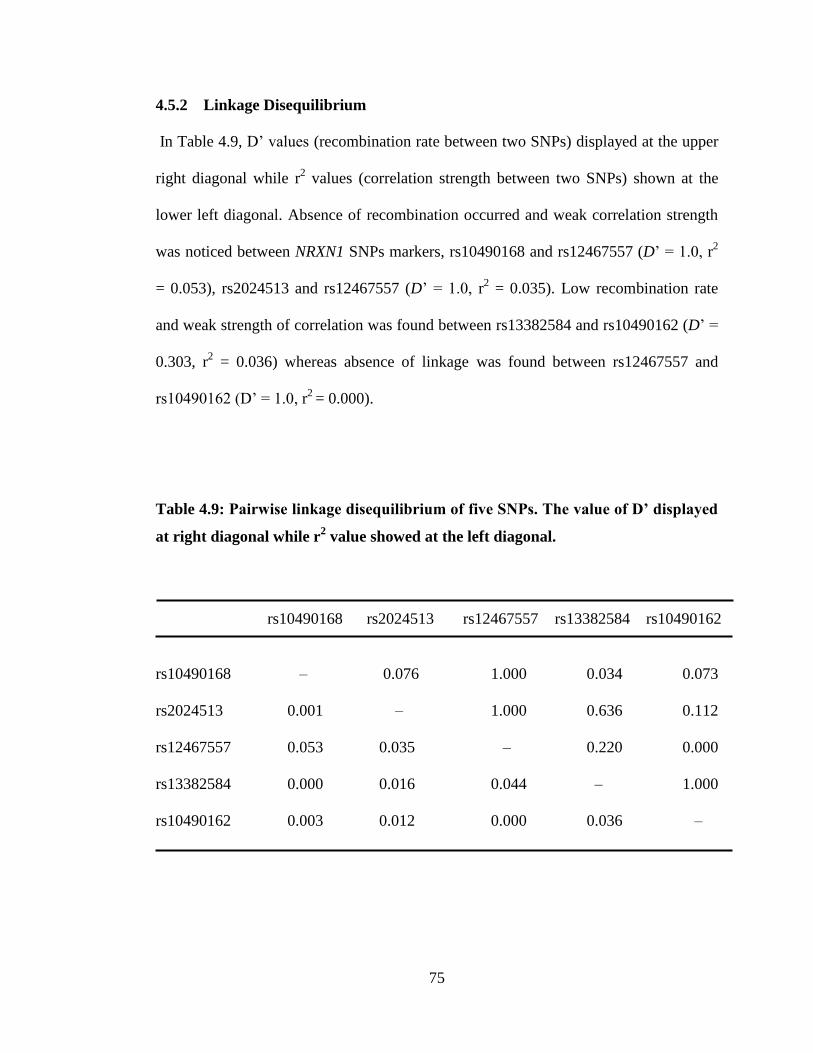
75
4.5.2 Linkage Disequilibrium
In Table 4.9, D‟ values (recombination rate between two SNPs) displayed at the upper
right diagonal while r2 values (correlation strength between two SNPs) shown at the
lower left diagonal. Absence of recombination occurred and weak correlation strength
was noticed between NRXN1 SNPs markers, rs10490168 and rs12467557 (D‟ = 1.0, r2
= 0.053), rs2024513 and rs12467557 (D‟ = 1.0, r2 = 0.035). Low recombination rate
and weak strength of correlation was found between rs13382584 and rs10490162 (D‟ =
0.303, r2 = 0.036) whereas absence of linkage was found between rs12467557 and
rs10490162 (D‟ = 1.0, r2
= 0.000).
Table 4.9: Pairwise linkage disequilibrium of five SNPs. The value of D’ displayed
at right diagonal while r2 value showed at the left diagonal.
rs10490168 rs2024513 rs12467557 rs13382584 rs10490162
rs10490168 – 0.076 1.000 0.034 0.073
rs2024513 0.001 – 1.000 0.636 0.112
rs12467557 0.053 0.035 – 0.220 0.000
rs13382584 0.000 0.016 0.044 – 1.000
rs10490162 0.003 0.012 0.000 0.036 –
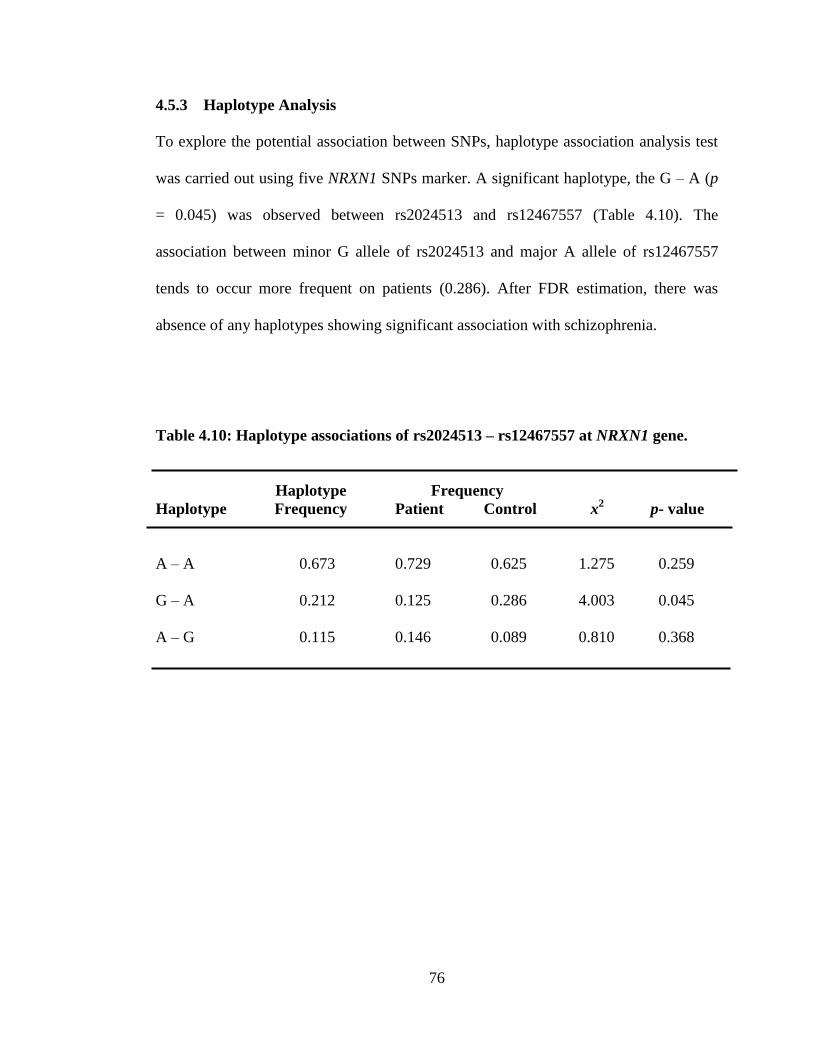
76
4.5.3 Haplotype Analysis
To explore the potential association between SNPs, haplotype association analysis test
was carried out using five NRXN1 SNPs marker. A significant haplotype, the G – A (p
= 0.045) was observed between rs2024513 and rs12467557 (Table 4.10). The
association between minor G allele of rs2024513 and major A allele of rs12467557
tends to occur more frequent on patients (0.286). After FDR estimation, there was
absence of any haplotypes showing significant association with schizophrenia.
Table 4.10: Haplotype associations of rs2024513 – rs12467557 at NRXN1 gene.
Haplotype Frequency
Haplotype Frequency Patient Control x2
p- value
A – A 0.673 0.729 0.625 1.275 0.259
G – A 0.212 0.125 0.286 4.003 0.045
A – G 0.115 0.146 0.089 0.810 0.368
77
CHAPTER 5
DISCUSSION
5.1 Brain Cognitive Test
TMT has been used in psychological mental study on various kind of psychiatric
disorder typically in patients with post-traumatic stress disorder (PTSD), bipolar
disorder and schizophrenia patient (Periáñez et al., 2007). Hashimoto et al (2006) found
that schizophrenia patients were lacking of cognitive ability as diagnosed at the early
beginning stage of the disease.
Schizophrenia multiplex families patients take longer executive time than healthy
control families to complete TMT section A and B. The results were identical to the
finding by Fujiki, et al. (2013). A later finding has also revealed low performance of
patients on both TMT parts compared to healthy subjects (Kourtidou et al., 2015).
Studies showed that lower performance on TMT-B is not caused merely by a slowed
motor performance, but also due to reduced capability of shifting and switching
between sets; a step which identified as an important composite of mental flexibility
(Anderson et al., 2008). TMT section A and B scores were strong predictor for
impairment of mobility, increased lower extremity function deterioration of subjects
(Lezak et al., 2004).
78
Besides that, two derived scores had been proposed as optional indexes to further
illustrate the conscious intellectual activity needed to complete the TMT. The
difference score (B–A) is to reduce the factor of speed from the examined result (Lezak
et al., 2004). Once the speed component is removed, results showed that schizophrenia
patients took almost double the time used by controls to complete the test. This is
similar to finding reported by Sánchez-Cubillo et al (2009) that patients with
schizophrenia performed notable worse than normal subjects on differential derived
score autonomously of their predominant indications. Watanabe and Kato (2004)
reported the high efficiency of healthy subjects group in completing both section of
TMT compared with schizophrenia patients.
TMT B: A also seems to be a good indicator of cognitive deterioration in certain cases.
Felmingham et al. (2004) suggest the application of rational score (TMT B: A), due to
deficits in TMT-B may appeared to underlie by slower performance on TMT-A. Slow
information processing speed increase the difficulties of subjects when facing more
complex cognitive tasks. Outcomes of this study did not show such observed
differences in TMT B: A and this was similar to the finding by Kourtidou et al (2015).
Significant correlation was found between TMT section A and B in both groups of
subjects. This outcome agreed with the finding by Sánchez-Cubillo et al (2009) that
general cognitive factors regulating and affecting both scores.
79
A series of correlations test confirmed the relationship between TMT section A and B
direct measured scores in controls and patients group. This had supported the common
speculation of common cognitive factors would adjust and modify both scores
(Sanchez-Cubillo et al., 2009). All derived scores of samples were found correlated
significantly with TMT-B. This had indicated that TMT-B was among the
measurements that generated the largest percentage notable outcomes on subjects with
schizophrenia subjects as compared to normal controls studies (Periáñez et al., 2007).
Quiñones et al (2009) found a significant heritability estimates for TMT-A to TMT-B
performance.
Neuroimaging and cognitive displayed has correlate the involvement of brain frontal
lobe and weak executive function to schizophrenia (Demakis, 2004; Rodríguez-
Sánchez et al., 2005). Studies by Demakis (2004) showed that schizophrenia subjects
with destruction in brain frontal lobe preforming worse in TMT-A than non-frontal lobe
damaged subjects. Furthermore, an above average consequence size for this
differentiation revealed that TMT-A was less much different between frontal and non-
frontal destruction. Thus, more studies should be conducted to consider frontal lobes as
a function and operating unit of brain executive function (Demakis, 2004; Sánchez-
Cubillo et al., 2009).
80
5.2 NRXN1 CNVs
5.2.1 Intronic Deletion
The NRXN1 intronic deletions have been found to be associated with schizophrenia
(Ching et al., 2010; Schaaf et al., 2013). The finding on intronic deletion found by
Curran et al (2013) was similar to the studies seen by Rujescu et al (2009). NRXN1
intronic deletions were found in approximately two thirds of all patients who expressed
neurodisability phenotypes (Curran et al, 2007). Deletions of NRXN1 introns was
pathogenic due to the losses of important regulatory substances in the gene, such as
promoters, alternative enhancers, or regulatory segments take part in the mechanism
splicing which produces different NRXN1 mRNA isoforms. Losses of copy number on
Exon 20 – Exon 21 disrupts the regular mechanisms consequences on the related RNA-
binding proteins in the flanking introns and existence of AU-rich recognition segments
for SAM68 (Iijima et al., 2011).
There are other deleterious intronic copy number losses in previous studies. Intronic
copy number losses in the SLC34A3 gene lead to hypercalciuria with hereditary
hypophosphatemic rickets (Ichikawa et al., 2006), occurred of Rothmund-Thomson
syndrome due to PKD1 gene mutation (Wang et al., 2002), and patients who
encountered 5-fluorouracil toxicity caused by dihydropyrimidine dehydrogenase gene
mutation (Owen, 2012). The diseases could be triggered by alteration in mechanisms or
biochemical pathway relatively (Sahoo et al., 2011), including removal of a specific
81
introns, mutation of an alternative promoter. Deleterious consequences on regulatory
sequences such as those involved in gene splicing controls, resulted in constraining of
intron size to below of normal. The gene might not function properly due to deletion of
cis-acting elements affecting the proper splicing, exon skipping, intron retention, and
turn-on of cryptic splice site (Curran et al., 2007).
The finding showed a much higher rate of NRXN1 copy number loss was detected in
schizophrenia patients compared with control populations. This agreed with Ching et al
(2010) who found frequency of NRXN1 deletion of control populations was much lower
than patients group. Similar findings had been reported for schizophrenia patients group,
where occurrences of NRXN1 deletions among schizophrenia patients and healthy
controls subjects are 0.19 versus 0.04 respectively (Kirov et al., 2009). It showed that
the rate of schizophrenia patients have NRXN1 copy number deletions approximately 5
times higher than mentally healthy subjects.
5.2.2 CNVs Susceptible Regions
Schizophrenia patients were found presence of copy number deletions at proximal
region of NRXN1 gene that encoding for N-terminal of NRXN1 isoforms (Ikeda et al.,
2008; Vrijenhoek et al., 2008). Six heterozygous intragenic NRXN1 deletions were
detected in clinical samples, three of which had deletion at proximal and intermediate
region of gene (Gregor et al., 2011).
82
Rowen et al. (2002) found that the NRXN1 introns occupied large regions within the
gene. Its sizable length resulted its high conservative degree throughout vertebrates
include humans. It was suggested involved a critical function in the hereditary process
of the NRXN1 gene. Introns are thought to be existed and present throughout the human
genome. It was speculated to fulfill many molecular functions, such as transporter of
transcriptional regulatory elements or main compounds in selective splicing (Fedorova
and Fedorov, 2003). Lengthy introns with more than 445 kb show a much more
interspersed repetitive sequences form stable structures within the genome. It was
suggested to gather splicing junctions near to each other and increase the efficiency of
splicing (Shepard et al, 2009). Recent finding also shows that short inverted repeats are
over expressed in the more than 50 targeted sites of NRXN1. The proximal region of
NRXN1 was identified as key segments of genomic instability and region of copy
number losses hotspot in psychiatric and neurocognitive disorders (Chen et al, 2013).
At the proximal region of NRXN1 gene, significant differences of copy number were
found between control and patient groups at Intron 6 and Intron 7 – Exon 7. Intron 6
was the largest intron at proximal region of NRXN1 (Tabuchi and Südhof, 2002). Intron
6 and Intron 7 – Exon 7 were found within site 1 and site 2 of alternative splicing sites.
Site 1 involved in generating -NRXN1 transcripts where exons 3, 4, and 5
alternatively spliced into 12 possible forms. Site 2 consists of two alternative 5‟ splices
site to generate three possible isoforms (Rowen et al., 2002).
83
The CN loss of Intron 6 could be pathogenic as affecting the splicing of respective
isoforms. Intron 6 deletions were found inherited and this may suggest that NRXN1
Intron 6 could attribute much of the genetic variations and increased the risk for
developmental and neuropsychiatric phenotypes (Schaaf et al., 2012). Among the
identified deleted samples, 30% of intragenic deletions were found in Intron 6 (Schaaf
et al., 2012).
The finding of structural variations influence the NRXN1 Intron 6 (Schaaf et al., 2012)
and Intron 7 – Exon 7 (Dabell et al., 2012) suggests that changed of expression in site 1
and site 2 of alternative splicing sites could interrupt -NRXN1 transcripts formation.
These identifications also reveal that more understated mutations of gene expression,
such as disruption of intron region could involved in the disorder susceptibility of
schizophrenia patients (Owen, Williams and O'Donovan, 2009).
At the distal region of NRXN1 gene, Intron 20 copy number was found significantly
different between control and patient groups. Intron 20 presents within site 4 of
alternative splicing sites on NRXN1 gene to generate both -NRXN1 and -NRXN1
transcripts (Rowen et al., 2002). Disruptions of Intron 20 adversely affect the regulatory
elements on splicing sites and alter the formation of both - and -NRXN1 isoforms
(Rowen et al., 2002). Deletions of NRXN1 distal part could disrupt the gene region that
encode for C-terminal of Neurexin1 isoforms. In the study done by Schaaf et al (2012),
10% of intronic deletion was found at Intron 20 among copy number deleted samples.
One hypotheses that this is because of deletions at C-terminal affecting intensively on
84
Neurexin1 isoforms formation, considering the disruption of splicing alternatively,
which has been found in NRXN1 genes (Südhof, 2008). In the study done by Schaaf et
al. (2012), nine out of seventeen patients affected with epilepsy were diagnosed with C-
terminal intragenic deletions. Five out of seven patients with deletions at C-terminal
were having macrocephaly. Harrison et al (2011) findings showed two sisters with
NRXN1 deletions, one disrupting the proximal site while another deletion occurred at
distal part of gene. Both sisters had serious and early stage onset of epilepsy.
No significant differences were found at the intermediate region of NRXN1 gene: Intron
9 – Exon 10, Intron 12 – Exon 13, Intron 15 – Exon 15 and Intron 16 – Exon 17.
Results of this findings were similar with the results presented by Rujescu et al (2009)
that no notable association of intermediate region of 2p16.3 genetic variants markers
was detected within the huge patient-control study groups. Intron 9 – Exon 10, Intron
15 – Exon 15 and Intron 16 – Exon 17 were located outside of the alternative splicing
sites whereas Intron 12 – Exon 13 was located within splicing sites 3. The intermediate
region was highly conserved (Reissner, Runkel and Missler, 2013) compared with both
proximal and distal region of NRXN1 gene which encode for N-terminal and C-terminal
of NRXN1 isoforms. Some selectively spliced exons in NRXN1 are much conserved
than other. Moreover, the inserted protein sequences between splicing site 2 and
splicing site 4 are highly conserved (Reissner, Runkel and Missler, 2013).
85
The findings showed that the penetrance of CNVs within the similar families at targeted
site of NRXN1 gene were relatively low. Yang, Visscher and Wray (2010) found that
schizophrenia is a polygenic inheritance disease with more expected isolated
occurrences than familial cases. This was agreed with Xu et al (2008) who found de
novo copy number mutations were more significantly linked with schizophrenia (p =
0.00078) in non-familial schizophrenia patients. Besides that, 15 de novo mutations
which detected on separate individuals were found by Girald et al (2011) in eight
schizophrenia families which is significantly higher than expected counting of previous
study (Awadalla et al., 2010). In another study, 60% of the 258 recruited schizophrenia
patients were identified without familial history of schizophrenia or any other related
cognitive disorders (Awadalla et al., 2010). In this study, the detected CNVs could not
be assured as de novo mutation due to patient‟s parents was not recruited and assessed
clinically.
In this study, 10% CN losses and 15% CN gains were found in healthy subjects versus
70% CN losses and 5% CN gains were detected in patient group. The rate of NRXN1
CN loss was shown 4 times higher than CN gain. Bassett et al (2010) reported that CN
deletions show more severe phenotype expression and higher penetrance rate than CN
duplications. Results reported by Rujescu et al (2009) showed a higher CN losses
compared with CN gains on a subset of NRXN1 gene disrupted individuals. Most
studies suggest NRXN1 deletions to be pathogenic while little is known about the
prevalence and pathogenicity of NRXN1 duplications. The gain of NRXN1 copy
number was described in one such case (Wisniowiecka-Kowalnik et al., 2010).
86
In this study, CNVs were also detected in healthy subjects. This has suggested that
copy number variations could exist in normal population, as discussed in several studies
(Iafrate et al., 2004; Sebat et al., 2004; McCarroll et al., 2006; Redon et al., 2006).
Wang et al (2009) reported that the copy number gains and losses in Asian normal
study group were 14% and 86%. Moreover, 65% gains and 35% losses of copy
numbers were found in Caucasian normal population.
5.2.3 CNVs and Cognitive Function
Schizophrenia was found associated with impaired cognitive performance (Stefansson
et al., 2014). As reported by Kendall et al (2016), United Kingdom BioBank Project
had discovered that carriers of pathogenic CNVs such as NRXN1 deletion had impaired
performances on seven cognitive tests (Pairs Matching, Reaction Time, Fluid
Intelligence Score, Digit Span, Symbol Digit Substitution, TMT-A and TMT-B).
Kendall et al (2016) compared the results of cognitive tests between schizophrenia
CNV carriers with NRXN1 deletion and healthy controls, significant differences were
found in TMT-A (p = 0.008) and TMT-B (p = 2.07 10-8
). A study on the Icelandic
population found reduced cognitive performance in NRXN1 deletion carriers. Moreover,
the NRXN1 deletion was associated with impaired verbal IQ and deficits in verbal letter
and category tests (Stefansson et al., 2014).
87
In this study, absence of significant correlations were found between targeted NRXN1
CNVs regions with four cognitive measurements (TMT-A, TMT-B, TMT B A, TMT
B: A). This finding suggests that the effect of CNVs at targeted NRXN1 regions on the
TMT cognitive ability tests may be mediated by slightly different mechanisms that are
not fully encompassed within the measurement of TMT direct and derived scores.
Besides that, the effects on cognitive domains might vary from one CNV to another
(Stefansson et al., 2014). Kendall et al (2016) found no significant correlations exist
between NRXN1 CNV with non-schizophrenia associated CNVs in TMT-A and TMT-
B cognitive test, however significant correlations were found in Digit Spin and
Reaction Time cognitive tests. Stefansson et al (2014) suggested that the effects of
CNVs on manifestation of disease could be investigated through various cognitive
function tests which target different cognitive domains.
The finding was similar to result demonstrated by McRae et al (2013), where no
association was found between copy number called from the Illumina 610K SNP
genotyping microarray and full-scale IQ assessment. These findings were consistent
with previous published genome wide association studies of CNVs and cognitive
performances, where no significant associations were found (Need et al., 2009). In spite
of that, the result was contradictory with outcomes reported by Vangkilde et al (2016).
The associations between cognition performances and copy number deletion at 22q11.2
region were studied with Spearman‟s correlation analysis and significant correlation
was found between cognitive rating scales with 22q11.2 copy number deletion
(Vangkilde et al., 2016).
88
There were other genes that reported with copy number alterations associated with
brain cognitive deficit. Neuroblastoma breakpoint family (NBPF) gene copy number is
proportionally linked with raised of cognitive function as measured by sum of IQ and
aptitude scores of mathematics (Davis et al., 2003). Dosage differences involving
NBPF gene have now been associated to expression in human, cognitive aptitude and
autism severity, showing that such conditions may be present of relation between
genetically and mechanistically factors. In another study, cognitive abilities were
examined by using the Mini-Mental State Examination (MMSE) on 107 elderly women
and mitochondrial DNA copy number was measured. MMSE scores were positively
correlated with their copy number (Lee et al., 2010).
Schizophrenia patients often have reduced brain volumes (Haijma et al., 2013).
Schizophrenia patients were found, intracranial and total volume of brain was
significantly reduced by 2.0% and 2.6% respectively. Larger impact sizes were noticed
for gray matter structures. Gray matter decreased was associated with illness that exists
for longer duration and higher dose of antipsychotic medication at time of scanning.
Haijma et al (2013) suggested that brain loss in schizophrenia may attribute to an
overlap of early neurodevelopmental abnormalities which reflected in intracranial
volume reduction as well as illness progression. Moreover, findings have revealed that
there are direct relations between decline of cognitive functions and reduction in brain
tissue volume (Sluimer et al., 2008; Cardenas et al., 2011)
89
5.3 NRXN1 SNPs
There are many findings that NRXN1 single nucleotide mutations (Feng et al., 2006;
Yan et al., 2008) confer high susceptibility rate for schizophrenia. In a genome-wide
association studies (GWAS) of SNPs markers, NRXN1 has also been found to be linked
with psychiatric disorder (Wang et al., 2009).
The genotype distribution for schizophrenia patients at rs2024513 and rs13382584
statistical deviated from Hardy-Weinberg expectations. The deviation observed in
patients may be due to mutation which is the dominant source of variation in human
genome. Mutation has the potential to happen in somatic cell line or germ line, it could
occur due to point mutation or copy number replication error (Carlson et al., 2003).
Deviation was also found in rs10490162 control group. The population bottlenecks
effect may leads to unbalance selection of controls to maintain multiple alleles in a
population (Przeworski et al., 2005). The deviation may indicate failure in non-random
mating. Other reasons as population stratification and bias of selection are possible
(Raymond and Rousset, 1995; Przeworski et al., 2005).
Absence of evidence of association between rs10490168 and schizophrenia was found.
The G allele remains dominant among Caucasian and Asian populations (Patil et al.,
2001). Genotypes and allele frequencies with schizophrenia were continuously
observed as weak associations in European population through case control studies
(Rujescu et al., 2009). The risk of NRXN1 isoform malfunction was significantly
90
higher in those with the A allele of rs10490168. Disruption in formation of NRXN1
isoforms will prevent the release of neurotransmitter triggered by calcium ions (Zhang
et al., 2005) and causing the malfunction of electric potential difference at channels in
the brainstem synapses (Dudanova et al., 2007).
Significant association of rs2024513 allele and genotype frequencies and schizophrenia
was determined in our study group. The outcome was identical to the findings by Yue
et al (2011) that shows significant difference in allele and genotype frequencies
between patients and controls (allele p = 0.006, genotype p = 0.023) in Asian
population. The rs2024513 allele frequency presented by Yue et al (2011) remained
significant after the Bonferroni correction.
In the cytogenetic analysis of Indian population of schizophrenia patients (Arun et al.,
2016), NRNX1 SNP marker, rs2024513 was found significantly associated with
schizophrenia (p = 0.017) and it remained significant after Bonferroni correction. Arun
et al (2016) found that schizophrenia patients of Indian population have higher
homozygous recessive GG allele than control groups. However, contradictory result
was shown by Bentley et al. (2008) in which allele A remained as the dominant allele in
European population. This may due to geography-based genetic differences that reflect
different adaptive evolutionary processes by separated populations (Baye, Wike and
Olivier, 2010). Evaluation of SNPs variation coverage in human genome carried out by
91
Li, Li and Guan (2008) revealed that selected SNPs for one population might not work
well for another different population.
In this study, rs12467557 was found to have no association with schizophrenia. The
data set is fairly similar with the lacking positive signals for associations of common
variants in a huge study of Swedish population (Ripke et al., 2013). No association was
found between rs10490162 and schizophrenia. These results indicated that neither A
nor G allele was notably correlate with schizophrenia which is supported by the study
of Nussbaum et al. (2008) on European and Africa population.
Specific marker analysis in the family-based subjects showed absence of evidence of
association with rs10490162 (p = 0.54) and rs12467557 (p = 0.33). There were absence
of association of these SNPs with schizophrenia in case-control study group
(rs10490162, p = 0.959; rs12467557, p = 0.74) (Jenkins et al., 2014). The individuals
who carried homozygous A alleles at both SNPs markers showed a responsive result to
neuroleptic drug treatment. Subjects who are heterozygous (AG) and homozygous
recessive (GG) at the similar variants do not showed any obvious positive outcome
according to measurement of response to antipsychotic treatment (Jenkins et al., 2014).
92
No association was found between rs13382584 and schizophrenia. Allele C remains as
recessive allele in Asian and Europe Population (Patil et al., 2001). Some finding
showed that the specific site with presence of these SNPs play a part in the splicing or
expression of the gene. The first NRXN transcripts go through complicate selective
splicing which is then to produce many distinct isoforms (Rowen et al., 2002).
One haplotype at NRXN1 gene was found to be associated with schizophrenia but no
haplotype remain significant after FDR correction. The linkage between rs2024513
with rs12467557 showed in this study was well supported by previous report (Yue et al.,
2011). The two introns located SNPs could be in present in linkage disequilibrium
status while their effects have to additionally be determined. The linkage disequilibrium
pattern may suggest high recombination rate in these SNPs that may be related to the
point mutation at the site, through an unclear mechanism (Lupski and Stankiewicz,
2005; Lee et al., 2007). This form of haplotype diversity has great consequences for
association mapping. The increase set of haplotype sharing among populations
proposed that it might tend to form an efficient set of SNPs for investigate in many
different populations (Carlson et al., 2003).
93
5.4 Future Studies
Recruitments of nuclear family which consist of parents and offspring remain a
challenge in Malaysia. Many schizophrenia patients do not receive a proper health care
and abandoned by their family (Krishnaswamy et al., 2011). In this study, only
schizophrenia sibling pairs or parent-offspring pairs from nuclear families were
enrolled rather than random samples. Some studies suggested that schizophrenia arise
from multiple genes variation. In this study, only NRXN1 was focused instead of
several schizophrenia candidate genes because target neuron cascade or pathways of
each gene are different.
Neuroimaging studies revealed that schizophrenia patients show neuronal vulnerability,
most obviously in brain frontal lobe and their circuitry (Pettersson-Yeo et al., 2011).
NRXN1 gene copy number loss confers susceptibility to schizophrenia could influence
the brain structure and function of cognitive (Voineskos et al., 2011). Structural
Magnetic resonance imaging (MRI) discovered a reduced volume of temporal and
frontal lobe, and reductions in pariental volumes and total brain volume within
schizophrenia populations (Minshew and Keller, 2010). Moreover, a meta-analysis of
over 15 separated studies assured a frontal lobe white matter deteriorations in patients
with schizophrenia (Di et al., 2009). Furthermore, cognitive assessment also identify
deficit of sensorimotor function in schizophrenia (Rajji and Mulsant, 2008; Welham et
al., 2009). In future study, a high resolutions MRI could be used to scan all subjects, to
assess total brain volume and cortical gray and white matter lobar volumes. Besides

94
that, a cognitive assessment known as finger tapping test will be used to assess
sensorimotor function of each subject. Therefore, the influence of genetic variation
(CNVs and SNPs) on cognitive and neural phenotypes could be further assessed.
95
CHAPTER 6
CONCLUSION
In this study, a significant correlation confirmed the relationship between TMT-A and
TMT-B scores. Cognitive deficit in schizophrenia patients could modulate both direct
scores. Besides that, TMT B A derived scores act as a sensitive indicator of cognitive
executive function and significant difference was detected between control and patient
groups. The patients from multiplex schizophrenia families required more processing
time in task switching and execute function compared with healthy families. The copy
number losses at NRXN1 Intron 6, Intron 7 – Exon 7 and Intron 20 were suspected to be
associated with first-degree of schizophrenia families. The copy number mean of
NRXN1 Intron 6 and Intron 20 of first-degree schizophrenia families were found
significantly lower than CN = 2.0. Low copy number at these regions of NRXN1 may
contribute to susceptibility of schizophrenia. There were absences of correlations found
between targeted NRXN1 CNVs regions with all the four measures of cognitive
performances. However, study should be further conducted to determine the effect of
NRXN1 CNVs on cognitive performance. In this study, allele and genotype frequencies
of rs2024513 were found associated with schizophrenia developed in first-degree
families. It was suggested that NRXN1 SNP rs2024513 may play a key role in
schizophrenia. The linkage of haplotype rs2024513–rs12467557 should study further.
A full understanding about the copy number variations and single nucleotides

96
polymorphisms of NRXN1 are necessary and act as a milestone for clinicians to
diagnose schizophrenia and come out with appropriate antipsychotic drugs as treatment
or preventions.
97
LIST OF REFERENCES
Anderson, V., Jacobs, R. and Anderson, P.J., 2008. Executive Functions and the
Frontal Lobes: A Lifespan Perspective (Studies on Neuropsychology, Neurology and
Cognition). London: Psychology Press.
Andreasen, N.C., 2010. The lifetime trajectory of schizophrenia and the concept of
neurodevelopment. Dialogue in Clinical Neuroscience, 12 (3), pp. 409–415.
Anne, S.B., Stephen, W.S. and Linda, M.B., 2010. Copy Number Variations in
Schizophrenia: Critical Review and New Perspectives on Concepts of Genetics and
Disease. American Journal of Psychiatry, 167 (8), pp. 899–914.
Arbuthnott, K. and Frank. F., 2000. Trail making test, part B as a measure of executive
control: validation using a set-switching paradigm. Journal of Clinical and
Experimental Neuropsychology, 22, pp. 518–528.
Arun, M., 2016. Cytogenetics and Selected Biochemical Phenotypes in Indian
Schizophrenia Patients. Journal of Genomic Medicine and Pharmacogenomics, 1 (1),
pp. 81–84.
Ashok, A.H., Baugh, J. and Yeragani, V.K., 2012. Paul Eugen Bleuler and the origin of
the term schizophrenia. Indian Journal of Psychiatry, 54 (1), pp. 95–96.
Awadalla, P. et al., 2010. Direct Measure of the De Novo Mutation Rate in Autism and
Schizophrenia Cohorts. American Journal of Human Genetics, 87 (3), pp. 316–324.
Aziz, S.A., 2008. National Mental Health Registry Schizophrenia Report 2003–2005.
Kuala Lumpur: National Mental Health Registry.
Bassett, A.S. et al., 2010. Clinically detectable copy number variations in a Canadian
catchment population of schizophrenia. Journal of Psychiatric Research, 44 (15), pp.
1005–1009.
Bassett, A.S., Scherer, S.W. and Brzustowicz, L.M., 2010. Copy Number Variations in
Schizophrenia: Critical Review and New Perspectives on Concepts of Genetics and
Disease. The American Journal of Psychiatry, 167 (8), pp. 899–914.
98
Barrett, J., Fry, B., Maller, J. and Daly, M.J., 2005. Haploview: analysis and
visualization of LD and haplotype maps. Bioinformatics, 21, pp. 263–265.
Baye, T.M., Wilke, R.A. and Olivier, M., 2009. Genomic and geographic distribution
of private SNPs and pathways in human populations. Personalized Medicine, 6 (6), pp.
623–641.
Benjamini, Y. and Y. Hochberg, 1995. Controlling the false discovery rate: a practical
and powerful approach to multiple testing. Journal of the Royal Statistical Society:
Series B, 57 (1): 289–300.
Bentley, D.R. et al., 2008. Accurate whole human genome sequencing using reversible
terminator chemistry. Nature, 456, pp. 53–59.
Biederer, T. and Südhof, T.C., 2001. CASK and protein 4.1 support F-actin nucleation
on neurexins. Journal of Biological Chemistry, 276, pp. 47869–47876.
Bierut, L.J. et al., 2007. Novel genes identified in a high-density genome wide
association study for nicotine dependence. Human Molecular Genetics, 16, pp. 24–35.
Bowie, C.R. and Harvey, P.D., 2006. Cognitive deficits and functional outcome in
schizophrenia. Neuropsychiatric Disease and Treatment, 2 (4), pp. 531–536.
Boydell, J. et al., 2001. Incidence of schizophrenia in ethnic minorities in London:
ecological study into interactions with environment. British Medical Journal, 323
(7325), pp. 1336.
Bromet, E., Andrade, L.H., Hwang, I., Sampson, N.A. and Alonso, J., 2011. Cross-
national epidemiology of DSM-IV major depressive episode. BMC Medicine, 9, pp. 90.
Brown, A.S. et al., 2005. Maternal Exposure to Toxoplasmosis and Risk of
Schizophrenia in Adult Offspring. American Journal of Psychiatric, 162 (4), pp. 767–
773.
Cannon, M., Kendell, R., Susser, E. and Jones, P., 2003. Prenatal and perinatal risk
factors for schizophrenia. The Epidemiology of Schizophrenia. Cambridge, UK:
Cambridge University Press, pp. 74–99.
99
Cantor-Graae, E., Pedersen, C.B., McNeil, T.F. and Mortensen, P.B., 2003. Migration
as a risk factor for schizophrenia: a Danish population-based chort study. British
Journal of Psychiatry, 182 (2), pp. 117–122.
Cardenas, V.A. et al., 2011. Brain atrophy associated with baseline and longitudinal
measures of cognition. Neurobiology of Aging, 32, pp. 572–580.
Capizzi, C., Musso, N., Barresi, V. and Condorelli, F.D., 2011. SNP Arrays in
Colorectal cancer: a new script to reveal Broad and Focal aberrations [Online].
Available at: http://bioinformatics.hsanmartino.it/bits_library/index.php?action=
browse&select=all&browseby=author&author=Musso%20N&show=abstract&orderby
=authors [Accessed: 12 February 2016].
Carlson, C.S. et al., 2003. Additional SNPs and linkage-disequilibrium analyses are
necessary for whole-genome association studies in humans. Nature Genetics, 33, pp.
518-521.
Catherine, M.G., Ailsa, R. and David, H., 2010. Trail making test performance in the
first degree relatives of schizophrenic and affective psychotic patients. Cognitive
Neuropsychiatry, 5, pp. 219–234.
Chen, B., Wilkening, S., Drechsel, M. and Hemminki, K., 2009. SNP tools: A compact
tool package for analysis and conversion of genotype data for MS-Excel. BMC
Research Notes, 2, e214.
Chen, F.P. and Greenberg, J.S., 2004. A positive aspect of caregiving: The influence of
social support on caregiving gains for family members of relatives with schizophrenia.
Community Mental Health Journal, 40 (5), pp. 423–435.
Chen, X., Liu, H., Shim, A.H., Focia, P.J. and He, X., 2008. Structural basis for
synaptic adhesion mediated by neuroligin-neurexin interactions. Nature Structural &
Molecular Biology, 15 (1), pp. 50–56.
Chen, X. et al., 2013. Molecular analysis of a deletion hotspot in the NRXN1 region
reveals the involvement of short inverted repeats in deletion CNVs. The American
Journal of Human Genetics, 92, pp. 375–386.
Ching, M.S. et al., 2010. Deletions of NRXN1 (neurexin-1) predispose to a wide
spectrum of developmental disorders. American Journal of Medical Genetics Part B,
153, pp. 937–947.
100
Chun, M., 2012. 12% Malaysians suffer from some forms of mental illness [Online].
Available at: http://www.thesundaily.my/news/297933 [Accessed: 2 January 2016].
Chung, W.S. and Barres, B.A., 2011. The role of glial cells in synapse elimination.
Current Opinion of Neurobiology, 2, pp. 30–35.
Cowan, W.M., Südhof, T.C. and Stevens, C.F., 2001. Synapses. Johns Hopkins
University: Baltimore.
Cooper, G.M., Nickerson, D.A. and Eichler, E.E., 2007. Mutational and selective
effects on copy-number variants in the human genome. Nature Genetics, 39, pp. 22–29.
Curran, S., Ahn, J.W., Grayton, H., Collier, D.A. and Ogilvie, C.M., 2007. NRXN1
deletions identified by array comparative genome hybridisation in a clinical case series
– further understanding of the relevance of NRXN1 to neurodevelopmental disorders.
Journal of Molecular Psychiatry, 1, pp. 4–10.
Craig, A.M. and Kang, Y., 2007. Neurexin-neuroligin signaling in synapse
development. Neurobiology, 17, pp. 43–52.
Dabell, M.P. et al., 2013. Investigation of NRXN1 deletions: clinical and molecular
characterization. American Journal of Medical Genetics Part A, 161, pp. 717–731.
Davis, K.L. et al., 2003. White matter changes in schizophrenia: evidence for myelin-
related dysfunction. Archives of General Psychiatry, 60, pp. 443–456.
Dean, C. and Dresbach, T., 2006. Neuroligins and neurexins: linking cell adhesion,
synapse formation and cognitive function. Trends in Neuroscience, 29, pp. 21–29.
Demakis, G.J., 2004. Frontal lobe damage and tests of executive processing: A meta-
analysis of the category test, stroop test, and trail-making test. Journal of Clinical and
Experimental Neuropsychology, 26, pp. 441–450.
Di. X., Chan, R.C.K. and Gong, Q.Y., 2009. White matter reduction in patients with
schizophrenia as revealed by voxel-based morphometry: An activation likelihood
estimation meta-analysis. Progress in Neuro-Psychopharmacology and Biological
Psychiatry, 33, pp. 1390–1394.
101
Dudanova, I., Tabuchi, K., Rohlmann, A., Südhof, T.C. and Missler, M., 2007.
Deletion of alpha-neurexins does not cause a major impairment of axonal pathfinding
or synapse formation. Journal of neurology, 502 (2), pp. 261–274.
Ebert, A. and Bär, K.J., 2010. Emil Kraepelin: A pioneer of scientific understanding of
psychiatry and psychopharmacology. Indian Journal of Psychiatry, 52 (2), pp. 191–192.
Elvevåg, B. and Goldberg, T.E., 2000. Cognitive impairment in schizophrenia is the
core of the disorder. Critical Review in Neurobiology, 14 (1), pp. 1–21.
Excoffier, L., Laval, G. and Schneider, S., 2005. Arlequin (version 3.0): An integrated
software package for population genetics data analysis. Evolutionary Bioinformatics
Online, 1, pp. 47–50.
Fallin, D. and Schork, N.J., 2000. Accuracy of haplotype frequency estimation for
biallelic loci, via the expectation-maximization algorithm for unphased genotype data.
Ameican Journal of Human Genetics, 67, pp. 947–959.
Faludi, G. and Mirnics, K., 2011. Synaptic changes in the brain of subjects with
schizophrenia. International Journal of Neuroscience, 29, pp. 305–309.
Fedorova, L. and Fedorov, A., 2003. Introns in gene evolution. Genetica, 118 (2-3), pp.
123-131.
Feng, J. et al., 2006. High frequency of neurexin 1beta signal peptide structural variants
in patients with autism. Neuroscience Letter, 409 (1), pp.10–13.
Felmingham, K.L., Baguley, I.J. and Green, A.M., 2004. Effects of diffuse axonal
injury on speed of information processing following severe traumatic brain injury.
Neuropsychology, 18 (3), pp. 564–571.
Feuk, L., Carson, A.R., and Scherer, S.W., 2006. Structural variation in the human
genome. Nature Review Genetics, 7, pp. 85–97.
First, M.B., Spitzer, R.L. and Gibbon, M., 2002. Structured Clinical Interview for
DSM-IV-TR Axis I Disorders, New York: Biometrics Research, New York State
Psychiatric Institute.
102
Fredman, D. et al., 2004. Complex SNP-related sequence variation in segmental
genome duplications. Nature Genetics, 36, pp. 861–866.
Fujiki, R. et al., 2013. Reduced prefrontal cortex activation using the Trail Making Test
in schizophrenia. Neuropsychiatric Disease and Treatment, 9, pp. 675–685.
Garner, C.C., Zhai, R.G., Gundelfinger, E.D. and Ziv, N.E., 2002. Molecular
mechanisms of CNS synaptogenesis. Trends in Neuroscience, 25, pp. 243–251.
Girard, S.L., Xiong, L., Dion, P.A. and Rouleau, G.A., 2011. Where are the missing
pieces of the schizophrenia genetics puzzle. Current Opinion in Genetics &
Development, 21, pp. 310–316.
Glessner, J.T. et al., 2009. Autism genome-wide copy number variation reveals
ubiquitin and neuronal genes. Nature, 459 (7246), pp. 569–573.
Glickman, M.E., Rao, S.R. and Schultz, M.R., 2014. False discovery rate control is a
recommended alternative to Bonferroni-type adjustments in health studies. Journal of
Clinical Epidemiology, 67 (8), pp. 850-857.
Gottesman, I.I., 1991. Schizophrenia Genesis: The Origins of Madness. New York:
Henry Holt & Company, Inc.
Green, M.F., Horan, W.P. and Lee, J., 2015. Social cognition in schizophrenia. Nature
Reviews Neuroscience, 16, pp. 620–631.
Gregor, A. et al., 2011. Expanding the clinical spectrum associated with defects in
CNTNAP2 and NRXN1. BMC Medical Genetics, 12, pp. 106–107.
Haahr, U. et al., 2008. First-episode psychosis: diagnostic stability over one and two
years. Psychopathology, 41, pp. 322–329.
Haijma, S.V. et al., 2013. Brain volumes in schizophrenia: a meta-analysis in over 18
000 subjects. Schizophrenia Bulletin, 39 (5), pp. 1129–1138.
Hallak, E.C. et al., 2013. Rapid Improvement of Acute Schizophrenia Symptoms After
Intravenous Sodium Nitroprusside. JAMA Psychiatry, 70 (7), pp. 668–676.
103
Harrison, V. et al., 2011. Compound heterozygous deletion of NRXN1 causing severe
developmental delay with early onset epilepsy in two sisters. American Journal of
Medical Genetics Part A, 155, pp. 2826–2831.
Hashimoto, R. et al., 2006. Effect of age and education on the Trail Making Test and
determination of normative data for Japanese elderly people. The Tajiri Project
Psychiatry and Clinical Neurosciences, 60, pp. 422–428.
Hoffman, R.E. and McGlashan, T.H., 2001. Neural network models of schizophrenia.
Neuroscientist, 7, pp. 441–454.
Holthausen, E.A.E. et al., 2002. Schizophrenic patients without neuropsychological
deficits. Psychiatry Research, 112, pp. 1–11.
Hooli, B.V., 2011. Genome wide Copy Number Variation Analysis in Early Onset
Alzheimer’s disease. PhD Thesis, Drexel University, Pennsylvania.
Huepe, D. et al., 2012. The relationship of clinical, cognitive and social measures in
schizophrenia: a preliminary finding combining measures in probands and relatives.
Behavioral Neurology, 25 (2), pp. 137–150.
Iafrate, A.J. et al., 2004. Detection of large-scale variation in the human genome.
Natural Genetics, 36, pp. 949–51.
Ichikawa, S. et al., 2006. Intronic deletions in the SLC34a3 gene cause hereditary
hypophosphatemic rickets with hypercalciuria. The Journal of Clinical Endocrinology
and Metabolism. 91(10), pp. 4022–4027.
Iida, J., Hirabayashi, S., Sato, Y. and Hata, Y., 2004. Synaptic scaffolding molecule is
involved in the synaptic clustering of neuroligin. Molecular Cell Neuroscience, 27, pp.
497–508.
Iijima, T. et al., 2011 . SAM68 regulates neuronal activity-dependent alternative
splicing of Neurexin-1. Cell, 147 (7), pp. 1601–1614.
Ikeda, M. et al., 2004. Association of AKT1 with schizophrenia confirmed in a
Japanese population. Biological Psychiatry, 56, pp. 698–700.
104
Ikeda, M. et al., 2008. Variants of dopamine and serotonin candidate genes as
predictors of response to risperidone treatment in first-episode schizophrenia.
Pharmacogenomics, 9, pp. 1437–1443.
International HapMap Consortium, 2005. A haplotype map of the human genome.
Nature, 437, pp. 1299-1320.
International Schizophrenia Consortium, 2008. Rare chromosomal deletions and
duplications increase risk of schizophrenia. Nature, 455 (7210), pp. 237–241.
Jakab, A. et al., 2013. Autistic Traits in Neurotypical Adults: Correlates of Graph
Theoretical Functional Network Topology and White Matter Anisotropy Patterns.
[Online].Available at: http://dx.doi.org/10.1371/journal.pone.0060982 [Accessed: 12
February 2016].
Jamain, S. et al., 2003. Mutations of the X-linked genes encoding neuroligins NLGN3
and NLGN4 are associated with autism. Nature Genetics, 34, pp. 27–29.
Jenkins, A. et al., 2014. Identification of candidate Single Nucleotide Polymorphisms in
NRXN1 Related to Antipsychotic Treatment Response in Patients with Schizophrenia.
Neuropsychopharmacology, 39, pp. 2170–2178.
Joo, E.J. et al., 2006. The dysbindin gene (DTNBP1) and schizophrenia: No support for
an association in the Korean population. Neuroscience Letter, 407, pp. 101–106.
Kavanagh, D.H., Tansey, K.E. and O'Donovan, M.C., 2015. Schizophrenia genetics:
emerging themes for a complex disorder. Molecular Psychiatry, 20 (1), pp. 72–76.
Karege, F. et al., 2012. Genetic overlap between schizophrenia and bipolar disorder: a
study with AKT1 gene variants and clinical phenotypes. Schizophrenia Research, 135,
pp. 8–14.
Kendall, K.M. et al., 2016. Cognitive Performance Among Carriers of Pathogenic
Copy Number Variants: Analysis of 152,000 UK Biobank Subjects. [Online] Available
at: http://dx.doi.org/10.1016/j.biopsych.2016.08.014 [Accessed: 30 January 2017].
Kim, H.G. et al., 2008. Disruption of Neurexin 1 associated with autism spectrum
disorder. The American Journal of Human Genetics, 82 (1), pp. 199–207.
105
Kirov, G. et al., 2009. Neurexin1 (NRXN1) deletions in schizophrenia. Schizophrenia
Bulletin, 35 (5), pp. 851– 854.
Klug, W.S., Cummings, M.R. and Spencer, C.A., 2009. Essentials of Genetics 7th
edition. United State: Benjamin Cummings.
Koester, H.J. and Sakmann, B., 2000. Calcium dynamics associated with action
potentials in single nerve terminals of pyramidal cells in layer 2/3 of the young rat
neocortex. Journal of Physiology, 529, pp. 625–646.
Korver-Nieberg, N., Quee, P.J., Boos, H.B. and Simons, C.J., 2011.The validity of the
DSM-IV diagnostic classification system of non-affective psychosis. Psychiatry, 45, pp.
1061–1068.
Kourtidou, P., Kasselimis, D., Potagas, P., Zalonis, I. and Evdokimidis, I., 2015. Effects
of Mental Flexibility and Motor Dysfunction on Cognitive Performance in Patients
WithParkinson's Disease. Archieves of Neuroscience 2 (3), e21087.
Kraft, P. and Hunter, D.J., 2009. Genetic risk prediction--are we there yet? The New
England Journal of Medicine, 360, pp. 1701–1703.
Krishnaswamy, S., Subramaniam, K., Indran H., Indran, T. and Patel, V., 2009.
Innovative method in data collection: the Malaysian mental health survey. International
Psychiatry, 6 (3), pp. 77.
Lakshiny, 2015. Mental Disorder Is Going To Affect Over 3 Million Malaysians By
2020 – Will You Be One Of Them? [Online]. Available at:
http://www.malaysiandigest.com/news/ 582570-mental-disorder-is-going-to-affect-
over-3-million-malaysians-by-2020-will-you-be-one-of-them.html [Accessed: 12
March 2016].
Lee, J.A., Carvalho, C.M. and Lupski, J.R., 2007. DNA replication mechanism for
generating nonrecurrent rearrangements associated with genomic disorders. Cell, 131,
pp. 1235–1247.
Lee, J.W., Park, K.D., Im, J.A., Kim, M.Y. and Lee, D.C., 2010. Mitochondrial DNA
copy number in peripheral blood is associated with cognitive function in apparently
healthy elderly women. Clinical Chemistry, 411, pp. 592–596.
106
Lett, T.A. et al., 2011. The putative functional rs1045881 marker of neurexin-1 in
schizophrenia and clozapine response. Schizophrenia Research, 132, pp. 121–124.
Levinson, D., Duan, J., Oh, S., Wang, K. and Sanders, A., 2011. Copy number variants
in schizophrenia: confirmation of five previous findings and new evidence for 3q29
microdeletions and VIPR2 duplications. The American Journal of Psychiatry, 168, pp.
302–316.
Lewis, C.M. et al., 2003. Genome scan meta-analysis of schizophrenia and bipolar
disorder, part II: schizophrenia. American Journal of Human Genetics, 73, pp. 34–48.
Lezak, M.D., Howieson, D.B. and Loring, D.W., 2004. Neuropsychological Assessment.
New York: Oxford University Press.
Li, M., Li, C. and Guan, W., 2008. Evaluation of coverage variation of SNP chips for
genome-wide association studies. European Journal of Human Genetics, 16, pp. 635–
643.
Li, X. et al., 2010. A genome wide association study between copy number variation
(CNV) and human height in Chinese population. Journal of Genetics and Genomics, 37
(12), pp. 779–785.
Loh, H.C., Chow, T.J., Tang, P.Y. and Yong, H.S., 2013. No association between
AKT1 gene variants and schizophrenia: A Malaysian case-control study and meta-
analysis. Psychiatric Research. 209 (3), pp. 732–733.
Lupski, J.R. and Stankiewicz, P., 2005. Genomic Disorders: Molecular Mechanisms for
Rearrangements and Conveyed Phenotypes. PLoS Genetics, 1 (6), e49.
Maat, A., Fett, A.K. and Derks, E., 2012. Social cognition and quality of life in
schizophrenia. Schizophrenia Research, 137, pp. 212–218.
Magri, C. et al., 2010. New Copy Number Variations in Schizophrenia. PLoS ONE, 5
(10), e13422.
Marshall, C.R. et al., 2008. Structural variation of chromosomes in autism spectrum
disorder. The American Journal of Human Genetics, 82 (2), pp. 477–488.
107
Maruish, M.E., 2004. The Use of Psychological Testing for Treatment Planning
and Outcomes Assessment. Community Mental Health Journal, 40(5), pp. 410–415.
Manji, H.K., Gottesman, I.I. and Gould, T.D., 2003. Signal transduction and genes-to-
behaviors pathways in psychiatric diseases. Science Signaling, 207, pp. 49.
Manolio, T.A., Brooks, L.D. and Collins, F.S., 2008. A HapMap harvest of insights into
the genetics of common disease. Journal of Clinical Invest, 118, pp. 1590–605.
McCarroll, S.A. et al., 2006. International HapMap Consortium. Common deletion
polymorphisms in the human genome. Natural Genetics, 38, pp. 86-92.
McCarthy, M.I. et al., 2008. Genome-wide association studies for complex traits:
consensus, uncertainty and challenges. Nature Reviews Genetics, 9, pp. 356–369.
McRae, A.F. et al., 2013. No association between general cognitive ability and rare
copy number variation. Behavioural Genetics 43(3), pp. 202-207.
Meyer, G., Varoqueaux, F., Neeb, A., Oschlies, M. and Brose, N., 2004. The
complexity of PDZ domain-mediated interactions at glutamatergic synapses: a case
study on neuroligin. Neuropharmacology, 47, pp. 724–733.
Ministry of Health Malaysia, 2009. Clinical Practice Guideline: Management of
schizophrenia in adults. Kuala Lumpur: Ministry of Health Malaysia.
Minshew, N.J. and Keller, T.A., 2010. The nature of brain dysfunction in autism:
functional brain imaging studies. Current opinion in Neurology, 23, pp. 124–130.
Missler, M. et al., 2003. Alpha-neurexins couple Ca2+
channels to synaptic vesicle
exocytosis. Nature, 423 (6943), pp. 939–948.
Monks, S. et al., 2014. Further evidence for high rates of schizophrenia in 22q11.2
deletion syndrome. Schizophrenia Bulletin, 153, pp. 231 –236.
Moskowitz, G., 2004. Social cognition: understanding self and others. New York:
Guilford Press.
108
Mueser, K.T. and McGurk, S.R., 2004. Schizophrenia. The Lancet, 363 (9426), pp.
2063–2072.
Myles-Worsley, M. et al., 2007. Recurrence risk to offspring in extended multiplex
schizophrenia pedigrees from a Pacific Island isolate. American Journal of Medical
Genetics Neuropsychiatric Genetics 144B (1), pp. 41-44.
Need, A. C., 2009. A Genome-wide Study of Common SNPs and CNVs in Cognitive
Performance in the CANTAB battery. Human Molecular Genetics 18 (23), pp. 4650-
4661.
Noble, W.S., 2009. How does multiple testing correction work? Nature Biotechnology,
27(12), pp. 1135–1137.
Numakawa, T. et al., 2004. Evidence of novel neuronal functions of dysbindin, a
susceptibility gene for schizophrenia. Human Molecular Genetics, 13, pp. 2699–2708.
Nussbaum, J. et al., 2008. Significant association of the neurexin-1 gene (NRXN1) with
nicotine dependence in European- and African-American smokers. Human Molecular
Genetics, 17 (11), pp. 1569–1577.
Owen, M.J., O'Donovan, M.C. and Harrison, P.J., 2005. Schizophrenia: a genetic
disorder of the synapse? BMJ Clinical Research, 330 (7484), pp.158–159.
Owen, M.J., 2012. Implications of genetic findings for understanding schizophrenia.
Schizophrenia Bulletin, 38, pp. 904–907.
Owen, M.J., Williams, H.J. and O'Donovan, M.C., 2009 Schizophrenia genetics:
advancing on two fronts. Current Opinion in Genetics & Development, 19 (3), pp. 266–
270.
Pang, Z.P., Xu, W., Cao, P. and Südhof, T.C., 2010. Calmodulin suppresses
synaptotagmin-2 transcription in cortical neurons. Journal of Biological Chemistry, 285,
pp. 33930–33939.
Patil, N., Berno, A.J., Hinds, D.A. and Barrett, W.A., 2001. Blocks of limited haplotype
diversity revealed by high-resolution scanning of human chromosome 21. Science, 294
(5547), pp. 1719-1723.
109
Periáñez, J.A. et al., 2007. Trail Making Test in traumatic brain injury, schizophrenia,
and normal ageing: sample comparisons and normative data. Archives of Clinical
Neuropsychology, 22 (4), pp. 433–447.
Pettersson-Yeo, W., Allen, P., Benetti, S., McGuire, P. and Mechelli, A., 2011.
Dysconnectivity in schizophrenia: where are we now? Neuroscience & Biobehavioral
Reviews, 35, pp. 1110–1124.
Pocklington, A.J., O'Donovan, M. and Owen, M.J., 2014. The synapse in schizophrenia.
The European Journal of Neuroscience, 39 (7), pp. 1059–1067.
Przeworski, M., Coop, G. and Wall, J.D., 2005. The signature of positive selection on
standing genetic variation. Evolution, 59, pp. 2312–2323.
Quiñones, R. et al., 2009. Heritability of Trail Making Test performance in multiplex
schizophrenia families: implications for the search for an endophenotype. European
Archives of Psychiatry and Clinical Neurosciences, 259 (8), pp. 475–481.
Rajji, T.K. and Mulsant, B.H., 2008. Nature and course of cognitive function in late-life
schizophrenia: a systematic review. Schizophrenia Research, 102, pp. 122–140.
Raymond, M. and Rousset, F., 1995. An exact test for population differentiation.
Evolution, 49, pp. 1280–1283.
Redon, R. et al., 2006. Global variation in copy number in the human genome. Nature,
444, pp. 444–54.
Rees, E., Moskvina, V., Owen, M.J., O‟Donovan, M.C. and Kirov, G., 2011. De novo
rates and selection of schizophrenia-associated copy number variants. Biology
Psychiatry, 70, pp. 1109–1114.
Reichenberg, A., 2010. The assessment of neuropsychological functioning in
schizophrenia. Dialogues in Clinical Neuroscience, 12(3), pp. 383–392.
Reissner, C., Klose, M., Fairless, R. and Missler, M., 2008. Mutational analysis of
theneurexin/ neuroligin complex reveals essential and regulatory components.
Proceedings of the National Academy of Sciences, 105 (39), pp. 15124–15129.
110
Reissner, C., Runkel, F. and Missler, M. 2013. Neurexins. Genome Biology, 14 (9), pp.
213.
Ríos, M., Periáñez, J.A. and Muñoz-Céspedes, J.M., 2004. Attentional control and
slowness of information processing after severe traumatic brain injury. Brain Injury, 18,
pp. 257–272.
Ripke, S. et al., 2013. Genome-wide association analysis identifies 13 new risk loci for
schizophrenia. Nature Genetics, 45, pp. 1150–1159.
Rodríguez-Sánchez, J.M. et al., 2005. Prefrontal cognitive functions in stabilized first-
episode patients with schizophrenia spectrum disorders: A dissociation between
dorsolateral and orbitofrontal functioning. Schizophrenia Research, 77, pp. 279–288
Rovelet-Lecrux, A., Hannequin, D., Raux, G., LeMeur, N. and Laquerriere, A., 2006.
APP locus duplication causes autosomal dominant early-onset Alzheimer disease with
cerebral amyloid angiopathy. Nature Genetics, 38, pp. 24–26.
Rowen, L. et al., 2002. Analysis of the human neurexin genes: alternative splicing and
the generation of protein diversity. Genomics, 79, pp. 587–597.
Rujescu, D. et al., 2009. Disruption of the Neurexin 1 gene is associated with
schizophrenia. Human Molecular Genetics, 18(5), pp. 988–996.
Saha, S., Chant, D. and McGrath, J., 2007. A systematic review of mortality in
schizophrenia: Is the differential mortality gap worsening over time? Architecture
Genetics Psychiatry, 64, pp. 1123–1131.
Sahoo, T. et al., 2011. Copy number variants of schizophrenia susceptibility loci are
associated with a spectrum of speech and developmental delays and behavior problems.
Genetics in Medicine, 13(10), pp. 868–880.
Salthouse, J.M., Toth, J., Daniels, K., Parks, C. and. Pak, R., 2000. Effects of aging on
efficiency of task switching in a variant of the trail making test. Neuropsychology, 14,
pp. 102–111.
Sanchez-Cubillo, I. et al., 2009. Construct validity of the Trail Making Test: role of
task-switching, working memory, inhibition/interference control, and visuomotor
abilities. Journal of the International Neuropsychological Society, 15, pp. 438–450.
111
Sanders, S., 2013. Multiplex-Simplex Comparisons. [Online]. Available at: http://link.springer.com/referenceworkentry/10.1007%2F978-1-4419-1698-3_1333
[Accessed: 12 January 2017].
Schaaf, C.P. et al., 2012. Phenotypic spectrum and genotype-phenotype correlations of
NRXN1 exon deletions. European Journal of Human Genetics, 20 (12), pp. 1240–1247.
Schaffner, S.F., Foo, C., Gabriel, S., Reich, D. and Daly, M.J., 2005. Calibrating a
coalescent simulation of human genome sequence variation. Genome Research, 15, pp.
1576–1583.
Schizophrenia Research Institute, 2013. About Schizophrenia [Online]. Available at:
http://www.schizophreniaresearch.org.au/schizophrenia/about-schizophrenia/
[Accessed: 20 March 2016].
Schneider, K., et al., 2013. Li-Fraumeni Syndrome [Online]. Available at:
http://www.ncbi.nlm.nih.gov/books/NBK1311/ [Accessed: 5 March 2016].
Sebat, J. et al., 2004. Large-scale copy number variation in the human genome. Science,
305, pp. 525–528.
Shah, A. K. et al., 2010. Rare NRXN1 promoter variants in patients with schizophrenia.
Neuroscience Letters, 475 (2), pp. 80–84.
Sharma,T. and Antonova, L., 2003. Cognitive function in schizophrenia. Deficits,
functional consequences, and future treatment. Psychiatric Clinics of North America,
26, pp. 25–40.
Sharp, A.J., Locke, D.P., McGrath, S.D., Cheng, Z. and Bailey, J.A., 2005. Segmental
duplications and copy-number variation in the human genome. American Journal of
Biological Science, 77, pp. 78–88.
Shatz, C.J., 2009. MHC class I: an unexpected role in neuronal plasticity. Neuron. 64,
pp. 40–45.
Sheckler, L.R., Henry, L., Sugita, S., Sudhof, T.C., Rudenko, G., 2006. Crystal
structure of the second LNS/LG domain from neurexin 1alpha: Ca2+
binding and the
effects of alternative splicing. Journal of Biological Chemistry, 281, pp. 22896–22905.
112
Shedlack, K. et al., 1997. Language processing and memory in ill and well siblings
from multiplex families affected with schizophrenia. Schizophrenia Bulletin, 25 (1), pp.
43–52.
Shepard, S., McCreary, M. and Fedorov, A., 2009. The peculiarities of large intron
splicing in animals. PLoS One, 4:e7853.
Siris, S.G., 2001. Suicide and schizophrenia. Journal of Psychopharmacology, 15, pp.
127–135.
Sluimer, J.D. et al., 2008. Whole-brain atrophy rate and cognitive decline: longitudinal
MR study of memory clinic patients. Radiology, 248, pp. 590–598.
Souza, R.P., Meltzer, H.Y., Lieberman, J.A., Le, F.B. and Kennedy, J.L., 2010.
Influence of neurexin 1 (NRXN1) polymorphisms in clozapine response. Human
Psychopharmacology, 25, pp. 582–585.
Stankiewicz, P. and Lupski, J.R., 2002. Genome architecture, rearrangements and
genomic disorders. Trends in Genetics, 18, pp. 74–82.
Stefansson, H. et al., 2008. Large recurrent microdeletions associated with
schizophrenia. Nature, 455, pp. 232–236.
Stefansson, H. et al., 2014. CNVs conferring risk of autism or schizophrenia affect
cognition in controls. Nature. 505 (7483), pp. 361-366.
Stellwagen, D. and Malenka, R.C., 2006. Synaptic scaling mediated by glial TNF-alpha.
Nature, 440, pp. 1054–1059.
Stranger, B.E., Forrest, M.S., Dunning, M., Ingle, C.E. and Beazley, C., 2007. Relative
impact of nucleotide and copy number variation on gene expression phenotypes.
Science, 315, pp. 848–853.
Strauss, E., Sherman, E.M.S. and Spreen, O., 2006. A compendium of
neuropsychological tests: Administration, norms, and commentary. NewYork: Oxford
University Press.
113
Stuss, D.T. et al., 2001. The Trail Making Test: A study in focal lesion patients.
Psychological Assessment, 13, pp. 230–239.
Südhof, T.C., 2008. Neuroligins and neurexins link synaptic function to cognitive
disease. Nature, 455, pp. 903 – 911.
Sugita, S. et al., 2001. A stoichiometric complex of neurexins and dystroglycan in brain.
Journal of Cell Biology, 154 (2), pp. 435–445.
Sullivan, P.F. et al., 2008. Genome wide association for schizophrenia in the CATIE
study: results of stage 1. Molecular Psychiatry, 14, pp. 1144.
Sullivan, P.F., Daly, M.J. and O'Donovan, M., 2012. Genetic architectures of
psychiatric disorders: the emerging picture and its implications. Nature Reviews
Genetics, 13, pp. 537-551.
Switaj, P. et al., 2012. Disability and schizophrenia: a systematic review of experienced
psychosocial difficulties. BMC Psychiatry, 12, pp. 193.
Szatmari, P. et al., 2007. Mapping autism risk loci using genetic linkage and
chromosomal rearrangements. Nature Genetics, 39 (3), pp. 319–328.
Tabuchi, K. and Südhof, T.C., 2002. Structure and evolution of neurexin genes: Insight
into the mechanism of alternative splicing. Genomics, 79 (6), pp. 849–859.
Tanaka, H., Nogi, T., Yasui, N., Iwasaki, K., and Takagi, J., 2011. Structural Basis for
Variant- Specific Neuroligin-Binding by α-Neurexin. PLoS ONE, 6 (4), e19411.
Tandon, R. and Carpenter, W.T., 2012. DSM-5 status of psychotic disorders.
Schizophrenia Bulletin, 38, pp. 369–370.
Tandon, R., Nasrallah, H. A. and Keshavan, M. S., 2009. Schizophrenia, "just the facts"
4. Clinical features and conceptualization. Schizophrenia Research, 110 (1), pp. 1–23.
Tee, S.F., Tang, P.Y. and Loh, H.C., 2011. No evidence for association between DRD3
and COMT with schizophrenia in a Malay population. Genetics and Molecular
Research, 10 (3), pp. 1850–1855.
114
Tochigi, M. et al., 2006. Association study of the dysbindin (DTNBP1) gene in
schizophrenia from the Japanese population. Neuroscience Research, 56, pp. 154–158.
Todarello, G. et al., 2014. Incomplete penetrance of NRXN1 deletions in families with
schizophrenia. Schizophrenia Research, 155(1), pp. 1–7.
Tombaugh, T.N., 2004. Trail Making Test A and B: Normative data stratified by age
and education. Archives of Clinical Neuropsychology, 19, pp. 203–214.
Ullrich, B., Ushkaryov ,Y.A. and Südhof, T.C., 1995. Cartography of neurexins: More
than 1000 isoforms generated by alternative splicing and expressed in distinct subsets
of neurons. Neuron, 14(3), pp. 497–507.
Ushkaryov, Y.A., Petrenko, A.G., Geppert, M. and Südhof, T.C., 1992. Neurexins:
Synaptic cell surface proteins related to the alpha-latrotoxin receptor and laminin.
Science, 257 (5066), pp. 50–56.
Utsunomiya, K. et al., 2008. Genetic association between the dopamine D3 gene
polymorphism (Ser9Gly) and schizophrenia in Japanese populations: Evidence from a
case-control study and meta-analysis. Neuroscience Letter, 444, pp. 161–165.
Vangkilde, A. et al., 2006. Associations between social cognition, skills, and function
and subclinical negative and positive symptoms in 22q11.2 deletion syndrome. Journal
of Neurodevelopmental Disorders, 8:42.
Varoqueaux, F. et al., 2006. Neuroligins determine synapse maturation and function.
Neuron, 51, pp. 741–754.
Voineskos, A.N. et al., 2011. The ZNF804A Gene: Characterization of a Novel Neural
Risk Mechanism for the Major Psychoses. Neuropsychopharmacology, 36 (9), pp.
1871–1878.
Vrijenhoek, T. et al., 2008. Outcome in Psychosis C. Recurrent CNVs disrupt three
candidate genes in schizophrenia patients. The American Journal of Human Genetics,
83 (4), pp. 504– 510.
Walsh, T. et al., 2008. Rare structural variants disrupt multiple genes in
neurodevelopmental pathways in schizophrenia. Science, 320 (5875), pp. 539 – 543.
115
Wang, J. et al., 2009. Genome-Wide Analysis of Copy Number Variations in Normal
Population Identified by SNP Arrays. The Open Biology Journal, 2, pp. 54-65.
Wang, L.L. et al., 2002. Intron Size Constraint as a mutational mechanism in
Rothmund-Thomson Syndrome. The American Journal of Human Genetics, 71,
pp.165–167.
Wang, S.-H. et al., 2013. A stochastic inference of de novo CNV detection and
association test in multiplex schizophrenia families. Frontiers in Genetics, 4, pp. 185.
Ward, A.J. and Cooper, T.A., 2010. The Pathobiology of Splicing. The Journal of
Pathology, 220 (2), pp. 152–163.
Watanabe, A. and Kato, T., 2004. Cerebrovascular response to cognitive tasks in
patients with schizophrenia measured by near-infrared spectroscopy. Schizophrenia
Bulletin, 30(2), pp. 435–444.
Weischenfeldt, J., Symmons, O., Spitz, F. and Korbel, J.O., 2013. Phenotypic impact of
genomic structural variation: insights from and for human disease. Nature Review of
Genetics, 2013, 14 (2), pp. 125-138.
Welham, J., Isohanni, M., Jones, P. and McGrath, J., 2009. The antecedents of
schizophrenia: a review of birth cohort studies. Schizophrenia Bulletin, 35, pp. 603–623.
Williams, N.M. et al., 2012. Genome-Wide Analysis of Copy Number Variants in
Attention Deficit Hyperactivity Disorder: The Role of Rare Variants and Duplications
at 15q13.3. The American Journal of Psychiatry, 169 (2), 195–204.
Wing, J. K. and Agrawal, N., 2003. Concepts and Classification of Schizophrenia.
Schizophrenia 2nd
Edition, United Kingdom: Blackwell Science Ltd, Oxford.
Wisniowiecka-Kowalnik, B. et al., 2010. Intragenic rearrangements in NRXN1 in three
families with autism spectrum disorder, developmental delay, and speech delay.
American Journal of Medical Genetics Part B: Neuropsychiatric Genetics, 153B, pp.
983–993.
Xu, B. et al., 2008. Strong association of de novo copy number mutations with sporadic
schizophrenia. Nature Genetics, 40, pp. 880–885.
116
Yan, J. et al., 2008. Neurexin1 alpha structural variants associated with autism.
Neuroscience Letter, 438 (3), pp. 368– 370.
Yang, J., Visscher, P.M., and Wray, N.R., 2010. Sporadic cases are the norm for
complex disease. European Journal of Human Genetics, 18 (9), pp. 1039–1043.
Yeo, R.A. et al., 2011. Rare copy number deletions predict individual variation in
human brain metabolite concentrations in individuals with alcohol use disorders.
Biological Psychiatry, 70 (6), pp. 537–544.
Yue, W. et al., 2011. A case-control association study of NRXN1 polymorphisms with
schizophrenia in Chinese Han population. Behavioral and Brain Functions (7), pp. 7.
Zahir, F.R. et al., 2007. A patient with vertebral, cognitive and behavioural
abnormalities and a de novo deletion of NRXN1 alpha. Journal of Medical Genetics, 45,
pp. 239– 243.
ZamZam, R. et al., 2011. National mental health registry for schizophrenia in Malaysia:
A preliminary assessment on service utilization. Asia-Pacific Psychiatry, 3, pp. 151–
156.
Zhang, W. et al., 2005. Extracellular domains of alpha-neurexins participate in
regulating synaptic transmission by selectively affecting N- and P/Q-type Ca2þ
channels. Journal of Neuroscience, 25(17), pp. 4330–4342.