the impact of respiratory disease in new zealand: 2018 update · the impact of respiratory disease...
TRANSCRIPT

The impact of respiratory disease in New Zealand: 2018 update
Dr Lucy Telfar BarnardJane Zhang
This report was prepared for the Asthma and Respiratory Foundation NZ
2
Contents
1. List of Figures .................................................................................................................... 5
2. List of Tables ................................................................................................................... 11
3. Executive Summary ........................................................................................................ 18
4. Introduction .................................................................................................................... 22
4.1. Background .............................................................................................................. 22
4.2. Aims ......................................................................................................................... 22
5. Indicator selection and methods .................................................................................... 24
5.1. Conditions ................................................................................................................ 24
5.2. Data sources ............................................................................................................ 24
5.3. Burden ..................................................................................................................... 24
5.3.1. Incidence .......................................................................................................... 25
5.3.2. Prevalence ........................................................................................................ 25
5.3.3. Costs ................................................................................................................. 25
6. New Zealand’s respiratory disease burden .................................................................... 29
6.1. Literature ................................................................................................................. 29
6.2. Asthma ..................................................................................................................... 29
6.2.1. Asthma prevalence ........................................................................................... 29
6.2.2. Asthma hospitalisations .................................................................................... 35
6.2.3. Asthma mortality .............................................................................................. 42
6.3. Bronchiectasis .......................................................................................................... 46
6.3.1. Bronchiectasis prevalence ................................................................................ 46
6.3.2. Bronchiectasis incidence .................................................................................. 47
6.3.3. Bronchiectasis hospitalisations ......................................................................... 47
6.3.4. Bronchiectasis mortality ................................................................................... 54
6.4. Childhood bronchiolitis ............................................................................................ 59
6.4.1. Childhood bronchiolitis hospitalisations ........................................................... 59

3
6.4.2. Childhood bronchiolitis mortality ..................................................................... 65
6.5. Childhood pneumonia ............................................................................................. 66
6.5.1. Childhood pneumonia hospitalisations ............................................................ 66
6.5.2. Childhood pneumonia mortality ....................................................................... 72
6.6. COPD in older adults (45+ years) ............................................................................. 76
6.6.1. Adult 45+ years COPD prevalence .................................................................... 76
6.6.2. Adult 45+ years COPD incidence ...................................................................... 77
6.6.3. Adult 45+ years COPD hospitalisations ............................................................. 77
6.6.4. Adult 45+ years COPD mortality ....................................................................... 83
6.7. Total serious respiratory disease ............................................................................. 88
6.7.1. Total respiratory hospitalisations ..................................................................... 88
6.7.2. Total respiratory mortality ............................................................................... 95
6.8. Cost Summary ........................................................................................................ 100
7. Recommendations ........................................................................................................ 103
8. References .................................................................................................................... 104
9. Appendix 1 Data tables ................................................................................................. 107
9.1. Asthma ................................................................................................................... 107
9.1.1. Asthma prevalence ......................................................................................... 107
9.1.2. Asthma hospitalisations .................................................................................. 109
9.1.3. Asthma mortality ............................................................................................ 114
9.2. Bronchiectasis ........................................................................................................ 116
9.2.1. Severe bronchiectasis prevalence .................................................................. 116
9.2.2. Bronchiectasis hospitalisations ....................................................................... 118
9.2.1. Bronchiectasis mortality ................................................................................. 123
9.3. Childhood bronchiolitis .......................................................................................... 126
9.3.1. Childhood bronchiolitis hospitalisations ......................................................... 126
9.4. Childhood pneumonia ........................................................................................... 131

4
9.4.1. Childhood pneumonia hospitalisations .......................................................... 131
9.4.1. Childhood pneumonia mortality ..................................................................... 136
9.1. COPD in adults aged 45+ years .............................................................................. 138
9.1.1. Adult 45+ years COPD hospitalisations ........................................................... 138
9.1.1. Adult 45+ years COPD mortality ..................................................................... 142
9.2. Total serious respiratory disease ........................................................................... 145
9.2.1. Total respiratory hospitalisations ................................................................... 145
9.2.1. Total respiratory mortality ............................................................................. 149
10. Appendix 2 Indicator definitions ............................................................................... 152
11. Appendix 3 Pharmaceutical inclusions ...................................................................... 153
12. Appendix 4 Literature search results ......................................................................... 154

5
1. LIST OF FIGURES
Figure 1. Age-standardised medicated asthma rates by age group and sex, 2016/17. .................................................................................................................. 31
Figure 2. Medicated asthma prevalence by ethnic group 2016/17, children and adults ........................................................................................................ 32
Figure 3. Child medicated asthma prevalence 2016/17 by NZDep2013, unadjusted .................................................................................................................. 32
Figure 4. Adult medicated asthma prevalence 2016/17 by NZDep2013, unadjusted .................................................................................................................. 33
Figure 5. Children’s (aged 2-14) medicated asthma prevalence by DHB, 2016/17, unadjusted. ............................................................................................... 34
Figure 6. Adult medicated asthma prevalence by region 2016/17, age-standardised .................................................................................................................. 35
Figure 7. Asthma hospitalisations per 100,000 people per year, 2000-2017. ......... 36
Figure 8. Asthma hospitalisations per 100,000 people by age group and sex, 2017. .................................................................................................................. 37
Figure 9. Asthma hospitalisations per 100,000 people by ethnic group, 2017, age-adjusted. ................................................................................................... 38
Figure 10. Asthma hospitalisations rates relative to non-MPA by ethnic group, 2000 – 2017, age-adjusted. ................................................................................ 38
Figure 11. Asthma hospitalisations per 100,000 people by ethnic group and age group, 2017. .............................................................................................. 39
Figure 12. Asthma hospitalisations per 100,000 people by NZDep2013 quintile, 2017, age-adjusted. ............................................................................................ 39
Figure 13. Asthma hospitalisation rates relative to NZDep 1-2 by NZDep2013 quintile, 2000 - 2017, age-adjusted. ......................................................... 40
Figure 14. Asthma hospitalisations per 100,000 people by ethnic group and NZDep2013, 2017, age-adjusted. .............................................................. 40
Figure 15. Asthma hospitalisations per 100,000 people by DHB, 2017. .................... 41
Figure 16. Asthma mortality rates 2000-2015, age-adjusted. ................................... 42
Figure 17. Asthma deaths per 100,000 people by age group and sex, 2010-2015. ... 43

6
Figure 18. Asthma mortality per 100,000 people per year by ethnic group, 2010-2015. ......................................................................................................... 44
Figure 19. Asthma deaths per 100,000 people per year, by ethnic group and age group, 2010-2015. ..................................................................................... 44
Figure 20. Asthma deaths per 100,000 people by NZDep2013 quintile, 2010-2015, age-adjusted. ............................................................................................ 45
Figure 21. Asthma deaths per 100,000 people by ethnic group and NZDep2013, 2010-2015, age-adjusted. ......................................................................... 45
Figure 22. Asthma deaths per 100,000 people per year, by DHB, 2010-2015, age-adjusted .................................................................................................... 46
Figure 23. Bronchiectasis hospitalisations per 100,000 people per year, 2000-2017. .................................................................................................................. 48
Figure 24. Bronchiectasis hospitalisations per 100,000 people per year by age group, 2000-2017. ................................................................................................ 50
Figure 25. Bronchiectasis hospitalisations per 100,000 people by age group and sex, 2017. ......................................................................................................... 50
Figure 26. Bronchiectasis hospitalisations per 100,000 people by ethnic group, 2017. .................................................................................................................. 51
Figure 27. Bronchiectasis hospitalisation rate ratios to non-MPA by ethnic group, 2000 – 2017, age-adjusted. ....................................................................... 51
Figure 28. Bronchiectasis hospitalisations per 100,000 people by ethnic group and age group, 2017. ....................................................................................... 52
Figure 29. Bronchiectasis hospitalisations per 100,000 people by NZDep2013 quintile, 2017, age-adjusted. .................................................................... 52
Figure 30. Bronchiectasis hospitalisations per 100,000 people by NZDep2013 quintile, 2000 - 2017, age-adjusted. ......................................................... 53
Figure 31. Bronchiectasis hospitalisations per 100,000 people by ethnic group and NZDep2013, 2017, age-adjusted. .............................................................. 53
Figure 32. Bronchiectasis hospitalisations per 100,000 people by DHB, 2017. ......... 54
Figure 33. Bronchiectasis mortality rates 2000-2015, age-adjusted. ........................ 55
Figure 34. Bronchiectasis deaths per 100,000 people by age group and sex, 2010-2015. ......................................................................................................... 56

7
Figure 35. Bronchiectasis mortality per 100,000 people per year by ethnic group, 2010-2015. ................................................................................................ 56
Figure 36. Bronchiectasis deaths per 100,000 people per year, by ethnic group and age group, 2010-2015. .............................................................................. 57
Figure 37. Bronchiectasis deaths per 100,000 people by NZDep2013 quintile, 2010-2015, age-adjusted. .................................................................................. 57
Figure 38. Bronchiectasis deaths per 100,000 people by ethnic group and NZDep2013, 2010-2015, age-adjusted. .................................................... 58
Figure 39. Bronchiectasis deaths per 100,000 people per year, by DHB, 2010-2015, age-adjusted ............................................................................................. 59
Figure 40. Childhood bronchiolitis hospitalisations per 100,000 people per year, 2000-2017. ................................................................................................ 60
Figure 41. Childhood bronchiolitis hospitalisations per 100,000 people by sex, 2017. .................................................................................................................. 61
Figure 42. Childhood bronchiolitis hospitalisations per 100,000 people by ethnic group, 2017. .............................................................................................. 62
Figure 43. Childhood bronchiolitis hospitalisations per 100,000 people by ethnic group, 2000 - 2017. ................................................................................... 62
Figure 44. Childhood bronchiolitis hospitalisations per 100,000 people by NZDep2013 quintile, 2017. ....................................................................... 63
Figure 45. Childhood bronchiolitis hospitalisations per 100,000 people by NZDep2013 quintile, 2000 - 2017. ............................................................ 63
Figure 46. Childhood bronchiolitis hospitalisations per 100,000 people by ethnic group and NZDep2013, 2017. ................................................................... 64
Figure 47. Childhood bronchiolitis hospitalisations per 100,000 people by DHB, 2017. .................................................................................................................. 65
Figure 48. Childhood bronchiolitis mortality numbers 2000-2015. ........................... 66
Figure 49. Childhood pneumonia hospitalisations per 100,000 people per year, 2000-2017. ................................................................................................ 67
Figure 50. Childhood pneumonia hospitalisations per 100,000 people by age group and sex, 2017. ........................................................................................... 68
Figure 51. Childhood pneumonia hospitalisations per 100,000 people by ethnic group, 2017, age-adjusted. ....................................................................... 69

8
Figure 52. Childhood pneumonia hospitalisations per 100,000 people by ethnic group, 2000 – 2017, age-adjusted. ........................................................... 69
Figure 53. Childhood pneumonia hospitalisations per 100,000 people by ethnic group and age group, 2017. ...................................................................... 70
Figure 54. Childhood pneumonia hospitalisations per 100,000 people by NZDep2013 quintile, 2017, age-adjusted. .................................................................... 70
Figure 55. Childhood pneumonia hospitalisations per 100,000 people by NZDep2013 quintile, 2000 - 2017, age-adjusted. ......................................................... 71
Figure 56. Childhood pneumonia hospitalisations per 100,000 people by ethnic group and NZDep2013, 2017, age-adjusted. ............................................ 71
Figure 57. Childhood pneumonia hospitalisations per 100,000 people by DHB, 2017. .................................................................................................................. 72
Figure 58. Childhood pneumonia mortality rates 2000-2015, age-adjusted. ............ 73
Figure 59. Childhood pneumonia deaths per 100,000 people by age group and sex, 2006-2015. ................................................................................................ 74
Figure 60. Childhood pneumonia mortality per 100,000 people per year by ethnic group, 2006-2015. ..................................................................................... 74
Figure 61. Childhood pneumonia deaths per 100,000 people by NZDep2013 quintile, 2006-2015, age-adjusted. ......................................................................... 75
Figure 62. Childhood pneumonia deaths per 100,000 people per year, by DHB, 2006-2015, age-adjusted ................................................................................... 76
Figure 63. COPD hospitalisations in adults aged 45+, per 100,000 people per year, 2000-2017, age-adjusted. ......................................................................... 78
Figure 64. COPD hospitalisations in adults aged 45+, per 100,000 people, by age group and sex, 2017. ................................................................................. 79
Figure 65. COPD hospitalisations in adults aged 45+, per 100,000 people, by ethnic group, 2017, age-adjusted. ....................................................................... 79
Figure 66. COPD hospitalisation rate in adults aged 45, by ethnic group, relative to non-MPA reference rate, 2000 - 2017, age-adjusted. .............................. 80
Figure 67. COPD hospitalisations in adults aged 45+, per 100,000 people, by ethnic group and age group, 2017. ...................................................................... 80
Figure 68. COPD hospitalisations in adults 45+, per 100,000 people, by NZDep2013 quintile, 2017, age-adjusted. .................................................................... 81

9
Figure 69. COPD hospitalisations in adults 45+, per 100,000 people, by NZDep2013 quintile, 2000 - 2017, age-adjusted. ......................................................... 81
Figure 70. COPD hospitalisations in adults aged 45+, per 100,000 people, by ethnic group and NZDep2013, 2017, age-adjusted. ............................................ 82
Figure 71. COPD hospitalisations in adults aged 45+, per 100,000 people, by DHB, 2017. ......................................................................................................... 83
Figure 72. Adult COPD mortality rates 2000-2015, age-adjusted. ............................. 84
Figure 73. Adult COPD deaths per 100,000 people by age group and sex, 2015. ...... 85
Figure 74. Adult COPD mortality per 100,000 people per year by ethnic group, 2015. .................................................................................................................. 85
Figure 75. Adult COPD deaths per 100,000 people per year, by ethnic group and age group, 2015. .............................................................................................. 86
Figure 76. Adult COPD deaths per 100,000 people by NZDep2013 quintile, 2015, age-adjusted. ............................................................................................ 86
Figure 77. Adult COPD deaths per 100,000 people by ethnic group and NZDep2013, 2015, age-adjusted. .................................................................................. 87
Figure 78. Adult COPD deaths per 100,000 people per year, by DHB, 2015, age-adjusted .................................................................................................... 88
Figure 79. Total respiratory hospitalisations per 100,000 people per year, 2000-2017, age-adjusted. .................................................................................. 90
Figure 80. New Zealand smoking prevalence 2000-2016/17. .................................... 90
Figure 81. Total respiratory hospitalisations per 100,000 people by age group and sex, 2017. .................................................................................................. 91
Figure 82. Total respiratory hospitalisations per 100,000 people by ethnic group, 2017, age-adjusted. .................................................................................. 92
Figure 83. Respiratory hospitalisation rate ratio to non-MPA by ethnic group, 2000 – 2017, age-adjusted. .................................................................................. 92
Figure 84. Total respiratory hospitalisations per 100,000 people by ethnic group and age group, 2017. ....................................................................................... 93
Figure 85. Total respiratory hospitalisations per 100,000 people by NZDep2013 quintile, 2017, age-adjusted. .................................................................... 93

10
Figure 86. Total respiratory hospitalisation rate ratio to NZDep 1-2 by NZDep2013 quintile, 2000-2017, age-adjusted. ........................................................... 94
Figure 87. Total respiratory hospitalisations per 100,000 people by ethnic group and NZDep2013, 2017, age-adjusted. .............................................................. 94
Figure 88. Total respiratory hospitalisations per 100,000 people by DHB, 2017. ...... 95
Figure 89. Total respiratory mortality rates 2000-2015, age-adjusted. ..................... 96
Figure 90. Total respiratory deaths per 100,000 people by age group and sex, 2010-2015. ......................................................................................................... 97
Figure 91. Total respiratory mortality per 100,000 people per year by ethnic group, 2010-2015. ................................................................................................ 97
Figure 92. Total respiratory deaths per 100,000 people per year, by ethnic group and age group, 2010-2015. .............................................................................. 98
Figure 93. Total respiratory deaths per 100,000 people by NZDep2013 quintile, 2010-2015, age-adjusted. ......................................................................... 98
Figure 94. Total respiratory deaths per 100,000 people by ethnic group and NZDep2013, 2010-2015, age-adjusted. .................................................... 99
Figure 95. Total respiratory deaths per 100,000 people per year, by DHB, 2010-2015, age-adjusted ........................................................................................... 100

11
2. LIST OF TABLES
Table 1. Data sources for indicator conditions and risk factors. ............................. 24
Table 2. Total child medicated asthma prevalence 2006 – 2017, age-standardised .................................................................................................................. 30
Table 3. Total adult medicated asthma prevalence 2006 – 2015, age-standardised .................................................................................................................. 30
Table 4. Ethnic and socioeconomic inequalities in asthma mortality over time. ... 43
Table A 1. Age-standardised medicated asthma rates by age-group and sex, 2016/17 ................................................................................................................ 107
Table A 2. Medicated asthma prevalence by ethnic group 2016/17, children and adults ...................................................................................................... 107
Table A 3. Child medicated asthma prevalence 2016/17 by NZDep2013, unadjusted ................................................................................................................ 107
Table A 4. Adult medicated asthma prevalence 2016/17 by NZDep2013, unadjusted ................................................................................................................ 108
Table A 5. Children (aged 2-14) and adult (aged 15+) medicated asthma prevalence by DHB 2016/17 ...................................................................................... 108
Table A 6. Asthma hospitalisations, rates and age-adjusted rates 2000-2017. ....... 109
Table A 7. 2017 asthma hospitalisation rates and rate ratios by age group and sex ................................................................................................................ 109
Table A 8. 2017 asthma hospitalisation age group rate ratios by sex ...................... 110
Table A 9. 2017 asthma hospitalisation rates and rate ratios by ethnic group. ...... 110
Table A 10. Asthma hospitalisation rates and rate ratios by ethnic group 2000 - 2017. ................................................................................................................ 110
Table A 11. Asthma hospitalisation ethnic group rate ratios to non-MPA, 2000 – 2017. ................................................................................................................ 111
Table A 12. 2017 asthma hospitalisation rates by ethnic group and age. ................. 111
Table A 13. 2017 asthma hospitalisation rates by NZDep2013 quintile. ................... 111
Table A 14. Asthma hospitalisation rates by NZDep2013 quintile 2000 - 2017. ........ 112

12
Table A 15. Asthma hospitalisation rates relative to NZDep 1-2 by NZDep2013 quintile 2000 - 2017. ............................................................................................ 112
Table A 16. 2017 asthma hospitalisation rates by ethnic group and NZDep2013 quintile. ................................................................................................... 113
Table A 17. 2017 asthma hospitalisation rates by DHB. ............................................ 113
Table A 18. Asthma mortality rates and age-adjusted rates 2000-2013. .................. 114
Table A 19. Asthma mortality rates and rate ratios by age group and sex, 2010-2015. ................................................................................................................ 114
Table A 20. Asthma mortality rate ratios by age group and sex, 2010-2015. ........... 114
Table A 21. Asthma mortality rates and rate ratios by ethnic group, 2010-2015. ..... 114
Table A 22. Asthma mortality rates by ethnic group and age, 2010-2015 ................ 115
Table A 23. Asthma mortality rates NZDep2006 quintile, 2010-2015. ...................... 115
Table A 24. Asthma mortality rates by ethnic group and NZDep quintile, 2010-2015. ................................................................................................................ 115
Table A 25. Asthma mortality rates by DHB, 2010-2015. .......................................... 116
Table A 26. 2017 severe bronchiectasis prevalence numbers, rates and rate ratios by age group and sex ................................................................................... 116
Table A 27. 2017 severe bronchiectasis prevalence age group rate ratios total and by sex. .......................................................................................................... 116
Table A 28. 2017 severe bronchiectasis prevalence rates and rate ratios by ethnic group. ...................................................................................................... 117
Table A 29. 2017 severe bronchiectasis prevalence rates by NZDep2013 quintile. .. 117
Table A 30. 2017 severe bronchiectasis prevalence rates by DHB. ........................... 117
Table A 31. Bronchiectasis hospitalisations, rates and age-adjusted rates 2000-2017. ................................................................................................................ 118
Table A 32. Bronchiectasis hospitalisation rates and rate ratios by age group, 2000 - 2017 ........................................................................................................ 118
Table A 33. 2017 bronchiectasis hospitalisation rates and rate ratios by age group and sex ........................................................................................................... 119
Table A 34. 2017 bronchiectasis hospitalisation age group rate ratios by sex .......... 119

13
Table A 35. 2017 bronchiectasis hospitalisation rates and rate ratios by ethnic group. ................................................................................................................ 119
Table A 36. Bronchiectasis hospitalisation rates by ethnic group 2000 - 2017. ........ 119
Table A 37. Bronchiectasis hospitalisation rate ratios to non-MPA by ethnic group 2000 - 2017. ............................................................................................ 120
Table A 38. 2017 bronchiectasis hospitalisation rates by ethnic group and age. ...... 120
Table A 39. 2017 bronchiectasis hospitalisation rates by NZDep2013 quintile. ........ 120
Table A 40. Bronchiectasis hospitalisation rates by NZDep2013 quintile 2000 - 2017. ................................................................................................................ 121
Table A 41. Bronchiectasis hospitalisation rates relative to NZDep 1-2 by NZDep2013 quintile 2000 - 2017. ............................................................................... 121
Table A 42. 2017 bronchiectasis hospitalisation rates by ethnic group and NZDep2013 quintile. ................................................................................................... 122
Table A 43. 2017 bronchiectasis hospitalisation rates by DHB. ................................. 122
Table A 44. Bronchiectasis mortality rates and age-adjusted rates 2000-2015. ....... 123
Table A 45. Bronchiectasis mortality rates and rate ratios by age group and sex, 2010-2015. ....................................................................................................... 123
Table A 46. Bronchiectasis mortality rate ratios by age group and sex, 2010-2015. . 123
Table A 47. Bronchiectasis mortality rates and rate ratios by ethnic group, 2010-2015. ................................................................................................................ 124
Table A 48. Bronchiectasis mortality rates by ethnic group and age, 2010-2015 ..... 124
Table A 49. Bronchiectasis mortality rates NZDep2006 quintile, 2010-2015. ........... 124
Table A 50. Bronchiectasis mortality rates by ethnic group and NZDep2013 quintile, 2010-2015. .............................................................................................. 124
Table A 51. Bronchiectasis mortality rates by DHB, 2010-2015. ............................... 125
Table A 52. Childhood bronchiolitis hospitalisations, rates and age-adjusted rates 2000-2017. .............................................................................................. 126
Table A 53. 2017 childhood bronchiolitis hospitalisation rates and rate ratios by sex ................................................................................................................ 126
Table A 54. 2017 childhood bronchiolitis hospitalisation rates and rate ratios by ethnic group. ........................................................................................... 126

14
Table A 55. Childhood bronchiolitis hospitalisation rates by ethnic group 2000 - 2017. ................................................................................................................ 127
Table A 56. Childhood bronchiolitis hospitalisation rate ratios to non-MPA by ethnic group 2000 - 2017. .................................................................................. 127
Table A 57. 2017 childhood bronchiolitis hospitalisation rates by NZDep2013 quintile. ................................................................................................................ 128
Table A 58. Childhood bronchiolitis hospitalisation rates by NZDep2013 quintile 2000 - 2017. ..................................................................................................... 128
Table A 59. Childhood bronchiolitis hospitalisation rates relative to NZDep 1-2 by NZDep2013 quintile 2000 - 2017. ........................................................... 129
Table A 60. 2017 childhood bronchiolitis hospitalisation rates by ethnic group and NZDep quintile. ....................................................................................... 129
Table A 61. 2017 childhood bronchiolitis hospitalisation rates by DHB. ................... 130
Table A 62. Childhood pneumonia hospitalisations, rates and age-adjusted rates 2000-2017. .............................................................................................. 131
Table A 63. 2017 childhood pneumonia hospitalisation rates and rate ratios by age group and sex .......................................................................................... 131
Table A 64. 2017 childhood pneumonia hospitalisation age group rate ratios by sex ................................................................................................................ 131
Table A 65. 2017 childhood pneumonia hospitalisation rates and rate ratios by ethnic group. ...................................................................................................... 131
Table A 66. Childhood pneumonia hospitalisation rates by ethnic group 2000 – 2017, age-adjusted. .......................................................................................... 132
Table A 67. Childhood pneumonia hospitalisation rate ratios to non-MPA by ethnic group 2000 – 2017, age-adjusted. .......................................................... 132
Table A 68. 2017 childhood pneumonia hospitalisation rates by ethnic group and age. ................................................................................................................ 133
Table A 69. 2017 childhood pneumonia hospitalisation rates by NZDep2013 quintile. ................................................................................................................ 133
Table A 70. Childhood pneumonia hospitalisation rates by NZDep2013 quintile 2000 – 2017, age-adjusted. ................................................................................ 133
Table A 71. Childhood pneumonia hospitalisation rates relative to NZDep 1-2 by NZDep2013 quintile 2000 – 2017, age-adjusted. .................................... 134

15
Table A 72. 2017 childhood pneumonia hospitalisation rates by ethnic group and NZDep2013 quintile. ............................................................................... 134
Table A 73. 2017 childhood pneumonia hospitalisation rates by DHB. ..................... 135
Table A 74. Childhood pneumonia mortality rates and age-adjusted rates 2000-2015. ................................................................................................................ 136
Table A 75. Childhood pneumonia mortality rates and rate ratios by age group and sex, 2006-2015. ....................................................................................... 136
Table A 76. Childhood pneumonia hospitalisation age group rate ratios by sex, 2006-2015. ....................................................................................................... 136
Table A 77. Childhood pneumonia mortality rates and rate ratios by ethnic group, 2006-2015. .............................................................................................. 136
Table A 78. Childhood pneumonia mortality rates NZDep2006 quintile, 2006-2015. ................................................................................................................ 137
Table A 79. Childhood pneumonia mortality rates by DHB, 2006-2015. ................... 137
Table A 80. COPD hospitalisations in adults aged 45+, rates and age-adjusted rates 2000-2017. .............................................................................................. 138
Table A 81. 2017 COPD in adults aged 45+ hospitalisation rates and rate ratios by age group and sex .......................................................................................... 138
Table A 82. 2017 COPD in adults aged 45+ hospitalisation age group rate ratios by sex ................................................................................................................ 138
Table A 83. 2017 COPD in adults aged 45+ hospitalisation rates and rate ratios by ethnic group. ........................................................................................... 139
Table A 84. COPD in adults aged 45+ hospitalisation rates by ethnic group 2000 – 2017, age-adjusted. ................................................................................ 139
Table A 85. COPD in adults aged 45+ hospitalisation rate ratios to non-MPA by ethnic group 2000 – 2017, age-adjusted. .......................................................... 139
Table A 86. 2017 COPD in adults aged 45+ hospitalisation rates by ethnic group and age. .......................................................................................................... 140
Table A 87. 2017 COPD in adults aged 45+ hospitalisation rates by NZDep2013 quintile. ................................................................................................... 140
Table A 88. COPD in adults 45+ hospitalisation rates by NZDep2013 quintile 2000 – 2017, age-adjusted. ................................................................................ 140

16
Table A 89. COPD in adults 45+ hospitalisation rates relative to NZDep 1-2 by NZDep2013 quintile 2000 – 2017, age-adjusted. .................................... 141
Table A 90. 2017 COPD in adults aged 45+ hospitalisation rates by ethnic group and NZDep2013 quintile. ............................................................................... 141
Table A 91. 2017 COPD in adults aged 45+ hospitalisation rates by DHB. ................. 142
Table A 92. COPD in adults 45+ mortality rates and age-adjusted rates 2000-2015. 142
Table A 93. COPD in adults aged 45+ mortality rates and rate ratios by age group and sex, 2015. ................................................................................................ 143
Table A 94. COPD in adults aged 45+ age group mortality rate ratios by sex, 2015. . 143
Table A 95. COPD in adults aged 45+ mortality rates and rate ratios by ethnic group, 2015. ....................................................................................................... 143
Table A 96. COPD in adults aged 45+ mortality rates by ethnic group and age, 2015. ................................................................................................................ 143
Table A 97. COPD in adults aged 45+ mortality rates by NZDep2006 quintile, 2015. 143
Table A 98. COPD in adults aged 45+ mortality rates by ethnic group and NZDep2013 quintile, 2015. ......................................................................................... 144
Table A 99. COPD in adults aged 45+ mortality rates by DHB, 2015. ........................ 144
Table A 100. Total respiratory hospitalisations, rates and age-adjusted rates 2000-2017. ....................................................................................................... 145
Table A 101. 2017 total respiratory hospitalisation rates and rate ratios by age group and sex .................................................................................................... 145
Table A 102. 2017 total respiratory hospitalisation age group rate ratios by sex ....... 145
Table A 103. 2017 total respiratory hospitalisation rates and rate ratios by ethnic group. ...................................................................................................... 146
Table A 104. Total respiratory hospitalisation rates and rate ratios by ethnic group, 2000 – 2017, age-adjusted. ..................................................................... 146
Table A 105. Total respiratory hospitalisation rate ratios to non-MPA by ethnic group 2000 – 2017, age-adjusted. ..................................................................... 146
Table A 106. 2017 total respiratory hospitalisation rates by ethnic group and age. ... 147
Table A 107. 2017 total respiratory hospitalisation rates by NZDep2013 quintile. ..... 147

17
Table A 108. Total respiratory hospitalisation rates by NZDep2013 quintile 2000 – 2017, age-adjusted. ................................................................................ 147
Table A 109. Total respiratory hospitalisation rates relative to NZDep 1-2 by NZDep2013 quintile 2000 – 2017, age-adjusted. .................................... 148
Table A 110. 2017 total respiratory hospitalisation rates by ethnic group and NZDep quintile. ................................................................................................... 148
Table A 111. 2017 total respiratory hospitalisation rates by DHB. .............................. 149
Table A 112. Total respiratory mortality rates and age-adjusted rates 2000-2015. .... 149
Table A 113. Total respiratory mortality rates and rate ratios by age group and sex, 2010-2015. .............................................................................................. 150
Table A 114. Total respiratory mortality rate ratios by age group and sex, 2010-2015. ................................................................................................................ 150
Table A 115. Total respiratory mortality rates and rate ratios by ethnic group, 2010-2015. ....................................................................................................... 150
Table A 116. Total respiratory mortality rates by ethnic group and age, 2010-2015 .. 150
Table A 117. Total respiratory mortality rates NZDep2013 quintile, 2010-2015. ........ 150
Table A 118. Total respiratory mortality rates by ethnic group and NZDep2013 quintile, 2010-2015. .............................................................................................. 151
Table A 119. Total respiratory mortality rates by DHB, 2010-2015. ............................ 151
Table A 120. Literature search publication numbers and filtering .............................. 154
Table A 121. Asthma prevalence in published studies ................................................ 154

18
3. EXECUTIVE SUMMARY
Overview
Chronic and serious respiratory illnesses continue to make a substantial contribution to New Zealand’s health burden. Respiratory diagnoses accounted for 1 in 10 of all 2017 overnight hospitalisations in New Zealand.
This report covers six respiratory disease indicators: asthma, bronchiectasis, childhood bronchiolitis and pneumonia, chronic obstructive pulmonary disease (COPD), and total respiratory disease. We report incidence, prevalence, risks and determinants, using the most recent available data from the New Zealand Health Survey, and pharmaceutical prescriptions, hospitalisations and mortality datasets, over the period 2000-2017.
Across the 2000 to 2017 study period, hospitalisation rates have increased for bronchiectasis, childhood bronchiolitis and total respiratory disease, remained static for COPD, and declined for asthma and childhood pneumonia. Mortality rates between 2000 and 2015 increased for bronchiectasis, remained generally static for childhood pneumonia, asthma and total respiratory disease, and declined for COPD.
While inequalities have generally reduced since the previous report, they continue to be unacceptably high.
All indicators showed inequalities in health by ethnic group. Pacific peoples and Māori shared the highest respiratory health burden. Pacific hospitalisation rates were consistently highest across all indicators except for COPD, where Māori rates were higher. Māori had highest mortality rates for total respiratory disease, asthma and COPD; bronchiectasis and childhood pneumonia mortality rates were highest in Pacific peoples. Asian peoples’ rates, however, were generally the same as or lower than the non-Māori, non-Pacific, non-Asian (non-MPA) comparison group.
Inequalities in respiratory hospitalisations by socio-economic deprivation were marked, with differences between the most and least deprived NZDep quintiles ranging from a rate ratio of 2.1 for childhood pneumonia, to 3.9 for childhood bronchiolitis and 5.1 for adult COPD. The effect of deprivation was near exponential: while differences across the first four quintiles were not always significant, all hospitalisation categories showed large and significant differences between the fourth and fifth quintiles.
There were also patterns in hospitalisation difference across age and gender, with all childhood rates higher in boys than girls, while most adult rates were higher in women than in men.
The South Island continued to have lower respiratory disease rates than the North Island, but compared to the previous report, the burden of respiratory disease has shifted from the north of the North Island to the centre: Lakes, Whanganui, Waikato and Tairawhiti DHBs had

19
the highest total respiratory hospitalisation rates, and generally also higher rates for other indicator conditions.
Total respiratory disease
The 2015 rate of respiratory hospitalisations was 1803.5 per 100,000 people. Total respiratory hospitalisations have been increasing at a rate of 17.4 hospitalisations per year since 2000. However, this increase appears as a two-tier effect – rates remained within the same range from 2000 to 2007, then increased sharply in 2008, and have only increased slightly since then. Conversely, mortality rates have not changed meaningfully over the same period, being 65.6 per 100,000 people per year in 2000, and 64.0 in 2017.
Respiratory hospitalisation rates were highest for children aged under 15 years and adults aged over 65 years. Mortality rates were highest in adults aged over 65.
Respiratory hospitalisation rates were highest for Pacific peoples, with rates 2.5 times higher than for non-MPA. Māori rates were also significantly higher (rate ratio 2.0), while rates for Asian peoples were significantly higher (rate ratio 0.7). These trends were repeated across all age groups. For mortality, however, Māori rates were highest.
There was a significant deprivation gradient in total respiratory hospitalisations and mortality. Hospitalisation rates in the most deprived NZDep quintile were 2.3 times higher than rates in the least deprived quintile, while mortality rates were 1.8 times higher. The deprivation gradient was present for both hospitalisations and deaths in all ethnic groups, but Pacific peoples’ hospitalisation rates stood out further: Pacific peoples living in the wealthiest quintile areas had respiratory hospitalisation rates higher than those of non-MPA people in the most deprived quintile areas.
Asthma
Medicated asthma prevalence showed no significant change during the study period in adults or children. The hospitalisation rate for asthma peaked in 2009 at 218 per 100,000 people, and overall declined slightly over the study period. Asthma mortality rates, however, which appeared to be declining in the previous report, have returned to previous higher levels, peaking at 2.0 deaths per 100,000 in 2014.
Risks for asthma were similar across measures. Prevalence, hospitalisation and mortality were all significantly higher for both Māori and Pacific peoples, and in more socioeconomically deprived neighbourhoods. In children, all asthma measures were higher for boys, whereas for adults, asthma measured higher for women.
Socio-economic differences in asthma hospitalisation saw rates 2.7 times higher in the most deprived NZDep2013 quintile 9-10, and 1.9 times higher in NZDep2013 quintile 7-8, compared to the wealthiest NZDep2013 quintile. These differences were similar to mortality

20
differences. Asthma prevalence showed a deprivation gradient for female children, but not for female adults, and not for males.
2017 asthma hospitalisation rates were lower than the national average in all South Island DHBs except West Coast, and higher than the national average in all North Island DHBs except Auckland, Waitemata, MidCentral and Capital and Coast; 2015 mortality rates were highest in the Tairawhiti and Lakes DHBs.
Bronchiectasis
Although bronchiectasis is the rarest of the indicator conditions, the bronchiectasis hospitalisation rate increased by a significant 45% over the study period. Mortality rates increased by 88%.
Being of Māori or Pacific ethnicity was a significant risk factor for bronchiectasis hospitalisation and death, and Asian mortality rates were also higher than non-MPA. The greatest disparity in hospitalisations by age and ethnicity was for Pacific peoples aged over 65 years, whose bronchiectasis hospitalisation rates of 490.5 per 100,000 were 5.94 times higher than for non-MPA. Overall, Pacific peoples were 6.2 times more likely to be hospitalised for bronchiectasis than non-MPA, and Māori were 3.8 times more likely to be hospitalised, while Asian peoples rates were not significantly different. Mortality differences were similar for Māori and Pacific, but 1.7 times the non-MPA rate for Asian peoples.
Bronchiectasis also showed strong socio-economic disparity, with hospitalisation rates 2.5 times higher in the most deprived compared to the least deprived neighbourhoods, and mortality rates 1.8 times higher. The hospitalisation rate increase for the most deprived quintile was steepest for Māori.
Childhood bronchiolitis
Childhood bronchiolitis hospitalisation rates have increased by nearly a half since 2000. Pacific rates were 3.5 times higher than non-MPA, and Māori rates 3.2 times higher. The rate for the most deprived quintile was 3.9 times the rate of the least deprived quintile. The combined effect of ethnicity and deprivation meant that Māori and Pacific children in the most deprived quintile were at least five times as likely to be hospitalised as non-MPA children in the wealthiest quintile.
There were few deaths from childhood bronchiolitis, but all 7 deaths between 2006 and 2015 were in NZDep deciles 7-10; and all were Māori and/or Pacific children.
Childhood pneumonia
Overall, the outstanding differences in childhood pneumonia rates were for Pacific peoples, and for those in the most deprived quintile. Pacific children’s pneumonia rates were 2.4 times higher than the non-MPA rate for hospitalisation, and 5.6 times higher for mortality; Māori children’s rates were 1.6 and 4.1 times higher respectively. Hospitalisation rates for

21
Asian children were 1.1 times higher. These differences were greater in children aged under 5 years.
Childhood pneumonia rates were highest in the most deprived areas, with hospitalisation rates 2.1 times higher in the most deprived NZDep quintile than in the least deprived. Over half of deaths were in the most deprived quintile, making the NZDep9-10 mortality rate 8.1 times higher than that of NZDep1-2.
COPD
COPD hospitalisation and mortality rates were lower for men than women in the 45 to 64 year age group, but higher for men in the 65+ age group. COPD rates were highest for Māori, at 3.5 times the non-MPA rate for hospitalisation and 2.2 times the rate for mortality. Pacific peoples’ hospitalisation rates were 2.7 times higher, and mortality was not significantly different from non-MPA. Both measures were lowest for Asian peoples.
There was a strong deprivation gradient, with COPD hospitalisation rates 5.1 times higher in the most deprived NZDep quintile than in the least deprived, and mortality rates 2.3 times higher. The gradient was apparent for all ethnic groups.
As in the previous report, the highest DHB rates were for Whanganui, and West Coast.
Costs
We estimated the minimum cost burden of respiratory disease to New Zealand to be $7.05b in 2015. Of this, $6.59b were indirect costs from mortality and disability affected life years, and the remaining $465.0m were direct costs from hospitalisations, prescriptions and doctors’ visits. We have costed asthma separately, at $1.018b, with $198.3m in direct costs, and $828.2 in indirect costs from work days lost, disability affected life years, and mortality.
While total costs have increased since the last report, the increase comes primarily from rising hospitalisation rates, an increase in the value of a life year, and improvements to the costing method.

22
4. INTRODUCTION
4.1. BACKGROUND
This report was commissioned by the New Zealand Asthma Foundation. The Foundation aims to assist people with asthma and respiratory diseases through contributing to the development of public policy, education and funded research, through advocacy on behalf of all people with respiratory conditions and through raising awareness of respiratory conditions in New Zealand. It aims to reduce hospital admissions caused by asthma and other respiratory conditions by 25%, by 2025.
Respiratory illnesses contribute a large part of New Zealand’s total disease burden, collectively accounting for 6.3% of total health loss, almost all from chronic obstructive pulmonary disease (COPD, 3.7%) and asthma (1.6%)1.
The Asthma & Respiratory Foundation has previously published five reports relevant to the burden of respiratory disease in New Zealand:
- ‘Trying to Catch Our Breath – The Burden of Preventable Breathing Diseases in Children and Young People’2 (2006) covers asthma, bronchiectasis, pneumonia, pertussis, general smoking-related respiratory illness, bronchiolitis, tuberculosis and obstructive sleep apnoea. Rates reported covered different periods, with the most recent figures given depending on condition, between 1999 and 2004.
- The Burden of Asthma in New Zealand3 (2002) reports mortality to 1994, hospitalisation rates to 1999, and pharmaceutical costs to 2000. Economic costs include data for a similar period (i.e. to 2000).
- Chronic Obstructive Pulmonary Disease and Lung Cancer in New Zealand4 (2003) includes data to 2002.
- The Impact of Respiratory Disease in New Zealand: 2014 update5 (2015). - The Impact of Respiratory Disease in New Zealand: 2016 update6 (2016), which this
report updates, and refers to as “the previous report”.
4.2. AIMS
This report updates analysis from earlier reports in 2002, 2003, 2006, 2014 and 2016; and measures indicator respiratory conditions identified in the previous report as markers for changes in levels of respiratory disease in New Zealand.
This report aims to provide key indicator data which can be used as an advocacy tool to assist with raising the profile of respiratory health regionally and nationally; and to guide the Foundation in best use of resources in the future
The Foundation identified six conditions to include in this updated Impact Report. These are:

23
• Asthma (including asthma and wheeze in preschool children) • Bronchiectasis • Childhood bronchiolitis (<5 years) • Childhood pneumonia (<5 years, 5-14 years) • Chronic Obstructive Pulmonary Disease (COPD) in older adults (45-64, 65+) • Total serious respiratory disease (i.e. hospitalisations and death)
Other conditions included in previous reports but not in this report include tuberculosis, total pneumonia, pertussis, and lung cancer. Lung cancer makes a large contribution to New Zealand’s health burden, but is well-monitored elsewhere. Tuberculosis, total pneumonia and pertussis are included in total respiratory disease but do not individually have sufficient health impact to warrant inclusion in the 2018 report.
The University of Otago originally recommended including obstructive sleep apnoea as an indicator condition, as the Ministry of Health Burden of Disease report includes the condition as a contributor to overall health loss, and also a risk factor for other life-limiting conditions. However, due to the absence of regularly collected data on the condition, it was not a viable indicator of respiratory health. The literature search found two new New Zealand studies which included sub-population sleep apnoea prevalence rates, but neither were representative of the general population: Swinbourne et al estimated between 8% (apnoeic episodes) and 38% (snorers) of highly trained team sport athletes could be suffering from OSA7; and Humphreys et al found 20% (n=9) of their study’s 45 duodenal switch patients also suffered from OSA before surgery. We continue to recommend further research on the New Zealand prevalence of OSA.

24
5. INDICATOR SELECTION AND METHODS
5.1. CONDITIONS
All respiratory conditions for monitoring were nominated by the Foundation. The conditions selected had been previously identified as making the largest contribution to New Zealand’s respiratory burden8. Justification for age groups measured and disease categorisation are included in the 2014 report.
ICD-10 codes used to identify indicator conditions in the hospitalisation and mortality data are included in Appendix 2.
5.2. DATA SOURCES
The primary data sources for this report are administrative datasets, specifically the national pharmaceutical, hospitalisation and mortality data collections. Additional data on asthma was included from the Ministry of Health’s published results of the New Zealand Health Survey 2016-2017.
Table 1. Data sources for indicator conditions and risk factors.
Indicator condition Indicator dataset Measureable risk factors/determinants
Asthma NZ Health Survey Age Sex Ethnicity DHB Region NZDep
All measured indicators NMDS (Hospitalisations)
All measured indicators Mortality Collection
Total respiratory illness Pharmaceutical Collection
5.3. BURDEN
New Zealand’s respiratory burden is measured here in three ways: the incidence of illness, the prevalence of illness, and the costs of illness. Incidence and prevalence time trends are reported from 2000, when the ICD-10 clinical coding system was introduced.
Rates have been age-standardised to Statistics New Zealand population estimates for 2017 (and for 2000 – 2017 in times series data). Age standardisation adjusts disease rates to the level they would be if the age distribution of the population was the same either across time, or across ethnic or socio-economic groups. Age standardisation ensures we are comparing like with like: using non-standardised rates can make it look like disease rates are different, when in fact the difference lies in what proportion of the population are in the age-group who have the highest or lowest rates of the disease.

25
5.3.1. INCIDENCE
Incidence is measured as the number of events per 100,000 of people per year. We have reported the incidence of hospital events and deaths for all indicator conditions. We have also reported the incidence of new cases of severe (i.e. hospitalised) bronchiectasis and COPD.
5.3.2. PREVALENCE
Prevalence measures the percentage of people in the population who have a given condition. Incidence and prevalence differ because incidence measures events, whereas prevalence can also measure chronic conditions. We have measured the prevalence of medicated asthma, bronchiectasis, and COPD.
The prevalence of medicated asthma is reported using Ministry of Health published data from the New Zealand Health Surveys in 2006/07, 2011/12, 2012/13, 2013/14, 2014/15, and 2016/17. The survey questions were “Have you ever been told by a doctor that you have [your child has] asthma?”, combined with any treatment answer to “What treatments do you now have [does your child now have] for asthma?”
Minima of the current prevalence of childhood bronchiectasis and total COPD were estimated as a cumulative count of individuals alive in 2017 who had been hospitalised with the condition since 1988.
5.3.3. COSTS
We report costs for 2015, as this is the most recent year for which mortality data was available. It is important to note that subsequent government funding changes for child GP visits will have reduced the private funding proportion and increased the public funding proportion. The next report will also need to incorporate broader changes to GP funding allocations.
The cost of asthma to the New Zealand economy was estimated at $349m in 2000,9 at $800m in the 2014 report, and at $858m in the 2016 report.
We have repeated the 2014 method, which used more restricted data than the 2000 report, to measure the private and public costs of asthma and total serious respiratory disease; but extended the range of pharmaceuticals included in respiratory costs to include spacers.
Private costs have been estimated using pharmaceutical data. In addition to the “patient contribution” recorded in the data, we assume a corresponding doctor’s visit for each non-repeat prescription dispensing date. The New Zealand Health Survey 2011/12 found the average cost of a GP visit for a child to be $21 for the 43% of parents who were charged; the other 57% of visits were free. This data is not available in subsequent New Zealand Health

26
Survey reports, however the Child Poverty Action Group (CPAG) found in 2013 that the average cost for a child aged 6 to 17 to visit their GP was $24.07 in working hours; $44.16 after hours; and 93% and 94% of practices respectively charged for working hours and after-hours visits.10 More importantly, however, from 1 July 2015 the Ministry of Health extended a voluntary free visit scheme to the 6 to 12 year age group.
For 2015 we have therefore assumed no GP visit cost for children under 6 years; $24.07 per visit for children aged 6 to 12 years, discounted by 50% to cover the free visit scheme for the second half of the year; and an average GP visit cost of $22.39 (93% x $24.07) for children aged 13 to 15. For adults, in the absence of data on visit cost changes, we assume an average cost of $32, as in the previous report.
Public costs have been estimated using pharmaceutical, hospitalisation and mortality data, and additional costs extrapolated from the Statistics New Zealand data on the working population and total population estimates, the New Zealand Health Survey, and a report on asthma rates in primary care11. Mortality costs are estimated from years of life lost based on average life expectancy at age of death12, multiplied by a value per life year of $176,000. The life year value is estimated from the 2015 NZTA value of a statistical life ($4.06m) and a 3% discount rate13.
Hospitalisation costs are summed from all 2015 publicly-funded hospitalisation discharges, using the appropriate 2014/15 or 2015/16 Ministry of Health cost weight multiplier.
The method for calculating the total cost of pharmaceuticals is described in Telfar Barnard et al 201113. The total pharmaceutical cost is the sum across all included prescriptions of:
Dispensing fee + retail subsidy - estimated 2015 Pharmac rebate
The estimated Pharmac rebate for 201514 was $196.27m total rebates/$987.62m gross expenditure = 19.87%.
The public cost of a doctor’s visit was based on the 2016 Ministry of Health standard GP subsidy of $31.11 for children aged under 6 years, $17.78 for children who were, or were children of, community services card (CSC) holders, $13.33 for CSC adults and non-CSC children 6-17.
As we did not have data on whether patients were CSC holders, we used 2008 figures on numbers of CSCs by category to estimate proportions of people aged 18 to 64, and 65+, with CSCs. We then applied these figures to proportions of people in NZDep deciles, and assigned CSC subsidies to all people aged 6 to 64 in NZDep deciles 8 to 10, and to all people aged 65+ in deciles 6 to 10.
Estimating adult and child prescription and doctors’ visit costs
In 1996/97, there were 126,800 GP medical subsidy claims for treating children aged under 16 with asthma, and 106,300 for adults9, giving a ratio of 1.19.

27
The 2013/14 ratio of child to adult asthma prevalence was 16.6/10.8=1.54. However, this ratio was unusually high. We have therefore used the three year (2014 – 2016) average of 15.3/11.3=1.35.
Children aged under 15 years were issued with 325,097 initial (rather than follow-on/repeat) respiratory prescriptions in 2015, giving a rate of 35.6 prescriptions per 100 people. Applying this rate, reduced by the ratio of child to adult asthma prevalence gives a figure of 968,400 first prescriptions for adults, or 60.2% of adult initial respiratory prescriptions. Using the same methodology, but a less comprehensive set of respiratory prescriptions, previous reports found figures of 50.2% for 2011, and 44.1% for 2013.
The WaiMedCa study in 1994 found that 60.9% of respiratory prescriptions were for asthma.15
We have used the lower 44.1% figure as representing a more conservative estimate of adult asthma prescription rates. It is also closer to the 42.4% level found if the WaiMedCa 60.9% rate is reduced by the change from the 1996/7 New Zealand Health Survey 15.5% estimate of asthma prevalence 16 to the 2015/16 level of 10.8%, so potentially provides a better estimate than the 50.2% used in 2011 or the 60.2% found for 2015.
Estimating the cost of days off school
The Home Heating study found children with asthma had 2.2 additional days off school per winter, compared to children without asthma17. Analysis of hospitalisations for the period 2000 to 2007 found the winter, term-time hospitalisation rate for asthma in children under 15 years to be 98% of the rate for non-winter term-time hospitalisations. If the same ratio applies to days off school, 2.2 additional days off school in winter would mean 2.2 additional days off school in non-winter, and a total of 4.4 additional days off school per year. This is a higher estimate than the 1.6 additional days derived from 1993 NZHS figures.18
We have costed each day off school conservatively, as 8 hours at half the 2015 adult minimum wage of $14.75/hr.
Cost of days off school=[Asthma prevalence in under 15 year olds] * [Statistics NZ estimated 2015 population under 15 years] * [additional days off school] *[0.5*adult minimum wage]*8 hours
=0.166 * 913,061 * 4.4 * 0.5 * $14.75 * 8* = $39,347,086
* The 2014 report erroneously left out the 8 hour multiplier, thus under-reporting the cost of days of school by a factor of 8.

28
Estimating the cost of days off work
We used the same method to calculate the cost of days off work as used by Nick Wilson in 2000.6 As the prevalence of adult asthma has decreased from the 15.2% used in that calculation, to 10.8% in the current adult population, we updated the figures by the increase in the average wage, and the increase in the working age population, then reduced by the change in adult asthma prevalence.
Estimating the cost of Emergency Department and Outpatient visits
We estimated the cost of Emergency Department (ED) and Outpatient (OP) visits by extrapolating from data in the 2014 primary care cohort to the total population. Asthma prevalence in that cohort was 4.8%, and asthma patients averaged 2.17 ED or OP visits each in the study year. The cost of an ED or OP visit was estimated at $254.85. Working from Statistics New Zealand’s 2015 resident population estimate of 4,595,703, we estimated the total cost of ED and OP visits to be
Asthma prevalence * resident population * (ED + OP visits per person) * ED or OP visit cost
= 4.8% * 4,595,703 * 2.17 * $254.85
= $121,993,745†
Estimating the cost of Years Lost to Disability (YLDs)
In 2001, Holt and Beasley estimated the cost of years lost to disability for asthma to be $340million3. This figure was based on an estimated 17,000 YLDs at 20% of the $100,000 value of a life-year lost. The Ministry of Health estimated YLDs from asthma in 2006 to be 13,362. We do not have a more recent figure than 2006, but as asthma prevalence has changed little since then it represents a better estimate than the 2001 figure. Increasing the 13,362 by the 14.1% increase in the population from 4,027,927 in the 2006 census to the 2015 resident population estimate of 4,595,703, takes the 2015 estimate of YLDs to 15.245. With the 2015 value of a life year at $176,000, and applying the same arbitrary 20% value as Holt and Beasley, the cost of YLDs is estimated at $536,641,796.
The estimate of YLDs from total respiratory disease in 2006 was 34,581. Allowing for the population increase to 2015 would take this estimate to 39,456. Respiratory hospitalisation rates have increased since 2006, so this should be a conservative estimate. At 20% of $176,000 per YLD, the YLD cost of total respiratory disease is estimated at $1,388,834,751.
† The $53,247,667 figure in the previous report did not include a multiplier for the number of visits per patient.

29
6. NEW ZEALAND’S RESPIRATORY DISEASE BURDEN
6.1. LITERATURE
As population prevalence data was available only for asthma and not for other indicator conditions, we conducted a focussed literature review seeking evidence on New Zealand rates and prevalence of the indicator conditions.
Our criteria for inclusion in the review were that the literature report original research measuring the rate or prevalence of the indicator condition (rather than including the rate or prevalence reported from another study) in the age-group(s) included in this report; that the research was conducted in New Zealand after 31 December 1999, and published after 1 January 2014 to exclude papers included in the 2014 report.
We searched Medline using the search terms “New Zealand” AND (“rate” OR “prevalence”) combined with each of the indicator conditions: “asthma OR wheeze”; “bronchiectasis”; “bronchiolitis”; “pneumonia”; “COPD OR ‘chronic obstructive pulmonary disease’”; “sleep apnoea”; “respiratory AND (illness OR disease OR condition OR hospitalisations OR mortality OR death)”; with each search limited to publications from 2000 onwards, and limited to humans. There was no need to limit the search by language as all results were published in English.
The search turned up eight new relevant publications: one on bronchiolitis; two on sleep apnoea; and five on general respiratory disease. These publications are discussed in the relevant sections.
6.2. ASTHMA
6.2.1. ASTHMA PREVALENCE
Published studies of New Zealand asthma prevalence were of limited use for determining long-term trends in asthma rates, as each study measured asthma in different ways and/or across different age groups. Published rates are summarised in Table A 121. There were no new studies reporting asthma prevalence since the previous report.
Prevalence for medicated asthma was sourced from the most recently published New Zealand Health Survey data. For current asthma prevalence, data covers the 2016-17 period. The International Study of Asthma and Allergies in Children (ISAAC) last measured New Zealand child asthma rates in 2001-03.19 Their measures are different to the definition used by the New Zealand Health Survey, so even their most similarly defined measure of prevalence rates, “current wheeze”, which was 22.4% in 6-7 year olds, and 27.6% in 13-14 year olds15, cannot be directly compared with New Zealand Health Survey prevalence figures. The Global Asthma Network is currently preparing to undertake Phase I surveillance which will include New Zealand and global measures of asthma prevalence.20

30
It should also be noted that diagnostic practice for childhood asthma has changed over the study period. Current guidelines mean children aged under 5 who present with wheeze are now less likely to be diagnosed with asthma than in the past21, and in particular wheeze in children aged under 3 is now seldom described as asthma.
NZ Health Survey measures of asthma prevalence by age group and sex, and by ethnicity, NZDep2013 quintile and DHB, for children and adults, are shown in Figures 2 to 7.
Trends over time 2006/7 – 2016/17
Medicated asthma prevalence declined significantly between 2006/7 and 2016/17 for girls aged under 15 years, from 14.2% of all girls to 11.3%. The change was particularly marked for Māori girls, among whom prevalence dropped from 20.6% to 14.9%. There were no significant changes in prevalence for adults (Table 2 and Table 3).
Table 2. Total child medicated asthma prevalence 2006 – 2017, age-standardised
Year Total Boys Girls
% 95% CI % 95% CI % 95% CI
2006-07 14.9 (13.6 – 16.3) 15.5 (13.6 – 17.7) 14.2 (12.5 – 16.1)
2011/12 14.0 (12.4 - 15.6) 16.1 (13.9 - 18.5) 11.7 (9.5 - 14.4)
2012/13 14.0 (12.6 – 15.6) 16.1 (14.2 – 18.3) 11.9 (10.2 – 13.9)
2013/14 15.2 (13.8 - 16.6) 17.1 (15.0 - 19.4) 13.1 (11.3 - 15.2)
2014/15 15.1 (13.4 - 16.9) 16.5 (14.2 - 19.1) 13.6 (11.5 - 16.0)
2015/16 16.6 (15.3 - 18.1) 18.5 (16.6 - 20.6) 14.7 (13.0 – 16.6)
2016/17 14.3 (12.8 – 16.0) 17.2 (15.3 – 19.3) 11.3 (9.4 – 13.5)
Table 3. Total adult medicated asthma prevalence 2006 – 2015, age-standardised
Year Total Men Women
% 95% CI % 95% CI % 95% CI
2002-03* 10.6 16.4
2006/07 11.3 (10.5 – 12.0) 9.4 (8.4 – 10.4) 13.0 (11.9 – 14.2)
2011/12 11.0 (10.2 – 11.8) 8.6 (7.7 – 9.7) 13.2 (12.2 – 14.3)
2012/13 10.9 (10.2 – 11.6) 8.9 (7.9 – 9.9) 12.8 (11.9 – 13.8)
2013/14 10.8 (10.0 - 11.6) 8.3 (7.4 - 9.3) 13.1 (12.0 - 14.3)
2014/15 11.0 (10.3 - 11.7) 9.0 (8.0 - 10.1) 12.8 (12.0 - 13.7)
2015/16 10.8 (10.3 - 11.4) 8.4 (7.5 - 9.3) 13.1 (12.3 - 14.0)
2016/17 12.0 (11.2 – 12.8) 9.9 (8.8 – 11.1) 14.0 (13.0 – 15.0)
*N.B 2002-03 rates are only for adults aged 15-44.

31
Risks and determinants 2016/17
Boys had higher medicated asthma prevalence than girls (rate ratio 1.53); but men had lower prevalence than women (rate ratio 0.71).
Medicated asthma prevalence was significantly higher for Māori than for the rest of the population in both children (rate ratio 1.36) and adults (rate ratio 1.48). Prevalence was also higher for the most deprived NZDep2013 quintile than for the least deprived for children (rate ratio 1.56), but was not significantly different for adults.
By region, there was no significant difference in children’s medicated asthma rates across New Zealand except in Auckland, where the rate was 10.4 compared to the national average of 14.3. Adult rates were higher in Whanganui, MidCentral, Hutt Valley and South Canterbury DHBs, and lower in Waitemata, and Counties Manukau (Table A 5). Figure 1. Age-standardised medicated asthma rates by age group and sex, 2016/17.
(See Table A 1 for data)
0
5
10
15
20
25
30
Total Male Female% o
f pop
ulat
ion
with
med
icat
ed a
sthm
a
Population
2-4 years 5-9 years 10-14 years 15-24 years 25-34 years35-44 years 45-54 years 55-64 years 65-74 years 75+ years

32
Figure 2. Medicated asthma prevalence by ethnic group 2016/17, children and adults
(See Table A 2 for data) Figure 3. Child medicated asthma prevalence 2016/17 by NZDep2013, unadjusted
(See Table A 3 for data)
17.8
15.6
9.8
14.816.4
11.4
6.5
12.7
0
5
10
15
20
25
Māori Pacific Asian European/Other
% o
f pop
ulat
ion
with
med
icat
ed a
sthm
a
Ethnic group
Children Adults
11.7
17.8
5.4
13.2
16.3
9.4
13.7
16.4
10.9
15.4
17.8
13.2
17 17.616.4
0
5
10
15
20
25
Total Male Female
% o
f pop
ulat
ion
with
med
icat
ed a
sthm
a
Population
Quintile 1 least deprived Quintile 2 Quintile 3 Quintile 4 Quintile 5 most deprived

33
Figure 4. Adult medicated asthma prevalence 2016/17 by NZDep2013, unadjusted
(See Table A 4 for data)
11.7
9.8
13.5
10.9
8.6
13.312.2
10.6
13.7
12.1
9.3
14.9
13.1
11.3
14.6
0
2
4
6
8
10
12
14
16
18
20
Total Male Female
% o
f pop
ulat
ion
with
med
icat
ed a
sthm
a
Population
Quintile 1 least deprived Quintile 2 Quintile 3 Quintile 4 Quintile 5 most deprived

34
Figure 5. Children’s (aged 2-14) medicated asthma prevalence by DHB, 2016/17, unadjusted.
(See Table A 5 for data)
0 5 10 15 20 25 30 35
Southern
South Canterbury
Canterbury
West Coast
Nelson Marlborough
Wairarapa
Hutt Valley
Capital & Coast
MidCentral
Whanganui
Hawke's Bay
Taranaki
Lakes
Tairawhiti
Bay of Plenty
Waikato
Counties Manukau
Auckland
Waitemata
Northland
New Zealand
Prevalence (%)
DHB

35
Figure 6. Adult medicated asthma prevalence by region 2016/17, age-standardised
(See Table A 5 for data)
6.2.2. ASTHMA HOSPITALISATIONS
Trends over time 2000 - 2017
Asthma hospitalisation rates show a small but statistically significant decline over the eighteen years 2000-2017. For the last five years, rates have continued below 170 hospitalisations per 100,000 people per year, reaching their lowest point of 157 in 2016. The average from 2000 to 2012 was 198, and never dipped below 180 (Figure 7).
Inequalities (Figure 10) between Pacific and non-Māori/Pacific/Asian (non-MPA) hospitalisation rates appear to have plateaued, while inequalities between Māori and non-MPA continue to rise. Rates for Asian peoples were higher than for non-MPA between 2005 and 2015, but have dropped back below non-MPA rates over the last two years.
Socio-economic inequalities in asthma hospitalisation, which rose between 2000 and 2014, may now be reducing (Figure 13).
0 5 10 15 20 25 30
SouthernSouth Canterbury
CanterburyWest Coast
Nelson Marlborough
WairarapaHutt Valley
Capital & CoastMidCentralWhanganui
Hawke's BayTaranaki
LakesTairawhiti
Bay of PlentyWaikato
Counties Manukau
AucklandWaitemata
NorthlandNew Zealand
Prevalence (%)
DHB

36
Figure 7. Asthma hospitalisations per 100,000 people per year, 2000-2017.
(See Table A 6 for data)
Risks and determinants 2017
Most risks and determinants in prevalence were magnified in hospitalisation. Asthma hospitalisation rates in children under 15 years were nearly 3 times the rates for adults aged 30-64 (rate ratio 2.72). Girls had substantially lower rates than boys (rate ratio 0.78), but women’s asthma hospitalisation rates were nearly twice or more those of men (Figure 8, Table A 7).
Differences in asthma hospitalisation rates by ethnic group lay in the same direction as prevalence. Māori rates were nearly 3 times higher than non-MPA (rate ratio 2.84), Pacific rates were higher again (rate ratio 3.21), and Asian rates were lower than non-MPA (rate ratio 0.86)(Figure 9).
There was a clear socio-economic gradient in asthma hospitalisation (Figure 12), with the most socioeconomically deprived areas having a hospitalisation rate nearly 3 times that of the wealthiest areas (rate ratio 2.70). Socioeconomic inequalities have pulled back a little over the last two years. This reduction is partly because asthma hospitalisation rates in NZDep 9-10 have decreased, but also because rates in NZDep 1-2 have increased,
Hospitalisation also showed greater rate variation by DHB than was apparent in prevalence data. 2017 asthma hospitalisation rates were lowest in South Canterbury DHB, and also significantly lower than the national average in Waitemata, Capital and Coast, Nelson
0
50
100
150
200
250
20002001
20022003
20042005
20062007
20082009
20102011
20122013
20142015
20162017Ho
spita
lisat
ions
per
100
,000
peo
ple
per y
ear
Year
95% CI Hospitalisation rate

37
Marlborough, Canterbury and Southern DHBs. Rates were highest in Tairawhiti, and also significantly higher than the national average in Waikato, Lakes, Bay of Plenty, Hawkes Bay, Taranaki, Whanganui and Hutt DHBs (Table A 17).
Figure 8. Asthma hospitalisations per 100,000 people by age group and sex, 2017.
(See Table A 7 and Table A 8 for data)
365.3
285.9326.6
69.3
190.4
128.2
80.2
157.5120.2
68.0
142.9108.0
0
50
100
150
200
250
300
350
400
450
Male rate Female rate Total rate
Hosp
italis
atio
ns p
er 1
00,0
00 p
eopl
e
Population
<15 years 15-29 years 30-64 years 65+ years

38
Figure 9. Asthma hospitalisations per 100,000 people by ethnic group, 2017, age-adjusted.
(See Table A 9 for data) Figure 10. Asthma hospitalisations rates relative to non-MPA by ethnic group, 2000 – 2017, age-adjusted.
(See Table A 10 and Table A 11 for data)
329.0
373.0
99.9116.0
0
50
100
150
200
250
300
350
400
450
Māori Pacific Asian non-MPA(excludes 'not-stated')
Hosp
italis
atio
ns p
er 1
00,0
00 p
eopl
e
Ethnic group
0
0.5
1
1.5
2
2.5
3
3.5
4
2000 2001 2002 2003 2004 2005 2006 2007 2008 2009 2010 2011 2012 2013 2014 2015 2016 2017
Asth
ma
hosp
italis
atio
n ra
te ra
tio to
non
-MPA
Year
Non-MPA (Reference) Māori Pacific Asian

39
Figure 11. Asthma hospitalisations per 100,000 people by ethnic group and age group, 2017.
(See Table A 12 for data) Figure 12. Asthma hospitalisations per 100,000 people by NZDep2013 quintile, 2017, age-adjusted.
(See Table A 13 for data)
487.6 481.4
229.1 236.7275.8
232.0
47.791.7
310.3 319.2
55.282.4
239.0
550.5
131.381.5
0
100
200
300
400
500
600
700
Māori Pacific Asian non-MPA(includes 'not-stated')
Hosp
italis
atio
ns p
er 1
00,0
00 p
eopl
e
Ethnic group
Under 15 15-29 30-64 65+
97.6111.0
133.5
186.8
263.6
0
50
100
150
200
250
300
NZDep 1-2 3-4 5-6 7-8 9-10
Hosp
italis
atio
ns p
er 1
00,0
00 p
eopl
e
NZDep2013 quintile

40
Figure 13. Asthma hospitalisation rates relative to NZDep 1-2 by NZDep2013 quintile, 2000 - 2017, age-adjusted.
(See Table A 14 and Table A 15 for data)
Figure 14. Asthma hospitalisations per 100,000 people by ethnic group and NZDep2013, 2017, age-adjusted.
(See Table A 16 for data)
0.6
1.0
1.4
1.8
2.2
2.6
3.0
3.4
2000 2001 2002 2003 2004 2005 2006 2007 2008 2009 2010 2011 2012 2013 2014 2015 2016 2017
Asth
ma
hosp
italis
atio
n ra
te re
lativ
e to
NZD
ep 1
-2
Year
NZDep 1-2 (Reference) NZDep 3-4 NZDep 5-6 NZDep 7-8 NZDep 9-10
154.0
274.4
61.289.6
228.0262.6
74.8 89.2
276.0
382.2
91.2 105.8
366.1
444.1
114.2135.3
397.4 382.3
140.6
208.4
0
100
200
300
400
500
600
Māori Pacific Asian non-MPA(excludes not stated)
Hosp
italis
atio
ns p
er 1
00,0
00 p
eopl
e
Ethnic group
NZDep 1-2 NZDep 3-4 NZDep 5-6 NZDep 7-8 NZDep 9-10

41
Figure 15. Asthma hospitalisations per 100,000 people by DHB, 2017.
(see Table A 17 for data)
130.672.1120.3145.991.5186.7229.9138.9251.3143.6213.2190.6235.4189.2251.5216.4168.1169.3145.3161.4
0 100 200 300 400
SouthernSth Canterbury
CanterburyWest Coast
Nelson MarlboroughWairarapa
HuttCapital and Coast
WhanganuiMidcentral
TaranakiHawkes Bay
TairawhitiBay of Plenty
LakesWaikato
Counties ManakauAuckland
WaitemataNorthland
Hospitalisations per 100,000 people
DHB

42
6.2.3. ASTHMA MORTALITY
Trends over time 2000 - 2015
There were 87 deaths from asthma in 2015. The asthma mortality rate reached its lowest point in 2009/2010. Rates in the seven years 2007-2015 were significantly lower than in the previous seven years, but mortality rates in 2014 and 2015 were higher than in the previous seven years.
Figure 16. Asthma mortality rates 2000-2015, age-adjusted.
(See Table A 18 for data)
Risks and determinants 2010 - 2015
Asthma mortality rates were highest in people aged 65+, and significantly higher in women than in men for the 30 to 64 years and 65 and over age groups (Figure 17).
Asthma mortality rates were highest for Māori and Pacific peoples, with rates 4.26 and 3.20 times higher than rates for non-MPA (Figure 18 and Figure 19). Since the previous report, Pacific rates have dropped by 1.28 and Māori rates have dropped by 0.62, whereas Asian and non-MPA rates have risen by 0.14 and 0.09 respectively. As in the last report, Pacific rates are declining faster than Māori rate.
There were socio-economic differences in asthma mortality, with rates 2.16 times higher in the most deprived NZDep2013 quintile 9-10, and 1.78 times higher in NZDep2013 quintile 7-8, compared to the least deprived NZDep2013 quintile 1-2 (Figure 20). This inequity has
0.00
0.50
1.00
1.50
2.00
2.50
3.00
20002001
20022003
20042005
20062007
20082009
20102011
20122013
20142015De
aths
per
100
,000
peo
ple
per y
ear
Year
95% CI Mortality rate

43
improved since the previous report. There was insufficient data to measure socioeconomic gradients across ethnic groups (Figure 21).
For both ethnicity and socioeconomic status, inequalities are lower in this report than in previous reports (Table 4).
Asthma mortality rates were highest in the MidCentral DHB (Figure 22), followed by Northland and Lakes, and lowest in West Coast and South Canterbury DHBs.
Table 4. Ethnic and socioeconomic inequalities in asthma mortality over time.
Report year
Mortality time period
RR (95% CI) Māori vs non-
MPA Pacific vs non-
MPA NZDep 9-10 vs
1-2 2014 2006-2011 4.83 (4.23-5.51) 5.82 (4.81-7.04) 3.15 (2.65-3.73) 2016 2008-2013 5.86 (4.23-5.51) 5.59 (4.81-7.04) 3.74 (3.12-4.49) 2018 2010-2015 4.26 (3.77-4.82) 3.20 (2.63-3.89) 2.16 (1.84-2.53)
Figure 17. Asthma deaths per 100,000 people by age group and sex, 2010-2015.
(See Table A 19 and Table A 20 for data)
0.21 0.34 0.270.40 0.33 0.360.501.17 0.85
5.82
10.17
8.17
0
2
4
6
8
10
12
14
Male rate Female rate Total rate
Deat
hs p
er 1
00,0
00 p
eopl
e pe
r yea
r
Population
<15 years 15-29 years 30-64 years 65+ years

44
Figure 18. Asthma mortality per 100,000 people per year by ethnic group, 2010-2015.
(See Table A 21 for data)
Figure 19. Asthma deaths per 100,000 people per year, by ethnic group and age group, 2010-2015.
(See Table A 22 for data)
5.22
3.92
1.481.22
0
1
2
3
4
5
6
7
Māori Pacific Asian non-MPA
Deat
hs p
er 1
00,0
00 p
eopl
e pe
r yea
r
Ethnic group
0.57 0.55 0.16 0.071.06 0.74 0.22 0.13
3.281.30 0.48 0.46
20.1418.84
5.797.17
0
5
10
15
20
25
30
Māori Pacific Asian non-MPA
Deat
hs p
er 1
00,0
00 p
eopl
e pe
r yea
r
Ethnic group
Under 15 15-29 30-64 65+

45
Figure 20. Asthma deaths per 100,000 people by NZDep2013 quintile, 2010-2015, age-adjusted.
(See Table A 23 for data)
Figure 21. Asthma deaths per 100,000 people by ethnic group and NZDep2013, 2010-2015, age-adjusted.
(See Table A 24 for data) N.B. Confidence intervals are wide. There was insufficient data to measure socio-economic gradients across ethnic groups.
1.16
1.54
1.14
2.06
2.50
0.0
0.5
1.0
1.5
2.0
2.5
3.0
3.5
NZDep 1-2 3-4 5-6 7-8 9-10
Deat
hs p
er 1
00,0
00 p
eopl
e pe
r yea
r
NZDep2013 Quintile
0.610.00
0.751.17
5.99
0.841.50 1.30
4.87
0.28
1.230.84
5.045.65
1.931.45
6.16
4.84
1.66 1.50
0
2
4
6
8
10
12
Māori Pacific Asian non-MPA
Deat
hs p
er 1
00,0
00 p
eopl
e pe
r yea
r
Ethnic group
NZDep 1-2 NZDep 3-4 NZDep 5-6 NZDep 7-8 NZDep 9-10

46
Figure 22. Asthma deaths per 100,000 people per year, by DHB, 2010-2015, age-adjusted
(see Table A 25 for data)
6.3. BRONCHIECTASIS
6.3.1. BRONCHIECTASIS PREVALENCE
We estimated the prevalence of severe bronchiectasis in 2017 by identifying living individuals hospitalised with bronchiectasis, as either primary or secondary diagnosis‡, since 1988. On 1 July 2017 there were 8366 people previously hospitalised with bronchiectasis, giving a population prevalence of 180 per 100,000 people. Prevalence was highest in Pacific peoples, with an age-standardised population rate of 789.5 per 100,000 (rate ratio 6.30
‡ 2013 report included only primary diagnoses.
1.380.591.840.421.580.962.371.261.342.891.471.321.911.362.201.512.001.411.622.381.69
0.0 1.0 2.0 3.0 4.0 5.0
SouthernSth Canterbury
CanterburyWest Coast
Nelson MarlboroughWairarapa
HuttCapital and Coast
WhanganuiMidcentral
TaranakiHawkes Bay
TairawhitiBay of Plenty
LakesWaikato
Counties ManakauAuckland
WaitemataNorthland
TOTAL
Deaths per 100,000 people per year
DHB

47
compared to non-MPA), followed by Māori, with 420.1 (rate ratio 3.75 compared to non-MPA). There was no significant difference between the 135.3 rate for Asian peoples and the 119.3 rate for non-MPA (Table A 28).
There was also a strong socio-economic gradient, with people in the most deprived NZDep quintile having 2.98 times higher bronchiectasis prevalence than people in the least deprived NZDep quintile (Table A 29).
Severe bronchiectasis prevalence was highest in Counties Manukau DHB, where prevalence was 358.1 cases per 100,000 people; and lowest in South Canterbury, with 70.2 cases per 100,000 people (Table A 30).
6.3.2. BRONCHIECTASIS INCIDENCE
New Zealand incidence of new cases of bronchiectasis in children aged under 15 was estimated at 3.7 per 100,000 in 2001/200222. “Incidence was highest in Pacific children at 17.8 compared with 4.8 in Māori, 1.5 in NZ European, and 2.4 other per 100,000 per year. Incidence varied significantly by region. The median age at diagnosis was 5.2 years; the majority had symptoms for more than two years.” There were no published studies of prevalence, nor of the incidence of bronchiectasis in New Zealand adults.
We measured the 2017 incidence of new cases of severe bronchiectasis in children aged under 15 by identifying hospital admissions with bronchiectasis as a primary or secondary diagnosis, and excluding cases where the patient had a previous hospital admission for bronchiectasis since 2001. This measure found 123 new cases of bronchiectasis in 2017, compared to 104 in 2016 and 102 in 2015. The 2017 incidence rate was 13.2 per 100,000. Incidence was highest in Pacific children at 28.0 compared with 17.7 in Māori, 4.6 in Asian children, and 8.8 in non-MPA children. Māori and Pacific rates were markedly higher than those measured by Twiss et al in 2001/2002. Rates for Asian and non-MPA were not measured in 2001/2002.
Hospitalised bronchiectasis incidence in children aged under 15 years increased with increasing socioeconomic deprivation, with incidence in children in the NZDep 9-10 quintile 2.41 times higher than in NZDep 1-2.
The findings of higher incidence in Māori and Pacific peoples, and of an economic gradient, are consistent with the findings of Bibby et al 2015.23
6.3.3. BRONCHIECTASIS HOSPITALISATIONS
Trends over time 2000 - 2017
Even after adjusting for age, the bronchiectasis hospitalisation rate increased significantly over the study period (see Figure 23). The 2017 rate of 31.0 hospitalisations per 100,000

48
people represented an increase of 49% over the 2000 rate of 20.9 per 100,000. The increase has been highest in children aged under 15 years, and adults aged 65 years and over. Personal communication with respiratory specialists suggested that some of this increase may be the result of diagnosing bronchiectasis at increasing earlier ages; this assessment is supported by changes in the age distribution of incidence.
Although ethnic inequalities continue, and bronchiectasis rates continue to rise for all ethnic groups (Table A 36), the 2000 – 2017 study period has seen an overall reduction in ethnic inequalities in bronchiectasis hospitalisation (Figure 27); though for Māori, inequality reductions between 2010 and 2014 were lost again in the last three years. 2017 was the first year in the study period to see Asian bronchiectasis rates dip below those of non-MPA.
Socio-economic disparities show no clear pattern over the study period (Figure 30).
Figure 23. Bronchiectasis hospitalisations per 100,000 people per year, 2000-2017.
(See Table A 31 for data)
Risks and determinants 2017
Bronchiectasis hospitalisation rates were highest in the elderly, with 104.7 hospitalisations per 100,000 people aged 65+. Female rates were higher than males in age groups over 15 years, but the difference was not statistically significant for the 30 – 64 years age group. Male rates were higher in children aged under 15 years (Figure 25).
Bronchiectasis hospitalisation rates also varied by ethnicity (Figure 26). Pacific peoples were 6.23 times more likely to be hospitalised, and Māori 3.75 times more likely to be
0
5
10
15
20
25
30
35
20002001
20022003
20042005
20062007
20082009
20102011
20122013
20142015
20162017Ho
spita
lisat
ions
per
100
,000
peo
ple
per y
ear
Year
95% CI Hospitalisation rate

49
hospitalised, than non-MPA. Asian peoples’ hospitalisation rates were not significantly different from non-MPA.
Māori and Pacific hospitalisation rate disparities showed across all age-groups. The highest rate ratio disparity by age and ethnicity was for Pacific youth and young adults aged 15 to 29 years, whose bronchiectasis hospitalisation rates of 21.2 per 100,000 were 5.11 times higher than the rate of 4.1 per 100,000 for non-MPA (Figure 28).
Bronchiectasis hospitalisations also showed strong socio-economic disparity. While there was only a gentle trend of increasing bronchiectasis hospitalisation with increasing deprivation across the first four NZDep quintiles, there was a steep increase in difference for the people living in the most deprived (NZDep 9-10) neighbourhoods: the hospitalisation rate for NZDep 9-10 was not only 2.5 times higher than for NZDep 1-2, it was also twice as high as the next most deprived NZDep 7-8 neighbourhoods (Figure 29). Bronchiectasis hospitalisation rates have risen across all NZDep quintiles (Figure 30), and there has been no clear trend in socio-economic inequalities across the study period (Table A 41).
For Māori, there was a two-step difference in socio-economic disparities in bronchiectasis hospitalisation rates: rates in the middle three quintiles were roughly 3 times as high as NZDep 1-2; while rates in NZDep 9-10 were nearly 6 times as high (RR 5.8). Pacific rates showed no overall trend across NZDep quintiles, though rates in NZDep 3-4, 5-6 and 9-10 were all higher than in NZDep 1-2 (Figure 31 ). There was no significant trend for Asian or non-MPA.
As with other respiratory illnesses, there was a rough north to south gradient in bronchiectasis hospitalisations. The highest rates were in Counties Manukau (53.5 per 100,000 people), Lakes (46.0), Auckland (41.6) and Northland (40.6), compared to the national rate of 31.0 (Figure 32).

50
Figure 24. Bronchiectasis hospitalisations per 100,000 people per year by age group, 2000-2017.
See Table A 32 for data. Figure 25. Bronchiectasis hospitalisations per 100,000 people by age group and sex, 2017.
(See Table A 33 and Table A 34 for data)
0
20
40
60
80
100
120
2000 2001 2002 2003 2004 2005 2006 2007 2008 2009 2010 2011 2012 2013 2014 2015 2016 2017
Hosp
italis
atio
ns p
er 1
00,0
00 p
eopl
e pe
r yea
r
Year
0 - 14 years 15 - 29 years 30 - 64 years 65+ years
37.2 31.0 34.2
5.8 8.9 7.315.7 16.7 16.2
66.2
138.3
104.7
0
20
40
60
80
100
120
140
160
Male rate Female rate Total rate
Hosp
italis
atio
ns p
er 1
00,0
00 p
eopl
e
Population
<15 years 15-29 years 30-64 years 65+ years

51
Figure 26. Bronchiectasis hospitalisations per 100,000 people by ethnic group, 2017.
(See Table A 35 for data) Figure 27. Bronchiectasis hospitalisation rate ratios to non-MPA by ethnic group, 2000 – 2017, age-adjusted.
(See Table A 36and Table A 37 for data)
76.3
126.6
18.7 20.3
0
20
40
60
80
100
120
140
160
Māori Pacific Asian Non-MPA
Hosp
italis
atio
ns p
er 1
00,0
00 p
eopl
e
Ethnic group
0
2
4
6
8
10
12
14
2000 2001 2002 2003 2004 2005 2006 2007 2008 2009 2010 2011 2012 2013 2014 2015 2016 2017
Bron
chie
ctas
is h
ospi
talis
atio
n ra
te ra
tio to
non
-MPA
Year
Non-MPA (Reference) Māori Pacific Asian

52
Figure 28. Bronchiectasis hospitalisations per 100,000 people by ethnic group and age group, 2017.
(See Table A 38 for data) Figure 29. Bronchiectasis hospitalisations per 100,000 people by NZDep2013 quintile, 2017, age-adjusted.
(See Table A 39 for data)
65.6 69.8
7.2 16.114.9 21.21.1 4.1
40.0 52.5
6.7 10.6
254.2
490.5
75.0 82.5
0
100
200
300
400
500
600
Māori Pacific Asian non-MPA(includes not-stated)
Hosp
italis
atio
ns p
er 1
00,0
00 p
eopl
e
Ethnic group
Under 15 15-29 30-64 65+
22.619.8
24.828.6
57.2
0
10
20
30
40
50
60
70
1 2 4 4 5
Hosp
italis
atio
ns p
er 1
00,0
00 p
eopl
e
NZDep2013 Quintile

53
Figure 30. Bronchiectasis hospitalisations per 100,000 people by NZDep2013 quintile, 2000 - 2017, age-adjusted.
See Table A 40 for data. Figure 31. Bronchiectasis hospitalisations per 100,000 people by ethnic group and NZDep2013, 2017, age-adjusted.
(See Table A 42 for data) N.B. Confidence intervals are wide for Māori, Pacific and Asian ethnic groups. Please see the associated text for interpretation.
0
10
20
30
40
50
60
2000 2001 2002 2003 2004 2005 2006 2007 2008 2009 2010 2011 2012 2013 2014 2015 2016 2017
Hosp
italis
atio
ns p
er 1
00,0
00 p
eopl
e
Year
NZDep 1-2 NZDep 3-4 NZDep 5-6 NZDep 7-8 NZDep 9-10
18.9
79.4
23.1 21.8
56.5
183.8
15.0 15.4
62.6
131.3
9.720.2
61.679.3
20.2 20.8
109.3
155.3
31.3 26.8
0
50
100
150
200
250
300
350
Maori Pacific Asian Non-MPA(excludes not stated)
Hosp
italis
atio
ns p
er 1
00,0
00 p
eopl
e
Ethnic group
NZDep 1-2 NZDep 3-4 NZDep 5-6 NZDep 7-8 NZDep 9-10

54
Figure 32. Bronchiectasis hospitalisations per 100,000 people by DHB, 2017.
(see Table A 43 for data)
6.3.4. BRONCHIECTASIS MORTALITY
Trends over time 2000 - 2015
Bronchiectasis mortality increased significantly over the study period, from 42 deaths per year in 2000-2001, to 116 deaths in 2015. This represented an age-adjusted increase of 0.08 deaths per 100,000 people per year.
Risks and determinants 2010 - 2015
Bronchiectasis mortality rates were highest in people aged 65+, and were significantly higher in women than in men for people aged 30 and over (Figure 34).
20.95.330.317.511.915.625.218.321.621.827.932.528.633.846.030.253.541.630.140.6
0 20 40 60 80
SouthernSth Canterbury
CanterburyWest Coast
Nelson MarlboroughWairarapa
HuttCapital and Coast
WhanganuiMidcentral
TaranakiHawkes Bay
TairawhitiBay of Plenty
LakesWaikato
Counties ManakauAuckland
WaitemataNorthland
Hospitalisations per 100,000 people
DHB

55
Bronchiectasis mortality was highest for Pacific peoples, with rates 6.34 times higher than for non-MPA. Rates were also significantly higher for Māori, (rate ratio 3.91) and Asian peoples (rate ratio 1.72) (Figure 35). Most of the difference was due to in differences in rates in the two older age groups (Figure 36).
There were socio-economic differences in bronchiectasis mortality. While mortality rates were similar across the first four NZDep2013 quintiles, rates for the most deprived quintile NZDep2013 9-10 were nearly double (RR 1.8) those in the first four quintiles (Figure 37). However, gradients within ethnic groups were more complex. There was no socio-economic gradient in the non-MPA ethnic group, and possible gradients for Māori and Pacific were not statistically significant. Mortality rates for Asian peoples appeared, if anything, to decline with increasing deprivation, though again this trend was not significant. (Figure 38).
Bronchiectasis mortality rates were highest, and significantly higher than the national rate, in Tairawhiti, Counties Manukau, Auckland and Lakes DHBs, and lowest in Wairarapa, Whanganui and Taranaki (Figure 39). Rates were also significantly below the national average in four other DHBs.
Figure 33. Bronchiectasis mortality rates 2000-2015, age-adjusted.
(See Table A 44 for data)
0.00
0.50
1.00
1.50
2.00
2.50
3.00
3.50
20002001
20022003
20042005
20062007
20082009
20102011
20122013
20142015
Deat
hs p
er 1
00,0
00 p
eopl
e pe
r yea
r
Year
95% CI Mortality rate
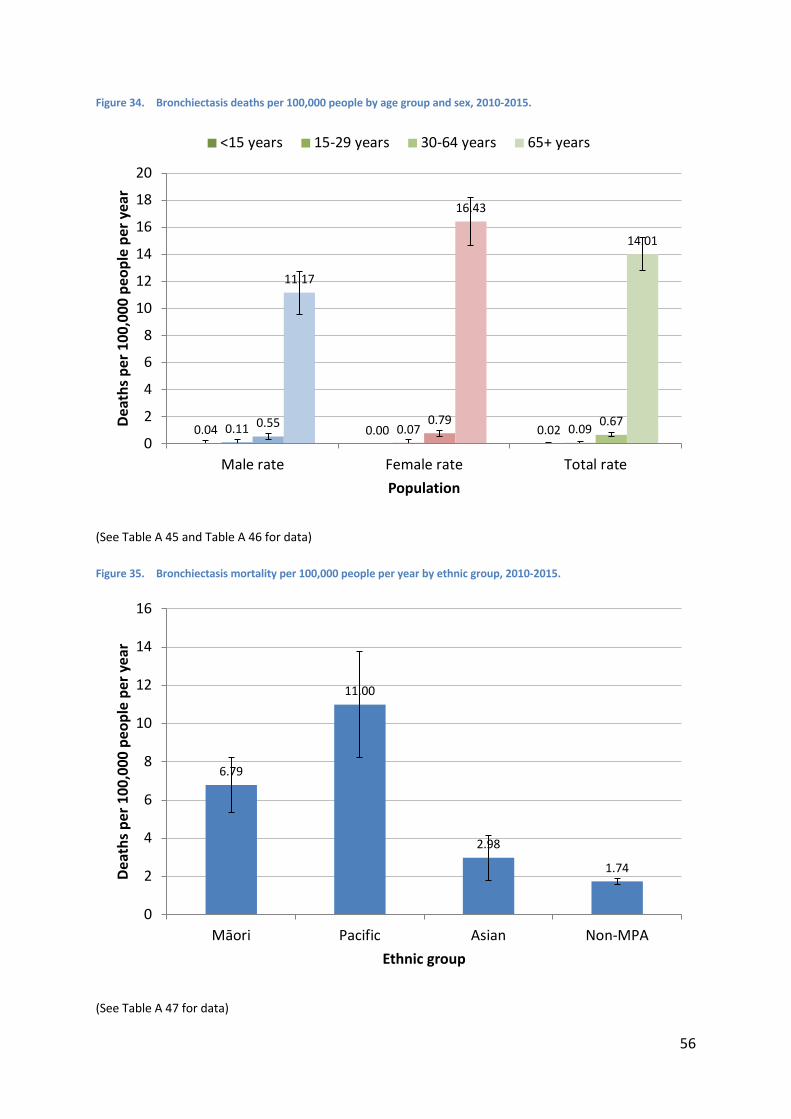
56
Figure 34. Bronchiectasis deaths per 100,000 people by age group and sex, 2010-2015.
(See Table A 45 and Table A 46 for data) Figure 35. Bronchiectasis mortality per 100,000 people per year by ethnic group, 2010-2015.
(See Table A 47 for data)
0.04 0.00 0.020.11 0.07 0.090.55 0.79 0.67
11.17
16.43
14.01
0
2
4
6
8
10
12
14
16
18
20
Male rate Female rate Total rate
Deat
hs p
er 1
00,0
00 p
eopl
e pe
r yea
r
Population
<15 years 15-29 years 30-64 years 65+ years
6.79
11.00
2.98
1.74
0
2
4
6
8
10
12
14
16
Māori Pacific Asian Non-MPA
Deat
hs p
er 1
00,0
00 p
eopl
e pe
r yea
r
Ethnic group

57
Figure 36. Bronchiectasis deaths per 100,000 people per year, by ethnic group and age group, 2010-2015.
(See Table A 48 for data) Figure 37. Bronchiectasis deaths per 100,000 people by NZDep2013 quintile, 2010-2015, age-adjusted.
(See Table A 49 for data)
0.00 0.14 0.00 0.000.19 0.37 0.11 0.002.48 2.46
0.14 0.30
31.85
56.51
13.16 11.68
0
10
20
30
40
50
60
70
80
Māori Pacific Asian non-MPA
Deat
hs p
er 1
00,0
00 p
eopl
e pe
r yea
r
Ethnic group
Under 15 15-29 30-64 65+
2.081.85
2.03 2.09
3.78
0.0
0.5
1.0
1.5
2.0
2.5
3.0
3.5
4.0
4.5
5.0
NZDep 1-2 3-4 5-6 7-8 9-10
Deat
hs p
er 1
00,0
00 p
eopl
e pe
r yea
r
NZDep2013 Quintile

58
Figure 38. Bronchiectasis deaths per 100,000 people by ethnic group and NZDep2013, 2010-2015, age-adjusted.
(See Table A 50 for data) N.B. Confidence intervals are too wide to establish a trend across quintiles for Māori, Pacific or Asian ethnic groups.
4.73.2
4.9
1.84.4
13.1
5.5
1.5
6.4
14.6
1.0 1.74.2 4.6
2.6 1.9
9.3
14.0
0.8 1.9
0
5
10
15
20
25
30
35
40
Māori Pacific Asian Non-MPA
Deat
hs p
er 1
00,0
00 p
eopl
e pe
r yea
r
Ethnic group
NZDep 1-2 NZDep 3-4 NZDep 5-6 NZDep 7-8 NZDep 9-10

59
Figure 39. Bronchiectasis deaths per 100,000 people per year, by DHB, 2010-2015, age-adjusted
(see Table A 51 for data)
6.4. CHILDHOOD BRONCHIOLITIS
6.4.1. CHILDHOOD BRONCHIOLITIS HOSPITALISATIONS
New research
Schlapbach et al24 reported combined Australian and New Zealand bronchiolitis intensive care unit (ICU) admissions in infants younger than 24 months over the period 2002 to 2014. Results were not disaggregated by country so are not necessarily indicative of the situation in New Zealand alone, but are included here for interest. They report a significant and dramatic increase in admissions over the study period, from 58.5 admissions per 100,000 population in 2002, to 125.3 in 2014, and a resulting increase in proportion of paediatric ICU cases from 19.5% to 30.7% over the same period. Severe bronchiolitis was found to result in
2.11.42.11.41.80.62.21.80.81.91.12.44.22.03.02.03.73.52.62.2
0 1 2 3 4 5 6 7
SouthernSouth Canterbury
CanterburyWest Coast
Nelson MarlboroughWairarapa
HuttCapital and Coast
WhanganuiMidcentral
TaranakiHawkes Bay
TairawhitiBay of Plenty
LakesWaikato
Counties ManakauAuckland
WaitemataNorthland
Deaths per 100,000 people per year
DHB

60
over US$30m in direct costs across the two countries, and to account for over a quarter of non-elective paediatric ICU admissions in infants.
Trends over time 2000 - 2017
Childhood bronchiolitis hospitalisation rates have increased significantly over the study period (see Figure 40 ), by an estimated 34.7 hospitalisations per year. The overall hospitalisation rate has increased by nearly a half over the study period.
Ethnic disparities have reduced slightly since 2009, however the reduction is primarily due to the continued increase in rates for non-MPA rather than a meaningful decrease in rates for Māori or Pacific peoples (Figure 43). Socio-economic inequalities increased between 2000 and 2003, and have reduced slightly since then, but remain high overall (Figure 45).
Figure 40. Childhood bronchiolitis hospitalisations per 100,000 people per year, 2000-2017.
(See Table A 52 for data)
Risks and determinants 2017
As with other childhood respiratory illness, bronchiolitis hospitalisation rates were higher for boys than for girls (rate ratio 0.64) (Figure 41).
Rates were lowest for non-MPA children, at 1127.1 per 100,000, highest for Pacific children, at 3967.6 per 100,000, and also high for Māori, at 3561.4, while Asian rates were lower, at 677.0 per 100,000 children (Figure 42). These differences were significant: Pacific rates were
0
500
1000
1500
2000
2500
20002001
20022003
20042005
20062007
20082009
20102011
20122013
20142015
20162017
Hosp
italis
atio
ns p
er 1
00,0
00 p
eopl
e pe
r yea
r
Year
95% CI Hospitalisation rate

61
3.4 times higher than non-MPA, Māori rates 3.1 times higher, and Asian rates 0.6 times lower than non-MPA rates.
As with bronchiectasis, the deprivation gradient was exponential rather than linear. There were 2994 bronchiolitis hospitalisations for children in the most deprived neighbourhoods, making their rates 3.9 times the 454 hospitalisations in the least deprived neighbourhoods (Figure 44). NZDep 9-10 rates were significantly higher than NZDep 1-2 for all ethnic groups. The combined effect of ethnicity and deprivation meant that Māori and Pacific children in the most deprived quintile were more than five times as likely to be hospitalised as NZ non-MPA children in the wealthiest quintile (Figure 46).
Across DHBs, childhood bronchiolitis rates were highest in Tairawhiti, Lakes, Waikato and Northland, and lowest in South Canterbury, West Coast, Canterbury and Nelson Marlborough (Figure 47).
Figure 41. Childhood bronchiolitis hospitalisations per 100,000 people by sex, 2017.
See
Table A 53 for data
2065.4
2501.7
1605.1
0
500
1000
1500
2000
2500
3000
Total Male Female
Hosp
italis
atio
ns p
er 1
00,0
00 p
eopl
e pe
r yea
r
Sex

62
Figure 42. Childhood bronchiolitis hospitalisations per 100,000 people by ethnic group, 2017.
(See Table A 54 for data)
Figure 43. Childhood bronchiolitis hospitalisations per 100,000 people by ethnic group, 2000 - 2017.
See Table A 55 and Table A 56 for data.
3561.4
3967.6
677.0
1127.1
0
500
1000
1500
2000
2500
3000
3500
4000
4500
Māori Pacific Asian Non-MPA
Hosp
italis
atio
ns p
er 1
00,0
00 c
hild
ren
Ethnic group
0
500
1000
1500
2000
2500
3000
3500
4000
4500
5000
200020012002200320042005200620072008200920102011201220132014201520162017
Hosp
italis
atio
ns p
er 1
00,0
00 p
eopl
e
Year
non-MPA Māori Pacific Asian

63
Figure 44. Childhood bronchiolitis hospitalisations per 100,000 people by NZDep2013 quintile, 2017.
(See Table A 57 for data)
Figure 45. Childhood bronchiolitis hospitalisations per 100,000 people by NZDep2013 quintile, 2000 - 2017.
See Table A 58 and Table A 59 for data.
918.31154.2
1477.2
2186.3
3613.8
0
500
1000
1500
2000
2500
3000
3500
4000
NZDep 1-2 3-4 5-6 7-8 9-10
Hosp
italis
atio
ns p
er 1
00,0
00 p
eopl
e
NZDep2013 Quintile
0
500
1000
1500
2000
2500
3000
3500
4000
4500
200020012002200320042005200620072008200920102011201220132014201520162017
Hosp
italis
atio
ns p
er 1
00,0
00 p
eopl
e pe
r yea
r
Year
NZDep 1-2 NZDep 3-4 NZDep 5-6 NZDep 7-8 NZDep 9-10

64
Figure 46. Childhood bronchiolitis hospitalisations per 100,000 people by ethnic group and NZDep2013, 2017.
(See Table A 60 for data)
1217.7
2228.8
528.7856.2
1959.5
3301.2
640.3889.1
2539.3
3467.8
561.9
1077.3
3581.83373.4
687.7
1359.7
4772.44506.2
929.3
1758.4
0
1000
2000
3000
4000
5000
6000
Māori Pacific Asian Non-MPA
Hosp
italis
atio
ns p
er 1
00,0
00 p
eopl
e
Ethnic group
NZDep 1-2 NZDep 3-4 NZDep 5-6 NZDep 7-8 NZDep 9-10

65
Figure 47. Childhood bronchiolitis hospitalisations per 100,000 people by DHB, 2017.
(see Table A 61 for data)
6.4.2. CHILDHOOD BRONCHIOLITIS MORTALITY
Trends over time 2000 - 2015
Deaths from childhood bronchiolitis were rare, totalling 15 over the period 2000-2015. There were no new child deaths from bronchiolitis since the previous report.
Risks and determinants 2006 - 2015
With no new deaths since the last report, the reduction in deaths over the study period has just reached statistical significance, with raw numbers reducing by 0.11 deaths per year (95%CI -0.21 – 0.00, p=0.043). The pleasing absence of deaths means there is no new information on risks and determinants since the previous report. Between 2006 and 2015, all seven deaths were Māori and/or Pacific children, in NZDep2013 deciles 7 to 10.
1668.5898.21119.7934.11240.51870.22324.61829.82462.32005.42101.92334.24694.42810.03720.33295.22487.61585.01332.22619.3
0 1000 2000 3000 4000 5000 6000
SouthernSouth Canterbury
CanterburyWest Coast
Nelson MarlboroughWairarapa
HuttCapital and Coast
WhanganuiMidcentral
TaranakiHawkes Bay
TairawhitiBay of Plenty
LakesWaikato
Counties ManakauAuckland
WaitemataNorthland
Hospitalisations per 100,000 people
DHB

66
Figure 48. Childhood bronchiolitis mortality numbers 2000-2015.
6.5. CHILDHOOD PNEUMONIA
6.5.1. CHILDHOOD PNEUMONIA HOSPITALISATIONS
Trends over time 2000 - 2017
While childhood pneumonia hospitalisations declined over the study period, by 4.4 hospitalisations per 100,000 children per year, that decline occurred over the period 2000 – 2014, and since 2013 rates have plateaued or increased, though the 2017 rate of 371.8 hospitalisations per 100,000 children per year is still less than the study period average of 391.8. (Figure 49).
Ethnic disparities in childhood pneumonia rates have decreased for Māori and Pacific children over the study period, and the improvement came as Māori and Pacific rates have declined while non-MPA rates have shown no significant change (Figure 52). Of concern, however, is the increase between 2000 and 2017 in childhood pneumonia rates among Asian children. Asian children’s childhood pneumonia rates have increased by 41% over the study period, from an average of 220 hospitalisations per 100,000 children per year in 2000 – 2004, to 311 in 2013 – 2017. This increase has also seen Asian rates shift from being lower than non-MPA rates between 2000 and 2006, to being higher than non-MPA rates from 2007 -2017.
Socio-economic disparities in childhood pneumonia hospitalisations have decreased over the study period, as rates have fallen faster in the most deprived quintiles than in the least deprived quintiles. Nonetheless, NZDep 9-10 areas continue to have hospitalisation rates more than double those of NZDep 1-2 areas (Figure 55).
3
1 1 1 1 1
3
0 0
1 1
0
2
0 0 00
1
2
3
4
2000 2001 2002 2003 2004 2005 2006 2007 2008 2009 2010 2011 2012 2013 2014 2015
Tota
l dea
ths p
er y
ear
Year

67
Figure 49. Childhood pneumonia hospitalisations per 100,000 people per year, 2000-2017.
(See Table A 62 for data)
Risks and determinants 2017
Childhood pneumonia showed only a small and non-significant overall difference between male and female rates, though differences by sex varied within age sub-groups: girls under 5 years had significantly lower hospitalisation rates than boys (rate ratio 0.95), but there was no significant difference in rates for children aged 5 to 14 years (Figure 50).
Pacific children had the highest childhood pneumonia rates, at 649.3 hospitalisations per 100,000 children. This rate was 2.4 times higher than the non-MPA rate of 271.8 hospitalisations per 100,000. Rates for Māori children were 1.6 times higher, while rates for Asian children were 1.1 times higher (Figure 51).
For Māori and Pacific children, these differences were more pronounced for children aged under 5 years (Figure 53).
Childhood pneumonia rates were highest in the most deprived areas, with rates 2.1 times higher in the most deprived NZDep quintile than in the least deprived (Figure 54).
Over both ethnicity and deprivation, Māori children had the strongest socioeconomic gradient in childhood pneumonia rates; the highest overall rate was for Pacific children in the most deprived NZDep quintile. There was no socioeconomic gradient for Asian children. non-MPA children childhood pneumonia rates showed a less pronounced socioeconomic gradient, with rates only significantly higher in the NZDep 7-8 and 9-10. (Figure 56).
0
100
200
300
400
500
600
20002001
20022003
20042005
20062007
20082009
20102011
20122013
20142015
20162017Ho
spita
lisat
ions
per
100
,000
peo
ple
per y
ear
Year
95% CI Hospitalisation rate

68
Across DHBs, the highest childhood pneumonia rates were in Lakes, Northland, and Auckland. Rates were lowest in South Canterbury, Southern and Nelson Marlborough, and also lower than average in Hawkes Bay, Canterbury, Capital and Coast, and MidCentral DHBs (Figure 57).
Figure 50. Childhood pneumonia hospitalisations per 100,000 people by age group and sex, 2017.
(See Table A 63 and Table A 64 for data)
829.4787.8 809.2
148.2 154.7 151.3
0
100
200
300
400
500
600
700
800
900
1000
Male rate Female rate Total rate
Hosp
italis
atio
ns p
er 1
00,0
00 p
eopl
e
Population
0-4 years 5-14 years

69
Figure 51. Childhood pneumonia hospitalisations per 100,000 people by ethnic group, 2017, age-adjusted.
(See Table A 65 for data) Figure 52. Childhood pneumonia hospitalisations per 100,000 people by ethnic group, 2000 – 2017, age-adjusted.
See Table A 66 and Table A 67 for data.
425.2
649.3
308.1271.8
0
100
200
300
400
500
600
700
800
Māori Pacific Asian Non-MPA
Hosp
italis
atio
ns p
er 1
00,0
00 p
eopl
e
Ethnic group
0
200
400
600
800
1000
1200
200020012002200320042005200620072008200920102011201220132014201520162017
Hosp
italis
atio
ns p
er 1
00,0
00 c
hild
ren
per y
ear
Year
non-MPA Māori Pacific Asian

70
Figure 53. Childhood pneumonia hospitalisations per 100,000 people by ethnic group and age group, 2017.
(See Table A 68 for data) Figure 54. Childhood pneumonia hospitalisations per 100,000 people by NZDep2013 quintile, 2017, age-adjusted.
(See Table A 69 for data)
974.2
1492.9
608.0549.5
148.3222.9
163.7 131.4
0
300
600
900
1200
1500
1800
Māori Pacific Asian non-MPA
Hosp
italis
atio
ns p
er 1
00,0
00 p
eopl
e
Ethnic group
0-4 5-14
255.4 269.4
325.3
393.8
525.4
0
100
200
300
400
500
600
NZDep 1-2 3-4 5-6 7-8 9-10
Hosp
italis
atio
ns p
er 1
00,0
00 p
eopl
e
NZDep2013 Quintile

71
Figure 55. Childhood pneumonia hospitalisations per 100,000 people by NZDep2013 quintile, 2000 - 2017, age-adjusted.
See Table A 70 and Table A 71 for data.
Figure 56. Childhood pneumonia hospitalisations per 100,000 people by ethnic group and NZDep2013, 2017, age-adjusted.
0
100
200
300
400
500
600
700
800
2000 2001 2002 2003 2004 2005 2006 2007 2008 2009 2010 2011 2012 2013 2014 2015 2016 2017
Hosp
italis
atio
ns p
er 1
00,0
00 p
eopl
e pe
r yea
r
Year
NZDep 1-2 NZDep 3-4 NZDep 5-6 NZDep 7-8 NZDep 9-10
197.9
359.1316.8
226.7280.2
655.6
252.3208.5
379.2
561.8
350.6
263.0
429.9
591.9
272.9
347.5
522.6
708.2
304.1
387.5
0
150
300
450
600
750
900
Māori Pacific Asian Non-MPA
Hosp
italis
atio
ns p
er 1
00,0
00 p
eopl
e
Ethnic group
NZDep 1-2 NZDep 3-4 NZDep 5-6 NZDep 7-8 NZDep 9-10

72
(See Table A 72 for data) Figure 57. Childhood pneumonia hospitalisations per 100,000 people by DHB, 2017.
(see Table A 73 for data)
6.5.2. CHILDHOOD PNEUMONIA MORTALITY
Trends over time 2000 - 2015
Mortality from childhood pneumonia showed no significant trend over the study period (Figure 58).
Risks and determinants 2006 - 2015
Pneumonia mortality rates for children aged under did not differ significantly by sex in either the under 5 years or the 5 to 14 years age group (Figure 59).
There was high inequality in the distribution of childhood pneumonia mortality by ethnicity. Rates for non-MPA and Asian peoples were 0.5 deaths per 100,000 children per year. Rates for Māori and Pacific peoples were 2.2 and 3.0 deaths respectively per 100,000 people per year, making rates 4.1 times higher for Māori and 5.6 times higher for Pacific peoples
163.2154.5219.6342.1173.5398.1516.6265.1362.0305.4391.9187.8355.7369.0627.4443.6460.9535.5359.4573.7
0 200 400 600 800
SouthernSouth Canterbury
CanterburyWest Coast
Nelson MarlboroughWairarapa
HuttCapital and Coast
WhanganuiMidcentral
TaranakiHawkes Bay
TairawhitiBay of Plenty
LakesWaikato
Counties ManakauAuckland
WaitemataNorthland
Hospitalisations per 100,000 people
DHB

73
(Figure 60). In absolute numbers, this meant that across the 122 deaths between 2006 and 2015, 53 deaths were Māori, 38 Pacific, 5 Asian, and 26 non-MPA.
Figure 58. Childhood pneumonia mortality rates 2000-2015, age-adjusted.
(See Table A 74 for data) N.B. Confidence intervals are wide. The peak and trough in 2004 and 2001 respectively are significantly different from each other, but not from other years.
Socio-economic inequalities were even more marked. In the previous 2004-2013 study period, there was a clear trend of higher mortality with increasing deprivation. For this study 2006 -2015 study period, differences over the first four NZDep2013 quintiles have reduced, but rates in the most deprived quintile have remained markedly higher than other quintiles. Over half of all deaths were in the most deprived quintile (Figure 61), for whom the mortality rate was 8.06 times higher than in the least deprived quintile. This difference is an improvement on the previous report, when the ratio was 17.9, and also on the 11.9 ratio for the 2002 – 2011 study period before that.
Childhood pneumonia mortality rates were highest, and significantly higher than the national average, in Bay of Plenty, Counties Manukau, Taranaki, Northland and Waikato DHBs. There were five DHBs with no childhood pneumonia deaths, and four other DHBs where rates were significantly below the national average (Figure 62).
0.0
0.5
1.0
1.5
2.0
2.5
3.0
3.5
4.0
20002001
20022003
20042005
20062007
20082009
20102011
20122013
20142015
Deat
hs p
er 1
00,0
00 p
eopl
e pe
r yea
r
Year
95% CI Mortality rate

74
Figure 59. Childhood pneumonia deaths per 100,000 people by age group and sex, 2006-2015.
(See Table A 75 and Table A 76 for data) Figure 60. Childhood pneumonia mortality per 100,000 people per year by ethnic group, 2006-2015.
(See Table A 77 for data)
3.312.95
3.14
0.26 0.17 0.22
0.0
0.5
1.0
1.5
2.0
2.5
3.0
3.5
4.0
4.5
Male rate Female rate Total rate
Deat
hs p
er 1
00,0
00 p
eopl
e
Population
0-4 years 5-14 years
2.18
3.01
0.46 0.54
0.0
0.5
1.0
1.5
2.0
2.5
3.0
3.5
4.0
4.5
Māori Pacific Asian non-MPA
Deat
hs p
er 1
00,0
00 p
eopl
e
Ethnic group

75
Figure 61. Childhood pneumonia deaths per 100,000 people by NZDep2013 quintile, 2006-2015, age-adjusted.
(See Table A 78 for data)
0.33
1.01
0.540.74
2.64
0.0
0.5
1.0
1.5
2.0
2.5
3.0
3.5
NZDep 1-2 3-4 5-6 7-8 9-10
Deat
hs p
er 1
00,0
00 p
eopl
e
NZDep2013 quintile

76
Figure 62. Childhood pneumonia deaths per 100,000 people per year, by DHB, 2006-2015, age-adjusted
(see Table A 79 for data)
6.6. COPD IN OLDER ADULTS (45+ YEARS)
6.6.1. ADULT 45+ YEARS COPD PREVALENCE
Research summary
The 2003/4 prevalence of COPD in adults aged 40 and over was estimated to be 14.2%25 26. This estimate used the “Global Initiative for Chronic Obstructive Lung Disease” (GOLD) definition for COPD.
A 2014 report on the burden of asthma and COPD in New Zealand reported that of 122,953 patients aged 45+ in their primary care cohort, 1871 or 2.3% were identified as having diagnosed and recently medicated COPD.7 Milne et al reported 2012/13 total population hospital admission rates for COPD at 2.82 per 100,000 people.27
There were no new studies of the incidence or prevalence of adult COPD since the previous report.
1.30.00.30.00.00.01.01.40.81.52.10.30.02.50.82.02.10.60.82.0
0 1 2 3 4 5 6
SouthernSth Canterbury
CanterburyWest Coast
Nelson MarlboroughWairarapa
HuttCapital and Coast
WhanganuiMidcentral
TaranakiHawkes Bay
TairawhitiBay of Plenty
LakesWaikato
Counties ManakauAuckland
WaitemataNorthland
Deaths per 100,000 people
DHB

77
We estimated the 1 July 2017 prevalence of severe COPD by identifying people who had been hospitalised with COPD as a primary or secondary diagnosis between 1988 and 2017, and excluding those deceased before 1 July 2017. This method identified 44,002 New Zealanders living with COPD on 1 July 2017, giving a total population prevalence of 0.95%. Age-standardised population prevalence was highest for Māori, at 2.44%, followed by Pacific, at 2.19%, and trailed by non-MPA and Asian peoples at 0.77% and 0.34% respectively. Age-standardised prevalence was 7.6% higher for men (0.98%) than women (0.88%). 96% of cases people with COPD in 2017 were over the age of 45, making the population prevalence of ever-hospitalised COPD 2.2% in people aged 45 and over.
The average age of Māori with COPD was 63.9, compared with 67.1 for Pacific peoples, 70.2 for Asian peoples, and 73.7 for non-MPA.
Note that this measure includes only those hospitalised for COPD since 1988, and will not include those who have been able to effectively manage their COPD in the community and primary care. However, it is included here to provide an ongoing reference, bearing in mind that the 1.9% prevalence in adults aged 40 and over represented 13.4% of the 2003/4 GOLD-defined prevalence, though the 2.2% prevalence in adults aged 45 and over was 77% of the prevalence found in the 2014 primary care cohort.
6.6.2. ADULT 45+ YEARS COPD INCIDENCE
We estimated the 2017 incidence of severe COPD by identifying COPD hospital admissions in 2017 where the patient had not previously been hospitalised with COPD (since 1988, the start of data availability). There were 5,579 new cases of COPD in 2017, a total incidence rate of 116.4 per 100,000 people. Rates were highest for Māori, at 295.4 per 100,000, followed by Pacific at 165.5, and lower for non-MPA, at 100.8, and Asian peoples, at 36.0. Average age of onset was 69.9 years, and was earliest for Māori and Pacific, at 62.5 and 63.2 years respectively, followed by Asian, at 68.8 years, and latest for non-MPA, at 72.4 years.
6.6.3. ADULT 45+ YEARS COPD HOSPITALISATIONS
It should be noted that COPD hospitalisations may include cases of misdiagnosed bronchiectasis, and vice versa. Bronchiectasis hospitalisations are less common than COPD: if all bronchiectasis hospitalisations in adults aged 45 years and over were in fact misdiagnosed COPD, it would increase COPD rates by about 31 hospitalisations per 100,000 people per year (2017), about 4.9% of the total COPD burden. However, although the actual proportion of misdiagnoses is unknown, it is unlikely to be so large.
Trends over time 2000 - 2017 2016 COPD hospitalisation rates dipped below the 2000 rate for the first time in the study period (Figure 63). While 2017 rates were a little higher again, all rates over the last five years were lower than rates in the period 2001 to 2012. Ethnic and socio-economic

78
disparities in COPD hospitalisation rates widened between 2000 and 2017 (Figure 66 and Figure 69). Figure 63. COPD hospitalisations in adults aged 45+, per 100,000 people per year, 2000-2017, age-adjusted.
(See Table A 80 for data)
Risks and determinants 2017
COPD hospitalisation rates were higher for women than men in the 45 to 64 year age group (rate ratio 1.20), but lower in the 65+ age group (rate ratio 0.93) (Figure 64).
COPD rates were highest for Māori, at 3.54 times the non-MPA rate, and Pacific peoples (rate ratio 2.70), and lowest for Asian peoples (rate ratio 0.34) (Figure 65).
There was a strong deprivation gradient, with COPD rates 5.11 times higher in the most deprived NZDep quintile than in the least deprived (Figure 68). The gradient was present across all ethnic groups (Figure 70).
COPD hospitalisation rates were highest in West Coast and Whanganui, and lowest in Nelson Marlborough (Figure 71).
0
100
200
300
400
500
600
700
800
20002001
20022003
20042005
20062007
20082009
20102011
20122013
20142015
20162017
Hosp
italis
atio
ns p
er 1
00,0
00 p
eopl
e pe
r yea
r
Year
95% CI Hospitalisation rate

79
Figure 64. COPD hospitalisations in adults aged 45+, per 100,000 people, by age group and sex, 2017.
(See Table A 81 and Table A 82 for data) Figure 65. COPD hospitalisations in adults aged 45+, per 100,000 people, by ethnic group, 2017, age-adjusted.
(See Table A 83 for data)
253.4 305.2 280.2
1215.71130.6 1170.3
0
200
400
600
800
1000
1200
1400
Male rate Female rate Total rate
Hosp
italis
atio
ns p
er 1
00,0
00 p
eopl
e
Population
45-64 years 65+ years
1749.1
1337.8
167.5
494.8
0
250
500
750
1000
1250
1500
1750
2000
Māori Pacific Asian Non-MPA
Hosp
italis
atio
ns p
er 1
00,0
00 p
eopl
e
Ethnic group

80
Figure 66. COPD hospitalisation rate in adults aged 45, by ethnic group, relative to non-MPA reference rate, 2000 - 2017, age-adjusted.
See Table A 84 and Table A 85 for data.
Figure 67. COPD hospitalisations in adults aged 45+, per 100,000 people, by ethnic group and age group, 2017.
(See Table A 86 for data)
0
0.5
1
1.5
2
2.5
3
3.5
4
2000 2001 2002 2003 2004 2005 2006 2007 2008 2009 2010 2011 2012 2013 2014 2015 2016 2017
Hosp
italis
atio
n ra
te re
lativ
e to
non
-MPA
rate
Year
non-MPA (reference) Māori Pacific Asian
976.0
456.7
33.1194.8
2955.2
2572.4
318.8
1059.2
0
500
1000
1500
2000
2500
3000
3500
Māori Pacific Asian non-MPA
Hosp
italis
atio
ns p
er 1
00,0
00 p
eopl
e
Ethnic group
45-64 65+

81
Figure 68. COPD hospitalisations in adults 45+, per 100,000 people, by NZDep2013 quintile, 2017, age-adjusted.
(See Table A 87 for data)
Figure 69. COPD hospitalisations in adults 45+, per 100,000 people, by NZDep2013 quintile, 2000 - 2017, age-adjusted.
(See Table A 88 and Table A 89 for data)
234.5
377.9466.5
750.8
1198.6
0
200
400
600
800
1000
1200
1400
NZDep 1-2 3-4 5-6 7-8 9-10
Hosp
italis
atio
ns p
er 1
00,0
00 p
eopl
e
NZDep2013 Quintile
0
200
400
600
800
1000
1200
1400
200020012002200320042005200620072008200920102011201220132014201520162017
Hosp
italis
atio
ns p
er 1
00,0
00 p
eopl
e pe
r yea
r
Year
NZDep 1-2 NZDep 3-4 NZDep 5-6 NZDep 7-8 NZDep 9-10

82
Figure 70. COPD hospitalisations in adults aged 45+, per 100,000 people, by ethnic group and NZDep2013, 2017, age-adjusted.
(See Table A 90 for data)
681.0 653.2
94.5226.8
942.41089.5
129.0
352.1
1226.6
941.3
123.0
434.8
1855.0
1251.9
198.8
674.0
2382.2
1721.4
284.8
975.6
0
500
1000
1500
2000
2500
3000
Maori Pacific Asian Non-MPA
Hosp
italis
atio
ns p
er 1
00,0
00 p
eopl
e
Ethnic group
NZDep 1-2 NZDep 3-4 NZDep 5-6 NZDep 7-8 NZDep 9-10

83
Figure 71. COPD hospitalisations in adults aged 45+, per 100,000 people, by DHB, 2017.
(see Table A 91 for data)
6.6.4. ADULT 45+ YEARS COPD MORTALITY
Trends over time 2000 - 2015
Mortality due to COPD declined over the study period, from an age-adjusted 111.9 deaths per 100,000 in 2000, to 85.0 deaths per 100,000 in 2015. This represented a decline of 2.81 deaths per 100,000 people per year. If this trend were to continue, we would see COPD eliminated as a cause of death by 2045.
Risks and determinants 2015
COPD mortality rates were similar for men and women in the 45-64 years age group, but higher in men than in women in the 65+ years age group (Figure 73).
COPD mortality rates were highest in Māori, whose rate of 183.4 deaths per 100,000 people per year was 2.24 (95% CI 2.07-2.42) times higher than 81.9 rate for non-MPA. Pacific rates
612.1477.9512.31033.3342.8659.1616.1475.7989.4502.8891.3776.9806.0584.2838.2812.9615.0437.8479.5719.0
0 200 400 600 800 1000 1200 1400
SouthernSouth Canterbury
CanterburyWest Coast
Nelson MarlboroughWairarapa
HuttCapital and Coast
WhanganuiMidcentral
TaranakiHawkes Bay
TairawhitiBay of Plenty
LakesWaikato
Counties ManakauAuckland
WaitemataNorthland
Hospitalisations per 100,000 people
DHB

84
were 1.08 times higher than non-MPA. However, the COPD mortality rate for Asian peoples was well under half that of non-MPA (Figure 74). These patterns were exaggerated in the younger 45-64 year age group (Figure 75).
COPD mortality rates also increased with increasing socio-economic deprivation, with deaths in NZDep2013 quintile 9-10 occurring at 2.26 times the rate in quintile 1-2 (Figure 76). Increasing COPD mortality with increasing deprivation was significant for Māori and non-MPA, but not significant for Pacific or Asian peoples (Figure 77).
Adult COPD mortality rates for 2015 were highest in Lakes, West Coast, and Whanganui DHBs; and lowest in Capital and Coast, and Waitemata.
Figure 72. Adult COPD mortality rates 2000-2015, age-adjusted.
(See Table A 92 for data)
0
20
40
60
80
100
120
140
160
20002001
20022003
20042005
20062007
20082009
20102011
20122013
20142015
Deat
hs p
er 1
00,0
00 p
eopl
e pe
r yea
r
Year
95% CI Mortality rate

85
Figure 73. Adult COPD deaths per 100,000 people by age group and sex, 2015.
(See Table A 93 and Table A 94 for data) Figure 74. Adult COPD mortality per 100,000 people per year by ethnic group, 2015.
(See Table A 95 for data)
13.4 14.4 13.9
237.0
186.7210.0
0
50
100
150
200
250
300
Male rate Female rate Total rate
Deat
hs p
er 1
00,0
00 p
eopl
e
Population
45-64 years 65+ years
183.4
88.8
30.7
81.9
0
50
100
150
200
250
Māori Pacific Asian Non-MPA
Deat
hs p
er 1
00,0
00 p
eopl
e
Ethnic group

86
Figure 75. Adult COPD deaths per 100,000 people per year, by ethnic group and age group, 2015.
(See Table A 96 for data). Figure 76. Adult COPD deaths per 100,000 people by NZDep2013 quintile, 2015, age-adjusted.
(See Table A 97 for data)
35.817.1
0.8 12.3
383.4
160.5
50.7
211.9
0
100
200
300
400
500
Māori Pacific Asian non-MPA
Deat
hs p
er 1
00,0
00 p
eopl
e
Ethnic group
45-64 65+
56.964.0
75.2
100.0
128.9
0
20
40
60
80
100
120
140
160
NZDep 1-2 3-4 5-6 7-8 9-10
Deat
hs p
er 1
00,0
00 p
eopl
e
NZDep2013 Quintile

87
Figure 77. Adult COPD deaths per 100,000 people by ethnic group and NZDep2013, 2015, age-adjusted.
(See Table A 98 for data) N.B. Confidence intervals were wide for Māori, Pacific and Asian ethnic groups. Trends of increasing mortality with increasing socioeconomic deprivation were not statistically significant for Pacific or Asian peoples.
12.8
148.5
21.9
60.9
155.5
0.010.7
64.2
130.1
83.1
48.3
75.1
169.0
92.2
37.6
101.1
258.4
113.2
49.2
116.1
0
50
100
150
200
250
300
350
Māori Pacific Asian Non-MPA
Deat
hs p
er 1
00,0
00 p
eopl
e
Ethnic group
NZDep 1-2 NZDep 3-4 NZDep 5-6 NZDep 7-8 NZDep 9-10

88
Figure 78. Adult COPD deaths per 100,000 people per year, by DHB, 2015, age-adjusted
(see Table A 99 for data)
6.7. TOTAL SERIOUS RESPIRATORY DISEASE
New research on respiratory disease incidence in children
Dowell et al analysed general practitioner (GP) consultations across 36 New Zealand primary care practices for children under 18 years of age, between 2008 and 2013 inclusive.28 Their study found rates of 1101 respiratory consultations per 1000 person-years, with 509 for upper respiratory tract infections, 107 for lower respiratory tract infections, 235 for wheeze, 180 for throat infections, 296 for otitis media and 36 for other infections. Seventy percent of children visited their GP for a respiratory condition in their first year of life. Respiratory conditions made up 45.4% of all consultations.
Priest et al found primary school children aged 5 to 11 years had 0.80 absences for respiratory illness per 100 child days. Provision of hand sanitiser in school did not reduce absences.29
6.7.1. TOTAL RESPIRATORY HOSPITALISATIONS
114.592.783.1129.8101.072.886.259.5125.276.0100.270.4124.391.7135.274.376.780.559.1108.8
0 50 100 150 200
SouthernSouth Canterbury
CanterburyWest Coast
Nelson MarlboroughWairarapa
HuttCapital and Coast
WhanganuiMidcentral
TaranakiHawkes Bay
TairawhitiBay of Plenty
LakesWaikato
Counties ManakauAuckland
WaitemataNorthland
Deatns per 100,000 people
DHB

89
New research
Lawton et al reported that 6.4% percent of infants born 1995 to 2009 inclusive were admitted to hospital for respiratory illness at least once in their first year of life.30 Infants of Māori and Pacific mothers had higher admission rates (rate ratios 2.42 and 3.79 respectively), particularly if the mothers were young; as did infants of mothers who lived in NZDep 9-10 areas (rate ratio 1.33 compared to NZDep 1-2), who smoked (rate ratio 1.3), or who had three or more previous births (rate ratio 2.77 compared to no previous births). Hospitalisation rates were also higher for pre-term births (rate ratio 3.14). Breastfeeding was not protective against respiratory hospitalisation.
Trends over time 2000 - 2017
The 2017 rate of respiratory hospitalisations was 1812.0 per 100,000 people. Total respiratory hospitalisations have been increasing at a rate of 17.4 hospitalisations per year over the study period. However, this increase appears as a two-tier effect – rates remained within the same range from 2000 to 2007, then increased sharply between 2007 and 2009, hen crept up slowly between 2009 and 2017. The arrival of influenza A(H1N1) in 2009 may have contributed to the rate remaining high, but cannot be responsible for the original increase in 2008 (Figure 79).
This increase has occurred despite a drop in tobacco smoking prevalence over a similar period (2000 – 2016/17) from 25% to 15.7%.31
While ethnic disparities in hospitalisation rates rose over the first half of the study period, reaching their peak in the late 2000s, since 2010 they have stabilised at a level slightly below that peak (Figure 83). Socio-economic disparities show a similar pattern (Figure 86).
Risks and determinants 2017
Respiratory hospitalisation rates were highest for the young (children aged under 15 years) and the elderly (adults aged over 65 years). Rates were higher for males than females in the young and the elderly, but higher for females than males in both age groups for adults aged 15 to 64 (Figure 81).
Respiratory hospitalisation rates were highest for Pacific peoples, with rates 2.51 times higher (95%CI 2.6-2.7) than for non-MPA. Māori rates were also significantly higher (rate ratio 2.03), and lower (rate ratio 0.71) for Asian peoples. These trends were repeated across all age groups (Figure 84).

90
Figure 79. Total respiratory hospitalisations per 100,000 people per year, 2000-2017, age-adjusted.
(See Table A 100 for data)
Figure 80. New Zealand smoking prevalence 2000-2016/17.
Data sourced from Tobacco Control Data Repository, http://www.tcdata.org.nz/TobaccoSectorOverview.aspx, accessed 11 August 2016, and New Zealand Health Survey data for 2011/12 - 2016/7.
0
200400
600
8001000
1200
14001600
1800
2000
20002001
20022003
20042005
20062007
20082009
20102011
20122013
20142015
20162017
Hosp
italis
atio
ns p
er 1
00,0
00 p
eopl
e pe
r yea
r
Year
95% CI Hospitalisation rate
0
5
10
15
20
25
30
2000 2001 2002 2003 2004 2005 2006 2007 2008 2009 2010 2011 2012 2013 2014 2015 2016
Smok
ing
prev
alen
ce (%
of p
eopl
e ag
ed 1
5 an
d ov
er)
Year
Tobacco Control Data Repository NZ Health Survey

91
There was a significant deprivation gradient in total respiratory hospitalisations, with rates in the most deprived NZDep quintile 2.32 times higher than rates in the least deprived quintile (Figure 85).
The deprivation gradient was present for all ethnic groups. However, the lowest Pacific rate, in the wealthiest quintile, was significantly higher than rates for non-MPA in the most deprived quintile: respiratory outcomes for Pacific peoples in even the wealthiest areas are worse than for non-MPA people in even the most deprived areas (Figure 87).
Total respiratory hospitalisation rates were highest in Lakes, Whanganui and Waikato DHBs, and lowest in Nelson Marlborough (Figure 88).
Figure 81. Total respiratory hospitalisations per 100,000 people by age group and sex, 2017.
(See Table A 101 and Table A 102 for data)
3079.3
2442.62769.2
585.3965.8
770.4964.9 1080.3 1024.6
4618.4
4020.54299.1
0
1000
2000
3000
4000
5000
6000
Male rate Female rate Total rate
Hosp
italis
atio
ns p
er 1
00,0
00 p
eopl
e
Population
<15 years 15-29 years 30-64 years 65+ years

92
Figure 82. Total respiratory hospitalisations per 100,000 people by ethnic group, 2017, age-adjusted.
(See Table A 103 for data) Figure 83. Respiratory hospitalisation rate ratio to non-MPA by ethnic group, 2000 – 2017, age-adjusted.
See Table A 104and Table A 105 for data.
3152.0
3884.5
1102.5
1549.8
0
500
1000
1500
2000
2500
3000
3500
4000
4500
Māori Pacific Asian Non-MPA
Hosp
italis
atio
ns p
er 1
00,0
00 p
eopl
e
Ethnic group
0.0
0.5
1.0
1.5
2.0
2.5
3.0
2000 2001 2002 2003 2004 2005 2006 2007 2008 2009 2010 2011 2012 2013 2014 2015 2016 2017
Hosp
italis
atio
n ra
te ra
tio to
non
-MPA
Year
non-MPA (reference) Māori Pacific Asian

93
Figure 84. Total respiratory hospitalisations per 100,000 people by ethnic group and age group, 2017.
(See Table A 106 for data) Figure 85. Total respiratory hospitalisations per 100,000 people by NZDep2013 quintile, 2017, age-adjusted.
(See Table A 107 for data)
3599.34099.2
1912.1 2188.4
1044.5 1195.8393.3 727.8
2138.9 2176.5
497.2 830.7
7727.1
10600.1
2411.7
3972.6
0
2000
4000
6000
8000
10000
12000
Maori Pacific Asian non-MPA(excludes not-stated)
Hosp
italis
atio
ns p
er 1
00,0
00 p
eopl
e
Ethnic group
Under 15 15-29 30-64 65+
1197.21384.5
1575.2
1987.8
2806.6
0
500
1000
1500
2000
2500
3000
NZDep 1-2 3-4 5-6 7-8 9-10
Hosp
italis
atio
ns p
er 1
00,0
00 p
eopl
e
NZDep2013 Quintile

94
Figure 86. Total respiratory hospitalisation rate ratio to NZDep 1-2 by NZDep2013 quintile, 2000-2017, age-adjusted.
Figure 87. Total respiratory hospitalisations per 100,000 people by ethnic group and NZDep2013, 2017, age-adjusted.
(See Table A 110 for data)
0.5
1.0
1.5
2.0
2.5
3.0
2000 2001 2002 2003 2004 2005 2006 2007 2008 2009 2010 2011 2012 2013 2014 2015 2016 2017
Hosp
italis
atio
n ra
te ra
tio to
NZD
ep 1
-2
Year
NZDep 1-2 (reference) NZDep 3-4 NZDep 5-6 NZDep 7-8 NZDep 9-10
1480.6
3075.2
851.21180.1
1963.4
3605.7
1041.91303.0
2474.0
3499.1
1069.11498.6
3163.6
4075.2
1185.9
1799.9
4151.44351.4
1494.8
2363.0
0
500
1000
1500
2000
2500
3000
3500
4000
4500
5000
Māori Pacific Asian Non-MPA
Hosp
italis
atio
ns p
er 1
00,0
00 p
eopl
e
Ethnic group
NZDep 1-2 NZDep 3-4 NZDep 5-6 NZDep 7-8 NZDep 9-10

95
Figure 88. Total respiratory hospitalisations per 100,000 people by DHB, 2017.
(see Table A 111 for data)
6.7.2. TOTAL RESPIRATORY MORTALITY
New research
In 2014 Kessaram et al had estimated seasonal influenza to account for 10.6 deaths per 100,000 people over the period 1990 to 2008.32 Further modelling by Khieu et al increased that estimate to 13.5 per 100,000 over the period 1994 to 2008, with 1.8% of all New Zealand deaths attributable to seasonal influenza. Males were at greater risk than females (rate ratio 1.9); Māori and Pacific peoples had higher rates than non-MPA (rate ratios 3.6 and 2.4 respectively); and those in the most socioeconomically deprived areas (NZDep 9-10) had higher rates than those in the least deprived areas (NZDep 1-2) (rate ratio 1.8).33
Trends 2000 - 2015
Respiratory disease was the cause of 2922 deaths in 2015. There were 64.0 deaths per 100,000 people, which was not significantly different from the 65.6 deaths in 2000. Earlier
1713.31434.81476.51733.41224.61762.91989.91468.02352.21689.12069.91988.32181.51903.42492.32209.52046.21738.11716.82049.8
0 500 1000 1500 2000 2500 3000
SouthernSouth Canterbury
CanterburyWest Coast
Nelson MarlboroughWairarapa
HuttCapital and Coast
WhanganuiMidcentral
TaranakiHawkes Bay
TairawhitiBay of Plenty
LakesWaikato
Counties ManakauAuckland
WaitemataNorthland
Hospitalisations per 100,000 people
DHB

96
reports detected a trend of declining respiratory mortality rates, but the longer study period shows that while respiratory mortality rates were higher than average between 2001 and 2004, and there is a linear trend, there is no sign of further decline after 2004.
Figure 89. Total respiratory mortality rates 2000-2015, age-adjusted.
(See Table A 112 for data)
Risks and determinants 2010 - 2015
Over the period 2010 – 2015, mortality rates due to any respiratory disease were 36.2 times higher in people aged 65+ than in adults aged 30-64. Mortality rates were higher in males than females in people aged 15 to 29 years and over 65 years, but not significantly different in adults aged 30-64 and children younger than 15 years (Figure 90).
Respiratory mortality rates were highest in Māori, with a rate ratio to non-MPA of 1.73; and also higher for Pacific peoples (rate ratio 1.27). However, the rate for Asian peoples was nearly half that of non-MPA (rate ratio 0.52) (Figure 91).
Respiratory mortality rates also increased with increasing socio-economic deprivation. Rates for the most deprived quintile were had a rate ratio of 1.80 to rates for the least deprived quintile (Figure 93). The deprivation gradient was present for all ethnic groups, though less linear for Pacific peoples (Figure 94).
Total respiratory mortality rates were highest in the Tairawhiti and Lakes DHBs, and also significantly higher than the national average in seven other DHBs. Rates were lowest in Waitemata, Capital and Coast, and Auckland DHBs (Figure 95).
0
10
20
30
40
50
60
70
80
90
20002001
20022003
20042005
20062007
20082009
20102011
20122013
20142015
Deat
hs p
er 1
00,0
00 p
eopl
e pe
r yea
r
Year
95% CI Mortality rate

97
Figure 90. Total respiratory deaths per 100,000 people by age group and sex, 2010-2015.
(See Table A 113 and Table A 114 for data) Figure 91. Total respiratory mortality per 100,000 people per year by ethnic group, 2010-2015.
(See Table A 115 for data)
1.8 1.7 1.71.1 0.5 0.811.8 12.0 11.9
429.4383.5
404.6
0
50
100
150
200
250
300
350
400
450
500
Male rate Female rate Total rate
Deat
hs p
er 1
00,0
00 p
eopl
e pe
r yea
r
Population
<15 years 15-29 years 30-64 years 65+ years
107.0
78.6
31.9
61.7
0
20
40
60
80
100
120
Maori Pacific Asian non-MPA
Deat
hs p
er 1
00,0
00 p
eopl
e pe
r yea
r
Ethnic group

98
Figure 92. Total respiratory deaths per 100,000 people per year, by ethnic group and age group, 2010-2015.
(See Table A 116 for data) Figure 93. Total respiratory deaths per 100,000 people by NZDep2013 quintile, 2010-2015, age-adjusted.
(See Table A 117 for data)
2.9 4.4 0.9 0.81.8 1.7 0.4 0.429.1 13.3 2.2 10.4
525.5
386.2
146.8
413.3
0
100
200
300
400
500
600
Maori Pacific Asian non-MPA
Deat
hs p
er 1
00,0
00 p
eopl
e pe
r yea
r
Ethnic group
Under 15 15-29 30-64 65+
47.654.3
57.7
72.7
85.6
0
10
20
30
40
50
60
70
80
90
100
NZDep 1-2 3-4 5-6 7-8 9-10
Deat
hs p
er 1
00,0
00 p
eopl
e pe
r yea
r
NZDep2013 Quintile

99
Figure 94. Total respiratory deaths per 100,000 people by ethnic group and NZDep2013, 2010-2015, age-adjusted.
(See Table A 118 for data)
45.7
27.8 25.2
48.6
78.2 78.9
32.5
54.0
91.7
76.5
28.1
57.1
101.3
69.4
33.6
72.0
134.3
94.7
43.3
79.0
0
20
40
60
80
100
120
140
160
Maori Pacific Asian Non-MPA
Deat
hs p
er 1
00,0
00 p
eopl
e pe
r yea
r
Ethnic group
NZDep 1-2 NZDep 3-4 NZDep 5-6 NZDep 7-8 NZDep 9-10

100
Figure 95. Total respiratory deaths per 100,000 people per year, by DHB, 2010-2015, age-adjusted
(see Table A 119 for data)
6.8. COST SUMMARY
The total cost of respiratory (ICD-10 Chapter 10) deaths in 2015 was $5,200,546,556, from 29,549 life years lost.
The total cost of asthma (J45 and J46) deaths in 2015 was $247,982,240, from 1409 life years lost
The total cost of respiratory (ICD-10 Chapter 10) hospitalisations in 2015 was $333,505,940.
The total cost of asthma (J45 and J46) hospitalisations in 2015 was $17,077,337.
The total cost to New Zealand (whether paid by patients or the State) of respiratory prescriptions in 2015 was $82,474,632.
Combining public and private costs of doctors’ visits for any respiratory condition, we estimate a minimum total cost of $49,004,860.
69.264.065.270.759.963.969.056.675.765.365.163.983.164.882.066.261.457.155.370.8
0 20 40 60 80 100
SouthernSouth Canterbury
CanterburyWest Coast
Nelson MarlboroughWairarapa
HuttCapital and Coast
WhanganuiMidcentral
TaranakiHawkes Bay
TairawhitiBay of Plenty
LakesWaikato
Counties ManakauAuckland
WaitemataNorthland
Deaths per 100,000 people per year
DHB

101
The cost of doctors’ visits for asthma, for adults aged 15+ was estimated at $18,856,970, and the cost of prescriptions was estimated at $35,557,064. For children these estimates were $2,754,175 and $2,102,368 respectively.
Costs for work days lost, ED and OP visits and YLDs were calculated as outlined in the method section.
Therefore, across all costs, we estimate the minimum total cost of asthma and respiratory disease to the New Zealand economy to be:
Childhood (0-14) asthma Adult (15+) asthma Total asthma
Work days lost $39,347,086 $4,232,557 $43,579,643 Doctors’ visits: $2,754,175 $18,856,970 $21,611,144 Prescriptions: $2,102,368 $35,557,064 $37,659,432 ED and OP visits: $121,993,745 Hospitalisations: $7,360,497 $9,716,840 $17,077,337 YLDs $536,641,796 Mortality: $27,665,440 $220,316,800 $247,982,240 TOTAL: $78,297,057 $280,992,007 $1,017,924,605
All respiratory
Doctors’ visits: $49,004,860 Prescriptions: $82,474,632 Hospitalisations: $333,505,940 YLDs: $1,388,834,751 Mortality: $5,200,546,556 TOTAL: $7,054,366,739
These are minimum costs. They do not include the direct cost of emergency department visits for asthma, nor work days lost or emergency department and outpatient visits for total respiratory disease, nor the long term indirect costs of the impact of absences on schooling.
Since the last report, some costs have increased while others have decreased.
The cost of work-days lost due to adult asthma has decreased due to a refinement in the method. The cost of work days lost due to children’s asthma has increased substantially due to a calculation correction.
The cost of doctors’ visits attributed to asthma has decreased for children due to an overall reduction in prescription costs, a reduction is private doctors’ visits costs not yet adjusted

102
for in public costs in the method, and also a marked reduction in the proportion of prescriptions issued to children.
The cost of ED and OP visits has also increased due to a calculation correction.
The cost of asthma hospitalisations reduced because asthma hospitalisation numbers dropped between 2013 and 2015. The cost of child asthma mortality has decreased because two children died of asthma in 2015, compared to three children in 2013.

103
7. RECOMMENDATIONS
Recommendations have changed little since the previous report, though we note Counties Manukau no longer has the country’s highest rates for respiratory disease hospitalisation.
1. Urgent new and extended programmes are needed to reduce the severe ethnic and socio-economic inequalities in respiratory disease.
2. The high concentration of respiratory disease in Lakes DHB; in Māori and Pacific peoples; and in the most socio-economically deprived neighbourhoods, suggest that targeted programmes could be effective in reducing not only inequalities, but also overall rates of respiratory disease.
3. We again recommend research into the current national prevalence of obstructive sleep apnoea, in order to better estimate its impact on national health outcomes.

104
8. REFERENCES
1. Ministry of Health. Health loss in New Zealand: A report from the New Zealand burden of diseases, injuries and risk factors study, 2006-2016. Wellington: Ministry of Health, 2013.
2. Trying to Catch Our Breath – The Burden of Preventable Breathing Diseases in Children and Young People. In: Asher I, Byrnes C, eds. Wellington: The Asthma and Respiratory Foundation of New Zealand, 2006.
3. Holt S, Beasley R. The burden of asthma in New Zealand. Wellington: The Asthma and Respiratory Foundation of New Zealand, 2002.
4. Broad J, Jackson R. Chronic Obstructive Pulmonary Disease and Lung Cancer in New Zealand Wellington: The Asthma and Respiratory Foundation of New Zealand, 2003.
5. Telfar Barnard L, Baker M, Pierse N, et al. The impact of respiratory disease in New Zealand: 2014 update. Wellington: The Asthma Foundation, 2015.
6. Telfar Barnard L, Zhang J. The impact of respiratory disease in New Zealand: 2016 update. https://www.asthmafoundation.org.nz/research/the-impact-of-respiratory-disease-in-new-zealand-2016-update: Asthma and Respiratory Foundation NZ, 2016.
7. Swinbourne R, Gill N, Vaile J, et al. Prevalence of poor sleep quality, sleepiness and obstructive sleep apnoea risk factors in athletes. European journal of sport science 2016;16(7):850-8.
8. Ministry of Health. Health of older people in New Zealand: a statistical reference. Wellington: Ministry of Health, 2002:116.
9. Wilson N. The Cost Burden of Asthma in New Zealand: Asthma and Respiratory Foundation of New Zealand, 2000.
10. Haran C, Ruscoe C, Turner N, et al. Teh cost of GP visits for 6 - 17 year olds in New Zealand. Auckland, NZ: Child Poverty Action Group, 2014.
11. Asthma and COPD in New Zealand. The experience of a large primary care cohort prevalence, pharmaceutical management and health services utilisation. Draft report. New Zealand: CBG Health Research Limited, 2014.
12. Statistics New Zealand. New Zealand Period Life Tables: 2012-14 http://www.stats.govt.nz/browse_for_stats/health/life_expectancy/NZLifeTables_HOTP12-14.aspx2015 [
13. Telfar Barnard L, Preval N, Howden-Chapman P, et al. The impact of retrofitted insulation and new heaters on health services utilisation and costs, pharmaceutical costs and mortality. Wellington: Ministry of Economic Development, MED, 2011.
14. Annual report of Pharmaceutical Management Agency (Pharmac) for the year ended 30 June 2015. New Zealand: Pharmaceutical Management Agency (Pharmac), 2015.
15. McAvoy B, Davis P, Raymont A, et al. The Waikato Medical Care (WaiMedCa) Survey 1991-1992. New Zealand medical journal 1994(107 (pt 2)):399-433.

105
16. Taking the pulse: The 1996/97 New Zealand Health Survey. Wellington, New Zealand: Ministry of Health, 1999.
17. Free S, Howden-Chapman P, Pierse N, et al. More effective home heating reduces school absences for children with asthma. Journal of Epidemiology and Community Health 2010;64:379-86.
18. A picture of health. Wellington, NZ: Statistics New Zealand and Ministry of Health, 1993.
19. Ellison-Loschmann L, Pattemore PK, Asher MI, et al. Ethnic differences in time trends in asthma prevalence in New Zealand: ISAAC Phases I and III. International journal of tuberculosis and lung disease 2009;13(6):775-82.
20. Ellwood P, Asher MI, Billo NE, et al. The Global Asthma Network rationale and methods for Phase I global surveillance: prevalence, severity, management and risk factors. Eur Respir J 2017;49(1).
21. Diagnosing and managing asthma in children. Best Practice Journal 2012;42.
22. Twiss J, Metcalfe R, Edwards E, et al. New Zealand national incidence of bronchiectasis "too high" for a developed country. Archives of Disease in Childhood 2005;90(7):737-40.
23. Bibby S, Milne R, Beasley R. Hospital admissions for non-cystic fibrosis bronchiectasis in New Zealand. New Zealand medical journal 2015(Sep 4):30-38,5.
24. Schlapbach LJ, Straney L, Gelbart B, et al. Burden of disease and change in practice in critically ill infants with bronchiolitis. Eur Respir J 2017;49(6).
25. Shirtcliffe P, Weatherall M, Beasley R. From the authors. European Respiratory Journal 2008;31(1):218-19.
26. Shirtcliffe P, Weatherall M, Marsh S, et al. COPD prevalence in a random population survey: a matter of definition. The European respiratory journal 2007;30(2):232-39.
27. Milne RJ, Beasley R. Hospital admissions for chronic obstructive pulmonary disease in New Zealand. New Zealand medical journal 2015(Jan 30):23-35.
28. Dowell A, Darlow B, Macrae J, et al. Childhood respiratory illness presentation and service utilisation in primary care: a six-year cohort study in Wellington, New Zealand, using natural language processing (NLP) software. BMJ open 2017;7(7):e017146.
29. Priest P, McKenzie JE, Audas R, et al. Hand sanitiser provision for reducing illness absences in primary school children: a cluster randomised trial. PLoS medicine 2014;11(8):e1001700.
30. Lawton B, Stanley J, Filoche S, et al. Exploring the maternal and infant continuum - ethnic disparities in infant hospital admissions for respiratory disease. Aust N Z J Public Health 2016;40(5):430-35.
31. Tobacco Use 2012/13. New Zealand Health Survey. http://www.health.govt.nz/publication/tobacco-use-2012-13-new-zealand-health-survey: Ministry of Health, 2014.

106
32. Kessaram T, Stanley J, Baker MG. Estimating influenza-associated mortality in New Zealand from 1990 to 2008. Influenza and other respiratory viruses 2015;9(1):14-9.
33. Khieu TQT, Pierse N, Telfar-Barnard LF, et al. Modelled seasonal influenza mortality shows marked differences in risk by age, sex, ethnicity and socioeconomic position in New Zealand. The Journal of infection 2017;75(3):225-33.
34. Cohet C, Cheng S, MacDonald C, et al. Infections, medication use, and the prevalence of symptoms of asthma, rhinitis, and eczema in childhood. Journal of Epidemiology & Community Health 2004;58(10):852-57.
35. Bates MN, Garrett N, Crane J, et al. Associations of ambient hydrogen sulfide exposure with self-reported asthma and asthma symptoms. Environmental research 2013;122:81-87.
36. Crampton P, Davis P, Lay-Yee R, et al. Comparison of private for-profit with private community-governed not-for-profit primary care services in New Zealand. Journal of health services and research policy 2004;9 supp 2:17-22.
37. Douwes J, Travier N, Huang K, et al. Lifelong farm exposure may strongly reduce the risk of asthma in adults. Allergy 2007;62(10):1158-65.
38. Hansell A, Ghosh RE, Poole S, et al. Occupational risk factors for chronic respiratory disease in a New Zealand population using lifetime occupational history. Journal of Occupational and Environmental Medicine 2014;56(3).
39. Eng A, Mannetje AT, Douwes J, et al. The New Zealand workforce survey II: occupational risk factors for asthma. Annals of occupational hygiene 2010;54(2):154-64.
40. Eng A, Mannetje A, Pearce N, et al. Work-related stress and asthma: results from a workforce survey in New Zealand. Journal of asthma 2011;48(8):783-89.
41. Watson P, McDonald B. Subcutaneous body fat in pregnant New Zealand women: association with wheeze in their infants at 18 months. Maternal & child health journal 2013;17(5):959-67.

107
9. APPENDIX 1 DATA TABLES
9.1. ASTHMA
9.1.1. ASTHMA PREVALENCE
Table A 1. Age-standardised medicated asthma rates by age-group and sex, 2016/17
Population group
Total Male Female M vs F % 95% CI % 95% CI % 95% CI RR 95% CI
Total children <15 years 14.9 (13.6 - 16.3) 15.5 (13.6 - 17.7) 14.2 (12.5 - 16.1)
1.53 (1.27–1.86)
2–4 years 12.4 (10.2 - 15.1) 15.4 (12.2 - 19.3) 9.0 (6.4 - 12.7) 5–9 years 16.3 (13.7 - 19.2) 19.9 (16.3 - 24.1) 12.4 (9.5 - 16.1) 10–14 years 13.3 (11.1 - 15.8) 15.4 (12.3 – 19.0) 11.2 (8.5 - 14.6)
Total adults 12.0 (11.2 - 12.8) 9.9 (8.8 - 11.1) 14.0 (13.0 – 15.0) 0.71 (0.62–0.81)
15–24 years 11.2 (9.4 - 13.2) 9.4 (7.0 - 12.4) 13.1 (10.4 - 16.3) 25–34 years 11.5 (9.8 - 13.5) 10.3 (7.9 - 13.4) 12.7 (10.5 - 15.3) 35–44 years 11.8 (10.0 - 13.9) 8.9 (6.7 - 11.7) 14.5 (12.0 - 17.4) 45–54 years 11.6 (9.8 - 13.7) 9.2 (6.7 - 12.4) 13.8 (11.5 - 16.5) 55–64 years 13.9 (11.8 - 16.3) 12.8 (10.0 - 16.2) 14.9 (12.3 – 18.0) 65–74 years 11.8 (10.2 - 13.6) 8.9 (6.8 - 11.6) 14.5 (12.4 - 16.9) 75+ years 12.6 (10.6 – 15.0) 9.4 (6.8 - 12.7) 15.2 (12.4 - 18.6)
Table A 2. Medicated asthma prevalence by ethnic group 2016/17, children and adults
Population group Children Adults
% 95% CI RR* to rest of population
% 95% CI RR* to rest of population
Total 14.9 (13.6 - 16.3) 12.0 (11.2 - 12.8) Māori 17.8 (15.1 - 20.8) 1.36 (1.11–1.66) 16.4 (14.4 - 18.8) 1.48 (1.24–1.75)
Pacific 15.6 (12.6 - 19.3) 1.10 (0.86–1.41) 11.4 (9 - 14.4) 0.96 (0.75–1.23)
Asian 9.8 (7.3 - 13.2) 0.66 (0.48–0.91) 6.5 (4.9 - 8.7) 0.52 (0.39–0.69)
European/Other 14.8 (12.8 - 17) Not given 12.7 (11.8 - 13.7) Not given
*Rate ratios are age and sex adjusted. Rate ratios in bold are statistically significant (p<0.05) Table A 3. Child medicated asthma prevalence 2016/17 by NZDep2013, unadjusted
NZDep quintile Total Boys Girls
% 95% CI % 95% CI % 95% CI 1-2 11.7 (8.4 - 16) 17.8 (13.2 - 23.7) 5.4 (2.8 - 10.3) 3-4 13.2 (9.5 - 18.1) 16.3 (11.4 - 22.9) 9.4 (5.8 - 14.9) 5-6 13.7 (10.9 - 17.1) 16.4 (12.6 - 21.1) 10.9 (6.7 - 17) 7-8 15.4 (12.3 - 19.2) 17.8 (13.5 - 23.3) 13.2 (9.3 - 18.4) 9-10 17 (14.7 - 19.6) 17.6 (14.5 - 21.2) 16.4 (12.9 - 20.6) Age-adjusted rate ratio 9-10 vs 1-2
1.56 (1.03–2.35) 0.94 (0.59–1.51) 3.55 (1.86–6.81)

108
Table A 4. Adult medicated asthma prevalence 2016/17 by NZDep2013, unadjusted
NZDep quintile
Total Men Women % 95% CI % 95% CI % 95% CI
1-2 11.7 (9.7 - 14) 9.8 (7.1 - 13.4) 13.5 (11.2 - 16) 3-4 10.9 (9.5 - 12.6) 8.6 (6.5 - 11.3) 13.3 (11.1 - 15.7) 5-6 12.2 (10.8 - 13.8) 10.6 (8.7 - 12.9) 13.7 (11.8 - 15.8) 7-8 12.1 (10.4 - 14.1) 9.3 (7.2 - 11.8) 14.9 (12.5 - 17.5) 9-10 13.1 (11.5 - 14.8) 11.3 (9 - 14.1) 14.6 (12.7 - 16.6) Age and ethnicity adjusted rate ratio 9-10 vs 1-2
1.11 (0.85–1.45) 1.18 (0.75–1.85) 1.06 (0.80–1.41)
Table A 5. Children (aged 2-14) and adult (aged 15+) medicated asthma prevalence by DHB 2016/17
District Health Boards (DHB)
Unadjusted prevalence (2016/17)
Children Adults
% (95% CI) % (95% CI)
New Zealand 14.3 (12.8-16.0) 12.0 (11.2-12.8)
Northland 9.1 (5.3-15.4) 9.5 (7.0-12.8)
Waitemata 11.6 (7.4-17.8) 8.8 (7.0-11.1)
Auckland 10.4 (7.5-14.2) 11.1 (9.1-13.6)
Counties-Manukau 14.7 (10.6-20.0) 9.6 (7.6-12.1)
Waikato 13.9 (9.9-19.3) 12.8 (10.3-15.8)
Bay of Plenty 15.7 (10.2-23.5) 9.2 (6.7-12.6)
Tairawhiti 14.9 (8.5-24.8) 9.3 (5.8-14.6)
Lakes 15.2 (7.5-28.4) 13.7 (9.6-19.2)
Taranaki 21.5 (14.3-31.0) 10.4 (7.9-13.6)
Hawkes Bay 14.3 (9.2-21.6) 11 (9.1-13.3)
Whanganui 20.1 (11.6-32.5) 16.3 (13.4-19.8)
MidCentral 20.2 (14.1-28.1) 18.7 (14.3-24.0)
Capital and Coast 14 (8.4-22.5) 12.7 (9.9-16.2)
Hutt Valley 20.2 (13.8-28.5) 18.4 (15.1-22.2)
Wairarapa 15 (5.5-34.9) 14.2 (10.3-19.1)
Nelson-Marlborough 13.9 (8.7-21.4) 11.2 (9.4-13.4)
West Coast 21.2 (12.4-33.9) 14.8 (8.1-25.5)
Canterbury 12.9 (8.8-18.5) 13.1 (10.3-16.6)
South Canterbury 9.1 (3.5-21.8) 17.3 (12.9-22.7)
Southern 17.1 (11.3-25.1) 13.6 (10.9-17.0) Bold values were statistically significantly different from the NZ rate (p<0.05). Rates are unadjusted.
Data source: Ministry of Health New Zealand Health Survey 2016/17 data tables.

109
9.1.2. ASTHMA HOSPITALISATIONS
N.B. All rates are per 100,000 people Table A 6. Asthma hospitalisations, rates and age-adjusted rates 2000-2017.
Year n
Rate
raw age adj'd 95% CI
2000 7519 194.9 187.5 (183.2-191.7) 2001 8088 208.4 200.8 (196.4-205.3) 2002 7755 196.4 192.0 (187.7-196.3) 2003 8232 204.4 200.6 (196.2-204.9) 2004 8356 204.4 201.3 (197-205.7) 2005 8536 206.5 204.6 (200.3-209) 2006 8214 196.3 195.0 (190.8-199.2) 2007 7874 186.4 184.8 (180.7-188.9) 2008 8471 198.9 196.5 (192.3-200.7) 2009 9381 218.0 214.6 (210.2-218.9) 2010 9346 214.8 211.3 (207-215.6) 2011 8650 197.3 194.7 (190.6-198.8) 2012 8289 188.0 186.2 (182.2-190.2) 2013 7501 168.9 168.1 (164.3-171.9) 2014 7353 163.0 163.2 (159.4-166.9) 2015 7599 165.3 166.4 (162.7-170.2) 2016 7278 155.1 156.7 (153.1-160.3) 2017 7685 160.3 162.1 (158.4-165.7) Trend 2000 -2017
-2.24 (-3.54 - -0.94), p=0.002
Table A 7. 2017 asthma hospitalisation rates and rate ratios by age group and sex
Age (years)
Total Male Female M v F
n Rate 95% CI n Rate 95% CI N Rate 95% CI RR 95% CI
<15 3050 326.6 (315.1-338.2) 1750 365.3 (348.2-382.5) 1300 285.9 (270.3-301.4) 0.78 (0.76-0.81)
15-29 1326 128.2 (121.3-135.1) 368 69.3 (62.2-76.4) 958 190.4 (178.4-202.5) 2.75 (2.59-2.91)
30-64 2528 120.2 (115.5-124.9) 813 80.2 (74.7-85.7) 1715 157.5 (150-165) 1.96 (1.89-2.05)
65+ 781 108.0 (100.4-115.6) 229 68.0 (59.2-76.8) 552 142.9 (131-154.9) 2.10 (1.95-2.27)

110
Table A 8. 2017 asthma hospitalisation age group rate ratios by sex
Age (years)
Total Male Female
RR 95% CI RR 95% CI RR 95% CI
<15 2.72 (2.65-2.79) 4.56 (4.38-4.74) 1.82 (1.75-1.88) 15-29 1.07 (1.03-1.1) 0.86 (0.81-0.92) 1.21 (1.16-1.26) 30-64 1.00 Baseline 1.00 Baseline 1.00 Baseline 65+ 0.90 (0.86-0.93) 0.85 (0.79-0.91) 0.91 (0.87-0.95)
Table A 9. 2017 asthma hospitalisation rates and rate ratios by ethnic group.
Total Ethnicity
Rate
n Raw Age adj'd 95% CI RR 95%CI
Māori 2666 354.9 329.0 (315.1-342.9) 2.84 (2.76-2.91)
Pacific 1365 361.6 373.0 (349.2-396.9) 3.21 (3.1-3.33)
Asian 658 93.2 99.9 (91.7-108) 0.86 (0.82-0.9)
Non-MPA 3292 107.9 116.0 (112-120.1) 1.00 Baseline
Table A 10. Asthma hospitalisation rates and rate ratios by ethnic group 2000 - 2017.
Year
Māori Pacific Asian non-MPA
n Rate 95% CI n Rate 95% CI N Rate 95% CI n Rate 95% CI
2000 2180 320.7 (303.4-338.1) 984 332.1 (304.7-359.5) 252 100.8 (84.7-116.8) 4128 155.3 (150.5-160.0)
2001 2328 325.1 (308.7-341.5) 1248 392.2 (363.3-421.1) 356 141.7 (123.4-160.0) 4182 158.0 (153.2-162.8)
2002 2431 348.4 (331.2-365.6) 1246 434.5 (402.3-466.7) 336 111.9 (97.9-125.8) 3809 143.0 (138.5-147.6)
2003 2554 376.1 (357.2-395.1) 1474 449.2 (419.5-478.8) 407 129.1 (113.0-145.3) 3917 147.4 (142.8-152.1)
2004 2605 359.0 (342.2-375.8) 1535 443.6 (414.8-472.4) 459 134.6 (120.0-149.3) 3894 147.0 (142.4-151.7)
2005 2731 371.3 (353.8-388.7) 1527 422.2 (394.8-449.5) 529 150.8 (136.1-165.6) 3924 148.9 (144.2-153.6)
2006 2644 348.0 (332.2-363.9) 1516 438.0 (408.2-467.8) 555 151.5 (137.2-165.9) 3700 137.9 (133.4-142.4)
2007 2611 342.1 (326.6-357.7) 1615 459.8 (430.6-488.9) 527 132.8 (120.4-145.2) 3357 125.1 (120.9-129.4)
2008 2677 343.6 (328.0-359.1) 1732 470.4 (442.4-498.4) 632 157.6 (143.5-171.6) 3664 136.3 (131.8-140.7)
2009 3188 396.7 (381.0-412.3) 1863 484.9 (457.7-512.1) 707 167.0 (153.3-180.8) 3945 145.8 (141.2-150.4)
2010 3125 376.9 (361.4-392.4) 1777 467.9 (440.5-495.2) 757 174.7 (160.3-189.2) 4017 148.6 (144.0-153.3)
2011 2856 349.2 (333.9-364.5) 1720 463.1 (435.4-490.8) 761 170.8 (156.2-185.3) 3704 136.1 (131.6-140.5)
2012 2713 333.1 (318.8-347.5) 1627 411.5 (386.7-436.4) 725 159.9 (146.0-173.7) 3537 130.9 (126.6-135.3)
2013 2515 311.2 (297.4-324.9) 1494 385.4 (361.1-409.7) 729 150.8 (138.3-163.3) 3036 112.4 (108.3-116.4)
2014 2455 300.5 (287.0-314.0) 1392 369.7 (346.2-393.3) 630 119.4 (109.0-129.8) 3134 114.5 (110.4-118.5)
2015 2681 323.5 (309.8-337.3) 1380 365.8 (342.0-389.5) 659 119.2 (109.2-129.2) 3143 114.6 (110.5-118.7)
2016 2475 297.1 (284.1-310.1) 1364 355.3 (332.6-378.0) 658 106.3 (97.6-115.0) 3058 111.5 (107.5-115.5)
2017 2666 329.0 (315.1-342.9) 1365 373.0 (349.2-396.9) 658 99.9 (91.7-108.0) 3292 116.0 (112.0-120.1)

111
Table A 11. Asthma hospitalisation ethnic group rate ratios to non-MPA, 2000 – 2017.
Year
Māori Pacific Asian
RR 95% CI RR 95% CI RR 95% CI
2000 2.07 (2.00 - 2.13) 2.14 (2.05 - 2.23) 0.65 (0.60 - 0.70)
2001 2.06 (2.00 - 2.12) 2.48 (2.39 - 2.58) 0.90 (0.84 - 0.96)
2002 2.44 (2.37 - 2.51) 3.04 (2.92 - 3.16) 0.78 (0.73 - 0.83)
2003 2.55 (2.48 - 2.63) 3.05 (2.94 - 3.16) 0.88 (0.82 - 0.93)
2004 2.44 (2.38 - 2.51) 3.02 (2.91 - 3.13) 0.92 (0.87 - 0.97)
2005 2.49 (2.43 - 2.56) 2.83 (2.74 - 2.94) 1.01 (0.96 - 1.06)
2006 2.52 (2.46 - 2.59) 3.18 (3.06 - 3.29) 1.10 (1.05 - 1.15)
2007 2.73 (2.66 - 2.81) 3.67 (3.55 - 3.8) 1.06 (1.01 - 1.11)
2008 2.52 (2.45 - 2.59) 3.45 (3.34 - 3.57) 1.16 (1.10 - 1.21)
2009 2.72 (2.66 - 2.79) 3.33 (3.22 - 3.43) 1.15 (1.10 - 1.20)
2010 2.54 (2.47 - 2.6) 3.15 (3.05 - 3.25) 1.18 (1.13 - 1.23)
2011 2.57 (2.50 - 2.64) 3.40 (3.29 - 3.52) 1.26 (1.20 - 1.31)
2012 2.54 (2.48 - 2.61) 3.14 (3.04 - 3.25) 1.22 (1.17 - 1.28)
2013 2.77 (2.69 - 2.85) 3.43 (3.31 - 3.55) 1.34 (1.28 - 1.40)
2014 2.63 (2.55 - 2.70) 3.23 (3.12 - 3.35) 1.04 (1.00 - 1.09)
2015 2.82 (2.75 - 2.90) 3.19 (3.08 - 3.31) 1.04 (1.00 - 1.09)
2016 2.66 (2.59 - 2.74) 3.19 (3.08 - 3.30) 0.95 (0.91 - 1.00)
2017 2.84 (2.76 - 2.91) 3.21 (3.10 - 3.33) 0.86 (0.82 - 0.90)
Table A 12. 2017 asthma hospitalisation rates by ethnic group and age.
Age (years)
Māori Pacific Asian non-MPA
n Rate 95% CI n Rate 95% CI N Rate 95% CI n Rate 95% CI
<15 1196 487.6 (459.9-515.2) 607 481.4 (443.1-519.7) 318 229.1 (203.9-254.3) 1118 236.7 (222.8-250.5)
15-29 537 275.8 (252.4-299.1) 241 232.0 (202.7-261.3) 88 47.7 (37.8-57.7) 531 91.7 (83.9-99.5)
30-64 823 310.3 (289.1-331.5) 407 319.2 (288.2-350.2) 182 55.2 (47.2-63.2) 1150 82.4 (77.6-87.1)
65+ 110 239.0 (194.4-283.7) 110 550.5 (447.6-653.4) 70 131.3 (100.5-162) 493 81.5 (74.3-88.7)
Table A 13. 2017 asthma hospitalisation rates by NZDep2013 quintile.
NZDep quintile n
Rate
RR 95% CI raw age adj'd 95% CI
1-2 867 93.5 97.6 (91.1-104.2) 1.00 Baseline
3-4 969 108.0 111.0 (104.0-118.1) 1.14 (1.09-1.19)
5-6 1200 129.7 133.5 (125.9-141.1) 1.37 (1.31-1.43)
7-8 1818 183.9 186.8 (178.2-195.5) 1.91 (1.84-1.99)
9-10 2825 267.8 263.6 (253.8-273.5) 2.70 (2.60-2.80)

112
Table A 14. Asthma hospitalisation rates by NZDep2013 quintile 2000 - 2017.
NZDep 1-2 NZDep 3-4 NZDep 5-6 NZDep 7-8 NZDep 9-10
Year n Rate 95% CI n Rate 95% CI n Rate 95% CI n Rate 95% CI n Rate 95% CI
2000 752 116.4 (107.9-124.8) 1032 150.4 (141.1-159.6) 1212 155.9 (147.0-164.7) 1837 212.9 (203.1-222.8) 2665 265.0 (254.6-275.5)
2001 842 130.6 (121.6-139.5) 1105 159.8 (150.3-169.3) 1250 159.8 (150.9-168.7) 1897 218.9 (208.9-228.8) 2912 290.6 (279.8-301.5)
2002 746 112.5 (104.4-120.7) 968 138.0 (129.3-146.8) 1336 169.6 (160.5-178.8) 1760 205.5 (195.8-215.1) 2935 295.0 (284.0-306.0)
2003 805 119.1 (110.8-127.5) 988 138.5 (129.8-147.2) 1341 168.8 (159.7-177.9) 1889 217.0 (207.1-226.8) 3172 314.3 (303.1-325.5)
2004 773 111.2 (103.3-119.2) 961 133.0 (124.5-141.5) 1373 173.2 (164.0-182.4) 1882 214.9 (205.1-224.6) 3360 328.2 (316.9-339.6)
2005 827 117.3 (109.2-125.3) 972 131.6 (123.3-139.9) 1385 175.6 (166.3-184.9) 2031 231.5 (221.4-241.6) 3305 320.6 (309.5-331.8)
2006 797 110.2 (102.5-117.9) 964 128.8 (120.6-136.9) 1233 153.4 (144.8-162.0) 1930 220.1 (210.3-230.0) 3283 319.2 (308.1-330.3)
2007 733 99.5 (92.2-106.7) 832 110.0 (102.5-117.5) 1143 141.2 (133.0-149.4) 1918 215.9 (206.2-225.6) 3241 315.6 (304.5-326.6)
2008 820 109.5 (101.9-117.0) 982 127.6 (119.6-135.7) 1324 162.0 (153.2-170.7) 1935 215.3 (205.6-224.9) 3386 327.8 (316.6-339.0)
2009 876 114.4 (106.8-122.0) 1098 140.0 (131.7-148.4) 1545 186.7 (177.3-196.0) 2138 235.0 (225.0-245.0) 3718 355.0 (343.4-366.6)
2010 940 120.3 (112.5-128.0) 1129 142.6 (134.2-150.9) 1543 184.3 (175.1-193.5) 2226 242.5 (232.4-252.6) 3504 333.0 (321.8-344.2)
2011 859 108.6 (101.3-115.9) 1058 131.8 (123.8-139.7) 1425 169.7 (160.9-178.5) 2019 219.5 (209.9-229.1) 3282 315.6 (304.7-326.6)
2012 835 103.1 (96.1-110.2) 1051 130.6 (122.7-138.5) 1310 155.9 (147.5-164.4) 1959 212.5 (203.1-222.0) 3133 302.2 (291.4-312.9)
2013 780 95.9 (89.1-102.6) 904 111.3 (104.0-118.6) 1181 140.1 (132.1-148.1) 1728 188.6 (179.7-197.5) 2900 281.2 (270.8-291.5)
2014 703 84.5 (78.2-90.8) 895 109.2 (102.0-116.3) 1171 137.2 (129.4-145.1) 1774 192.7 (183.7-201.7) 2805 268.9 (258.8-278.9)
2015 750 88.0 (81.6-94.3) 883 106.1 (99.1-113.1) 1144 132.9 (125.2-140.6) 1892 202.3 (193.1-211.5) 2911 276.4 (266.2-286.6)
2016 780 89.8 (83.5-96.2) 862 102.8 (95.9-109.7) 1046 119.5 (112.2-126.7) 1815 189.9 (181.1-198.7) 2774 259.4 (249.6-269.2)
2017 867 97.6 (91.1-104.2) 969 111.0 (104.0-118.1) 1200 133.5 (125.9-141.1) 1818 186.8 (178.2-195.5) 2825 263.6 (253.8-273.5)
Table A 15. Asthma hospitalisation rates relative to NZDep 1-2 by NZDep2013 quintile 2000 - 2017.
Year
NZDep 3-4 NZDep 5-6 NZDep 7-8 NZDep 9-10
RR 95% CI RR 95% CI RR 95% CI RR 95% CI
2000 1.29 (1.23 - 1.35) 1.34 (1.28 - 1.40) 1.83 (1.76 - 1.91) 2.28 (2.19 - 2.37)
2001 1.22 (1.17 - 1.28) 1.22 (1.17 - 1.28) 1.68 (1.61 - 1.74) 2.23 (2.14 - 2.31)
2002 1.23 (1.17 - 1.29) 1.51 (1.44 - 1.58) 1.83 (1.75 - 1.90) 2.62 (2.52 - 2.73)
2003 1.16 (1.11 - 1.22) 1.42 (1.36 - 1.48) 1.82 (1.75 - 1.90) 2.64 (2.54 - 2.74)
2004 1.20 (1.14 - 1.25) 1.56 (1.49 - 1.63) 1.93 (1.85 - 2.01) 2.95 (2.84 - 3.07)
2005 1.12 (1.07 - 1.17) 1.50 (1.44 - 1.56) 1.97 (1.90 - 2.05) 2.73 (2.63 - 2.84)
2006 1.17 (1.12 - 1.22) 1.39 (1.33 - 1.45) 2.00 (1.92 - 2.08) 2.90 (2.79 - 3.01)
2007 1.11 (1.05 - 1.16) 1.42 (1.36 - 1.48) 2.17 (2.08 - 2.26) 3.17 (3.05 - 3.30)
2008 1.17 (1.11 - 1.22) 1.48 (1.42 - 1.54) 1.97 (1.89 - 2.05) 2.99 (2.89 - 3.11)
2009 1.22 (1.17 - 1.28) 1.63 (1.57 - 1.70) 2.05 (1.98 - 2.13) 3.10 (2.99 - 3.22)
2010 1.19 (1.14 - 1.24) 1.53 (1.47 - 1.59) 2.02 (1.94 - 2.09) 2.77 (2.67 - 2.87)
2011 1.21 (1.16 - 1.27) 1.56 (1.50 - 1.63) 2.02 (1.94 - 2.10) 2.91 (2.80 - 3.02)
2012 1.27 (1.21 - 1.32) 1.51 (1.45 - 1.58) 2.06 (1.98 - 2.14) 2.93 (2.82 - 3.04)
2013 1.16 (1.11 - 1.22) 1.46 (1.40 - 1.53) 1.97 (1.89 - 2.05) 2.93 (2.82 - 3.05)
2014 1.29 (1.23 - 1.36) 1.62 (1.55 - 1.70) 2.28 (2.19 - 2.38) 3.18 (3.06 - 3.31)
2015 1.21 (1.15 - 1.26) 1.51 (1.44 - 1.58) 2.30 (2.21 - 2.40) 3.14 (3.02 - 3.27)
2016 1.14 (1.09 - 1.20) 1.33 (1.27 - 1.39) 2.11 (2.03 - 2.20) 2.89 (2.78 – 3.00)
2017 1.14 (1.09 - 1.19) 1.37 (1.31 - 1.43) 1.91 (1.84 - 1.99) 2.70 (2.60 - 2.80)

113
Table A 16. 2017 asthma hospitalisation rates by ethnic group and NZDep2013 quintile.
Ethnic group
NZDep quintile
1-2 3-4 5-6 7-8 9-10
Māori
Hosp_Num 121 226 342 692 1282
Rate (raw) 179.0 258.8 291.1 393.3 423.5
Rate (age adj'd) 154.0 228.0 276.0 366.1 397.4
95%CI (125.0-183.0) (196.2-259.9) (244.2-307.8) (335.1-397.1) (372.8-422.1)
Pacific
Hosp_Num 54 85 152 322 749
Rate (raw) 278.4 281.3 378.7 425.1 357.4
Rate (age adj'd) 274.4 262.6 382.2 444.1 382.3
95%CI (193.2-355.6) (189.8-335.5) (314.4-450.1) (382.1-506.2) (348.3-416.3)
Asian
Hosp_Num 77 121 111 147 202
Rate (raw) 63.5 82.6 83.5 103.5 125.1
Rate (age adj'd) 61.2 92.9 91.2 114.2 140.6
95%CI (47.4-75.1) (74.8-111.0) (73.1-109.2) (94.3-134.1) (119.7-161.6)
NZ European/ Other
Hosp_Num 632 556 628 750 726
Rate (raw) 85.4 84.3 97.4 122.0 185.4
Rate (age adj'd) 89.6 89.2 105.8 135.3 208.4
95%CI (82.5-96.7) (81.6-96.7) (97.3-114.3) (125.2-145.3) (192.5-224.2)
Table A 17. 2017 asthma hospitalisation rates by DHB.
DHB n Rate
raw) age adj’d 95%CI Northland 276 157.4 161.4 (142.1-180.8) Waitemata 887 146.4 145.3 (135.7-154.9) Auckland 802 153.2 169.3 (157.3-181.3) Counties Manukau 927 169.6 168.1 (157.1-179.0) Waikato 892 218.2 216.4 (202.1-230.6) Lakes 275 253.4 251.5 (221.6-281.3) Bay of Plenty 432 186.2 189.2 (171.1-207.2) Tairawhiti 122 251.5 235.4 (193.2-277.6) Hawkes Bay 312 190.3 190.6 (169.3-211.9) Taranaki 250 211.6 213.2 (186.6-239.8) MidCentral 253 143.3 143.6 (125.8-161.5) Whanganui 161 251.3 251.3 (212.0-290.6) Capital and Coast 420 134.3 138.9 (125.5-152.4) Hutt 340 229.8 229.9 (205.4-254.4) Wairarapa 78 175.2 186.7 (144.4-228.9) Nelson Marlborough 129 86.7 91.5 (75.4-107.6) West Coast 45 138.6 145.9 (102.4-189.3) Canterbury 638 115.7 120.3 (110.9-129.7) South Canterbury 42 70.6 72.1 (49.8-94.3) Southern 404 124.6 130.6 (117.7-143.4)

114
9.1.3. ASTHMA MORTALITY
Table A 18. Asthma mortality rates and age-adjusted rates 2000-2013.
Year n Rate
raw age adj'd 95% CI 2000 72 1.87 2.15 (1.65 - 2.66) 2001 71 1.83 2.10 (1.60 - 2.59) 2002 76 1.92 2.16 (1.67 - 2.65) 2003 76 1.89 2.18 (1.68 - 2.67) 2004 70 1.71 1.91 (1.46 - 2.36) 2005 61 1.48 1.64 (1.23 - 2.06) 2006 78 1.86 2.03 (1.58 - 2.49) 2007 64 1.52 1.64 (1.23 - 2.04) 2008 62 1.46 1.55 (1.16 - 1.93) 2009 55 1.28 1.34 (0.98 - 1.69) 2010 56 1.29 1.35 (0.99 - 1.70) 2011 70 1.60 1.65 (1.27 - 2.04) 2012 64 1.45 1.49 (1.13 - 1.86) 2013 71 1.60 1.63 (1.25 - 2.00) 2014 91 2.02 2.04 (1.62 - 2.46) 2015 87 1.89 1.90 (1.50 - 2.30) Trend 2000 -2015
-0.03 (-0.06 - -0.02), p=0.037
Table A 19. Asthma mortality rates and rate ratios by age group and sex, 2010-2015.
Age (years)
Total Male Female M v F n Rate 95% CI n Rate 95% CI n Rate 95% CI RR 95% CI
<15 15 0.3 (0.1-0.4) 6 0.2 (0.0-0.4) 9 0.3 (0.1-0.6) 1.58 (0.96-2.60) 15-29 20 0.4 (0.2-0.5) 11 0.4 (0.2-0.6) 9 0.3 (0.1-0.5) 0.83 (0.54-1.27) 30-64 102 0.8 (0.7-1.0) 29 0.5 (0.3-0.7) 73 1.2 (0.9-1.4) 2.34 (1.90-2.88) 65+ 302 8.2 (7.2-9.1) 99 5.8 (4.7-7.0) 203 10.2 (8.8-11.6) 1.75 (1.55-1.96)
Table A 20. Asthma mortality rate ratios by age group and sex, 2010-2015.
Age (years)
Total Male Female RR 95% CI RR 95% CI RR 95% CI
<15 0.32 (0.25-0.42) 0.43 (0.28-0.66) 0.29 (0.21-0.4) 15-29 0.43 (0.34-0.54) 0.80 (0.57-1.11) 0.28 (0.2-0.4) 30-64 1.00 Baseline 1.00 Baseline 1.00 Baseline 65+ 9.64 (8.65-10.75) 11.64 (9.52-14.23) 8.69 (7.64-9.9)
Table A 21. Asthma mortality rates and rate ratios by ethnic group, 2010-2015.
Total Ethnicity
Rate n Raw Age adj'd 95% CI RR 95%CI
Māori 111 2.7 5.2 (4.1-6.4) 4.26 (3.77-4.82) Pacific 35 1.7 3.9 (2.4-5.4) 3.20 (2.63-3.89) Asian 21 0.7 1.5 (0.7-2.2) 1.21 (0.94-1.55) Non-MPA 274 1.5 1.2 (1.1-1.4) 1.00 Baseline
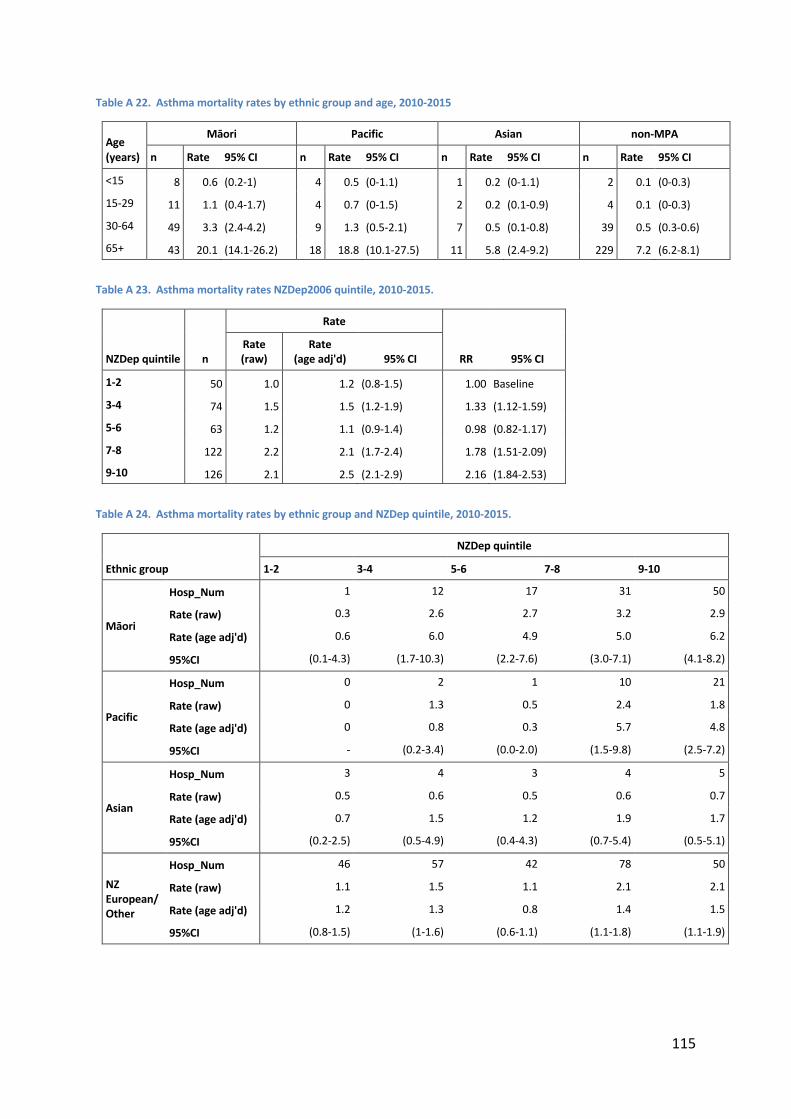
115
Table A 22. Asthma mortality rates by ethnic group and age, 2010-2015
Age (years)
Māori Pacific Asian non-MPA
n Rate 95% CI n Rate 95% CI n Rate 95% CI n Rate 95% CI
<15 8 0.6 (0.2-1) 4 0.5 (0-1.1) 1 0.2 (0-1.1) 2 0.1 (0-0.3)
15-29 11 1.1 (0.4-1.7) 4 0.7 (0-1.5) 2 0.2 (0.1-0.9) 4 0.1 (0-0.3)
30-64 49 3.3 (2.4-4.2) 9 1.3 (0.5-2.1) 7 0.5 (0.1-0.8) 39 0.5 (0.3-0.6)
65+ 43 20.1 (14.1-26.2) 18 18.8 (10.1-27.5) 11 5.8 (2.4-9.2) 229 7.2 (6.2-8.1)
Table A 23. Asthma mortality rates NZDep2006 quintile, 2010-2015.
NZDep quintile n
Rate
RR 95% CI Rate (raw)
Rate (age adj'd) 95% CI
1-2 50 1.0 1.2 (0.8-1.5) 1.00 Baseline
3-4 74 1.5 1.5 (1.2-1.9) 1.33 (1.12-1.59)
5-6 63 1.2 1.1 (0.9-1.4) 0.98 (0.82-1.17)
7-8 122 2.2 2.1 (1.7-2.4) 1.78 (1.51-2.09)
9-10 126 2.1 2.5 (2.1-2.9) 2.16 (1.84-2.53)
Table A 24. Asthma mortality rates by ethnic group and NZDep quintile, 2010-2015.
Ethnic group
NZDep quintile
1-2 3-4 5-6 7-8 9-10
Māori
Hosp_Num 1 12 17 31 50
Rate (raw) 0.3 2.6 2.7 3.2 2.9
Rate (age adj'd) 0.6 6.0 4.9 5.0 6.2
95%CI (0.1-4.3) (1.7-10.3) (2.2-7.6) (3.0-7.1) (4.1-8.2)
Pacific
Hosp_Num 0 2 1 10 21
Rate (raw) 0 1.3 0.5 2.4 1.8
Rate (age adj'd) 0 0.8 0.3 5.7 4.8
95%CI - (0.2-3.4) (0.0-2.0) (1.5-9.8) (2.5-7.2)
Asian
Hosp_Num 3 4 3 4 5
Rate (raw) 0.5 0.6 0.5 0.6 0.7
Rate (age adj'd) 0.7 1.5 1.2 1.9 1.7
95%CI (0.2-2.5) (0.5-4.9) (0.4-4.3) (0.7-5.4) (0.5-5.1)
NZ European/ Other
Hosp_Num 46 57 42 78 50
Rate (raw) 1.1 1.5 1.1 2.1 2.1
Rate (age adj'd) 1.2 1.3 0.8 1.4 1.5
95%CI (0.8-1.5) (1-1.6) (0.6-1.1) (1.1-1.8) (1.1-1.9)

116
Table A 25. Asthma mortality rates by DHB, 2010-2015.
DHB n Rate
raw age adj’d 95%CI Northland 25 2.54 2.38 (1.43-3.32) Waitemata 48 1.45 1.62 (1.16-2.08) Auckland 31 1.12 1.41 (0.91-1.91) Counties Manukau 47 1.58 2.00 (1.42-2.59) Waikato 34 1.50 1.51 (1.00-2.02) Lakes 13 2.10 2.20 (1.00-3.39) Bay of Plenty 20 1.55 1.36 (0.76-1.96) Tairawhiti 5 1.77 1.91 (0.24-3.59) Hawkes Bay 14 1.48 1.32 (0.63-2.02) Taranaki 11 1.62 1.47 (0.60-2.35) MidCentral 32 3.16 2.89 (1.89-3.89) Whanganui 6 1.60 1.34 (0.27-2.41) Capital and Coast 19 1.08 1.26 (0.69-1.83) Hutt 19 2.21 2.37 (1.3-3.44) Wairarapa 3 1.18 0.96 (0.31-2.97) Nelson Marlborough 16 1.88 1.58 (0.80-2.37) West Coast 1 0.51 0.42 (0.06-2.97) Canterbury 59 1.93 1.84 (1.37-2.31) South Canterbury 3 0.87 0.59 (0.19-1.82) Southern 27 1.47 1.38 (0.86-1.90)
9.2. BRONCHIECTASIS
9.2.1. SEVERE BRONCHIECTASIS PREVALENCE
Table A 26. 2017 severe bronchiectasis prevalence numbers, rates and rate ratios by age group and sex
Age (years)
Total Male Female M v F
n Rate n Rate n Rate RR 95% CI
<15 712 76.3 403 84.2 309 68.0 0.81 (0.70-0.94)
15-29 749 72.2 372 69.5 377 75.2 1.08 (0.94-1.25)
30-64 2447 116.4 1072 105.7 1375 126.4 1.20 (1.10-1.30)
65+ 4458 617.1 1669 515.8 2789 705.9 1.37 (1.29-1.46)
Total 8366 174.5 3718 635.4 5088 477.8 1.23 (1.18-1.29)
Table A 27. 2017 severe bronchiectasis prevalence age group rate ratios total and by sex.
Age (years)
Total Male Female
RR 95% CI RR 95% CI RR 95% CI
<15 0.66 (0.60-0.71) 0.80 (0.71-0.89) 0.54 (0.48-0.61)
15-29 0.62 (0.57-0.67) 0.66 (0.58-0.74) 0.59 (0.53-0.67)
30-64 1.00 Baseline 1.00 Baseline 1.00 Baseline
65+ 5.30 (5.04-5.57) 4.69 (4.35-5.07) 5.71 (5.36-6.10)

117
Table A 28. 2017 severe bronchiectasis prevalence rates and rate ratios by ethnic group.
Total Ethnicity
Rate
n Raw Age adj'd 95% CI RR 95%CI
Māori 1987 264.5 420.1 (398.9-441.4) 3.75 (3.55-3.96))
Pacific 1561 413.6 789.5 (742.2-836.7) 6.30 (5.93-6.70)
Asian 529 74.9 135.3 (122.4-148.3) 0.97 (0.88-1.06)
Non-MPA 4444 145.6 119.3 (114.7-122.8) 1.00 Baseline
Table A 29. 2017 severe bronchiectasis prevalence rates by NZDep2013 quintile.
NZDep quintile n
Rate
RR 95% CI raw age adj'd 95% CI
1-2 977 103.8 108.2 (101.4-115.1) 1.00 Baseline
3-4 988 108.0 106.4 (99.8-113.1) 1.01 (0.93-1.11)
5-6 1,313 142.1 132.8 (125.6-140.0) 1.28 (1.17-1.39)
7-8 1,672 168.7 163.6 (155.8-171.5) 1.55 (1.43-1.68)
9-10 2,973 291.1 321.2 (309.6-332.8) 3.09 (2.87-3.32)
Table A 30. 2017 severe bronchiectasis prevalence rates by DHB.
DHB n
Rate
raw age adj’d 95%CI
Northland 337 192.1 172.2 (153.5-190.8)
Waitemata 872 143.9 152.2 (142.1-162.3)
Auckland 1,036 197.9 242.6 (227.7-257.5)
Counties Manukau 1,508 275.9 324.1 (307.5-340.7)
Waikato 739 180.8 178.9 (166.0-191.8)
Lakes 182 167.7 166.9 (142.6-191.2)
Bay of Plenty 546 235.4 202.2 (185.1-219.4)
Tairawhiti 94 193.7 195.7 (155.8-235.5)
Hawkes Bay 249 151.9 142.5 (124.5-160.5)
Taranaki 130 110.1 104.5 (86.3-122.6)
MidCentral 167 94.6 87.3 (74.0-100.5)
Whanganui 84 131.2 110.2 (86.4-134.0)
Capital and Coast 307 98.2 106.0 (94.1-117.9)
Hutt 234 158.2 161.6 (140.9-182.2)
Wairarapa 56 125.8 107.8 (78.7-136.9)
Nelson Marlborough 144 96.8 81.0 (67.4-94.7)
West Coast 42 129.5 115.7 (80.1-151.2)
Canterbury 735 133.3 129.8 (120.4-139.2)
South Canterbury 48 80.7 65.2 (46.1-84.3)
Southern 413 127.4 119.1 (107.6-130.6)

118
9.2.2. BRONCHIECTASIS HOSPITALISATIONS
N.B. All rates are per 100,000 people Table A 31. Bronchiectasis hospitalisations, rates and age-adjusted rates 2000-2017.
Year n Rate
Raw (age adj'd) 95% CI 2000 719 18.6 20.9 (19.3 - 22.4) 2001 791 20.4 22.5 (20.9 - 24.1) 2002 782 19.8 21.6 (20.1 - 23.2) 2003 758 18.8 20.5 (19.0 - 21.9) 2004 862 21.1 22.9 (21.3 - 24.4) 2005 825 20.0 21.6 (20.1 - 23.1) 2006 912 21.8 23.4 (21.9 - 24.9) 2007 938 22.2 23.6 (22.0 - 25.1) 2008 935 21.9 23.2 (21.7 - 24.6) 2009 1001 23.3 24.5 (22.9 – 26.0) 2010 1035 23.8 24.9 (23.4 - 26.4) 2011 1161 26.5 27.4 (25.9 – 29.0) 2012 1055 23.9 24.4 (22.9 - 25.9) 2013 1197 26.9 27.2 (25.7 - 28.8) 2014 1243 27.6 27.7 (26.1 - 29.2) 2015 1372 29.9 29.9 (28.3 - 31.5) 2016 1288 27.4 27.2 (25.7 - 28.7) 2017 1493 31.1 31.0 (29.4 - 32.6) Trend 2000 -2017
0.53 (0.41 - 0.65), p<0.001
Table A 32. Bronchiectasis hospitalisation rates and rate ratios by age group, 2000 - 2017
Year
<15 years 15-29 years 30 – 64 years 65+ years
n Rate 95% CI n Rate 95% CI n Rate 95% CI n Rate 95% CI 2000 71 8.1 (6.2 – 10.0) 46 5.8 (4.1 - 7.4) 369 21.3 (19.2 - 23.5) 233 51.4 (44.8 – 58.0) 2001 132 15.0 (12.5 - 17.6) 52 6.6 (4.8 - 8.4) 365 20.8 (18.7 – 23.0) 242 52.5 (45.9 - 59.2) 2002 143 16.2 (13.5 - 18.8) 49 6.1 (4.4 - 7.8) 330 18.4 (16.4 - 20.4) 260 55.6 (48.9 - 62.4) 2003 138 15.5 (12.9 - 18.1) 46 5.6 (4.0 - 7.2) 299 16.3 (14.4 - 18.1) 275 57.8 (51.0 - 64.7) 2004 141 15.8 (13.2 - 18.4) 47 5.6 (4.0 - 7.2) 368 19.7 (17.7 - 21.7) 306 63.1 (56.1 - 70.2) 2005 175 19.7 (16.7 - 22.6) 50 5.9 (4.3 - 7.5) 303 16.0 (14.2 - 17.8) 297 59.8 (53.0 - 66.6) 2006 150 16.9 (14.2 - 19.6) 46 5.3 (3.8 - 6.9) 324 16.9 (15.0 - 18.7) 392 76.6 (69.0 - 84.2) 2007 166 18.6 (15.8 - 21.5) 52 6.0 (4.4 - 7.6) 320 16.5 (14.7 - 18.3) 400 76.1 (68.7 - 83.6) 2008 161 18.0 (15.2 - 20.8) 58 6.6 (4.9 - 8.3) 326 16.7 (14.9 - 18.5) 390 72.9 (65.7 - 80.1) 2009 152 16.9 (14.2 - 19.5) 69 7.8 (6.0 - 9.7) 353 17.9 (16.0 - 19.8) 427 77.9 (70.5 - 85.3) 2010 135 14.9 (12.4 - 17.4) 53 5.9 (4.3 - 7.5) 378 19.0 (17.1 - 20.9) 469 83.2 (75.7 - 90.8) 2011 161 17.7 (14.9 - 20.4) 69 7.7 (5.9 - 9.5) 386 19.3 (17.4 - 21.3) 545 94.0 (86.1 - 101.8) 2012 169 18.6 (15.8 - 21.4) 54 6.0 (4.4 - 7.6) 308 15.4 (13.7 - 17.1) 524 86.9 (79.5 - 94.3) 2013 191 21.0 (18.0 – 24.0) 72 8.0 (6.1 - 9.8) 318 15.9 (14.1 - 17.6) 616 98.4 (90.6 - 106.2) 2014 241 26.5 (23.1 - 29.8) 69 7.4 (5.7 - 9.2) 318 15.8 (14.0 - 17.5) 615 94.6 (87.1 – 102.0) 2015 296 32.4 (28.7 - 36.1) 64 6.6 (5.0 - 8.2) 329 16.1 (14.4 - 17.9) 683 101.3 (93.7 - 108.9) 2016 254 27.6 (24.2 - 30.9) 92 9.2 (7.3 - 11) 260 12.6 (11.0 - 14.1) 682 97.7 (90.3 - 105) 2017 319 34.2 (30.4 - 37.9) 76 7.3 (5.7 – 9.0) 341 16.2 (14.5 - 17.9) 757 104.7 (97.2 - 112.1)

119
Table A 33. 2017 bronchiectasis hospitalisation rates and rate ratios by age group and sex
Age (years)
Total Male Female M v F
n Rate 95% CI n Rate 95% CI n Rate 95% CI RR 95% CI
<15 319 34.2 (30.4-37.9) 178 37.2 (31.7-42.6) 141 31.0 (25.9-36.1) 0.83 (0.75-0.93)
15-29 76 7.3 (5.7-9.0) 31 5.8 (3.8-7.9) 45 8.9 (6.3-11.6) 1.53 (1.23-1.91)
30-64 341 16.2 (14.5-17.9) 159 15.7 (13.2-18.1) 182 16.7 (14.3-19.1) 1.07 (0.96-1.18)
65+ 757 104.7 (97.2-112.1) 223 66.2 (57.5-74.9) 534 138.3 (126.6-150.0) 2.09 (1.94-2.25)
Table A 34. 2017 bronchiectasis hospitalisation age group rate ratios by sex
Age (years)
Total Male Female RR 95% CI RR 95% CI RR 95% CI
<15 2.11 (1.96-2.27) 2.37 (2.14-2.63) 1.86 (1.67-2.06) 15-29 0.45 (0.40-0.51) 0.37 (0.31-0.45) 0.54 (0.46-0.63) 30-64 1.00 Baseline 1.00 Baseline 1.00 Baseline 65+ 6.46 (6.07-6.87) 4.22 (3.82-4.66) 8.27 (7.63-8.98)
Table A 35. 2017 bronchiectasis hospitalisation rates and rate ratios by ethnic group.
Total Ethnicity
Rate
n Raw Age adj'd 95% CI RR 95%CI
Māori 413 55.0 76.3 (67.4-85.2) 3.75 (3.51-4.01)
Pacific 275 72.9 126.6 (108.1-145.1) 6.23 (5.75-6.74)
Asian 74 10.5 18.7 (14.0-23.5) 0.92 (0.81-1.05)
Non-MPA 747 24.5 20.3 (18.8-21.8) 1.00 Baseline
Table A 36. Bronchiectasis hospitalisation rates by ethnic group 2000 - 2017.
Year
Māori Pacific Asian non-MPA
n Rate 95% CI n Rate 95% CI n Rate 95% CI n Rate 95% CI 2000 198 65.5 (53.8-77.2) 135 105.0 (82.9-127.1) 18 20.5 (8.7-32.4) 369 13.2 (11.9-14.6) 2001 212 62.2 (51.0-73.5) 175 126.2 (102.3-150.0) 23 17.1 (9.4-24.7) 391 14.1 (12.7-15.5) 2002 236 67.3 (56.6-77.9) 184 123.0 (100.2-145.9) 26 19.3 (9.7-28.9) 333 11.8 (10.5-13.0) 2003 231 63.8 (52.8-74.9) 183 129.6 (104.1-155.1) 22 14.1 (6.6-21.6) 325 11.1 (9.9-12.3) 2004 268 79.8 (66.7-92.8) 197 133.4 (108.1-158.6) 34 20.4 (12.4-28.4) 366 12.3 (11.0-13.6) 2005 243 61.3 (50.7-71.8) 182 93.8 (75.5-112.0) 27 17.0 (8.9-25.1) 376 12.5 (11.2-13.8) 2006 211 48.7 (40.7-56.8) 207 127.3 (104.2-150.4) 37 21.9 (12.6-31.3) 448 14.3 (13.0-15.6) 2007 268 63.4 (53.7-73.1) 192 103.5 (84.5-122.5) 35 15.8 (10.0-21.5) 447 14.1 (12.8-15.4) 2008 261 53.5 (45.3-61.7) 249 146.4 (122.1-170.7) 51 24.5 (16.2-32.9) 399 12.5 (11.2-13.7) 2009 288 60.5 (52.2-68.8) 244 145.8 (122.9-168.8) 51 23.0 (15.4-30.7) 431 13.1 (11.8-14.3) 2010 255 58.1 (49.3-67.0) 223 124.6 (104.6-144.5) 55 24.3 (16.9-31.7) 502 14.9 (13.6-16.2) 2011 290 63.1 (54.4-71.7) 251 129.8 (109.7-149.9) 64 31.2 (22.2-40.3) 583 17.3 (15.9-18.7) 2012 269 55.3 (47.1-63.5) 215 123.8 (103.0-144.5) 70 31.1 (22.3-39.8) 522 15.1 (13.8-16.4) 2013 309 60.5 (52.5-68.4) 214 103.2 (85.9-120.5) 75 35.5 (26.0-44.9) 610 17.3 (15.9-18.7) 2014 299 52.4 (45.2-59.7) 291 128.3 (110.5-146.1) 72 30.0 (21.7-38.3) 618 17.2 (15.9-18.6) 2015 387 71.1 (62.5-79.8) 268 132.5 (113.3-151.8) 81 23.6 (17.8-29.4) 663 18.5 (17.1-20.0) 2016 370 66.4 (58.3-74.5) 249 125.4 (105.7-145.0) 82 20.9 (15.8-26.0) 608 16.5 (15.2-17.8) 2017 413 76.3 (67.4-85.2) 275 126.6 (108.1-145.1) 74 18.7 (14.0-23.5) 747 20.3 (18.8-21.8)

120
Table A 37. Bronchiectasis hospitalisation rate ratios to non-MPA by ethnic group 2000 - 2017.
Year
Māori Pacific Asian
RR 95% CI RR 95% CI RR 95% CI
2000 4.95 (4.48-5.47) 7.94 (7.09-8.90) 1.55 (1.17-2.06)
2001 4.40 (3.98-4.86) 8.93 (8.05-9.90) 1.21 (0.96-1.51)
2002 5.72 (5.22-6.28) 10.47 (9.43-11.62) 1.64 (1.28-2.10)
2003 5.74 (5.20-6.34) 11.66 (10.45-13.01) 1.27 (0.98-1.65)
2004 6.50 (5.91-7.13) 10.86 (9.78-12.06) 1.66 (1.36-2.02)
2005 4.90 (4.45-5.40) 7.50 (6.74-8.34) 1.36 (1.07-1.72)
2006 3.41 (3.11-3.74) 8.90 (8.06-9.83) 1.53 (1.24-1.89)
2007 4.50 (4.12-4.91) 7.34 (6.64-8.11) 1.12 (0.93-1.34)
2008 4.30 (3.93-4.7) 11.76 (10.71-12.91) 1.97 (1.66-2.34)
2009 4.63 (4.27-5.02) 11.16 (10.20-12.2) 1.76 (1.49-2.09)
2010 3.91 (3.59-4.26) 8.38 (7.67-9.16) 1.64 (1.40-1.91)
2011 3.64 (3.37-3.94) 7.50 (6.89-8.16) 1.80 (1.56-2.09)
2012 3.67 (3.38-3.99) 8.21 (7.49-8.99) 2.06 (1.79-2.38)
2013 3.49 (3.24-3.76) 5.95 (5.44-6.51) 2.04 (1.79-2.34)
2014 3.04 (2.81-3.29) 7.44 (6.89-8.04) 1.74 (1.51-2.00)
2015 3.84 (3.58-4.12) 7.15 (6.60-7.75) 1.27 (1.12-1.44)
2016 4.03 (3.75-4.32) 7.60 (6.98-8.28) 1.27 (1.12-1.43)
2017 3.75 (3.51-4.01) 6.23 (5.75-6.74) 0.92 (0.81-1.05)
Table A 38. 2017 bronchiectasis hospitalisation rates by ethnic group and age.
Age (years)
Māori Pacific Asian non-MPA
n Rate 95% CI n Rate 95% CI n Rate 95% CI n Rate 95% CI
<15 161 65.6 (55.5-75.8) 88 69.8 (55.2-84.4) 10 7.2 (2.7-11.7) 66 16.1 (12.5-19.7)
15-29 29 14.9 (9.5-20.3) 22 21.2 (12.3-30) 2 1.1 (0.3-4.3) 9 4.1 (2.5-5.8)
30-64 106 40.0 (32.4-47.6) 67 52.5 (40.0-65.1) 22 6.7 (3.9-9.5) 122 10.6 (8.9-12.3)
65+ 117 254.2 (208.2-300.3) 98 490.5 (393.4-587.6) 40 75.0 (51.8-98.3) 444 82.5 (75.3-89.8)
Table A 39. 2017 bronchiectasis hospitalisation rates by NZDep2013 quintile.
NZDep quintile n
Rate
RR 95% CI raw age adj'd 95% CI
1-2 206 22.2 22.6 (19.5-25.7) 1.00 Baseline
3-4 179 20.0 19.8 (16.8-22.7) 0.87 (0.79-0.96)
5-6 249 26.9 24.8 (21.7-27.9) 1.10 (1.00-1.20)
7-8 293 29.6 28.6 (25.3-31.9) 1.27 (1.16-1.38)
9-10 566 53.7 57.2 (52.4-62.0) 2.53 (2.34-2.74)

121
Table A 40. Bronchiectasis hospitalisation rates by NZDep2013 quintile 2000 - 2017.
Year
NZDep 1-2 NZDep 3-4 NZDep 5-6 NZDep 7-8 NZDep 9-10
n Rate 95% CI n Rate 95% CI n Rate 95% CI n Rate 95% CI n Rate 95% CI
2000 87 15.4 (12.0-18.7) 74 11.9 (9.1-14.7) 103 14.3 (11.5-17.1) 176 23.2 (19.7-26.7) 279 36.9 (32.5-41.4)
2001 100 18.0 (14.4-21.6) 99 16.5 (13.2-19.8) 122 16.5 (13.5-19.4) 169 22.1 (18.7-25.5) 292 36.3 (32.0-40.6)
2002 76 13.4 (10.3-16.5) 85 13.4 (10.5-16.2) 115 15.6 (12.7-18.4) 179 22.8 (19.4-26.2) 327 39.5 (35.0-43.9)
2003 63 11.5 (8.6-14.3) 96 13.9 (11.1-16.7) 118 15.3 (12.5-18.0) 166 20.5 (17.3-23.6) 312 38.0 (33.7-42.3)
2004 66 11.0 (8.3-13.7) 105 15.3 (12.3-18.2) 113 14.8 (12.1-17.6) 181 21.9 (18.7-25.2) 395 48.0 (43.1-52.9)
2005 80 13.2 (10.3-16.1) 67 9.7 (7.4-12.1) 112 14.3 (11.6-16.9) 226 27.1 (23.5-30.6) 339 39.4 (35.1-43.7)
2006 90 14.1 (11.1-17.0) 103 14.7 (11.8-17.5) 140 17.4 (14.5-20.3) 232 26.8 (23.3-30.3) 347 40.8 (36.4-45.1)
2007 103 15.5 (12.5-18.6) 96 13.2 (10.5-15.8) 141 17.2 (14.3-20.0) 192 22.6 (19.4-25.8) 406 46.8 (42.2-51.5)
2008 74 11.0 (8.4-13.5) 126 16.9 (13.9-19.8) 148 17.9 (15.0-20.8) 188 21.7 (18.6-24.8) 399 45.5 (41.0-50.1)
2009 86 12.0 (9.4-14.6) 108 14.5 (11.7-17.2) 129 15.3 (12.7-17.9) 213 24.1 (20.8-27.3) 462 53.0 (48.1-57.9)
2010 106 14.4 (11.6-17.1) 135 17.2 (14.3-20.1) 168 19.5 (16.6-22.5) 201 22.3 (19.2-25.4) 425 49.4 (44.7-54.2)
2011 115 15.5 (12.7-18.4) 159 20.2 (17.0-23.3) 203 23.3 (20.1-26.5) 253 27.8 (24.4-31.2) 431 48.6 (44.0-53.3)
2012 111 14.4 (11.7-17.1) 121 14.9 (12.3-17.6) 197 22.1 (19.0-25.2) 216 23.4 (20.3-26.5) 410 45.6 (41.1-50.1)
2013 148 18.0 (15.1-20.9) 152 18.4 (15.5-21.3) 219 23.9 (20.7-27.1) 236 25.2 (21.9-28.4) 442 48.2 (43.7-52.8)
2014 171 20.7 (17.6-23.9) 167 19.7 (16.7-22.7) 200 21.6 (18.6-24.7) 241 25.3 (22.1-28.5) 463 49.6 (45.1-54.2)
2015 160 18.5 (15.6-21.4) 177 20.4 (17.4-23.4) 213 22.2 (19.2-25.2) 306 31.4 (27.9-35.0) 515 54.4 (49.6-59.1)
2016 169 19.1 (16.2-22.0) 149 16.7 (14.0-19.4) 180 18.5 (15.8-21.3) 276 27.2 (24-30.4) 512 52.5 (47.9-57.2)
2017 206 22.6 (19.5-25.7) 179 19.8 (16.8-22.7) 249 24.8 (21.7-27.9) 293 28.6 (25.3-31.9) 566 57.2 (52.4-62.0)
Table A 41. Bronchiectasis hospitalisation rates relative to NZDep 1-2 by NZDep2013 quintile 2000 - 2017.
Year
NZDep 3-4 NZDep 5-6 NZDep 7-8 NZDep 9-10
RR 95% CI RR 95% CI RR 95% CI RR 95% CI
2000 0.77 (0.66 - 0.90) 0.93 (0.81 - 1.07) 1.51 (1.33 - 1.72) 2.41 (2.13 - 2.71)
2001 0.92 (0.80 - 1.05) 0.92 (0.81 - 1.04) 1.23 (1.09 - 1.39) 2.02 (1.80 - 2.26)
2002 1.00 (0.86 - 1.16) 1.16 (1.01 - 1.34) 1.70 (1.49 - 1.95) 2.95 (2.60 - 3.34)
2003 1.21 (1.04 - 1.42) 1.33 (1.15 - 1.55) 1.78 (1.55 - 2.06) 3.32 (2.90 - 3.79)
2004 1.39 (1.19 - 1.62) 1.35 (1.16 - 1.57) 1.99 (1.74 - 2.29) 4.36 (3.84 - 4.96)
2005 0.74 (0.63 - 0.86) 1.08 (0.94 - 1.25) 2.05 (1.81 - 2.33) 2.99 (2.65 - 3.37)
2006 1.04 (0.91 - 1.19) 1.23 (1.08 - 1.40) 1.90 (1.69 - 2.14) 2.89 (2.58 - 3.24)
2007 0.85 (0.74 - 0.97) 1.11 (0.98 - 1.25) 1.45 (1.29 - 1.64) 3.02 (2.71 - 3.36)
2008 1.54 (1.33 - 1.77) 1.63 (1.42 - 1.87) 1.97 (1.73 - 2.25) 4.15 (3.67 - 4.69)
2009 1.21 (1.05 - 1.39) 1.28 (1.12 - 1.46) 2.01 (1.78 - 2.27) 4.42 (3.95 - 4.95)
2010 1.20 (1.06 - 1.35) 1.36 (1.21 - 1.53) 1.55 (1.38 - 1.74) 3.44 (3.10 - 3.82)
2011 1.30 (1.15 - 1.46) 1.50 (1.34 - 1.67) 1.79 (1.61 - 1.99) 3.13 (2.83 - 3.46)
2012 1.04 (0.92 - 1.18) 1.54 (1.37 - 1.72) 1.63 (1.46 - 1.82) 3.18 (2.87 - 3.52)
2013 1.02 (0.91 - 1.14) 1.33 (1.20 - 1.47) 1.40 (1.26 - 1.54) 2.68 (2.44 - 2.93)
2014 0.95 (0.86 - 1.05) 1.04 (0.95 - 1.15) 1.22 (1.11 - 1.34) 2.39 (2.20 - 2.61)
2015 1.10 (0.99 - 1.22) 1.20 (1.08 - 1.32) 1.69 (1.54 - 1.86) 2.93 (2.69 - 3.20)
2016 0.88 (0.79 - 0.98) 0.97 (0.88 - 1.08) 1.43 (1.30 - 1.57) 2.75 (2.53 – 3.00)
2017 0.87 (0.79 - 0.96) 1.10 (1.00 - 1.20) 1.27 (1.16 - 1.38) 2.53 (2.34 - 2.74)

122
Table A 42. 2017 bronchiectasis hospitalisation rates by ethnic group and NZDep2013 quintile.
Ethnic group NZDep quintile
1-2 3-4 5-6 7-8 9-10
Māori
Hosp_Num 8 32 47 74 252 Rate (raw) 11.8 36.6 40.0 42.1 83.2 Rate (age adj'd) 18.9 56.5 62.6 61.6 109.3 95%CI (3.8-34.0) (33.5-79.6) (42.7-82.6) (42.5-80.7) (92.9-125.8)
Pacific
Hosp_Num 10 18 32 40 175 Rate (raw) 51.6 59.6 79.7 52.8 83.5 Rate (age adj'd) 79.4 183.8 131.3 79.3 155.3 95%CI (27.0-131.7) (75.5-292.2) (75.9-186.7) (49.4-109.2) (126.0-184.7)
Asian
Hosp_Num 19 12 7 18 18 Rate (raw) 15.7 8.2 5.3 12.7 11.2 Rate (age adj'd) 23.1 15.0 9.7 20.2 31.3 95%CI (12.0-34.2) (5.3-24.6) (2.1-17.3) (9.5-30.8) (12.9-49.7)
NZ European/ Other
Hosp_Num 171 116 165 165 130 Rate (raw) 23.1 17.6 25.6 26.8 33.2 Rate (age adj'd) 21.8 15.4 20.2 20.8 26.8 95%CI (18.5-25.1) (12.6-18.3) (17.0-23.4) (17.4-24.1) (21.9-31.7)
Table A 43. 2017 bronchiectasis hospitalisation rates by DHB.
DHB n
Rate
raw age adj’d 95%CI
Northland 79 45.0 40.6 (31.5-49.7)
Waitemata 170 28.1 30.1 (25.6-34.7)
Auckland 173 33.0 41.6 (35.3-47.8)
Counties Manukau 253 46.3 53.5 (46.8-60.2)
Waikato 127 31.1 30.2 (25.0-35.5)
Lakes 51 47.0 46.0 (33.3-58.7)
Bay of Plenty 91 39.2 33.8 (26.7-40.8)
Tairawhiti 14 28.9 28.6 (13.5-43.6)
Hawkes Bay 61 37.2 32.5 (24.3-40.7)
Taranaki 35 29.6 27.9 (18.6-37.2)
MidCentral 41 23.2 21.8 (15.1-28.5)
Whanganui 18 28.1 21.6 (11.6-31.7)
Capital and Coast 53 16.9 18.3 (13.3-23.2)
Hutt 37 25.0 25.2 (17.1-33.3)
Wairarapa 9 20.2 15.6 (5.2-26.0)
Nelson Marlborough 24 16.1 11.9 (7.1-16.6)
West Coast 7 21.6 17.5 (4.3-30.7)
Canterbury 172 31.2 30.3 (25.7-34.8)
South Canterbury 5 8.4 5.3 (0.6-10.0)
Southern 73 22.5 20.9 (16.0-25.7)

123
9.2.1. BRONCHIECTASIS MORTALITY
Table A 44. Bronchiectasis mortality rates and age-adjusted rates 2000-2015.
Year n Rate
Raw (age adj'd) 95% CI
2000 42 1.09 1.30 (0.90-1.70) 2001 42 1.08 1.26 (0.88-1.65) 2002 57 1.44 1.69 (1.25-2.13) 2003 58 1.44 1.69 (1.25-2.13) 2004 57 1.39 1.62 (1.19-2.04) 2005 57 1.38 1.58 (1.17-1.99) 2006 69 1.65 1.87 (1.42-2.31) 2007 78 1.85 2.07 (1.61-2.53) 2008 95 2.23 2.46 (1.97-2.96) 2009 94 2.18 2.38 (1.90-2.86) 2010 94 2.16 2.31 (1.84-2.78) 2011 87 1.98 2.09 (1.65-2.53) 2012 102 2.31 2.39 (1.93-2.86) 2013 97 2.18 2.23 (1.79-2.68) 2014 109 2.42 2.45 (1.99-2.91) 2015 116 2.52 2.54 (2.08-3.00) Trend 2000 -2015
0.08 (0.06 – 0.10), p<0.001
Table A 45. Bronchiectasis mortality rates and rate ratios by age group and sex, 2010-2015.
Total Male Female M v F
Age (years) n Rate 95% CI n Rate 95% CI n Rate 95% CI RR 95% CI
<15 1 0.0 (0.0-0.1) 1 0.0 (0.0-0.3) 0 0 0
15-29 5 0.1 (0.0-0.2) 3 0.1 (0.0-0.3) 2 0.1 (0.0-0.3) 0.68 (0.28-1.61)
30-64 81 0.7 (0.5-0.8) 32 0.6 (0.4-0.7) 49 0.8 (0.6-1.0) 1.42 (1.15-1.77)
65+ 518 14.0 (12.8-15.2) 190 11.2 (9.6-12.8) 328 16.4 (14.7-18.2) 1.47 (1.35-1.60)
Table A 46. Bronchiectasis mortality rate ratios by age group and sex, 2010-2015.
Age (years)
Total Male Female
RR 95% CI RR 95% CI RR 95% CI
<15 0.03 (0.01-0.07) 0.06 (0.02-0.17) -
15-29 0.14 (0.09-0.21) 0.20 (0.11-0.35) 0.09 (0.05-0.19)
30-64 1.00 Baseline 1.00 Baseline 1.00 Baseline
65+ 20.83 (18.59-23.33) 20.25 (16.88-24.28) 20.93 (18.09-24.2)

124
Table A 47. Bronchiectasis mortality rates and rate ratios by ethnic group, 2010-2015.
Total Ethnicity
Rate
n Raw Age adj'd 95% CI RR 95%CI
Māori 107 2.6 6.8 (5.3-8.2) 3.91 (3.49-4.39)
Pacific 74 3.6 11.0 (8.2-13.8) 6.34 (5.56-7.22)
Asian 28 0.9 3.0 (1.8-4.2) 1.72 (1.41-2.09)
Non-MPA 398 2.2 1.7 (1.6-1.9) 1.00 Baseline
Table A 48. Bronchiectasis mortality rates by ethnic group and age, 2010-2015
Māori Pacific Asian non-MPA Age (years) n Rate 95% CI n Rate 95% CI n Rate 95% CI n Rate 95% CI
<15 0 0.0 1 0.1 (0.0-1.0) 0 0.0 n/a 0 0.0 n/a
15-29 2 0.2 (0.0-0.8) 2 0.4 (0.1-1.5) 1 0.1 (0.0-0.8) 0 0.0 n/a
30-64 37 2.5 (1.7-3.3) 17 2.5 (1.3-3.6) 2 0.1 (0.0-0.5) 25 0.3 (0.2-0.4)
65+ 68 31.9 (24.3-39.4) 54 56.5 (41.4-71.6) 25 13.2 (8.0-18.3) 373 11.7 (10.5-12.9)
Table A 49. Bronchiectasis mortality rates NZDep2006 quintile, 2010-2015.
NZDep quintile n Rate
RR 95% CI raw age adj'd 95% CI 1-2 89 1.8 2.1 (1.6-2.5) 1.00 Baseline 3-4 88 1.8 1.8 (1.5-2.2) 0.89 (0.77-1.02) 5-6 115 2.2 2.0 (1.7-2.4) 0.97 (0.85-1.12) 7-8 127 2.3 2.1 (1.7-2.5) 1.00 (0.88-1.15) 9-10 185 3.2 3.8 (3.2-4.3) 1.82 (1.61-2.06)
Table A 50. Bronchiectasis mortality rates by ethnic group and NZDep2013 quintile, 2010-2015.
Ethnic group NZDep2013 quintile 1-2 3-4 5-6 7-8 9-10
Māori
Deaths 6 8 16 16 61 Rate (raw) 1.8 1.8 2.5 1.6 3.5 Rate (age adj'd) 4.7 4.4 6.4 4.2 9.3 95%CI (1.5-14.6) (0.9-7.9) (2.8-10) (1.8-6.6) (6.7-12)
Pacific
Deaths 2 4 9 5 53 Rate (raw) 2.0 2.5 4.2 1.2 4.5 Rate (age adj'd) 3.2 13.1 14.6 4.6 14.0 95%CI (0.8-13.8) (4.8-36.2) (3.7-25.4) (0.2-9) (9.8-18.2)
Asian
Deaths 9 10 2 4 3 Rate (raw) 1.6 1.5 0.3 0.6 0.4 Rate (age adj'd) 4.9 5.5 1.0 2.6 0.8 95%CI (1.4-8.3) (2.0-9.1) (0.2-4.5) (0.1-5.1) (0.2-2.8)
NZ European/ Other
Deaths 72 67 88 102 69 Rate (raw) 1.7 1.8 2.3 2.8 2.9 Rate (age adj'd) 1.8 1.5 1.7 1.9 1.9 95%CI (1.4-2.3) (1.2-1.9) (1.3-2) (1.5-2.2) (1.4-2.3)

125
Table A 51. Bronchiectasis mortality rates by DHB, 2010-2015.
DHB n
Rate
raw age adj’d 95%CI Northland 25 2.5 2.2 (1.4-3.1) Waitemata 74 2.2 2.6 (2.0-3.1) Auckland 74 2.7 3.5 (2.7-4.3) Counties Manukau 81 2.7 3.7 (2.9-4.5) Waikato 45 2.0 2.0 (1.4-2.6) Lakes 18 2.9 3.0 (1.6-4.4) Bay of Plenty 32 2.5 2.0 (1.3-2.7) Tairawhiti 11 3.9 4.2 (1.7-6.7) Hawkes Bay 26 2.7 2.4 (1.5-3.3) Taranaki 9 1.3 1.1 (0.4-1.9) MidCentral 22 2.2 1.9 (1.1-2.7) Whanganui 4 1.1 0.8 (0.0-1.6) Capital and Coast 27 1.5 1.8 (1.1-2.5) Hutt 17 2.0 2.2 (1.1-3.2) Wairarapa 2 0.8 0.6 (0.2-2.4) Nelson Marlborough 19 2.2 1.8 (1.0-2.6) West Coast 3 1.5 1.4 (0.5-4.4) Canterbury 67 2.2 2.1 (1.6-2.6) South Canterbury 7 2.0 1.4 (0.4-2.4) Southern 41 2.2 2.1 (1.4-2.7)

126
9.3. CHILDHOOD BRONCHIOLITIS
9.3.1. CHILDHOOD BRONCHIOLITIS HOSPITALISATIONS
N.B. All rates are per 100,000 people Table A 52. Childhood bronchiolitis hospitalisations, rates and age-adjusted rates 2000-2017.
Year n Rate 95% CI 2000 3984 1405.7 (1362.0 - 1449.3) 2001 4187 1490.0 (1444.9 - 1535.1) 2002 4663 1658.6 (1611.0 - 1706.2) 2003 4489 1592.7 (1546.1 - 1639.3) 2004 4393 1543.2 (1497.6 - 1588.9) 2005 4292 1509.6 (1464.5 - 1554.8) 2006 4502 1574.0 (1528.1 – 1620.0) 2007 4511 1539.1 (1494.2 – 1584.0) 2008 5349 1776.8 (1729.2 - 1824.5) 2009 6312 2054.8 (2004.1 - 2105.5) 2010 5798 1844.4 (1796.9 - 1891.9) 2011 5735 1806.5 (1759.7 - 1853.3) 2012 6411 2030.6 (1980.9 - 2080.3) 2013 5461 1750.8 (1704.3 - 1797.2) 2014 5909 1913.6 (1864.8 - 1962.4) 2015 6452 2110.2 (2058.7 - 2161.6) 2016 5645 1850.7 (1802.4 – 1899.0) 2017 6320 2065.4 (2014.4 - 2116.3) Trend 2000 -2017
34.7 (22.7-46.6), p<0.000
Table A 53. 2017 childhood bronchiolitis hospitalisation rates and rate ratios by sex
Total Male Female M v F
n Rate 95% CI n Rate 95% CI n Rate 95% CI RR 95% CI
6320 2065.4 (2014.4-2116.3) 3930 2502 (2423.5-2579.9) 2390 1605.1 (1540.7-1669.4) 0.64 (0.63-0.66)
Table A 54. 2017 childhood bronchiolitis hospitalisation rates and rate ratios by ethnic group.
Total Ethnicity n
Rate
Raw 95% CI RR 95%CI
Māori 2972 3561.4 (3433.4-3689.5) 3.16 (4.18-4.44)
Pacific 1746 3967.6 (3781.4-4153.7) 3.52 (4.87-5.20)
Asian 373 677.0 (608.3-745.7) 0.60 (1.02-1.13)
Non-MPA 1602 1127.1 (1071.9-1182.2) 1.00 Baseline

127
Table A 55. Childhood bronchiolitis hospitalisation rates by ethnic group 2000 - 2017.
Māori Pacific Asian non-MPA
Year n Rate 95% CI n Rate 95% CI n Rate 95% CI n Rate 95% CI 2000 1631 2154.3 (2049.7-2258.8) 875 2417.9 (2257.7-2578.1) 86 428.0 (337.6-518.5) 1453 890.7 (844.9-936.5) 2001 1816 2434.3 (2322.4-2546.3) 1154 3151.3 (2969.5-3333.1) 80 392.3 (306.4-478.3) 1218 754.9 (712.5-797.3) 2002 1934 2598.1 (2482.3-2713.9) 1318 3524.7 (3334.4-3715.0) 96 431.0 (344.8-517.3) 1403 879.7 (833.7-925.8) 2003 1956 2646.5 (2529.2-2763.7) 1308 3429.0 (3243.2-3614.9) 117 475.9 (389.7-562.1) 1209 764.2 (721.1-807.3) 2004 1996 2700.6 (2582.1-2819.1) 1177 2992.9 (2821.9-3163.9) 128 495.2 (409.4-581.0) 1203 756.1 (713.4-798.8) 2005 1967 2687.9 (2569.1-2806.7) 1143 2889.6 (2722.1-3057.2) 137 521.7 (434.3-609.1) 1229 772.8 (729.6-816.0) 2006 2014 2757.4 (2637.0-2877.8) 1287 3289.9 (3110.1-3469.6) 122 454.0 (373.5-534.6) 1236 769.1 (726.3-812.0) 2007 2032 2636.2 (2521.6-2750.8) 1275 3185.9 (3011.0-3360.8) 131 452.3 (374.8-529.7) 1253 776.4 (733.4-819.4) 2008 2457 3030.0 (2910.2-3149.8) 1597 3837.5 (3649.3-4025.7) 194 620.0 (532.8-707.3) 1387 854.9 (809.9-899.9) 2009 2919 3486.2 (3359.7-3612.7) 1905 4450.2 (4250.4-4650.0) 214 642.0 (556.0-728.0) 1581 968.6 (920.8-1016.3) 2010 2587 3007.1 (2891.2-3123.0) 1693 3808.8 (3627.3-3990.2) 217 611.0 (529.7-692.3) 1647 997.6 (949.4-1045.8) 2011 2568 2961.9 (2847.4-3076.5) 1719 3783.1 (3604.3-3961.9) 240 636.7 (556.1-717.2) 1535 930.1 (883.5-976.6) 2012 2956 3454.9 (3330.3-3579.4) 1955 4278.9 (4089.3-4468.6) 303 769.8 (683.1-856.5) 1580 969.8 (922.0-1017.6) 2013 2375 2826.0 (2712.4-2939.7) 1629 3655.7 (3478.2-3833.3) 269 654.0 (575.9-732.2) 1455 909.7 (862.9-956.4) 2014 2610 3124.6 (3004.7-3244.5) 1691 3820.8 (3638.7-4002.9) 301 694.1 (615.7-772.5) 1636 1055.7 (1004.5-1106.8) 2015 2994 3611.6 (3482.2-3740.9) 1866 4237.2 (4045.0-4429.5) 377 804.4 (723.2-885.5) 1577 1054.0 (1002.0-1106.0) 2016 2484 2992.4 (2874.7-3110.1) 1490 3393.0 (3220.7-3565.3) 401 788.4 (711.2-865.5) 1546 1061.8 (1008.9-1114.7) 2017 2972 3561.4 (3433.4-3689.5) 1746 3967.6 (3781.4-4153.7) 373 677.0 (608.3-745.7) 1602 1127.1 (1071.9-1182.2)
Table A 56. Childhood bronchiolitis hospitalisation rate ratios to non-MPA by ethnic group 2000 - 2017.
Year
Māori Pacific Asian
RR 95% CI RR 95% CI RR 95% CI
2000 2.42 (2.34 - 2.50) 2.71 (2.61 - 2.83) 0.48 (0.43 - 0.53)
2001 3.22 (3.11 - 3.34) 4.17 (4.01 - 4.34) 0.52 (0.47 - 0.58)
2002 2.95 (2.86 - 3.05) 4.01 (3.86 - 4.16) 0.49 (0.44 - 0.54)
2003 3.46 (3.34 - 3.59) 4.49 (4.32 - 4.66) 0.62 (0.57 - 0.68)
2004 3.57 (3.45 - 3.70) 3.96 (3.81 - 4.12) 0.65 (0.60 - 0.72)
2005 3.48 (3.36 - 3.60) 3.74 (3.60 - 3.89) 0.68 (0.62 - 0.74)
2006 3.59 (3.46 - 3.71) 4.28 (4.12 - 4.44) 0.59 (0.54 - 0.65)
2007 3.40 (3.28 - 3.51) 4.10 (3.95 - 4.26) 0.58 (0.53 - 0.64)
2008 3.54 (3.43 - 3.66) 4.49 (4.33 - 4.65) 0.73 (0.67 - 0.78)
2009 3.60 (3.49 - 3.71) 4.59 (4.45 - 4.75) 0.66 (0.62 - 0.71)
2010 3.01 (2.93 - 3.11) 3.82 (3.69 - 3.95) 0.61 (0.57 - 0.66)
2011 3.18 (3.09 - 3.28) 4.07 (3.93 - 4.21) 0.68 (0.64 - 0.73)
2012 3.56 (3.46 - 3.67) 4.41 (4.27 - 4.56) 0.79 (0.75 - 0.84)
2013 3.11 (3.01 - 3.21) 4.02 (3.88 - 4.16) 0.72 (0.68 - 0.77)
2014 2.96 (2.87 - 3.05) 3.62 (3.50 - 3.74) 0.66 (0.62 - 0.70)
2015 3.43 (3.33 - 3.53) 4.02 (3.89 - 4.15) 0.76 (0.72 - 0.81)
2016 2.82 (2.73 - 2.91) 3.20 (3.09 - 3.31) 0.74 (0.70 - 0.78)
2017 3.16 (3.07 - 3.25) 3.52 (3.41 - 3.64) 0.60 (0.57 - 0.63)

128
Table A 57. 2017 childhood bronchiolitis hospitalisation rates by NZDep2013 quintile.
NZDep quintile n Rate 95% CI RR 95% CI
1-2 454 918.3 (833.8-1002.8) 1.00 Baseline
3-4 604 1154.2 (1062.2-1246.3) 1.26 (1.18-1.33)
5-6 824 1477.2 (1376.4-1578.1) 1.61 (1.52-1.7)
7-8 1434 2186.3 (2073.1-2299.5) 2.38 (2.26-2.51)
9-10 2994 3613.8 (3484.3-3743.2) 3.94 (3.75-4.13)
Table A 58. Childhood bronchiolitis hospitalisation rates by NZDep2013 quintile 2000 - 2017.
NZDep 1-2 NZDep 3-4 NZDep 5-6 NZDep 7-8 NZDep 9-10
Year n Rate 95% CI n Rate 95% CI n Rate 95% CI n Rate 95% CI n Rate 95% CI
2000 299 713.1 (632.3-793.9) 415 916.3 (828.2-1004.5) 562 1084.1 (994.5-1173.7) 855 1401.0 (1307-1494.9) 1837 2205.8 (2104.9-2306.7)
2001 291 683.9 (605.3-762.5) 403 886.7 (800.1-973.3) 531 1025.7 (938.4-1112.9) 936 1552.8 (1453.3-1652.2) 1939 2396.2 (2289.5-2502.9)
2002 308 710.0 (630.7-789.3) 482 1048.1 (954.5-1141.6) 602 1167.1 (1073.9-1260.4) 971 1626.2 (1523.9-1728.5) 2297 2855.5 (2738.8-2972.3)
2003 240 541.5 (473.0-610.0) 402 859.9 (775.8-944.0) 538 1048.7 (960.1-1137.4) 954 1608.8 (1506.7-1710.9) 2304 2874.6 (2757.2-2992.0)
2004 283 621.2 (548.8-693.5) 351 737.9 (660.7-815.1) 508 982.6 (897.1-1068.0) 901 1519.4 (1420.2-1618.6) 2349 2918.0 (2800.0-3036.0)
2005 276 599.6 (528.9-670.3) 342 713.8 (638.2-789.5) 544 1058.8 (969.8-1147.8) 952 1615.2 (1512.6-1717.8) 2168 2709.7 (2595.6-2823.7)
2006 253 536.1 (470.1-602.2) 352 723.7 (648.1-799.3) 496 952.0 (868.2-1035.8) 944 1595.4 (1493.6-1697.2) 2454 3110.7 (2987.6-3233.7)
2007 309 636.2 (565.3-707.1) 366 730.8 (656.0-805.7) 464 872.7 (793.3-952.1) 1034 1695.9 (1592.5-1799.3) 2336 2909.5 (2791.5-3027.4)
2008 327 658.7 (587.3-730.1) 409 794.8 (717.8-871.8) 614 1123.3 (1034.5-1212.2) 1074 1715.1 (1612.5-1817.7) 2906 3516.5 (3388.6-3644.3)
2009 348 693.2 (620.4-766.1) 508 970.8 (886.3-1055.2) 721 1294.9 (1200.4-1389.4) 1340 2085.0 (1973.3-2196.6) 3389 4001.7 (3866.9-4136.4)
2010 385 753.1 (677.9-828.4) 517 971.8 (888.0-1055.6) 753 1317.6 (1223.5-1411.7) 1248 1886.9 (1782.2-1991.6) 2893 3335.6 (3214.1-3457.2)
2011 394 761.6 (686.4-836.9) 498 926.9 (845.5-1008.3) 647 1118.2 (1032.1-1204.4) 1198 1793.4 (1691.9-1895.0) 2998 3433.0 (3310.1-3555.8)
2012 430 830.4 (751.9-908.9) 582 1090.5 (1001.9-1179.1) 781 1357.8 (1262.6-1453.0) 1379 2068.4 (1959.2-2177.6) 3236 3747.1 (3618.0-3876.2)
2013 328 633.7 (565.1-702.3) 476 891.7 (811.6-971.8) 672 1177.3 (1088.3-1266.3) 1167 1766.8 (1665.5-1868.2) 2815 3366.4 (3242.1-3490.8)
2014 388 760.2 (684.5-835.8) 518 985.2 (900.3-1070.0) 768 1362.4 (1266.1-1458.8) 1297 1988.0 (1879.8-2096.2) 2937 3515.7 (3388.5-3642.8)
2015 444 878.0 (796.3-959.7) 544 1043.1 (955.5-1130.8) 795 1435.5 (1335.7-1535.3) 1428 2203.7 (2089.4-2318.0) 3228 3896.7 (3762.2-4031.1)
2016 422 852.0 (770.7-933.3) 577 1109.2 (1018.7-1199.7) 709 1280.0 (1185.8-1374.2) 1247 1909.6 (1803.7-2015.6) 2684 3243.1 (3120.4-3365.8)
2017 454 918.3 (833.8-1002.8) 604 1154.2 (1062.2-1246.3) 824 1477.2 (1376.4-1578.1) 1434 2186.3 (2073.1-2299.5) 2994 3613.8 (3484.3-3743.2)

129
Table A 59. Childhood bronchiolitis hospitalisation rates relative to NZDep 1-2 by NZDep2013 quintile 2000 - 2017.
Year
NZDep 3-4 NZDep 5-6 NZDep 7-8 NZDep 9-10
RR 95% CI RR 95% CI RR 95% CI RR 95% CI
2000 1.28 (1.20 - 1.38) 1.52 (1.42 - 1.63) 1.96 (1.84 - 2.09) 3.09 (2.92 - 3.28)
2001 1.30 (1.21 - 1.39) 1.50 (1.40 - 1.61) 2.27 (2.13 - 2.42) 3.50 (3.30 - 3.72)
2002 1.48 (1.38 - 1.58) 1.64 (1.54 - 1.76) 2.29 (2.15 - 2.44) 4.02 (3.80 - 4.26)
2003 1.59 (1.47 - 1.72) 1.94 (1.80 - 2.08) 2.97 (2.77 - 3.18) 5.31 (4.98 - 5.66)
2004 1.19 (1.10 - 1.28) 1.58 (1.47 - 1.70) 2.45 (2.29 - 2.61) 4.70 (4.43 - 4.99)
2005 1.19 (1.10 - 1.29) 1.77 (1.65 - 1.89) 2.69 (2.52 - 2.87) 4.52 (4.25 - 4.80)
2006 1.35 (1.25 - 1.46) 1.78 (1.65 - 1.91) 2.98 (2.78 - 3.18) 5.80 (5.45 - 6.18)
2007 1.15 (1.07 - 1.24) 1.37 (1.28 - 1.47) 2.67 (2.51 - 2.84) 4.57 (4.32 - 4.84)
2008 1.21 (1.12 - 1.29) 1.71 (1.60 - 1.82) 2.60 (2.45 - 2.76) 5.34 (5.05 - 5.64)
2009 1.40 (1.31 - 1.50) 1.87 (1.76 - 1.99) 3.01 (2.84 - 3.18) 5.77 (5.47 - 6.09)
2010 1.29 (1.21 - 1.38) 1.75 (1.65 - 1.86) 2.51 (2.37 - 2.65) 4.43 (4.21 - 4.66)
2011 1.22 (1.14 - 1.30) 1.47 (1.38 - 1.56) 2.35 (2.23 - 2.49) 4.51 (4.28 - 4.74)
2012 1.31 (1.24 - 1.39) 1.64 (1.54 - 1.73) 2.49 (2.36 - 2.62) 4.51 (4.30 - 4.74)
2013 1.41 (1.31 - 1.51) 1.86 (1.74 - 1.98) 2.79 (2.63 - 2.96) 5.31 (5.03 - 5.62)
2014 1.30 (1.22 - 1.38) 1.79 (1.69 - 1.90) 2.62 (2.48 - 2.76) 4.62 (4.39 - 4.87)
2015 1.19 (1.12 - 1.26) 1.64 (1.55 - 1.73) 2.51 (2.38 - 2.64) 4.44 (4.23 - 4.66)
2016 1.30 (1.22 - 1.38) 1.50 (1.42 - 1.59) 2.24 (2.12 - 2.36) 3.81 (3.62 – 4.00)
2017 1.26 (1.18 - 1.33) 1.61 (1.52 - 1.70) 2.38 (2.26 - 2.51) 3.94 (3.75 - 4.13)
Table A 60. 2017 childhood bronchiolitis hospitalisation rates by ethnic group and NZDep quintile.
NZDep quintile
Māori Pacific Asian non-MPA
n Rate 95%CI n Rate 95%CI n Rate 95%CI n Rate 95%CI
1-2 80 1217.7 (950.8-1484.5) 45 2229 (1577.6-2880.0) 50 529 (382.1-675.2) 291 856 (757.8-954.6)
3-4 181 1959.5 (1674.0-2245.0) 106 3301 (2672.7-3929.6) 71 640 (491.3-789.2) 275 889 (784.0-994.2)
5-6 323 2539.3 (2262.4-2816.2) 153 3468 (2918.3-4017.3) 57 562 (416.0-707.8) 331 1077 (961.2-1193.3)
7-8 713 3581.8 (3318.9-3844.8) 314 3373 (3000.3-3746.6) 85 688 (541.5-833.9) 394 1360 (1225.5-1494.0)
9-10 1671 4772.4 (4543.6-5001.2) 1126 4506 (4243.0-4769.4) 110 929 (755.6-1103.0) 307 1758 (1561.7-1955.1)

130
Table A 61. 2017 childhood bronchiolitis hospitalisation rates by DHB.
DHB n Rate 95%CI Northland 302 2619.3 (2323.8-2914.7) Waitemata 541 1332.2 (1219.9-1444.4) Auckland 464 1585.0 (1440.8-1729.2) Counties Manukau 1050 2487.6 (2337.1-2638.0) Waikato 921 3295.2 (3082.4-3508.0) Lakes 282 3720.3 (3286.1-4154.5) Bay of Plenty 426 2810.0 (2543.2-3076.9) Tairawhiti 169 4694.4 (3986.7-5402.2) Hawkes Bay 257 2334.2 (2048.9-2619.6) Taranaki 165 2101.9 (1781.2-2422.6) MidCentral 221 2005.4 (1741.0-2269.9) Whanganui 106 2462.3 (1993.5-2931.0) Capital and Coast 329 1829.8 (1632.1-2027.5) Hutt 232 2324.6 (2025.5-2623.8) Wairarapa 49 1870.2 (1346.6-2393.9) Nelson Marlborough 98 1240.5 (994.9-1486.1) West Coast 17 934.1 (490.0-1378.1) Canterbury 362 1119.7 (1004.4-1235.0) South Canterbury 30 898.2 (576.8-1219.6) Southern 299 1668.5 (1479.4-1857.7)

131
9.4. CHILDHOOD PNEUMONIA
9.4.1. CHILDHOOD PNEUMONIA HOSPITALISATIONS
N.B. All rates are per 100,000 people Table A 62. Childhood pneumonia hospitalisations, rates and age-adjusted rates 2000-2017.
Year n Rate Raw (age adj'd) 95% CI
2000 3580 407.4 418.7 (405.0 - 432.4) 2001 3961 451.5 466.8 (452.2 - 481.3) 2002 3626 410.4 427.5 (413.6 - 441.4) 2003 3693 414.9 435.3 (421.3 - 449.4) 2004 3122 349.6 365.1 (352.3 - 377.9) 2005 3448 387.3 401.1 (387.7 - 414.5) 2006 3480 391.8 405.5 (392.0 – 419.0) 2007 3187 357.6 364.4 (351.7 – 377.0) 2008 3583 400.1 401.7 (388.5 - 414.8) 2009 4131 458.4 456.2 (442.3 - 470.2) 2010 3414 375.9 371.3 (358.9 - 383.8) 2011 3324 365.0 358.6 (346.4 - 370.8) 2012 3096 340.3 334.7 (322.9 - 346.4) 2013 2994 329.5 325.9 (314.3 - 337.6) 2014 3484 382.4 380.7 (368.0 - 393.3) 2015 3900 426.5 427.6 (414.1 – 441.0) 2016 3113 337.8 340.3 (328.4 - 352.3) 2017 3426 366.9 371.8 (359.3 - 384.3) Trend 2000 -2017 -4.41 (-7.78- 1.03), p=0.014
Table A 63. 2017 childhood pneumonia hospitalisation rates and rate ratios by age group and sex
Total Male Female M v F Age (years) n Rate 95% CI n Rate 95% CI n Rate 95% CI RR 95% CI
<5 2476 809.2 (777.3-841.0) 1303 829.4 (784.4-874.5) 1173 787.8 (742.7-832.8) 0.95 (0.91-0.99)
5-14 950 151.3 (141.7-161.0) 477 148.2 (134.9-161.5) 473 154.7 (140.7-168.6) 1.04 (0.98-1.11) Table A 64. 2017 childhood pneumonia hospitalisation age group rate ratios by sex
Age (years)
Total Male Female
RR 95% CI RR 95% CI RR 95% CI
<5 5.35 (5.16-5.54) 5.60 (5.32-5.89) 5.09 (4.84-5.36)
5-14 1.00 Baseline 1.00 Baseline 1.00 Baseline Table A 65. 2017 childhood pneumonia hospitalisation rates and rate ratios by ethnic group.
Total Ethnicity n
Rate
Raw Age adj'd 95% CI RR 95%CI
Māori 1053 429.3 425.2 (399.5-450.9) 1.56 (1.5-1.63)
Pacific 840 666.1 649.3 (605.3-693.2) 2.39 (2.29-2.49)
Asian 472 340.1 308.1 (280.1-336) 1.13 (1.08-1.19)
Non-MPA 1215 257.2 271.8 (256.5-287.2) 1.00 Baseline

132
Table A 66. Childhood pneumonia hospitalisation rates by ethnic group 2000 – 2017, age-adjusted.
Māori Pacific Asian non-MPA
Year n Rate 95% CI n Rate 95% CI n Rate 95% CI n Rate 95% CI 2000 1121 504.2 (474.7-533.7) 869 829.6 (774.3-884.8) 110 184.0 (149.6-218.4) 1494 296.5 (281.4-311.5) 2001 1177 535.8 (505.2-566.5) 1097 1029.2 (968.2-1090.1) 131 216.1 (179.1-253.1) 1617 323.6 (307.8-339.4) 2002 1092 496.6 (467.1-526.1) 979 900.0 (843.6-956.5) 168 250.8 (212.9-288.7) 1433 291.8 (276.6-306.9) 2003 1085 496.0 (466.5-525.6) 1137 1021.4 (962-1080.8) 176 238.8 (203.5-274.1) 1347 279.0 (264-293.9.0) 2004 865 395.6 (369.2-421.9) 992 864.4 (810.6-918.3) 163 210.6 (178.3-242.9) 1154 237.7 (223.9-251.4) 2005 1010 466.1 (437.3-494.8) 874 759.8 (709.4-810.2) 189 237.6 (203.7-271.5) 1447 294.7 (279.5-309.9) 2006 1045 483.4 (454.1-512.7) 989 861.4 (807.7-915.1) 216 268.7 (232.8-304.5) 1317 269.8 (255.2-284.4) 2007 996 442.6 (415.1-470.1) 937 802.0 (750.7-853.4) 229 268.4 (233.6-303.1) 1133 232.1 (218.6-245.6) 2008 1122 481.1 (452.9-509.3) 1118 924.6 (870.3-978.8) 282 310.8 (274.5-347.1) 1231 251.6 (237.6-265.7) 2009 1350 567.7 (537.3-598.0) 1220 987.1 (931.7-1042.6) 310 322.3 (286.4-358.2) 1424 289.2 (274.1-304.2) 2010 995 408.0 (382.6-433.4) 912 717.7 (671.0-764.3) 322 319.9 (284.9-355.0) 1324 267.7 (253.3-282.1) 2011 997 404.5 (379.3-429.6) 1048 806.2 (757.2-855.1) 288 271.0 (239.6-302.5) 1143 232.2 (218.8-245.7) 2012 937 380.1 (355.7-404.5) 943 716.7 (670.9-762.6) 304 274.1 (243.2-305.1) 1076 220.8 (207.6-234.0) 2013 851 350.2 (326.6-373.7) 856 662.7 (618.2-707.1) 301 260.2 (230.7-289.7) 1108 230.1 (216.6-243.7) 2014 997 408.4 (383.1-433.8) 962 748.2 (700.9-795.6) 397 326.9 (294.6-359.1) 1280 271.7 (256.8-286.5) 2015 1165 477.3 (449.9-504.8) 1109 861.1 (810.4-911.8) 467 356.9 (324.3-389.4) 1357 295.1 (279.4-310.9) 2016 841 342.2 (319.1-365.4) 827 642.3 (598.5-686.1) 431 301.8 (273.1-330.5) 1148 254.3 (239.6-269.1) 2017 1053 425.2 (399.5-450.9) 840 649.3 (605.3-693.2) 472 308.1 (280.1-336.0) 1215 271.8 (256.5-287.2)
Table A 67. Childhood pneumonia hospitalisation rate ratios to non-MPA by ethnic group 2000 – 2017, age-adjusted.
Year Māori Pacific Asian
RR 95% CI RR 95% CI RR 95% CI 2000 1.70 (1.64 - 1.77) 2.80 (2.69 - 2.91) 0.62 (0.57 - 0.68) 2001 1.66 (1.6 - 1.72) 3.18 (3.06 - 3.3) 0.67 (0.61 - 0.73) 2002 1.70 (1.64 - 1.77) 3.08 (2.97 - 3.21) 0.86 (0.8 - 0.93) 2003 1.78 (1.71 - 1.85) 3.66 (3.52 - 3.8) 0.86 (0.79 - 0.92) 2004 1.66 (1.59 - 1.74) 3.64 (3.49 - 3.79) 0.89 (0.82 - 0.96) 2005 1.58 (1.52 - 1.64) 2.58 (2.47 - 2.69) 0.81 (0.75 - 0.87) 2006 1.79 (1.72 - 1.86) 3.19 (3.07 - 3.32) 1.00 (0.93 - 1.07) 2007 1.91 (1.83 - 1.99) 3.46 (3.31 - 3.6) 1.16 (1.08 - 1.24) 2008 1.91 (1.84 - 1.99) 3.67 (3.53 - 3.82) 1.24 (1.16 - 1.32) 2009 1.96 (1.89 - 2.04) 3.41 (3.29 - 3.54) 1.11 (1.05 - 1.18) 2010 1.52 (1.46 - 1.59) 2.68 (2.57 - 2.79) 1.20 (1.13 - 1.27) 2011 1.74 (1.67 - 1.81) 3.47 (3.33 - 3.62) 1.17 (1.1 - 1.24) 2012 1.72 (1.65 - 1.8) 3.25 (3.11 - 3.39) 1.24 (1.17 - 1.32) 2013 1.52 (1.46 - 1.59) 2.88 (2.76 - 3.01) 1.13 (1.06 - 1.2) 2014 1.50 (1.44 - 1.57) 2.75 (2.64 - 2.87) 1.20 (1.14 - 1.27) 2015 1.62 (1.56 - 1.68) 2.92 (2.81 - 3.03) 1.21 (1.15 - 1.27) 2016 1.35 (1.29 - 1.41) 2.53 (2.42 - 2.64) 1.19 (1.12 - 1.25) 2017 1.56 (1.5 - 1.63) 2.39 (2.29 - 2.49) 1.13 (1.08 - 1.19)

133
Table A 68. 2017 childhood pneumonia hospitalisation rates by ethnic group and age.
Māori Pacific Asian non-MPA
Age (years) n Rate 95% CI n Rate 95% CI n Rate 95% CI n Rate 95% CI
<5 813 974.2 (907.3-1041.2) 657 1492.9 (1378.8-1607.1) 335 608.0 (542.9-673.1) 781 549.5 (510.9-588)
5-14 240 148.3 (129.5-167) 183 222.9 (190.6-255.2) 137 163.7 (136.3-191.1) 434 131.4 (119-143.8)
Table A 69. 2017 childhood pneumonia hospitalisation rates by NZDep2013 quintile.
NZDep quintile n
Rate
RR 95% CI raw age adj'd 95% CI
1-2 408 234.8 255.4 (230.4-280.3) 1.00 Baseline
3-4 431 260.9 269.4 (243.9-294.8) 1.05 (0.99-1.13)
5-6 545 322.4 325.3 (298.0-352.6) 1.27 (1.20-1.36)
7-8 757 405.9 393.8 (365.7-421.9) 1.54 (1.45-1.64)
9-10 1284 536.9 525.4 (496.6-554.1) 2.06 (1.95-2.17)
Table A 70. Childhood pneumonia hospitalisation rates by NZDep2013 quintile 2000 – 2017, age-adjusted.
NZDep 1-2 NZDep 3-4 NZDep 5-6 NZDep 7-8 NZDep 9-10
Year n Rate 95% CI n Rate 95% CI n Rate 95% CI n Rate 95% CI n Rate 95% CI
2000 350 268.3 (240.1-296.5) 407 291.8 (263.4-320.2) 451 284.1 (257.9-310.4) 749 411.2 (381.8-440.7) 1603 652.1 (620.1-684.0)
2001 337 253.3 (226.2-280.4) 462 329.0 (299.0-359.1) 570 361.7 (332.0-391.4) 809 449.9 (418.9-480.9) 1731 721.6 (687.6-755.6)
2002 340 252.9 (226.0-279.9) 455 323.3 (293.5-353.1) 462 292.9 (266.1-319.6) 753 422.1 (391.9-452.2) 1613 675.3 (642.4-708.3)
2003 353 260.2 (233.0-287.5) 423 298.0 (269.5-326.4) 480 307.8 (280.3-335.4) 704 397.8 (368.4-427.2) 1682 706.2 (672.4-739.9)
2004 321 228.6 (203.5-253.7) 328 227.0 (202.4-251.6) 406 259.0 (233.8-284.3) 634 358.6 (330.7-386.6) 1430 599.1 (568.0-630.1)
2005 344 238.5 (213.2-263.7) 421 284.7 (257.4-311.9) 481 305.6 (278.3-333.0) 688 391.3 (362.1-420.6) 1508 636.1 (604.0-668.2)
2006 351 242.3 (216.9-267.7) 394 266.6 (240.2-292.9) 455 290.0 (263.3-316.6) 716 408.3 (378.4-438.2) 1560 666.5 (633.4-699.5)
2007 329 222.7 (198.6-246.8) 324 214.8 (191.4-238.2) 405 254.8 (230.0-279.6) 653 364.9 (336.9-392.9) 1475 622.8 (591.0-654.5)
2008 368 242.6 (217.8-267.4) 415 269.2 (243.3-295.1) 472 290.7 (264.5-317.0) 689 376.8 (348.7-405.0) 1632 676.1 (643.3-708.9)
2009 412 266.9 (241.1-292.7) 450 286.6 (260.2-313.1) 573 348.3 (319.8-376.9) 850 458.0 (427.2-488.8) 1844 754.5 (720.1-789.0)
2010 426 272.1 (246.3-298.0) 404 254.4 (229.6-279.2) 462 276.2 (251.0-301.4) 740 392.3 (364.0-420.6) 1382 557.2 (527.8-586.6)
2011 356 224.5 (201.1-247.8) 413 258.1 (233.2-282.9) 491 292.5 (266.6-318.3) 691 360.6 (333.7-387.6) 1372 548.3 (519.2-577.4)
2012 325 203.0 (180.9-225.1) 363 227.2 (203.8-250.6) 415 247.6 (223.8-271.5) 672 352.9 (326.2-379.7) 1320 531.5 (502.7-560.2)
2013 352 217.8 (194.9-240.6) 373 232.7 (209.1-256.3) 441 264.1 (239.4-288.7) 573 302.8 (277.9-327.6) 1255 518.8 (490.1-547.6)
2014 401 249.7 (225.2-274.3) 453 284.4 (258.2-310.5) 502 302.1 (275.7-328.6) 705 374.9 (347.2-402.6) 1423 585.0 (554.6-615.4)
2015 441 274.3 (248.6-300.1) 478 301.7 (274.6-328.7) 557 337.7 (309.6-365.7) 818 434.0 (404.2-463.8) 1598 659.7 (627.3-692.1)
2016 406 258.6 (233.4-283.9) 380 238.7 (214.6-262.7) 445 268.1 (243.2-293.0) 604 317.9 (292.5-343.2) 1275 524.2 (495.4-553.0)
2017 408 255.4 (230.4-280.3) 431 269.4 (243.9-294.8) 545 325.3 (298.0-352.6) 757 393.8 (365.7-421.9) 1284 525.4 (496.6-554.1)

134
Table A 71. Childhood pneumonia hospitalisation rates relative to NZDep 1-2 by NZDep2013 quintile 2000 – 2017, age-adjusted.
Year
NZDep 3-4 NZDep 5-6 NZDep 7-8 NZDep 9-10
RR 95% CI RR 95% CI RR 95% CI RR 95% CI
2000 1.09 (1.01 - 1.17) 1.06 (0.99 - 1.13) 1.53 (1.44 - 1.63) 2.43 (2.30 - 2.57)
2001 1.30 (1.21 - 1.39) 1.43 (1.34 - 1.52) 1.78 (1.67 - 1.89) 2.85 (2.69 - 3.02)
2002 1.28 (1.19 - 1.37) 1.16 (1.08 - 1.24) 1.67 (1.57 - 1.78) 2.67 (2.52 - 2.83)
2003 1.14 (1.07 - 1.23) 1.18 (1.11 - 1.26) 1.53 (1.44 - 1.63) 2.71 (2.57 - 2.87)
2004 0.99 (0.92 - 1.07) 1.13 (1.06 - 1.22) 1.57 (1.47 - 1.67) 2.62 (2.47 - 2.78)
2005 1.19 (1.11 - 1.28) 1.28 (1.20 - 1.37) 1.64 (1.54 - 1.75) 2.67 (2.52 - 2.82)
2006 1.10 (1.03 - 1.18) 1.20 (1.12 - 1.28) 1.69 (1.58 - 1.79) 2.75 (2.60 - 2.91)
2007 0.96 (0.90 - 1.04) 1.14 (1.07 - 1.23) 1.64 (1.54 - 1.75) 2.80 (2.64 - 2.96)
2008 1.11 (1.04 - 1.19) 1.20 (1.12 - 1.28) 1.55 (1.46 - 1.65) 2.79 (2.64 - 2.94)
2009 1.07 (1.01 - 1.15) 1.31 (1.23 - 1.39) 1.72 (1.62 - 1.82) 2.83 (2.68 - 2.98)
2010 0.93 (0.88 - 1.00) 1.01 (0.95 - 1.08) 1.44 (1.36 - 1.53) 2.05 (1.94 - 2.16)
2011 1.15 (1.07 - 1.23) 1.30 (1.22 - 1.39) 1.61 (1.51 - 1.71) 2.44 (2.31 - 2.58)
2012 1.12 (1.04 - 1.20) 1.22 (1.14 - 1.31) 1.74 (1.63 - 1.85) 2.62 (2.47 - 2.78)
2013 1.07 (1.00 - 1.15) 1.21 (1.13 - 1.30) 1.39 (1.30 - 1.48) 2.38 (2.25 - 2.52)
2014 1.14 (1.07 - 1.22) 1.21 (1.14 - 1.29) 1.50 (1.41 - 1.59) 2.34 (2.22 - 2.47)
2015 1.10 (1.03 - 1.17) 1.23 (1.16 - 1.31) 1.58 (1.50 - 1.67) 2.40 (2.28 - 2.53)
2016 0.92 (0.86 - 0.99) 1.04 (0.97 - 1.11) 1.23 (1.16 - 1.31) 2.03 (1.92 - 2.14)
2017 1.05 (0.99 - 1.13) 1.27 (1.20 - 1.36) 1.54 (1.45 - 1.64) 2.06 (1.95 - 2.17)
Table A 72. 2017 childhood pneumonia hospitalisation rates by ethnic group and NZDep2013 quintile.
Ethnic group
NZDep quintile
1-2 3-4 5-6 7-8 9-10
Māori
Hosp_Num 42 78 143 250 540
Rate (raw) 191.0 275.2 379.5 443.3 535.4
Rate (age adj'd) 197.9 280.2 379.2 429.9 522.6
95%CI (137.7-258.1) (218.0-342.5) (317.0-441.3) (376.6-483.3) (478.5-566.7)
Pacific
Hosp_Num 22 63 72 161 521
Rate (raw) 361.1 649.0 577.5 617.4 724.2
Rate (age adj'd) 359.1 655.6 561.8 591.9 708.2
95%CI (208.9-509.2) (493.6-817.5) (431.9-691.8) (500.3-683.5) (647.4-769.1)
Asian
Hosp_Num 84 99 97 90 102
Rate (raw) 342.4 335.6 389.1 312.2 336.5
Rate (age adj'd) 316.8 314.4 350.6 272.9 304.1
95%CI (248.8-384.7) (252.3-376.5) (280.3-420.9) (215.8-329.9) (244.8-363.5)
NZ European/ Other
Hosp_Num 264 208 248 296 199
Rate (raw) 198.7 193.7 253.8 353.1 393.4
Rate (age adj'd) 226.7 208.5 263.0 347.5 387.5
95%CI (198.9-254.5) (180.0-237.0) (230.2-295.8) (307.9-387.1) (333.7-441.4)

135
Table A 73. 2017 childhood pneumonia hospitalisation rates by DHB.
DHB n
Rate
raw age adj’d 95%CI
Northland 205 550.5 573.7 (495.0-652.4)
Waitemata 432 364.6 359.4 (325.5-393.3)
Auckland 462 546.8 535.5 (486.6-584.3)
Counties Manukau 576 465.1 460.9 (423.3-498.6)
Waikato 373 433.9 443.6 (398.6-488.7)
Lakes 144 607.3 627.4 (524.8-730.0)
Bay of Plenty 171 359.2 369.0 (313.6-424.3)
Tairawhiti 40 343.6 355.7 (245.2-466.2)
Hawkes Bay 63 179.8 187.8 (141.4-234.2)
Taranaki 94 381.6 391.9 (312.6-471.3)
MidCentral 102 294.2 305.4 (246.1-364.7)
Whanganui 47 356.6 362.0 (258.4-465.5)
Capital and Coast 145 263.1 265.1 (221.9-308.3)
Hutt 155 516.7 516.6 (435.2-597.9)
Wairarapa 32 378.7 398.1 (259.9-536.2)
Nelson Marlborough 43 160.3 173.5 (121.4-225.5)
West Coast 19 328.7 342.1 (188.1-496.1)
Canterbury 216 217.3 219.6 (190.3-248.9)
South Canterbury 16 150.1 154.5 (78.7-230.3)
Southern 91 159.6 163.2 (129.6-196.8)

136
9.4.1. CHILDHOOD PNEUMONIA MORTALITY
Table A 74. Childhood pneumonia mortality rates and age-adjusted rates 2000-2015.
Year n
Rate
Raw (age adj'd) 95% CI
2000 8 0.91 0.95 (0.29-1.61)
2001 2 0.23 0.24 (0.06-0.96)
2002 9 1.02 1.07 (0.37-1.76)
2003 6 0.67 0.70 (0.14-1.27)
2004 20 2.24 2.37 (1.33-3.41)
2005 10 1.12 1.16 (0.44-1.88)
2006 10 1.13 1.17 (0.44-1.89)
2007 14 1.57 1.61 (0.77-2.46)
2008 12 1.34 1.35 (0.58-2.11)
2009 10 1.11 1.10 (0.42-1.78)
2010 11 1.21 1.18 (0.48-1.88)
2011 10 1.10 1.07 (0.41-1.73)
2012 18 1.98 1.93 (1.04-2.82)
2013 9 0.99 0.98 (0.34-1.63)
2014 7 0.77 0.76 (0.2-1.33)
2015 8 0.87 0.87 (0.27-1.48) Trend 2000 -2015
0.04 (-0.03 - 0.11), p=0.289
Table A 75. Childhood pneumonia mortality rates and rate ratios by age group and sex, 2006-2015.
Total Male Female M v F Age (years) n Rate 95% CI n Rate 95% CI n Rate 95% CI RR 95% CI
<5 96 3.1 (2.5-3.8) 52 3.3 (2.4-4.2) 44 3.0 (2.1-3.8) 0.89 (0.73-1.08)
5-14 13 0.2 (0.1-0.3) 8 0.3 (0.1-0.4) 5 0.2 (0-0.3) 0.66 (0.38-1.13)
Table A 76. Childhood pneumonia hospitalisation age group rate ratios by sex, 2006-2015.
Age (years)
Total Male Female
RR 95% CI RR 95% CI RR 95% CI
<5 14.42 (10.89-19.09) 12.68 (8.84-18.18) 17.21 (10.99-26.94)
5-14 1.00 Baseline 1.00 Baseline 1.00 Baseline
Table A 77. Childhood pneumonia mortality rates and rate ratios by ethnic group, 2006-2015.
Total Ethnicity
Rate
n Raw Age adj'd 95% CI RR 95%CI
Māori 53 2.3 2.2 (1.6-2.8) 4.07 (3.25-5.12)
Pacific 38 3.2 3.0 (2.1-4) 5.63 (4.42-7.17)
Asian 5 0.5 0.5 (0.1-0.9) 0.86 (0.54-1.37)
Non-MPA 26 0.5 0.5 (0.3-0.7) 1.00 Baseline

137
Table A 78. Childhood pneumonia mortality rates NZDep2006 quintile, 2006-2015.
NZDep n
Rate
RR 95% CI raw age adj’d 95% CI
1-2 5 0.3 0.3 (0-0.6) 1.00 Baseline
3-4 16 1.0 1.0 (0.5-1.5) 3.10 (1.91-5.05)
5-6 9 0.5 0.5 (0.2-0.9) 1.66 (0.98-2.83)
7-8 14 0.8 0.7 (0.4-1.1) 2.26 (1.38-3.72)
9-10 65 2.8 2.6 (2-3.3) 8.06 (5.18-12.53)
Table A 79. Childhood pneumonia mortality rates by DHB, 2006-2015.
DHB n
Rate
raw age adj’d 95%CI
Northland 7 1.96 2.01 (0.5-3.5)
Waitemata 9 0.81 0.80 (0.3-1.3)
Auckland 5 0.61 0.56 (0.1-1.1)
Counties Manukau 26 2.19 2.14 (1.3-3.0)
Waikato 16 1.98 1.98 (1.0-3.0)
Lakes 2 0.84 0.84 (0.2-3.4)
Bay of Plenty 11 2.43 2.52 (1.0-4.0)
Tairawhiti 0 Hawkes Bay 1 0.29 0.30 (0.0-2.1)
Taranaki 5 2.12 2.14 (0.3-4.0)
MidCentral 5 1.45 1.48 (0.2-2.8)
Whanganui 1 0.75 0.77 (0.1-5.5)
Capital and Coast 8 1.47 1.43 (0.4-2.4)
Hutt 3 0.98 0.98 (0.3-3.0)
Wairarapa 0
Nelson Marlborough 0
West Coast 0
Canterbury 3 0.31 0.31 (0.1-1.0)
South Canterbury 0 Southern 7 1.26 1.28 (0.3-2.2)

138
9.1. COPD IN ADULTS AGED 45+ YEARS
9.1.1. ADULT 45+ YEARS COPD HOSPITALISATIONS
N.B. All rates are per 100,000 people Table A 80. COPD hospitalisations in adults aged 45+, rates and age-adjusted rates 2000-2017.
Year n
Rate
Raw (age adj'd) 95% CI
2000 7327 569.0 574.6 (561.4 - 587.8)
2001 8367 635.0 640.4 (626.6 - 654.2)
2002 8513 629.5 637.1 (623.5 - 650.7)
2003 9384 675.4 689.3 (675.3 - 703.3)
2004 9868 690.8 706.8 (692.8 - 720.8)
2005 9086 619.1 636.3 (623.1 - 649.4)
2006 9856 652.6 673.8 (660.5 - 687.2)
2007 9816 633.3 653.4 (640.5 - 666.4)
2008 10618 668.3 690.5 (677.4 - 703.7)
2009 10970 674.4 696.7 (683.7 - 709.8)
2010 11056 664.6 683.9 (671.2 - 696.7)
2011 11304 665.9 681.0 (668.4 - 693.5)
2012 11539 667.0 675.7 (663.4 - 688)
2013 10931 619.5 623.3 (611.6 - 635)
2014 11214 621.7 620.2 (608.7 - 631.6)
2015 11178 606.3 600.4 (589.3 - 611.6)
2016 10917 578.6 568.0 (557.3 - 578.7)
2017 11842 613.7 596.6 (585.9 - 607.4) Trend 2000 -2017
-2.36 (-6.45 – 1.73), p=0.238
Table A 81. 2017 COPD in adults aged 45+ hospitalisation rates and rate ratios by age group and sex
Total Male Female M v F Age (years) n Rate 95% CI n Rate 95% CI n Rate 95% CI RR 95% CI
45-64 3381 280.2 (270.8-289.7) 1473 253.4 (240.5-266.3) 1908 305.2 (291.5-318.9) 1.20 (1.17-1.24)
65+ 8461 1170.3 (1145.3-1195.2) 4095 1215.7 (1178.4-1252.9) 4366 1130.6 (1097.1-1164.2) 0.93 (0.91-0.95)
Table A 82. 2017 COPD in adults aged 45+ hospitalisation age group rate ratios by sex
Age (years)
Total Male Female
RR 95% CI RR 95% CI RR 95% CI
45-64 1.00 Baseline 1.00 Baseline 1.00 Baseline
65+ 4.18 (4.1-4.26) 4.80 (4.66-4.94) 3.70 (3.61-3.8)

139
Table A 83. 2017 COPD in adults aged 45+ hospitalisation rates and rate ratios by ethnic group.
Total Ethnicity n
Rate RR 95%CI Raw Age adj'd 95% CI
Māori 2743 1461.2 1749.1 (1678.5-1819.8) 3.54 (3.46-3.61) Pacific 798 971.1 1337.8 (1237.8-1437.7) 2.70 (2.60-2.81) Asian 220 107.6 167.5 (143.3-191.7) 0.34 (0.32-0.36) Non-MPA 8079 551.7 494.8 (483.9-505.6) 1.00 Baseline
Table A 84. COPD in adults aged 45+ hospitalisation rates by ethnic group 2000 – 2017, age-adjusted.
Māori Pacific Asian non-MPA
Year n Rate 95% CI n Rate 95% CI n Rate 95% CI n Rate 95% CI 2000 921 1340.7 (1243.7-1437.6) 232 913.1 (787.0-1039.1) 63 243.9 (175.9-311.9) 6003 520.5 (507.2-533.7) 2001 1177 1618.4 (1515.8-1721.0) 343 1249.5 (1106.0-1392.9) 86 290.8 (222.6-358.9) 6624 561.1 (547.5-574.8) 2002 1280 1671.5 (1568.8-1774.2) 380 1310.9 (1167.0-1454.7) 77 218.7 (164.9-272.5) 6656 553.3 (539.9-566.7) 2003 1431 1810.3 (1705.1-1915.6) 423 1401.4 (1257.1-1545.7) 88 209.9 (160.2-259.6) 7326 601.2 (587.3-615.1) 2004 1459 1866.6 (1757.3-1975.8) 508 1585.2 (1435.9-1734.5) 110 257.9 (204.9-310.9) 7717 619.0 (605.1-632.9) 2005 1391 1624.7 (1528.9-1720.4) 397 1220.8 (1090.0-1351.7) 121 314.3 (251.7-377.0) 7089 557.7 (544.6-570.8) 2006 1640 1871.1 (1769.0-1973.3) 512 1523.3 (1377.9-1668.7) 115 250.2 (199.5-300.8) 7518 579.3 (566.2-592.5) 2007 1725 1878.3 (1778.5-1978.0) 530 1388.5 (1261.7-1515.4) 94 178.2 (137.3-219.1) 7401 559.0 (546.2-571.8) 2008 1868 1992.8 (1892.0-2093.6) 560 1527.4 (1391.1-1663.7) 125 238.2 (191.3-285.0) 7997 593.5 (580.4-606.5) 2009 1997 1938.6 (1844.5-2032.7) 627 1501.8 (1375.8-1627.8) 126 213.4 (171.8-255.1) 8169 595.9 (582.9-608.8) 2010 2014 1843.4 (1754.8-1931.9) 610 1407.4 (1287.3-1527.5) 159 225.7 (187.2-264.1) 8258 589.5 (576.8-602.3) 2011 2163 1885.2 (1797.7-1972.6) 626 1453.7 (1329.8-1577.7) 198 282.1 (238.0-326.3) 8289 578.4 (566.0-590.9) 2012 2191 1839.9 (1754.1-1925.8) 690 1518.2 (1395.6-1640.7) 210 269.1 (228.8-309.4) 8431 574.9 (562.6-587.2) 2013 2207 1752.7 (1672.1-1833.2) 622 1302.1 (1190.7-1413.6) 183 220.0 (184.7-255.3) 7894 528.0 (516.3-539.7) 2014 2201 1627.1 (1552.4-1701.8) 626 1250.2 (1143.0-1357.3) 202 230.4 (194.7-266.1) 8172 540.5 (528.8-552.3) 2015 2372 1650.3 (1577.9-1722.7) 663 1203.7 (1103.9-1303.6) 167 157.0 (130.9-183.1) 7952 514.5 (503.1-525.8) 2016 2422 1622.2 (1552.4-1692.1) 732 1294.3 (1193.2-1395.4) 177 137.1 (115.2-159.0) 7565 477.0 (466.2-487.8) 2017 2743 1749.1 (1678.5-1819.8) 798 1337.8 (1237.8-1437.7) 220 167.5 (143.3-191.7) 8079 494.8 (483.9-505.6)
Table A 85. COPD in adults aged 45+ hospitalisation rate ratios to non-MPA by ethnic group 2000 – 2017, age-adjusted.
Year Māori Pacific Asian
RR 95% CI RR 95% CI RR 95% CI 2000 2.58 (2.48 - 2.67) 1.75 (1.64 - 1.88) 0.47 (0.41 - 0.54) 2001 2.88 (2.79 - 2.98) 2.23 (2.10 - 2.36) 0.52 (0.46 - 0.58) 2002 3.02 (2.93 - 3.12) 2.37 (2.24 - 2.50) 0.40 (0.35 - 0.45) 2003 3.01 (2.92 - 3.10) 2.33 (2.21 - 2.45) 0.35 (0.31 - 0.39) 2004 3.02 (2.93 - 3.11) 2.56 (2.44 - 2.68) 0.42 (0.38 - 0.46) 2005 2.91 (2.83 - 3.00) 2.19 (2.08 - 2.31) 0.56 (0.51 - 0.62) 2006 3.23 (3.14 - 3.32) 2.63 (2.51 - 2.76) 0.43 (0.39 - 0.48) 2007 3.36 (3.27 - 3.46) 2.48 (2.37 - 2.60) 0.32 (0.29 - 0.36) 2008 3.36 (3.27 - 3.45) 2.57 (2.46 - 2.69) 0.40 (0.36 - 0.44) 2009 3.25 (3.17 - 3.34) 2.52 (2.42 - 2.63) 0.36 (0.33 - 0.39) 2010 3.13 (3.05 - 3.21) 2.39 (2.29 - 2.49) 0.38 (0.35 - 0.42) 2011 3.26 (3.18 - 3.34) 2.51 (2.41 - 2.62) 0.49 (0.45 - 0.53) 2012 3.20 (3.12 - 3.28) 2.64 (2.54 - 2.75) 0.47 (0.44 - 0.50) 2013 3.32 (3.24 - 3.40) 2.47 (2.36 - 2.57) 0.42 (0.39 - 0.45) 2014 3.01 (2.94 - 3.09) 2.31 (2.22 - 2.41) 0.43 (0.40 - 0.46) 2015 3.21 (3.13 - 3.28) 2.34 (2.24 - 2.44) 0.31 (0.28 - 0.33) 2016 3.40 (3.32 - 3.48) 2.71 (2.61 - 2.82) 0.29 (0.27 - 0.31) 2017 3.54 (3.46 - 3.61) 2.70 (2.60 - 2.81) 0.34 (0.32 - 0.36)

140
Table A 86. 2017 COPD in adults aged 45+ hospitalisation rates by ethnic group and age.
Māori Pacific Asian non-MPA
Age (years) n Rate 95% CI n Rate 95% CI n Rate 95% CI n Rate 95% CI
45-64 1383 976.0 (924.6-1027.4) 284 456.7 (403.5-509.8) 50 33.1 (23.9-42.3) 1675 194.8 (185.5-204.1)
65+ 1360 2955.2 (2798.2-3112.3) 514 2572.4 (2350.1-2794.8) 170 318.8 (270.9-366.7) 6404 1059.2 (1033.3-1085.1)
Table A 87. 2017 COPD in adults aged 45+ hospitalisation rates by NZDep2013 quintile.
NZDep n
Rate
RR 95% CI raw age adj'd 95% CI
1-2 875 215.3 234.5 (218.8-250.2) 1.00 Baseline
3-4 1451 379.1 377.9 (358.4-397.4) 1.61 (1.55-1.68)
5-6 1968 502.6 466.5 (445.9-487.2) 1.99 (1.91-2.07)
7-8 3189 812.9 750.8 (724.5-777) 3.20 (3.09-3.32)
9-10 4350 1222.4 1198.6 (1162.9-1234.3) 5.11 (4.93-5.3)
Table A 88. COPD in adults 45+ hospitalisation rates by NZDep2013 quintile 2000 – 2017, age-adjusted.
NZDep 1-2 NZDep 3-4 NZDep 5-6 NZDep 7-8 NZDep 9-10
Year n Rate 95% CI n Rate 95% CI n Rate 95% CI n Rate 95% CI n Rate 95% CI
2000 660 339.4 (313.3-365.5) 1059 475.3 (446.5-504.1) 1307 462.4 (437.1-487.6) 2042 677.6 (647.9-707.4) 2241 849.2 (813.8-884.6)
2001 715 354.2 (328.0-380.4) 1159 507.1 (477.8-536.4) 1568 542.2 (515.2-569.2) 2234 724.1 (693.7-754.5) 2629 980.3 (942.6-1018.0)
2002 782 376.6 (350.0-403.2) 1159 493.3 (464.8-521.8) 1600 541.9 (515.2-568.6) 2297 726.4 (696.3-756.4) 2663 977.7 (940.4-1015.1)
2003 826 383.8 (357.4-410.2) 1169 482.0 (454.2-509.7) 1701 569.9 (542.7-597.2) 2614 812.7 (781.2-844.2) 3037 1103.0 (1063.6-1142.4)
2004 801 364.7 (339.2-390.2) 1219 487.1 (459.6-514.5) 1764 573.7 (546.8-600.6) 2790 846.6 (814.8-878.4) 3287 1173.2 (1132.8-1213.5)
2005 742 327.4 (303.6-351.1) 1034 402.1 (377.5-426.7) 1569 500.8 (475.9-525.7) 2537 753.5 (723.9-783.1) 3197 1121.2 (1082.1-1160.2)
2006 752 321.9 (298.7-345.1) 1188 449.3 (423.7-475.0) 1675 527.6 (502.3-553) 2656 771.4 (741.7-801.0) 3582 1233.5 (1192.9-1274.0)
2007 766 314.3 (291.9-336.8) 1123 411.0 (386.9-435.1) 1600 487.9 (463.9-511.9) 2719 780.7 (751.1-810.3) 3601 1218.7 (1178.7-1258.6)
2008 779 307.8 (286.0-329.6) 1308 466.8 (441.4-492.1) 1913 570.6 (545-596.3) 2806 793.6 (764.0-823.2) 3796 1265.5 (1225.1-1305.8)
2009 859 325.3 (303.3-347.2) 1288 443.7 (419.5-468.0) 2014 589.3 (563.5-615.1) 2866 798.8 (769.4-828.3) 3938 1295.2 (1254.7-1335.7)
2010 851 309.1 (288.1-330.0) 1326 442.7 (418.9-466.6) 2067 589.3 (563.8-614.7) 2985 816.2 (786.8-845.7) 3818 1234.5 (1195.3-1273.7)
2011 956 335.8 (314.3-357.2) 1308 421.4 (398.6-444.3) 2079 580.4 (555.4-605.4) 3120 835.8 (806.3-865.3) 3836 1220.0 (1181.4-1258.6)
2012 955 322.3 (301.7-343.0) 1426 443.7 (420.7-466.8) 1963 535.7 (511.9-559.4) 3056 802.9 (774.3-831.5) 4136 1290.1 (1250.8-1329.4)
2013 827 267.8 (249.4-286.2) 1251 376.9 (356.0-397.8) 1971 524.8 (501.6-548.0) 2971 765.4 (737.8-793.1) 3902 1196.1 (1158.6-1233.6)
2014 904 277.0 (258.7-295.2) 1291 376.2 (355.6-396.7) 1999 517.4 (494.7-540.1) 2918 737.8 (710.9-764.7) 4092 1218.8 (1181.5-1256.2)
2015 865 253.9 (236.8-271.0) 1273 359.0 (339.3-378.8) 1964 494.9 (472.9-516.8) 2971 735.5 (708.9-762.0) 4084 1190.8 (1154.3-1227.4)
2016 922 256.7 (240.0-273.4) 1272 345.1 (326.1-364.1) 1912 466.7 (445.8-487.7) 2897 700.7 (675.0-726.3) 3912 1108.3 (1073.5-1143.0)
2017 875 234.5 (218.8-250.2) 1451 377.9 (358.4-397.4) 1968 466.5 (445.9-487.2) 3189 750.8 (724.5-777.0) 4350 1198.6 (1162.9-1234.3)

141
Table A 89. COPD in adults 45+ hospitalisation rates relative to NZDep 1-2 by NZDep2013 quintile 2000 – 2017, age-adjusted.
Year
NZDep 3-4 NZDep 5-6 NZDep 7-8 NZDep 9-10
RR 95% CI RR 95% CI RR 95% CI RR 95% CI
2000 1.40 (1.34 - 1.47) 1.36 (1.30 - 1.43) 2.00 (1.91 - 2.08) 2.50 (2.40 - 2.61)
2001 1.43 (1.37 - 1.50) 1.53 (1.47 - 1.60) 2.04 (1.96 - 2.13) 2.77 (2.66 - 2.88)
2002 1.31 (1.25 - 1.37) 1.44 (1.38 - 1.50) 1.93 (1.85 - 2.01) 2.60 (2.50 - 2.70)
2003 1.26 (1.20 - 1.31) 1.49 (1.43 - 1.55) 2.12 (2.04 - 2.20) 2.87 (2.77 - 2.98)
2004 1.34 (1.28 - 1.39) 1.57 (1.51 - 1.64) 2.32 (2.23 - 2.41) 3.22 (3.10 - 3.34)
2005 1.23 (1.17 - 1.29) 1.53 (1.47 - 1.60) 2.30 (2.21 - 2.4) 3.42 (3.29 - 3.56)
2006 1.40 (1.33 - 1.46) 1.64 (1.57 - 1.71) 2.40 (2.30 - 2.49) 3.83 (3.69 - 3.98)
2007 1.31 (1.25 - 1.37) 1.55 (1.49 - 1.62) 2.48 (2.39 - 2.58) 3.88 (3.73 - 4.03)
2008 1.52 (1.45 - 1.58) 1.85 (1.78 - 1.93) 2.58 (2.48 - 2.68) 4.11 (3.96 - 4.27)
2009 1.36 (1.31 - 1.42) 1.81 (1.74 - 1.88) 2.46 (2.37 - 2.55) 3.98 (3.84 - 4.13)
2010 1.43 (1.37 - 1.49) 1.91 (1.83 - 1.98) 2.64 (2.54 - 2.74) 3.99 (3.85 - 4.14)
2011 1.26 (1.21 - 1.31) 1.73 (1.67 - 1.79) 2.49 (2.40 - 2.58) 3.63 (3.51 - 3.76)
2012 1.38 (1.32 - 1.43) 1.66 (1.60 - 1.73) 2.49 (2.40 - 2.58) 4.00 (3.87 - 4.14)
2013 1.41 (1.35 - 1.47) 1.96 (1.88 - 2.04) 2.86 (2.75 - 2.97) 4.47 (4.31 - 4.63)
2014 1.36 (1.30 - 1.42) 1.87 (1.80 - 1.94) 2.66 (2.57 - 2.76) 4.40 (4.25 - 4.56)
2015 1.41 (1.36 - 1.47) 1.95 (1.87 - 2.03) 2.90 (2.79 - 3.01) 4.69 (4.53 - 4.86)
2016 1.34 (1.29 - 1.40) 1.82 (1.75 - 1.89) 2.73 (2.63 - 2.83) 4.32 (4.17 - 4.47)
2017 1.61 (1.55 - 1.68) 1.99 (1.91 - 2.07) 3.20 (3.09 - 3.32) 5.11 (4.93 - 5.30)
Table A 90. 2017 COPD in adults aged 45+ hospitalisation rates by ethnic group and NZDep2013 quintile.
Ethnic group
NZDep quintile
1-2 3-4 5-6 7-8 9-10
Māori
Hosp_Num 75 165 298 664 1537
Rate (raw) 428.5 734.2 1011.6 1539.1 2051.7
Rate (age adj'd) 681.0 942.4 1226.6 1855.0 2382.2
95%CI (496.7-865.3) (785.8-1099.0) (1079.4-1373.8) (1698.2-2011.7) (2252.6-2511.8)
Pacific
Hosp_Num 15 44 56 140 542
Rate (raw) 307.8 642.8 617.6 876.5 1223.9
Rate (age adj'd) 653.2 1089.5 941.3 1251.9 1721.4
95%CI (186.2-1120.2) (712.4-1466.7) (658.5-1224.1) (1020.8-1483.0) (1563.3-1879.6)
Asian
Hosp_Num 25 48 33 47 67
Rate (raw) 60.3 103.5 83.9 124.3 173.5
Rate (age adj'd) 94.5 183.9 123.0 198.8 284.8
95%CI (54.2-134.9) (129.0-238.9) (77.3-168.7) (135.6-262) (198.7-371)
NZ European/ Other
Hosp_Num 756 1184 1581 2343 2210
Rate (raw) 214.5 375.8 505.7 798.2 1162.6
Rate (age adj'd) 226.8 352.1 434.8 674.0 975.6
95%CI (210.5-243.1) (332.0-372.2) (413.2-456.5) (646.1-701.9) (934.1-1017.2)

142
Table A 91. 2017 COPD in adults aged 45+ hospitalisation rates by DHB.
DHB n
Rate
raw age adj’d 95%CI
Northland 660 790.5 719.0 (663.7-774.4)
Waitemata 1087 466.8 479.5 (450.9-508.0)
Auckland 702 409.5 437.8 (405.3-470.3)
Counties Manukau 1083 573.3 615.0 (578.1-651.9)
Waikato 1405 849.3 812.9 (770.2-855.5)
Lakes 396 872.1 838.2 (755.3-921.2)
Bay of Plenty 708 657.7 584.2 (540.7-627.7)
Tairawhiti 166 847.8 806.0 (683.0-929.0)
Hawkes Bay 627 846.4 776.9 (715.7-838.1)
Taranaki 490 948.7 891.3 (812.1-970.5)
MidCentral 420 554.6 502.8 (454.4-551.2)
Whanganui 335 1111.5 989.4 (882.7-1096)
Capital and Coast 537 460.5 475.7 (435.4-516.1)
Hutt 369 613.4 616.1 (553.1-679.1)
Wairarapa 162 733.4 659.1 (556.6-761.7)
Nelson Marlborough 282 377.8 342.8 (302.5-383.1)
West Coast 168 1044.8 1033.3 (875.7-1190.9)
Canterbury 1181 523.0 512.3 (483.0-541.5)
South Canterbury 164 555.2 477.9 (404.1-551.6)
Southern 900 651.9 612.1 (572.0-652.3)
9.1.1. ADULT 45+ YEARS COPD MORTALITY
Table A 92. COPD in adults 45+ mortality rates and age-adjusted rates 2000-2015.
Year n Rate Raw (age adj'd) 95% CI
2000 1441 111.91 114.56 (108.60-120.52) 2001 1709 129.71 132.17 (125.86-138.47) 2002 1598 118.17 121.04 (115.07-127.00) 2003 1641 118.10 120.93 (115.04-126.81) 2004 1704 119.28 123.22 (117.34-129.10) 2005 1473 100.36 103.55 (98.24-108.86) 2006 1541 102.04 105.77 (100.47-111.07) 2007 1471 94.91 98.20 (93.16-103.23) 2008 1671 105.18 108.97 (103.74-114.21) 2009 1563 96.08 99.71 (94.76-104.66) 2010 1482 89.08 91.74 (87.07-96.41) 2011 1591 93.73 96.03 (91.31-100.75) 2012 1540 89.01 90.47 (85.95-94.99) 2013 1499 84.96 85.98 (81.63-90.33) 2014 1616 89.59 89.73 (85.35-94.11) 2015 1579 85.65 85.04 (80.84-89.24)
Trend 2000 -2015
-2.81 (-3.53 - -2.09), p<0.001

143
Table A 93. COPD in adults aged 45+ mortality rates and rate ratios by age group and sex, 2015.
Total Male Female M v F
Age (years) n Rate 95% CI n Rate 95% CI n Rate 95% CI RR 95% CI
45-64 163 13.9 (11.8-16.1) 76 13.4 (10.4-16.5) 87 14.4 (11.4-17.4) 1.07 (0.92-1.24)
65+ 1416 210.0 (199.1-220.9) 741 237.0 (219.9-254.1) 675 186.7 (172.6-200.7) 0.79 (0.75-0.83)
Table A 94. COPD in adults aged 45+ age group mortality rate ratios by sex, 2015.
Age (years)
Total Male Female
RR 95% CI RR 95% CI RR 95% CI
45-64 1.00 Baseline 1.00 Baseline 1.00 Baseline
65+ 15.06 (13.93-16.3) 17.62 (15.72-19.76) 12.96 (11.63-14.44)
Table A 95. COPD in adults aged 45+ mortality rates and rate ratios by ethnic group, 2015.
Total Ethnicity
Rate
n Raw Age adj'd 95% CI RR 95%CI
Māori 205 117.1 183.4 (155.6-211.3) 2.24 (2.07-2.42)
Pacific 39 50.9 88.8 (58.2-119.4) 1.08 (0.92-1.28)
Asian 22 12.8 30.7 (16.9-44.5) 0.37 (0.3-0.47)
Non-MPA 1312 92.6 81.9 (77.4-86.3) 1.00 Baseline
Table A 96. COPD in adults aged 45+ mortality rates by ethnic group and age, 2015.
Māori Pacific Asian non-MPA
Age (years) n Rate 95% CI n Rate 95% CI n Rate 95% CI n Rate 95% CI
45-64 48 35.8 (25.7-45.9) 10 17.1 (6.5-27.7) 1 0.8 (0.1-5.5) 104 12.3 (9.9-14.6)
65+ 157 383.4 (323.4-443.4) 29 160.5 (102.1-218.8) 21 50.7 (29-72.4) 1208 211.9 (200-223.9)
Table A 97. COPD in adults aged 45+ mortality rates by NZDep2006 quintile, 2015.
NZDep n Rate (raw)
Rate (age adj'd) 95% CI RR 95% CI
1-2 182 47.2 56.9 (48.6-65.3) 1.00 Baseline
3-4 222 60.8 64.0 (55.5-72.4) 1.12 (1.02-1.24)
5-6 307 81.9 75.2 (66.8-83.7) 1.32 (1.21-1.44)
7-8 428 113.8 100.0 (90.5-109.5) 1.76 (1.61-1.91)
9-10 438 128.4 128.9 (116.8-140.9) 2.26 (2.08-2.46)

144
Table A 98. COPD in adults aged 45+ mortality rates by ethnic group and NZDep2013 quintile, 2015.
NZDep2013 quintile Ethnic group 1-2 3-4 5-6 7-8 9-10
Māori
Hosp_Num 1 18 23 40 122 Rate (raw) 6.4 88.4 84.3 99.3 170.6 Rate (age adj'd) 12.8 155.5 130.1 169.0 258.4 95%CI (1.8-90.7) (76.2-234.8) (73.6-186.5) (106.9-231) (206.7-310)
Pacific
Hosp_Num 1 0 4 7 27 Rate (raw) 22.8 0.0 48.4 46.8 64.5 Rate (age adj'd) 148.5 0.0 83.1 92.2 113.2 95%CI (20.9-1054.5) (0-0) (0-166.1) (11.5-172.9) (65.8-160.5)
Asian
Hosp_Num 3 2 6 5 6 Rate (raw) 8.7 5.2 18.0 15.7 18.2 Rate (age adj'd) 21.9 10.7 48.3 37.6 49.2 95%CI (6.5-73.6) (2.1-53.8) (8.2-88.5) (3.1-72.2) (0.9-97.5)
NZ European/ Other
Hosp_Num 177 202 274 376 282 Rate (raw) 53.1 66.8 90.2 130.8 148.1 Rate (age adj'd) 60.9 64.2 75.1 101.1 116.1 95%CI (51.9-70) (55.4-73.1) (66.1-84) (90.8-111.5) (102.4-129.7)
Table A 99. COPD in adults aged 45+ mortality rates by DHB, 2015.
DHB n Rate (raw) Rate (age adj’d) 95%CI
Northland 90 114.5 108.8 (86.2-131.4)
Waitemata 124 55.7 59.1 (48.7-69.5)
Auckland 119 72.3 80.5 (66-95)
Counties Manukau 118 65.5 76.7 (62.8-90.7)
Waikato 121 77.2 74.3 (61.1-87.6)
Lakes 57 132.4 135.2 (100-170.4)
Bay of Plenty 108 106.6 91.7 (74.4-109.1)
Tairawhiti 23 122.7 124.3 (73.4-175.1)
Hawkes Bay 55 77.6 70.4 (51.8-89)
Taranaki 55 110.2 100.2 (73.6-126.7)
MidCentral 62 85.3 76.0 (57-94.9)
Whanganui 41 141.7 125.2 (86.7-163.7)
Capital and Coast 63 56.5 59.5 (44.8-74.2)
Hutt 48 82.7 86.2 (61.8-110.6)
Wairarapa 17 80.7 72.8 (38.2-107.4)
Nelson Marlborough 78 109.4 101.0 (78.5-123.4)
West Coast 20 128.0 129.8 (72.6-187)
Canterbury 184 85.2 83.1 (71.1-95.1)
South Canterbury 32 111.3 92.7 (60.5-125)
Southern 162 122.1 114.5 (96.8-132.1)

145
9.2. TOTAL SERIOUS RESPIRATORY DISEASE
9.2.1. TOTAL RESPIRATORY HOSPITALISATIONS
N.B. All rates are per 100,000 people Table A 100. Total respiratory hospitalisations, rates and age-adjusted rates 2000-2017.
Year n Rate Raw (age adj'd) 95% CI
2000 54886 1422.7 1476.8 (1464.2 - 1489.3) 2001 58336 1503.3 1560.8 (1548.0 - 1573.6) 2002 58214 1474.4 1538.3 (1525.7 – 1551.0) 2003 58738 1458.5 1535.9 (1523.4 - 1548.5) 2004 59328 1451.4 1530.6 (1518.2 - 1543.1) 2005 58216 1408.3 1475.2 (1463.1 - 1487.3) 2006 60900 1455.3 1526.5 (1514.3 - 1538.6) 2007 60203 1425.3 1480.1 (1468.3 – 1492.0) 2008 66703 1565.9 1613.8 (1601.5 - 1626.1) 2009 72427 1683.4 1717.1 (1704.6 - 1729.7) 2010 71805 1650.4 1673.5 (1661.3 - 1685.8) 2011 73787 1683.1 1698.5 (1686.3 - 1710.8) 2012 75944 1722.8 1729.7 (1717.4 – 1742.0) 2013 72210 1625.6 1629.1 (1617.2 – 1641.0) 2014 77650 1721.8 1725.0 (1712.9 - 1737.2) 2015 81001 1762.5 1770.2 (1758.0 - 1782.4) 2016 78595 1674.6 1682.9 (1671.1 - 1694.6) 2017 86457 1803.5 1812.0 (1799.8 - 1824.1) Trend 2000 -2015
17.37 (11.79-22.96), p<0.001
Table A 101. 2017 total respiratory hospitalisation rates and rate ratios by age group and sex
Total Male Female M v F
Age (years) n Rate 95% CI n Rate 95% CI n Rate 95% CI RR 95% CI
<15 25857 2769.21594 (2735.5-2803) 14750 3079.3 (3029.6-3129) 11107 2442.6 (2397.2-2488) 0.79 (0.78-0.8)
15-29 7967 770.3576211 (753.4-787.3) 3109 585.3 (564.7-605.9) 4858 965.8 (938.6-992.9) 1.65 (1.61-1.69)
30-64 21547 1024.635086 (1011-1038.3) 9784 964.9 (945.7-984) 11763 1080.3 (1060.8-1099.8) 1.12 (1.11-1.13)
65+ 31086 4299.079638 (4251.3-4346.9) 15561 4618.4 (4545.8-4691) 15525 4020.5 (3957.2-4083.7) 0.87 (0.86-0.88)
Table A 102. 2017 total respiratory hospitalisation age group rate ratios by sex
Age (years)
Total Male Female
RR 95% CI RR 95% CI RR 95% CI
<15 2.70 (2.68-2.73) 3.19 (3.15-3.23) 2.26 (2.23-2.29)
15-29 0.75 (0.74-0.76) 0.61 (0.59-0.62) 0.89 (0.88-0.91)
30-64 1.00 Baseline 1.00 Baseline 1.00 Baseline
65+ 4.20 (4.16-4.23) 4.79 (4.73-4.85) 3.72 (3.68-3.77)

146
Table A 103. 2017 total respiratory hospitalisation rates and rate ratios by ethnic group.
Total Ethnicity
Rate n Raw Age adj'd 95% CI RR 95%CI
Māori 20092 2674.3 3152.0 (3099.3-3204.7) 2.03 (2.02-2.05) Pacific 11304 2994.9 3884.5 (3791.4-3977.7) 2.51 (2.48-2.54) Asian 6305 892.7 1102.5 (1070.8-1134.1) 0.71 (0.70-0.72) Non-MPA 50168 1643.7 1549.8 (1535.6-1563.9) 1.00 Baseline
Table A 104. Total respiratory hospitalisation rates and rate ratios by ethnic group, 2000 – 2017, age-adjusted.
Māori Pacific Asian non-MPA
Year n Rate 95% CI n Rate 95% CI n Rate 95% CI n Rate 95% CI 2000 11285 2411.0 (2343.1-2478.9) 5380 2515.6 (2411.8-2619.3) 1458 788.1 (730.0-846.2) 35960 1323.7 (1309.9-1337.5) 2001 12239 2638.0 (2567.3-2708.6) 6614 2925.8 (2816.6-3035.0) 1829 955.5 (896.2-1014.9) 37074 1351.1 (1337.3-1365.0) 2002 12638 2641.8 (2573.2-2710.4) 6916 3060.0 (2947.9-3172.1) 1906 871.7 (818.5-924.9) 36270 1315.6 (1301.9-1329.3) 2003 13037 2804.8 (2733.4-2876.1) 7246 3067.0 (2958.9-3175.1) 2082 813.4 (765.9-861.0) 36260 1299.5 (1285.9-1313.0) 2004 12926 2757.1 (2687.0-2827.2) 7365 3177.7 (3068.4-3286.9) 2226 865.8 (817.2-914.4) 36824 1301.4 (1288.0-1314.9) 2005 12880 2558.8 (2495.5-2622.2) 6707 2657.7 (2562.2-2753.3) 2382 884.2 (835.6-932.8) 36335 1274.1 (1260.9-1287.4) 2006 13399 2718.3 (2652.8-2783.8) 7582 3125.8 (3020.0-3231.6) 2521 904.9 (858.4-951.5) 37542 1295.1 (1281.8-1308.3) 2007 13598 2673.4 (2609.8-2737.1) 7727 3073.9 (2973.6-3174.1) 2665 868.4 (825.7-911.0) 36543 1246.3 (1233.4-1259.3) 2008 15070 2863.3 (2799.3-2927.2) 8932 3445.9 (3341.8-3549.9) 3195 1026.0 (979.6-1072.3) 40084 1351.5 (1338.1-1364.9) 2009 17245 3034.7 (2972.8-3096.5) 10346 3830.7 (3725.5-3935.9) 3554 1004.8 (963.0-1046.6) 42141 1413.7 (1400.0-1427.4) 2010 16316 2828.5 (2769.6-2887.4) 9366 3425.0 (3327.5-3522.5) 3928 1079.9 (1037.7-1122.1) 43168 1434.1 (1420.4-1447.8) 2011 16633 2899.2 (2840.4-2958.0) 10019 3605.1 (3505.6-3704.5) 4166 1136.0 (1092.1-1179.9) 44140 1441.2 (1427.5-1454.9) 2012 17240 2984.9 (2925.4-3044.4) 10295 3659.2 (3560.5-3758.0) 4500 1153.6 (1111.5-1195.8) 45066 1464.9 (1451.1-1478.7) 2013 16094 2777.6 (2722.1-2833.0) 9401 3338.9 (3246.0-3431.8) 4582 1114.2 (1074.2-1154.2) 43099 1393.5 (1380.1-1407.0) 2014 17207 2880.5 (2825.4-2935.6) 10398 3670.1 (3575.2-3765.0) 5046 1126.1 (1087.9-1164.3) 46229 1488.0 (1474.0-1501.9) 2015 18735 3015.6 (2961.0-3070.1) 11101 3774.9 (3681.2-3868.7) 5577 1132.8 (1097.2-1168.4) 46869 1497.6 (1483.6-1511.5) 2016 17686 2823.0 (2771.8-2874.2) 10030 3410.3 (3322.6-3497.9) 5611 1025.3 (993.9-1056.8) 46421 1471.0 (1457.2-1484.9) 2017 20092 3152.0 (3099.3-3204.7) 11304 3884.5 (3791.4-3977.7) 6305 1102.5 (1070.8-1134.1) 50168 1549.8 (1535.6-1563.9)
Table A 105. Total respiratory hospitalisation rate ratios to non-MPA by ethnic group 2000 – 2017, age-adjusted.
Year Māori Pacific Asian RR 95% CI RR 95% CI RR 95% CI
2000 1.82 (1.8 - 1.85) 1.90 (1.86 - 1.94) 0.60 (0.57 - 0.62) 2001 1.95 (1.93 - 1.98) 2.17 (2.13 - 2.21) 0.71 (0.69 - 0.73) 2002 2.01 (1.98 - 2.04) 2.33 (2.28 - 2.37) 0.66 (0.64 - 0.68) 2003 2.16 (2.13 - 2.19) 2.36 (2.32 - 2.4) 0.63 (0.61 - 0.64) 2004 2.12 (2.09 - 2.15) 2.44 (2.4 - 2.48) 0.67 (0.65 - 0.68) 2005 2.01 (1.98 - 2.03) 2.09 (2.05 - 2.12) 0.69 (0.68 - 0.71) 2006 2.10 (2.07 - 2.13) 2.41 (2.37 - 2.46) 0.70 (0.68 - 0.72) 2007 2.15 (2.12 - 2.17) 2.47 (2.43 - 2.51) 0.70 (0.68 - 0.71) 2008 2.12 (2.09 - 2.14) 2.55 (2.51 - 2.59) 0.76 (0.74 - 0.78) 2009 2.15 (2.12 - 2.17) 2.71 (2.67 - 2.75) 0.71 (0.7 - 0.73) 2010 1.97 (1.95 - 1.99) 2.39 (2.35 - 2.42) 0.75 (0.74 - 0.77) 2011 2.01 (1.99 - 2.03) 2.50 (2.47 - 2.54) 0.79 (0.77 - 0.8) 2012 2.04 (2.02 - 2.06) 2.50 (2.46 - 2.53) 0.79 (0.77 - 0.8) 2013 1.99 (1.97 - 2.01) 2.40 (2.36 - 2.43) 0.80 (0.79 - 0.81) 2014 1.94 (1.92 - 1.96) 2.47 (2.43 - 2.5) 0.76 (0.74 - 0.77) 2015 2.01 (1.99 - 2.03) 2.52 (2.49 - 2.55) 0.76 (0.74 - 0.77) 2016 1.92 (1.9 - 1.94) 2.32 (2.29 - 2.35) 0.70 (0.69 - 0.71) 2017 2.03 (2.02 - 2.05) 2.51 (2.48 - 2.54) 0.71 (0.7 - 0.72)

147
Table A 106. 2017 total respiratory hospitalisation rates by ethnic group and age.
Māori Pacific Asian non-MPA
Age (years) n Rate 95% CI n Rate 95% CI n Rate 95% CI n Rate 95% CI
<15 8829 3599.3 (3524.2-3674.3) 5169 4099.2 (3987.4-4210.9) 2654 1912.1 (1839.4-1984.9) 10338 2188.4 (2146.2-2230.6)
15-29 2034 1044.5 (999.1-1089.9) 1242 1195.8 (1129.3-1262.3) 725 393.3 (364.7-422.0) 4215 727.8 (705.8-749.8)
30-64 5673 2138.9 (2083.2-2194.6) 2775 2176.5 (2095.5-2257.5) 1640 497.2 (473.2-521.3) 11596 830.7 (815.6-845.8)
65+ 3556 7727.1 (7473.1-7981.0) 2118 10600.1 (10148.6-11051.5) 1286 2411.7 (2279.9-2543.5) 24019 3972.6 (3922.4-4022.9)
Table A 107. 2017 total respiratory hospitalisation rates by NZDep2013 quintile.
n Rate (raw)
Rate (age adj'd) 95% CI RR 95% CI
NZDep 1-2 10460 1128.3 1197.2 (1174-1220.4) 1.00 Baseline
3-4 12256 1366.4 1384.5 (1359.8-1409.1) 1.16 (1.14-1.17)
5-6 14932 1613.7 1575.2 (1549.7-1600.7) 1.32 (1.3-1.33)
7-8 20183 2041.4 1987.8 (1960.1-2015.4) 1.66 (1.64-1.68)
9-10 28556 2707.0 2806.6 (2773.6-2839.6) 2.34 (2.32-2.37)
Table A 108. Total respiratory hospitalisation rates by NZDep2013 quintile 2000 – 2017, age-adjusted.
NZDep 1-2 NZDep 3-4 NZDep 5-6 NZDep 7-8 NZDep 9-10
Year n Rate 95% CI n Rate 95% CI n Rate 95% CI n Rate 95% CI n Rate 95% CI
2000 5928 1021.3 (994.7-1047.8) 7757 1219.1 (1191.7-1246.6) 9496 1269.9 (1244.1-1295.6) 13352 1610.4 (1582.8-1638.1) 18155 2025.0 (1994.2-2055.8)
2001 6008 1015.6 (989.4-1041.8) 8366 1297.0 (1268.9-1325.1) 10125 1339.4 (1313.1-1365.7) 14073 1690.6 (1662.4-1718.8) 19224 2157.6 (2125.8-2189.3)
2002 6087 1007.8 (982-1033.6) 8081 1227.2 (1200.2-1254.2) 10213 1338.9 (1312.8-1365.0) 13939 1666.8 (1638.9-1694.7) 19821 2196.0 (2164.3-2227.8)
2003 6066 985.0 (959.7-1010.2) 7749 1156.1 (1130.1-1182.1) 9963 1293.5 (1267.9-1319.0) 14137 1674.1 (1646.3-1701.9) 20485 2271.9 (2239.7-2304.1)
2004 6064 958.2 (933.7-982.8) 7552 1107.2 (1082.1-1132.4) 9932 1273.9 (1248.8-1299.1) 14204 1663.2 (1635.6-1690.8) 21516 2381.8 (2348.9-2414.7)
2005 6125 935.0 (911.2-958.8) 7253 1031.3 (1007.4-1055.2) 9890 1253.5 (1228.7-1278.3) 14203 1643.0 (1615.8-1670.2) 20668 2264.4 (2232.6-2296.2)
2006 6450 966.2 (942.3-990.2) 7755 1089.2 (1064.8-1113.6) 10034 1256.0 (1231.4-1280.7) 14731 1687.5 (1660.1-1715.0) 21866 2389.2 (2356.7-2421.7)
2007 6330 921.4 (898.4-944.4) 7468 1023.6 (1000.3-1047.0) 9851 1208.1 (1184.2-1232.0) 14725 1664.8 (1637.7-1691.8) 21774 2361.5 (2329.3-2393.7)
2008 6846 972.7 (949.4-996.1) 8460 1137.2 (1112.8-1161.5) 11101 1342.0 (1317.0-1367.1) 15772 1756.8 (1729.3-1784.4) 24372 2612.8 (2579.1-2646.4)
2009 7444 1028.0 (1004.4-1051.7) 9284 1219.0 (1194.1-1243.9) 12404 1478.8 (1452.7-1504.9) 17005 1864.5 (1836.4-1892.7) 26235 2749.6 (2715.5-2783.7)
2010 7953 1070.7 (1046.9-1094.5) 9480 1220.7 (1196.1-1245.4) 12634 1478.4 (1452.5-1504.2) 17020 1835.0 (1807.3-1862.7) 24683 2576.1 (2543.2-2609.0)
2011 8138 1075.1 (1051.5-1098.7) 9955 1257.7 (1232.9-1282.4) 12866 1485.9 (1460.1-1511.6) 17630 1878.8 (1851.0-1906.7) 25162 2615.4 (2582.4-2648.4)
2012 8646 1115.9 (1092.1-1139.6) 10437 1300.1 (1275.2-1325.1) 12853 1473.4 (1447.9-1498.9) 18007 1902.7 (1874.8-1930.6) 25969 2696.4 (2663.0-2729.9)
2013 8140 1027.5 (1005.0-1050.0) 9755 1195.8 (1172.0-1219.5) 12422 1408.8 (1383.9-1433.6) 17070 1794.4 (1767.4-1821.4) 24767 2584.5 (2551.7-2617.2)
2014 8945 1103.4 (1080.4-1126.5) 10460 1264.1 (1239.9-1288.4) 13256 1481.5 (1456.2-1506.8) 18295 1903.9 (1876.2-1931.7) 26651 2735.4 (2702.1-2768.8)
2015 9173 1102.8 (1080.0-1125.5) 11000 1307.6 (1283.1-1332.1) 13620 1501.5 (1476.1-1526.8) 19343 1984.6 (1956.5-2012.7) 27666 2792.9 (2759.5-2826.3)
2016 9463 1114.2 (1091.6-1136.9) 11008 1280.2 (1256.2-1304.2) 13379 1441.9 (1417.3-1466.5) 18546 1863.5 (1836.5-1890.4) 26168 2600.9 (2569-2632.9)
2017 10460 1197.2 (1174.0-1220.4) 12256 1384.5 (1359.8-1409.1) 14932 1575.2 (1549.7-1600.7) 20183 1987.8 (1960.1-2015.4) 28556 2806.6 (2773.6-2839.6)

148
Table A 109. Total respiratory hospitalisation rates relative to NZDep 1-2 by NZDep2013 quintile 2000 – 2017, age-adjusted.
Year
NZDep 3-4 NZDep 5-6 NZDep 7-8 NZDep 9-10
RR 95% CI RR 95% CI RR 95% CI RR 95% CI
2000 1.19 (1.17 - 1.21) 1.24 (1.22 - 1.26) 1.58 (1.55 - 1.60) 1.98 (1.95 - 2.01)
2001 1.28 (1.26 - 1.30) 1.32 (1.30 - 1.34) 1.66 (1.64 - 1.69) 2.12 (2.09 - 2.16)
2002 1.22 (1.20 - 1.24) 1.33 (1.31 - 1.35) 1.65 (1.63 - 1.68) 2.18 (2.15 - 2.21)
2003 1.17 (1.15 - 1.19) 1.31 (1.29 - 1.33) 1.70 (1.67 - 1.72) 2.31 (2.27 - 2.34)
2004 1.16 (1.14 - 1.17) 1.33 (1.31 - 1.35) 1.74 (1.71 - 1.76) 2.49 (2.45 - 2.52)
2005 1.10 (1.08 - 1.12) 1.34 (1.32 - 1.36) 1.76 (1.73 - 1.78) 2.42 (2.39 - 2.46)
2006 1.13 (1.11 - 1.15) 1.30 (1.28 - 1.32) 1.75 (1.72 - 1.77) 2.47 (2.44 - 2.51)
2007 1.11 (1.09 - 1.13) 1.31 (1.29 - 1.33) 1.81 (1.78 - 1.83) 2.56 (2.53 - 2.60)
2008 1.17 (1.15 - 1.19) 1.38 (1.36 - 1.40) 1.81 (1.78 - 1.83) 2.69 (2.65 - 2.72)
2009 1.19 (1.17 - 1.20) 1.44 (1.42 - 1.46) 1.81 (1.79 - 1.84) 2.67 (2.64 - 2.71)
2010 1.14 (1.12 - 1.16) 1.38 (1.36 - 1.40) 1.71 (1.69 - 1.74) 2.41 (2.38 - 2.44)
2011 1.17 (1.15 - 1.19) 1.38 (1.36 - 1.40) 1.75 (1.73 - 1.77) 2.43 (2.40 - 2.46)
2012 1.17 (1.15 - 1.18) 1.32 (1.30 - 1.34) 1.71 (1.68 - 1.73) 2.42 (2.39 - 2.45)
2013 1.16 (1.15 - 1.18) 1.37 (1.35 - 1.39) 1.75 (1.72 - 1.77) 2.52 (2.48 - 2.55)
2014 1.15 (1.13 - 1.16) 1.34 (1.33 - 1.36) 1.73 (1.70 - 1.75) 2.48 (2.45 - 2.51)
2015 1.19 (1.17 - 1.20) 1.36 (1.34 - 1.38) 1.80 (1.78 - 1.82) 2.53 (2.50 - 2.56)
2016 1.15 (1.13 - 1.16) 1.29 (1.28 - 1.31) 1.67 (1.65 - 1.69) 2.33 (2.31 - 2.36)
2017 1.16 (1.14 - 1.17) 1.32 (1.30 - 1.33) 1.66 (1.64 - 1.68) 2.34 (2.32 - 2.37)
Table A 110. 2017 total respiratory hospitalisation rates by ethnic group and NZDep quintile.
NZDep quintile
Ethnic group 1-2 3-4 5-6 7-8 9-10
Māori
Hosp_Num 805 1467 2462 4712 10627
Rate (raw) 1191.1 1680.2 2095.7 2678.0 3510.4
Rate (age adj'd) 1480.6 1963.4 2474.0 3163.6 4151.4
95%CI (1343.4-1617.8) (1838.8-2088) (2358.3-2589.8) (3051.4-3275.7) (4054.5-4248.4)
Pacific
Hosp_Num 363 803 1085 2273 6771
Rate (raw) 1871.5 2657.4 2703.0 3001.1 3231.3
Rate (age adj'd) 3075.2 3605.7 3499.1 4075.2 4351.4
95%CI (2510.2-3640.2) (3245.1-3966.3) (3214-3784.3) (3845.5-4305) (4212.8-4490)
Asian
Hosp_Num 913 1205 1117 1337 1732
Rate (raw) 752.9 822.8 840.4 941.1 1073.0
Rate (age adj'd) 851.2 1041.9 1069.1 1185.9 1494.8
95%CI (789.5-913) (975-1108.9) (996.2-1141.9) (1109.5-1262.3) (1395.7-1594)
NZ European/ Other
Hosp_Num 8380 8879 10421 12200 10246
Rate (raw) 1132.2 1345.5 1615.7 1984.8 2617.1
Rate (age adj'd) 1180.1 1303.0 1498.6 1799.9 2363.0
95%CI (1154.1-1206) (1275-1331) (1468.3-1528.8) (1765.8-1834.1) (2313.8-2412.3)

149
Table A 111. 2017 total respiratory hospitalisation rates by DHB.
DHB n Rate (raw) Rate (age adj’d) 95%CI
Northland 3908 2228.0 2049.8 (1984.1-2115.6) Waitemata 10062 1660.5 1716.8 (1683.2-1750.5) Auckland 7840 1497.7 1738.1 (1698.8-1777.4) Counties Manukau 10490 1919.2 2046.2 (2006.3-2086.1) Waikato 9232 2258.4 2209.5 (2164.2-2254.7) Lakes 2787 2568.0 2492.3 (2399.4-2585.3) Bay of Plenty 4863 2096.2 1903.4 (1848.8-1958) Tairawhiti 1111 2290.2 2181.5 (2052.5-2310.5) Hawkes Bay 3530 2153.6 1988.3 (1921.9-2054.7) Taranaki 2598 2199.3 2069.9 (1989.6-2150.2) MidCentral 3144 1780.2 1689.1 (1629.4-1748.8) Whanganui 1695 2646.2 2352.2 (2237.9-2466.6) Capital and Coast 4246 1357.8 1468.0 (1423.5-1512.5) Hutt 2938 1985.7 1989.9 (1917.9-2062) Wairarapa 859 1929.9 1762.9 (1641.1-1884.7) Nelson Marlborough 1961 1318.0 1224.6 (1168.4-1280.8) West Coast 600 1847.9 1733.4 (1591.2-1875.5) Canterbury 8005 1452.0 1476.5 (1443.9-1509) South Canterbury 966 1623.0 1434.8 (1340.7-1528.8) Southern 5618 1732.1 1713.3 (1668-1758.6)
9.2.1. TOTAL RESPIRATORY MORTALITY
Table A 112. Total respiratory mortality rates and age-adjusted rates 2000-2015.
Rate Year n Raw (age adj'd) 95% CI
2000 2060 53.40 65.61 (62.77-68.46) 2001 2407 62.03 74.42 (71.44-77.40) 2002 2392 60.58 72.24 (69.34-75.15) 2003 2357 58.53 69.68 (66.86-72.50) 2004 2467 60.35 71.16 (68.35-73.97) 2005 2164 52.35 60.91 (58.34-63.48) 2006 2396 57.26 65.61 (62.98-68.24) 2007 2329 55.14 62.16 (59.64-64.69) 2008 2623 61.58 68.24 (65.63-70.85) 2009 2558 59.45 64.84 (62.32-67.35) 2010 2439 56.06 60.21 (57.82-62.60) 2011 2718 62.00 65.33 (62.87-67.79) 2012 2833 64.27 66.56 (64.10-69.01) 2013 2719 61.21 62.70 (60.35-65.06) 2014 2902 64.35 65.14 (62.77-67.51) 2015 2922 63.60 64.03 (61.70-66.35)
Trend 2000 -2015
-0.47 (-0.88 - -0.06), p=0.027

150
Table A 113. Total respiratory mortality rates and rate ratios by age group and sex, 2010-2015.
Total Male Female M v F Age (years) n Rate 95% CI n Rate 95% CI n Rate 95% CI RR 95% CI
<15 95 1.7 (1.4-2.1) 50 1.8 (1.3-2.3) 45 1.7 (1.2-2.2) 0.95 (0.78-1.15)
15-29 45 0.8 (0.6-1.1) 31 1.1 (0.7-1.5) 14 0.5 (0.2-0.8) 0.46 (0.34-0.62)
30-64 1435 11.9 (11.3-12.5) 687 11.8 (11.0-12.7) 748 12.0 (11.1-12.8) 1.01 (0.96-1.06)
65+ 14959 404.6 (398.1-411.1) 7302 429.4 (419.5-439.2) 7657 383.5 (374.9-392.1) 0.89 (0.88-0.91)
Table A 114. Total respiratory mortality rate ratios by age group and sex, 2010-2015.
Age (years)
Total Male Female
RR 95% CI RR 95% CI RR 95% CI
<15 0.15 (0.13-0.16) 0.15 (0.13-0.17) 0.15 (0.13-0.17)
15-29 0.07 (0.06-0.08) 0.09 (0.08-0.11) 0.06 (0.04-0.07)
30-64 1.00 Baseline 1.00 Baseline 1.00 Baseline
65+ 33.95 (33.07-34.85) 36.24 (34.89-37.64) 30.99 (29.89-32.13)
Table A 115. Total respiratory mortality rates and rate ratios by ethnic group, 2010-2015.
Total Ethnicity
Rate
n Raw Age adj'd 95% CI RR 95%CI
Māori 1616 39.0 107.0 (101.1-112.8) 1.73 (1.69-1.78)
Pacific 502 24.4 78.6 (71.0-86.3) 1.27 (1.21-1.34)
Asian 321 10.0 31.9 (28.1-35.6) 0.52 (0.49-0.55)
Non-MPA 14122 79.6 61.7 (60.7-62.7) 1.00 Baseline
Table A 116. Total respiratory mortality rates by ethnic group and age, 2010-2015
Māori Pacific Asian non-MPA Age (years) n Rate 95% CI n Rate 95% CI N Rate 95% CI n Rate 95% CI
<15 41 2.9 (2.0-3.8) 32 4.4 (2.9-5.9) 6 0.9 (0.2-1.7) 25 0.8 (0.5-1.2)
15-29 19 1.8 (1.0-2.7) 9 1.7 (0.6-2.8) 4 0.4 (0.0-0.9) 14 0.4 (0.2-0.7)
30-64 434 29.1 (26.3-31.8) 92 13.3 (10.6-16) 32 2.2 (1.4-3.0) 883 10.4 (9.7-11.1)
65+ 1122 525.5 (494.8-556.3) 369 386.2 (346.8-425.6) 279 146.8 (129.6-164.1) 13200 413.3 (406.2-420.3)
Table A 117. Total respiratory mortality rates NZDep2013 quintile, 2010-2015.
NZDep quintile n Rate (raw)
Rate (age adj'd) 95% CI RR 95% CI
1-2 2002 39.6 47.6 (45.5-49.7) 1.00 Baseline
3-4 2582 51.6 54.3 (52.2-56.4) 1.14 (1.11-1.17)
5-6 3285 63.2 57.7 (55.7-59.7) 1.21 (1.18-1.25)
7-8 4480 80.6 72.7 (70.6-74.9) 1.53 (1.49-1.57)
9-10 4145 70.6 85.6 (83.0-88.2) 1.80 (1.75-1.85)

151
Table A 118. Total respiratory mortality rates by ethnic group and NZDep2013 quintile, 2010-2015.
NZDep2013 quintile Ethnic group 1-2 3-4 5-6 7-8 9-10
Māori
Hosp_Num 44 123 210 353 885
Rate (raw) 13.1 27.0 33.0 36.4 50.7
Rate (age adj'd) 45.7 78.2 91.7 101.3 134.3
95%CI (29.2-62.2) (62.5-93.8) (77.9-105.5) (89.4-113.3) (124.4-144.2)
Pacific
Hosp_Num 9 34 48 82 325
Rate (raw) 9.2 21.5 22.6 19.8 27.8
Rate (age adj'd) 27.8 78.9 76.5 69.4 94.7
95%CI (6.8-48.8) (48.5-109.3) (51.4-101.7) (52.5-86.2) (83.2-106.1)
Asian
Hosp_Num 45 66 54 68 81
Rate (raw) 8.2 10.0 8.7 10.4 11.0
Rate (age adj'd) 25.2 32.5 28.1 33.6 43.3
95%CI (17.3-33.1) (24-40.9) (20.1-36.1) (25.1-42) (32.6-54)
NZ European/ Other
Hosp_Num 1904 2364 2977 3980 2869
Rate (raw) 46.3 62.4 78.7 109.6 118.7
Rate (age adj'd) 48.6 54.0 57.1 72.0 79.0
95%CI (46.4-50.8) (51.8-56.1) (55-59.1) (69.8-74.3) (76.1-81.9)
Table A 119. Total respiratory mortality rates by DHB, 2010-2015.
DHB n Rate (raw) Rate (age adj’d) 95%CI
Northland 789 80.1 70.8 (65.8-75.7)
Waitemata 1589 48.1 55.3 (52.6-58.1)
Auckland 1188 42.8 57.1 (53.9-60.4)
Counties Manukau 1268 42.5 61.4 (58.0-64.8)
Waikato 1472 65.0 66.2 (62.9-69.6)
Lakes 486 78.3 82.0 (74.7-89.4)
Bay of Plenty 1046 81.0 64.8 (60.9-68.8)
Tairawhiti 217 77.0 83.1 (72.1-94.2)
Hawkes Bay 691 72.9 63.9 (59.1-68.7)
Taranaki 508 74.7 65.1 (59.4-70.7)
MidCentral 744 73.4 65.3 (60.6-69.9)
Whanganui 356 94.8 75.7 (67.8-83.6)
Capital and Coast 833 47.3 56.6 (52.8-60.5)
Hutt 544 63.4 69.0 (63.2-74.8)
Wairarapa 209 82.5 63.9 (55.2-72.5)
Nelson Marlborough 628 73.9 59.9 (55.3-64.6)
West Coast 149 75.5 70.7 (59.3-82.1)
Canterbury 2082 68.1 65.2 (62.4-68.0)
South Canterbury 311 90.3 64.0 (56.8-71.2)
Southern 1385 75.3 69.2 (65.6-72.9)

152
10. APPENDIX 2 INDICATOR DEFINITIONS
ICD-10 codes defining indicator conditions:
• Asthma: o J45 Asthma o J46 Status asthmaticus
• Bronchiectasis: o J47 Bronchiectasis o Q33.4 Congenital bronchiectasis
• Bronchiolitis: o J21 Bronchiolitis
• Childhood pneumonia (children under 15 years) o J10.0 Influenza with pneumonia, other influenza virus identified o J11.0 Influenza with pneumonia, virus not identified o J12 Viral pneumonia, not elsewhere classified o J13 Pneumonia due to Streptococcus pneumoniae o J14 Pneumonia due to Haemophilus influenzae o J15 Bacterial pneumonia, not elsewhere classified o J16 Pneumonia due to other infectious organisms, not elsewhere classified o J17* Pneumonia in diseases classified elsewhere o J18 Pneumonia, organism unspecified
• COPD: o J40-42 with previous or subsequent J43 or J44 hospitalisation o J43 Emphysema o J44 COPD
• Total serious respiratory disease: o All ICD-10 Chapter 10 (J-codes)

153
11. APPENDIX 3 PHARMACEUTICAL INCLUSIONS
Pharmaceutical products included in the cost calculations were those pharmaceuticals classified as (Level 2 classification):
• Beta-Adrenoceptor Agonists; • Corticosteroids and Related Agents for Systemic Use; • Inhaled Anticholinergic agents; • Inhaled Corticosteroids; • Inhaled Long-acting Beta-adrenoceptor Agonists; • Methylxanthines;
And also spacer devices and masks.
In 2017, these had the following chemical_ids:
1056 1065 1066 1083 1108 1168 1492 1580 1598 1826
1829 1832 2096 2374 2375 2404 3710 3758 3805 3858
3967 4042 4043 4056 4057 4058 4059 4060 4079 6311

154
12. APPENDIX 4 LITERATURE SEARCH RESULTS
Table A 120. Literature search publication numbers and filtering
(Publications since previous report only)
Condition Medline publications returned
Remaining after abstract screening
Remaining after full text screening
Asthma 11 1 0
Bronchiectasis 6 0 0
Childhood bronchiolitis 11 2 1
Childhood pneumonia 34 1 0
COPD in adults 35 2 0
OSA 8 2 2
Total respiratory 164 13 5
Table A 121. Asthma prevalence in published studies
(None new since previous report)
Publication Data year
NZ Location n Age; Ethnicity
Outcome measured Rate/ prevalence
Cohet et al 200434
2002 Greater Wellington
2539 controls
6-7 years; all
Wheezing ever 44.5%
Wheezing last 12 months 24.3%
More than one wheezing attach in past 12 months
24.0%
Night waking in past 12 months
14.8%
Severe wheeze in past 12 months
4.1%
Asthma ever 32.8%
Exercise wheeze 16.9%
Night cough in past 12 months
30.8%
Bates et al 201335
2008-2010
Rotorua 1637 18-65 years; all
current asthma, defined as: “ever been diagnosed by a doctor as having asthma”,
16.7%

155
Publication Data year
NZ Location n Age; Ethnicity
Outcome measured Rate/ prevalence
plus either wheeze in the last 12 months or current use of asthma medication.
Wheeze or whistling 28.5%
Woken with chest tightness 14.7%
Shortness of breath at rest 9.7%
Woken by shortness of breath
8.7%
Woken by coughing 23.3%
Ever asthma diagnosis 24.2%
Current asthma treatment 13.1%
Crampton et al 200436
2001-2002
All New Zealand
10 506 GP visits
All; all
“For profit” GP visit for asthma
5.0%
“Not for profit” GP visit for asthma
9.1%
Douwes et al 200737
N.B. High (23.2%) smoking rate in population
Not stated
Rural, lower half North Island
1328 25-49 years; all
Woken by shortness of breath in past 12 months
12.9%
Wheeze in past 12 months 25.4%
Asthma medication in past 12 months
11.0%
Asthma ever 23.3%
Doctor diagnosed asthma ever
22.2%
Hansell et al 201438
2003-2004
Greater Wellington
1017 24-74 years;
all;
Asthma ever diagnosed 23.9%
Ellison-Loschmann et al 200919 and various; aka ISAAC III
2001-2003
All New Zealand
10873 6-7 years; all (extrapolated)
Wheezing ever 40.9%
Current wheeze 22.4%
>=4 wheezing attacks 7.2%
Night waking from wheeze 13.3%
Speech-limiting wheeze 3.7%
Asthma ever 30.3%
Exercise wheeze 16.0%
Night cough 28.2%
13317 13-14 years; all (extrapolated)
Wheezing ever 46.5%
Current wheeze 27.6%
>=4 wheezing attacks 6.4%
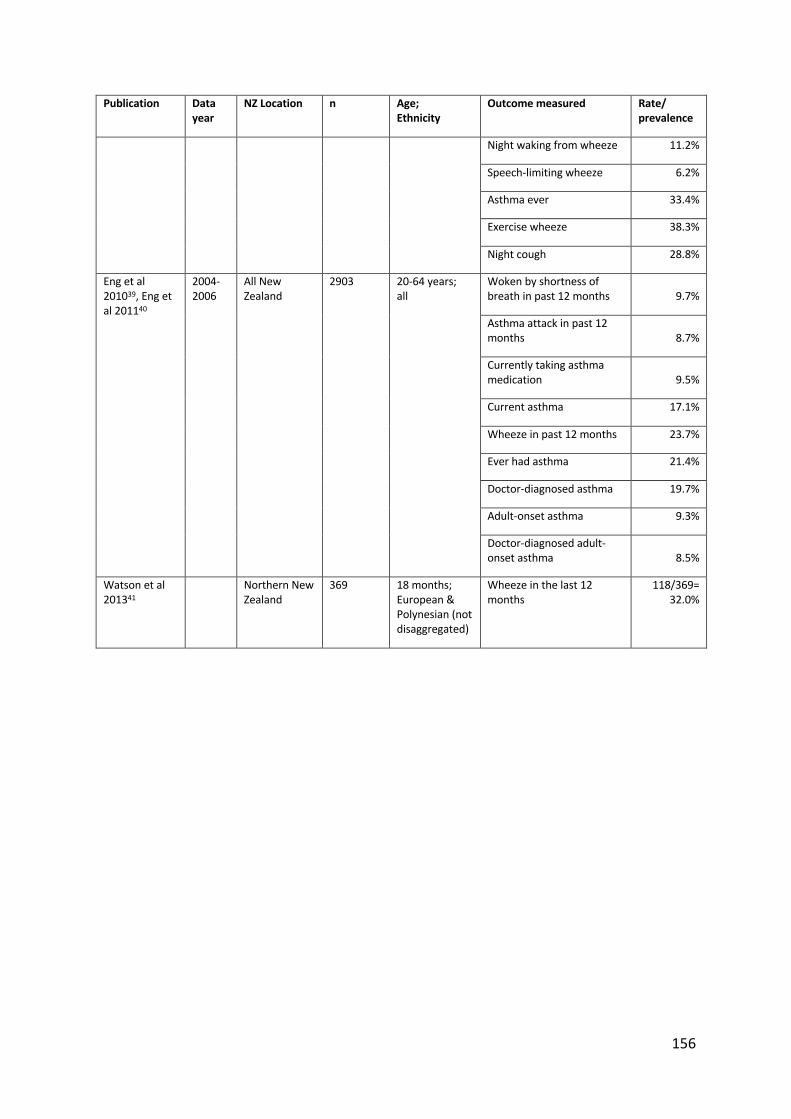
156
Publication Data year
NZ Location n Age; Ethnicity
Outcome measured Rate/ prevalence
Night waking from wheeze 11.2%
Speech-limiting wheeze 6.2%
Asthma ever 33.4%
Exercise wheeze 38.3%
Night cough 28.8%
Eng et al 201039, Eng et al 201140
2004-2006
All New Zealand
2903 20-64 years; all
Woken by shortness of breath in past 12 months 9.7%
Asthma attack in past 12 months 8.7%
Currently taking asthma medication 9.5%
Current asthma 17.1%
Wheeze in past 12 months 23.7%
Ever had asthma 21.4%
Doctor-diagnosed asthma 19.7%
Adult-onset asthma 9.3%
Doctor-diagnosed adult-onset asthma 8.5%
Watson et al 201341
Northern New Zealand
369 18 months; European & Polynesian (not disaggregated)
Wheeze in the last 12 months
118/369= 32.0%

In memory of Dr W Brent Wilson;This report was made possible by the Scholarship Fund of the late Dr W Brent Wilson
The impact of respiratory disease in New Zealand: 2018 update