the impact of product market competition on firms’ …grullon/wp/competition.pdf · the impact of...
TRANSCRIPT

The Impact of Product Market Competition on Firmsrsquo Payout Policy
by
Gustavo Grullon Rice University
and
Roni Michaely
Cornell University and IDC
May 2014
We thank Amir Barnea Yaniv Grinstein Gerard Hoberg Gordon Phillips and seminar participants at the American Finance Association Meetings the Caesarea Center Annual Conference Cornell University Georgia State University Rice University Texas AampM International Texas State University and the University of Maryland for helpful comments We are grateful to Gordon Philips for providing us with the industry concentration ratios We also thank Daniela Covarrubias and Christopher Vincent for their research assistance An earlier version of this paper was circulated under the title ldquoDividend Policy and Product Market Competitionrdquo Please address correspondence to Gustavo Grullon grullonriceedu or Roni Michaely rm34cornelledu
The Impact of Product Market Competition on Firmsrsquo Payout Policy
Abstract This paper investigates the interaction between product market competition and managersrsquo decision to distribute cash to shareholders Using a large sample of manufacturing firms we find that firms in more competitive industries pay more dividends than firms in less competitive markets Further consistent with agency theory we find that the effect of product market competition on corporate payouts became significantly stronger after an exogenous event that intensifies the agency conflict between managers and shareholders (the business combination laws adopted by several states in the US during the 1980s and 1990s) Overall our findings are consistent with the notion that the disciplinary forces of competition induce managers to pay out excess cash and with the idea that dividends are the ldquooutcomerdquo of external factors
1
1 Introduction
It has been argued in the economic literature that intense product market competition
provides corporate managers with incentives to behave efficiently (eg Allen and Gale (2000))
One of the main rationales for this theoretical argument is that the disciplinary forces of
competition rapidly remove incompetent managers from the market This is an old idea that was
recognized by Adam Smith in The Wealth of Nations who wrote that ldquomonopolyhellipis a great
enemy to good managementrdquo Other examples include Hicks (1935) who acknowledges that
ldquothe best of all monopoly profits is a quiet liferdquo and Caves (1980) who comments that
economists seem to have a ldquovague suspicion that competition is the enemy of slothrdquo Over the
past few decades several theoretical papers have tried to formalize this idea by examining the
potential channels through which competition can have an effect on managerial incentives (see
for example Holmstrom (1982) Hart (1983) Nalebuff and Stiglitz (1983) Scharfstein (1988)
Hermalin (1992) Schmidt (1997) Aghion Dewatripont and Rey (1999) Jagannathan and
Srinivasan (1999) and Raith (2003)) Allen and Gale (2000) for example conclude that
competition among firms may be a more effective corporate governance mechanism than either
the market for corporate control or institutional monitoring
From an empirical perspective several recent studies seem to support the idea that
competition incentivizes managers to be more efficient and more aligned with shareholders For
example Graham Kaplan and Sibley (1983) find that airlines experienced significant
productivity improvements after the deregulation of their industry in 1978 Nickell (1996)
documents that total factor productivity growth among a sample of UK firms is positively
correlated with proxies for competition intensity Berger and Hannan (1998) find a strong
negative relation between cost efficiency and measures of market power in the US banking
2
industry Griffith (2001) provides evidence that an increase in product market competition leads
to increases in productivity especially among those firms in which managers are less aligned
with shareholders More recently several studies find evidence suggesting that product market
competition has the disciplinary effects that mitigate the need for either internal or external
corporate controls (Giroud and Mueller (2010) and Chhaochharia Grinstein Grullon and
Michaely (2011))
Financial economists also suggest that dividends could be used as a mean to reduce
agency conflict between management and shareholders (eg Jensen (1986) Easterbrook (1984)
La Porta Lopez-de-Silanes Shleifer and Vishny (2000)) Higher dividends reduce managersrsquo
ability to enjoy the quiet life (Bertrand and Mullainathan (2003)) or build unjustified empires
(Jensen (1986)) The idea that agency considerations are an important determinant of payout
policy has received empirical support (see for example Lie (2000) Grullon and Michaely
(2004) and DeAngelo DeAngelo and Stulz (2006))
In this paper we investigate the link between product market competition managerial
incentives and corporate payout policy There are several potential reasons why product market
competition and payout policy might be related Perhaps the most important one is the
interaction between competition and agency conflicts It is possible that product market
competition through its effect on agency conflicts may be an important determinant of the
decision to pay out excess cash to shareholders Similar to La Porta Lopez-de-Silanes Shleifer
and Vishny (2000) (henceforth LLSV) we argue that product market competition can potentially
have two opposing effects on payout policies One possibility is that firms pay dividends
because competition acts as an enforcement mechanism that exerts pressure on managers to
distribute cash to their shareholders by increasing the risk and the cost of overinvesting (eg
3
higher probability of liquidation greater transparency) The main idea here is that intense
competition can affect corporate payouts in ways similar to a strong legal systemmdashby creating
conditions that pressure managers to pay out rather than invest in non-profitable investments (the
ldquooutcomerdquo model) Alternatively payout policy can be a substitute for competition managers
use dividends as a substitute for the external disciplinary factors to establish good reputation in
the capital markets to be able to raise capital on better terms (the ldquosubstitutionrdquo model)
There are significant disagreements in the literature on how corporate governance affects
payout policy On the one hand consistent with the outcome model LLSV (2000) find that
firms in countries with strong minority shareholder rights tend to pay higher dividends More
recently Michaely and Roberts (2012) compare dividend policies of firms with weak corporate
governance (private firms) to dividend policies of firms with strong corporate governance (public
firms) and find that firms with stronger corporate governance pay higher dividends On the
other hand consistent with the implications of the substitution model several recent papers find
evidence supporting the notion that firms use dividend payments to reduce agency costs that are
caused by poor governance (Officer (2006) and John and Knyazeva (2006)) Further Grinstein
and Michaely (2005) find that firms with high institutional holding (an external governance
proxy) generally pay lower dividends In this paper we test these competing hypotheses by
examining the relation between product market competition and corporate payout policy
Using the Herfindahl-Hirschman Index (HHI) from the Census of Manufacturers as a
measure of market concentration we find that firms in more concentrated industries have
significantly lower dividend payout ratios and are less likely to pay and increase dividends than
firms in less concentrated industries These results hold even after controlling for other factors
that have been documented to affect corporate payout policy such as size profitability growth
4
opportunities firm age leverage and volatility Moreover we find that the effect of
concentration levels on corporate dividend payouts is not only statistically significant but also
economically significant
While the large sample regression analysis control for many of the factors found by prior
literature to affect dividend policy (as well as industry- and time-fixed-effects) given the nature
of the investigation it may not be enough To address this issue we use a natural experiment that
exogenously exacerbated the agency problems between managers and shareholders
Specifically following Bertrand and Mullainathan (2003) and Giroud and Mueller (2010) we
use the adoption of business combination (BC) laws to examine the how agency issues affect the
relation between corporate payouts and product market competition Because these laws
substantially reduced the chance of hostile takeover they increased the opportunity of
managerial misbehavior among the firms affected by the BC laws The reason for this is that the
market for corporate control is an external factor that serves as a substitute for the lack of
product market competition (Giroud and Mueller (2010)) Therefore if our main results are
mainly driven by the interaction of competition and agency issues then managers in less
competitive markets should become more entrenched after the adoption of the BC laws than do
managers in more competitive markets which should lead to a larger differential in payout ratios
between firms in concentrated markets and firms in competitive markets
Using the business combination (BC) laws passed between 1985 and 1991 on a state-by-
state basis we perform a differences-in-differences analysis to investigate whether these anti-
takeover laws increased the gap in payout ratios between competitive and non-competitive firms
Consistent with the predictions of agency theory we find that the negative relation between
industry concentration levels and dividend payout ratios becomes much stronger after the
5
passage of the BC laws These results are consistent with the conceptual framework in LLSV
(2000) that dividends are the outcome of external factors
We also investigate the possibility that firms in more concentrated markets pay lower
dividends because they need to hoard cash to fend off predatory behavior from competitors as in
Bolton and Scharfstein (1990) Although there is evidence that especially for financially
constrained firms strategic product market considerations are an important determinant of
payout policy (Hoberg Phillips and Prabhala (2014)) and cash holdings (Haushalter Klasa and
Maxwell (2007)) our analysis indicates that these interactions are not the main drivers of our
results As discussed above we find that the differential in payout ratios between firms in
competitive and non-competitive markets increases after the passage of the BC laws For this
result to be consistent with the predation hypothesis BC laws should make firms in non-
competitive markets more prone to predatory behavior From a theoretical perspective it is not
clear why this should be the case Moreover if our results were mainly driven by strategic
interactions then firms in concentrated markets would not only hoard more cash after the
adoption of BC laws but would also try to improve their operational efficiency to better cope
with the increased predatory threats However contrary to this prediction and consistent with
the idea that managers decided to enjoy the ldquoquiet liferdquo Giroud and Mueller (2010) find that
these firms became less efficient after the passage of the BC laws Finally we also find that the
negative relation between industry concentration levels and corporate disbursements is much
stronger among large firms This result is unlikely to be driven by strategic considerations
because predatory issues should be less of a concern for large firms as they possess more
resources and potentially more market power to fend off any predatory attack than do small
firms
6
In a recent paper Hoberg Phillips and Prabhala (2014) also examine the effect of
industry concentration on corporate payout policy Using a new measure of the HHI based on
text-based analysis these authors find that firms in more concentrated industries tend to pay
more dividends In this paper we reconcile our results with these recent findings by showing that
the HHI based on text-based analysis is not a good instrument for actual industry concentration
According to theory concentrated industries (eg oligopolistic markets) should be populated by
larger and more profitable firms Consistent with these predictions we corroborate the findings
in Ali Klasa and Yeung (2008) and show that the HHI from the Census of Manufacturers is
positively correlated with firm size and price-cost margins (Lerner index) In contrast the
measure constructed by Hoberg Phillips and Prabhala (2014) is negatively correlated with firm
size and unrelated to price-cost margins For example according to this measure the average
sales of firms in the least concentrated industries are 26 larger than the average sales of the firms
in the most concentrated industries This evidence suggests that the measure of concentration
we use in this paper is better proxy for competition than the one used in recent studies
Overall our settings enable us to analyze the interaction between two corporate
governance mechanisms an internal onemdashdividend policy and an external onemdashcompetition
The higher payouts in more competitive industries suggest that intense product market
competition appears to have induced management to disgorge cash through dividends These
findings lend further support to the idea that corporate payouts are the outcome of external
disciplinary forces similar to LLSV (2000) where the external force is the extent of investorsrsquo
protection or Michaely and Roberts (2012) where the external force is the disciplinary force of
public financial markets The findings also underscore the importance of agency conflicts in the
7
determination of corporate payout policy Finally they provide another example of how product
market competition can have a significant effect on corporate financial decisions
The paper is organized as follows Section 2 discusses the theoretical arguments linking
corporate payout policy to product market competition Section 3 describes the sample selection
procedure defines the variables and provides summary statistics Section 4 investigates the
empirical relation between industry concentration levels and corporate payout policy In Section
5 we investigate whether agency theory can explain the relation between product market
competition and corporate payout policy documented in this paper In Section 6 we reconcile
our results with the existing literature that indicates that firms in less concentrated markets have
lower payout ratios Section 7 concludes
2 The Link between Corporate Payout Policy and Product Market Competition
In this section we discuss several potential channels through which product market
competition can affect managersrsquo decision to distribute cash to their shareholders Building on
the work of LLSV we explain how corporate payouts could be the outcome of intense product
market competition or alternatively a substitute for competition Further we explain how
potential predatory behavior in less competitive markets can affect corporate payout policy
21 Outcome Model
The outcome model contends that managers need some inducements to dispense free cash
flows This inducement can be stricter investorsrsquo protection laws (LLSV (2000)) tighter
regulation and corporate control (Michaely and Roberts (2012)) or product market competition
Managers in highly competitive markets should distribute more cash to their shareholders
because they are more likely to be penalized by the disciplinary forces of competition if they
mishandle the resources of the firm The premise of competition as a disciplinary role is not
8
new and can be based on several theoretical arguments The first argument is related to the
threat-of-liquidation hypothesis (see for example Schmidt (1997) and Aghion Dewatripont and
Rey (1999)) which states that if a firm in a highly competitive industry begins investing in
negative NPV projects or overspending then it will become less competitive (eg raising prices
to subsidize the bad projects) and consequently more likely to be driven out of the market
Thus to avoid liquidation loss of bonuses that are related to stock price performance or the loss
of their jobs managers in more competitive markets are more likely to pay higher dividends and
avoid negative NPV projects The second argument is related to the yardstick competition
hypothesis (see for example Holmstrom (1982) Nalebuff and Stiglitz (1983) and Shleifer
(1985)) Under this hypothesis product market competition reduces asymmetric information and
monitoring costs by generating greater opportunities for outsiders to benchmark the performance
of a firm to the performance of its competitors Therefore according to this argument intense
competition could make dividends more appealing by reducing the likelihood of overinvestment
and management failure
The ldquooutcomerdquo model has two important implications On the one hand it predicts a
negative relation between industry concentration levels and corporate payouts On the other
hand it predicts that the negative relation between concentration levels and payouts should be
stronger among firms with severe agency problems of free cash flows The main rationale for
the latter prediction is that if competition affects corporate payout policy by increasing the risk
and the cost of overinvesting then its effect on payouts should be stronger among those firms
that are more likely to overinvest We test this implication in two ways First we examine the
effect of business combination laws on the relation between payout policy and product market
competition As discussed above these laws exogenously exacerbated the agency conflicts
9
between managers and shareholders by (at least partially) immunizing firms from the market for
corporate control Since the market for corporate control is viewed as a substitute for product
market competition one would expect managers in less competitive markets to face less pressure
from external factors than managers in more competitive markets after the adoption of these
laws Therefore the ldquooutcomerdquo model predicts that the passage of the business combination
laws should lead to a larger gap in dividends between firms in competitive and non-competitive
markets Second we examine whether the relation between concentration levels and corporate
payouts is stronger among large and low-growth firms which due to their nature are more likely
to have agency problems of free cash flows
22 Substitution Model
Firms in less competitive markets face higher agency costs associated with free cash
flows One potential reason for this is that these firms have the ability to generate extraordinary
rents which allows managers to have access to more free cash flows (eg Jensen (1986)
Shleifer and Vishny (1997) Giroud and Mueller (2010)) Another potential reason is that
managers in less competitive markets are more likely to overinvest because they are less
susceptible to the disciplinary forces of product market competition As discussed above since
value-destroying managers in less competitive markets have more slack to subsidize negative
NPV projects they are more likely to avoid liquidation than similar managers in more
competitive industries
Under the ldquosubstitutionrdquo model dividends are a substitute for other disciplinary measures
such as laws and regulations (LLSV (2000)) compliance and regulations of public markets
(Michaely and Roberts (2012)) or the disciplinary role of market competition Additionally
payout may be used more commonly in less competitive markets (ie markets with less
10
information) because of reputation and signaling Thus managers in less competitive markets
pay dividends and repurchase shares to mitigate the potential agency costs generated by the lack
of competitive pressure from the product market According to recent theoretical arguments
managers of under-valued firms may rationally pay dividends to either establish a reputation for
treating shareholders well so they can raise capital at favorable terms in the future (LLSV
(2000)) or to maximize the value of their holdings in the firm (Gomes (2000))
The empirical implication is that corporate payouts should be positively correlated with
industry concentration levels because dividends and share repurchases are being used as a
substitute for intense competition However this model does not provide clear predictions on
how the magnitude of potential agency problems should affect the positive relation between
concentration levels and corporate payouts If managers use corporate payouts to establish a
reputation as good managers to raise capital on better terms in the future (LLSV (2000)) then the
positive relation between concentration levels and payouts should be stronger among high-
growth firms that generate low cash flows because these are the firms that are most likely to
access the capital markets in the future (eg small firms) If on the other hand managers use
corporate payouts to mitigate the agency costs of free cash flows so they can maximize the value
of their holdings in the firm (Gomes (2000)) then we should expect a stronger positive
correlation between concentration levels and payouts among firms with severe agency costs of
free cash flows (eg large firms) The main reason for this is that the benefits of reducing
potential agency problems are larger among this type of firms
23 Predation Hypothesis
It is also possible that product market competition and payout policy may interact for
strategic consideration such as predation risk For example an implication of Bolton and
11
Scharfstein (1990) is that firms will tend to pay lower dividends and hoard more cash so that
they are better able to fend off potential predatory behavior1 Since this behavior is unlikely to
be effective in competitive markets not only because prices are equal to marginal costs but also
because there is no gain from having n-1 firms instead of n firms in the market predatory risk is
higher in less competitive markets Thus the major prediction of the predation hypothesis is that
payouts should be lower in more concentrated industries
Note that the predation hypothesis and the ldquooutcomerdquo model generate similar predictions
regarding the relation between product market competition and corporate payouts lower level of
dividends in less competitive markets However while the predation hypothesis does not have
any clear predictions regarding the effect of the BC laws on the relation between concentration
levels and corporate payout policy the ldquooutcomerdquo model predicts that the relation between these
two variables should become stronger after the passage of the BC laws Therefore our tests
examining the effects of the BC laws on the HHI-payout policy relation allow us to distinguish
between these two hypotheses Further the predation hypothesis predicts that the negative
relation between concentration levels and payouts should be stronger among small firms This
follows from the idea that predation is less likely to occur against large firms since these firms
possess more resources and market power to fend off any predatory attack Further because
large firms are less likely to be financially constrained than small firms (eg Hadlock and Pierce
(2010)) holding cash to avoid passing profitable investment opportunities is less of a concern for
large firms than it is for small firms (see for example Acharya Almeida and Campello (2007))
24 Agency Theory and the Form of Payout Dividends vs Repurchases
Over the last two decades share repurchases have become an important payout
mechanism in part as a substitution for dividends (Grullon and Michaely (2002)) At the same 1 Bolton and Scharfsteinrsquos (1990) original argument is about debt but it also holds for dividends (and repurchases)
12
time there is clear evidence that repurchases are less persistent than dividends (eg Leary and
Michaely (2011)) and that they are more likely to be used to distribute non-recurring cash flows
than to distribute permanent cash flows (Jagannathan Stephens and Weisbach (2000))
Because of these differences dividends are perceived as a stronger commitment device than
share repurchases As in the case of debt (Zwiebel (1996)) this suggests that dividends are a
more credible mechanism to reduce the amount of free cash flow in the firm than share
repurchases Therefore if agency considerations are an important determinant of our results
then one would expect product market competition to have a stronger effect on dividends than on
share repurchases
3 Sample Selection Variable Definitions and Descriptive Statistics
31 Sample Selection
Our initial sample consists of all firms operating in any of the industries covered by the
Census of Manufacturers (SIC code interval 2000-3990) This census reports the results from a
survey taken every five years in which all manufacturing firms in the US are asked to provide
information on their number of employees payroll and total output Unlike most surveys this is
a fully comprehensive sample since firms are required by federal law to respond to the survey
supplied by the US Census (Title 13 of the US Code) Thus selection bias is not a significant
issue Using this information the US Census calculates several summary statistics including
the Herfindahl-Hirschman index (HHI) that we use in this paper
Since the HHIs are only reported every five years we assume that the indexes stay
constant until the results from a new survey are available For example we use the HHIs
reported in 1987 for the observations in years 1987 1988 1989 1990 and 1991 This approach
is unlikely to bias our empirical results because the HHI does not experience large changes over
13
time For example the probability that an industry in the smallest HHI quintile moves to the
largest HHI quintile (or vice versa) over a period of 5 years is virtually zero
From our initial sample of manufacturing firms we then select those observations that
satisfy the following criteria (1) the firm appears on the CRSPCompustat merged files (2) the
firm operates in an industry covered by the Census of Manufacturers (SIC code interval 2000-
3990) and (3) the firmrsquos total assets are greater than $1 million This selection process generates
a final sample of 64647 firm-year observations over the period 1972 to 2010 This is a
relatively large sample considering that it only contains manufacturing firms
32 Variable Definitions
321 Proxy for Industry Concentration
Following Aggarwal and Samwick (1999) Allayanis and Ihrig (2001) Campello (2006)
MacKay and Phillips (2005) Akdoğu and MacKay (2008) and Haushalter Klasa and Maxwell
(2007) among others we use the Herfindahl-Hirschman Index (HHI) from the Census of
Manufacturers as a proxy for product market competition The US Census calculates this index
by summing up the squares of the individual market shares for the 50 largest firms in the
industry If the industry has less than 50 firms then the US Census uses the total number of
firms in the industry Since in most industrial groups the largest 50 firms capture most of the
market this index is a reasonable proxy for the overall level of industry concentration In this
paper we use four-digit SIC HHIs
322 Measures of Corporate Payouts
Using data from Compustat we construct the following six measures of corporate
payouts dividends and share repurchases scaled by total sales (item SALE) dividends and share
repurchases scaled by total assets (item AT) and dividends and share repurchases scaled by the
14
market value of equity (item CSHO times item PRCC_F) Dividends (DIV) are equal to the total
dollar amount of dividends declared on the common stock of a company during a year (item
DVC) Share repurchases (REPO) are equal to the expenditure on the purchase of common and
preferred stocks (item PRSTKC) We examine share repurchases because they have become an
important payout method for many firms (see for example Grullon and Michaely (2002))
Finally to mitigate the effect of outliers we exclude from our analyses all observations where
the payout ratios are greater than one
323 Control Variables
Following the literature on corporate payout policy we control for the following firm
characteristics in our empirical analyses
bull Maturity Our proxies for the level of firm maturity are the market value of equity
(MV) and the age of the firm (AGE) MV is defined as the total number of common
shares outstanding (Compustat item CSHO) times the closing stock price at the end of
the fiscal year (item PRCC_F) AGE is the time (in years) from the firmrsquos CRSP
listing date
bull Investment Opportunities We use the market-to-book ratio (MB) as a proxy for
investment opportunities MB is equal to the book value of assets (item AT) plus the
market value of equity (MV) minus the book value of equity (item CEQ) scaled by
the book value of assets
bull Risk Our proxy for risk is the volatility of stock returns (RETVOL) RETVOL is
the standard deviation of monthly stock returns over a one-year period
15
bull Profitability We use the return on assets (ROA) as a proxy for the level of
profitability of the firm ROA is the operating income before depreciation (item
OIBDP) scaled by the book value of assets
bull Leverage We define leverage (DEBTASSETS) as long-term debt (item DLTT) plus
short-term debt (item DD1) scaled by the book value of assets
To mitigate the effect of outliers MB and ROA have been winsorized at the 1 and the
99 of their empirical distribution Further since there is evidence that corporate payout policy
in the US has significantly changed over the last three decades (see for example Fama and
French (2001) and Grullon and Michaely (2002)) we also include year dummies in our
regressions to control for any time trends Finally we include industry fixed effects where
industry is defined by the firmrsquos two-digit SIC code
Given the well documented fact that large stable profitable old firms with low
investment opportunities are more likely to distribute cash to their shareholders than are other
types of firms we expect the coefficients of MV AGE and ROA to have a positive sign and the
coefficients of MB and RETVOL to have a negative sign However the coefficient of
DEBTASSETS could be positive or negative depending on whether firms treat leverage as a
substitute for payouts or as a complement to payouts
324 Descriptive Statistics
Table 1 reports summary statistics for the firms in our sample This table shows that the
average sample firm has a dividend yield (DIVMV) equal to 106 and a repurchase yield of
(REPOMV) equal to 105 These payout ratios are very similar to the ones reported in
Grullon and Michaely (2002) Further the average firm in our sample is almost 13 years old and
it has a market value of equity (MV) of $11 billion a market-to-book ratio (MB) equal to 20 a
16
debt-to-asset ratio (DEBTASSETS) equal to 167 and a return on assets (ROA) equal to
43 The characteristics of the average firm in our sample are very similar to the characteristics
of the average firm in Compustat (not reported in a table) Thus it seems that our sample is not
biased toward a particular type of firm Finally Table 1 also shows that there are large cross-
sectional differences in payout ratios and firm characteristics This large dispersion in both
dependent and independent variables should improve the power of our empirical tests to detect
any effect of concentration levels on corporate payouts
4 The Relation between Industry Concentration Levels and Corporate Payout Policy
In this section we investigate whether product market competition affects managersrsquo
decision to distribute cash to their shareholders We perform this analysis by regressing scaled
measures of dividends and repurchases on the Herfindahl-Hirschman Index (HHI) size (MV)
market-to-book ratio (MB) return on assets (ROA) debt-to-total assets ratio (DEBTASSETS)
age of the firm (AGE) stock return volatility (RETVOL) year dummies and industry dummies
Since our measures of corporate payouts are truncated at zero and one we estimate the
regression coefficients using a two-sided Tobit model Following Petersen (2009) we control
for possible cross-sectional dependence in the residuals by adjusting the standard errors for
within-firm correlation and control for any time series dependence by including time dummies
We do not include firm-fixed effects in our panel data regressions because the HHIs do not
change much over time However we include two-digit SIC code dummies to control for
industry-fixed effects
The first three columns of Panel A of Table 2 report estimates of regressions relating
scaled dividends to the HHI and other control variables Consistent with the predictions of the
ldquooutcomerdquo model and the predation risk hypothesis these columns show that dividend payout
17
ratios are negatively correlated with industry concentration levels Note that the coefficient of
the HHI is negative and statistically significant in all the specifications To control for potential
non-linearities in the relation between payout ratios and HHI we also consider specifications in
which instead of using the continuous variable HHI we use a dummy variable equal to one if the
HHI is above its median zero otherwise We report the results from this alternative specification
in the last three columns of Panel A of Table 2 Consistent with our results using the continuous
variable we find that firms in high HHI industries have lower dividend payout ratios than firms
in low HHI industries
As expected Table 2 shows that dividend payout ratios are positively correlated with size
(MV) maturity level (AGE) and profitability (ROA) and negatively correlated with growth
opportunities (MB) and volatility (RETVOL) Moreover there is evidence that dividends are
negatively related to leverage (DEBTASSET) which suggests that firms use debt as a substitute
for dividends In general these results are consistent with the stylized fact that large stable
profitable old firms with low investment opportunities pay more dividends
As discussed earlier dividends have been shown to be a stronger commitment device
than share repurchases (see for example Jagannathan Stephens and Weisbach (2000) and
Guay and Harford (2000)) Consequently if agency considerations are an important determinant
of the relation between competition and payouts then product market competition should have a
weaker effect on share repurchases To test this hypothesis we replicate the previous analyses
using share repurchases instead of dividends (Panel B of Table 2) We find that the relation
between repurchases and the HHI appears to be weaker than the relation between dividends and
the HHI Consistent with the implications of agency theory these results indicate that product
market competition has the strongest effect on the least flexible payout method
18
We augment the previous analysis by examining the effect of industry concentration on
the decision to increase distribute cash to shareholders We use this alternative approach to
examine whether our main results hold over the following discrete payout decisions (1) the
decision to pay dividends (Div gt 0) (2) the decision to increase dividends (change in Div gt 0)
and (3) the decision to repurchase shares (Rep gt 0) Given the nature of these dependent
variables we estimate the regression parameters using a Logit model Table 3 reports the results
from this analysis Consistent with the results in Table 2 we find that firms in less competitive
markets are less likely to pay dividends and less likely to increase dividends relative to firms in
more competitive markets Further there is some evidence that firms in less competitive
markets are less likely to repurchase shares (see columns 3 amp 6) albeit these results are much
weaker than the ones for dividends
The results in Tables 2 and 3 are also economically significant For example Table 2
results imply that an increase of one standard deviation in the HHI reduces the dividend yield
(DIVMV) by 27 from its mean value and the dividend-to-assets ratio (DIVASSETS) by
almost 41 from its mean value Overall the empirical results in this section indicate that firms
in more competitive market tend to have significantly higher dividend payout ratios than firms in
less competitive markets
5 Explaining the Negative Relation between Industry Concentration and Corporate Payout Policy
In the previous section we show that corporate payouts particularly dividend payments
are negatively related to industry concentration levels These results are consistent with both the
ldquooutcomerdquo model proposed by LLSV (2000) and the predation hypothesis In the next two sub-
sections we perform several tests to disentangle these two explanations
51 A quasi-natural experiment The Effect of Business Combination Laws
19
The negative correlation between corporate payouts and HHI supports one of the
implications of agency theorymdashthat payouts are the outcome of external factors However this
negative relation could be driven by some unobservable factor that could be unrelated to agency
problems Therefore to examine whether agency issues are driving our main results we need to
show that an exogenous shock to agency conflicts strengthens the negative relation between
payouts and industry concentration levels
Following the work of Bertrand and Mullainathan (2003) and Giroud and Mueller (2010)
we use the adoption of business combination (BC) laws in the US as a natural experiment to
examine how agency issues affect the relation between corporate payouts and product market
competition The business combination laws were enacted in more than 25 states between 1985
and 1991 These laws make hostile takeovers significantly more difficult by imposing a
moratorium of three to five years on certain types of transactions such as asset sales and mergers
Bertrand and Mullainathan (2003) and Giroud and Mueller (2010) provide empirical evidence
that the BC laws exacerbated the agency problems between managers and shareholders
Therefore we use these laws to examine whether our main results are mainly driven by agency
issues If the market for corporate control serves as a substitute for the lack of product market
competition (Giroud and Mueller (2010)) then the outcome model predicts that the negative
relation between the HHI and payouts should become stronger after the passage of the BC laws
If on the other hand dividends in concentrated industries are being limited as a consequence of
predatory concerns then we expect that the adoption of the BC laws to have no effect on
dividend policy Further since the BC laws only reduce the likelihood of a firm becoming a
takeover target these exogenous events allow us to control for any unobservable factor that
could drive the negative relation between payouts and concentration levels
20
To investigate the effect of the BC laws on the relation between concentration levels and
payouts we perform a differences-in-differences analysis using data around the adoption of these
laws (we use data from 1979 until 1997) We do this by including in our regressions a dummy
variable (DUMBC) equal to one if the firm is incorporated in a state that has passed a business
combination law zero otherwise and a term in which we interact the HHI with DUMBC By
design this latter term should capture the change in the gap in payout ratios between competitive
and non-competitive firms after the passage of the BC laws Thus if agency conflicts are driving
force behind the relation between HHI and corporate payouts then the coefficient on the
interaction term HHI x DUMBC should be negative
Table 4 reports the results from this analysis using scaled measures of dividends and
share repurchases Consistent with the predictions of the outcome we find evidence that the
negative relation between dividends and industry concentration levels becomes significantly
stronger after the passage of the BC laws Panel A of Table 4 shows that the interaction term
Log(HHI) x DUMBC is negative and statistically significant in most specifications
Interestingly when we use the dummy variable DUMHHI to measure concentration we find that
that the regression coefficient on DUMHHI x DUMBC is statistically significant in all
specifications but the coefficient on DUMHHI is not This indicates that the negative
correlation between dividends and concentration levels is only significant for firms incorporated
in states that have passed business combination laws On the other hand Panel B of Table 4
shows that the BC laws did not have any effect on the relation between concentration levels and
share repurchases This suggest that the shock to agency conflicts generated by the BC laws
only affected dividends ndash the payout method that is less flexible and consequently more likely
to reduce agency problems consistent with our findings in the previous section
21
Finally we examine whether the effect of the BC laws on the relation between
concentration levels and corporate payouts hold over discrete payout decisions whether to pay
dividends whether to increase dividends and whether to repurchase shares We report the
results from this analysis in Table 5 Corroborating the results in Table 4 we find that the
negative effect of the HHI on the likelihood of paying dividends or increasing dividends
becomes much stronger after the passage of the business combination laws Note that the
coefficients on Log (HHI) x DUMBC and DUMHHI x DUMBC are negative and statistically
significant all the specifications using dividend decisions as the choice variable (see columns 1
2 4 and 5) Further consistent with our previous results we do not find any effect of the BC
laws on the relation between the HHI and the decision to repurchase shares
Overall the results in this section support the idea that the negative relation between
concentration and corporate dividend payouts is driven by agency considerations In particular
they provide support to the theoretical argument in LLSV (2000) that corporate dividend policy
is the outcome of external factors Further since it is not clear why BC laws should only make
firms in less concentrated markets more vulnerable to predatory threats these results suggest that
strategic interactions in the product market are not a main determinant of the negative relation
between competition and payout ratios In fact if our results were mainly driven by predatory
issues then the firms in concentrated markets that were affected by the BC laws would have
tried to become more efficient to fend off potential predatory attacks by their competitors
However the evidence in Giroud and Mueller (2010) indicates managers of these firms decided
to adopt the ldquoquiet liferdquo which suggests that they were not extremely concerned about predation
52The Effect of Firm Size
22
In the previous sub-section we examine the effect of the BC laws on the relation between
market concentration and corporate payout policy to distinguish the ldquooutcomerdquo model from the
predation hypothesis The results from these seem to support the predictions of the ldquooutcomerdquo
model To further investigate whether agency or predatory issues are driving our main results in
this sub-section we examine the effect of firmrsquos position within the industry (proxied by their
relative market cap) on the relation between concentration and payout
The predation risk hypothesis suggests that the negative relation between the HHI and
payout ratios should be weaker among large firms and stronger among small firms The main
intuition behind this argument is that the largest firms in a particular industry should be less
concerned about inducing predatory behavior than the smallest firms because the former firms
have more resources and potentially more market power to fend off any predatory attack than the
latter firms
If corporate payouts are the ldquooutcomerdquo of intense product market competition however
then we should expect that the effect of competition on payouts should be stronger among those
firms that are more likely to have high agency cost of free cash flows2 Thus since large firms
tend to be mature firms that generate substantial and stable cash flows the ldquooutcomerdquo model
predicts that the negative relation between the HHI and payouts should be stronger among this
type of firms
To investigate whether the relation between the HHI and payout ratios is different
between large and small firms we include in our regressions a term that interacts the
concentration measure (HHI) with a dummy variable (LARGE) that is equal to one if a firmrsquos
market value is above its industry (four-digit SIC code) average market value at time t If the
2 Jensen (1986) argues that agency costs of free cash flows are likely to be more severe among ldquofirms that have stable business histories and substantial free cash flow (ie low growth prospect and high potential for generating cash flows)rdquo
23
predation risk hypothesis is correct then the coefficient of the interaction term (HHI x LARGE)
should be positive However if agency considerations are the main drivers behind the relation
between concentration levels and corporate payouts then the coefficient of the interaction term
should be negative
Table 6 reports the results from this analysis Consistent with the predictions of the
ldquooutcomerdquo model Panel A shows that the coefficient of the interaction term (HHI x LARGE) is
negative and statistically significant in all specifications using scaled measures of dividends as
dependent variables This result implies that the negative relation between the HHI and
dividend payout ratios is much stronger among large firms Interestingly Panel A shows that the
coefficients on Log (HHI) and DUMHHI are not statistically significant which suggests that the
relation between concentration levels and dividend payout ratios is mainly driven by large firms
In Panel B of Table 6 we find similar results using scaled measures of share repurchases as
dependent variables but the results are weaker than the ones using dividends Table 7 replicates
the analysis in Table 6 using discrete payout decisions as dependent variables Consistent with
our previous empirical results Table 7 shows that the effect of the HHI on the decision to pay
dividends increase dividends or repurchase shares is generally stronger among the largest firms
in a particular industry
One again the economic magnitude of the coefficients reported in Table 6 and 7 is large
For example among large firms an increase of one standard deviation in the HHI reduces the
dividend yield (DIVMV) by 47 from its mean value and the dividend-to-assets ratio
(DIVASSETS) by almost 74 from its mean value In general the empirical results in this
section indicate that the negative relation between HHI and corporate payouts is mainly driven
by firms that are likely to have high agency cost of free cash flows While these findings seem
24
to support the idea that corporate payouts are the ldquooutcomerdquo of external factors they are
inconsistent with the idea that firms in more concentrated markets tend to pay less cash to fend
off predatory behavior from competitors
6 Does the Choice of Concentration Measure Matter
In a recent paper Hoberg and Phillips (2014) developed an alternative measure of the
HHI (TNIC3 HHI) using industry classifications based on firm pairwise similarity scores from
text analysis of firm 10K product descriptions Hoberg Phillips and Prabhala (2014) use this
alternative measure of concentration in their empirical tests and find that firms in more
concentrated industries tend to pay more dividends Given that these results are at odds with our
main findings we investigate in this section the source of the discrepancy between the Census
HHI and the TNIC3 HHI
To illustrate this issue Table 8 examines the empirical relation between dividend payout
ratios and these two alternative measures of concentration over the period 1997-20103 While
columns 1 2 and 3 show that our main results are robust over this sample period columns 4 5
and 6 show that dividends are positively related to the TNIC3 HHI This inconsistency in the
relation between corporate payouts and concentration levels strongly suggests that the Census
HHI and the TNIC3 HHI are measuring different aspects of firmsrsquo product markets
One potential reason for this discrepancy is that Hoberg and Phillips (2014) construct
their measure of concentration using data from publicly-traded firms that appear on Compustat
As pointed out by several authors the concentration measures derived from Compustat data are
less meaningful than the ones reported by the Census of Manufacturers because the former
measures are constructed only using public firms while the latter measure uses both private and
public firms In a recent study Ali Klasa and Yeung (2009) show that this key difference 3 We restrict our analysis to this sample period because the TNIC3 HHI is only available after 1996
25
between these two measures seems to significantly bias the HHI derived from Compustat data
For example consistent with the idea that more concentrated industries should be populated by
larger and more profitable firms Ali et al (2009) find that the Census HHI is positively
correlated with both average firm size and price-cost margins Further they show that the total
number of firms in the industry is negatively related to the Census HHI However they do not
find these results when they use the HHI derived from Compustat data In fact they find that
industries classified as concentrated using the Compustat HHI tend to be populated by smaller
firms These findings suggest that the use of Compustat concentration measures as proxy for
industry concentration may lead to incorrect inferences
To investigate whether the TNIC3 HHI is good proxy for competition we replicate the
analysis in Ali et al (2009) for both the Census HHI and the TNIC3 HHI The results from this
analysis are reported in Table 9 Corroborating the findings in Ali et al (2009) Panel A shows
that the Census HHI is positively correlated with several proxies for firm size (market
capitalization total assets and total sales) and price-cost margins In contrast Panel B shows
that the TNIC3 HHI is negatively correlated with all the proxies for firm size and uncorrelated
with price-cost margins To better visualize these patterns Figures 1 and 2 depicts the
characteristics of portfolios sorted by competition measures In general these results indicate
that TNIC3 HHI suffers from the same biases as the Compustat HHI which raises important
concerns about the validity of this concentration measure
7 Conclusion
Our study extends the work of LLSV (2000) by arguing that product market competition
can be viewed as an additional external disciplinary factor Based on the idea that competition
can exert pressure on managers to distribute cash to their shareholders by increasing the risk and
26
the cost of overinvesting we argue that corporate payouts could either be the result of product
market competition or alternatively a disciplinary devise that substitutes for competition A
third alternative is that payout policy is related to competition through predation risk Firms in
less competitive markets pay out less and hoard more cash to reduce potential predatory attacks
from competitors
The results in this paper seem to support the idea that corporate payouts are the outcome
of the disciplinary forces of product market competition We find that corporate payouts are
positively correlated with the intensity of industry competition even after controlling for
potential confounding effects There is no support for the notion that corporations use payout
policy as an alternative governance mechanism to competition Moreover consistent with the
implications of agency theory we find that the effect of product market competition on payouts
becomes much stronger among firms affected by the business combinations laws adopted by
several states in the US during the 1980s and 1990s Since these laws exacerbated the agency
conflict between managers and shareholders by immunizing firms against the market for
corporate control our findings indicate that the link between concentration levels and corporate
payouts is mainly driven by agency considerations
The initial results-that firms in more competitive market have higher payout than
otherwise similar firms in less competitive markets-is also consistent with the predation-risk
alternative The use of the change in the BC laws sheds some light on this issue as well since
predation risk imply no change in payout policy as a consequence of these law changes Our
findings of great effect of competition on payout after the passage of the law is not consistent
with the notion that predation is the dominant factor affect the relation between competition and
payout Further analysis reveals that the difference in payout policy between firms in competitive
27
and less competitive market is primarily driven by large firms That is our main results are
driven by firms who are more likely to be subject to free cash flow issues rather than to predatory
issues
Overall our results complement the empirical results in LLSV While they find evidence
suggesting that a strong legal system exerts pressure on corporate managers to distribute excess
cash to their shareholders we find that intense product market competition appears to have
similar effects These findings are important because they further suggest that competition is
indeed a strong disciplinary devise At the same time the findings suggest that agency problems
play an important role in managersrsquo decision to distribute cash to shareholders and that at times
external disciplinary devises such as competition induce managers to behave more optimally
28
References
Acharya V H Almeida and M Campello 2007 ldquoIs Cash Negative Debt A Hedging Perspective on Corporate Financial Policiesrdquo Journal of Financial Intermediation 16 515-554
Aggarwal R and A Samwick 1999 ldquoExecutive Compensation Strategic Competition and
Relative Performance Evaluation Theory and Evidencerdquo Journal of Finance 54 1999-2043
Aghion P M Dewatripont and P Rey 1999 ldquoCompetition Financial Discipline and
Growthrdquo Review of Economic Studies 66 825-852 Akdoğu E and P MacKay 2008 ldquoInvestment and Competitionrdquo Journal of Financial and
Quantitative Analysis 43 299-330 Ali A S Klasa and E Yeung 2009 ldquoThe Limitations of Industry Concentration Measures
Constructed with Compustat Data Implications for Finance Researchrdquo Review of Financial Studies 22 3839-3871
Allayannis G and J Ihrig 2001 ldquoExposure and Markupsrdquo Review of Financial Studies 14
805-835 Allen F and D Gale 2000 ldquoCorporate Governance and Competitionrdquo published in Corporate
Governance Theoretical and Empirical Perspectives edited by X Vives Cambridge University Press 23-94
Allen F A Bernardo and I Welch 2000 ldquoA Theory of Dividends Based on Tax Clientelesrdquo
Journal of Finance 55 2499-2536 Ang J R Cole and J Lin 2000 ldquoAgency Costs and Ownership Structurerdquo Journal of Finance
55 81-106 Arabmazar A and P Schmidt 1981 ldquoFurther Evidence on the Robustness of the Tobit
Estimator to Heteroskedasticityrdquo Journal of Econometrics 17 253-258 Arabmazar A and P Schmidt 1982 ldquoAn Investigation of the Robustness of the Tobit
Estimator to Non-Normalityrdquo Econometrica 50 1055-1063 Bebchuk L A Cohen and A Ferrell 2009 ldquoWhat Matters in Corporate Governancerdquo Review
of Financial Studies 22 783-827 Berger A and T Hannan 1998 ldquoThe Efficiency Cost of Market Power in the Banking
Industry A Test of the ldquoQuiet Liferdquo and Related Hypothesesrdquo The Review of Economics and Statistics 80 454-465
29
Bertrand M and S Mullainathan 2003 ldquoEnjoying the Quiet Life Corporate Governance and Managerial Preferencesrdquo Journal of Political Economy 111(5) 1043-1075
Bolton P and D Scharfstein 1990 ldquoA Theory of Predation Based on Agency Problems in
Financial Contractingrdquo American Economic Review 80 93-106 Boudoukh J R Michaely M Richardson and M Roberts 2007 ldquoOn the Importance of
Measuring Payout Yield Implications for Empirical Asset Pricingrdquo Journal of Finance 62 877-915
Campello M 2006 ldquoDebt Financing Does it Boost or Hurt Firm Performance in Product
Marketsrdquo Journal of Financial Economics 83 135-172 Caves R 1980 ldquoIndustrial Organization Corporate Strategy and Structurerdquo Journal of
Economic Literature 18 64-92 Chhaochharia V Y Grinstein G Grullon and R Michaely 2012 ldquoProduct Market
Competition and Internal Governance Evidence from the Sarbanes Oxley Actrdquo Working Paper Cornell University
DeAngelo H L DeAngelo and R Stulz 2006 ldquoDividend Policy and the EarnedContributed
Capital Mix A Test of the Lifecycle Theoryrdquo Journal of Financial Economics 81(2) 227-254
DeFond M and C Park 1999 ldquoThe Effect of Competition on CEO Turnoverrdquo Journal of
Accounting and Economics 27 35-56 Fama E and K French 2001 ldquoDisappearing Dividends Changing Firm Characteristics or
Lower Propensity to Payrdquo Journal of Financial Economics 60 3-43 Fee C and C Hadlock 2000 ldquoManagement Turnover and Product Market Competition
Empirical Evidence from the US Newspaper Industryrdquo Journal of Business 73 205-243
Giroud X and H M Mueller 2010 ldquoDoes Corporate Governance Matter in Competitive
Industriesrdquo Journal of Financial Economics 95 312-331 Giroud X and H M Mueller 2011 ldquoCorporate Governance Product Market Competition and
Equity Pricesrdquo Journal of Finance 66 563-600 Gomes A 2000 ldquoGoing Public without Governance Managerial Reputation Effectsrdquo Journal
of Finance 55 615-646 Gompers P J Ishii and A Metrick 2003 Corporate Governance and Equity Prices
Quarterly Journal of Economics 118 107-155
30
Graham D D Kaplan and D Sibley 1983 ldquoEfficiency and Competition in the Airline Industryrdquo Bell Journal of Economics 14 118-138
Griffith R 2001 ldquoProduct Market Competition Efficiency and Agency Cost An Empirical
Analysisrdquo Working Paper Institute for Fiscal Studies Grinstein Y and R Michaely 2005 ldquoInstitutional Holdings and Payout Policyrdquo Journal of
Finance 60 1389-1426 Grinstein Y and A Palvia 2006 ldquoExecutive Loans Corporate Governance and Firm
Performance - Evidence from Banksrdquo Working Paper Cornell University Grullon G and R Michaely 2002 ldquoDividends Share Repurchases and the Substitution
Hypothesisrdquo Journal of Finance 57 1649-1684 Grullon G and R Michaely 2004 ldquoThe Information Content of Share Repurchase Programsrdquo
Journal of Finance 59 651-680 Guay W and J Harford 2000 ldquoThe Cash-Flow Permanence and Information Content of
Dividend Increases versus Repurchasesrdquo Journal of Financial Economics 57 385-415 Hart O 1983 ldquoThe Market as an Incentive Mechanismrdquo Bell Journal of Economics 14 336-
382 Haushalter D S Klasa and W Maxwell 2007 ldquoThe Influence of Product Market Dynamics on
the Firms Cash Holdings and Hedging Behaviorrdquo Journal of Financial Economics 84 797-825
Hermalin B 1992 ldquoThe Effects of Competition on Executive Behaviorrdquo RAND Journal of
Economics 23 350-365 Hicks J 1935 ldquoAnnual Survey of Economic Theory The Theory of Monopolyrdquo Econometrica
3 1-20 Hoberg G and G Phillips 2014 ldquoText-Based Network Industries and Endogenous Product
Differentiationrdquo Working Paper University of Maryland Hoberg G G Phillips and N Prabhala 2014 ldquoProduct Market Threats Payouts and Financial
Flexibilityrdquo Journal of Finance 69 293-324 Holmstrom B 1982 ldquoMoral Hazard in Teamsrdquo Bell Journal of Economics 13 324-340 Jagannathan R and S B Srinivasan 1999 ldquoDoes product market competition reduce agency
costsrdquo North American Journal of Economics and Finance 10 387ndash399
31
Jagannathan M C Stephens and M Weisbach 2000 ldquoFinancial Flexibility and the Choice between Dividends and Stock Repurchasesrdquo Journal of Financial Economics 57 355-384
Jensen M 1986 ldquoAgency Costs of Free Cash Flow Corporate Finance and Takeoversrdquo
American Economic Review 76 323-329 John K and A Knyazeva 2006 ldquoPayout Policy Agency Conflicts and Corporate
Governancerdquo Working Paper NYU Kruse T and C Rennie 2006 ldquoProduct Market Competition Excess Free Cash Flows and
CEO Discipline Evidence from the US Retail Industryrdquo Working Paper University of Arkansas
La Porta R F Lopez-de-Silanes A Shleifer and R Vishny 2000 ldquoAgency Problems and
Dividend Policies around the Worldrdquo Journal of Finance 55 1ndash33 Lie E 2000 ldquoExcess Funds and Agency Problems An Empirical Study of Incremental Cash
Disbursementsrdquo Review of Financial Studies 13 219-248 Linderberg E and S Ross 1981 ldquoTobinrsquos q Ratio and Industrial Organizationrdquo Journal of
Business 54 1-32 MacKay P and G Phillips 2005 ldquoHow Does Industry Affect Firm Financial Structurerdquo The
Review of Financial Studies 18 1433-1466 Massa M Z Rehman and T Vermaelen 2007 ldquoMimicking Repurchasesrdquo Journal of Financial
Economics 84 624-666 Michaely R and M Roberts 2012 ldquoCorporate Dividend Policies Lessons from Private
Firmsrdquo Review of Financial Studies 25 711-746 Nalebuff B and J Stiglitz 1983 ldquoPrizes and Incentives Towards a General Theory of
Compensation and Competitionrdquo Bell Journal of Economics 14 21-43 Nickell S 1996 ldquoCompetition and Corporate Performancerdquo Journal of Political Economy 104
724-746 Officer M 2006 ldquoDividend Policy Dividend Initiations and Governancerdquo Working Paper
University of Southern California Petersen M 2009 ldquoEstimating Standard Errors in Finance Panel Data Sets Comparing
Approachesrdquo Review of Financial Studies 22 435-480 Powell J 1984 ldquoLeast Absolute Deviations Estimation of the Censored Regression Modelrdquo
Journal of Econometrics 25 303ndash325
32
Raith M 2003 ldquoCompetition Risk and Managerial Incentivesrdquo American Economic Review 93
1425-1436 Salinger M 1984 ldquoTobinrsquos q Unionization and the Concentration-Profits Relationshiprdquo Rand
Journal of Economics 15 159-170 Scharfstein D 1988 ldquoProduct-Market Competition and Managerial Slackrdquo RAND Journal of
Economics 19 147-155 Schmidt K 1997 ldquoManagerial Incentives and Product Market Competitionrdquo Review of
Economic Studies 64 191-213 Skinner D 2008 ldquoThe Evolving Relation between Earnings Dividends and Stock
Repurchasesrdquo Journal of Financial Economics 87 582-609 Shleifer A 1985 ldquoA Theory of Yardstick Competitionrdquo RAND Journal of Economics 16 319-
327 Shleifer A and R Vishny 1997 ldquoA Survey of Corporate Governancerdquo Journal of Finance 52
737-783 Zwiebel J 1996 ldquoDynamic Capital Structure under Managerial Entrenchmentrdquo American
Economic Review 86 1197-1215
33
Figure 1 Average Total Sales of Portfolios Sorted by Competition Measures
This figure depicts the average total sales of portfolios sorted by competition measures Census HHI is the four-digit SIC Herfindahl-Hirschman Index from the Census of Manufacturers TNIC3 HHI is the Herfindahl-Hirschman Index developed by Hoberg and Phillips (2014) which uses industry classifications based on firm pairwise similarity scores from text analysis of firm 10K product descriptions The sample period is from 1997 to 2010
0
500
1000
1500
2000
2500
3000
3500
4000
4500
1 2 3 4
Mill
ions
of $
Quartiles based on Census HHI
0
500
1000
1500
2000
2500
3000
3500
4000
4500
1 2 3 4
Mill
ions
of $
Quartiles based on TNIC3 HHI
34
Figure 2 Average Lerner Index of Portfolios Sorted by Competition Measures
This figure depicts the average Lerner index sorted by competition measures The Lerner Index is the price-cost margin [(total sales - cost of goods sold - selling and general expenses -depreciation)total sales] Census HHI is the four-digit SIC Herfindahl-Hirschman Index from the Census of Manufacturers TNIC3 HHI is the Herfindahl-Hirschman Index developed by Hoberg and Phillips (2014) which uses industry classifications based on firm pairwise similarity scores from text analysis of firm 10K product descriptions The sample period is from 1997 to 2010
700
750
800
850
900
950
1 2 3 4Quartiles based on Census HHI
700
750
800
850
900
950
1 2 3 4Quartiles based on TNIC3 HHI
35
Table 1 Summary Statistics
This table reports the summary statistics for the sample firms To be included in the sample the observation must satisfy the following criteria the firmrsquos financial data is available on Compustat the firm operates in an industry covered by the Census of Manufacturers (SIC code interval 2000-3990) total assets are greater than $1 million DIV is the total dollar amount of dividends declared on the common stock REPO is the expenditure on the purchase of common and preferred stocks SALES are total sales MV is the market value of common stock ASSETS are equal to the total book value of assets AGE is the time (in years) from the firmrsquos CRSP listing date MB is the market-to-book ratio [(book value of assets + market value of equity - book value of equity) book value of assets] DEBTASSETS is equal to long-term debt plus short-term debt scaled by total assets HHI is the four-digit SIC Herfindahl-Hirschman Index from the Census of Manufacturers ROA is the operating income before depreciation scaled by total assets CAPEX is the level of capital expenditures All the payout measures MB and ROA have been winsorized at the 1 and the 99 of their empirical distribution MV and ASSETS have been deflated by the Consumer Price Index (1982-1984=100) The sample period is from 1972 to 2010
Mean Std Dev 5th Median 95th N Payout Measures DIV ASSETS 080 150 0 0 380 64644 DIV SALES 074 152 0 0 357 63647 DIV MV 106 192 0 0 538 63616 REPO ASSETS 102 305 0 0 649 60056 REPO SALES 116 378 0 0 696 59270 REPO MV 105 304 0 0 637 59026 Proportion of Firms with DIV gt 0 359 Proportion of Firms with REPOgt 0 297 Firm Characteristics MV 1138 5980 3 64 4305 63794 ASSETS 1154 5958 3 62 4253 64866 AGE 134 144 0 9 45 64866 MB 20 14 07 14 56 61718 DEBTASSETS 0167 0170 0 0129 0494 63500 HHI 857 680 270 647 2300 64780 ROA 0043 0246 -0500 0111 0281 64634 RETVOL 0155 0106 0055 0131 0330 58731 CAPEXASSETS 0056 0056 0005 0041 0158 64097
36
Table 2 The Relation between Product Market Competition and Corporate Payouts
This table reports estimates of regressions relating scaled measures of dividends and share repurchases to the Herfindahl-Hirschman Index and other control variables DIV is the total dollar amount of dividends declared on the common stock REPO is the expenditure on the purchase of common and preferred stocks SALES are total sales MV is the market value of common stock ASSETS are equal to the total book value of assets HHI is the four-digit SIC Herfindahl-Hirschman Index from the Census of Manufacturers scaled by 100 DUMHHI is a dummy variable equal to one if the HHI is above its median zero otherwise MB is the market-to-book ratio [(book value of assets + market value of equity - book value of equity) book value of assets] ROA is the operating income before depreciation scaled by total assets DEBTASSETS is equal to long-term debt plus short-term debt scaled by total assets AGE is the time (in years) from the firmrsquos CRSP listing date All the payout measures MB and ROA have been winsorized at the 1 and the 99 of their empirical distribution Since the dependent variables are truncated at zero and one we estimate the regression coefficients using a two-sided Tobit model Standard errors adjusted for within-firm correlation are reported in parentheses below coefficient estimates Superscripts a b and c denote significantly different from zero at the 1 5 and 10 level respectively The sample period is from 1972 to 2010 Panel A Dividends Dependent Variable DIV
SALES DIV MV
DIV ASSETS
DIV SALES
DIV MV
DIV ASSETS
Intercept -00233a -00226a -00209a -00251a -00243a -00227a (00029) (00033) (00027) (00028) (00032) (00026) Log (HHI) -00016a -00015a -00017a (00005) (00006) (00005) DUMHHI -00020a -00017b -00019a (00007) (00080) (00007) log (MV) 00039a 00043a 00031a 00039a 00043a 00031a (00002) (00002) (00002) (00002) (00002) (00002) log (MB) -00057a -00243a -00055a -00058a -00244a -00055a (00008) (00010) (00008) (00008) (00010) (00008) ROA 00680a 00773a 00837a 00683a 00776a 00840a (00037) (00044) (00040) (00037) (00044) (00040) DEBTASSETS -00183a -00166a -00241a -00183a -00165a -00241a (00023) (00026) (00021) (00023) (00026) (00022) log (1+ AGE) 00056a 00072a 00063a 00057a 00072a 00064a (00004) (00005) (00004) (00004) (00005) (00004) RETVOL -01299a -01607a -01330a -01296a -01606a -01328a (00075) (00085) (00073) (00075) (00085) (00073) Year-Fixed Effects Yes Yes Yes Yes Yes Yes Two-Digit SIC Industry-Fixed Effects Yes Yes Yes Yes Yes Yes N 54715 55343 55343 54715 55343 55343
37
Panel B Share Repurchases Dependent Variable REPO
SALES REPO
MV REPO
ASSETS REPO SALES
REPO MV
REPO ASSETS
Intercept -00573a -00437a -00472a -00574a -00440a -00472a (00056) (00045) (00046) (00053) (00044) (00044) Log (HHI) -00004 -00005 -00002 (00010) (00009) (00009) DUMHHI -00027c -00022c -00020c (00015) (00012) (00012) log (MV) 00055a 00033a 00035a 00056a 00033a 00035a (00005) (00004) (00004) (00005) (00004) (00004) log (MB) -00017 -00161a 00009 -00018 -00161a 00008 (00018) (00013) (00014) (00018) (00013) (00014) ROA 00432a 00500a 00636a 00431a 00499a 00636a (00052) (00037) (00043) (00052) (00037) (00043) DEBTASSETS -00407a -00202a -00346a -00408a -00202a -00347a (00049) (00039) (00038) (00049) (00039) (00038) log (1+ AGE) 00051a 00052a 00056a 00051a 00051a 00056a (00008) (00007) (00007) (00008) (00007) (00007) RETVOL -00982a -00821a -00843a -00975a -00816a -00839a (00100) (00078) (00078) (00100) (00078) (00078) Year-Fixed Effects Yes Yes Yes Yes Yes Yes Two-Digit SIC Industry-Fixed Effects Yes Yes Yes Yes Yes Yes N 51101 51608 51608 51101 51608 51608
38
Table 3 Logit Regressions Product Market Competition and Payout Decisions
This table reports estimates of Logit regressions relating payout decisions to the Herfindahl-Hirschman Index and other control variables DIV gt 0 is a dummy variable equal to one if the total dollar amount of dividends declared on the common stock is positive zero otherwise Change in DIV gt 0 is a dummy variable equal to one if the firm increases its dividends from year t-1 to t zero otherwise REPO gt 0 is a dummy variable equal to one if the expenditure on the purchase of common and preferred stocks is positive zero otherwise MV is the market value of common stock HHI is the four-digit SIC Herfindahl-Hirschman Index from the Census of Manufacturers scaled by 100 DUMHHI is a dummy variable equal to one if the HHI is above its median zero otherwise MB is the market-to-book ratio [(book value of assets + market value of equity - book value of equity) book value of assets] ROA is the operating income before depreciation scaled by total assets DEBTASSETS is equal to long-term debt plus short-term debt scaled by total assets AGE is the time (in years) from the firmrsquos CRSP listing date RETVOL is the standard deviation of monthly stock returns MB and ROA have been winsorized at the 1 and the 99 of the empirical distribution Standard errors adjusted for within-firm correlation are reported in parentheses below coefficient estimates Superscripts a b and c denote significantly different from zero at the 1 5 and 10 level respectively The sample period is from 1972 to 2010 Dependent Variable
DIV gt 0 Change in DIV gt 0 REPO gt 0 DIV gt 0
Change in DIV gt 0 REPO gt 0
Intercept -37083a -39547a -12362a -35544a -37831a -11803a (02596) (02025) (01465) (02568) (02009) (01441) Log (HHI) -01312a -01468a -00441 (00501) (00414) (00291) DUMHHI -02028a -02305a -00729c (00695) (00582) (00407) log (MV) 04984a 03818a 01344a 04986a 03819a 01343a (00243) (00178) (00127) (00242) (00177) (00127) log (MB) -13758a -08140a -03352a -13809a -08211a -03356a (00790) (00663) (00417) (00788) (00662) (00417) ROA 65581a 80272a 17317a 65870a 80652a 17355a (03023) (02879) (01248) (03029) (02884) (01249) DEBTASSETS -13200a -06518a -09733a -13229a -06540a -09730a (01949) (01673) (01248) (01954) (01679) (01248) log (1+ AGE) 06786a 04850a 01830a 06816a 04875a 01836a (00420) (00325) (00226) (00420) (00325) (00226) RETVOL -12192a -10083a -2942a -12153a -10028a -2934a (05268) (04747) (02408) (05246) (04719) (02409) Year-Fixed Effects Yes Yes Yes Yes Yes Yes Two-Digit SIC Industry-Fixed Effects Yes Yes Yes Yes Yes Yes N 55343 54552 51608 55343 54552 51608
39
Table 4 The Effect of Business Combination Laws on the Relation between Product Market
Competition and Corporate Payouts
This table examines the effect of business combination laws on the relation between the Herfindahl-Hirschman Index and scaled measures of dividends and share repurchases DIV is the total dollar amount of dividends declared on the common stock REPO is the expenditure on the purchase of common and preferred stocks SALES are total sales MV is the market value of common stock ASSETS are equal to the total book value of assets HHI is the four-digit SIC Herfindahl-Hirschman Index from the Census of Manufacturers scaled by 100 DUMHHI is a dummy variable equal to one if the HHI is above its median value zero otherwise DUMBC is a dummy variable equal to one if the firm is incorporated in a state that has passed a business combination law zero otherwise MB is the market-to-book ratio [(book value of assets + market value of equity - book value of equity) book value of assets] ROA is the operating income before depreciation scaled by total assets DEBTASSETS is equal to long-term debt plus short-term debt scaled by total assets AGE is the time (in years) from the firmrsquos CRSP listing date All the payout measures MB and ROA have been winsorized at the 1 and the 99 of their empirical distribution Since the dependent variables are truncated at zero and one we estimate the regression coefficients using a two-sided Tobit model Standard errors adjusted for within-firm correlation are reported in parentheses below coefficient estimates Superscripts a b and c denote significantly different from zero at the 1 5 and 10 level respectively The sample period is from 1979 to 1997 Panel A Dividends Dependent Variable DIV
SALES DIV MV
DIV ASSETS
DIV SALES
DIV MV
DIV ASSETS
Intercept 00054 00250a 00150a 00014 00208a 00106a (00033) (00043) (00038) (00029) (00038) (00034) Log (HHI) -00021b -00024b -00024b (00009) (00011) (00010) Log (HHI) x DUMBC -00028a -00009 -00024b (00010) (00012) (00010) DUMBC 00064b 00026 00049b (00023) (00028) (00024) DUMHHI -00009 -00018 -00011 (00010) (00013) (00011) DUMHHI x DUMBC -00052a -00029b -00045a (00012) (00014) (00012) DUMBC 00035a 00022 00024
(00014) (00017) (00016) Other Controls Yes Yes Yes Yes Yes Yes Year-Fixed Effects Yes Yes Yes Yes Yes Yes Two-Digit SIC Industry-Fixed Effects Yes Yes Yes Yes Yes Yes N 23678 23938 23938 23678 23938 23938
40
Panel B Share Repurchases Dependent Variable REPO
SALES REPO
MV REPO
ASSETS REPO SALES
REPO MV
REPO ASSETS
Intercept -00661a -00505a -00540a -00641a -00488a -00525a (00078) (00080) (00070) (00065) (00070) (00060) Log (HHI) 00010 00006 00007 (00022) (00021) (00019) Log (HHI) x DUMBC -00021 -00009 -00020 (00026) (00025) (00022) DUMBC 00030 00013 00032 (00057) (00055) (00050) DUMHHI -00004 -00012 -00006 (00026) (00025) (00024) DUMHHI x DUMBC -00027 -00015 -00025 (00031) (00030) (00027) DUMBC 00003 00003 00005
(00032) (00030) (00029) Other Controls Yes Yes Yes Yes Yes Yes Year-Fixed Effects Yes Yes Yes Yes Yes Yes Two-Digit SIC Industry-Fixed Effects Yes Yes Yes Yes Yes Yes N 22561 22797 22797 22561 22797 22797
41
Table 5 The Effect of Business Combination Laws on the Relation between Product Market
Competition and Payout Decisions
This table examines the effect of business combination laws on the relation between the Herfindahl-Hirschman Index and payout decisions DIV gt 0 is a dummy variable equal to one if the total dollar amount of dividends declared on the common stock is positive zero otherwise Change in DIV gt 0 is a dummy variable equal to one if the firm increases its dividends from year t-1 to t zero otherwise REPO gt 0 is a dummy variable equal to one if the expenditure on the purchase of common and preferred stocks is positive zero otherwise MV is the market value of common stock HHI is the four-digit SIC Herfindahl-Hirschman Index from the Census of Manufacturers scaled by 100 DUMHHI is a dummy variable equal to one if the HHI is above its median zero otherwise DUMBC is a dummy variable equal to one if the firm is incorporated in a state that has passed a business combination law zero otherwise MB is the market-to-book ratio [(book value of assets + market value of equity - book value of equity) book value of assets] ROA is the operating income before depreciation scaled by total assets DEBTASSETS is equal to long-term debt plus short-term debt scaled by total assets AGE is the time (in years) from the firmrsquos CRSP listing date RETVOL is the standard deviation of monthly stock returns MB and ROA have been winsorized at the 1 and the 99 of the empirical distribution We estimate the regression coefficients using a Logit model Standard errors adjusted for within-firm correlation are reported in parentheses below coefficient estimates Superscripts a b and c denote significantly different from zero at the 1 5 and 10 level respectively The sample period is from 1979 to 1997 Dependent Variable
DIV gt 0 Change in DIV gt 0 REPO gt 0 DIV gt 0
Change in DIV gt 0 REPO gt 0
Intercept -01349 -11203a -16018a -05539 -15336a -15502a (04262) (03455) (02517) (03756) (02938) (02171) Log (HHI) -02287b -02436a 00210 (01131) (00939) (00678) Log (HHI) x DUMBC -01988c -02172b -00664 (01237) (01007) (00791) DUMBC 04028 04445b 01515 (02703) (02207) (01748) DUMHHI -01975c -02575a 00087 (01221) (01029) (00813) DUMHHI x DUMBC -04186a -03444a -01267 (01408) (01194) (00958) DUMBC 02228 01911 00834 (01482) (01272) (00928) Other Controls Yes Yes Yes Yes Yes Yes Year-Fixed Effects Yes Yes Yes Yes Yes Yes Two-Digit SIC Industry-Fixed Effects Yes Yes Yes Yes Yes Yes N 23938 23572 22797 23938 23572 22797
42
Table 6 The Effect of Being a Large Firm on the Relation between Product Market Competition
and Corporate Payouts
This table examines the effect of being a large firm on the relation between the Herfindahl-Hirschman Index and scaled measures of dividends and share repurchases DIV is the total dollar amount of dividends declared on the common stock REPO is the expenditure on the purchase of common and preferred stocks SALES are total sales MV is the market value of common stock ASSETS are equal to the total book value of assets HHI is the four-digit SIC Herfindahl-Hirschman Index from the Census of Manufacturers scaled by 100 DUMHHI is a dummy variable equal to one if the HHI is above its median value zero otherwise LARGE is a dummy variable equal to one if a firmrsquos market value is above its industry (four-digit SIC code) average market value at time t zero otherwise MB is the market-to-book ratio [(book value of assets + market value of equity - book value of equity) book value of assets] ROA is the operating income before depreciation scaled by total assets DEBTASSETS is equal to long-term debt plus short-term debt scaled by total assets AGE is the time (in years) from the firmrsquos CRSP listing date All the payout measures MB and ROA have been winsorized at the 1 and the 99 of their empirical distribution Since the dependent variables are truncated at zero and one we estimate the regression coefficients using a two-sided Tobit model Standard errors adjusted for within-firm correlation are reported in parentheses below coefficient estimates Superscripts a b and c denote significantly different from zero at the 1 5 and 10 level respectively The sample period is from 1972 to 2010 Panel A Dividends Dependent Variable DIV
SALES DIV MV
DIV ASSETS
DIV SALES
DIV MV
DIV ASSETS
Intercept -00253a -00242a -00225a -00261a -00251a -00233a (00030) (00034) (00028) (00028) (00033) (00026) Log (HHI) -00007 -00008 -00007 (00006) (00007) (00006) Log (HHI) x LARGE -00024a -00018b -00024a (00008) (00008) (00008) LARGE 00041a 00027 00050a (00017) (00018) (00016) DUMHHI -00002 -00007 -00002 (00008) (00010) (00008) DUMHHI x LARGE -00050a -00028b -00045a
(00012) (00012) (00011) LARGE 00022b 00008 00029a (00009) (00010) (00009) Other Controls Yes Yes Yes Yes Yes Yes Year-Fixed Effects Yes Yes Yes Yes Yes Yes Two-Digit SIC Industry-Fixed Effects Yes Yes Yes Yes Yes Yes N 54715 55343 55343 54715 55343 55343
43
Panel B Share Repurchases Dependent Variable REPO
SALES REPO
MV REPO
ASSETS REPO SALES
REPO MV
REPO ASSETS
Intercept -00602a -00462a -00495a -00592a -00449a -00479a (00055) (00046) (00046) (00053) (00044) (00044) Log (HHI) 00005 00004 00009 (00012) (00010) (00010) Log (HHI) x LARGE -00028 -00028b -00033b (00019) (00014) (00015) LARGE 00029 00040 00062b (00039) (00030) (00031) DUMHHI -00014 -00015 -00008 (00016) (00014) (00014) DUMHHI x LARGE -00042 -00023 -00040c
(00029) (00022) (00024) LARGE -00005 -00001 00019 (00022) (00018) (00019) Other Controls Yes Yes Yes Yes Yes Yes Year-Fixed Effects Yes Yes Yes Yes Yes Yes Two-Digit SIC Industry-Fixed Effects Yes Yes Yes Yes Yes Yes N 51101 51608 51608 51101 51608 51608
44
Table 7 The Effect of Being a Large Firm on the Relation between Product Market Competition
and Payout Decisions
This table examines the effect of being a large firm on the relation between the Herfindahl-Hirschman Index and payout decisions DIV gt 0 is a dummy variable equal to one if the total dollar amount of dividends declared on the common stock is positive zero otherwise Change in DIV gt 0 is a dummy variable equal to one if the firm increases its dividends from year t-1 to t zero otherwise REPO gt 0 is a dummy variable equal to one if the expenditure on the purchase of common and preferred stocks is positive zero otherwise MV is the market value of common stock HHI is the four-digit SIC Herfindahl-Hirschman Index from the Census of Manufacturers scaled by 100 DUMHHI is a dummy variable equal to one if the HHI is above its median zero otherwise LARGE is a dummy variable equal to one if a firmrsquos market value is above its industry (four-digit SIC code) average market value at time t zero otherwise MB is the market-to-book ratio [(book value of assets + market value of equity - book value of equity) book value of assets] ROA is the operating income before depreciation scaled by total assets DEBTASSETS is equal to long-term debt plus short-term debt scaled by total assets AGE is the time (in years) from the firmrsquos CRSP listing date RETVOL is the standard deviation of monthly stock returns MB and ROA have been winsorized at the 1 and the 99 of the empirical distribution Standard errors adjusted for within-firm correlation are reported in parentheses below coefficient estimates Superscripts a b and c denote significantly different from zero at the 1 5 and 10 level respectively The sample period is from 1972 to 2010 Dependent Variable
DIV gt 0 Change in DIV gt 0 REPO gt 0 DIV gt 0
Change in DIV gt 0 REPO gt 0
Intercept -36469a -39052a -12529a -35782a -38204a -12276a (02609) (02034) (01474) (02561) (02016) (01449) Log (HHI) -00847 -00789c -00027 (00554) (00468) (00324) Log (HHI) x LARGE -01352 -01703a -01366a (00848) (00661) (00504) LARGE 00714 00143 -01207b (00911) (00731) (00540) DUMHHI -00906 -01113c -00296 (00753) (00652) (00452) DUMHHI x LARGE -03741a -03270a -01473c (01262) (00974) (00778) LARGE 03157a 02530a 00135 (00972) (00784) (00614) Other Controls Yes Yes Yes Yes Yes Yes Year-Fixed Effects Yes Yes Yes Yes Yes Yes Two-Digit SIC Industry-Fixed Effects Yes Yes Yes Yes Yes Yes N 55343 54552 51608 55343 54552 51608
45
Table 8 The Relation between Product Market Competition and Dividends Alternative Measures
of Concentration
This table reports estimates of regressions relating scaled measures of dividends and share repurchases to measures of concentration and other control variables DIV is the total dollar amount of dividends declared on the common stock REPO is the expenditure on the purchase of common and preferred stocks SALES are total sales MV is the market value of common stock ASSETS are equal to the total book value of assets Census HHI is the four-digit SIC Herfindahl-Hirschman Index from the Census of Manufacturers scaled by 10000 TNIC3 HHI is the Herfindahl-Hirschman Index developed by Hoberg and Phillips (2014) which uses industry classifications based on firm pairwise similarity scores from text analysis of firm 10K product descriptions MB is the market-to-book ratio [(book value of assets + market value of equity - book value of equity) book value of assets] ROA is the operating income before depreciation scaled by total assets DEBTASSETS is equal to long-term debt plus short-term debt scaled by total assets AGE is the time (in years) from the firmrsquos CRSP listing date All the payout measures MB and ROA have been winsorized at the 1 and the 99 of their empirical distribution Since the dependent variables are truncated at zero and one we estimate the regression coefficients using a two-sided Tobit model Standard errors adjusted for within-firm correlation are reported in parentheses below coefficient estimates Superscripts a b and c denote significantly different from zero at the 1 5 and 10 level respectively The sample period is from 1997 to 2010 Dependent Variable DIV
SALES DIV MV
DIV ASSETS
DIV SALES
DIV MV
DIV ASSETS
Intercept -00607a -00364a -00443a -00761a -00479a -00570a (00061) (00043) (00047) (00069) (00048) (00053) Census HHI -00282b -00229b -00291a (00149) (00115) (00115) TNIC3 HHI 00178a 00121a 00151a (00041) (00031) (00031) log (MV) 00061a 00038a 00041a 00051a 00030a 00035a (00005) (00003) (00004) (00006) (00004) (00005) log (MB) -00043a -00071a -00031a -00035a -00063a -00027a (00008) (00007) (00006) (00008) (00071) (00006) ROA 01029a 00717a 00986a 00928a 00670a 00921a (00104) (00067) (00086) (00109) (00072) (00092) DEBTASSETS -00241a -00127a -00231a -00152a -00071c -00168a (00053) (00040) (00041) (00053) (00042) (00042) log (1+ AGE) 00124a 00100a 00107a 00159a 00128a 00133a (00011) (00008) (00008) (00013) (00009) (00010) RETVOL -01535a -01107a -01235a -01471a -01088a -01212a (00184) (00122) (00139) (00199) (00135) (00153) Year-Fixed Effects Yes Yes Yes Yes Yes Yes Two-Digit SIC Industry-Fixed Effects Yes Yes Yes Yes Yes Yes N 21755 22152 22152 19386 19748 19748
46
Table 9 Firm Characteristics of Portfolios Sorted by Competition Measures
This table reports the summary statistics of portfolios sorted by competition measures MV is the market value of common stock ASSETS are equal to the total book value of assets SALES are total sales The Lerner Index is the price-cost margin [(total sales - cost of goods sold - selling and general expenses -depreciation)total sales] GS_5YR is the five-year growth rate in total sales MB is the market-to-book ratio [(book value of assets + market value of equity - book value of equity) book value of assets] HHI is the four-digit SIC Herfindahl-Hirschman Index from the Census of Manufacturers TNIC3 HHI is the Herfindahl-Hirschman Index developed by Hoberg and Phillips (2014) which uses industry classifications based on firm pairwise similarity scores from text analysis of firm 10K product descriptions MB and GS_5YR have been winsorized at the 1 and the 99 of the empirical distribution The sample period is from 1997 to 2010
Panel A Quartiles based on Census HHI 1 2 3 4 Census HHI 298 521 831 1787 MV 936 1290 1331 2883 ASSETS 1138 1377 1378 3781 SALES 1068 1352 1438 3466 Lerner Index 792 826 858 922 GS_5YEAR 800 951 1028 869 MB 153 165 163 162 Panel B Quartiles based on TNIC3 HHI 1 2 3 4 TNIC3 HHI 914 1908 2965 5085 MV 4423 3396 2240 2025 ASSETS 3923 3245 2976 2571 SALES 4321 2554 2102 1631 Lerner Index 857 894 882 860 GS_5YEAR 1189 1055 944 879 MB 174 180 168 174
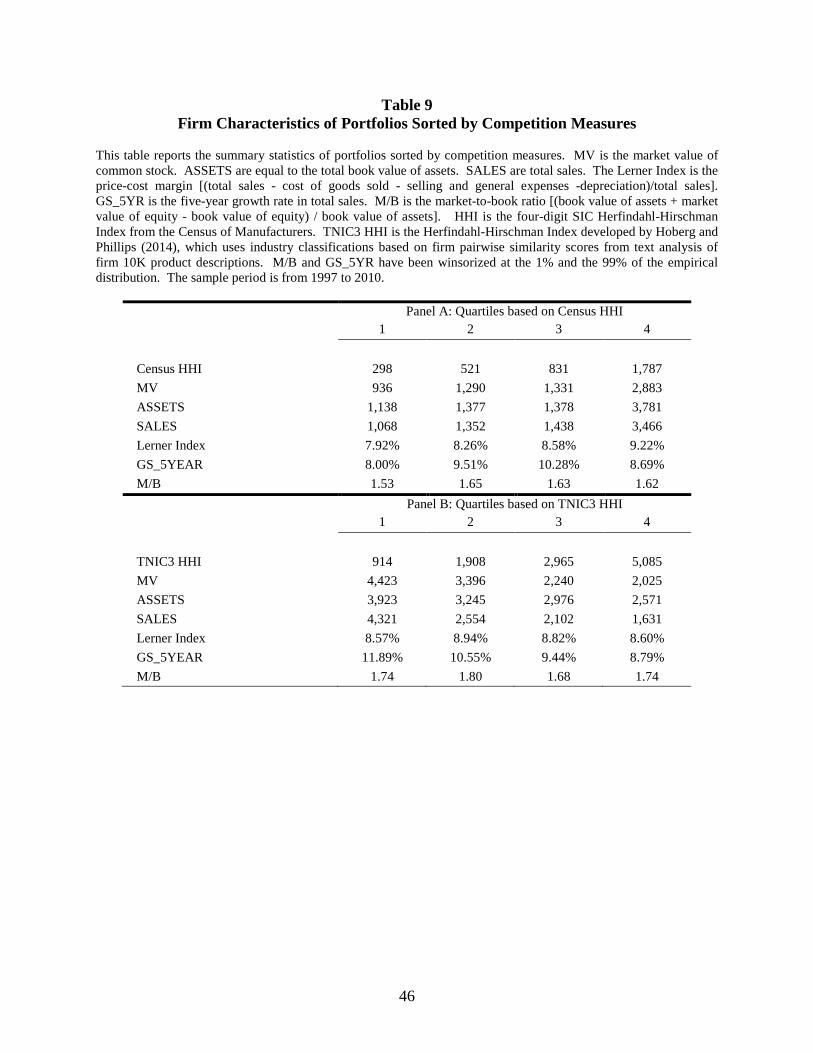