competition among hospitals · competition among physicians is itself imperfect. finally, the...
TRANSCRIPT

TRADE COMMISSION
manommissjonermissioner, CommissionerIR., Commissioner
W OF ECONOMICS
. Director.ssociate Director for Policy;LD. Associate Director for Special
)eputy Director for Operations and
, Deputy Director for Economic Policy
Deputy Director for Antitrust, Assistant Director for AntitrustR.S, Assistant Director for Consumer
)N. Assistant Director for Antitrust
ssistant Director for Economic Policy
repared by an individual member of)f the FTC Bureau of Economics. Itthe author and is not intended toof the Federal Trade ' Commission orlual Commissioner.

ACKNOWLEDGEMENTS
Cheryl Asher initiated this project, formulated many of thebasic ideas, and collected and compiled most of the data.Her efforts were indispensible to this project. I wish also to
thank Jim Ferguson, Mark Frankena, Mark Fratrik, TedFrech, Oliver Grawe, Scott Harvey, Richard Higgins, PaulineIppolito, Mike Lynch , Paul Pautler, Dave SCheffman , and TobySinger for many valuable suggestions. John HOlsinger andNellie Liang served as able research assistants.

TABLE OF CONTENTS
Introduction
II. Literature Review
II. The Model and Data
Results
Conclusion
Appcndix
Referenccs

LIST OF TABLES
:ts of Competition Measures
Nith descriptive statistics)
ice Regressions
Price Regressions
,put Regressions
om other Rela ted Regrcssions
ect of Competition Mcasurcs onenses
, Concentration. Entry Barriermmy Variables

I. Introduc:tlon
Hospital competition is generally perceived to differfrom that observed in other industries, where price competi.tion and profit maximization govern firm behavior. Variouscharacteristics of the hospital industry may alter normalincentives and reduce constraints on prices charged. Hospitalcompetition may instead focus on Qualityt in order to attract
patients and physicians. Since Quality is costly, those factorsthat increase competition may, by raising the average levelof Quality, lead to highcr prices (per unit of output not
adjusted for Quality).
This study attempts to determine the extent, form , andeffect of competition among hospitals. Is it true that Qualityis the only dimension that matters, or does price competition
also exist? What structural factors of the hospital industryare most important in affecting competition? Do concentra.tion and entry barriers, for example, have the same signifi.cance in the hospital industry as in other industries? What
influence do for-profit firms have in this primarily non-profitindustry? What role do physicians play?
Both hospital price and expense data are uscd toidentify the independent effects of price and Quality compe-tition. The price data should be particularly enlightening.
1 For now, the tenn "quality. i8 uNC 1;0 ",'er to all non.pric8 ..pata competition. An inc ue in "quality" 18 no ft8Ciuily w.lfar-enhancinc.IMflcient incre.... in quality, i.e. inen.. in l8n'ic.. or equipment that arpunl, reundant, .il be diacU8 beow, in MCtion 11;8. The data available tothi, dudy do not lMnnt the ..pa. kktification' of beneficial and ...teful, orin.md..at
, "
quality. cOlnlMtition.
2 Indee, in Federal Trade Common c.. . chaUencinch08pitai acqui.ition8
under the antitrut la.' hOlpital chuRl have aqed that hOlpital. do not enPiein traitioal price competition. Th. Cornion, ho....r, hu njecte thi8....nt. (Hoopitol Corpration or Amria, 108 F. C. 361, 482 11115), ald 807
2d 1381 (7th Ci.. 111); Amrian M.dicollntemationol , 104 F. C. 1 202 (1114).
SECTION t
Since they represent charges for particular disease categories
many of the case-mix aggregation problems found in otherstudies are mitigated here. Moreover, most studies have reliedon expense data, which, while useful for analyzing Quality
competition and efficiency issues, are not helpful in address-ing the subject of price competition. Since the expense dataare not as disaggregated as the price data, however, direct
measurement of the effects of competition on hospital profitsis not feasible.
lescribing price, which holdcost conditions, are estimatedket structure, ownership, andrice regressions measure theuality competition that mayto control completely for
ice competition from these: also estimate reduced formthe influence on expenses ofct price. Their effects onefficiency and scale economy=ffects of price competition.
:e and expense regressionsnpetition.
cribed below suggest that a: to an increase in both price,pears that increased quality
: reduction in concentration
uistically significant amount.: reduction in concentrationterms, when concentration ' is
ble to identify those marketscertain level , more substantialincrease in expenses when
=s (per unit of output, notnted from rising by a conco-,etition. This result implies,lity, price , is lower in areas

tNTRODUCTION
less concentrated markets. Since hospitals appear to
.. -
'1 both price and Quality dimensions, the hospital:an be analyzed, for the most part, like otherNhen , for example, applying the antitrust laws.
: entry into a market is regulated by a Certificate:ON) law , both prices and expenses are higher thanithout such regulations. Prices appear to increase
greater, and perhaps more significant, in asense, amounts than expenses. Since these resultser margins , a CON law may function as an entryIts primary effect, however, is to lead to lessesource utilization and higher costs. There is no,at CON laws have resulted in the resource savingsnnrnortedly designed to promote. Therefore recent
ions to repeal CON laws in some states shouldler welfare.
:ts of for-profit hospitals on prices andso examined. Consistent with other literaturethis study finds that for-profit institutions,rices but incur similar expenses. Since theirlower, there is no evidence that they produceservices. The results suggest that for-profitIg decisions generate higher profits than those
takenalon. milht be con.i.tent with. poitive correlation)0 and .mciency I the benefit. of which ar not paned on \0lIult., di8uued. below in Section IV.A, IUClett that .ffcien-ain the Relative relation between concentraion and expenH8.
of this .tudy do 1U",,' that an ine.... in concentratiol,mum.bl, beaua of .. reudion in quality competition.unchanlec. how.ver, consumers do not benefit. In fact
alit, competition i8 w..'eful. conlumen ar hlL. Whalat welfan depend8 on th.tr.w80ff between the reuction j"h (and . inen.. in effciency) ..d the deadweilht 108.:ompetitivepricinland poibly .. non.optimallevel of qualil:,

SECTON 1
presence of outsideonstrain the pricingphysicians, who botht maximization thatzing prices.
r contract with anveral hospitals also
ir expenses are evenn for hospitals that, owned hospitals iss study provides nos enhance efficiency,: predates the timeins and managemenl
) hospitals appear tc)Cnses. Their highe.
: tha t is sicker Its that they do no'
, these results shec
ial difficulties.
s also lead to highe
: because physiciances since they mak,rongly influence th
re owned by phyaician. thtb. meical .taf tban d
I. iI cleary inappropria\4,.icilU, by the lat. 18701
lorit,. of for-prOfit hOlpitaJnly I .ince phyllcian-owneof the for-profit be wel

ypc of Cdl'" 1111..11 ",..11"""""" ............. ........ .n ..n.. ..""...,....... AUddition, it is possible that greater usage of physiciansc1ative to beds indicates higher Quality services. The resultsIrovide no evidence that physicians lower the demand forlospital care by functioning primarily as substitutes tolospital care.
The results of this study imply that, while hospitalnarkets may have several important distortions, almost alecade ago they were not immune to standard competitiveorces, including price competition. Much anecdotal evidenceuggests that consumer sensitivity to hospital care prices hasncreased in recent years. Therefore, since evidence oflospital price competition is found in the 1977. 197g dataIsed in this study, it is reasonable to speculate that evennore exists today.
Section U presents a review of the literature discussing10spital behavior and the role of various organizational formsInd rcgulations. Section IU develops a model to derive thenice and expense regressions used in the empirical estima-tion. The data are described as well. Section IV presents:mpirical results. Section V provides a conclusion and1iscusses some implications for the current, apparently more
ompetitive environment.


II. Literature Review
To formulate theories useful in predicting hospitalresponses to competition, it is helpful to outline certain
characteristics specific to the hospital industry as well as
various economic models that explain hospital behavior.While these theories vary in their choice of relevant decision
makers and objective functions, most predict that, due to thenature of the hospital induStry, price competition is not theprimary force governing hospital behavior and implicitlyassume hospitals to be price setters.
Characteristics of fIosoitals
Many unusual facets of hospital behavior are generallyattributcd to some special characteristics of the industry.First, since the vast majority (about 90%) of hospital bilsare paid by third parties, consumers (patients) may lackincentives to shop around, and, if so, price competition
not directly encouraged. Since, until recently, public andprivate insurance companies have paid hospitals on a costreimbursement basis, little restraint has been generated bythe direct payors either. Prices arc presumably prevented
from rising infinitely by less than total insurance coverageand some rcsistance to high premiums.1 8
. Salk.... (1818) at 182.
T Lynch' (1986) h...bawn the remaably atabl. reatiolUhip between out ore
poket health . car expendiCul' ar take home war overthe lu' 65"ean.While both total health .canexlMnditui'" . peent of GNP and tbe proportionof them covendbr' third pari- 'ba.eri draticalYi the numbe of' week, ofwap necMlar to pay fOl dir.t bealth car eJndituna haa 11 coeffciilmt ofvaration of only nI &om 192D to INS.
8 The akt of, prce ..R8Unty iI an, empirical quwtion which h.. nol bnn
..Ul.d defnitively. An eary Rud)' by Mania F.ldatein (!S111) ..tim.ted
..crpt. deman .1..Udti.. with rap8 to pri net of in.urau p.,,.nu of4 to .8 at then 'pNvailnc....laor net pnc NewhoUR and Phelpl (1176)' notedtla.. in the duly.tion of hil in.urac. varabe and. Wline . 8uperior measure

SECTtON II
Second , physicians play an important role in determiningboth the supply of and demand for hospital services. On thesupply side, they influence hospital input and production
decisions. Physicians may often act as patients' agents andthus affect the demand for hospital services as well.Patients generally do not admit themselves to hospitals.Moreover , since information about the nature and total priceof the product consumed is difficult for patients to under-stand, and risk aversion with respect to outcome is probablycommon, consumers in general grant their physiciansconsidcrable decision-making authority. Since physicianobjectives may not coincide with hospital profit maximizationtheir influence may alter hospital behavior, particularly since
competition among physicians is itself imperfect.
Finally, the hospital industry is composed primarily ofnon-profit firms. The incentives of such firms are notclcarly understood, but profit maximization is by definitionnot the explicit goal.lO Discussion below wil focus on the
rnuure an ....tieit,. very ciON to ..ro. They aI found that the exitenc8 ofinlurane.cov_rae had . .tlOne .a.ct on price - Mnlitivity. I.tv pape byFeldatein (1977) lound .. .Iona run admiion. eluticit,. with repet to price or .and. ahort run .I..ticity of only .10. Mean .ta,. .laUdti- were inlipificantlydifferent from ..ro. A very nent Itud,. by the Rand Corpration on ncJ'rom ua. (O'Gray, Mannine. Ne"ho.. and Bro (1N&)) .ho".dtbu .merceneyrom us wu eo pucent blah- for miDOI allmeb and SO pel't bilher formore HriOUI di.cn0881 by thON with coplete cov.. than by thONwho had topay 2&-05 percent of the bill themalv.. For le u..ent CaN. the extence ofcoin.uranee ... mo important thaa the amunt, whUef'rmon HriOUl c"".u.... deuaH with Inc-:.. in COt Ibarne.
D S.. K_t (ID58), Fried.. (11162), Hyd. .. WolI (IDU), ""d Noon...(1D8).
10 ram. and.J.nMn (lW . and b (085) ditiftish non-profit fimw ..thou without an,. nliduu daita 8ucb .. tbe ltoolden of corpationl.Thi. lack of I'liduai claimata "UI potential donon that thei liRa wil not

recent growth in thehospital industry.
LtTERATURE REVIEw
proprietary (for-profit) segment of the
Models of HosDital Behavior
Two broad classes of models exist to describe hospitalbehavior. Since several summaries of this literature existonly a brief discussion is included here to focus on themodels ' competitive implications. The first scenario, suggestedby Newhouse (1970), Feldstein (1971), and Lee (1971), posits agroup of trustees and administrators with a preferencefunction in Quality and, sometimes also, Quantity. both of
which enhance the prestige of the hospital and herice of theutility maximizers as well. In these models, the hospital isfaced with a budget constraint that leads to a trade-offbetween Quality and Quantity. The budget constraint itselfhowever, is assumed to be somewhat fluid due to extensivethird party coverage.
The implication of increased competition on thesemodels is not clear. To the extent that Quality is important
because it enables hospitals to attract more and betterphysicians who enhance the prestige of the hospital andincrease demand for its services,12 competition results ingreater quality with higher prices per bundled unit ofoutput. Moreover if consumers are fairly insensitive to price
and, at the same time, they value Quality, increased competi-tion can be expected to arise primarily along Quality rather
be expropriated. Thu. non-prot orcanutioft oftn reeive. bieh proportion oftheir lund. fro donatioN- For nOD pl'fit h08pital, however. thi, i. no Ioncer
th. cue. and t.he chance may explain the . .merpnce of
. .
erwine for-profituctal'. On the other hand, the lOernment .tIlI "donat." reource. . to non profihOlpital, by cntinl them tax-exempt .tatUI.
11 S.., lol' example. navi, (19'72), Jacobi (1974) 01' Sloan and Steinwald (1980).
12 The Le moel dilCUIH this mot dii'tly.

SECTION II
than price dimensions.13 This market can also be compared
to that of regulated airlines which , since prices were fixeddissipated profits through costly service competition.
The second set of models, exemplified by Pauly andRedisch (1973), focuses on the importance of the physician inhospital decision making. These models view the hospital asa 'physicians cooperative." Physicians maximize theircollective incomes subject to constraints imposed by the costsor other inputs, but cooperate imperfectly and hence use too
many hospital inputs.
13 Alari economiCi literature diKuuel the imp8t. of mmet .trudure onproudquality. Schmal.Dlee (lU7U) pcovid.. a po lummar of this literature.
U.inl durabilty.. a proxy for quality. under.. let of ,enera! ..umptiona , Swan(1970, 1971) .bowed that market .tructure h.. no impad on a proucer , optimalquality decision. A crucial auumption implicit in Swan , relult , however, ia thatno demand exltl for durabilty 2!; uline durabilty.. the paripn forquality anum," that con.umen ar interested only in a Hnice "ow, e.l'. ..ten-Ihan-blade costine 81.00 ia equivalent to .. fiftY-lhave-blade c08tinc 85.00.
Demand for quality hOlpitai car cannot. be treated this .imply; two lowquality operation. .ennul)' do not prouce t.he ..me output... one hilIh qualityone. Lehvar &l Pel" (197 ) and Lemer (1982) develop more Jeneral modell.Ther show that when quality inere.. the demand for. prouct, but is not alubltitute for quantity. i.e. doa not alect durabilty. then the .ffect or marketstrudUnt on quality depend. on the . shape of the COlt function -.. well .. theinteration of the effecta of quality and . quantity, on demand. Without speificfonnulaUoM of demad and COlt functiona, the relation 'between quality andmaret structur hi unbilUOU.
tC Se Doull.. " Miler (19TC).
15 Pauly (1080), workina- in the context of . two factor (phy.ici81 andother hOlpiital inputs). inel of bOlpitai output. conclud.. that physicianeincaUveI do not prouce the c08t-minimisiq mix of their own time and otherinpub. Whil. the ..ultin profit hi .han &mna al of the phyliciUl afliatewith the hOlpital, eac bean the full cOt of hi./ber own input. Since neitherphysician. nor patienb face the maqnal COlt of complemntar h08pUai inpuy

LITERATURE REVtEW
Since in this scenario, physicians are the relevantdecision makers, more competitive hospital markets are the
result of greater competition among physicians. Whilegreater physician competition should certainly imply lowerphysician incomes, the appropriate prediction about hospitalfees is not downward. First, these models assume, consumersare only concerned about the total price of hospital serviceswhich includes both the physician and hospital components.If this is true, then increased competition among physiciansmay permit the hospital, to the extent that its owners/managers have interests distinct from the medical staff, togather some of the rents formerly earned by physicians. Inthis case, the hospital component of prices may rise whiletotal prices either fall or remain constant depending onconsumer price sensitivity. Second , as physicians become lessorganized, their tendency to overutilze hospital inputs may
Pauly IUuaU that ph,.ician. overutilae h08pitalinputa. Therefon he pndiebth.t the total CCMt of .. h08pital vian, indudinc the phY1ician an h08pitalcomponenta. excee the effcient leel. Afr ..Um.Un.. .. hOlpital prouctionfundion he condud- that bOlpital 8XJMri Could be reuce by .icht percent on
avera by moYinC to the optimal (emcient) phlician-hopital input ratio. In arelated atudy, Pauly (itaT8) ah deten.. tba' bCMpitai COIU ar ael.tive)y..I.ted to the concentratioD 01 , output (admiOIU) aml tbe ph)'ician ataf.Shalit (IU7T) extend8 th. two faCtor D1el of ph)'idan and other hoapital inpuuin adiftnnt diretion. He exlidtly auUnM- tbat the meical ,tal eafore.. ..cut" throUlb mainhnance of.. c1- atal. . WhU..moDOpolut would wilh anycoPtentv,: input to be luppl8d competitively I 8ine eac phyaician h.. aniDcetiv. to ch . by -ine an .exc.." of ho.pital-.upplied input.
U-orpiHd phylldan cal also rwtrictltbe IUpplyof IUch coplement.,inpuu. Therefore he p..dict. that mo oriHC phy.ldan POP" beter ..tridthe lupply or ho.pital inpub and that. thenor. a poUv. reation .houid ex.t
t.een phyaician pria and phpician/hCMpitai input: ratio.. Empirically. ShalifincH' that an index . of prica for vanoU8 nMicai pIUre il .ipilicatl)'ne,atively reated to the be/pbyaician and other bOlpitai pennel/ph)'.icianrat:i08. Such evidence cotraicts the notlOl that phyelU .. paid the value ofthei marnal prouct. which "'ould de.. .. their -..e re.ti.e to oth.rInputs incnue. Shallt r8oci... .. d08 Pauly. that If bOlpital inputl ...repriced apprpriahly. luch input natrictiop woud be unnecar.

SECTION n
increase. This would also lead to higher expenses 'and priceswith increases in competition.
While both the administrator and physician decisionmaker models imply that, all else constant, higher hospitalprices may result from increased competition, the causediffers across the models. In the administrator modelincreased competition leads to higher Quality output which iscostly to produce. On the other hand, in the physicianmaximization model, the hospital component of prices riseseither because output is produced less efficiently or becausemore rents accrue to hospitals (at the expense of physi-cians). The two models are by no means mutually exclusive;the objcctives of physicians and administrators do notnecessarily diverge according to these models.
The market imperfections discussed above cause twodepartures from efficient resource allocation. First, at agiven level of Quality, output is produced inefficiently due tothe inappropriate pricing of different inputs. Sccond, thelevel of .quality. is itself altered. As mentioned earlier, theterm' .Quality. has been used to describe the complexity ofthe bundle of output produced. Such complexity results fromthe usage of more costly inputs, particularly technologicallyadvancc:d capital, but also more specialized personnel. While,in one sense, such medical carc can be termed high Quality,it is not clear that such care always produces better healthoutcomes. In other words, some of the Quality competitiondiscussed above may indeed' be wasteful as the Lee model
Ie Bon (lQ7T), for oxlU. Yi.. tho hotal .. two ..ponte
orpintiOl, ooe cornpo of ,he DM .,af and th other, tlM admi18-'raton. PhJlidan .. paUenb' apta an tbe 81.ctIV8 demanden. whU.admii8traton arp for thl 8UPPb' an detum. thl capacty le.1 of Il& oft.h. n8CU' input.. Th, pat_, h.. two I8 cotrab, one with thephyolci.. an tho oth.. with tho h_ltal.
suggests.1T Various empirical studiesrange exists in the type of care given
for comparable illnesses.
LlTERATURE REVIEW
suggest that a widein different locations
Since medical care costs do not consume total GNPsome restraint on hospital prices obviously does exist. Whileincreased competition may lead to the usage of more inputsto create a more complex ou.tput, it seems likely that somepressure on price is also manifested. Even if prices rise dueto "Quality competition , price per unit of Quality, and,hence, margins the difference between prices and costsshould fall as the degree of competition increases. In other
words, competition may have two opposing effects on prices.Production of a more costly output bundle pushes pricesupward, while standard competitive pressures lower them.
Which effect is stronger is an empirical Question. It isdifficult, however, to test these models of hospital competi-tion for at least two reasons. First, the definition andmeasurement of Quality or complexity is elusive. There aremany ,unpriced product attributes, such as response timeprecautions taken , excess capacity, and amenities. Moreoverto account for Quality appropriately, output should measured rather than inputs. In many studies, Quality proxied by the number of diagnostic and therapeutic proce-dures completed per day or by poorly measured healthoutcomes.tV Unadjusted hospital output is also difficult to
17 I( 801n . ho.pltal copetition iI in fad totall,. .uterul. it preumablyhlutt8 from the riit . 8yer8ion paucity. of inr .tion FOlfn'1Id by co",umen.
In other,Uu.UoM when quality competition it important IUch .. the relatedairine IndUltry I tbe inenau Hrofere. whie notwelf.. maxmi&inc in a
lint-bet , HQI, at I..., provide lOme , utilty to. COumtn. Thi, may not, be thec.. fOr IO bOipital competition;oDly phy.iciw and/or hOlpital admin;.tratonlIaybenefit.
18_Mtdical Pratice: Why Doe it Var 10 Much? HOiDital. , 3/1/86 . at 88.
tV Sloan (t984) 01 83-84.

SECTION II
define since, even within a given disease category. no twocases are identical. Second , these models imply that hospitalmarkets are differentiated oligopolies. Such a marketstructure is notoriously difficult to model.
Most researchers have postulated that "Quality" compe-tition is more important than "price" competition in ,hospitalmarkets, but few have studied the net effect on prices. Theeffect of Quality competition should be seen most clearly onexpenses where the offsetting effects of price competition do
not exist.
20 Ao nohd ab., hotol pruce thei outp"" inolcHntlr. It tlW Ia. the II price copetitio ext1. it 8hd cn.&' iDnti.. 101 IN-tv .m-
deDcr. In thi c.. pri eotiti wi afKt .xD. AI wen
.. -
pm: endmar o!rt ao of the Im of -ir qoWl) compltion.WiI and Jadow (1082) att. to _UN "' oIt oC co_tltio .mci8D. Th -tilD a pl'UC futlo.. for Dudeu meal andUN It to
....
tha eI.. .. of
..
of on aaml. bopltol rn th.prouction _tla. Th Cl that hl ""- of tha "'''UN of _tltlon(a "''' ....ur aquol". t'" pruc of bopltal d_II), poultion d.nol)and ..orral raUI) ar ua.to with
..
eI".co fr the oIcitfrtie. Thor
-'
that InCl _till"" tal.. the Corm DC pun:h.. DCreundant Inputa compl.mantar to phraclan MI.. (th. X- mo.l) and thatprouction efet_ney iI th.reor- nduc. They aI fid that co-mmenthOlpital an t.. .Mde..t ..hUe propmt8I hOlpitu. ar more .meMot, maUyeto non-prot iR8titutiom.

III. The Model and Data
This study attempts to measure the type and magnitudeof competition among U.S. hospitals. In particular, it wil tryto determine whether price competition exists. The effectsof various measures of market structure on prevailing pricesand total expenses are examined, after holding constant otherexogenous factors that would affect demand and input cost,and hence prices and expenses.
As discussed above, most economists conjecture thatsince consumers are not particularly sensitive to price,hospital competition does not center around price. Sincehospitals are thought instead to compete by offering costlyservices and capital, it is believed that a market structurethat fosters greater rivalry may actually result in higherprices per unit of output unadjusted for input use. Howeverif price also affects consumers ' demand for hospital servicesthen at least some hospital interaction should concern price.Therefore, a more competitive market should result in lowerprice per unit of service-adjusted output as margins fall.
A. The Model
In order to estimate the effect of market structure onprices for various hospital trea ments, a reduced formequation to explain pdce is derived. Reduced form equationsare used to simplify the analysis, particularly since it is notalways clear that the cffects of Certain factors on supply anddemand, for examplc those of physicians, can be sepUl!ted.The potential endogeneity of various variables will be t stedin the empirical analysis. Demand (x ) is specified as relatedto price (P), Quality (Q), and a vector of exogenous demandcharacteristics (M),
(I) f(P
where x 0( 0, x :. 0 and x :. O.
Hospital markets are generally (and probably, correctly)characterized as differentiated oligopolies where each firm

SECTION II
faces a downward sloping demand curve. While a completeanalysis of such a market would require the development of amodel of conjectural variations across firms, a sort of market
supply curve21 can be posited that depends on price and on
costs, which in turn are a function of quality (Q), outpUt (x).and a vector of exogenous factor costs (N). Moreoveroutput wil depend on the industry market structure, deter-mined by the vector S. as wil Quality if Quality compctitionis relevant. The 'supply ' curve is written as
(2) ' m h(P q(S),
where x , x ' 0( 0 since quality increases costs, and x:, O. Measuring S. for the momcnt. as a concentration ratio orHerfindahl statistic.22 the sign of xi (where Xi
- a x/as +(ax/aQ)(dq/dS)) is indeterminate. While the direct effect of Son output is negative, if Quality competition also exists, theindirect impact through its effect on quality is positive. Amore concentrated market would have less Quality competi-tion, lower Quality, and hence, all else constant, higheroutput.
Equating (1) and (2).21 a reduced form equation for
21 Whl It 18 thet1all7' mC1I1' top0lt the IUppty cure of .
monopoll1t U1d8pmd.nt of th d8d cur fac it. ,uc anuawnptionunderU.. much Of th empirca wo lIuu tureatlo bet.Mn conceotra-Uoo and pranto. Tlll foulaU, oulpul II .. oxlldl Nodloo of morkelatrutun. be JU8tln. b7 . Ooo& mo. 10 the Cornol moel. outputdlpend8 ln adtion. OD. cod. and dem, whi II .functloa ofpriCI.
22 In ou oolmtloo, B wi acuol be -- br dofod 10 colalo 0_lo of nrlab- Ibol poletI lu_co _111100, ou .. hoopllal owoor,ablp. ncatloa. pb)aa lubltltute aD colemntl.
21 Wo ..uma Ihal hopUai _.18 d.... So of lho lI_u.. cOllid...perman.nt .xc.. demad. attributabl. to the dllCpabq blt.84ft private udlOai COIU raultinc from atenvI third puty co8l, to be .. more

THE MODEL AND DATA
price is derived
(3) P .. P(Q(S),M,N
where P 0, P 0, and P o. Ps is uncertain becauseof offset1ing effects of price and Quality competition.
A similar expense (E) regression can be written as
(4) E = E(Q(S),M,N)
Expenses depend on Quality and exogenous input costs.u To
the extent that demand accounts for otherwise unmeasured
Quality variables, and if expenses are affected by outputdemand variables are also important. Expected signs are thesame as in the price regression with one exception. Theeffect of concentration (S) on expenses is unambiguously
negative since it only excrts a single influence through itseffect on Quality.
For this reason, any difference between the effects ofthe market structure variables on prices and expenses shouldbe iluminating as to the type of competition present in themarket. Since the price regressions mcasure the effects ofboth price and Quality competition and since it is difficult tohold constant all dimensions of Quality, it might be impossible
to isolate the existence and effects of price competition fromthe price regressions alone.
2I Since the only major cffect of
eppropriate U8umption. Se F81dlteiD (IQ71). Such an Ulumption preict.coutant up'War pl'uni on prie...
24 It i8 ..ume tha bieh qualty CO". mo than lower. Thi. Ulumption
is commnly made in th 8COI.mC . liklrature . onqualit)'. . Se Scott an Flo(1986) for.. 8umma of many Ituel. that 8Uppori the relation betwun chanl-in meical technoloo and men.. in . b08pUal COlA.
25 From data available to thiJ .tudy it .. impoibla to ..nna", profit data,inC4 th.. prce data and exnd dua an meuunc dilTel'ntly.

SECTtON II
market structure on the expense regressions wil be throughits influence on Quality competition 26 any differencesbetween the coefficients in the two sets of regressionsshould suggest the existence of price competition.
27 If bothprice and quality competition are in fact relevant, they wilto some extent offset each other in their measured impact inthe price regressions, while in the expense regressions whereonly Quality competition is measured, the effect of market
concentration should be significantly negative.
Measures of ComDetition
The vector S contains the many determinants of thedegree of competition in any hospital market. The numberand distribution by size and ownership of hospitals, as wellas substitutes and complements to hospitals, may be impor.tanto In this study, the market is assumed to include allshort term general hospitals that are not federally operated
(primarily V A). Potential substitutes include long termhospitals, nursing homes, and, indirectly, HMOs that rely onoutpatient care.28 The geographic area is defined as anSMSA. Since hospital markets exhibit some unusual characte-
26 It may . ha.e an Inclt . .t.d on COt. tbruch ita .rr.d Oft . output.However, ecDOml- (or diH-) of leal. ba.e n...r ben ,boWD to beimportant In the hopltal induatry. Noreer, h08pltal .1.. and occupancy rat.van.bl- an included in tb. npeD8.
27 linel th, InduatlJ i8 compG prmar of hOD-prfit fi. "may.
apprpria\4to woder . whethe cIv. aUt be-.. total NY",,,,, aodu:pen... NumeroUl ,tuci.. han mow that 8Y nOl-pIt b08ltal Ii
eam a ..turn. (s., for ox, DaYl (10n), 81.. .. Vrau (loa), I!I (1078), 'and "Moot "_ltol Quickly Loam to be Protable WallSt..t Journal. 8/28/85at 8)
28 F..tandinc lmerpcy centen &ld ambulatory can cent.n did not extat the time of th. .tudy.
THE MODEL AND DATA
ristics, this study tries to determine the form and scope oftheir competition. This section wil discuss various factorsthat potentially affect competition among hospitals and thatwil be included in the regressions as explanatory variables.Table I summarizes these variables and their predicted signs
according to the various theories.
I. Structure
A Herfindahl statistic (HER F), calculated with beds asthe measure of each hospital system s market share 29 is used
to describe the number and size distribution of firms in anindustry.30 As discussed earlier, if market structure isimportant to competition and if price competition dominates,
the coefficient in the price regressions should be positive. Ifin addition price competition leads to greater efficiency,expenses should also be positively rclated to HERF. IfQuality competition is most important, HERF should show anegative sign in the expense regressions and probably in the
price regressions as well. If both types of competition existthe sign in the price regressions is indeterminate while thatin the expense regressions should stil be negativc unlcssefficiency factors reduce costs more than Quality competition
2Q If . hOlpital qateru
wn maN . than one h08pit81 . in aiven SMSA. the
multiple b08pital ar tn.ted.. Iln.1e fi in ttM calculation of the HerfndMI.M...ure IUch .. patleit daYI . and . l'Y8nu- an biehly corrlated with the becapacity meMU", UH and, when taMd. proucedn..tly identical raulh.
SO A Herfndah at.ti.tic .. calcula'- by 8Ummnc the 8quar manet .haraof aI. the fi in tbe maret. It" pnly collideNd .. better meuun than -.imp.. concentration ratio be.UN it tal. &Count of .U firm in the marketrather than JUlt the top four or "cht. Therore It provida .. me..ure of firm,iH dilpenion in additio "" concentration. The Deparment or JU8tice MercrGuid.lina nleue June 1", 108 b.. their atrudural criteria on the H.rfndahlind8X.

5ECTtON II
increases them. coursc. possible that market
31 Sev.ral .tudi.. haYe attempted to IIUUN the .rtect. of h08pitalconcentration Of quality. prce and COt.. SaI..y.,. (IG78) dMCribe two ltach.tudi... Watt. (tOTe) found poiti.., albllt inicificlU', .rreeh of tb. ftumbtr of
h08pital. in a county. the phyllciUl-hCMpitai be ratio and the physician-population ..atio on h08pital Nvenu... It iI not clear what .... ia h.ld con.tantin her "(lion.. Similarly. Da.i. (U 71 and 1874) note that. hOlpital', .hanof county be. and the numtMr of hCMpit", 1MI' lIuan mil. in a county had anin.icnificant .treet on priu-av8race cod rati08, whil. the activ. phy.ician8hfC.be ratio had . poitiv. .rreet on eMt...J08kow (lD80) poi&. that .inee demand for h08pita! CaN it Itocutic. one
rrUU'" of quality i8 the' h08pital Nerve mvn 01, probabilty that apace i.available for any potential patient. He lIuura this probability. by . ..uminl tbatthe anr.,. daily . ceo.u. (occupancy) of hCMpital. foUow. a Poiaon dittribution.H. find. that muket concentration, .. lIuure by . a Herfndah index calculatedat the SMSA"vel ia nelatively nlati8 to hit meuun of quality, the faervemarrin. He al . find. . . ..eakly De.ati.e nlatioMhip betw..n the number ofphy.iciant per hCMpital and the AMrve mucin, and luecaa. that . whe,.nlativelymon phy.ician .xilt, h08pital do not nee \0 compete for phy.ician afUation.&I much. Alternativel,., however. it i8 poible that . wh... ma phy.ici&l' exi.tadmiuion. aN enatv (beau.. of phy.ician.' inuence) and that h08pitaloccupancy rat.. .. hipel' .. . rault.
Farley (1085) exarnea the man ceneral qu..tion of what - diflennc.. existbetween varoU8 charteristica of hoipitals in "monopolistic" .enut incompetitive" markets. He fin. little diference in prom rat.. but finda both
expen.u and nvenua to be hieher in competitive markeb. He aJeofinds lenethor 8'ay. number of opentioRi per .hort- term admiUiOD. number of Hrvicnavanable, and ..ta and employ.. PCI' adrnion all to be . &nater incompetitinmukeb. Then nculu 8Upport the facilty and Hnice competition hypth_is.They ar limited . however, by their luk of control for any other f&cton thatmay afect hOlpiial usac.
M..t nent!), in two p.pe, Lun .t 01. (1888) and Rob_n and Lun (1885)examne tbe .ftact; or coftntration OD &atal c.oat par admiioa., total . adaion.ayane lenh. of .t., and on tbe priaionof .pealind dlnlca! lUiCf.Cocetration II meu\ind .. the number of h08pltal Within a , or II mil.raius. Holdi", coftanti C8 mi, demand conditlOD. and _opOUI CQtfactora, they find that . COlU inen.. with. tbelr maMure of competition .. do

VARLE
HorIndahland concen-tration ratio
For ProfitHOipital(Ih..)
(dummy)
Multihoapitaland ManageHOlpital
TABLE 1
Pntded Effec of Competition M...ur
THEORY
I. Wqualty. but Ii"le/no price com-
petition (adrator pret.. and/or(.mpetition tor phY1ician moel)
2. price. but little/no "qualty com-petition (norm competitive maket)
3. both pri and "qualty copetition
1. lovelton want retur on thei capital(more conceed With and able to profito)
2. Reuce Market power of phyaicianl
3. Ar more effcient
4. Different incentives
6. Cream-.kimms
6. Enter into alady profitable markeh
I. 2. 3. and ..
SandS
1. More efcient
2. More conceed with profit maatioDS. Cheape &cce \0 capital
4. Factate Colbuion
EFFECTPrice Expee
+/0
+ andl or
lam .. .har
::i 3..
~~~
1 Auum no important leal. efecb.
2 Depeda on reative importance of. price and qualtycompetition.
ao"

_erlation: hier ocupancy ..ulblualty proud
lib 8ub8titute for
:nuplemt hOlpital ,..ay
ontrol hOlpita1. but
,.,.
.. peectly when thenthem
mpete for pby.iciaD byoatly ,"pub
lDto cotU.t aru
ident competition
oapitali&ati oU.. ilnc:e-aenitive patienta
)ffer cheape altemative
;ly attrat 1- il patientl
ompetitive lub8titut. to
be.08\ coatly patientl to hOlpital
"uteful qualty comptition
carel thrulh entry barer
) ineffcient reure a1ation
LO efect
lVely control pried
110 .Uect
afect ex orjUlt' ma.
- . - ,,-;; ": .. .

TH MODEL AND DATA
asured by a Herfindahl statistic, doesl. Certainly, the literature on thetration and profits in other industries
tural variables often have no effectare held constant.S2 If this is theriable should be insignificant in bothgressions.
also run substituting a four-firmt4) for the HerfindahI statistic. AsJSses, this change does not affect the
nly matter when it reaches someefore, in a second set of regressions,tilng one when concentration is high,linear measure discussed above. It iscture affects competition only whenform of entry barrier. As wil
, '
interaction variables prove to be
The oIed of ..et etr- on \h prwon ofaeCt. SeC8auch emcy roDl
.theteOD unts ""more prealent in mothat tbey aN - UH to attrat either patientl or
land ..ea that ar demded ray and arauch .. cobalt thery ar 8uppUed in .
lei 8v.uabilty at nelchbori hopital lowen theI luppliu the ICmu.
lum or the older liteture.

5JCQN li
2. The Imoortance of Different Orllanizational Forms in theHosoital Industrv
a. For-Profit Hosoitals
While voluntary (non-profit) hospitals stil operate themajority of all beds in the United States, the market, sharecontrolled by proprietary institutions has increased substan-tially in recent years.53 In addition, a growing number ofboth non-profit and proprietary hospitals either belong tomultihospital systems or are managed by an outside con-tractor. Have these changes in organizational structureaffected competition among hospitals? What changes inmarket conditions explain the recent increase in entry of
for-profit hospitals after many years of exit?s4
Many of the advantalles facing non-profit hospitals havedisappearcd or declined in the last few years.S5 Both
13 In 1M3, oK of all .ho hn AOn fe.nI be
..
in for-pIfithOlpital, and (rom 1010 to IGBI, a IMriod duriq which the numbe of Ihort-tumno-fedra be Incnue by 20" and total be delined in number, abon-t.rmpropritar be incrue by 71. (HOIDit.) Statiatia. 108.c)
54 In 1810, 56" of on hopihl. ... for-prllt. (51.. (11164) al 65-64)M08t w... ..tablihed and openA by phyikiUl, priarly in. ru anu ..hen(.. other hopital radti.. wen ...aIable. - How..., 'M plp""'' tona.ubHutatly beam I.. important. By lSM ... no-prt. COtroUlDlII 01 on bo. Dr 1846, GOlf 5" of on hopilol bo ... in pIelarin.titutioM.
55 s..ra lnollulicmol 1.",-. In 11 pul an DO-proi ""Iu-liano. P",prllar hoopi'''' caplol ... hlor u. cI .., nelv.prnh phllhrpf "or did u. qual for __I oubo. (AllHUI-B- 1uc1 w- lor -.p hool"'.) TIoi lab co'" we aIhi"'.. .."" pnnllol _I .u
--
DO.,' bGil.. in lhebet la.. (e. , ..arkOMa , copea..'Io). NOn-prfit lDt1tuUon do not pay
,,,.
They u. ..eN at Ie 80IIwbat InuUM fr la... riGall,.
THE MODEL AND DATA
government funding and private philanthropy have almost
disappeared since the advent of Medicare and Medicaid.On the other hand, proprietary firms have the ability to raisecapital by issuing equity. Many recent takeovcrs ofnon-profit, particularly county and municipal, hospitals byproprietary hospitals have been attributed to the non-profithospitals' inability to raise necessary funds for renovations.Since non-profit hospitals are restricted to the debt marketsfor capital, many have amassed high debt-equity ratios and
are th,erefore unable to find further capital at reasonableprices.37 Moreover, public and private insurance plans nowreimburse proprietary hospitals for their capital costs Quite
generously. The growth of systems of many hospitals hasalso been attributed to access to capital. The diversificationand larger scale created by a hospital system allegedly reduce
the risk potential investors perceive.
for-profit in8titutiomwen '\abject to mOn Ii,rinlent Certificate of Neererrl.ti and. both public . and private iNura. nimbunelnnt rata ..,ntower. (Ba.. (1113) al 361, P. raldalein (lGl1) all60.
36 Bct...a 106 and t07G the pe.,h.p of .bart-term cerier&! hopitalcon.trucUon finance by tb. . 8'"ernnM' feU from 2S.2" to S.2". Similarly.pbilanthropy , thaN droppe from 2J.1" to 8" D.bt financinl ..ume a moreimportant role, Nine from 38.71 to 10.1" OYer the aa period. (-Hocpital CapitalFinancinl Debate, American Medical N... 3/2S/84. at 1.
S1:eR Owne ChaiD8 tin..t!Exaf'ion IG8SSuneySho"II' Modern
Heallhca... a/1/11 al 84; Brow. " SaI...(1116) al 124; Hil (lG1S) an Sie..al(10'3,). , lie. moe by. non-profit h08pital .. to iuu..tok' in . for;;profit8ub8idiuy. (-Not-fo..profitl Competilll for Capital by Sellnc Stock in AlternativeVentul': Modem He<hc&R, 8/16/86 at 90)
38 Currnt hci1lative propo..t, would mae Medicar , capihl CMtreimburament prolJ cOIiderbly .. ..neroua in the tutu... (-HCF A PI'p0&1Would Tie Occupucy to Medic., P"7ntl for Capltal Modem Healthcare.10/n/86 a' 100)
3G Sierrl (lG8S), Ennann" Cabel (1I1Bf).

SECION m
Explaining the growth of proprietary or system hospitalsby access to capital does not iead directly to a prediction onwhat effect their entry wil have on competition. It seemslikely, however, that if the physician-control-of-hospitalstheory is valid, the presence of outside investors, who are
concerned about a return on their investment, may lead todifferent hospital behavior.co In a hospital perfectlycontrolled by physicians, hospital services are priced atmarginal cost so that physicians can extract all monopolyrents in the fees that they charge. In a non-physician-owned for-profit hospital, outside investors and/or hospitalexecutivcs should not permit such pricing behavior; ifeconomic profits are available, physicians would be TeQuiredto share them with the hospital's investors. Thus while thetotal price of a hospital stay, which includes both physicianand hospital fees, should be lower' or the same at afor-profit hospital relative to a non-profit institution, thehospital portion of the total price (which is ",hat this studyanalyzes) may be higher at the for-profit hospital. Account-ing measures of expense, which do not include a return onequity, should not be different for for-profit hospitals except
to the extent that hospital owners make different decisionsabout input use than physicians do.
011 the other hand, the recent growth in proprietaryhospitl/ls may be due to their greater abilty to. respond tonew demand-based prcssures on price generated by anincreased cost consciousness that has appeared in recent
co In loct Pauly" I\ (1;731 aun- that It .. aule I.. th. mecal.tat to maitain contro of . DOl-prfit h08itai. (It 18 DO dear wi,. theycan OWI their own hOlpitaJ. how",v.) MONH DO 0D th AmcaHaopltal AMati.., but aI tb. Juri.. Medcal AMaU aupp or the HiU..Buno Ad. which provided u.ve8IlDt.fiDUci to aoaprofU hOlpital.

THE MODEL AND DATA
years. 1 If the physician-administrator utility maximizationmodels of hospital behavior have some validity, then perhapsthe presence of outside shareholders is necessary to generatemore efficient resource utilzation. Under this explanationthe entry of proprietary hospitals into a market should ulti:mately result in lower prices and perhaps lower Quality aswell if that is what consumers prefer.
For-profit hospitals may also have different incentivesthan non-profit hospitals. These different incentives might
make some forms of active or tacit collusion between for-profit and non-profit hospitals more difficult. This couldlead to higher Quality or lower prices depending on therelative importance of price and Quality competition. If anyform of collusion is lessened, lower prices per unit of Quality
should result.
On the other hand, it is often alleged that fOr-profithospitals engage in cream-skimming behavior; that is, theymay specialize in those services which' non-profit hospitalshave priced above average cost in order to subsidize other
services. Extensive cross-subsidization hselfmay result fromthe predominance of comprehensive third party payors thatdo not consider the costs of individual treatments.
u Invuy hCnt year- . . p1atV ' ..an.. Of and concern , over coetl
.... to have .mel'ed Company il1une ptaN ha.. altere poliel.. to makelub8ben mon ..nliUn to C08U. Th. condudinl"MCtioD provides aonM
evidence of and diKU8 m. of ' the rUficatiom of the. chances oR h08pitalcompetition.
.(2 Rott (1974) luU-ted that the for-profit h08pital induatry declinedinitially beaun of an inen.. in the diculty of benl .mcient with crwth in.iM. implyinc that fton-prot iutitutiOl aN I.. concerned with .mciency.
4.3 Non-profit hCMpital. ' pric.. foryanQU8 A"iea reneet extenaive cro-
lublidisation. Jeffrey Ran (18'n) and Karn V.vi (1971) report revenue-cOitratio raainc from about .8 fOl major IUI" and delivery rom senicn to OV8I.. for MJnM taboratory ura. iI policy iI or&cm 1UUelted to be optimal

SECTION In
For-profit hospitals may also lure away those patients whosubsidize others (the wealthy, routine care, low cost) by
charging slightly lower prices, or by providing higher Qualityservice or more amenities.. to patients who are less sensitiveto price (the comprehensively insured and wealthy), and stilearn positive profits if they can also turn away the more
costly cases. They are often accused of refusing ' to treat
(in 8 HCond, but "OH), either to "rYe the Hlf iokrat or an orciud meicalltafr, or to allocate limited input.. Can Ba,. (1D8). at n. dUne the Bar.tudr I IUlPta th&t hOlpitai pnc for' Mric.. mot diretly nl.te phpicianactiviti.., web .. 8U"''' and inhnU.8 cu.. an h..vi,. lubediud 10 thatphflici.. can raN their own I.., .ince p.,on an only int..ted in the totalpriu. However, if total price il really th. . only relevlUt,.arable. then it is notdear why p.yon an Dot concerned that hOlpital be and diqn08tic proedureun. be priced far abe maqnal COlt. Paul Feldatein (1871), at 144, not_tba,the cutama low. IOmetima Decany., markup on maternty ..nice ia ntionalin the fraork of KOomc priu di8nation: youn, coupl..ha.inc childretrpicaUyar n1ati.el, por (and iMuraC8 may not provide comple'e oY.r... of
obtte\rical ..rr). and thay allO ha.e IUffcient time to ahop arund. A Reat.tudy fouad tbat onequutr of all WOI of dtildbearnc ..e in t!MU.S. lacany health in.uranee that would pal' for the hopital bill. (-Many Not bure forMat4rnity Cota, W..hinrion Pwt. 7/S/81at Ae) 1n\8f8tin.I , proprietar
hoopilal olt.r Uttle obo\4trica
....
(Goldamlth 11081), ot 117.) Hvr .,,-..thatcroubei..tion in h08pital prcinc COIU. inequiU.. in atandud inlU1conttab that, oyernsun . routine can and inadequately WUN . catutrophic CaNand thi worki. por. H. fala. to note. however. how the. paricu.lar paUern or
ublidi.ation tbat ex rectir.. ,he inuiti_.Noa-prol h..pitol 01 ..he of c.--o"bodl..llon. Poorly (or
non) Ia pa" .. ."bodi "" "" "".\e CO.. , (ODd w..Uhler)p.IIo... aln n.. co-pr, lo COt pa.. ",bocl hip COtpotiolo. Moor, "" molai cotr withot ..Ia poaloapridnc. hOlital caUl routine ca to IUbI IIrpnq tn.llMot.
44 Comptition 011 &mlti- .ueb .. bette foo, privat 1O1', or cabl. TVbu beolM popular.

THE MODEL AND DATA
indigent patients.4s If for-profit hospitals cream-skimlucrative patients by offering a higher Quality product, they
can cause average prices and costs to rise.46 If cream-skimming takes the form of offering only those services thathad been priced above marginal cost to subsidize otherservices at non-profit hospitals, then the prices of some
services wil actually fall while others rise as all prices movecloser to marginal cost.
If proprietary hospitals only enter profitable markets,
but neither affect the degree of price competition norcream-skim, a positive correlation between their market shareand prices and/or a negative correlation between marketshare and expenses will exist. Since it is unlikely thatsupply and demand are always in equilibrium in growingmarkets, it should not be surprising to find large for-profit
4' Sloan" Vraiu (108) find no dift8In in the percent... of all patientday. accounhd for by Medicaid,' and Medic., palieno 01' in the type of HfYiCHavailabl. at the two t.Ype ofhOlpi'ab. MonOYeI', Bromberc (1985) not.. t.h.tboth propritar.nd voluntuyh08pit.& wroe oft about -t." percent of patient "nnlH to charty cue and . ba :debt.
46 Enn if theycn&m .kil by oaeri.lichtly Io.er but .tilecftomic.llyprofit.ble pric... .vu... . pric.. wil ri II nOD P!ffithOlpita1 , Nt their cro-.ub.idi,inl pric.. 80 tha' the,. JU8t . bnak even ' in aclfpU and " if the budedcon.traintfadnc the indUitry .. . .hoe .. noteompletely - bindia.. - Sine. non;'profit hOlpita1 mudllGw. ni tM. priC" th.,.- Char formrly.ub8idiMd' paUentawhile proPrMtar h08pitaJ - .U'i l- potiv8 protl. total - nY8I\I colleG\emm' ircr... If non-prot . hOlpit'" . bad be . at . , price lUtraed equilbriumprior to th...try' Of for-profit iatitutioDlisnbIY80D1 ext would occur.Giv. cOIt-b.. . luurac. PnJ8m 10 the put It.... probably..poble forthem jUlt &0 ra th.ir prca. Tb. cUlnt propedi.. remburHment (DRG).yatem for' Medicar 'mak.. thi8 1.. f...ible. and ext .. inde. beominC morccommOR.
"7 Watt
!!.
(19 ) find no nidenc. oldifl4I nc.. betW"1I the c..,.mi
of for profit and . non-protboepit"' . . tMIr ratio of Medicar or Medicaid d&Y' tototal daya, or in their ratio 01 inhn. can dap to total day..

9ECTtON m
hospital market shares associated with high prices. In thiscase, however, causation would run from price to marketshare rather than vice versa. For-profit hospitals have beenestablished primarily in southern and western states whereunion activity and average labor costs are low, population
growth is high, regulations are loose, and reimbursementsystems are generous.
In summary, the effect of for-profit hospitals on marketprices depends on which theory correctly explains theirbehavior. If their entry is explained by their efficiency, itshould result in lower costs, lower prices and possibly lowerQuality. Similarly, if their entry makes collusion moredifficult, it should lower margins, but it has an indeterminanteffect on prices. If propi'etary hospitals enter to takeadvantage of cream-skimming opportunities, they may offerhigher Quality, and higher prices and costs may result'"Alternatively, prices may be pushed Closer to marginal costCwhile expenses do not change if cream-skimming ' reducescross-subsidization.iO Finally, if for-profit hospitals are ableto extract rent$otherwise accruing to. physicians, while thetotal price for hospital services may decline or remainunchanged, the entry of proprietary hospitals , may lead to ahigher charge for he hospital portion of those services,holding constant the degree of physician competition.
C8 Pri for fuy IMur PMI"' .t ..on-P",tI, hoop"". would rai andI.. co".re paenta. I.. would ri. StrCt Medic.. . CO .. il not ..pneroUi U 8011 pri".'. pl'. .tlriht ext ' MedicaN''' (our dab. ) to
ri.C8 Th wod ... 10.. ri and at"' rai.10
Expe ri it for-prollt h08pitab offer a hicher qualty prouct thON patient. 1- Mntive \0 priC8 that th., lun a..y. M. N8ult of thechantlin CaH-nU, ap.. 8I ri for voluntar b08pital. that an lef withonly Ii.. patientl.

THE MODEL AND DATA
Two types of variables are used to measure the effectsof ownership structure on hospital prices and expenses.First, in all the regressions, one explanatory variablemeasures the share of beds operated by for-profit hospitalsin the SMSA (SFP). In addition, in the individual hospital
regressions, dummy variables indicate whether a particularhospital observation is for-profit (FP). Under most theories,the share and dummy variables should show similar effects.One exception i$ the entry- into-profitable-markets hypothe-sis. If that is the sole explanation, the share variables will
reflect profitable markets while the individual dummies shouldhave no influence.
Evidence on differences in for-profit and non-profithospital behavior is mixed. Lewin et al. (1981) note thatfor-profit hospitals have higher costs and prices. Bays (1979)finds that once an adjustment is made for case mix, nodifference exists. Sloan & Vraciu (1983) also find no signifi-cant difference in costs, but find that net operating funds ofproprietary hospitals are slightly larger than for non-profithospitals, sugge$ting that the former charge higher prices.Becker & Sloan (1985) find that ownership does not signifi-cantly affect costs or profits. Watt et al. (1986) find thatin 1980 investor-owned hospitals charged 22 percent more peradmission after adjusting for case mix. This differenceprimarily reflected higher prices for ancillary services. Total
costs of proprietary hospitals, on the other hand, were only
insignificantly higher. The after-tax margin of investor-owned hospitals was double that of non-profit hospitals.
S 1 They fiiid that "independent prolit-MekinC h08pital. ar .li,hUy mon.meien' . but chun owned . profit..kina hCHpitab appear I., . .ftcicnt thanindcpadent, nonprofit bOlpital and DO more .mcientthan coyemrnnt hOlpital.run by dlainl. Governt hOlpitai tend to be leu profitable than eitherpnva'. nonprofi or lor;'profithOlpitalli...." (at 31)

SECTON m
b. Svstem and Manned HosDitals
The development of for-prorit hospitals may not be thatsigniricant by itself. Rather, there has been a concomitantincrease in the number of for-prorit hospitals affilated withchains or systems or that are managed by outside parties.Many of the same theories posited to explain the potentialeffects of proprietary hospitals can be applied to chainhospitals. They may be more efficient, or at least haveaccess to cheaper capital , and they may have more traditionalprofit maximization incentives, even when they are non-profit. On the other hand, their more unified structure mayease collusion which could raise prices (per unit of Quality)
and/or lower Quality.
Studies of multi-hospital systems and management-runhospitals (Ermann &0 Gabel (1984) and Wheeler, Zuckermanand Aderholdt (1982) respectively) suggest that they takeadvantage of managerial economies ' of scale in, for exampledealing with third party payors, as well as in bulk purchases
of inventories. Most studies dispute that they otherwiseoperate more efriciently.6S Finally, several note that bothfor-prorit and non-prorit managed and system hospitals sethigher prices to increase proritabilty.
12 In IN2, on. thi of al cowaty hOlpibJa, KCDtinl for 18" of th.be" b8lonpd \0 . ho8tal ay cOGtamlne tb.. 01 man owned or maaphOlpital. of the .,.. boeta1 wen inv..tor-owHC, 14" ... afiuedwith nlicou bI'itUtiOR ' and the . reainder we privat non-profit or municpal(E....n" Cab (1-) 0& 4U).
6S Bet.. " 810.. (1-) nole Ihal prprlar chai.. in parlcul.. an effcint. an the .umm br EniU Gab (188S)aohl Hveraotbe .tudi..that find no alciencl.. acrunc to chain hOlpitab.
14 Enann II Gabe (101. 1") 'UlQ' . the Uteratun. Se aI, Wheeler
Zu.ko.... .. Ad.rhotdl (11112).

THE MODEL AND DATA
The regressions account for affilations across hospi-tals. SMAN measures the proportion of each SMSA's bedsthat arc controlled by an outside management organization.SMHS represents the proportion of beds that are part of asystem or chain of multiple hospitals that are both commonlyowned and managed. Individual hospital dummy variables(MAN) and (MHS) measurc the effects of affiliation on theindividual hospitals.
c. Public HosDitals
The effects of the share of beds accounted for bycounty, municipal and state hospitals (SGOV) as well as thatof individual government hospitals (GOV) are also measured.Since county and municipal hospitals generally treat mostindigent, non-insured patients, their presence should reducethe need for remaining hospitals to cross-subsidize these
patients through their insured consumers. Therefore, a
generally negative impact on prices of the government sharevariable is expect cd. The government dummy variable mighthave a positive or insignificant effect dcpending on theextent to which other funds are available to subsidizeindigent patients.
3. Substitutes for HosDitals
The greater the, potential for using substitutcs fOrhospitals, the more competitive hospitals have to be. HealthMaintenance Organizations (HMOs), which provide comprehen-sive care, have been shown to have significantly lowerhospital utilzation rates than the ' population at large.66 Inareas where HMOs are more prcvalent we should expcct tofind hospitals acting more competitively. It;s possible, ofcourse, that this competition takes the form of Qualitycompetition. HMOs may draw off consumers who are most
1& Hard Luft (1078 and 1081). The .bove averac health .t.tu. or HMOenroll.. exlain. 801M. but not all, DC the reuctiQn in utilntion.

SECTION m
price sensitive and leave those who are more concerned aboutQuality to private hospital insurance plans. Therefore it isnot clear what effect HMO presence should have on hospitalprices. It is also possible t"at HMOs entered first intothose markets where cost was highest.51 A variable thatmeasures the pcrcent of the population belonging to HMOs in1977 (HMOMEM) is used along wit" another that measuresthe change in HMO market share from 1977 to 1978 (DHMO).
Nursing homes, at least to a certain extent, substitute
for hospitals. If this effect predominates, their presence
should lower hospital prices.1i8 On the other hand, if theydraw those patients primarily requiring maintenance ser,vicesrather than more costly medical services, they may raise theaverage cost of treating hospital (particularly elderlyMedicare) patients. The nursing home bed-population ratio
56 In rent yean, the andotal evide .uubI tb.t HMO. have bemelar. enoulh to caua h08p"ab to bid for their contncti bJ' of.ri. pricecompetitive pack..... About 87" of lup metropolitan hOlpital DOW have , aomerelationship with an HMO , and another 28" plan to impl81Dt one within the nexyear. ("Molt Metropolitan H08pital wil Link with HMOt HOIl1it..ll. G/1/86 at 44)In 1977-78, how8Y", it ia unlikely that HMO. .ere lare- enoulh to elicit much ofthis behavior.
17 Carl Schra, direto of ,he ceHr for HOIpital Finance and ManaK_-IInt of the JohDI Rapti.. M.dc" lD8itutloD81 b.. dated: .W. do knowhowever, that in ,tat. whuemoN competitive 8Dvironnwntl exlt, , laqycharacteriHd .. IUch b8UH . of tbe prl1ft of 1I0t, the bOlpitai leto overcapitaliHd whil. at , the 8a ti hlch prot 1f" ext. WuhindonPOI' , 8/2O/81i al A1U. SI"di.. ban found HMO ..wtb to be potivot)' ..1- tohOlpital apendituNl uad . It Ia quite poible th.t the two ar jointly deter-mined. (Fra..d WoIcI (UI86))
58 Whil. Dot applicale to the .amle peod. tbe neent moy. towar propolivol)' d_Ra p&)'n'" fnr bnopi'aI (DRGe) hoo bo cnrrated wllh areuction il lenhs at .t.7. Tbil ma, ver .eU be Indine to crMer nunilhome utiluUon.

THE MODEL AND DATA
(NHBED) describes their influence.
4. The Effect of Phvsicians on HosDital Behavior
Since the supply of physicians is probably jointly deter-mined with the supply of hospital services, inclusion ofvariables measuring physician supply in the reduced-formhospi tal regressions ma y lead to biases. Therefore theresults initially reported omit measures of physician influence.Since, however, the role of physicians is important, regres-
sions were also run including various measures of theireffect. Since those variables have little effect on the othervariables in the regression, serious biases probably are notpresent and those results are also reported.
The patient care physician - short term hospital bedratio (MDBED) is used to account both for shifts in demandcaused by physicians acting as substitutes or complements tohospital services and for the impact of physicians on hospitaloperating decisions. The physician bed ratio may haveoffsetting effects of decreasing demand, if physician office
visits substitute for hospital stays, and increasing demand ifphysicians make the decisions to hospitalize patients. If thePauly and Shalit theories are correct, larger groups ofphysicians are less able to control individual and collectiveoutput and the hospital component ,of costs may rise with thenumber of affilated physicians. High physician-bed ratiosmay also reflect higher Quality care in markets wherehospitals have attracted a large number of physicians through
&9 To take account of other h08plta1 in the maret , .. varable meuurincthe ratio of be in the included m....t(thon in.hon term, ..nera Don-fede-ral h08pital) \0 .n otber h08pital be. in the SMSA .u included i08011
. preliminary "..ioo.. Ir the other h08pitahin the ana exert lome competitivepreuure on price, the coeffcient on thi8 varable ahould be itiy. .inee hilh
value. of thi. var.bl. imply few h08pital h.. other than the on.. located in ourmeuure lample. The ..anable , lien .hiRed &Cr' l'p-ionl, however I and...imicnificant. Thenfore it waS omitted from lubluent reioRl.

SECTION III
provisio of advanced (costly) technology. One could also
argue, as does Joskow (1981), that the causality is reversed.In markets more saturated with physicians, hospitals may nothave to compete as much for physician affilations through
provision of expensive facilities. In that case, in areas with
high physician density, hospital prices should be lower.
MDBED could also pick up supply effects sincerela-tively high values indicate relatively low values of beds. Thephysician-population ratio (MDPOP) which should measureonly the effect of physicians as substitutes or complements isalso included to sort out the various possible effects.
GPMD measures the proportion of all patient ' carephysicians who are general or family practitioners. Giventhe physician/bed ratio, it should have a negative impact onhospital prices, since GPs are more apt to substitute forinpatient hospital services.
S. HOSDital OccuDancv Rates
Holding constant a hospital's occupancy rate, the higherits occupancy rate is relative to the market average, the less
it may need to compete. Its higher occupancy may indicative of some local markct power related to, forexample, a beneficial location.eo If this is true, thatmarket power should be manifested in higher prices if the
hospital market is anything like a normal economic market.It is also possible that the higher relative occupancy mayresult from higher relative demand due to a higher Quality
eo Th.
..
mo.' uo In .hle .'udJ Ie dotlM AI .It 8MSA Inol.In ao c.. thlt mal' be to lup. paicuar for fairl,. routine tnatlDu.h.. .... hopl'" prold. eo.. io oR.. 'hoUCh' to be, . laIimportant lac.' of . bopttal"a chU'tertiCl 80 . paicular hoeplt81 may be&h. to char 81ilhtly hilh.r price libaa otlMn within the SNSA and not 10Mman,. patientl.

THE MODEL AND DATA
(and costlier) product produced by the hospital. If this isthe case, then a hospital's relative occupancy rate (ROCC)should be positively correlatcd with both prices and expenses.
If the market power story is correct, only prices should be
positively correlated with ROCC. Finally, hospitals mayachieve relatively higher occupancy rates by charging lowerprices (per unit of Quality. In this case, ROCC should benegatively correlated with prices or positively correlated withexpenses.
ReRulations AffectinR the HosDital Industrv
Two major forms of regulation control the hospitalindustry. Entry regulations require approval for construction
and for some other major capital expenditures. In a fewstates, rate regulations affect the prices hospitals maycharge.
Two government programs control entry. Certificate ofNeed (CON) regulations, implemented by most states duringthe I 970s
81 reQuirc that any hospital that wishes to enter
and/or expand obtain approval from a state regulatory autho-rity. Similarly, Section 1122 (of the Social Security Act
Amendments of 1972) authorizes state planning agencies toreview hospital expansion plans and to recommend that theDepartment of Health and Human Services disallow associatedintercst and depreciation expenses paid under public insu-rance programs if the plans are not approved. Since CONregulation is broader but serves essentially the same purposemany states abolished their Section 1122 programs upon
61 Feder law mandat8dtb.ir enactment by IgSO in order to qualify forfed.ra health fundi. Thi8 reuirement, however, hu ben eliminated. Tex..Minnaot8. Anson., Utah, California, . Kanu. New. Mexco, Idaho, and Louisianahave reently dimanUed their CON pro(ral1 or plan to ph... them out in thenear future, althoulh some of theM .tates .UII have Section 1122 "gut_tionl. Inat leut two atate. . 'Ul'e in notices of intent to build haa ben noted ainceabolition of the.entry nview pl'am.

9ECTtON m
enacting CON legislation.
Three theories predict differing effects of entry regula-
tion. The first, which is based on the common belief tha tany expansion in hospital bed supply creates its owndemand z and that, left unregulated, hospitals compete fophysicians and patients through .unnecessary. expenditures onfacilties and equipment, posits that entry regulation reducescosts and hence prices. Alternatively, Posner (1974) andJoskow (1981) have suggested that CON regulation can fostercartclizing behavior by hospitals: it hinders rent dissipationthrough Quality/amenity competition as well as preventingentry. Under this view, it is not surprising that the Ameri-
can Hospital Association supported the mandatory enactmentof CON programs.83 This carte; Iheory predicts that entryregulation leads to higher prices with constant or lower
costs, i. , higher margins. Finally, the third hypothesissuggests that regulation of beds and certain large equipment
expenditures merely redirects purchases to other forms ofcapital (Salkever and Bice. 1979). Total capital expendituresremain constant while operating costs may rise sinceproduction using the regulated mix of capital is less effi-
cient.
Most analyses of the effect of entry regulation pro-grams suggest that, several years after their enactment. theyreduce expansion of bed supply but encourage greater utilza-tion of the existing bed stock as well as other inputs.Empirical studies suggest that aggregate costs increase orremain unchanged. , The effect of entry regulation on price
62 Thia concept. known.. Rollr . La. I .u lint .uuted . b,. MiltonRo... (lIMt).
83 American Hoepital Aaation (lNI).84 Sloan (1081). Sloan .. Shinwold (108), Solkov.. .. Die. (1871). Miok ..
Roynoldo (1878). Jookow (1111),

has not been carefully examined.effect as well.
THE MODEL AND DATA
This study analyzes this
The effect of certificate of need regulation is initiallymeasured as the number of years a law has been in effect inthe state (CON AGE), since CON regulation is designed toreduce expenditures on durable goods and therefore can beexpected to become effective only with a lag.s6 CON AGEranges from 0 to 13 for the year, 1977, that is studied. Asecond formulation assumes that once a CON law is well-established, its age does not matter. This specificationdefines a dummy variable as equal to one when the CON lawis at least three years old and zero otherwise. Section 1122(S1I22) is measured as a dummy variable which takes a valueof one in those states having Section 1122 review boards.
Prospective Rate Review regulation has also beeninstituted by some states in the last decade. This form ofregulation attempts to control hospital costs by establishingin advance maximum allowable rates either based ' on pastcosts or to cover proposed total budgets.
sT State hospitalassociations have generally opposed rate regulation. Evidenceon the effect of such programs is mixed. While most recent
studics find a negative effect on costs in those states with
65 PnvoUiltudiel. e.c-, Sloan .IlSt.inwald (1980); have .haWD thi. tabetrue.
66 SectioR 1122 ii not meuure by ita be.UM all MCtion 1122 .tatutuwen enacted ' in the ntaUve.y.hor' period bet.een 1971 and' 1914. AlternativelylpeifyinCS1122uth. proportion or the population that ia enroUed in Medk...or Medicaidinthon .t- with Sec on 1122 Nvie. bo did not chane- th.N8wta licnifcantly. Since 81122 "culatiom .often duplicate CON 180.', lUoth.ralternative varable. ... formulate
.. ..
dummy equallinlone only-hen.. 81122prolf exte by .. CON la. did not. Theruulu did not chance.
81 Se Mom.. et aI. (198) for &1 interatinc theoretical discuuonexplaininl' why errective rate review lowen -quality" of hOlpital input. when thehOipitai objective i. to maxmiacphy.ician incomel.
,.'

SECTtON II
mandatory rate settingsignificant effect.
programs older studies find
Prospective Reimbursement (PR) probably does notdirectly influence market competition. However. if it favorsone type or size of hospital over another, or affects case
mix, it may have an indirect effect. Programs differaccording to whether they are voluntary (PRV) or mandatory(PRM), whether they use a formulary or budget review
approach , and whQ they cover. Mandatory programs are morelikely to be effective.
C. Data
I. Price Data and Reuessions
This study uses price data for various individual, diseasecategories. As noted in the introduction, studying prices forspecific disease categories has at least two advantages.While most previous studies of hospital competition havemeasured Quality competition using expense data, price dataare essential to determine the effect of competition onconsumer welfare. Second, since hospital services are ahighly differentiated product, focusing on individual disease
categories is necessary to avoid serious production functionaggregation . problems. While case mix variation stil existswithin a given disease category. such variation should bemuch smaller than that found in the aggregate hospital
88 Slooa (ll1), Jookow (1011), Mord u.. (ll1), Wonhorqtn oadPir (1012), Dra.". en eo. (1-), M.lnck l1. (1011), oad Slooa (1011)rOWld p..potln nI """'100 ro.... hooplt" _to oItl7 whU. Slooaoad Stonwol (101), Mlok oad lIdI (1012), ODd Elnlckl (1071) 'oWld no.troct frm ouc ..I.tloo. Tho dltr..u CO prmay be "'trlbut'" to th.time period analyHd .. wel. .. 'be ..y in which the YcJoab. lMurin& 'h.nculuion... chart.riae.

revenue or expense measures used in
THE MODEL AND DATA
many studies.
Both average market prices, where the market area isdefined to be a Standard Metropolitan Statistical Area(SMSA), and individual hospital level observations areexamined. Implicit in the market level analysis is a model ofindividual hospital behavior that yields equilibrium market
prices dependent on various characteristics of the marketsuch as demand, structure, and regulatory environment.Using SMSA.defined lTarkets, it is straightforward to define
each hospital's competitors.
There are two disadvantages to working with dataaggregated to the SMSA level. First, only about 2g00, orless than 50% of all community hospitals71 are located inSMSAs. Therefore only half of the available sample of allcommunity hospitals is used. Moreover, hospitals located inSMSAs are not drawn from the distribution applicable to allcommunity hospitals. Hospital$ located in SMSAs are mOreapt to be large: while 44% of the SMSA-hospitals containmore than 200 beds, only 27% of all community hospitals do.Likewise, less than 9% of SMSA- Iocated hospitals have fewerthan SO beds, while 24% of all community hospitals are thatsmall. Second, by aggregating all the individual hospital
aD One very reent .tudy(EakOl at Peddecord, 1986) ayoida this major
problem by uline profi data by individua hopital Hrvice (e. , pharacy, meicalAt lurccal, obltetrica. dinical laboratory) to dehmUne the eff tof ownerhip on
marDl for different aeic... The data ar ,til lubject to cue mix probleml.however, and the .tudy doa not examne the erred of, maret structure.
70 Madd... (1977) th. econometric advantac and di..dvant..t1 ofdata ......tion. Infonnation i8 Iot throuc au.. ion but , to the extent that.non mat in the micrata or the micrrel.tioft an inadequately lpeified,au"8ted data ar appropriate-
71 Community hOlpital ar defined .. -non-federa .hon-tenn cener andother speial hOlpitai. - excluding hOlpitu units of inatitutionl - WhOM faciltiesand aervice8 ar available to the public,- (H08pital Stati.tiC8 . 1977. p.. vii)

SECTION m
data, we lose potentially valuable information about differ-ences across hospitals that may affect their pricing deci-sions. Therefore it wil also be useful to study prices at the
individual hospital level.72
Both the SMSA and individual hospital level regressionsinclude the same explanatory variables belonging to thevector S discussed in the previ()us section as well measures to control for exogenous demand and cost factorslisted below and discussed in the appendix. In additiondummy variables to reflect the ownership status of eachindividual hospital wil be included in the individual hospitalregressions.
Eleven disease categories are studied. Four categoriesof explanatory variables are discussed: those that measure
demand, those that account for cost, regulation variables, andproxies for the degree of market competition. In the priceregressions, the depcndent variable is the average price(charge) per case for the particular disease category for allthe hospital services except for the physicians' fees. In the
'1 For ...nI dI.. cat exam. th comdea' of .ar.liion oflbo, ..Io prlco d.t. b.. ba cop- to th ."".. ..mdonl orvaratio (cv) of the cI..t8 data. The ..u1u. IhOWDbew. .how minordi.recli bet... the two. tn of ay....DiM..Co.
Ag'" CV CV 01 Individual H08Dlta1Mo.. ft210s14
421
2102Z8288218
1812112SI
01 - 1.01 - .
002 - .002 - .

TH MODEL AN DATA
aggregate regreuions, the unit of observation is an SMSA.In these regreuions the price variables arc weighted (bynumber of cascs) averages across the sample hospitals in agiven SMSA.
The price data come from Health Care FinancingAdministration (HCFA) files of average chargcs fOr the mostfrequent diagnoses for Mcclicare inpatient diagnoses for 1977
and 1978. They are cIerived from the Medicare ProviderAnalysis and Review (MEDPAR) data whic!t "are a 20% sampleof all Medicare hospital inpatient bils submitted to HCFA forpayment under Title XVIII (Medicare) of the Social SecurityAct."n Individual patient data are aggregated to thehospital level to preserve confidentiality.
7I Also, - since asmall number of very high charges created substantialdifferences between means and medians, tbe top 7% of allpatient records for each diagnostic catcgory was delcted byHCFA. HCFA cautions users of the data to remember thatthey are "for the Medicare enrolled DODulation onlv" (empha-sis in original), but also notes that persons over the age of65 account for one quarter of all hospital discharges and forone third of all patient days. Otber studies bave also showna strong correlation between the pattern of Medicare CbargeS
and other prices across hospitals. Even thougb the levelsmay vary, the data "can be considered reasonable indicatorsof tbe overall relative differences in prices charged
13 In
- -
, t'" 8MA
..
ho.oI dat. uo not
..
oa alhohlo In t'" 8MS 11-- "" lU .. OD t- 8MSA Chat
..
_t or tb.. 7." or th bo In th 8MA (201 oba1l,..41 DO oitdl- .. rOU.
74 1a_1o on t'" dat 00 10 dOoc - "' 0.. or lloo.bPI"". P_1a IMhr No. 81- , MarSl , 1081 (U.s. IHIr..tor HooCh OD H.. 8ecol. QO or ... dlo In t"" ..po ..w.... (1081 OD tb. P_IaOl wtle II or A_t lS, 108.
71 D- ca at . pYln hotol wltb tb.. Ii.. _at-uo de by HerA.

SKCON m
hospitals for similar types of diagnoses."
The data have one problem. Because of the nature ofMedicare (and most private insurance plans), the price for a
hospital visit is divided into two components: a chargerepresenting all of the hospital inputs (e.g., bed, nursingservices, operating room, drugs, physical therapy) which ispaid by Part A of Medicate, and a physician fee, generallybiled directly by the physician, which is covered under PartB of Medicare.
T8 Ideally, the effect of various features ofthe hospital market on total hospital service price should bestudied. Unfortunately, as is true for almost all studies ofhospital competition, only data for the hospital component ofthis price are available. The hospital price may not alwaysreact in the same fashion as the total charge would todifferences in market conditions, particularly if physicianshave some control over the production process for hospitalservices. It wil be particularly difficult to test the Pauly-type model of hospital behavior.
2. Exoense Data and ReRressions
As discussed earlier, since it is difficult to holdconstant all dimensions of quality in the price regressions,and since pro(it data by disease category do not exist in theavailable data set, it is necessary also to examine expensedata.
The American ' Hospital Association s annual survey ofUnited States hospitals provides the expense data. They arcmatched to the price data by hospital before any aggregationis done to the SMSA level. These . data represent totalhospital accuntin8 expenses, including salaried persnnel,their benefits, professional fees depreciation, interest
n Moo' prl"...
..
wor th
--
waF. I'or ox., Ia 81.. en
--
hoplla co wbJ 81- abl -"" r..1J ch_.

supplies and purchased services.for-profii hospitals are inc1uded.
THE MODEL AN DATA
Tax payments by
The expense data are nOt disaggregated to the diseasecategory level. This implies that unlike the price data, the
expense data may be subject to substantial case mix varia-tion. Several hospital characteristics are thought to affectcase mix. To the extent possible, these are held constant inthe expense regressions to minimize the case mix problem.Teaching hospitals and large urban hospitals, which mayattract more complicated cases, are accounted for by variousdummy variables in the regressions. In addition, as men-tioned earlier, it is alleged that proprietary hospitals treat asimpler less diversified, case mix than do non-profitinstitutions. Bays (1979) found this to be true for unaffi-liated for-profit institutions, but reported insignificantdifferences between the case mixes of proprietary chain andnon-profit hospitals. Over 50% of the proprietary hospitalsin the sample used in this study are chain-affiiated.Measures of ,the special facilties possessed by hospitals (acommon indicator used to measure Quality) were incorporatedin earlier regressions but had totally insignificant effects onprices and ,expenses. Since maternity visits tend to berelatively low cost, a variable measuring the, ratio of birthsto admissions is also included in the expense regressions.
77 Accrd to B.aer aadSloua (lOll, at 32), 8Jte overhead Or' -homeOm"8 e08t. ar chU' \0 indvidual hOlpital but not 01 . r..-Iorw..rviceb..ia. Perent.. of nv,nM iaOf.method conly uN. It il diffcult to
det.rme what bi.. thil may enat.78 Dat. deleain tbl tax p&ymb ollDdiYiduai hopitab .- not avaiiable
to thil dudr 8i tax paymtl an " iauded in an -a.... cate or -otlMrnonpayroU dJM- by. th AmricuHOIpltai Auatlon. 88er _d Sloan(1Q86, at II) _timat. tbat- pretU) bopital 8XII w... on av_ra- 3.percent bieb- In 1977 be of tax paymtl. They aI note that hichlriI"er' COU payab on corprate debt fmancl eu oppo to muaicipal orother tax-eempt) led &0 . furiher 1 JMrcent co.' diaadvantap accr proprietar b08pitab.
SECTION II
Regressions are run on expense per admission (EXP AD),
which corresponds most closely to the price pcr case measure
used in the price regressions. Admissions are adjusted totake account of outpatient visits. Since factor usage is in
parI determined by the form of competition , variables such aslabor inputs and assets per bed are not exogenously deter-
ined in the expense regressions. Therefore regressions arerun omitting such variables. Regressions of the inputmeasures on the competition variables are also run todetermine how input usage is determined by competitivefactors. Once again regressions are run both at the SMSAand individual hospital levels.
3. Demand and Cost Variables
Several variables are used to control for differentdemand conditions across SMSA markets. These - includeincome, insurance coverage, percentage of the population onwelfare or unemployed, population density and growth, theperccntage of the population that is white and the deathrate. Also included is a dummy (or share, dtpendinll on thelevel of the regression) variable indicating hospitals located
in cities with population equal to or exceeding one milion.This variable accounts for the more complicated case mixtypically found in urban' hospitals. Motivation for theirusage and the results are discussed in the appendix.
Since many hospital costs cannot be viewed as exoge-nous determinants of price, it is inappropriate to includethem in the rcduced-form rcgrcssions. Rather, Only thosevariables that cannot be affected by the hospital decision-makers, the physicians or administrators, are used. Resultsfor these variables are also described in the appendix.
The next section outlnes results for the price andexpense regressions. In order to present tbe complete story.the results from all four sets of regressions are described

THE MODEL AND DATA
simultaneously.7 The discussion focuses on the variablesthought to affect market competition among hospitals. Thesevariables include the structure and ownership descriptorsmeasures of substitutes and complements, and the forms ofvarious regulations. Table 2 presents a complete list of vari-ables, their definilions, and descriptive statistics.so Bt
79 SMSA level price and expel1, and individual hoipital level price andexpenH, ftll'ioRl.
80 A. i8 apparnt from the table, for aome van.bln the SMSA level meanvan.. con.iderably. frm the h08pit.J level .yen.... For exunple, the concentra-
tion m...ur' . an conaiderahly ,nateI' at the SMSA. level. Thi8 iI due todifferent weiaht. plac.d in. c..cut.tin p'and me81. While the SMSA level valuuar calculated ...eicht 8V"" of aU . tlM b08pita1 in the SMSA. in thesrd mean"' eac SMSA iI liven equal ..il'ht. . Attheh08pital level, .inee eachboapital iI .eilhted equally in calculatinc the m.UI. SMSA8 with more hOlpital.reeive a &natI' - weicht. Since . - tbON SMSA8 have lower concentration, the
concentration leel .ppean lower. Similarly. aver.. priee at theh08pital level appear hipel' . be.UN hopitall in lar urban ue ar likely tootter a more 8OphUiticated , hilher priced prouct. Since .uch hOlpU'" ar notevenly di.tribute &Cro . SMSAa, . they do . not reeive.. much weicht in theoverl SMSA. .vera.
, ,
81 A corrlation matri of all 10 independent and 28 dependent van.bl.. it
available from the author.

SGO
VS
har
of b
ed. o
wne
d by
pub
lic h
oollo
l
SMA
Sha
r of
be.
In h
o.pl
lol.
man
apdb
y al
hlrd
par
,: .
SMH
SSh
ar o
f ho
d In
hoo
pllo
l. Ih
al o
r pa
r of
mul
ll-ho
op!lo
l oy.
lam
1 F
eder
a hO
lplta
t. ar
not
incl
uded
in th
e da
ta li
t: be
eau.
. of t
heir
re.tr
icte
d cl
ient
ele.

Dul
D ..
..abl
. den
olln
C I
ndiv
idua
l for
- pro
m h
o.pl
lal
no
...
(us
In in
divi
dual
hos
plla
ll"".
! rec
r.lo
na o
nly)
GO
VD
UI
vara
ble
deno
tinc
pubU
c hO
lplta
l
...
...
Dum
vara
ble
deno
ting
outs
ide
man
age
hOlp
ital
...
...
MH
SD
umm
var
able
den
otin
g hOlpltal that i. par
ot
.y.te
m
,..
...
NH
BE
DNItC home
bed
- po
pula
llon
ral!
o1.
75
HM
OM
EM
Per
cent
., of
SM
SA p
opul
atio
n w
ho a
n H
MO
mem
bers
DH
MO
Cha
np In
HM
OM
E fr
om 1
977
10 1
978
1l..
MD
BE
DPhylc:an. in
at;e
nt
Car
.. S
hort
Ter Bed
ratio
88
GPM
DPr
opor
tion
olPh
ytid
an w
bo a
n G
ener
al P
ratit
ione
r
':;

.. .. "' ,, ..
o'i
g::
"37'" u8.
'0 ::r:1J
0'"2 !
. ..

UI!
TH
S
'00
CO
d V
aPl -
.bJe
t
WA
GE
SNomial' w.,.
ot
hosp
ital'
Indu
atry
wor
ken
9484
1253
9780
2027
CO
TH
Sha
r of
be
in h
""pl
lall
lhal
ar
mem
be o
f Ihe
Cou
DeI
of
Tea
clD
II H
""pl
lalll
D S
MSA
_.Io
n.;
D\I
vara
qJe
del1
0lill
indi
vidu
al h
Olll
al m
embe
rsip
ID COTH iD iDdlduaI h"
"plla
l ....
..IO
DI
SrZ
EAye.. Dumbe of be (SMSA -I
ona)
; Par
leul
ar25
025
820
8
h""p
llal'
l Dum
be o
f be
(hO
lllal
"_lo
DI)
RSr
ZE
Indi
vidu
al h
Olp
ltaJ
.1..
rela
tive
to av
er..
hoop
llal .
... iD
SM
SA
:9."

Deo
.nde
nt V
arab
ln
Pric
e.. D
i.bet
- M
elltu
s13
1185
215
9262
3
Pric
o -
Ool
aroe
l (w
flur
gry)
933
203
1060
317
P410
Pric
e.. A
cute
myo
cari
alln
tart
ion
2637
593
2957
998
P427
Pric
e.. C
onge
tive
hear
failu
re15
6339
117
6664
4

PSSO
InlUal Koma (W/lurl')
11T
S22
4
PS82
m..r
tlcua
of I
nllli
ine
285
P80D
Kyp
lul..
of
Proa
le (W
/IU
rpry
)18
1888
2
P820
Fra
lur
of N
ec a
nd F
emur
(w/l1
ry)
S88S
T8T
EX
AD
Tol
al exQl/lotal adUlted (f
or o
utpa
tient
) ad
mlll
lol1
1191
288
ASS
ET
B.M
ut (
net o
f de
prei
atio
n) -
Bed
rat
io (
for
SM
SA
or
hOlp
ltal)
81.
IT.
FTE
BFun time equivalent penonnel per be (for SM
SA o
r hO
lplla
l)84
5
..-.-
----
,y.
;0),
lS41
"-0'
1122
2115
4249
1299
59. U82

IV. Results
of the SMSA level price regressions are3, while those for the individual hospitalappear in Table 4. The expense regressionthe SMSA and individual hospital levels areable 5. Results using input measures aslies are shown in Table as well.
tJcnsc RCllressions
e SMSA and individual hospital levels, thes show that the Herfindahl (HERF) as'er significant. By itself, this could indicatelcture has no effect on hospital competition.cr admission (EXP AD) regressions exhibitive and significant Herfindahl coefficients,legative correlation between market concen-cnses suggests that competition occurs alongld facilty dimensions. The significance ofin the expense regressions combined with itsn the price equations suggests that while; increase the Quality or complexity of the
termed a hospital stay, it does not affectplies that the price of a Quality-adjusted'ut (which we cannot measure) falls withe level of concentration. and that some pricecfore does exist.
c argued that the negative relation betweenId expenses indicates that hospitals in morerkets have taken advantage of economies ofs a result, more efficient. Such a view liesuments that suggest that regional planning
erfndahl ... allO included in an eulier atap of the NIf-II. non-Unear relation betw..n prce 01 ape.. and cocen-,Wd licficant raul". Simiar I wben tbe Uerfndah OIplt'" raanap by. comm company.. lincle firm, the

-- II.. ..--1 B
::.. ;:.. ".. cr..
"- ..
=c: I! :;1i.. go! :..
:!,
'1-
...
1;-
:!....
;; 8..C!G! .
"'
... 0"" ..-::.. ft
.- =::. ... .. -' .- :.:
'T..
:- -
8!! ft ....
:..'..
:= Ii Ii
.,.. .... ....
11-
-- -- .
.i -i1
~~~..- "."-:-
OI. ....
"'"- ..'"- -,, --
1- -
... --
a.. ...
,: ..!..
.. 0.. ..G!:;, ..- I,....
..... .. ,.
w 1I'i :;ii.... .... !I"
.. .- .... ....
II;qi:
g--
..l ci.. ;.i
...;
i--Ii..
1:- -I: II;"'Ii
";"" ;.!
-1..
.:.. ",,
Ii;
";,
'1-
-:-
-10 1:= 1qQ'
"'"' "'"'.... .... ,;,.
il1 . i
.-'=-
I!;; I!'i
::!!
!l1!gd.
g.;
id.
..
11- h_
.."'
ce;
::.; =. ....
/1-'1-
11-IS'1;1:
;;:;
-'CI
.=.
:a=. I!-'T-
Iii I!'i "I:
.;;--
1111
....
.. i
....
11- liS.
-:- --
r'"

- --
:I" 1;1\
.. ....- -:!": :::
Clo:liE'
.. ".=
- 0-i- ..II !i:! .
r!""
- ,
'1-3q i
s: - i-
.....
II fi:I .
:::;
CI- :I:! ..
".:... .... ... ......- ,- -...
;:=- 'T
-::
I:I!
..;
h h
....... - ..- ,-
'5:
.... ..- '.... ..- --- ,,-
... e. ti . 'I
".= -
!IE
10:; ;;!!;:"i =-"1-
.. ,,,-
"''I ..q
=f.. !=-
q II
:;. IIq
.. ..- ....
t. '1 -
h..
;!
iji; ..=. 11 =
:: i
2' :iS": Ii""
i ..Ii-i Ii""'1-
::- ,,-....==-....
I!:
"..:::::
!e.
Ii..
...==-
I: I I: ii-'lq
"' "'.. ., ..- - -....!:!
hI:
...
s:,
11-
:=1:ft..
h h
..i
:="" I!- III:IIG! "'
"'..... - .. II::i..
;;a
11-
:;!
it I:iJ.
11- !i-'III
iI"" I:q """'
- -
ii- -
=: ..
:! Ed.
Ii ..- hO
IRE' =- Ii Ei"I.. II 2!. ...... I I .. el'
- -
is' i- "11 I!.
.' "- -
1! .,
... ...
ol- ..-
I: -'lCI 1011II:: 8:: II::
....,,-
ii I\II- a
..- '" .....;:
.,.. 'lq "'.,
.... .... ....=- .
'i ..I::
I: -CI"' ..IiII.. ....0-
--.. .... ..-..- .. .. ,
r!i Ii0'" ....
.- --;!..... .... ::- =- =
51::
.... .....-
0""
. .::.-
II:
::- . ...; ~~~
==t;
E!t
. .,
- oj
.. .

- - -
--.
H.o
)11
1)i:i
:..)
-.--
\-""
--...
.
-147
.18
4.1'
7.-4
24.
-01.
10.
-127
.-1
41.
111.
818
7.
I..)
(-1.
1)(-
I,
..)
4.1)
(-U
I)(-
UI)
..,
I""
(-1.
11)
I"')
12.
1.2.
118.
211.
81'
7.11
7.'U
I11
.11
8.17
1.
70'
(.II
,(I
.(I
,(U
I)(1
."(2
."(1
.01'
(1.0
,(U
I)(1
. 70)
414.
..8
.
...
21T
.al
.4'
7.1'
11'
140.
142.
118.
UO
I(u
.,(1
""(I
.
(-..)
(1."
(l, e
I'
(-..,
(1""
..)
.1'
los
41.
-1.1
74
...
17.
..,".
....
.
17.
-10'
"-1
4.
(1.
..,
(1.0
1'(I
,
(..,
I.,
11'
(u.,
'')
ID.8
-U.
1T.
'8.'0
IDa.
-D.
10.
aU4
11.1
11.7
41a2
1.,
..)(.
.,...
,
(-1.
')D
O)
11'
71)
(-1.
..)
OO
)B
MO
Ml
171
7'. 0
81I.
Jl1
707
81f
1.11
140
111
.8(I
"')
(u.,
(I...)
("'"
,
(I.
(1."
(U')
(I.
('''J
(1..,
(2.1
)D
""o
"'. 11
2'1
140
001
101
181
'-1
.01
l1'
(-U
'J1.
"(-
I.
..'
II)
(-1.
.,H
UI)
(,u.
,
.')
N1E
I-I
.U
811.
81-1
. 174
JiS
1V81
-1.8
12I
l-1
. '18
011
(-1.
0'(U
I)
(-.,
01,
(-..)
,")
(.I)
(-u.
,(.
II)
(-U
IJR
ooe
...
87.
ill.
1111
.14
1.88
J.41
1.
,...
fa;.
128.
alS.
(u.,
..,(',
eI)
(I"'
,(U
"(I
"',
(I"'
)
(..)
("",
(U')
(I"'
)O
ON
AO
B
'''"
IUt
aID
11.8
11.
....
"81
tTe
DO
'
....
(1.')
(1.1
'(I
,(U
',(u
.,(u
.,(u
.,(1
.0'
(1.1
2'(U
',(1
,11)
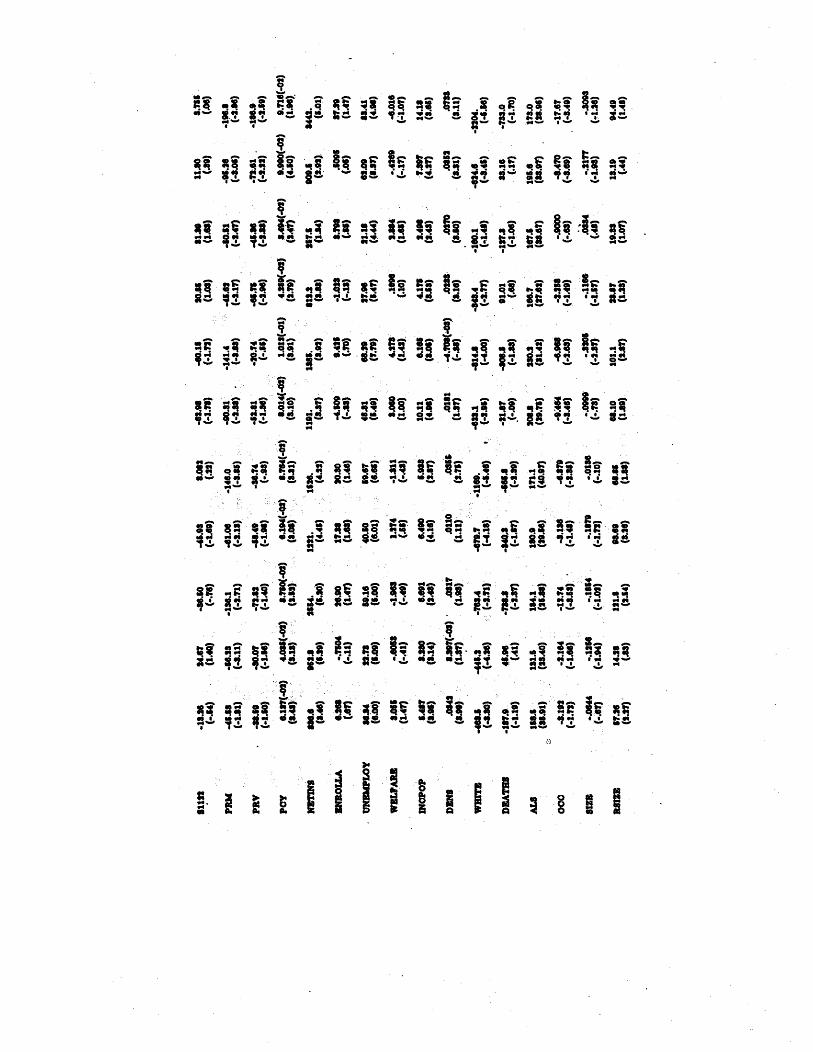
..
IIII ;;I; ;:1: qCl
"'"-
1'1
.... ';! .! .,
:t
.. ::'-:- -:-
Ii", 1:-I!i
\; ._ .'"
!;i"IM. ..I;
....
1\;; ;:1111
.. .! :; :j": !! ;'"
i..
'"
'i i", 'iII"! . .. "!"' II.,0.. .... .... ....
,..
'T"= - =-I!i :Ii
.... .....
::- 1- g- it=l "' 1i51 "'
".="
.e i1 IIIq:1. S!
h;:1.. - liSai..
'" -
1S- -
"" .,q
! ;.l a:! '1.J =e.
10 eo; II""1I q","'e. .! I; 11
.. G
- .-- ..
--C!
- - ", -
=- :i1 =::
:iF
. . - --..- ....
tolI C!CIi..
..,! - .-
ii.. ... IIi; I!: "':: -a T.. i ..:'T 8'1
,- ,-
u h ..
.. ... ......
. '0-
- - -..
Ii!
,;-'
'T..s! ;!
rift =..
,-
II! ,.. 1.0
!!:;
111i.,11Ii':
:!
.'I ;:S iJ, I':
8..
:;
!Ii1;.II! i!!
!!-
::i
iji
"'
ii:
.... ....
/I':
.:! j!!
1'-
::: .... ......
1-: !IiiI:.!
'.. .': "'.. .;":
1. 'T-
I'" IIi if I!i;i!.. IIG!to:I.!
",: .:!

211
a14
410
421
411
1111
111
182
820
SWA
G.
.011
0274
100
.01
0821
.G11
.182
.oS
018
UIS
(111
)(8
. 111
)(1
18)
(117
)(1
17)
(1.8
)(7
.2)
(8.0
8)(8
.')(8
.(8
.7)
OO
T11
1.80
4040
7.41
11.
110.
4SU
281.
111.
asu
818.
(12.
04)
(8. '1
)(1
0.24
)(1
1.1)
. (10
.28)
(11.
8)(1
0,21
)(1
1.8)
(8.8
)(1
10)
(10.
1S)
POPD
UM
108.
11.
1.1.
104.
132.
151.
111,
80.8
1.1.
211.
(4.8
)(1
.1)
(1.1
)(1
.11)
($.I
)(4
.1)
(4.')
(1.8
).(1
.0)
(4.4
)(1
.1)
OO
NST
AN
-141
17.
111,
-2'1
1.11
8.-1
88.
2Ut.
-18t
.-1
081.
-821
.15
88.
2118
.81
)U
t)(-
8.1.
1)1.
1)(-
8.88
)1.
0)(-
4.1)
(-4.
2)1.
2)1.
8)
.8.
112
Ift
184
810
.815
'17
840
828
UU
422
4.8I
S.40
.010
.841
18.7
4'2.
2411
221
2..
'l1,
88ut
lHt
1114
1778
1811
1814
1788
l1t
120
1882
14.

TABLES
EXENSE AN INUT B.REIONB(SM"" -"' Lo)
KXAD ASSETII!.RA. HOSP SMSA ROSP SMSA HOSP
-an.s 2111.8 2"2 'JU 11.1.0) (-0) U.) 2"') 1.H)
11. 11.71) US)
...)
BFP .UI 1"'0 .HI 1S.1..) (-I)
(....)
21)
GOV IU' 2,. USB(1.0) (T.o US)
saov 11. l1. 01" lt0 -4.881 -2.(.H)
..)
11) (-1," 01) HIT)
111.1 .0101 8.021(B.01) 1T) (1.')
41.
...
fo2& 24.("1) (1.')
(...)
(UT) (1.0)
II. 102
....
(s.7I) (s..) (u.)10. nTl
....
I21 -1..1
..)
(2..) (1.T)
..)
UO)
nU(-I) 2.,,(-1) 0'1 OUS.o) 1T) 1..) (-.s) SB)
1.814 1.,(-1)
...
11-1) ISfS'1)
(....)
to)
0"'(-1) """(-1) ""1 100(UT) 01)
(...) (..)
12)
181.. .aU 41.(UO) ("'T) (B.
B"" .0111 "'''(-1)(1..) (1.1) (1"') (1.11)
-IU1 .011 1.11
("'10) .H)
(..,.)
.I) UT)
114
....
1.01 1.s18(-.H) (1.0)
..)
(U')
11.
....
1481 IIMS!TO) .A) (1"') OI)
.G1n 018-1) ..n( -I) -I.B(") 01(-1)(1.') (1.11) (1..) 11)
..)

FTEBHOSP SMSA ROS SMSA
781. D181 0113 SI. 4.8.
(3.0) (1.') ("'0)
('.
0') (1.1)
tUIS 0'" 11S fli"
(....) ..)
(1..) 1.8)
..)
U8("')
....(-
1SO 1030(1.')
..) ..)
1.8)
..)"'.
11("')...o
"'. ."(-
22101.8)
...)
1.'). US) 1..)
..(..)
u..(..)
.... ...
(2.') (1..) (1.') (2..) (1.')
.om 1.80("') 1.14(-
...(..)
1"7(1.8) 00) (1.8)
..) ..)
1SS .sliD -3.10& 21.
(...
so)
..)
(-1.8)
..)
lee. 111 UUl 1.1171.') 8') SO) (1.0) 11)
111. 100 I'I" 187('5.')
("'.
8') '0. 04) (...s)
-e. 0116
..... ...(....)
(8.
..)
("'2) (1.') ('.0)
11" 8"(-) 1.37(-4)
"'(-
(1.0) 1.1) 00)
"") ..)
11.3 1::1 1.318(2..) (UI)
('''')
0(")-
"'''(-)
('8. (2.8) (U')
Q4. 841T 20... 24.
(.....) ('.
(U"') (U.) (U')
18;18
....
111 2."
(...)
(U') (U') (.H) (1.')
-en.
...
.3111
....
-41.11
(.....)
(1.7) 71)
("',
1$)
118.8 IIO -I.OSI -8,(2"')
..) ..)...
118 151
....
llnaU'. 1811
..... ......
24.
... ..., . .

RESULTS
should limit the number of hospitals allowed to maintaincertain types of costly equipment. It could be argued thatsuch an efficiency is not passed on in the form of lowerprices because of the lack of price sensitivity on the part ofconsumers.
If this explanation were correct, however, one wouldexpect that hospital size would also be negatively related toexpenses. Instead , as is evident from Table and detailed inthe appendix, expenses are positively related to size, perhapsbecause larger hospitals tend to offer more sophisticatedtreatment to a more complex case mix.83 Since the expensedata are aggregate, rather than by disease code, it is possiblethat, despite the presence of other variables discussed belowthe size measure is accounting for some dimensions of casemix.
Interestingly, prices are negatively, albeit for the mostpart insignificantly, related to size. Thus if there areeconomies of scale, they appear to be passed on in .the formof lower prices. Therefore, the argument that the differenteffects of concentration on prices and expenses merelyreflect size economies tha t are not passed on to consumersappears to be incorrect.
Similarly, while higher concentration might reflectefficiencies due to higher Occupancy rates, hospital andSMSA occupancy rates are specifically held constant in theregressions. It seems, therefore, unlikely that the estimated
negative correlation between concentration and expenses canbe explained fully by standard efficiency arguments.
This discussion does not imply that none of thequality" competition among hospitals is wasteful, or that no
efficiencies result from increases in hospital concentration.Rather, it appears that increased efficiency may be one of
IS Quadraic Jn..UNI of hOlpitai 81.. 'f "80 included in .arier
..-
.iona, but; did not h... an, .ianificaDt .a8Cton hOlpital 8X.

SECTION IV
many effects of increased concentration, but, if present, doesnot directly benefit consumers. Unless all Quality competi-
, tion is wasteful, increased competition appears to give
: consumers higher Quality for the same price as the lower
Quality care offered in more concentrated markets.
Alternatively, since the expense data may not hold casemix entirely constant, the observed negative relationbctweenconcentration and expenses could mcrely reflect the fact that
urban hospitals (whose markets are generally less concen-trated) tend to offer more sophisticated care and take careof sicker people. Once again, these factors have beenaccounted for; population density as well as location in
large city are included as explanatory variables. Moreoveras Scction 1I.C.2 explained, variables measuring the effect oftcaching status and the proportion of cases that are birthsare also included to account for case mix variations. Severalof these variables are significant. It seems unlikely thatremaining unexplained case mix diffcrences are sufficientlylarger in the expense regressions than in the price regres-sions alone , to cause the difference between the price andexpense results.
Regressions in which the four firm concentration ratio(CR4) is substituted tell essentially the same story.8& Table6 shows the CR4 coefficients from regressions identical tothose shown in Tables except that CR4 has been substi-tuted for HERF. Since none of the remaining coefficientschange substantially, the other results are not reported. TheSMSA level results, have a similar pattern to those using
84 Thi. conthl" with nculat.d airlin.., which, when allowed to compete OD.
price, lowe prica at weD.. quality.
85 A. two-firm eoncntration ratio .... al tried, with YU7 aimilu naulta tho uainl CR4. The total number of h08pitab in the ma.t ar. ... al
lubitituHd . ror the H.rfndahl .taU-tic. 1& did not prouce pariculary aipicartraulh.
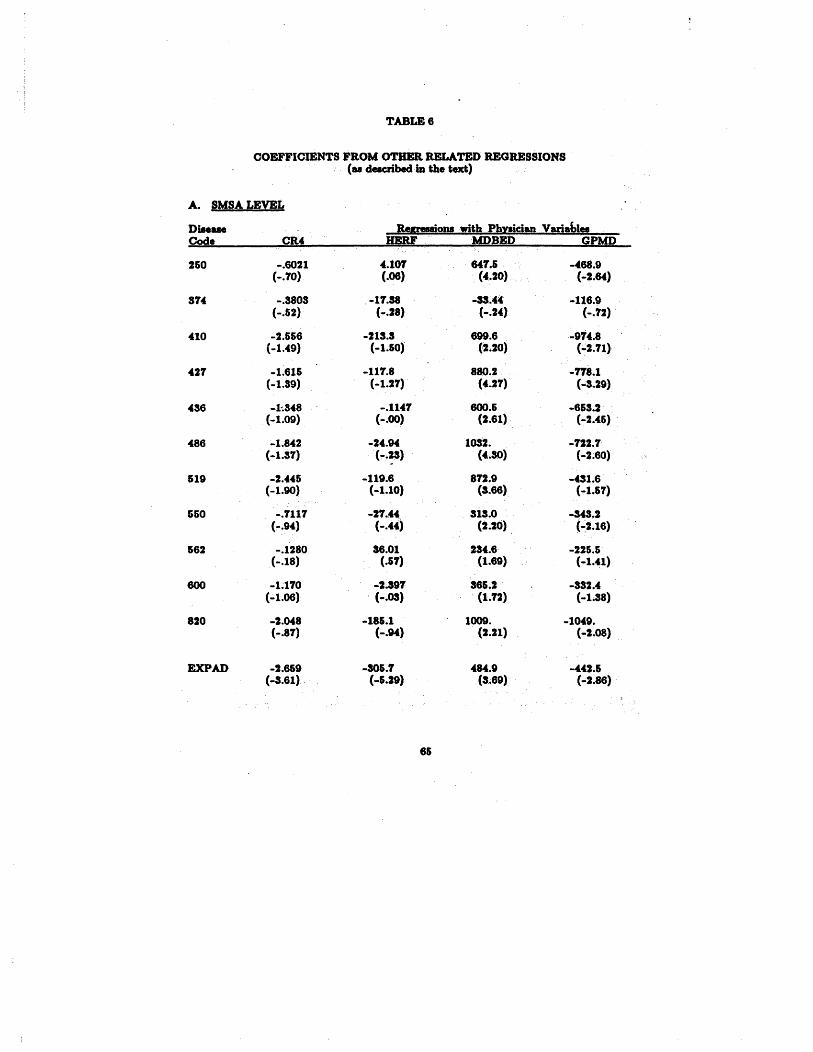
TABLE 6
COEFFICIENTS FROM OTH RETED REGRESSIONS(u dacbeln the te)
A. SMSA LEVEL
Retnionawith Ph ician VarablesCR4 DERF MDBED GPMD
6021 101 641. 468.10) 06) (400) 64)
3803 11. 33. 116.&2) 28) 24) 12)
566 213. 699. 914.49) &0) (UO) ("2.11)
616 111. 880. 118.39) 1.21) (401) 29)
348 1141 80. 6&3.09) 00) (Ut) 206)
842 24. IOS2. 122.37) (4.SO) 2.0)
446 119. 812. 431.690) 1.0) (3.6) 1.1)
1117 21. 313. 343.94) 44) (UO) 2.6)
1280 3600 234. 226.18) 61) (1.69) 1.41)
170 391 36&. 332.06) OS) (1.2) !.8)
048 18&. 100, 1049.81) 94) (2.21) 08)
6&9 SO&. 464. 442.61) 29) (3.69) 2.6)
""..".~~~~ )!!",

'SPtTAL LEVEL
88iolU with Ph ician VanablesHERF MDBED GPMD
62. 100. 116.67) (8.01) 70)
11. 169, 103.19) (1.97) 81)
1361. 68.63) (6.78) 18)
13. 1119. 221.316) (8.42) 1.6)
40. 1094. 119.34) (6. 16) 48)
21. 1357. 144.18) (7.71) 68)
19. 1141. 114.16) (6.65) 46)
43. 465. 152.66) (U6) 1.06)
SO. 420. 89.(1.9) (4.2) 71)
21. 618. 17.22) (4.06) 08)
50. t798. 230.24) (6.45) 48)
145. 661. 77.08) (1.67) 54)
_i,f..
RESULTS
HERF. In the individual hospital regressions, the coefficienton CR4 is generally significantly negative. However, itsmagnitude relative to the depcndent' variable is usually muchsmaller than in the expense regression.BI From theseresults, it again appears that price competition offsets atleast partially the effects of costly Quality competition.
In no case, however, does the magnitude of theHerfindahl coefficient suggest that market structure, asmeasured by a Herfindahl or concentration ratio, is asubstantial determinant of price or expense. As Table 7shows, a .01 point increase (100 points when the Herfindahlis measured on the familiar 1- 000 scale) in HERF leadsto .09 to - 03 percent decrease in price and a . 17 to .percent decrease in expenses. The effect measured using CR4is stil smaller, ranging from a .008 decrease to a .001increase in prices and a .008 to .0 II percent decrease forexpenses when CR4 is increased by points.
The share of proprietary hospitals (SFP) shows auniformly positive and often significant coefficient in theprice regressions at the SMSA level and a generally insigni-ficant (but also positive) effect at the individual hospitallevel. The expense regressions indicate no significantrelation between for-profit market share and hospital costs.This suggests that cream-skimming is not the primary ,forceraising prices in markets with large proprietary market
86 No direct .tatiatical 0( the coecient. &Cro price and
expe"" reioDl is meaninaful Ilc. tbe price ncioQl conce individualdiM"" while the exn.. equatioDi an mo. ac'8te. Auatinl. npre-Mntative price varabl. 8C diM.. cat.ri.. i8 Dot poibl. beaU1 the dat-Nt contuna obMaUoM on ever diM.. catqo17 ani)" for the lareat h08pit.l8.
87 A 100 pont iDere.. ia the cutotr under tbe 198 Deparment or luaticecuidelinea for wben one mat -ri0Ul,. inv.tica . lnereef if the level of theH.rrmdahl index i8 in the raee of the aver maret .tudied here.
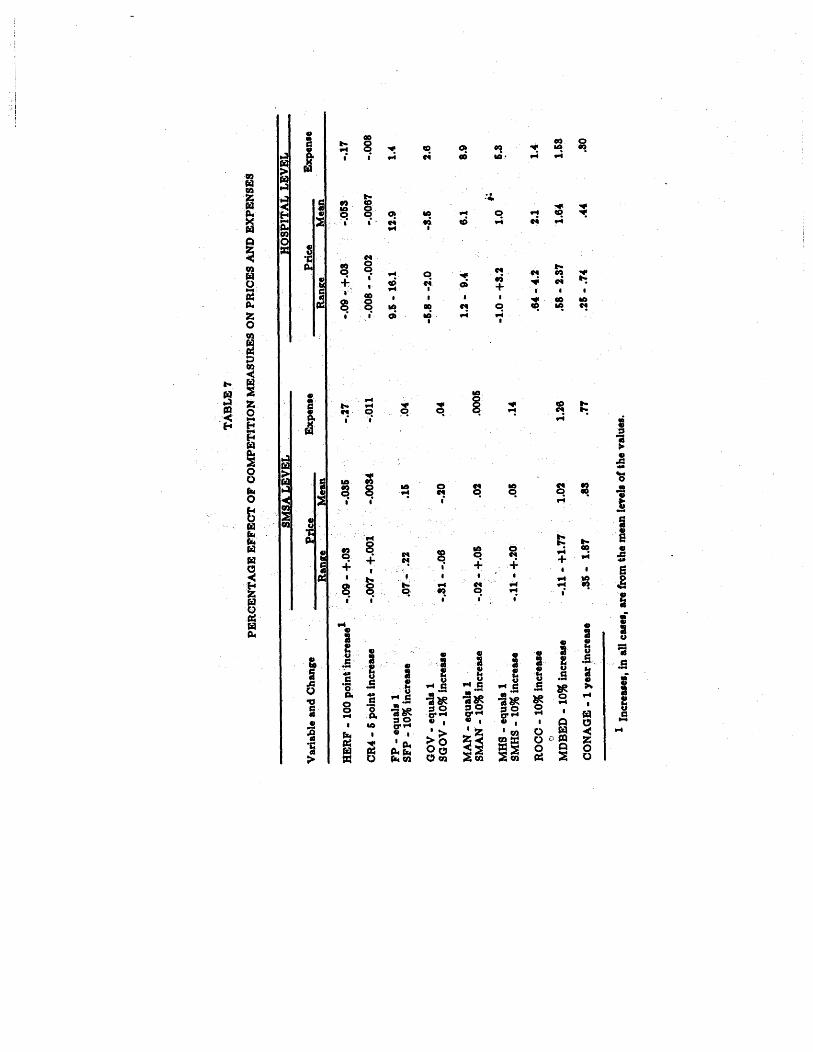
"'r.
.,
ND EXPENSES
HO
SP
ITA
L LE
VE
L
Exp
enl.
Kan
a:. M
ean
.nan
a:e
Mea
n
----
HERF - 100
point increase I
09 - +.
035
09 - +.
053
:y.
OR
O(
- 5 point increase
007 - +.
001
0034
011
008
- -
002
0067
008
FP - equal.
5 - 16.
12.
SFP
- 10
% in
creu
e07
- .
GOV - equall
8 -
-8G
OV
- 1
0% in
cr...
.31 - -
MAN - equals
2 - 9.
SM
AN
- 1
0% in
cre.
..02 - +.
005
MHS - equals
0 -
+3.
SMR
S -
10%
incr
ease
11 - +.
RO
CC
- 1
0% in
cr...
.64
- 4
.
MD
BE
D -
10%
incr
e...
11 -
+1.
1.26
58 -
2.
1.3
CO
NA
GE
- 1 year increase
35 - 1.
25 -
.
1 Increasel
, in
aU c
ases
, an
from
the
mea
n le
vels
of
the
valu
es.

ECTION IV
or- bfit hospitals either enter intotarkets or higher prices represent less
dummy variables in the individual)rovide additional information useful ino remaining theories. For-profit hospital:hly significant positive impact on pricey negative effect on costs. These resultsary hospitals charge prices that are, on.igher than those of non-profit hospitals.previous work showing that for-profit
to generate larger margins.DO It alsositive coefficient on for-profit marketnot" only to the fact that proprietary
most profitable markets, the effect of:asured by the for-profit market shareo their own pricing policies. Jf the,on-profit and proprietary hospitals weree dummy variable denoting the proprie-lid be insignificant. This suggests thatless control over pricing in proprietary
re must share the rents with hospital
all diM.. catqri.. ri. the nduction of CI-cn8I-8irn dou not hold. While cn-lkin.at. miCht prouce uniformy hip_I' prica, it would
r and Hadley (108) lound that tb. chan.. in marethOlpitab bet..MI 1873 an 1082 .... lificaatly
han.. in non-profit. hOlplt.' nvenue-t marDl,P'.th an tlM for-prot chuM ' 1973 ma.t .han u on chua in proprietar chain maret alan;
reent atudy by lA.in and Auat- round thatchar 21" moN than Dot-for-prot h08pital.:har.. 21" More: Study: Modem Healthcar, 7/5/85 at

ian charge for hospital services mayrit hospital is involved, there is no:sults, tha t the en try of f or-profi t:r prices for the hospital-based
proprietary hospitals are insignifi-'se of non- profit hospitals. When a: tax payments made by proprietaryfrom each for-profit hospital'coefficient on FP becomes, notnegative.Ql This
suggests that for-er input costs. This wil be tested
Ire of governmcnt beds (SGOV) haspact on prices. The effect on
tive coefficients on the individual(GOV) suggest that government runrge lower prices. Public hospitalIe of private non-profit institutions,is . insignifcant at standard lcvels.:ct, it is not surprising that many)spitals are currently facing bank-iroprietary hospital chains.
managed and system hospitals sharesice are not particularly significant.rficients on the SMAN variablcs toit rarely ' significant, whilc those on ., insignificantly negative at least at
:vel. Managed hospitals may have

tele of such hospitals. The expense,ignificantly positive co.officients on both\.ny areawide efficiencies that obtain from)r ownership appear to be at least offset
in service-facility use perhaps generated by aality competition.
lividual hospital variables show that the effect ofgement (MAN) on price is positive and sometimeswhile that of membership in a multi-hospitalIS) is generally smaller and insignificant.managed and system hospitals are significantlythose of unaffiliated hospitals, and, as Table 7
nagnitude of the effect caused by affiliation isxpenses than on prices. This may partly resultct that many financially troubled hospitals are.y management companies or system hospitals. 11Owever , to justify the efficiency arguments made,pitals.lIs These results are fairly consistent withoutlined in section II above that suggested that
;ystem h()spitals generate higher profits10 not suggest). they do so through higher)Wer costs.
of the population belonging to HMOss a generaIly insignificant coefficient inice and expense regressions. It is signifi-
.t.'v.
.II maaated h08 t'" , in the .ampl. wen for-profit. Inlanap hOlpital that ar prprietar ia 66" with 86" ofraedChaiu Continue Expaon Ig85 Survey Shows6 at 76)II COUI" that manap and 8Y.t8m hOlpital. provide bilher
bu.. .m- __8n1 unlikely .inee their priCe an not uniformy hipet.
e individual hospital level regressions.
the change in HMO market share fromI) shows a uniformly negative and oftenIt. From this set of results, it appears:ed enter first into the most costly areas
, subsequently leads to lower costs and
home bed-population ratio (NHBED)Isignificant coefficients in both the priceions, except for the individual hospitalere the coefficients are mostly negative
icant as predicted under the competition-Overall though, nursing homes do , not
bstitutes to hospitals.
iician-bed ratio (MDBED) is included in, its effect is always positive, and mostlyn both the SMSA and individllal levelin Table 6.11 The significantly positive
that while . HMO. exte in M of 2"9 SNSA. in IG77
if 30 .t.tel, mot wen found in the W88 CotS,.te."I . be exlairM pariay by. the celRphic loation ' of
rial dumm varab.. .tim_. the tipcan 0( the'he -eat cou' dumm varable il hi&hly .ipificant.
tee in Califomi., pariculary durin. the .ample period,
racllti" and outpatient lurli-centen bave al deve-ompete with h9lpitah at 1..., for limple . proedUr.h~-eyer. at the tim th. ' daa for thit .tudy .er
ne from ftrrioRl identical to thOl ,bOWD in Tableaand GPMP have
..
added. Th.... SMSA-wld.o ie uudin both &he ....t. ..d individual hoepltalIpital-'p8ific meuure (of the ratio of al pby.ici&n

REBUL TS
on the physician-bed ratio in the expenseas well suggests ,that more hospital inputs aremore physicians are present, but it is impossible
.ish whcther higher Quality or less physiciancr input use produces this result. It is cleart physicians do not act primarily as substitutes forIS.
Iroportion of physicians who are general practi-'MD) has a universally negative and often signifi-icient in thc SMSA level price and expenseas expected. In the individual hospital reg res-
both prices and expenses, the coefficients arenificant, albeit sometimes unexpectedly positive.
ion of the physician measures in the regressionsffect on the other variables' coefficients. In thehospital regressions it tends to reduce the magni-ignificance of the structure variables' coefficients: negative. This suggests that, as hypothesized:tition among hospitals is for physicians.
clative occupancy rate of a hospital (ROCe) hasd positive and significant effect on prices in most
Iding constant the hospital's own occupancy rate.umably affects costs, the higher its occupancythe average in the local market,. the more power
: pri.Uelf at the paricular h08pital to the Dumber of be. at theId be U8 in the individual hOlpitai naion.. nata ar not. .tud,.. however I to compute :Iuch a varable.
.ion of . phpidaa-polallo ratio (MDPOP - Dot in the repo" lurprinc,. tend8 to reuce (but not eUmnale) the lipificanc8
.11. pnT8.Qan-be ratio. (The colatioa betwe MDBED and MDPOP is . lig.()POP fUe is alw. poitive and J' liplficaat , 80rutima more 10 thaDBE If onl, MDBED wer , lipUcant, it could be ....urinC ani,. a Nt.ti".t)rtac of h08pital . be.; . the adtIonal aicnilcance of MDPOP impU.. thatyaicianl therDlv. inRuence hopital prica. and 8XnH.

r price. w nile tne posi ti ve relation, by itself. could also be explained
wherein a hospital's higher Quality: demand, the relative insignificanceof the effect on expenses does nottheory.
CONAGE and S1I22) do not appear totures. The coefficients on CONAGEItly positive in the price regressions
SA level, while those on Sl122 arein most instances. The SMSA-level
I a significant positive coefficient forl negative effect on expenses, but ishe individual hospital level. The:oefficients at both the price andGE suggest that such regulation does:xpenditures, but rather leads to aresources. Using the mean, level ofJggest that states with CON laws onexpenses that were 1.8 to 2.6 and 1.2spectively. than those without. Theedicts higher prices and/or lower, supported by these regressions sincees appear higher. These results areIf the literature on hospital entry
, both mandatory and voluntaryion programs (PRM and PRY) fretly negative impacts on prices. Notof mandatory programs is generallyant. The effect of both on expensesppears, therefore. that the primaryIlation is to reduce margins, but not:nt operation.
iduals have been plotted and at leastalter plots appe,lr ran(\om. The

RESULTS
iously violate normality assumptions; if
tern exhibits slightly thin tails. Logthe data removed any semblance of
id not change any of the results substan-
rather than per case, has also been used
riable. While thorough testing of thisIt been undertaken, the results do notdifferent.
Immy varia bles to measure nine geogra-:he U.S. does not change most of the
effects significantly. Of the regionalone representing the Pacific states98 hasIe) effect. The size and significance ofj with the regional variables; since many
Caliornia, this is not surprising givenIe Pacific dummy variable.
cification of Concentration and Entrv
:cifications of concentration and entryinappropriate. Concentration may notuesholdis reached, artd the effect of abe noticeable until it is well-established."'0 dummy variables were substituted fordiscussed in the previous section. They was set at one when the Herfindahleast. (3000 on the familar 1- 000..ise. Siinilarly, an entry dummy wase only when the CON law was at least
Californi.. AI...... and Hawaii. New ' Eqan il the

TABLE 8
)NCENTION AN ENTRY BARR'UM VARLESLmmv CONAGE Dum)SP SMSA HOSP
12. (2.66) (2.0) (2.06)
18. (3.60) 18) (2.9)
266. 183.(6) (U9) (4.3)
321 101. 62.1(4) (2.() (209)
99. 109,61) (U6) (3.2)
OJ( 129. 10:.23) (2.96) (3.31)
116, 90.69) (2.8) (2.90)
28. 41.61) (1.8) (U8)
1(.94) 62) (1.3)
41. 66.6() (1.() (U6)
114. 197.16) (2.6) (302)
(1.00) (1.94) ((3.6)

n 1977).
icients on these two variables and the:ts they represent are shown in Table 8.stly confirm those discussed previously. Since
on the remaining variables did not changey are not reported. The regressions usingabies appear to fit the data about as well as
ar specifications.
concentration appears to have no significantices but is significantly negatively related to
,rice coefficients suggest that prices are. 7 toer (albeit insignificantly), while expenses arent lower, when the Herfindahl equals or
that is at least three years old raises both
Ises significantly. Since prices may increasecentage than expenses (4.0 to 4.9 percent oneleven prices versus 3.3 to 4.0 percent fors appear to ipcrease slightly, and CON lawsstrict entry. Stil, CON's strongest effect is
Jst-raising inefficiencies which are passed onIf CON' s primary impact was as a carteliz-
nses should not increase as much. Interest-:entration and a well-established CON law
ffects on expenses that are identical inIposite in sign. This suggests that whenxist, the reduction in quality competitionlessening of efficiency. In this case,changed from the state where' neitherlent. Since prices are higher, however:ased.
:r specifications were also tried. Rather
0& for both yarab.. wer tried; theae to fit: the

..- IIUUY"" '"U"" ....n...." ...........- --.........
,...
Interactions of the price and CONariables were accounted for as well.used to test whether the existence of
hat would prevent the erosion of supra-as necessary for high concentration toteraction of the level of concentration
with the existence of a well-established:sted. As mentioned earlier, alterna iveied. None of the interaction variablesAce Done of these alternative specifica-. to those discussed above, their results
etition is important, input use is in , partdegree of competition. Therefore, itIte to include input measures as explana-: price or expense regressions. Instead
the effect that our measures of compe- .IS, regressions were run with inputs as
Table reports results where full-,nnel per bed (FTEB) and assets per bed,dogenous, variables. The regressions arethose run on prices and expenses,u1O
;ling variables are discussed.
lured the Herfindahl statistic
I that; input UM i8 detennMd . byc:mptitiveO:U. cOl. futo. and a derived demand from tbech. apefication HelM appropriate. The
-...
,.lrqOD aice it i8 lik.ay to be .ndOceno8;the relfioM in thi8 Itudy.

RESULTS
,ve a ncgative effect on input use, but is onlythe individual hospital personnel regression. If,etition is important, as is suggested by the,ssions, it is surprising that this variable doesmore important influence in the input regres-s other unmeasured inputs are also important.it hospitals clearly use fewer labor and capitaled than do non-profit hospitals. These results:hey may engage in less wasteful input competi-suggests that they do not offer a higher Quality
payments and additional financing costs appearreduction in input cost.
lospitals appcar to use more personnel than non-lIs. This may be duc to their , on average , olderphysical plants. Since assets are measured net, the negative coefficicnt in the asset equation
:cts this age.
hospitals, and perhaps managed ones as well,e more inputs per bed. This explains their11 expcnses and confirms the initial suspicion
not more efficient (at least in terms of inputr independent counterparts.
in HMOs apparently reduces hospital input use
"eating pressures for cost reduction. A rela-umber of nursing home beds in the market, on
, leads to greater use of personnel by hospi-y reflect a sicker clientele in the hospital.
her a hospital's own occupancy rate relative toverage, the larger its use of inputs. Moreover
ii's absolute occupancy (OCC) (or theI the SMSA), the greater is the use ofThese results are plausible: the morethe beds (as reflected by their rate of:r the demand for complementary inputs.Gt appear to depend significllntly onIf the occupancy rate of any given

tcs over time, it may be easier to adjust inputpersonnel than by changing the amount of
IS do not appear to affect input
;pitals use substantiallyapital inputs per bed.
grea ter
V. Conclusion
:al work described in this study suggests that
,tructure in 1977- 1978 affected competition in
Istry. A linear regression including Herfin-tration ratio measures of market structure,ese measures have no significant impact ondo, however, have a significant negative:nses, where the effects of facilty-service:ition and/or efficiency are isolated. Thea relation between market concentration andwith the negative effect of concentration on
, that the price of a Quality-adjusted bundle
could be measured) does fall with reductions)f market concentration as measured by amcentration ratio statistic. The coefficients,t that the magnitude of any effect of
itself, was small in 1977-1978. Regressionsdummy variable denoting markets where the
, I ..t .3 (as measured in this study, or 3000conventional 1- 10,000 scale) Cor the
ssed above confirm that concentrationon prices but negatively influences
.ares with other work in the field theQuality accurately, and it is thereforeice competition. The evidence collected, suggests that in 1977-1978 price anddid exist and were greater in lessi. The results suggest that hospital:penses fall with increases in hospital, where expens are interpreted as
therefore, appears that normal competi-e hospital industry. While it might bega ti ve correIa tion between expenses andeconomies of scale that are not passd
5 Section IV. above discusses, suchprovide the full explanation for the
Since standard economic conditionsth price and Quality competition amongreasona ble, for the most part, to use

----------- - -
equipment across many hospitalssk that a particular patient at at not have immediate access to theogy, this benefit comes at a high
ns such as Certificate of Need lawshigher prices. Higher expendituresse results are 'more significant in theation than in the linear measure, but
'ant coefficients are positive. Theny variable suggest price increases orcost increases of 3.3 to 4.0 percentence of a well-established CON law.It CON programs have at least led tocations and may additionally haveitive pricing through their entrY-his study provides no evidence toI have reduced resource utilzation.appears to have reduced prices but
o earn the highest margins in areasation and a well-established CON lawnot appear to be a direct interactionand entry regulation. Since highlatively low expenses, while a well-related to higher prices, the combina-rgins than in areas where only one or
lmined the behavior of new ownershipIS in the industry, such as proprietaryhe evidence suggests' that for-profit

CONCLUSION
ed price competition, but appearprofit-maximize in markets whereely inelastic, as well as perhapsr physicians. While their expenses
rent from those of non-profitIbstantially higher prices. Theevidence of grea ter efficicncy on
ita Is. It is possible that for-profitbut offer a higher Quality service
:xpenses are the same as those of
their input use is lower, however
'ides no evidence to support theand system hospitals are moreones. Expenses for both formerThe prices of managed hospitals
than internally managed hospitals.)n prices and expenses of beingsmall. Since the data used' in thisajor expansion of the large chains
ems, however, these results should
If the medical market in the latcI that hospitals focused many ofIn Quality dimensions. It appears
,int on prices was that imposed bylate insurance premiums to coverence suggests that consumersto differentials in premiums. lo2
red during the 1970s as medical
'. bHn inltituted only in th. lut few y.ars.I copaymentl weAl Iman and ra.149.

IS alSO saw their labor costs rise due,ation of medical care benefits.
however, it appears that sensitivity,articular, corporations have becomelout the proportion of their expenses
,tion of employee health benefits.increased their search for alternative
, in some cases, have establishediDS. 106 In efforts to contain costsld their coinsurance rates l06 and
nbursement rates between in-patientto create incentives for greater
heaper alternative.
s of arrangements have developedider Organizations (PPOs) where a
J6 when Medicar/Medicaid wen enacted to 7.
be data for thia.tudy W4fe collecte.
lounced that worken at ita new Saturn plant will.urace arcernntl. Gooyear and Continentalteical COYera. while. Deere hu atabU,hed . italOBS Hiclichta H08Ditala S9. Decembe 16 1086,
lOunt , of .ac biD the patient Dlut pay' out 1"8). the pIrcntap, of camA.. offuifullI declined frm abut GO to arnd. 50 In the la"foa1lh c.. Cota: Ne.. York Ti... 3/3(86 iCaI La Health I08ul'ce: HOiDital. 1/1/86 atploT" Attltud- on Cot Containment, Equitablen: 1986.

CONCLUStON
If physicians and hospitals are promised all of,lan s subscribers and prompt reimburscment incoun tcd ra tes.107 While the results of thishat in 1977- 1978 , HMO membership share wasy, positively correlated with hospital pricesIMO arrangements may initially have becnIe costliest areas. HMOs are much more
well established now. loa While no rccenty of their effect exists, the incentives theyltimately lead to greater price sensitivity, ifn the part of patients, then through theirrance, or on the part of their physicians. logIselves, are forming HMOs and offering moreIre through them.no Finally, alternative
ha ve arisen to challenge the traditional:s of fee- for-service physicians and hospitals.many types of surgery are now done in
r commn:ial inaurace care" 'pon80r either HMO. or PPo..CI' or Blu. Shield . plan. in S8 .tate ofer them ..tiV8 Delivery Scoreboar for lniuren HOiDitall 1/18/8&)"80 bellnn!nll. &0 'ponll their own PPO.. ("H08pltal Chain
!rican Medical Ne... 4/21/" at 3) 326 PPO. exated byof which wen joint ventunI betw..n phpianl and hOlpitallponare by h08pital. ("Induatl' Trencb: 1986 Hilhlicht.,
MI, 16, 111&, al 61.
to the National HMO C8U8 IN4
&), ..
of DKeberdun" 16.7 millon rnben, and enrolment had incrue
8UrY.Yot COIu.mer Mnliti"ity to h08pital pric.. foundV' "'. where HMO. ar .till moat peuiYtI to be the I't8umen SeDlitiV8 &0 H08p&tal Cou?" Romitala. 2/1/86 at 88)
10 h08pital ban for an HMO with 80 paicipatinc.rtl witb at ....t. 1 employ.n. includinC the COk CountyJital,: Bulldinc Diur Mouatrap8 to Snar Your Patienb11/12/84 al n)

J --- __a "-
-- '
..-.... --. -- -- -. ___A
their room and board rates in the lastBusiness and consumer coalitions inlIected and published information on,e major hospitals in their areas. us
imary car centera exted at the beginninl of 1985
1980. Such centen did not exlt durin. the time
lilted here. Hoapital in 80 aru have becun tofor eligible patientl. ("HOIpitallndultry pri Wanat 69) HOIpital priC8 lell lrom 1983 to 198,. lor
tecoria lurveyed in Columbo. Ohio. ("10 HOIpitaillca on Some ServiCe HMDjtala. 5/16/85 at 31) AI competition by MucinC rom rat.. by 20" whilemel'ncy deparment fed. (" Trends and TopicsIe hOlpital hu adverliHd in the Wall Street Journal:OIt $300 lea per patient day than thOH or it.rvic.. touted in Wall Stret Journal Adl MOdern
linetn. D. I National Capital Ara Health Carcarprationl, inlurce compaiea. unionl; trae
roviden ilCUrntly conductio. a.une). ("ShoppiDI. P08t. U/14/84, at D7)AI, Chic: pubUsheonen Your.Medicai Cou. Chicuo. 8/84 at 186) .. didaul. The Blue CI' AaiatioD of Columbus, Ohio
Ohio ' 81u.. PlanPrib Booklet' Latini TreatmetModem Health Car. D/1S/85 at 66) Sav"" .tat..I at publhed suney. On.. such company. Quakermeical COiti per ..lar employ.. reu neary 71084 .. . rault of . PDlra cot. COtrol pro-pit"''' Ne. York Time. 4/2/66 at D2) as bealthd d.ta on health can COlt8, and 20 prouce price

CONCLUStON
Several states have authorized the negotiation of fixed feecontracts between insurance companies and doctors andhospitals.114 In an attempt to control hospital expenditures
..;,.u.. which accounts for over half of all hospital pay-duced its Diagnosis Related Group (DRG) systemcment in October 1983.116 This program appears
iminished hospital utilzation. The Americansociation reports that average hospital occupancyfallen significantly since 1983.116 Moreover, the.kforce decreased by 3 percent. Utilization dimi-he entire population rather than only for patients
(those covered by Medicare), suggesting thaturance companies are also price conscious. 117
several states, Blue Cross-Blue Shield has nego-hospitals for DRG-type reimbursement mecha-
In California , hospitals bid for contracts to treat
lel. ("H08pitallndultry Price Wan Heat Up, HOiDital.. 10/1/85 at
;h Inlurace on the Stat.hoUH Floor: lQ85 Project JURI H08Dital..
thi.pro, hOipitalan reimbuned a rUt amunt per paUentermned by . cl..ifc. ion .ystem of 460 din.. catel(ri..patient' I.n of stay or treatment complety.
Ipaney ra.. fen to 84 peent of .tafed hoapital be durine ther liH ,from7l pent. year prwiou.ly and 77..( durine the firat, dapit. tbe Ibuttin down of IInt be. Thil decline raulteD both admiODI rat.. IUd Iecth8 of Itay.
n.. Decin. for . Natio' , H08pital Arrrican Medical Ne..HOIpitalLoins' Radl" AH Study Findl American Medicil
.t 28.
. CI' or Northern Ohio nquire hCMpitai. to bid for iu contnid.any IOH only 70" of their bill. CBu.inen Week. 12/24/84, at

ollees. $500 nprogram. llD
, in the last few pages suggests thatue to extensive third party coverage" may be diminishing. If this trendbe surprising if the form of competi-uses more on price dimensions and, if
les less concerned with Quality. Thistition in 1977- 1978 should provide aich to measure industry changes.

is often thought to have a positive effect onor most forms of health care.120 Evidence onincome on total costs is mixed however. Per
: (PCY) is measured at the SMSA level. Thean almost universally positive, but only
nificant at the SMSA level, effect of income ect on expenses is insignificant.
xtensive insurance coverage is thought toind (or at least reduce elasticity) for hospitalit reduces price sensitivity, as commonlyHersch (1983) notes, an empirical problem existsnsurance coverage is used as the measure ofItection, since insurance coverage and hospitalfact be jointly determined. Various researchers: share of the population covered by Blue Cross
this measure has problems as well. Blue Crossis affected by competitors such as HMOs that
e direct effects on hospital demand.121 Anotherascertaining the effect of insurance is themeasuring depth of coverage rather than mere)epth of coverage takes account of whichcovered, limitations on benefits covered, andyments. Finally, differences may exist between: of private and public insurance plans; inIblic programs may function more as subsidies
n (1971) found an income eluticity ot 47 fol' mean .enlJh or.mal eflect (e1uticlty of .08) on admiioru. NewhouH and
I . Imall (.02- 04) and inaficant e1..ticity for admiiolU.
n of . Blue Cro coer vaable in addition to the varableprivat. inu ce cover prouce an inlicnificantc08ffcientr any other multi. Hencej thue . raulb an not report. It10 if I.. 81ue Shield pluu neCOU.ted diKb from providen.arabl. mipt be nq.tive.

are used to measure the separate ell ectsc insurance coverage. NETINS measurese cover",ge) percentage of the populationIe insurance program.122 Data are onlye level. ENROLLA measures the percen-lation enrolled in Medicare s Part Aprogram. It is measured at the SMSA
insurance variable, NETINS. has thefect on both prices and expenses but ist the individual hospital level. TheENROLLA, has a generally insignificantInterestingly, its effect on expenses is. The differential effect can perhaps befference between the units of observation
the elderly hospitalized population is on
I costler, this would be reflected in:nses. Since the price data are sOlely
is not surprising that no effect is
, (DENS) is expected to have twospital care demand. Its influence isI travel time lead to substitution ofhospitalization. Alternatively, since
are generally more sophisticated than
y attract all of the complicated cases.oulation density might reduce: admis- -average length of stay and have an
ication of private ifturace .. th. proportion ofcaret.hatwere . cover by privat inaurance ...
:OY Thi, varable ._neraly had in.ipificant""port.

APPENDIX
bed demand. DENS is measured at, population per square mile. Into have a generally positive, albeit
, effect on hospital prices andis due to the offsetting impacts ofects or to multicollnearity is notmeasure which may more directlyed case mix is a dummy variable)ca tions. This is discussed below inles.
INCPOP), measured as the percentage:1 1977, generally has a positive and'ices , particularly at the individual:ests that there is some lag in supplyI demand. Individual hospital leveluggesting the substitution of moreises.
:s are used to measure the generalpopulation. These are WELFARE
vel as total welfare expenditures perthe percentage of population that is
ed at the SMSA level.) While theseto measure poverty and thus wereuence prices negatively, both usually;, and at least those for UNEMPLOYh.. "ositive effects of these variables
of cross-subsidization of unin-
are covered by insurance. Thebe sicker when they enter a
y have less access to medicalmore costly to treat. If this
owever significantly positivethe expense regressions as well.
m demands more hospital care,roxies have been used in otherLtUS, such as percentage of the

L.U." b"'.J ""'0-..' ...
al industry is heavily labor intensive,early an important cost. Two alterna-. a wage variable were tried in, the
:sults are reported that use a variablewage paid by the hospital (or in thehospital labor market is probably
ates should be exogcnous. As expectedtrices and expenses of this measure issignificant. Alternatively, since anis affected by the mix of employees atthe measured average wage may bet may reflect Quality competition.of service industry wages in the SMSAe results using this variablc are verynificant for the wage variable itself, sothe hospital wage are reported.
es have produced conflicting resultsnit efficicnt scale and the existence ofnhospitals. Average hospital size hasgesting that changes in technology haveRecent studies suggest about 150.200
num.124 The existence of economies of
renot. on hOlpital .alar pneralYithii vanabl.doe
194 and P. Feld.tein (1919) at 185.

APPENDIX
evcr been well documented; most work suggestsiseconomies set in after abo1,t 300 beds, but the
is in general fairly flat.125 The problem withc cost studies is the difficulty in con trollng forince larger hospitals attract more complex cases,
cely to bc higher. This does not imply that:ient, however.
neasuring the number of beds in the hospitalmeasure either the effects of any econo-
,r of more complex case mix. It has amostly insignificant, effect in the pricesting that some slight economies of scalehe expense regressions, the coefficients aremtly so in the SMSA level expense regres-o itself is insignificant in the hospital levelns, RSIZE is significantly positive. Theseest that case mix is not completcly heldaggregate expense data, and that relativclytreat a more complex and costly case mixhich more tban offsets any economies of10 has a positive effect in the price regrcs-
:esting that relatively larger hospitals maylality service and/or have some local marketr favorable reputation.126
ies have shown th!(t hospitals affilated withnursing schools have higher costs. Thisged, because of the necessary subsidizationby the hospital. However, as Hadley (1983)to Gary Becker s model of generalized
ng, the student should bear the cost. A
Barci . at 108.
H-8Uar ter .u al included to measur the efecta oftiOD. It .ueitberincat or negative (augting and COt function), and its omiion change none of the

lan , Feldman, and Steinwald (19g3) shoing for case mix differences and inco .) physicians, the cost difference between
teaching hospitals is slight.u7 Anothered costs in teaching hospitals may exceedhing institutions is the different waysare measured in the two set-ups. Initals, physicians bil separately (from theil) for their services. In teaching hospi.
salaried and appear as a hospital expense.hysician costs to patients may be lower inthe hospital bil may appear higher.
.. level regressions, COTH measures the10spital beds in the SMSA in hospitals that
f Teaching Hospitals, a group of mostial teaching responsibilities.u8 At the:1 COTH is measured as a simple dummyembership in COTH for a particular;trong positive effect on prices and, suggesting that the latter hypothesis
rate of a hospital should negativelyat least some hospital costs are fixed.the SMSA-average occupancy rate in
;sions and as the individual hospital'individual hospital regressions. Bothand price show the expected negativecases, the coefficients are negative,
:ularly at the individual hospital level.:ssions cannot control for a particular
ciable to ' indicate 8Chool.,afUate hOlpita1. m..,. beH uome..ueed cue ri differences.
: include all h08pitall that' an afliated witb meical

APPENDtx
ccupancy relative to the average which mayI market power. Therefore, it is not surprisingtimated results at the SMSA level are weakerincorporate the offsetting effect. If pricewere strong, occupancy rates might be expected
rices positively since they are negatively related
Ipacity. These results, however, confirm those of80) who posited that excess capacity was one:nsion on which hospitals compete.1
'my variable for hospitals located in SMSAs with)f greater than one million (POPDUM) is used to
effects of the more complicated case mixIUnd in large urban hospitals. Such a control isimportant in the expense regressions where the
:gregated across disease categories. As expected
c has a uniformly positive and generally signifi-ient.
ncluded in the expense regressions is a variablehe ratio of births to admissions (BIRTHR). This,trois for case-mix. Since the average cost of a'Y is low relative to average hospital visits, itsnd actual) effect is negative. It is not included
regressions since they concern individual disease
r, we include one variable which is probably notlogenous, but which is too important to exclude.Igth of stay (ALS), calculated for each particularegory within each SMSA, shows a stronglyand positive effect on price. . Each additional day5 from $130 to $230 to the price in the individual
w (1981) ,uIIUU that one imponant quality dimenaion on whichlie in cOitly competition. on ex caty which reUCei the
.hortace. He . find hat in I.. concentrate hOlpital .maikeb,. are lower. Thi. Could aI imply ,ilnple . exc.. capacity due, to .
..l.tive to prevailing de1nan . how4Ier.

hile length of stay can partially be.ician, it presumably also measureserences that we have been unable toIYS. Therefore it seems necessary
:cted, ALS also has a positive effectIn since longer stays add to the total

as A. Non-Profit Hospitals.
hing Col, 1981.
Boston: Auburn
. "
Case-Mix Differences Between Nonprofitit Hospitals." Inquiry 14 (1977): 17-21.
. "
Cost Comparisons:osp itals. Social Science179): 219-225.
of For-Profit andand Medlcloe 13c
. "
Why Most Private Hospitals are Nonprofit..!icy Analysis and Management 2 (Spring 1993):
d R. and Sloan, Frank A. "Hospital OwnershipIRce." Economic Inquiry 23 (19gS): 21-36.
tael. "The Business of Health Care." Editorialn Post, 4/8/gS at All.
an Betz and Saltmanin the U. : A
Lmer 1985): 122- 131.
Richard B. "HealthStrategic Perspective."
:conomic Theories of Behavior in NonprofitIs," Economic and Business Bulletin (Winter
. "
Relationship of Hospital Prices to Costs."c:s4 (1971): 115- 125.

e Role of Technology, Demand and Labormination of Hospital Costs." In TheI and Medinl Care, edited by Mark974.
Issell, Louise. "The Substitution ofCare for Inpatient Care." Review ofics 54 (May 1972): 109- 120.
nd Miller, James C. HI. Economic:ic Air Transport: Theory and Policy.Brookings Institution (1974).
Ispective Reimbursement of Hospitals."180.
:one, Kenneth. "Does Hospital Rate:r Hospital Expenses?" Journal ofune 1985): 159- 166.
iSA Connecticut Hospital Incentive,valuation." Inquiry 12 (1975): 47-58.
, Jon. "Multihospital Systems:IS." Health Affairs 3 (1984).
Issues
: Changing Face of American Health Care, Emergency Centers, and Surgery23 (May 1985): 401-421.
ecord, K. Michael. "The Relationshipp and Service Composition to Hospital, Finandng Review 6 (1985): 51-58.
ensen, Michael C. "Agency ProblemsJournal of Law and Ec:onomlcs 26

REFERENCES
. "
Organizational Forms and Investment Deci-
'Of Flnudal Economlcs 14 (March 1985):
. "
Separation of Ownership and Control."and Ec:onomics 26 (June 1983b): 301-326.
Competition Among Hospitals: MarketIts Relation to Utilzation, Costs and
tion. Research Note, Hospital Studies; Pub. No. (PHS)gS-33S3. U.S. Dept. of Healthrvices, National Center for Health Serviceslealth Care Technology Assessment, 1985.
,. "
Hospital: Dynamics.
): 853-872
Cost Inflation: A Study ofAmerican Economic Review 61
. "
Quality Change and the Demand for HospitalOtrlca 45 (October 1977): 1681-1702. 'Heallh Assodatlons and the Demand for
he Political Ec:onomy of Heallh. Cambridgeublishing Co. 1977. . Heallh Care Ec:onomlc:s. New York: John
(1979).
t, W. Richard and Ewy, W. "Does PracticeMedical Care 22 (February 1984): 98- 125.
J. and Welch, W.P. "The Competitive Effectscview of the Evidence." Inquiry 22 (Summer
I. "Occupational Licensure in Capitalism
Chicago: University of Chicago Press (1962):

:80 Hospitals Survive? The Newore Markel. Homewood, IL. Irwin
"g and Health Costs.'83): 467-482.
Journal or
Internal Organization of Hospitals:'tions. " Bell Journal or Economics 8
ng Rules for Hospitals." Bell Jonrnal orn9): 224-243.
pctition and The Performance ofUnpublished paper, Wichita Stateof Economics, 1993.
ents and Impediments for Private, the Delivery of Health Services."
Competition and Control, pp. 193-jon Macleod and Mark Perlman.er Publishing Company, 1979.
ross, A. and Hoffman, E.L. "Theia tion: Power, Purpose, and Poli tics
Yale Law Journal 63 (1954): 938-
of Economic Models of Hospitals."97. .
ling Hospital Costs: The Role orCambridge, MA: MIT Press, 1991.
ffects of Competition and Regulationand the Reservation Quality of the
or Ec:onomlcs II (Autumn 1980):
100

REFERENCES
Price Discrimination in Medicine.ad Ec:onomlcs I (1958): 20-53.
Conspicuous Production Theory of Hospitalrn Ec:onomle Journal 38 (July 1971): 48-59.
Ambiguous Changes in Product Quality.le Review 72 (1982): 956-967.
, Peles, Yoram. "Market Structure, QualityBell Journal of Ec:onomlcs 4 (Spring 1973):
, R.A. and Margulies, R. "Investor-Owned'iffer in Economic Performance. " Hospitals
tes. Studies In the Comparative PerCorm-Ir-Owned and Not-Cor-Profit Hospitals.Lewin and Associates, 1981.
!\ssessing the Evidence on HMO Perform-Memorial Fund Quarterly 58 (1980): 501-
Health Malnteauc:e Organizations: Dlmeo-iDee. New York: Wiley, 1981.
How Do Health Maintenance Organizationsiavings
'"
Rhetoric and Evidence." NewIC Medicine 298 (1978): 1336- 1343.
mnker, J.P. and Enthoven, Alan. "Should'legionalized? The Empirical Relation
Volume and Mortality. New Englandne 301 (December 20, 1979): 1364- 1369.
101

, James; Garnick, Deborah; MaerkiStephen. "The Role of Specialized:ompetition among Hospitals." Inquiry14.
Out-of-Pocket Expenditures on Health, Unpublished note, Federal Trade
etrlcs. New York: McGraw-Hil Book
, John R.C. and Feldstein , Paul J.lation on Selected Components ,Iry 19 (1981): 240-246.
Roger. "Effects of Regulation onQuarterly Review of Economlcs and12): 66-g0.
ld, Donald; Shortell, Steven andI Rate Review: A Theory and an"oal of Health Economics 3 (1984):
Frank ,and Mitchell, Samuel. "Statellysis of Some Unresolved Issues."36-47.
Jack. "Interstate Variations in thej Proprietary Hospitals, 1973- 1982."
151.
ward a Theory of Nonprofit Institu-: Model of a Hospital." Amerlc:an970): 64-74.
102

I Redisch, Michael.hysicians ' Cooperative."): g7-99.
The Not-for-ProfitAmerican Economic
REFERENCES
rles. "New Estimates oftedical Care Services." In
Health Insurance In the Health Senlc:esRichard Rosell. New York: NBER, 1976.
The Growing Supply of Physicians: Hasome More Competitive?" Journal or Labortober 1986).
; Manning, Wilard G. ; Newhouse, Joseph P.bert H. "The Impact of Cost Sharing on'artment Use." New England Journal orugust 22, 1985): 484-490,
)octors and their Workshops: Ec:onomlcsician Behavior. Chicago: University of980.
. "
Medical Staff Characteristics and Hospital- or Human Resources 13 (Supplement 1979):
A. "Certificates of Need for Health CareDissenting View." In Regulating Health
structlon edited by Clark Ha vighurst.. American Enterprise Institute, 1974.
Diffusion of Technological Innovation,fit Firms: A Case Study of Radioisotopes inJournal of Ec:onomlcs and Business: 108-
and Luft, Harold. "The Impact of Hospitalre on Patient Volume, Average Length of:ost of Care." Journal or Health Ec:onomlcs
103
I Supply and Hospital Utilzation:" Hospitals 35 (1961): 36-42.
)rietary Hospitals in the United States.or Health and Medical Care, edited byIon: Macmilan and Company, 1974.
Rology in Hospitals: Medlul Advanceson. Washington, D.C.: Brookings
Ipetition Among Hospitals." in Competl-:are Sector: Past, PreSent and Future,by Warren Greenberg. Federal Trade
lice , Theodore. Hospital Certlf1ute or'pact on Investment, Costs, and Use.merican Enterprise Institute, 1979.
Market Structure, Durability ande Survey. Ec:onomlc: Inquiry 17 (April
Flood, Ann Barry. "Cost andA Review of the 'Literature.5): 213-261.
QualityMedlc:al
,,-
Hospital Cartel Theory.
, 1977): 1-20.Journal or
Jr. "Wall Street and the For ProfitIt Companies." in The New Health Care35. 50, editcd by Bradford Gray.
lational Academy Press; 1983.
104

REFERENCES
1\. "Hospital Rate Review: A Theory and aneview." Journal of Health Ec:onomlc:s 3 (1984):
' "
Rate Regulation as a Strategy for HospitalI: Evidence from the Last Decade. Mllbanknd Quarterly 61 (1983): 195-221.
. "
Regulation and the Rising Cost of Hospital;W of Economics and Statlstlc:s 63 (November:7. .
Feldman , Roger and Steinwald , Bruce. "Effectson Hospital Costs. Journal of Health
(19g3): 1-28.
and Steinwald, Bruce. Insuranc:e. Regulation,I Costs. Lexington, MA: Lexington Books
ind Vraciu, Robert. " Investor-owned and Not-Hospitals: Addressing Some Issues. Health.82): 25-37.
Durabilty of Consumer Goods.,view 60 (December 1970): g84-894.
Amerlcan
. "
The Durabilty of Goods and the Regulation
;:Bell Jouraal of Ec:onomlc:s 2 (Spring 1971):
ael; Derzon, Robert A.; Renn, Steven C.arl J.; Hahn, James S. and Pilari, George D.rative Economic Performance of Investor-ownedlot-for-Profit Hospitals." New England Journal314 (January 9, 1986): 89-96.
10S

LeafDIDI, conco vy narvcyuoIQSCnmlO, MIChael Mann , andFred Weston. Boston: Little, Brown and Company, 1974.
"o_ L__- 1'__ .. c"_- " Area Approach to the Analysis ofIce." In Health Planning Methods
. HRP-OI021OI , Department ofvices Pub. No. (HRA) 80- 14012
, Howard and Aderholdt, John.cts Can Affect Hospital Finances."
ican Hospital Industry since 1900:
..nces In Health Economics andvol. 3. edited by Richard
iiter. Greenwich, CT: lAI Press
, Joseph.
. '
Competition, ProfitEfficiency in the Provision of
s." Bell Journal of Ec:onomlc:s 13
d Piro, Paula A. "The Effects ofograms on Volumes of HospitalAnalysis." Health Care Financing
106