the impact of pisa on mathematics education: linking...
TRANSCRIPT

Education Journal《教育學報》, Vol. 31, No. 2, 2003 & Vol. 32, No. 1, 2004 © The Chinese University of Hong Kong 2005
The Impact of PISA on Mathematics Education: Linking Mathematics and the Real World
MARGARET WU Assessment Research Centre, University of Melbourne
This article presents key features of the mathematics assessment in OECD’s Programme for International Student Assessment (PISA), from the point of view of the design of test items to fit in with the PISA mathematics framework. A brief description is first given to provide some background to the development of the PISA mathematics framework. The “spirit” of PISA mathematics is then captured through illustrative examples of items to highlight the differences between traditional mathematics assessments and PISA assessment. Some empirical data are presented to provide support for the claims of differences between PISA and other assessments. The PISA results for Hong Kong are also examined to highlight strengths and weaknesses of Hong Kong students. The main message that this article conveys is that PISA has taken a bold step in an international comparative study to link mathematics to the real world.
The discussion document of ICMI Study 14: Applications and Modelling in Mathematics Education describes the impact of the Programme for International Student Assessment (PISA) on mathematics education (International Commission on Mathematical Instruction [ICMI], 2003):
Following the 2001 publication of results of the first PISA cycle (from 2000), an intense discussion has started, in several countries, about aims and design of mathematics instruction in schools, and especially about the role of mathematical modelling, applications of mathematics and relations to the real world. (p. 4)

122 Margaret Wu
The PISA mathematics framework (Organisation for Economic Co-operation and Development [OECD], 2003) emphasizes the literacy orientation of mathematics. In particular, the framework makes explicit the connection between mathematics and the real world. This article discusses the objectives of the PISA mathematics assessment and how these differ from traditional assessments of mathematics. The article also examines some PISA results beyond just the simple ranking of countries/regions, and highlights what the mathematics education community can learn from the PISA results.
The PISA Mathematics Framework
The PISA mathematics framework was designed by a group of experts in mathematics education led by Prof. Jan de Lange from the University of Utrecht, the Netherlands. The members of the PISA mathematics expert group (MEG) brought with them their insights and long-standing experience in mathematics education both nationally and internationally. The inception of the PISA mathematics framework was very much a product of the concerted efforts of MEG, in conjunction with the participating countries/regions (through discussions in mathematics forums), in planning the directions mathematics education should take. From this point of view, the PISA mathematics framework design was somewhat different from TIMSS (Trends in International Mathematics and Science Study) in that the PISA framework was expert-driven rather than curriculum-driven.
The PISA mathematics framework was designed from a top-down, not bottom-up, approach. That is, the experts first survey the importance of mathematics in the real world around us, and then delineate the knowledge and skills required to perform these tasks, whereas a bottom-up approach, as adopted in TIMSS, would be to start with the building blocks of mathematics curriculum, and then decide how these skills can be applied to real-world applications. This is not to say that PISA mathematics pays no attention to curriculum. Every PISA mathematics item has mathematics content, otherwise it would not be testing mathematics. The PISA mathematics strands have close links with traditional mathematics curriculum strands. However, by adopting a top-down approach, PISA attempts to ensure that the mathematics being assessed relates to students’ abilities to solve problems in the real world, and that it is not just fragmented mathematical knowledge which

The Impact of PISA on Mathematics Education 123
students may not be able to put to functional use in their everyday life. This is why, in part, the term “mathematical literacy” is used to describe what is being assessed by PISA. It is important to note that PISA is about the assessment of mathematics, and not about designing teaching materials in classrooms, although there is a close relationship between assessment and teaching. It may very well be the case that a bottom-up approach is better for designing mathematics curriculum for classrooms.
The formal definition of mathematical literacy for PISA is as follows:
Mathematics literacy is an individual’s capacity to identify and understand the role that mathematics plays in the world, to make well-founded judgements and to use and engage with mathematics in ways that meet the needs of that individual’s life as a constructive, concerned and reflective citizen. (OECD, 2003, p. 24)
In summary, the PISA mathematics framework aims at assessing the outcome of schooling as to whether students can put mathematics to functional use in their lives.
At the surface level, the PISA definition of mathematical literacy may not differ a great deal from other definitions of mathematics in curriculum statements around the world. However, there are at least three emphases in the PISA mathematics framework. The first is that the nature of the mathematics assessed is more applied, to fit in with the notion of “[engaging] with mathematics in ways that meet the needs of that individual’s life.” The second emphasis is that the mathematics assessed ought to be “holistic” and not “fragmented.” That is, one would like to assess the whole process where mathematics is applied, starting from understanding the problem, to formulating and solving the problem, and to communicating the results. The third emphasis is that the contexts where problems are set ought to be “authentic,” in the sense that the contexts are not contrived. The PISA framework states that:
OECD/PISA mathematics uses the terms [sic] “authentic” to indicate that the use of mathematics is genuinely directed to solving the problem at hand, rather than the problem being merely a vehicle for the purpose of practising some mathematics. (OECD, 2003, p. 33)
These three emphases set PISA mathematics apart from many other assessments where the main purpose is to measure the degree to which students have learned certain topics of mathematics taught in class.

124 Margaret Wu
The directions taken by PISA mathematics framework are consistent with current trends in mathematics research. First, the document Curriculum and Evaluation Standards for School Mathematics (National Council of Teachers of Mathematics, 1989) specifies that mathematics curriculum should move away from traditional emphases on decontextualized mathematical knowledge, and move toward holistic approaches that focus on problem-solving processes. Second, the theory of Realistic Mathematics Education developed in the Netherlands (de Lange, 1996; Freudenthal, 1991; Gravemeijer, 1999) is founded on two principles: (1) mathematics must be connected to the real world, and (2) mathematics should be seen as a human activity. There are also many other mathematics educators who have made substantial contributions in the area of linking mathematics to the real world (e.g., Blum, Niss, & Huntley, 1989; Verschaffel, 1999). However, PISA is the first to take on the focus of mathematics in the real world in a large-scale international assessment.
Designing Test Items for the PISA Assessment
Of course, a framework specifies goals. The extent to which these goals are achieved still depends on the items designed for the assessment. So the next step is to develop items to meet the goals of the PISA framework.
The PISA mathematics framework poses a considerable challenge for test designers to write test items that fit in with the framework. The first implication of the PISA framework is that there is a very limited scope for including “naked” drill items such as “simplify a fraction” or “solve a quadratic equation.” Secondly, a quick survey of “application” problems presented in most textbooks revealed that most of these problems did not meet the PISA framework specifications. PISA emphasizes the authenticity of the problem context. Figure 1 shows a typical application problem in textbooks.
The item shown in Figure 1 is not regarded as fitting the PISA mathematics framework “spirit” in that the context of the problem is rather artificial. After all, if one is interested in knowing the value of the variable x, the best way is to measure it directly on the ground. That is, a good question posed to students should be authentic in the sense that students are able to see the need to find the solutions of the problem.

The Impact of PISA on Mathematics Education 125
Therefore, in designing PISA items, the test designers always think about “why does someone want to know the answer to this problem?”
Figure 1. Example Item with Non-authentic Context
How far is the foot of a 2 m ladder from the wall when the top of the ladder is 1.92 m above the ground?
x
Figure 2 shows two examples where the contexts of the problems
are different, but the underlying mathematics is the same. The “chicken and rabbit” problem appears in many textbooks. The context is not regarded as fitting the PISA assessment as it does not seem to reflect real-life situations of how mathematics might be applied. The second item about school concerts has a more authentic context. One might conjecture that many students will be able to solve the first question, as this question is a typical problem-solving task taught in class, whereas few students would recognize that the same underlying mathematics can be applied in the second example.
Figure 2. Example Items of Different Contexts but Same Mathematics
Farmer Dave keeps chickens and rabbits. Dave counted altogether 65 heads and 180 feet. How many chickens does Dave have?
Tickets to the school concert costs $4 for an adult and $2 for a child. 65 tickets were sold for a total of $180. How many children’s tickets were sold?
Figure 3 shows an example item to illustrate the functional use of
mathematics in everyday life. While this item appears to test the topic of proportionality, there is also an added dimension of how real-life situations interact with the mathematics. A purely mathematical answer without regard to real-life situations would be that the two discount cards are the same, as each offers two discounts out of 10 visits.

126 Margaret Wu
However, in real life, for the second discount card, customers can potentially discard the card after the first three visits, and obtain a new discount card. In this way, they will be able to obtain one free offer for every 3 visits. Consequently, the design of the sequence of the free offers has an impact on how the discount card may be used, beyond the consideration of mathematical computations of proportions. Problems such as this example, where real-life situations intertwine with mathematics, occur frequently in everyday life. Students should be encouraged to think beyond the standard textbook exercises, and to think about how they can apply mathematics to real-life situations taking into account all constraints and factors that can affect the solution to a problem.
Figure 3. Example Item of Functional Use of Mathematics in Everyday Life
First Discount Card Second Discount Card If a second discount card has the following sequence of Free offers, give reasons to explain whether the shop will be offering the same discount value as the first discount card.
1 2 Free 4 5 6 7 Free 9 10
Present this card each time you purchase a muffin at Muf-funs and receive a free muffin on your 6th and 10th visit. Cardholder Name: ___________________________________
1 ☺
2 3 4 5 Free 7 8 9 Free
This offer is not available in conjunction with any other offer.
The PISA test designers attempt to steer away from items requiring only simple recall of mathematical facts, and prefer items requiring higher-order thinking skills such as reasoning and reflection. Figures 4 and 5 show two example items. The first example “spinner1” (Figure 4)

The Impact of PISA on Mathematics Education 127
is a typical school textbook item, where knowledge about probability is being tested. The second example “spinner2” (Figure 5) asks the students to think about how their knowledge of probability can be applied in a real-life situation. From the point of view of the PISA framework, “spinner2” would make a better item in emphasizing how mathematical knowledge can be put to functional use. The item “spinner2” also calls for reasoning skills over and above the recall of mathematical knowledge typically learned from textbooks. However, the added complexity in “spinner2” makes the item much more difficult and beyond the capability of many students.
Figure 4. Example Item “spinner1”
The picture shows a spinner used in playing games. (1) What is the probability of spinning a “3”? (2) What is the probability of spinning an even number?
6
5 4
3
21
Figure 5. Example Item “spinner2”
The picture shows a spinner used in playing games. For a game, the spinner is used to choose a person at random to start the game. Explain how you will use this spinner to choose a person at random if there are (1) three players, and (2) nine players.
6
5 4
3
21
The above examples attempt to capture the “spirit” of the PISA
assessment items. More example items of PISA can be found in the framework document (OECD, 2003). As can be seen, there are

128 Margaret Wu
considerable differences between the PISA items and those found in more traditional school assessments. Consequently, the call for national contributions of PISA mathematics items was not very successful in that most contributions from countries/regions were still very textbook-based types of items. Another problem arose in relation to the level of difficulty of the items. While the PISA framework would prefer to include more complex items to assess “holistic” approaches to doing mathematics, these items inevitably have high difficulty levels. To be able to target the mathematical levels of the population of 15-year-old students in participating countries/regions, some easy — thus more “fragmented” — items were included. In all, the PISA test still contained a small proportion of traditional mathematics items. But by and large, most items in the PISA test were designed with the firm visions of the expert group for testing mathematics with authentic contexts and real-life applications. From this point of view, the PISA test indeed reflects a new era in the assessment of mathematics. Although these are the intentions of the MEG and the test designers for developing PISA items, the empirical results of PISA still need to be examined to assess the extent to which the PISA test has successfully achieved its goals. The following sections focus on the implications of the PISA 2000 results, particularly in relation to the performance of students in Hong Kong.
Mathematics Performance in PISA 2000
The relative performance of countries/regions in PISA 2000 mathematics is shown in Figure 6 where mean scores and 95% confidence intervals are displayed.
It can be seen from Figure 6 that Asian countries/regions outperformed other countries in PISA 2000. This result is consistent with many findings in cross-national comparative studies of mathematics. In general, the PISA mathematics results can be summarized as follows: Students in Asian countries/regions had the highest average scores, followed by students in English-speaking countries, northern European countries, eastern European countries, southern European countries, and then central and south American countries.

Figu
re 6
. M
ean
Scor
es in
PIS
A 2
000
Mat
hem
atic
s (b
y C
ount
ry/re
gion
)
330
380
430
480
530
580
Hong Kong
Japan
Korea
New Zealand
Finland
Australia
Canada
Switzerland
United Kingdom
Belgium
France
Austria
Denmark
Iceland
Liechtenstein
Sweden
Ireland
Norway
Czech Republic
United States
Germany
Hungary
Russia
Spain
Poland
Latvia
Italy
Portugal
Greece
Luxembourg
Mexico
Brazil
Mathematics Mean Score
Sou
rce:
Dow
nloa
ded
from
OE
CD
PIS
A 2
000
data
base
(OE
CD
, 200
1).

130 Margaret Wu
A Comparison of Results Between PISA 2000 and TIMSS 1999
A comparative analysis between PISA 2000 and TIMSS 1999 (Third International Mathematics and Science Study, see Mullis et al., 2000) results was carried out for a paper contribution to the 13th ICMI study (Wu, 2003). This section summarizes the findings, with the addition of Hong Kong in the analysis.
Figure 7 shows a comparison between the relative standings of 14 countries/regions in terms of their standardized mean scores in PISA 2000 and TIMSS 1999. As scores between PISA and TIMSS are not directly comparable, the scores have been standardized to have a mean of 0 and a standard deviation of 1 for PISA and TIMSS scores. That is, a value of 1.3 for Hong Kong in PISA indicates that the mean PISA score for Hong Kong is 1.3 standard deviations above the average of the 14 means. Similarly, a value of 1.6 for Hong Kong in TIMSS indicates that the mean TIMSS score for Hong Kong is 1.6 standard deviations above the mean of the 14 countries/regions. In other words, Hong Kong’s TIMSS score is actually relatively higher than its PISA score when measured in terms of the “distances” from the other countries under comparison.
Two observations can be made about Figure 7. Firstly, for the TIMSS scores, there is a large gap between the Asian countries/regions and the other countries, whereas for the PISA scores, the distance between the Asian countries/regions and other countries narrows. This means that there is a greater difference between the Asian countries/regions and other countries in the performance on the TIMSS test. This difference is not so marked in PISA. Secondly, most English-speaking countries are ahead of Eastern European countries in PISA, but they are behind most Eastern European countries in TIMSS.
A conjecture for the explanation to the above observations is that TIMSS items tend to be more curriculum-based, whereas PISA items are more application-based. The traditions in mathematics education in different countries/regions have different emphases. Therefore, the observed differences between PISA and TIMSS are a result of the contents of the tests as well as the traditions of mathematics education in the countries/regions. This conjecture is tested in the next section where the patterns of item responses are compared across countries/regions.

The Impact of PISA on Mathematics Education 131
Figure 7. Standardized PISA and TIMSS Mean Scores of
Countries/regions1
-2
-1.5
-1
-0.5
0
0.5
1
1.5
2
Stan
dard
ized
sco
res
jpn
jpn
kor
kor
nzl fin
fin
can
can
aus
aus
uk
uk
cze
cze
usausahun
hun
rus
rus
lav
lav
ita
PISA TIMSS
ita
nzl
hkg
hkg
Note: See Note 1 of this article for the countries/regions that the abbreviations in this figure represent.
Source: Wu (2003).

132 Margaret Wu
Cluster Analysis on Patterns of Item Responses
IRT (item response theory) analyses were carried out in PISA 2000, and calibrated item difficulties were produced for each country/region. These item difficulties reflect the relative performance on items within each country/region.2 A cluster analysis was carried out on these nationally calibrated item difficulties to identify patterns of item responses across countries/regions.
Figure 8 shows the dendrogram from the cluster analysis. The figure shows the “distances” between countries/regions in terms of the patterns of item difficulty parameters. For example, Canada (English-speaking) and New Zealand are the closest in terms of their patterns of item difficulties. They are joined by England and Scotland, and then Australia, Ireland, and the United States. At the other end of the clusters, Hong Kong joins Russia, and then they are joined by Korea and Japan. This picture of the “distances” between countries/regions is consistent with the perceived traditions in mathematics education, where Asian countries/regions and Russia have a mathematics curriculum that contains more formal approaches to mathematics, whereas English-speaking countries tend to have a more open, application-oriented approach to teaching mathematics. This distinction is manifested through the comparison of the PISA and TIMSS results as shown in the previous section. That is, PISA favors Western countries whereas TIMSS favors countries with more traditional mathematics curricula.
Weaknesses and Strengths of Students in Hong Kong in Mathematics
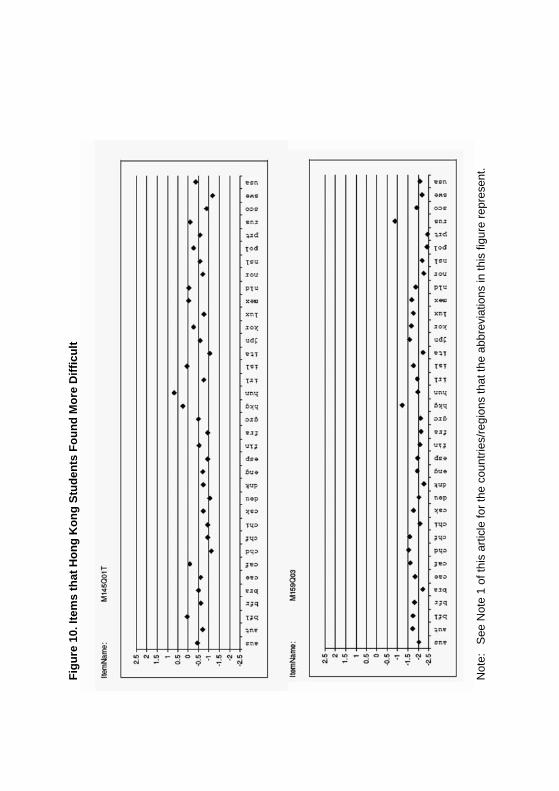
While the cluster analysis identifies patterns of performance between countries/regions, it does not highlight specific areas of differences in mathematics performance. It will be useful to examine strengths and weaknesses for each country/region in terms of students’ performance on individual items. In this section, we will focus on the performance of Hong Kong students in the PISA test.
Figures 9 and 10 show plots of “item-by-country/region-interactions” for a number of selected items. The vertical axis shows the

The Impact of PISA on Mathematics Education 133
Figure 8. Dendrogram from Cluster Analysis on Item Difficulty Parameters
* * * * H I E R A R C H I C A L C L U S T E R A N A L Y S I S * * * *
Dendrogram using Average Linkage (Between Groups)
Note: See Note 1 of this article for the countries/regions that the abbreviations in this figure represent.

134 Margaret Wu
Figu
re 9
. Ite
ms
that
Hon
g K
ong
Stud
ents
Fou
nd E
asie
r
Not
e:
See
Not
e 1
of th
is a
rticl
e fo
r the
cou
ntrie
s/re
gion
s th
at th
e ab
brev
iatio
ns in
this
figu
re re
pres
ent.
The Impact of PISA on Mathematics Education 135
Figu
re 1
0. It
ems
that
Hon
g K
ong
Stud
ents
Fou
nd M
ore
Diff
icul
t
Not
e:
See
Not
e 1
of th
is a
rticl
e fo
r the
cou
ntrie
s/re
gion
s th
at th
e ab
brev
iatio
ns in
this
figu
re re
pres
ent.

136 Margaret Wu
value of item difficulty calibrated for each country/region. A high value indicates that the country/region found the item relatively more difficult as compared to other countries/regions after adjusting for their average performance. For items M136Q01T and M136Q02T, Hong Kong students found these two items very easy compared to students of the same ability from other countries. In contrast, for items M145Q01T and M159Q03, Hong Kong students performed less well as compared to students of the same ability from other countries. Three of these items are included in the Appendix.
In general, it can be seen that Hong Kong students have strengths in formal mathematics, particularly in items involving algebra and equations. Hong Kong students performed less well than expected on items that require verbal reasoning, interpretation of graphs and spatial reasoning. It is important to note that these observations are made in relative terms. When some items show unexpectedly high student performance, there must be some items that show unexpectedly low student performance. These comparisons do not reflect the actual performance in terms of percentages correct on the items.
Conclusions The PISA mathematics assessment attempts to bring the real world to mathematics, and vice versa. A comparison of PISA results with TIMSS results suggests that PISA has successfully differentiated itself from curriculum-based tests. There is some evidence that the relative performances of countries/regions in PISA and in TIMSS are influenced by the traditions of mathematics education in the places.
Whereas the PISA mathematics framework clearly articulates its purpose and approach, the test development process experienced some difficulties in obtaining country contributions that clearly met the framework objectives. This suggests that the innovation brought by PISA is still not commonly implemented in countries/region. The next step after the PISA assessment is to transform the visions of the PISA MEG to the education systems within each country/region and within each school. As for Hong Kong, there is still room to improve even though Hong Kong outperformed all other countries in PISA. That is, mathematics education must be made relevant to everyday life and to real-world applications.
The Impact of PISA on Mathematics Education 137
Notes
1. The following table shows the countries/regions that the abbreviations in Figures 7–10 represent:
Abbreviation Country/region Abbreviation Country/region aus Australia hun Hungary aut Austria irl Ireland bfl Belgium (Flemish) isl Iceland bfr Belgium (French) ita Italy bra Brazil jpn Japan cae Canada (English) kor Korea caf Canada (French) lav Latvia can Canada lux Luxembourg chd Switzerland (German) mex Mexico chf Switzerland (French) nld The Netherlands chi Switzerland (Italian) nor Norway csk/czk Czech Republic nsl/nzl New Zealand deu Germany pol Poland dnk Denmark prt Portugal eng England rus Russia esp Spain sco Scotland fin Finland swe Sweden fra France uk United Kingdom grc Greece usa United States hkg Hong Kong
2. The item difficulties are “relative” in the sense that they have been
standardized to account for the mean abilities of students in each country/region.
References
Blum, W., Niss, M., & Huntley, I. (Eds.). (1989). Modelling, applications and applied problem solving: Teaching mathematics in a real context. Chichester: Ellis Horwood.
De Lange, J. (1996). Using and applying mathematics in education. In A. J. Bishop, K. Clements, C. Keitel, J. Kilpatrick, & C. Laborde (Eds.), International handbook of mathematics education (pp. 49–98). Dordrecht, the Netherlands: Kluwer Academic Publishers.
Freudenthal, H. (1991). Revisiting mathematics education. China Lectures. Dordrecht, the Netherlands: Kluwer Academic Publishers.

138 Margaret Wu
Gravemeijer, K. (1999). How emergent models may foster the constitution of formal mathematics. Mathematical Thinking and Learning, 1(2), 155–177.
International Commission on Mathematical Instruction. (2003). ICMI study 14: Applications and modelling in mathematics education — Discussion document. Québec: Université Laval.
Mullis, I. V. S., Martin, M. O., Gonzalez, E. J., Gregory, K. D., Garden, R. A., O’Connor, K. M., Chrostowski, S. J., & Smith, T. A. (2000). TIMSS 1999 international mathematics report: Findings from IEA’s repeat of the Third International Mathematics and Science Study at the eighth grade. Chestnut Hill, MA: Boston College.
National Council of Teachers of Mathematics. (1989). Curriculum and evaluation standards for school mathematics. Reston, VA: Author.
Organisation for Economic Co-operation and Development. (2001). PISA 2000 database. Retrieved November 1, 2003 from the OECD PISA Web site: http://pisaweb.acer.edu.au/oecd/oecd_pisa_data_s1.html
Organisation for Economic Co-operation and Development. (2003). The PISA 2003 assessment framework: Mathematics, reading, science and problem solving, knowledge and skills. Paris: Author.
Verschaffel, L. (1999). Realistic mathematical modelling and problem solving in the upper elementary school: Analysis and improvement. In J. H. M. Hamers, J. E. H. van Luit, & B. Csapó (Eds.), Teaching and learning thinking skills: Contexts of learning (pp. 215–240). Lisse, the Netherlands: Swets and Zeitlinger.
Wu, M. L. (2003). A comparison of mathematics performance between East and West: What PISA and TIMSS can tell us. Paper contributed to the 13th ICMI study.

The Impact of PISA on Mathematics Education 139
Appendix: Selected Released PISA 2000 Items
APPLES
A farmer plants apple trees in a square pattern. In order to protect the trees against the wind he plants conifers all around the orchard.
Here you see a diagram of this situation where you can see the pattern of apple trees and conifers for any number (n) of rows of apple trees:
n = 1
X X X X X X X X
n = 4
X X X X X X X X XX XX XX XX XX XX XX XX X X X X X X X X
n = 3
X X X X X X XX XX XX XX XX XX X X X X X X
n = 2
X X X X XX XX XX XX X X X X
X = conifer = apple tree
Apples Question 1 (Item 7, M136Q01)
Complete the table: n Number of apple trees Number of conifers 1 1 8 2 4 3 4 5
Apples Question 2 (Item 8, M136Q02)
There are two formulae you can use to calculate the number of apple trees and the number of conifers for the pattern described above:
Number of apple trees = n2
Number of conifers = 8n where n is the number of rows of apple trees.

140 Margaret Wu
There is a value of n for which the number of apple trees equals the number of conifers. Find the value of n and show your method of calculating this.
SPEED OF RACING CAR
This graph shows how the speed of a racing car varies along a flat 3-kilometre track during its second lap.
Speed of a racing car along a 3 km track (second lap)
Speed
(km/h)
0 0.2 0.4 0.6 0.8 1.0 1.2 1.4 1.6 1.8 2.0 2.2 2.4 2.6 2.8 3.0 2.5 0.5 1.5
180 160 140 120 100 80 60 40 20
Distance along the track (km) Starting line
Question 3: Speed of Racing Car (M159Q03)
What can you say about the speed of the car between the 2.6 km and 2.8 km marks? A. The speed of the car remains constant. B. The speed of the car is increasing. C. The speed of the car is decreasing. D. The speed of the car cannot be determined from the graph.
Speed of racing car scoring 3
Full credit Code 1: B. The speed of the car is increasing No credit Code 0: Other responses Code 9: Missing