the impact of misalignment of organization structure and...
TRANSCRIPT

The Impact of Misalignment of Organization Structureand Product Architecture on Quality in Complex Product
DevelopmentBilal Gokpinar1, Wallace J. Hopp2, Seyed M. R. Iravani3
1Department of Management Science and Innovation, University College London, London WC1E 6BT, United Kingdom2Ross School of Business, University of Michigan, Ann Arbor, MI 48109, USA
3Department of Industrial Engineering and Management Sciences, Northwestern University, Evanston, IL 60208, USA
A well-planned and well-executed new product development (NPD) process, which produces a stream of timely andhigh quality products, can provide significant competitive advantage to a company. Focusing on product quality as a keymeasure of NPD performance, we examine the impact of technical and organizational factors on a vehicle developmentprocess. Our results indicate that centrality in a product architecture network is related to quality according to an inverted-U relationship, which suggests that vehicle subsystems of intermediate complexity exhibit abnormally high levels ofquality problems. To identify specific subsystems in danger of excessive quality problems, we characterize mismatchesbetween product architecture and organization structure by defining a new metric, called coordination deficit, and showthat it is positively associated with quality problems. These results deepen our understanding of the impact of organiza-tional structure and product architecture on the NPD process and provide tools with which managers can diagnose andimprove their NPD systems.
Key words: new product development; product architecture; organization structure; complex networksHistory: October 2007, Revised June 2008, Revised March 2009, Revised July 2009
1. Introduction and Literature Review
Product innovation has always been central to business creation and growth. But in recent years, as glob-
alization has made it more difficult to sustain competitive advantages from market access or operational
efficiency, innovation has become even more crucial. Firms that are able to bring a steady stream of timely
and well-executed products to market are likely to enjoy long term financial success. Indeed, in a study of
the U.S. pharmaceutical industry, Roberts (1999) found that sustained high profitability results when a firm
repeatedly introduces innovations that target previously unmet consumer demands.
In addition to being one of the most important management functions, product development is also one
of the most difficult. For instance, developing a complex product like an automobile or an airplane takes
several years and involves thousands of engineers designing, testing and integrating hundreds of thousands
of parts. Consequently, a key challenge for product development organizations is matching the organization
to the product being developed. This involves two fundamental problems: (1) How to assign people to the
parts and subsystems that make up the product, and (2) How to ensure that people communicate/collaborate
1

2
effectively in the performance of design tasks. As evidence that these problems are universal and difficult, a
recent joint study by BusinessWeek and the Boston Consulting Group, reported that 1,000 senior managers
around the globe cited a lack of coordination as the second-biggest barrier to innovation (McGregor 2006).
From an operations management standpoint, we can view the NPD process as a network of engineers
designing a network of parts. Consequently, in this paper, we study the problem of coordinating parts
and people in an NPD process by means of network analysis. As such, this paper is part of a growing
literature that makes use of networks to represent both product architecture (Krishnan and Ulrich 2001,
Henderson and Clark 1990, Ulrich 1995) and organization structure (Clark and Fujimoto 1991, Brown and
Eisenhardt 1995). In the work closest to our own, Sosa et al. (2004) adopted a combined perspective in a
study of the alignment of design interfaces and communication patterns. In a subsequent paper, they iden-
tified factors that make some teams better than others at aligning their cross-team interactions with design
interfaces (Sosa et al. 2007). While the insights from these studies are interesting and potentially useful
in improving NPD processes, they are premised on a basic assumption, namely that misalignment of the
design organization and the product architecture is detrimental to performance. But, since none of these
studies actually measured performance, they could not corroborate this assumption.
In this paper, we build on this stream of research by (a) defining a new metric, called coordination deficit,
which quantifies mismatches between product architecture and organization structure, and (b) empirically
investigating the effect of coordination deficit on product quality.
In a broader sense, our work builds upon and integrates two streams of research: (i) operations of complex
product development and (ii) social network analysis of organizational performance. While these areas are
very broad, and have been studied from a variety of perspectives, they been studied together under two major
research headings, knowledge networks (see Nonaka and Takeuchi 1995, Contractor and Monge 2002) and
modularity (Ulrich 1995, Baldwin and Clark 2000).
Researchers have investigated various aspects of knowledge networks in the context of product devel-
opment and have provided critical insights into why some business units are able to make effective use
of knowledge from other parts of the company, while other units find knowledge to be a barrier to inno-
vation (Hansen 2002, Carlile 2002). In this paper, we construct a very specific knowledge network that
characterizes collaboration and communication between design engineers and identify structural features of
this network that are correlated with quality problems in the final product.

3
Modularity refers to methods for reducing the number of interactions and interfaces among parts and
components in product design (Ulrich 1995, Baldwin and Clark 2000). Organizational implications of mod-
ularity, as well as the organizational factors that support the use of modularity, have been studied by several
researchers (see Sanchez and Mahoney 1996, Schilling 2002, Ethiraj and Levinthal 2004, Fleming and
Sorenson 2004). Unlike other network studies of modularity, which represent interfaces as either present
or not present, we make use of engineering data to characterize the strength of interfaces between compo-
nents. This gives us a more detailed representation of the product architecture, which we compare to the
organizational structure in order to quantitatively measure the degree of misalignment.
This paper also contributes to the literature on the use of social network tools in empirical studies of
organizations (see, e.g., Wasserman and Faust 1994). A distinctive feature of our study is that we make use
of archival data, rather than surveys, to construct a social network. Because such data is readily available in
NPD environments, this approach may ultimately make network analysis more practical as a management
tool.
Finally, from a practical perspective, our work can help managers to systematically identify and quantify
potential problem areas that can be addressed to improve the quality of the resulting products. Our metric
of organizational misalignment (i.e., coordination deficit) can be computed using standard data from an
engineering change order system. As such, it provides a way to highlight opportunities for improving coor-
dination among design engineers without collecting additional data. This should be particularly valuable
in environments where evolution of product architectures changes coordination needs over time and makes
static organizational policies ineffective.
The remainder of the paper is organized as follows: In the next section we provide the theoretical back-
ground and frame our hypotheses. In Section 3, we present a detailed description of the data and the system
in which we test the hypotheses. Section 4 describes the model development, and Section 5 presents the
analysis and results. We discuss our results in Section 6 and conclude in Section 7.
2. Theory and Hypothesis
Ulrich (1995) defined product architecture as: “(i) the arrangement of functional elements, (ii) the mapping
from functional elements to physical components and (iii) the specification of the interfaces among inter-
acting physical components”. All three of these dimensions may influence ultimate product performance at
either the local (component) level (Ulrich 1995, Baldwin and Clark 2000, Mihm et al. 2003) or the global

4
(product) level (Clark and Fujimoto 1990). An intermediate level between the component and product lev-
els is the subsystem level, which is widely used by firms to describe product architectures for management
purposes. From a network perspective, product architecture can be characterized by representing subsys-
tems as nodes and interfaces between subsystems as links. Network metrics can then be used to describe the
nature and position of product subsystems. For example, a subsystem with many (physical and functional)
interfaces will have high centrality in the product architecture network.
Given this interpretation, the centrality of a subsystem can serve as a proxy for complexity, since more
interfaces imply more design issues. So, if management were to devote equal resources and attention to all
subsystems, we would expect highly central subsystems to exhibit worse performance (e.g., more quality
problems). But management would never do this. Previous research on product development has shown that
architectural/technical interdependence is associated with organizational communication (Henderson and
Clark 1990, Brown and Eisenhardt 1995, Adler et al. 1995). Highly central subsystems, which are heavily
connected to other subsystems, logically receive intense attention from the organization, which offsets the
potential quality problems resulting from their complexity.
If management were to perfectly correlate resources and attention to the complexity of each subsys-
tem, we would not expect to see any correlation at all between centrality and performance (e.g., quality).
But we do not think this is realistic either. Complexity is not directly observable. So mismatches between
organizational attention and subsystem interconnectivity, of the type observed by Sosa et al. (2004), are
likely to occur. We conjecture that they are most likely to occur for subsystems of intermediate centrality.
The reason is that highly central subsystems are obviously highly complex, and hence receive substantial
organizational attention. Indeed, they may receive even more attention than they need because they present
such manifest design challenges. At the other end of the scale, low centrality subsystems, which have few
interfaces, require relatively little coordination effort and so are unlikely to be under-attended. Even the
minimal amount of organizational coordination built into standard design practices is likely to be enough
for these subsystems. But intermediate centrality subsystems are neither complex enough to be obvious nor
simple enough to be easy. These are the subsystems where a delicate matching of resources and attention
to the design complexity is most difficult. So this is where we expect to find the most mismatches, as we
conjecture in the following hypothesis.

5
Hypothesis 1. The centrality of a product subsystem in the product architecture has an inverted-Uassociation with the quality problems observed in that subsystem.
The earlier discussion provide a very general sense of where a lack of organizational coordination might
lead to excessive quality problems. But since centrality only characterizes subsystems in a coarse manner,
it would not provide any explicit managerial guidance on which subsystems are most prone to quality
problems. Henderson and Clark (1990) established a relationship between product architecture and design
organization, and pointed out the importance of matching team interfaces to technical interfaces. Sosa et al.
(2004) observed that product development teams tend to ignore certain types of technical interfaces. In a
more recent study, Sosa et al. (2007) presented anecdotal evidence from industry where the shortage of
organizational attention to technical interfaces resulted in poor performance. Based on these findings and
the intuition of NPD managers in our client firm, we conjecture the following hypothesis:
Hypothesis 2. Mismatches between product architecture and organizational coordination in subsys-tems are positively associated with the quality problems observed in these subsystems
We note, however, that neither Henderson and Clark (1990) nor Sosa et al. (2004) actually measured
NPD process performance in order to test the above hypothesis. To do this, we will first establish a quanti-
tative measure of the degree of mismatch between the organization and the product and then correlate this
metric with empirically observed performance (i.e., warranty claims).
3. Overview of the Vehicle Development Process
Our empirical analyses are based on a detailed study of the new vehicle development process of a large
US auto manufacturer. Because it involves many interdependent tasks over an extended period, automotive
design is a prototypical example of complex product development. To create a useful model, one of the
authors spent two summers (about 6 months) on site for data collection and analysis. This allowed us to
gain a good understanding of the product development process through observation of common practices
and obstacles. We also collected an extensive data set from the Engineering Change Orders (ECO) system,
which is used by the firm to manage and document the design process.
3.1. Vehicle Development Process
Our main unit of reference regarding the vehicle development process is a vehicle program. For a large
company, such as the one we studied, there are typically multiple models with different brand names within
the same vehicle program. A model refers to the end product that is sold to the customers in dealerships

6
(e.g., Chevrolet Malibu, Toyota Camry, etc.). Although models under the same vehicle program may be
sold under different brand names, their underlying architectural structure and product development effort
is similar. Since vehicles are built off of platforms, there is a good deal of component commonality across
models. Some of these components are entirely new to the program, while some are carried over from
previous programs.
It takes two to three years to complete the entire product development process for a program. A program
provides a platform for several vehicles, which are typically launched in a staggered fashion to smooth
demands on engineering and marketing resources. Once in the market, vehicles are usually given major
refreshes (redesigns) every five to six years, with a minor update at about the midpoint of a model life cycle.
Most models are eventually retired after being in the market for several design cycles.
For practical reasons of data availability, we followed our client in dividing an automobile into 243
architectural subsystems, which contain roughly 150,000 parts that interact with each other. Consequently,
we will construct the product architecture network by describing interfaces between subsystems.
3.2. Organization
The primary actors in a vehicle development organization are design engineers. Although other types of
engineers (e.g., materials engineers, quality-control engineers and testing engineers) are employed by the
organization, their direct involvement in the design process is limited. Therefore, we focus our attention
exclusively on the design engineers. In the system we studied, there were about 10,000 engineers who par-
ticipated in the engineering design work. These engineers are responsible for creating the parts, making
sure that they meet design specifications and coordinating interfaces with other parts. Design engineers
typically work in groups of 5-10 people, led by a manager who is responsible for supervising the design of
parts/components, as well as coordinating efforts within and beyond the group. Within the product devel-
opment system, design engineers coordinate with each other through distribution lists. Whenever there is
activity related to a part, designated engineers who are directly involved (e.g., an engineer whose parts share
a direct physical interface with a modified part) or indirectly involved (e.g., an engineer whose part shares
an indirect functional interface) are notified via the distribution list. Individual engineers are placed on these
distribution lists as a result of both management policy and requests by engineers. As such, distribution lists
capture both formal connections inherent in the organization chart and informal connections that emerge
from the experience of engineers.
7
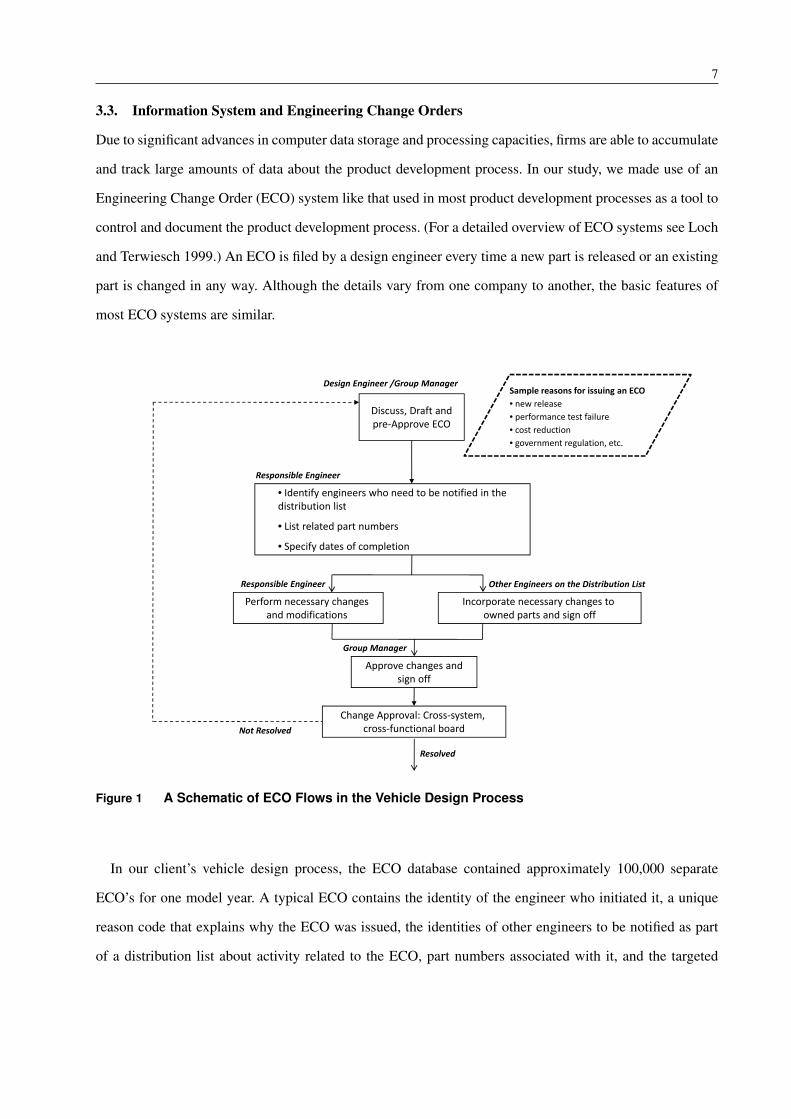
3.3. Information System and Engineering Change Orders
Due to significant advances in computer data storage and processing capacities, firms are able to accumulate
and track large amounts of data about the product development process. In our study, we made use of an
Engineering Change Order (ECO) system like that used in most product development processes as a tool to
control and document the product development process. (For a detailed overview of ECO systems see Loch
and Terwiesch 1999.) An ECO is filed by a design engineer every time a new part is released or an existing
part is changed in any way. Although the details vary from one company to another, the basic features of
most ECO systems are similar.
Discuss, Draft and pre‐Approve ECO
• Identify engineers who need to be notified in the distribution list
• List related part numbers
• Specify dates of completion
Design Engineer /Group Manager
Responsible Engineer
Incorporate necessary changes to owned parts and sign off
Other Engineers on the Distribution List
Approve changes andsign off
Group Manager
Perform necessary changes and modifications
Responsible Engineer
Change Approval: Cross‐system, cross‐functional board
Resolved
Not Resolved
Sample reasons for issuing an ECO • new release• performance test failure• cost reduction• government regulation, etc.
Figure 1 A Schematic of ECO Flows in the Vehicle Design Process
In our client’s vehicle design process, the ECO database contained approximately 100,000 separate
ECO’s for one model year. A typical ECO contains the identity of the engineer who initiated it, a unique
reason code that explains why the ECO was issued, the identities of other engineers to be notified as part
of a distribution list about activity related to the ECO, part numbers associated with it, and the targeted

8
and actual dates of completion. Figure 1 shows a simplified version of our client’s ECO process. Note that
there are several different situations for which ECO’s are created, including when a part is initially released,
when there is a design problem that must be corrected, and when there is an exogenous change (e.g., due
to a government regulation, styling change or supplier request). Each ECO is notated with a reason code,
which describes the specific motivation for it.
For purposes of analysis we have grouped ECO’s into three mutually exclusive sets according to their
reason codes: (1) new release ECO’s, which are filed for all parts of a new model (note that some of these
parts are new, while others are existing parts from a previous model that have been renumbered for the new
model), (2) problematic ECO’s whose reason codes were identified by several design engineers with whom
we consulted as indicating problems in the design process, and (3) other ECO’s, which include all ECO’s not
contained in the above categories (e.g., ECO’s due to a cost reduction initiative or a change in government
regulations). The role of each of these ECO types in the design process are illustrated schematically in
Figure 2. We use this classification to create variables in the empirical model in the next section.
Part Release
Design LaunchNew Release
ECO
OtherECO
Problematic ECO
Test
Design/Integration problems
Other problems
Pass
Figure 2 Modification of a Part Through the ECO System
There have been several studies (see Clark and Fujimoto 1991, Huang and Mak 1999, Terwiesch and Loch
1999, Loch and Terwiesch 1999) of ECO’s in the design process. These examined the broad significance of

9
ECO generation without specifically capturing product architecture information or organization structure.
Since ECO’s are filed when an individual part fails to meet specifications, two or more parts have interface
problems, or product changes are made that affect part designs, the ECO database contains a great deal of
information. To our knowledge, this study is the first attempt to use the ECO system to capture product and
organization interactions.
Previous studies (e.g., Sosa et al. 2004, 2007) have relied on surveys to construct networks for both prod-
uct architectures and organizational structures. This is (a) time consuming, which may limit use in practice,
and (b) subject to people’s memories (e.g., a vehicle program lasts several years, so people must remember
with whom they collaborated years ago in order to construct a relevant organizational structure network
through a survey). Because the ECO system contains information about both parts and the engineers who
work on them, we can use it instead of surveys to construct the product architecture and organizational
coordination networks.
4. Model Development
In this section we describe how we created the product architecture and organizational coordination net-
works from the ECO data described above. These networks are the basis for the key independent variables in
our empirical study of vehicle quality. So, once we have described the networks, we discuss the construction
of the dependent variable, independent variables and control variables in our regression model.
4.1. Creating the Product Architecture Network
We constructed the product architecture network by defining vehicle subsystems as nodes. We defined links
between these nodes by looking only at new release ECO’s. Note that these new release ECO’s are not a
result of a problem or later changes, but purely a result of initiating all parts of a new vehicle program.
As such, they provide an unbiased summary of the linkages between parts. For example, when a part in
the steering wheel subsystem is newly released, all parts related to it, which may be in the steering wheel,
electrical traction or other subsystems, will be automatically listed on the new release ECO for that part.
The logic behind this construction is straightforward: when a part is initiated by issuing a new release
ECO, all parts that share some sort of physical or functional interface with that part are also listed in the
ECO. So, if we look at all such ECO’s and count how many times two subsystems appear in the same ECO,
we can get a proxy for the strength of the architectural interaction (number of interfaces) between the two

10
subsystems. Specifically, we use the number of new release ECO’s that include parts both from subsystems
i and j as the weight for the link between nodes i and j in the product architecture network.
This network reveals that the various subsystems differ substantially in terms of their connections to other
subsystems. For example in a car, the wiring harness subsystem has physical connections to almost every
other subsystem, while the air cleaner subsystem has only a limited number of physical connections with
the rest of the vehicle. Figure 6 depicts a visual representation of the product architecture network, which
shows that the network is too large and complex to analyze visually. Clearly, we need quantitative metrics
to characterize the product architecture in a useful manner.
Figure 3 Product Architecture Network: A Network of Vehicle Subsystems
4.2. Creating the Organizational Coordination Network
Many organizational studies (see Ibarra 1993, Krackhardt and Hanson 1993, Burt 2004) have studied com-
munication and advice networks of individuals by using empirical data sets that are usually collected
through surveys or questionnaires. Our study differs from these by making use of formal institutional con-
nections, rather than informal social ones. One benefit of this approach is that it permits organizational
11
analysis with data already being recorded, and so does not subject the organization to the burden of a
detailed survey. A second benefit is that it focuses on links over which management has a great deal of
influence (i.e., who is listed on which distribution list). Hence, any levers indicated by this analysis can be
translated into concrete management policies.
To construct the organizational coordination network, we again used vehicle subsystems as nodes and
proceeded in two steps. In the first step, we only used the new release ECO’s to determine which engineers
are associated with which subsystems. We did this because our client indicated that only key engineers
involved in the design of the parts (and hence subsystems) are listed in the new part release ECO’s. (Note that
an engineer may be associated with more than one subsystem, while a subsystem always involves more than
one engineer.) In the second step, we used all ECO’s to characterize communication between subsystems,
in order to capture the full range of communication over the duration of the project. Specifically, we used
the number of distribution lists that include engineers from both subsystem i and subsystem j as the weight
of the link between nodes i and j in the organization coordination network. Note that each distribution list
corresponds to an issue in the product development work, so we count the number of distribution lists rather
than the number of people in establishing the links between subsystems.
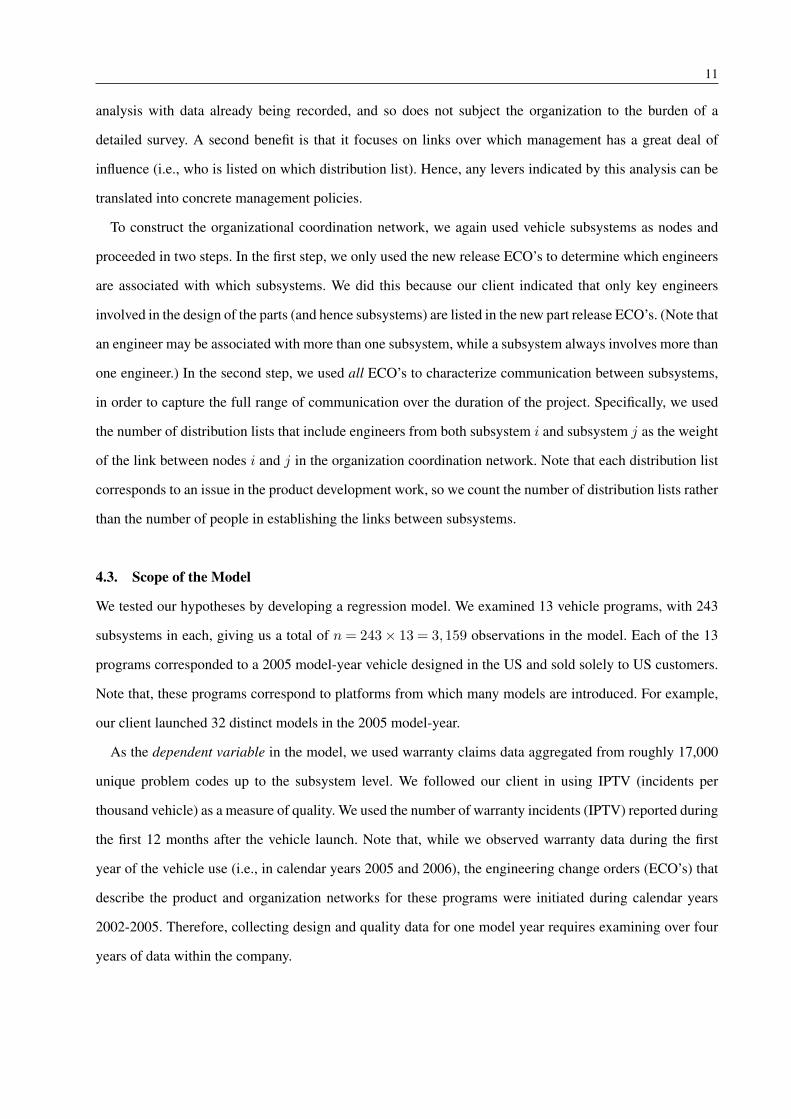
4.3. Scope of the Model
We tested our hypotheses by developing a regression model. We examined 13 vehicle programs, with 243
subsystems in each, giving us a total of n= 243× 13 = 3,159 observations in the model. Each of the 13
programs corresponded to a 2005 model-year vehicle designed in the US and sold solely to US customers.
Note that, these programs correspond to platforms from which many models are introduced. For example,
our client launched 32 distinct models in the 2005 model-year.
As the dependent variable in the model, we used warranty claims data aggregated from roughly 17,000
unique problem codes up to the subsystem level. We followed our client in using IPTV (incidents per
thousand vehicle) as a measure of quality. We used the number of warranty incidents (IPTV) reported during
the first 12 months after the vehicle launch. Note that, while we observed warranty data during the first
year of the vehicle use (i.e., in calendar years 2005 and 2006), the engineering change orders (ECO’s) that
describe the product and organization networks for these programs were initiated during calendar years
2002-2005. Therefore, collecting design and quality data for one model year requires examining over four
years of data within the company.

12
We conducted a similar study by examining the vehicles that were launched in the 2006 model-year to
check the robustness of the model. As before, we focused on 13 vehicle programs, which correspond to 26
distinct models. Since the procedure and the results are very similar to those for the 2005 model-year, we
present them in the Online Appendix.
4.4. Independent Variables
4.4.1. Centrality in the Product Architecture Network: After creating the product architecture net-
work as outlined in the previous section, we calculated the centrality scores of the nodes (subsystems) using
UCINET 61, Borgatti et al. (2002). We use degree centrality, which is computed as the sum of the weights
of the links emanating from a node to characterize the level of connectivity of a subsystem. Subsystems
with higher degree centrality have more interfaces and are therefore, presumably, more complex. Figure 4
illustrates this by showing partial centrality scores for a portion of the product architecture network.
Electrical
TractionSteering
Wheel
Door
Trim Wiring
Harness Battery
19
25434
13 9
Centrality score = 66
Centrality score = 17
Centrality score = 44
Centrality score = 9
Centrality score: 13+43+25+9 = 90
Figure 4 Calculating Degree Centrality in the Product Architecture Network
To look for the U-shaped relationship conjectured in Hypothesis 1, we also included the square of the
degree centrality as an independent variable. A positive coefficient for the linear variable and a negative
coefficient for the squared variable would suggest an inverted U-shaped relationship between degree cen-
trality and warranty claims.
1 UCINET is a social network analysis software package that graphically displays networks and computes most standard networkmetrics.

13
4.4.2. Coordination Deficit Hypothesis 2 conjectures that misalignment between the product architec-
ture and organizational structure is associated with quality problems. The product architecture and orga-
nizational coordination networks defined above provide a means for quantifying misalignment. But there
are many ways to specify and measure mismatches between the two networks. As long as (a) the metric
is computed from the data contained in the product architecture and organizational coordination networks,
and (b) the metric monotonically increases in the extent to which the two networks are misaligned, then it
can be considered as a possible metric. Below, we discuss one such metric that we feel fits the NPD process,
along with three other plausible metrics.
To develop a misalignment metric, we first posit that the interfaces between two subsystems in the prod-
uct architecture network imply a certain number of design issues that must be resolved. This number may be
uncertain, but we assume that it is proportional in expectation to the number of interfaces indicated by the
product architecture network. We further assume that each issue requires some number of communications
to resolve, which again may be uncertain. The product of these two numbers is the number of commu-
nications required to successfully coordinate the two subsystems. If the number of communications falls
short of this limit, then unresolved issues may result in design flaws that lead to warranty claims. Since
each unresolved issue represents an additional flaw, we conjecture that the expected number of warranty
claims is linearly related to the difference between the actual and required number of communications.
However, if the number of actual communications exceeds the required number, then no additional benefit
is gained, since communications about the interfaces between subsystems i and j will not impact design
issues involving interfaces between other pairs of subsystems.
We quantify the above reasoning into a metric that we call the coordination deficit metric. To do this,
we let WA and WC represent the product architecture and coordination networks, respectively, where
WA = [WAij ], and WA
ij represents the weight of the link between nodes i and j in the product architecture
network; and WC = [WCij ], and WC
ij represents the weight of the link between nodes i and j in the orga-
nizational coordination network. Since these weights may have different magnitudes, we normalize them
by dividing by the total weight of the links in each network. This yields Aij = WAij /(
∑i,j W
Aij /2) and
Cij =WCij /(
∑i,j W
Cij /2), whereAij and Cij represent the proportion of total links that are from subsystem
i to subsystem j in the product architecture and organizational coordination networks, respectively. With
14
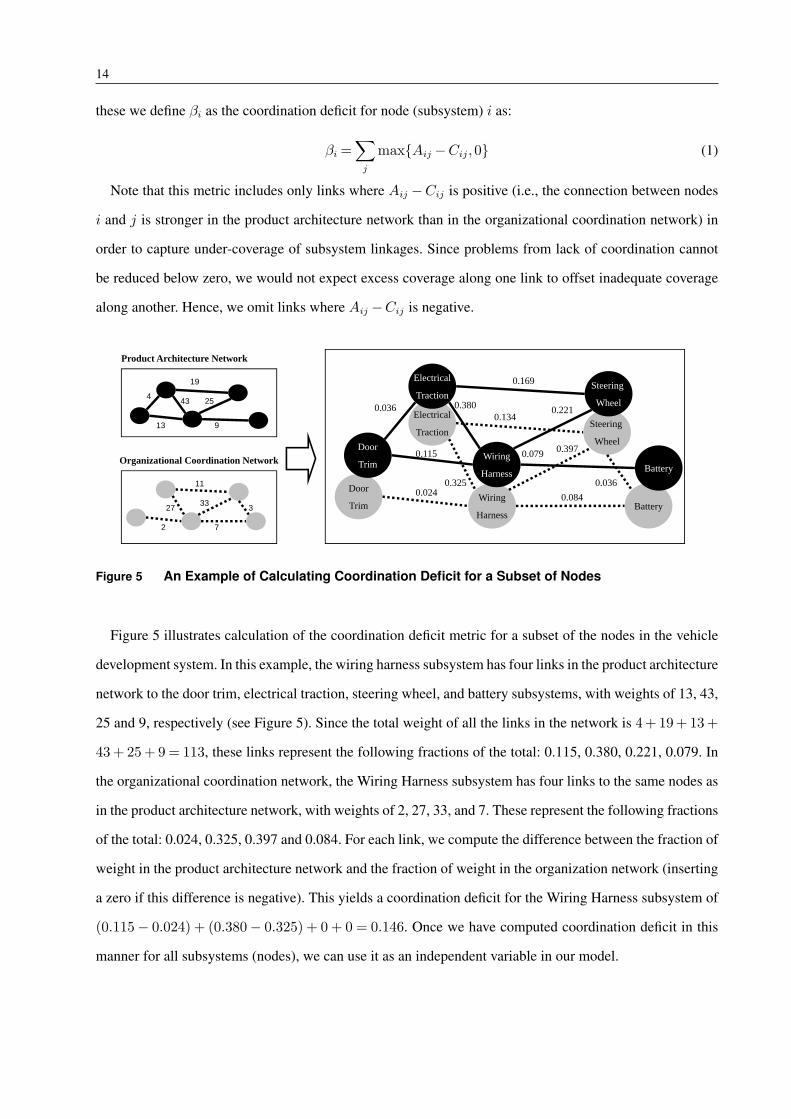
these we define βi as the coordination deficit for node (subsystem) i as:
βi =∑
j
max{Aij −Cij,0} (1)
Note that this metric includes only links where Aij −Cij is positive (i.e., the connection between nodes
i and j is stronger in the product architecture network than in the organizational coordination network) in
order to capture under-coverage of subsystem linkages. Since problems from lack of coordination cannot
be reduced below zero, we would not expect excess coverage along one link to offset inadequate coverage
along another. Hence, we omit links where Aij −Cij is negative.
Product Architecture Network
Organizational Coordination Network
0.169
0.2210.3800.036
0.115 0.079
Electrical
TractionSteering
Wheel
Door
TrimWiring
HarnessBattery
0.134
0.397
0.3250.024 0.084
0.036
Electrical
TractionSteering
Wheel
Door
TrimWiring
Harness Battery
3
11
27
2
19
4
9
2543
13
7
33
Figure 5 An Example of Calculating Coordination Deficit for a Subset of Nodes
Figure 5 illustrates calculation of the coordination deficit metric for a subset of the nodes in the vehicle
development system. In this example, the wiring harness subsystem has four links in the product architecture
network to the door trim, electrical traction, steering wheel, and battery subsystems, with weights of 13, 43,
25 and 9, respectively (see Figure 5). Since the total weight of all the links in the network is 4 + 19 + 13 +
43 + 25 + 9 = 113, these links represent the following fractions of the total: 0.115, 0.380, 0.221, 0.079. In
the organizational coordination network, the Wiring Harness subsystem has four links to the same nodes as
in the product architecture network, with weights of 2, 27, 33, and 7. These represent the following fractions
of the total: 0.024, 0.325, 0.397 and 0.084. For each link, we compute the difference between the fraction of
weight in the product architecture network and the fraction of weight in the organization network (inserting
a zero if this difference is negative). This yields a coordination deficit for the Wiring Harness subsystem of
(0.115− 0.024) + (0.380− 0.325) + 0 + 0 = 0.146. Once we have computed coordination deficit in this
manner for all subsystems (nodes), we can use it as an independent variable in our model.

15
Although our coordination deficit metric is reasonable, it is not the only way to measure mismatches
between the product architecture and organizational coordination networks. To see if another measure might
work better, we considered three alternatives that also satisfy the two criteria we defined above for a metric
to measure misalignment:
1. The Ratio Metric is computed as the ratio of the percent of links in the two networks. That is, we
first calculate the percent of the entire network flow at each link for both architectural and coordination
networks as we did for the coordination deficit metric (i.e., calculating the Aij and Cij). However, unlike
the coordination deficit metric which calculates the difference between the flow at links in two networks,
this metric calculates the ratio between the flow at links in two networks. After calculating the ratios, it
proceeds similar to the coordination deficit metric, and aggregates these ratio values at each node. More
formally, the ratio metric for node (subsystem) i is given by:
Ri =∑
j
max{Aij
Cij
,0} (2)
While this metric is monotonic in the degree of mismatch between the product architecture and orga-
nizational coordination networks, it implies that reducing the number of mismatches will affect quality
(warranty claims) in a nonlinear fashion.
2. The Node Difference Metric is computed as the difference between the centrality score of the sub-
system (node) in the product architecture network and that in organizational coordination network. That
is, if we let Ai =∑
j Aij be the centrality of node i in the product architecture network, and Ci =∑
j Cij
be the centrality of node i in the organizational coordination network, the node difference metric for node
(subsystem) i is given by:
Di = max{Ai−Ci,0} (3)
As such, this metric considers node differences between the two networks, rather than link differences.
3. The Local Deficit Metric is obtained by calculating the percent of flow along each link emanating from
a node. After calculating these flow percentages at each node for both networks, it proceeds in a fashion
similar to the coordination deficit metric and calculates the aggregated deficit scores. Formally, Aij and Cij
are now calculated as Aij =WAij /(
∑j W
Aij ) and Cij =WC
ij /(∑
j WCij ). We then aggregate these for node
(subsystem) i as:
Li =∑
j
max{Aij −Cij,0} (4)

16
Because it normalizes flows at each link by the total flow from that node, rather than total network flow,
the local deficit metric is not sensitive to the total amount of coordination effort associated with a subsystem.
For example, 1 unit of flow between nodes i and j out of a total flow of 10 units from node i is regarded as
equivalent to 10 units of flow between nodes i and j out of a total flow of 100 units from node i.
We examined both the original coordination deficit metric and these three alternate metrics in our regres-
sion analysis, as we discuss in Section 5.
4.5. Control Variables
4.5.1. Previous year’s warranty claims: Although we control for all relevant factors for which we
could obtain data, there may still be unobserved factors such as subsystem characteristics or engineer capa-
bilities, that could bias the results. According to (Wooldridge 2002), “The impact of unobserved variables
bias can be eliminated, or at least mitigated, if a proxy variable is available for the unobserved variables,
and often the outcome of the dependent variable from an earlier time period can be a useful proxy variable”.
Nerkar and Paruchuri (2005) and Heckman and Borjas (1980) used this approach by introducing previous
performance as an independent variable to predict current performance. To control for unobserved factors,
we used warranty claims in the previous year as an independent variable.
4.5.2. Fraction of problematic ECO’s: We included the fraction of problematic ECO’s as a measure
of internal quality problems. The rationale is that the rate of internal quality problems could be a signal of
external warranty issues. Since problematic ECO’s are a result of design related mistakes, a high percentage
of problematic ECO’s is a reasonable proxy for the rate of internal quality problems.
4.5.3. Fraction of new parts: Following Clark et al. (1987), who adjusted for the fraction of new
parts in a vehicle in order to compare the productivity of different auto makers, we include the fraction of
new parts (relative to the previous model year) in a subsystem as a control variable. We would expect to
experience more quality problems with new parts than old ones.
4.5.4. Other controls: We also controlled for the following additional factors:
• Number of parts: This is the total number of parts in a subsystem which may be a proxy for the
subsystem size or complexity.
• Number of engineers: This represents the total number of engineers that appear in the distribution lists
associated with a subsystem, which is another potential proxy for the complexity of that subsystem.

17
• Number of ECO’s: This is the total number of ECO’s that are generated in a subsystem, which may be
yet another indicator of the complexity of a subsystem.
• Average ECO tardiness: This variable is calculated using the targeted completion dates and actual com-
pletion dates of ECO’s. Specifically, it calculates the tardiness for each ECO and then averages it across all
ECO’s in a subsystem. Tardiness could indicate trouble in the design process (bad for quality) or additional
time spent resolving problems (good for quality) and so does not have an obvious expected relationship
with warranty claims.
5. Analysis and Results
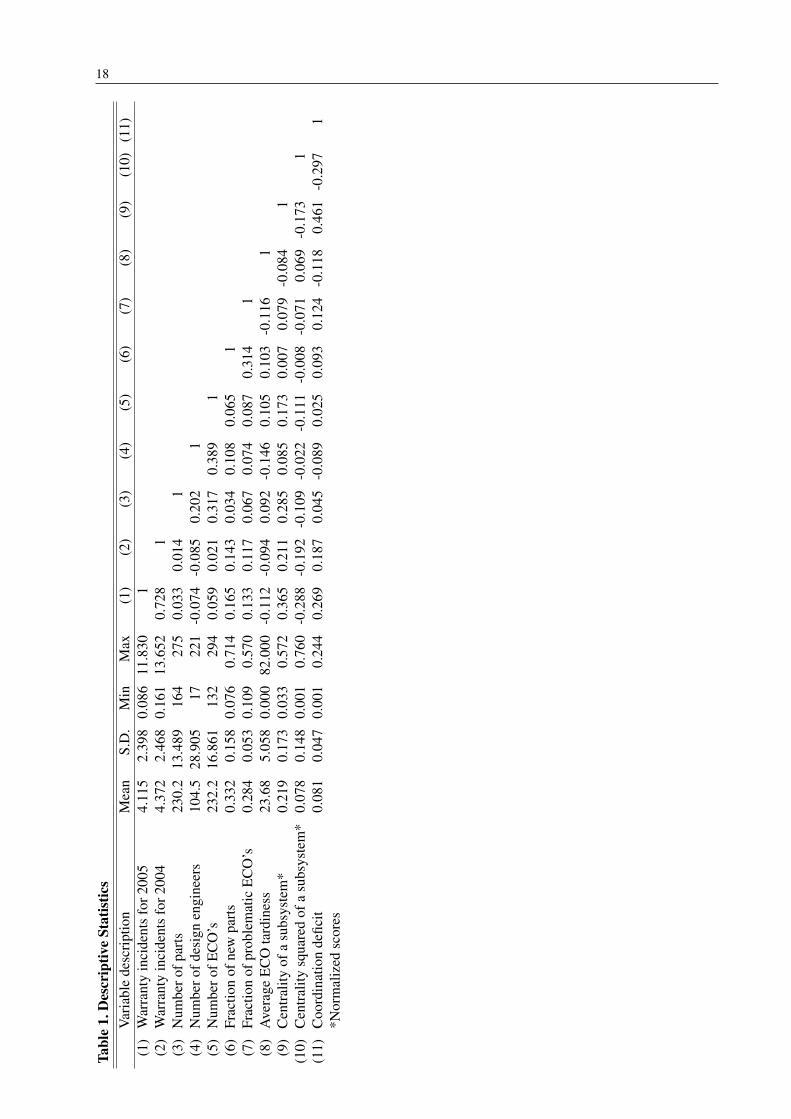
Table 1 shows descriptive statistics and bivariate correlations between the variables in our models. Warranty
incidents for the 2004 and 2005 model years are highly correlated as expected. Furthermore, we note that
both centrality of a subsystem and coordination deficit have positive correlations with 2005 warranty claims.
Our study examines a total of 243 subsystems across 13 vehicle programs. Since we have all subsystems
present in all programs, we have the repeated observations for each of the 243 subsystems. This panel
structure of our data set (i.e., a cross-section of 243 subsystems observed 13 times) allows us to explore both
within and between subsystem variation. By using panel data methods, we can control for the unobserved
subsystem characteristics which could pose a major problem for the OLS estimates (Petersen and Koput
1991).
A fixed-effects model could address the problem of unobserved heterogeneity by including an error term
that is assumed to be constant over vehicle programs for each subsystem, whereas a random-effects model
could address this by inserting an error term that varies randomly over programs for each subsystem. While
random-effects models make use of the (seldom met) assumption that individual effects are uncorrelated
with the regressors, and model individual constant terms as randomly distributed across cross-sectional
units, fixed-effects models impose the most powerful control on unobserved heterogeneity by only examin-
ing within subsystem variation (Greene 2008).
A random-effects model is more appealing to us than a fixed-effects model for two reasons: (i) Fixed-
effects models can produce biased estimates for panels over short time periods (Greene 2008, Hsiao 1986).
Since we only have 13 programs (similar to having 13 time units) and a large number of cross-sections
(N=243), a fixed-effects model may not be appropriate. (ii) Fixed-effects models provide poor estimates of
the effects of the variables that vary only slightly over time (i.e., over the 13 programs) (Kraatz and Zajac
18
Tabl
e1.
Des
crip
tive
Stat
istic
sV
aria
ble
desc
ript
ion
Mea
nS.
D.
Min
Max
(1)
(2)
(3)
(4)
(5)
(6)
(7)
(8)
(9)
(10)
(11)
(1)
War
rant
yin
cide
nts
for2
005
4.11
52.
398
0.08
611
.830
1(2
)W
arra
nty
inci
dent
sfo
r200
44.
372
2.46
80.
161
13.6
520.
728
1(3
)N
umbe
rofp
arts
230.
213
.489
164
275
0.03
30.
014
1(4
)N
umbe
rofd
esig
nen
gine
ers
104.
528
.905
1722
1-0
.074
-0.0
850.
202
1(5
)N
umbe
rofE
CO
’s23
2.2
16.8
6113
229
40.
059
0.02
10.
317
0.38
91
(6)
Frac
tion
ofne
wpa
rts
0.33
20.
158
0.07
60.
714
0.16
50.
143
0.03
40.
108
0.06
51
(7)
Frac
tion
ofpr
oble
mat
icE
CO
’s0.
284
0.05
30.
109
0.57
00.
133
0.11
70.
067
0.07
40.
087
0.31
41
(8)
Ave
rage
EC
Ota
rdin
ess
23.6
85.
058
0.00
082
.000
-0.1
12-0
.094
0.09
2-0
.146
0.10
50.
103
-0.1
161
(9)
Cen
tral
ityof
asu
bsys
tem
*0.
219
0.17
30.
033
0.57
20.
365
0.21
10.
285
0.08
50.
173
0.00
70.
079
-0.0
841
(10)
Cen
tral
itysq
uare
dof
asu
bsys
tem
*0.
078
0.14
80.
001
0.76
0-0
.288
-0.1
92-0
.109
-0.0
22-0
.111
-0.0
08-0
.071
0.06
9-0
.173
1(1
1)C
oord
inat
ion
defic
it0.
081
0.04
70.
001
0.24
40.
269
0.18
70.
045
-0.0
890.
025
0.09
30.
124
-0.1
180.
461
-0.2
971
*Nor
mal
ized
scor
es

19
2001). In our panel data, some of the key variables such as number of design engineers and fraction of new
parts change only slightly across programs. Random-effects models do not share these limitations. They
allow us to examine both within and between subsystem variance in independent and dependent variables.
Nevertheless, we fitted both the random-effects model and fixed-effects model, and conducted a Haus-
man test to determine which specification is more appropriate (Hausman 1978). In this test, under the null
hypotheses, the two estimates do not differ significantly, and therefore the more efficient and consistent
random-effects model is preferable. The Hausman test resulted in a test statistic of χ2 = 11.74, which is
well below the critical value of 15.51 from the chi-squared table. Therefore, the null hypothesis of the
“no statistical differences” is not rejected, which implies that the random-effects model is the appropriate
specification for our data.
Table 2 presents the results of our panel model. Model 1 consists of only the control variables. As we
would expect, this shows that warranty incidents in 2004 is significant (p < 0.01) as a predictor of warranty
incidents in 2005. This confirms that it is an effective proxy variable. Both the fraction of new parts and
the fraction of problematic ECO’s also have significant positive coefficients (p < 0.05), which indicates a
positive association between these variables and warranty incidents. Average ECO tardiness is significant
(p < 0.05) with a negative coefficient, which suggests that ECO’s that take longer to resolve tend to result
in fewer quality problems in the field. Finally, the number of parts and the number of ECO’s in a subsystem
are not significant. This agrees with our on-site observations that: (i) subsystems with more parts are not
necessarily more complex, since some of the simplest subsystems involve many tiny parts, and (ii) total
number of ECO’s itself is not a good quality indicator because many ECO’s are not problem related. Note
that Model 1 explains almost 71% of the variation in 2005 warranty incidents.
5.1. Inverted-U relationship
Model 2a adds the linear and quadratic terms for subsystem centrality in order to investigate Hypothesis 1.
We note that both terms are significant, but that the coefficient is positive for the linear term and negative for
the quadratic term. While this is consistent with the conjectured inverted U-shaped relationship, it is not suf-
ficient to demonstrate it. We must also show an appropriate distribution of the independent variable around
the maximum. Without this, the coefficients might indicate a monotonic concave relationship instead. The

20
Table 2. Models of Warranty Incidents for Product SubsystemsModel 1 Model 2a Model 2b Model 3a Model 3b
Estimation Method: Random-effects Random-effects Fixed-effects Random-effects Fixed-effectsVariable (Controls) (Architecture) (Architecture) (Deficit) (Deficit)
Warranty incidents for 2004 0.6943*** 0.6881*** 0.8319*** 0.7024*** 0.8608***(0.077) (0.077) (0.126) (0.079) (0.131)
Number of parts 0.0038 0.0053 0.0084 0.0049 0.0077(0.013) (0.010) (0.019) (0.014) (0.017)
Number of design engineers -0.0098 -0.0087* -0.0125 -0.0091* -0.0098(0.006) (0.005) (0.008) (0.005) (0.007)
Number of ECO’s 0.0061 0.0066 0.0039 0.0064 0.0043(0.004) (0.004) (0.006) (0.004) (0.006)
Fraction of new parts 3.752** 3.744** 3.108 3.719** 3.325(1.440) (1.472) (2.140) (1.465) (2.144)
Fraction of problematic ECO’s 10.16** 9.653** 6.741** 9.462** 6.722**(5.041) (4.890) (3.127) (4.851) (3.125)
Average ECO tardiness -0.153** -0.147** -0.219* -0.116** -0.236*(0.059) (0.064) (0.115) (0.051) (0.121)
Centrality of a subsystem 3.78*** 2.92***(0.942) (0.874)
Centrality squared -6.07*** -5.13***of a subsystem (1.186) (1.143)
Coordination deficit 2.6975*** 2.3494**(0.997) (0.922)
R-squared 71.00% 72.55% 29.53% 73.95% 30.76%Adjusted R-squared 70.93% 72.46% 29.35% 73.88% 30.61%N 3,159 3,159 3,159 3,159 3,159*p < 0.1, **p < 0.05, ***p < 0.01
Box-Whisker plot in Figure 6, which provides a simple visualization of the data by dividing the sample into
deciles and box-plotting each sub-sample, also supports the inverted-U relationship.
To further check the inverted-U relationship, we performed two calculations (please see the Appendix for
details): (i) First, we calculated the location of the inflection point (i.e., the maximum) which corresponds to
(3.78−2×6.07×x= 0) or x= 0.311. This value is about half a standard deviation above the mean, which
supports the inverted-U relationship. (ii) We divided the data into deciles, conducted separate regressions
within each sub-sample, and observed the pattern of the coefficient of subsystem centrality. The estimated
coefficients in these separate regressions confirm the inverted-U relationship with the maximum in the
seventh decile. We also checked for outliers, since a significant curvilinear relationship between subsystem
centrality and warranty incidents might be attributed to a few outliers in subsystem centrality. We did not
detect any influential outliers using Cook’s distance (Cook and Weisberg 1982).
Note that the behavior of the control variables is quite similar in Models 1 and 2a. Also note that with
the addition of subsystem centrality variables (both the linear and quadratic term), the adjusted R squared
improves from 70.93% to 72.46% despite the loss of two degrees of freedom. Hence, we conclude that

21
Model 2a supports Hypothesis 1 and indicates an inverted-U relationship between subsystem centrality and
warranty incidents.
5.2. Coordination Deficit
Model 3a replaces the two subsystem centrality variables with our coordination deficit metric as a predictor
and shows coordination deficit metric to be highly significant (p < 0.01) with a positive coefficient. Note
that, instead of including both subsystem centrality and coordination deficit in the model simultaneously,
the coordination deficit variable replaces the subsystem centrality variable.
The reason for this is that it is our theory that both variables are proxies for the same effect, namely that
mismatches between the organizational coordination network and the product architecture network increase
the likelihood of warranty claims. However, subsystem centrality captures this effect only very roughly,
by suggesting through the observed inverted-U relationship that intermediate centrality subsystems tend to
exhibit higher levels of warranty incidents. In contrast, coordination deficit measures the mismatches much
more directly by incorporating information about the organizational coordination network, as well as the
product architecture network. That the two variables overlap in their predictive role is supported by the fact
that they are correlated (correlation coefficient = 0.461). That they are not identical is supported by the fact
that a regression including both subsystem centrality and coordination deficit has both variables significant
(at the 5% level).
We observe that, although the majority of the explanatory power of the model comes from the previ-
ous year’s warranty claims, adding the coordination deficit metric to the original control variables causes
adjusted R squared to improve from 70.93% in Model 1 to 73.88% in Model 3a. Hence, Model 3a sup-
ports Hypothesis 2 by suggesting that coordination deficit and warranty incidents are positively associated.
The fact that R-squared is higher in Model 3a than in Model 2a suggests that coordination deficit is a
better predictor of warranty claims than is subsystem centrality. This makes sense because coordination
deficit contains much more information about the system than does subsystem centrality. Finally, note that,
coefficients of the variables are quite stable across models. This supports our earlier observation that multi-
collinearity is not a problem. But it also suggests that the magnitudes of the coefficients are a good gauge
of the effects.
In addition to the three models presented in Table 2, we ran versions of Model 3a using the ratio, node
difference and local deficit metrics presented in Section 4.4.2. However, none of these metrics were signif-

22
icant. Given the logical flaws in these metrics, this is not surprising. The ratio metric assumed a nonlinear
relationship between reduction in mismatches and warranty claims which is hard to defend considering
the observation in Section 4.4.2 that architectural interfaces generate issues requiring communications to
resolve, implying a linear relationship between warranty claims and mismatches. The node difference met-
ric is a coarser measure of mismatches than the coordination deficit metric because there are many fewer
nodes than links, which explains why it did not work as well in predicting quality problems. Finally, the
local deficit metric used the normalization of flows at each node, and did not consider the flows in the other
parts of the network. Hence, this metric cannot detect some kinds of misalignment that are detected by the
coordination deficit metric and consequently it was less effective.
0
2
4
6
8
10
12
14
Decile1 Decile2 Decile3 Decile4 Decile5 Decile6 Decile7 Decile8 Decile9 Decile10
q1
min
median
max
q3
Warranty incide
nts
Centrality Deciles
Figure 6 Box-Whisker Plot for Subsystem Centrality and Warranty Incidents
5.3. Checking for Endogeneity and the Robustness of Results
Since some of the covariates in our models include measures that are potentially endogenous (e.g., assign-
ment of distribution lists, etc.), it is important to examine potential endogeneity issues and their impact
on the results. Although the Hausman test suggested that a random-effects model is appropriate for our
data, we also examined the results of the fixed-effects model which specifically controls for the unobserved
heterogeneity. We present the results of the fixed-effects regressions in Models 2b and 3b. Note that the
23
coefficients and significance levels of the variables in these fixed-effects models are different than those in
the earlier random-effects models due to different model assumptions. Also, since the fixed-effects mod-
els only exploits within subsystem variation, the R2 values are significantly lower than the random-effects
models. The main conclusion from Models 2b and 3b is that our main variables of interest, product network
centrality and coordination deficit, are significant at the 0.01 and 0.05 levels. This provides further support
for our earlier results.
One significant variable that may be effected by such endogeneity problem is coordination deficit. In
order to examine the endogeneity of coordination deficit, we created a two-stage least squares (2SLS)
random-effects model (Baltagi 2001). In this procedure, in the first stage we regress all exogenous variables
on the suspected endogenous variable (i.e., coordination deficit) and get the fitted values. Here we use
number of new release ECO’s, number of new release parts, and number of engineers working on new
release parts as the instruments. We expect these variables to have a direct effect on coordination deficit, but
no effect on warranty claims other than their indirect effect through coordination deficit. We then calculate
the second stage model using the fitted values created in the first stage. The results of the 2SLS random-
effects model showed that all pairs of coefficients are within a 90% confidence interval of the original
random-effects model, suggesting that endogeneity does not pose a threat for our analysis.
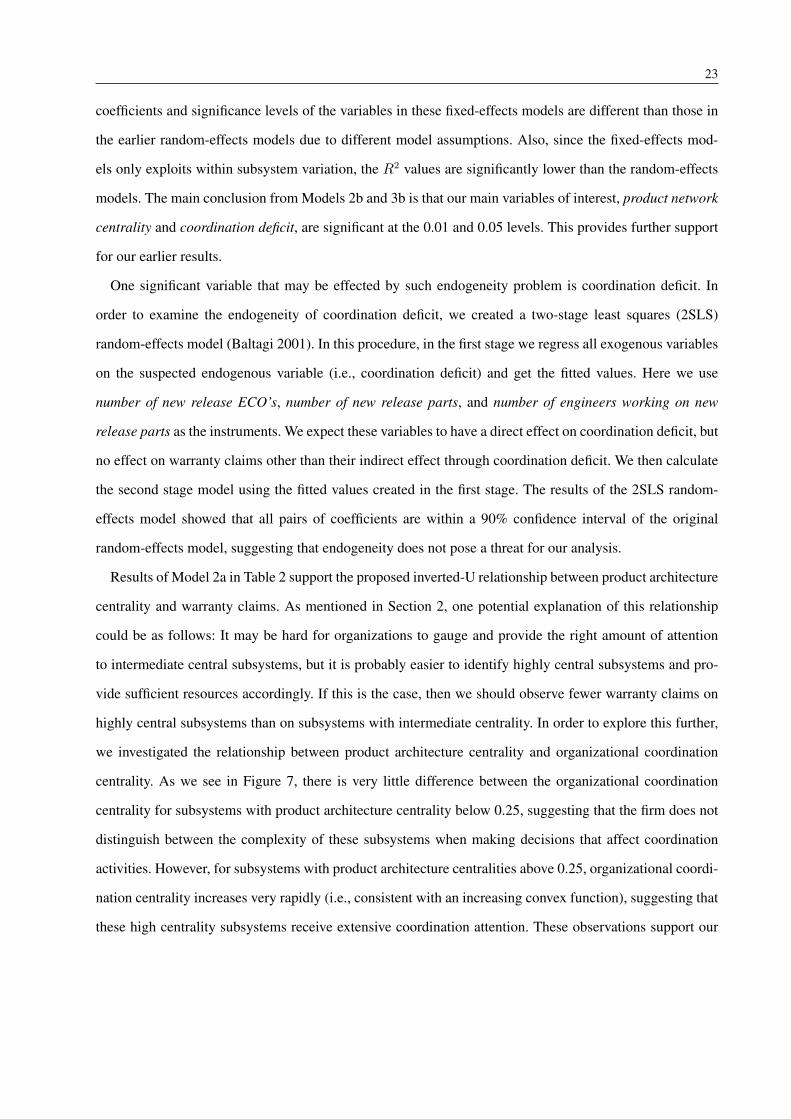
Results of Model 2a in Table 2 support the proposed inverted-U relationship between product architecture
centrality and warranty claims. As mentioned in Section 2, one potential explanation of this relationship
could be as follows: It may be hard for organizations to gauge and provide the right amount of attention
to intermediate central subsystems, but it is probably easier to identify highly central subsystems and pro-
vide sufficient resources accordingly. If this is the case, then we should observe fewer warranty claims on
highly central subsystems than on subsystems with intermediate centrality. In order to explore this further,
we investigated the relationship between product architecture centrality and organizational coordination
centrality. As we see in Figure 7, there is very little difference between the organizational coordination
centrality for subsystems with product architecture centrality below 0.25, suggesting that the firm does not
distinguish between the complexity of these subsystems when making decisions that affect coordination
activities. However, for subsystems with product architecture centralities above 0.25, organizational coordi-
nation centrality increases very rapidly (i.e., consistent with an increasing convex function), suggesting that
these high centrality subsystems receive extensive coordination attention. These observations support our

24
reasoning behind Hypothesis 1 that intermediate centrality subsystems may not be receiving coordination
effort commensurate with their complexity.
From the results of the models in Table 2, it is clear that warranty claims in the previous year has a large
impact on the warranty claims this year. In order to check the robustness of coefficients of the other variables
in the models, we removed this lagged variable from the models and and re-ran the statistical analysis. We
did not observe a significant change in the direction or impact of the coefficients, but as expected, the overall
explanatory power of the models were reduced (e.g., adjusted R-squared of Model 2 was reduced to around
11% from 69%) by excluding of the lagged variable.
y = 1.114x2 - 0.249x + 0.072
R² = 0.471
0
0.05
0.1
0.15
0.2
0.25
0.3
0.35
0.4
0 0.1 0.2 0.3 0.4 0.5 0.6 0.7
Product architecture centrality
Org
aniz
atio
nal c
oord
inat
ion
cent
ralit
y
Figure 7 Organizational coordination vs. product architecture centrality
5.4. Economic Significance of Coordination Deficit
In addition to the statistical analyses, we conducted an analysis of economic significance in order to get
a sense of the magnitude of the association between coordination deficit and warranty claims. Following
the convention used in other studies (see, Nerkar and Paruchuri 2005, Song et al. 2003) we computed the
percentage change in the dependent variable (i.e., warranty claims) associated with a one standard deviation
change in the independent variable (i.e., coordination deficit), evaluated at the mean of the data. Reducing
coordination deficit by one standard deviation (which is equal to 0.047) from the mean in our model predicts
a 2.6975× 0.047 = 0.127 unit reduction in warranty claims, which represents a 0.127÷ 4.115 = 3.08%
25
percent reduction. For our client, this would translate into millions of dollars annually in direct savings,
plus an important reputational benefit (i.e., because Consumer Reports and other rating services consider
warranty claims in their evaluation and recommendation of vehicles).
While a 3.08% reduction in warranty claims is economically important, the percentage of quality issues
that are related to coordination deficit may actually be substantially larger than this. The reason is that
in our model, the variable representing warranty claims from the previous year may also contain claims
that are associated with coordination deficit (i.e., design flaws that were introduced in previous years and
carried over to this year’s model through part re-use). So, if the firm were to reduce coordination deficit by
one standard deviation in each design cycle, some of the quality improvements would carry over to future
vehicles (through components based on previous designs). Although one can not calculate this carry-over
effect of the reduction in coordination deficit with precision, we can get an approximate figure by using our
models.
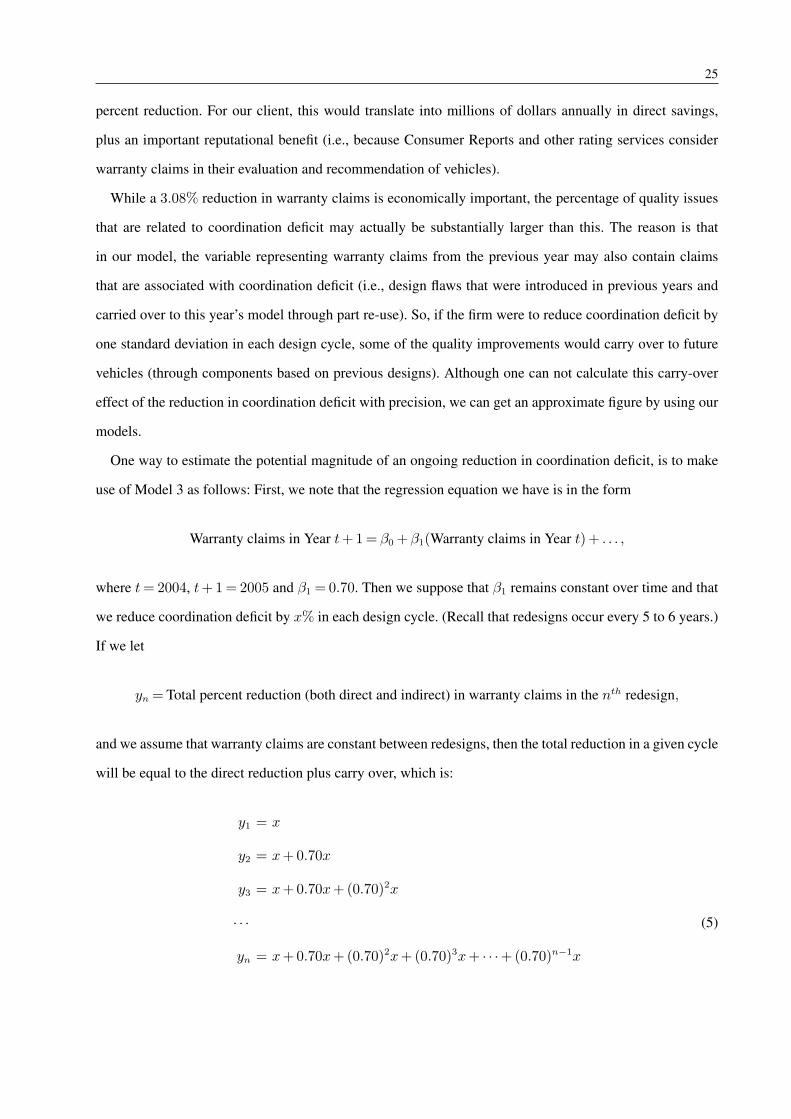
One way to estimate the potential magnitude of an ongoing reduction in coordination deficit, is to make
use of Model 3 as follows: First, we note that the regression equation we have is in the form
Warranty claims in Year t+1 = β0 +β1(Warranty claims in Year t)+ . . . ,
where t= 2004, t+ 1 = 2005 and β1 = 0.70. Then we suppose that β1 remains constant over time and that
we reduce coordination deficit by x% in each design cycle. (Recall that redesigns occur every 5 to 6 years.)
If we let
yn = Total percent reduction (both direct and indirect) in warranty claims in the nth redesign,
and we assume that warranty claims are constant between redesigns, then the total reduction in a given cycle
will be equal to the direct reduction plus carry over, which is:
y1 = x
y2 = x+0.70x
y3 = x+0.70x+(0.70)2x
· · · (5)
yn = x+0.70x+(0.70)2x+(0.70)3x+ · · ·+(0.70)n−1x

26
As n→∞, this geometric series converges to x+x[0.70/1−0.70] = 3.33x. So, if coordination deficit is
reduced by one standard deviation (i.e., x= 3.08%), and if there is no redesign at all, then the percent war-
ranty reduction in the nth year converges to 3.33×3.08% = 10.26% when n is large. If, instead, we assume
that, because of technology change and model retirement, the dependence on old designs extends back
only five design cycles, then an ongoing one standard deviation reduction in coordination deficit ultimately
results in a y5×x (= 2.94× 3.08% = 9.06%) reduction in warranty claims.
To get a sense of the total number of warranty claims that are associated with mismatches between the
organizational coordination and product architecture networks (as opposed to the improvement predicted
by our model for a realistically achievable one standard deviation reduction in coordination deficit), we
consider the predicted impact eliminating coordination deficit entirely. According to Model 3, this would
result in a 5.3% direct reduction in warranty claims, which would yield a reduction of 3.33 × 5.3% =
17.65% in the limit, and a reduction of 2.94×5.3% = 15.58% if the carryover effect is limited to five design
cycles.
Although these calculations give us a general sense of the impact of ongoing reduction in coordination
deficit, we should be cautious in interpreting the individual coefficients and carry-over effects. In the above
calculations, warranty claims from the previous year is a proxy variable, which may include many causal
effects, of which coordination deficit is only one. Using our regression model to estimate the amount of this
variable that is attributable to coordination deficit is reasonable, but far from precise. Moreover, since we
would expect design flaws from prior years to get corrected over time, our estimate is probably an upper
bound on the overall economic impact of coordination deficit reductions on warranty claims.
According a 2006 J.D Power and Associates quality survey, an average 52 of the 124 (i.e., 42%) of quality
problems observed in automobiles were design defects (Jensen 2006). If that is true, then our analysis
suggests that almost half of these design related warranty claims are due to organizational coordination
problems. The rest, presumably, are associated with individual errors.
Along with the cost savings, these numbers also indicate a major potential reputational benefit. For exam-
ple, in a recent J.D Power and Associates initial quality survey, Toyota observed 104 complaints per 100
vehicles (4th in ranking), while Honda observed 110 (7th in ranking), Ford observed 112 (8th in rank-
ing), and Chevrolet observed 113 problems (10th in ranking) in the first 90 days of ownership (Bennett
and Boudette 2008). While these complaints are not the same as our warranty incidents, they are certainly
related. Since these numbers are very close for the brands, a 10% reduction could move a brand from

27
10th place to 3rd place. So, relatively small improvements in warranty incidents, could make a significant
improvement in a firm’s quality rankings, and hence its reputation.
6. Discussion
Our analysis shows that warranty claims in the previous year have significant power for predicting warranty
claims this year. Indeed, when we use only the previous year’s warranty claims in a simple regression, it
explains about 55% of the variation in this year’s warranty claims. While intuitive, this result is not of great
managerial use, since it merely implies that trouble spots in a vehicle tend to persist over time. In this sense,
using last year’s warranty claim data to predict this year’s warranty claims is a bit like using yesterday’s
weather to predict today’s weather. There is a substantial correlation, but the model is obvious. Only by
going beyond this level of prediction can we derive useful forecasts.
We also observed a positive correlation between the fraction of problematic change orders and the number
of warranty claims. Subsystems for which we observe a high percentage of problems during design are
the very subsystems that result in a higher number of warranty incidents. The implication is that engineers
fix some of the design problems by issuing and resolving ECO’s, but not all of them. Since some design
problems reach the marketplace and lead to warranty claims, management efforts to reduce the problematic
change orders will both speed the vehicle development process and improve vehicle quality.
Another factor shown by our analysis to be correlated with warranty claim incidents is the percentage of
new parts in a subsystem. This is intuitive given the learning involved in the design of a new part. From a
management perspective, this implies that design organizations should devote extra attention and resources
to subsystems with higher fractions of new parts. While our client clearly knew this already, the fact that
warranty claims are still positively correlated with the fraction of new content suggests that current levels
of attention and/or resources may not be enough.
A somewhat counter-intuitive implication of our results is that, tardiness of engineering change orders
and quality problems are negatively correlated. Although one might expect tardiness to compromise quality
(e.g., by causing haste or chaos in the design process), we observed that subsystems with more ECO tardi-
ness tend to have fewer quality problems in the field. This may be due to a simple time vs. quality tradeoff;
more time on a component results in a lower probability of a problem, even at the expense of missing due
dates. Of course, while missing a due date in order to spend more time on a given component may improve
that component, it may also be detrimental to other components or the vehicle launch as a whole. So, while

28
this result may suggest that management should be careful about compressing design times too much, it
certainly should not be taken as support for missing due dates established by the ECO system.
The inverted-U association we observed between subsystem centrality and warranty incidents suggests
that subsystems of intermediate centrality are more prone to quality problems. We conjecture that this is
due to the fact that intermediate centrality parts are more difficult to evaluate with regard to their complexity
than are high centrality parts (which are obviously complex) or low centrality parts (which are obviously
simple). As such, it is more difficult to determine the appropriate amount of resources and coordination
effort for intermediate centrality parts than for either high or low centrality parts. While intriguing from a
research perspective, this result does not identify specific subsystems in need of greater attention and hence
is of limited managerial use.
Our most important contributions are: (1) introduction of the coordination deficit metric for quantify-
ing mismatches between the product architecture and the organizational structure and (2) showing that
this metric is positively correlated with warranty claim incidents. This result is significant to the literature
on network analysis of product development systems because (a) it is the first effort to formally measure
misalignment between an organization and its assigned work, and (b) it provides support for the common
conjecture that misalignment of the design organization with the product architecture is detrimental to per-
formance.
From a management perspective this work suggests some potentially appealing insights. First, our anal-
ysis highlights a means for mining ECO system data to monitor the alignment of the organization with
the product being designed. Our coordination deficit metric provides a simple quantitative measure of the
degree of mismatch and points out specific pairs of subsystems where the level of formal coordination is less
than the extent of connectivity in the product architecture. Such pairs of subsystems may be candidates for
additional coordination attention. Since the coordination deficit metric also identifies pairs of subsystems
where the level of coordination activity exceeds the amount of connectivity in the product architecture, it
may also suggest places where coordination efforts can be reduced with minimal impact on performance.
This suggests that it is possible to improve the match between organizational coordination and the product
architecture without increasing the total amount of coordination activity.
Although the statistical correlations we have identified in this study only suggest, rather than prove,
causality, the existence of a positive association between coordination deficit and quality problems is of
managerial interest. Due to the large cost of design quality problems (e.g., recalls), managers of product

29
development organizations must be sensitive to any factor that may have an impact on design quality prob-
lems. No statistical study (e.g., of the type used in Six Sigma programs) can ever provide proof of causality,
so managers can only pursue improvements by addressing factors shown to be associated with quality
problems. Our paper introduces and quantifies coordination deficit as one such factor. Furthermore, since
researchers and practitioners have been arguing (indeed assuming) that alignment of the organization with
the product is desirable, our findings are consistent with current management theory. Our results support
this theory and provide concrete guidance on how to act upon it in practice.
7. Conclusions
In this paper we have presented an empirical model that characterizes the misalignment of the product
architecture and organizational interactions and have investigated the impact of this misalignment on quality
(measured by warranty claims) in a vehicle development process. Our results suggest that organizational
factors and product architecture have a significant impact on quality.
Our analysis made use of data from an Engineering Change Order (ECO) system like that used in most
product development processes. These data enabled us to specify both product architecture and organiza-
tional coordination networks. As such, our study is the first of which we are aware that bases a network
analysis of the product development process entirely on standard data from a firm’s information system.
Because we do not rely on cumbersome and time consuming surveys, our methodology is more likely to
find use in practice than survey based methods.
Our work, along with the other studies that have made use of emerging tools of complex networks to
characterize both product architecture (a network of components) and organizational structure (a network
of people), highlight the potential importance of such network tools to the science and practice of new
product development. Our results suggest that misalignment of the design organization with the product
architecture negatively affects product quality and uses network tools to highlight the specific areas of
misalignment. Sosa et al. (2004, 2007) suggest that such misalignments are influenced by various features
of the organizational structure and use network tools to characterize these features. Because of the power
and flexibility of these network tools, they are already becoming a standard part of the NPD research tool
kit. We expect them to become similarly prevalent as practical management tools in the future.
To further the science and practice of NPD processes, this work could be extended in several directions.
First, our research exclusively relied on archival (e.g. ECO, warranty) data. While this is of substantial prac-

30
tical use, since it captures formal connections, it leaves out informal connections, such as communication
outside the channels indicated by the distribution lists. Hence, a complementary study could make use of
surveys or email/phone records to characterize informal communication for use as an additional predictor
of quality performance.
A second dimension along which our model could be refined is the granularity of the product data. We
have performed our analysis at the subsystem level. This was largely due to the fact that our client only had
warranty claims data that could be appropriately aggregated at this level. But if we could obtain warranty
claims at the part level, we could perform a much more detailed analysis of the impact of coordination deficit
on product quality. Our expectation is that this would facilitate more precise matching of the organization
structure to product architecture. It would also enable more accurate prediction of potential quality trouble
spots.
Finally, we note that the ultimate managerial purpose of this type of analysis is to better adapt the design
organization to the products being developed. Our results provide an approach for identifying gaps between
organization structure and product architecture. But we have only analyzed vehicle programs for one model
year. To get a deeper understanding of how vehicle architectures evolve over time and where the organiza-
tional coordination practices lag behind product changes, it would be useful to perform a longitudinal study
over multiple model years. While getting data extending back across multiple design cycles would be a
huge challenge, such an analysis would represent an important step in the use of complex network methods
to further the science of product development.
Acknowledgments
The authors gratefully acknowledge the support of this research by the National Science Foundation under grantsDMI-0423048 and DMI-024377.
ReferencesAdler, P.S., A. Mandelbaum, V. Nguyen, E. Schwerer. 1995. Problem solving oscillations in complex engineering
projects. Management Science 41 458–484.
Baldwin, C. Y., K. B. Clark. 2000. Design Rules: the Power of Modularity. MIT Press, Cambridge, MA.
Baltagi, B. 2001. Econometric Analysis of Panel Data (2nd ed). John Wiley and Sons, New York.
Bennett, J., N. E. Boudette. 2008. Ford and gm show gains in quality survey. The Wall Street JournalHttp://online.wsj.com/article/SB121259964651445519.html.
Borgatti, S. P., M. G. Everett, L. C. Freeman. 2002. Ucinet for Windows: Software for Social Network Analysis.Analytic Technologies, Harvard, MA.
Brown, S. L., K. M. Eisenhardt. 1995. Product development: Past research, present findings, and future directions.Academy of Management Review 20(2) 343–378.

31
Burt, R. S. 2004. Structural holes and good ideas. American Journal of Sociology 110 349–399.
Carlile, P. R. 2002. A pragmatic view of knowledge and boundaries: Boundary objects in new product development.Organization Science 13(4) 442–455.
Clark, K. B., W. B. Chew, T. Fujimoto, J. Meyer, F. M. Scherer. 1987. A practice-centered model of organizationalrenewal through product innovation. Brookings Papers on Economic Activity 3 729–781.
Clark, K. B., T. Fujimoto. 1990. The power of product integrity. Harvard Business Review 68.
Clark, K. B., T. Fujimoto. 1991. Product Development Performance: Strategy, Organization, and Management in theWorld Auto Industry. Harvard Business School Press, Boston, MA.
Contractor, N. S., P. R. Monge. 2002. Managing knowledge networks. Management Communication Quarterly 16(2)249–258.
Cook, R. D., S. Weisberg. 1982. Residuals and Influence in Regression. Chapman and Hall, London.
Ethiraj, S. K., D. Levinthal. 2004. Modularity and innovation in complex systems. Management Science 50(2) 157–173.
Fleming, L., O. Sorenson. 2004. Science as a map in technological search. Strategic Management Journal 25 909–928.
Greene, W. H. 2008. Econometric Analysis(6th edition). Prentice Hall, Upper Saddle River, NJ.
Hansen, M. T. 2002. Knowledge networks: Explaining effective knowledge sharing in multiunit companies. Organi-zation Science 13(3) 232–248.
Hausman, J. A. 1978. Specification tests in econometrics. Econometrica 46 1251–1271.
Heckman, J.J., G.J. Borjas. 1980. Evolution of r and d capabilities: The role of knowledge networks within a firm.Economica 47 247–283.
Henderson, R. M., K. B. Clark. 1990. Architectural innovation: The reconfiguration of existing product technologiesand the failure of established firms. Administrative Science Quarterly 35 9–30.
Hsiao, C. 1986. Analysis of Panel Data. Cambridge University Press, Cambridge, UK.
Huang, G.Q., K.L. Mak. 1999. Current practices of engineering change management in uk manufacturing industries.International Journal of Operations and Production Management 19(1) 21–37.
Ibarra, H. 1993. Network centrality, power, and innovation involvement: Determinants of technical and administrativeroles. Academy of Management Journal 36(3) 471–501.
Jensen, C. 2006. Design quirks erode ’06 quality ratings. The New York TimesHttp://www.nytimes.com/2006/06/11/automobiles/11QUALITY.html.
Kraatz, M. S., E. J. Zajac. 2001. How organizational resources affect strategic change and performance in turbulentenvironments: Theory and evidence. Organization Science 12(5) 632–657.
Krackhardt, D., J. R. Hanson. 1993. Informal networks: The company behind the chart. Harvard Business Review71(4) 104–111.
Krishnan, V., K. T. Ulrich. 2001. Product development decisions: A review of the literature. Management Science47(1) 1–21.
Loch, C. H., C. Terwiesch. 1999. Accelerating the process of engineering change orders: Capacity and congestioneffects. Journal of Product Innovation Management 16(2) 145–159.
McGregor, J. 2006. The world’s most innovative companies. BusinessWeekHttp://www.businessweek.com/print/magazine/content/0617/b3981401.htm?chan=gl.
Mihm, J., C. Loch, A. Huchzermier. 2003. Problem solving oscillations in complex engineering projects. ManagementScience 46 733–750.
Nerkar, A., S. Paruchuri. 2005. Evolution of r and d capabilities: The role of knowledge networks within a firm.Management Science 51 771–785.
Nonaka, I., H. Takeuchi. 1995. The knowledge-creating company: How Japanese companies create the dynamics ofinnovation. Oxford University Press, New York.
Petersen, T., K. Koput. 1991. Density dependence in organizational mortality: Legitimacy or unobserved heterogene-ity? American Sociological Review 56 399–409.

32
Roberts, P. W. 1999. Product innovation, product-market competition and persistent profitability in the u.s. pharma-ceutical industry. Strategic Management Journal 20(7) 655–670.
Sanchez, R., J. T. Mahoney. 1996. Modularity, felixibility and knowledge management in product and organizationdesign. Strategic Management Journal 17 63–76.
Schilling, M. A. 2002. Toward a general modular systems theory and its application to interfirm product modularity.Academy of Management Review 25(2) 312–334.
Song, J., P. Almeida, G. Wu. 2003. Learning-by-hiring: When is mobility more likely to facilitate interfirm knowledgetransfer? Management Science 49 351–365.
Sosa, M., S. D. Eppinger, C. M. Rowles. 2004. The misalignment of product architecture and organizational structurein complex product development. Management Science 50(12) 1674–1689.
Sosa, M. E., M. Gargiulo, C. Rowles. 2007. Component connectivity, team network structure and the attention totechnical interfaces in complex product development. Working paper. INSEAD .
Terwiesch, C., C. H. Loch. 1999. Managing the process of engineering change orders: The case of the climate controlsystem in automobile development. Journal of Product Innovation Management 16(2) 160–172.
Ulrich, K. 1995. The role of product architecture in the manufacturing firm. Research Policy 24 419–441.
Wasserman, S., K. Faust. 1994. Social Network Analysis. Cambridge University Press, London.
Wooldridge, J. M. 2002. Econometric Analysis of Cross Section and Panel Data. The MIT Press, Cambridge, MA.

33
ONLINE APPENDIXThe Impact of Product Architecture and Organization Structure on
Quality in Complex Product Development
by: Gokpinar, Hopp and Iravani
A. Robustness of Inverted-U Relationship between Product Architecture Centrality and WarrantyClaims
We performed additional analysis to check the validity of our proposed inverted-U relationship between the
centrality of a subsystem in the product architecture network and warranty claims.
First, we considered the location of the inflection point (i.e., the level of subsystem centrality where
the warranty claims reach its maximum). Technically, this point is where the first partial derivative of the
regression equation with respect to subsystem centrality is equal to zero. To identify the inflection point,
we set the partial derivative (with respect to the subsystem centrality) of the regression equation of Model
2 equal to zero. Solving 3.78− 2(6.07)x= 0 for x, we found that the inflection point is located at a level of
subsystem centrality equal to 0.311.
We also divided the sample into deciles and for each sub-sample we conducted separate regressions and
examined the coefficient of subsystem centrality.
Table A.1. Coefficients of Subsystem Centrality for Each Decile
Decile 1 Decile 2 Decile 3 Decile 4 Decile 5 Decile 6 Decile 7 Decile 8 Decile 9 Decile 10β: 1.09 3.65 4.29 3.86 1.61 1.53 0.41 −0.68 −1.33 −1.82
Table A.1 shows the coefficients of these separate regressions. Note that the coefficients are positive for
the deciles below decile 7 where the inflection occurs, and negative for the deciles above it. These robustness
checks verify and confirm the inverted U relationship between subsystem centrality and warranty claims.
B. Replicating the Analysis for 2006 Model Year
We have duplicated our empirical analysis (which was originally for the 2005 model year) for the 2006
model year. Comparing two data sets from the same group representing two different time periods has been
likened to a quasi experiment in a natural setting (Lee 1987), and was applied successfully in examining
individual performance and centrality in virtual R&D groups (Ahuja et al. 2003). Clark and Fujimoto (1991)
also used two different years to verify the stability of their regression results in an automotive product
development environment.

34
Tabl
eA
.2.D
escr
iptiv
eSt
atis
ticsf
or20
06M
odel
Year
Var
iabl
ede
scri
ptio
nM
ean
S.D
.M
inM
ax(1
)(2
)(3
)(4
)(5
)(6
)(7
)(8
)(9
)(1
0)(1
1)(1
)W
arra
nty
inci
dent
sfo
r200
64.
542
2.52
80.
139
17.5
401
(2)
War
rant
yin
cide
nts
for2
005
4.11
52.
398
0.08
611
.830
0.68
51
(3)
Num
bero
fpar
ts24
8.5
10.4
3618
329
9-0
.082
0.03
81
(4)
Num
bero
fdes
ign
engi
neer
s12
9.4
22.6
5424
202
-0.1
140.
045
0.16
71
(5)
Num
bero
fEC
O’s
264.
412
.011
154
368
0.10
8-0
.029
0.28
50.
309
1(6
)Fr
actio
nof
new
part
s0.
272
0.17
50.
049
0.63
40.
142
0.16
60.
074
0.13
30.
105
1(7
)Fr
actio
nof
prob
lem
atic
EC
O’s
0.34
10.
106
0.09
20.
593
0.11
20.
185
0.04
1-0
.021
0.06
50.
347
1(8
)A
vera
geE
CO
tard
ines
s27
.99
5.67
70.
000
113.
000
-0.1
85-0
.028
-0.0
46-0
.259
0.13
30.
087
-0.1
261
(9)
Cen
tral
ityof
asu
bsys
tem
*0.
263
0.20
40.
064
0.49
80.
294
0.30
40.
229
0.09
20.
118
0.02
10.
044
-0.0
661
(10)
Cen
tral
itysq
uare
dof
asu
bsys
tem
*0.
095
0.16
10.
001
0.73
9-0
.362
-0.1
59-0
.126
0.00
5-0
.137
0.01
3-0
.051
0.08
8-0
.206
1(1
1)C
oord
inat
ion
defic
it0.
115
0.06
80.
001
0.29
10.
225
0.20
70.
028
-0.0
510.
019
0.12
80.
095
-0.1
390.
518
-0.3
251
*Nor
mal
ized
scor
es

35
Table A.2 presents the descriptive statistics and bivariate correlations between the variables for the 2006
model year. Note that, the general pattern of the bivariate correlations is quite similar to that for the 2005
model year. One significant difference is the increase in correlation between subsystem centrality and coor-
dination deficit from 0.461 to 0.518 for the 2006 model year.
Table A.3. Random-effects Model of Warranty Incidents For Product SubsystemsModel 1 Model 2 Model 3
Variable (Controls) (Architecture) (Deficit)Warranty incidents for 2004 0.661*** (0.071) 0.653*** (0.069) 0.687*** (0.074)Number of parts 0.0052 (0.011) 0.044 (0.012) 0.0033 (0.014)Number of design engineers -0.0071* (0.004) -0.0063* (0.004) -0.0070* (0.004)Number of ECO’s 0.0047 (0.003) 0.0052 (0.003) 0.0042 (0.003)Fraction of new parts 2.649** (1.215) 2.887** (1.237) 2.963** (1.314)Fraction of problematic ECO’s 6.345** (3.112) 6.773** (3.006) 6.555** (3.104)Average ECO tardiness -0.234** (0.109) -0.217** (0.0098) -0.211** (0.0094)
Centrality of a subsystem 2.96*** (0.913)Centrality squared of a subsystem -4.13*** (1.880)
Coordination deficit 2.4412*** (0.895)R-squared 64.28% 67.13% 69.71%Adjusted R-squared 64.19% 66.92% 69.51%N 3159 3159 3159*p < 0.1, **p < 0.05, ***p < 0.01
We provide the results of the random-effects model in Table A.3. We observe that almost all of the
proposed associations for the 2005 model year holds for the 2006 model year. We note that our main
variables of interest, which are: (a) centrality in the product architecture network, (b) the quadratic term
for centrality in the product architecture network, and (c) coordination deficit, are all significant at the
0.01 level. The variation in 2006 warranty claims explained by the models (as indicated by R-squared
values of 64.19%, 66.92% and 69.51%) is also slightly lower than in the original study, but nevertheless
the explanatory power of the models is still quite large. Similar to the 2005 model year, we examined the
robustness of the inverted-U relationship (following the steps outlined in Section A of the Appendix) as
well as the potential endogeneity issues (as outlined in Section 5.3 of the paper) for this model. We found
that the inverted-U relationship is robust and that endogeneity is not a problem.

36
ReferencesAhuja M. K., A., D. E. Galletta, K. M. Carley. 2003. Individual Centrality and Performance in Virtual R&D Groups:
An Empirical Study. Management Science 49 21-38.
Clark, K. B., T. Fujimoto. 1991. Product Development Performance: Strategy, Organization, and Management in theWorld Auto Industry. Harvard Business School Press, Boston, MA.
Hausman, J. A. 1978. Specification tests in econometrics. Econometrica 46 12511271.
Davidson, R., J. Mackinnon. 1993. Estimation and Interference in Economics. Oxford University Press, New York.
Lee, A. 1987. Natural experiments. Human Relations 42 (2) 117-137.
White, H. 1980. A heteroscedasticity-consistent covariance matrix estimator and a direct test for heteroscedasticity.Econometrica 48 817838.
Wooldridge, J. M. 2002. Econometric Analysis of Cross Section and Panel Data. The MIT Press, Cambridge, MA.