the heartbeat of electronics
TRANSCRIPT
SiTime is Transforming the World of Timing
The Heartbeat of Electronics
SiTime Corporation, November 11, 2021
2
This presentation regarding SiTime Corporation (the “Company”) contains forward-looking statements. All statements other than statements of historical facts contained in this presentation, including statements regarding the Company’s financial position, strategy and plans, and the Company’s expectations for the timing market, are forward-looking statements. These forward-looking statements are subject to a number of risks, uncertainties, and assumptions, including, but not limited to: the Company’s ability to retain and expand its customer relationships and to achieve design wins; the Company’s ability to address market and customer demands and to timely develop new or enhanced solutions to meet those demands; anticipated trends, challenges and growth in the Company’s business and the markets in which it operates; the size and growth potential of the markets for the Company’s solutions, and the Company’s ability to serve those markets; the Company’s expectations regarding competition in its existing and new markets; the Company's ability to execute business plans and general economic factors; regulatory developments in the United States and foreign countries; the performance of the Company’s third-party suppliers and manufacturers; the Company’s and its customers’ ability to respond successfully to technological shifts or market demands; the Company’s ability to attract and retain key personnel; the accuracy of the Company’s estimates regarding capital requirements and needs for additional financing; change in industry standards to which the Company’s solutions conform; the Company’s expectations regarding its ability to obtain and maintain intellectual property protection for its technology; and the anticipated use of the net proceeds from the proposed offering. Moreover, the Company operates in a very competitive and rapidly changing environment. New risks emerge from time to time. It is not possible for the Company’s management to predict all risks, nor can the Company assess the impact of all factors on its business or the extent to which any factor, or combination of factors, may cause actual results to differ materially from those contained in any forward-looking statement. For more information concerning risks, uncertainties, and other factors that could cause results to differ materially from the expectations described in this document please refer to the Company’s most recent Quarterly Report on form 10-Q filed with the U.S. Securities and Exchange Commission (“SEC”), and other documents filed with the SEC. In light of these risks, uncertainties and assumptions, the forward-looking events and circumstances discussed in this presentation may not occur and actual results could differ materially and adversely from those anticipated or implied. Forward-looking statements represent management’s current expectations and are made only as of the date hereof. Except as required by law, neither the Company nor any other person assumes responsibility for the accuracy and completeness of the forward-looking statements. The Company undertakes no obligation to update publicly any forward-looking statements for any reason after the date of this presentation to conform these statements to actual results or to changes in the Company’s expectations, except as required by law.
This presentation includes certain non-GAAP financial measures as defined by the SEC rules. The Company believes that the presentation of non-GAAP financial measures provides important supplemental information to investors regarding financial and business trends relating to SiTime’s financial condition and results of operations. These non-GAAP financial measures are provided in addition to, and not as a substitute for or superior to measures of, financial performance prepared in accordance with U.S. GAAP. There are a number of limitations related to the use of these non-GAAP financial measures versus their nearest GAAP equivalents. For example, other companies may calculate non-GAAP financial measures differently or may use other measures to evaluate their performance, all of which could reduce the usefulness of the presented non-GAAP financial measures as tools for comparison. Please see the Appendix for a reconciliation of these Non-GAAP measures to the most comparable GAAP measure.
Disclaimers
3
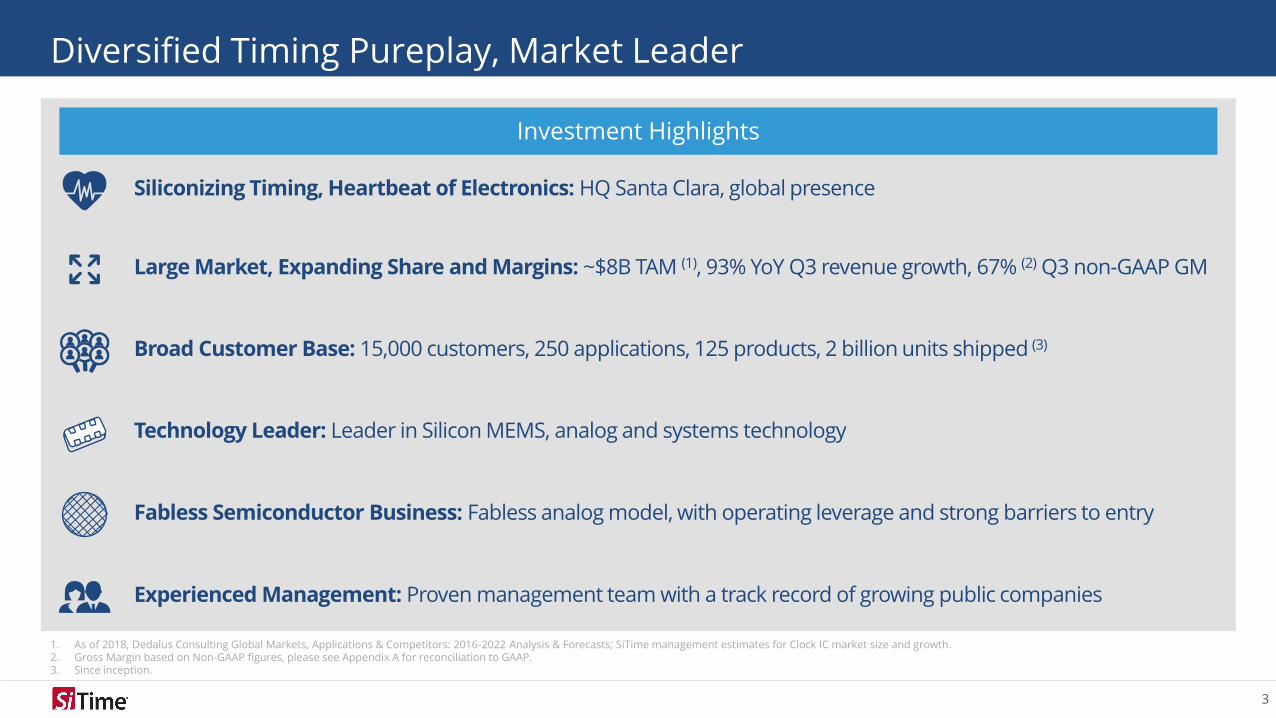
Diversified Timing Pureplay, Market Leader
Investment Highlights
1. As of 2018, Dedalus Consulting Global Markets, Applications & Competitors: 2016-2022 Analysis & Forecasts; SiTime management estimates for Clock IC market size and growth.2. Gross Margin based on Non-GAAP figures, please see Appendix A for reconciliation to GAAP.3. Since inception.
Fabless Semiconductor Business: Fabless analog model, with operating leverage and strong barriers to entry
Experienced Management: Proven management team with a track record of growing public companies
Large Market, Expanding Share and Margins: ~$8B TAM (1), 93% YoY Q3 revenue growth, 67% (2) Q3 non-GAAP GM
Broad Customer Base: 15,000 customers, 250 applications, 125 products, 2 billion units shipped (3)
Technology Leader: Leader in Silicon MEMS, analog and systems technology
Siliconizing Timing, Heartbeat of Electronics: HQ Santa Clara, global presence
4
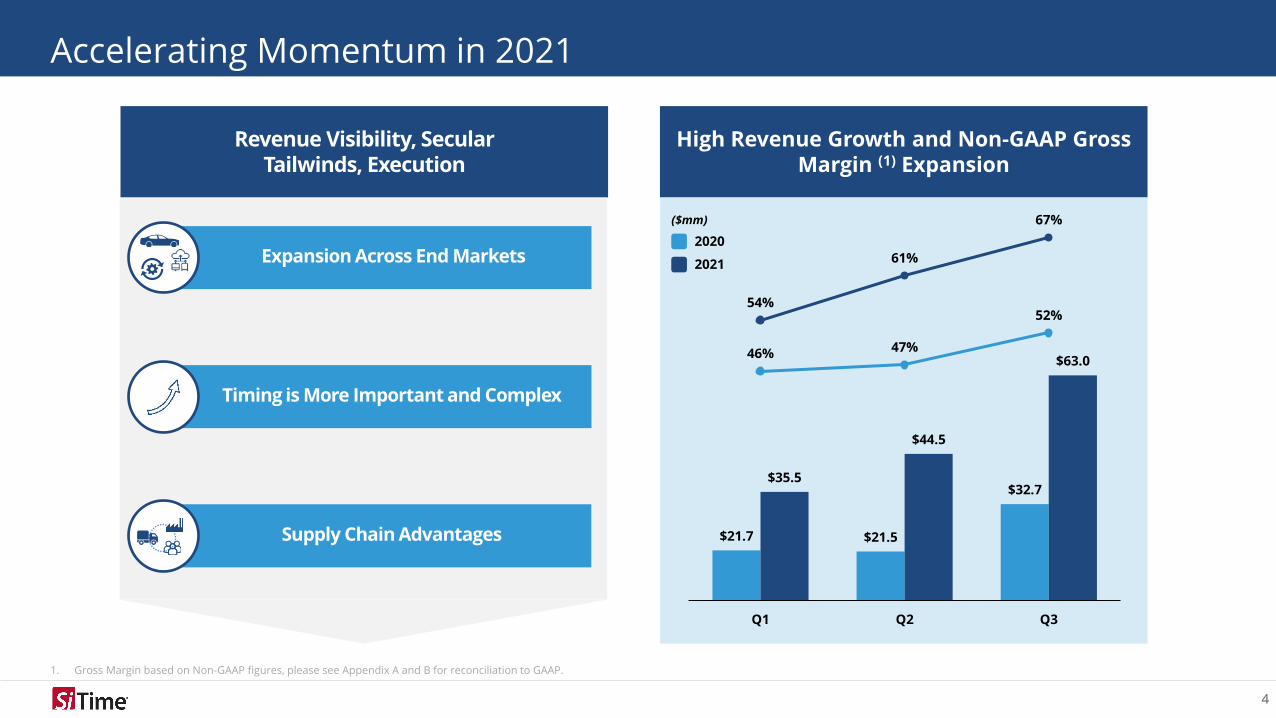
Accelerating Momentum in 2021
1. Gross Margin based on Non-GAAP figures, please see Appendix A and B for reconciliation to GAAP.
High Revenue Growth and Non-GAAP Gross Margin (1) Expansion
Revenue Visibility, Secular Tailwinds, Execution
Supply Chain Advantages
Timing is More Important and Complex
Expansion Across End Markets
$21.7 $21.5
$32.7 $35.5
$44.5
$63.0
54%
61%
67%
46% 47%
52%
10%
20%
30%
40%
50%
60%
70%
$10.0
$20.0
$30.0
$40.0
$50.0
$60.0
$70.0
$80.0
$90.0
$100.0
Q1 Q2 Q3
($mm)
2020
2021
5
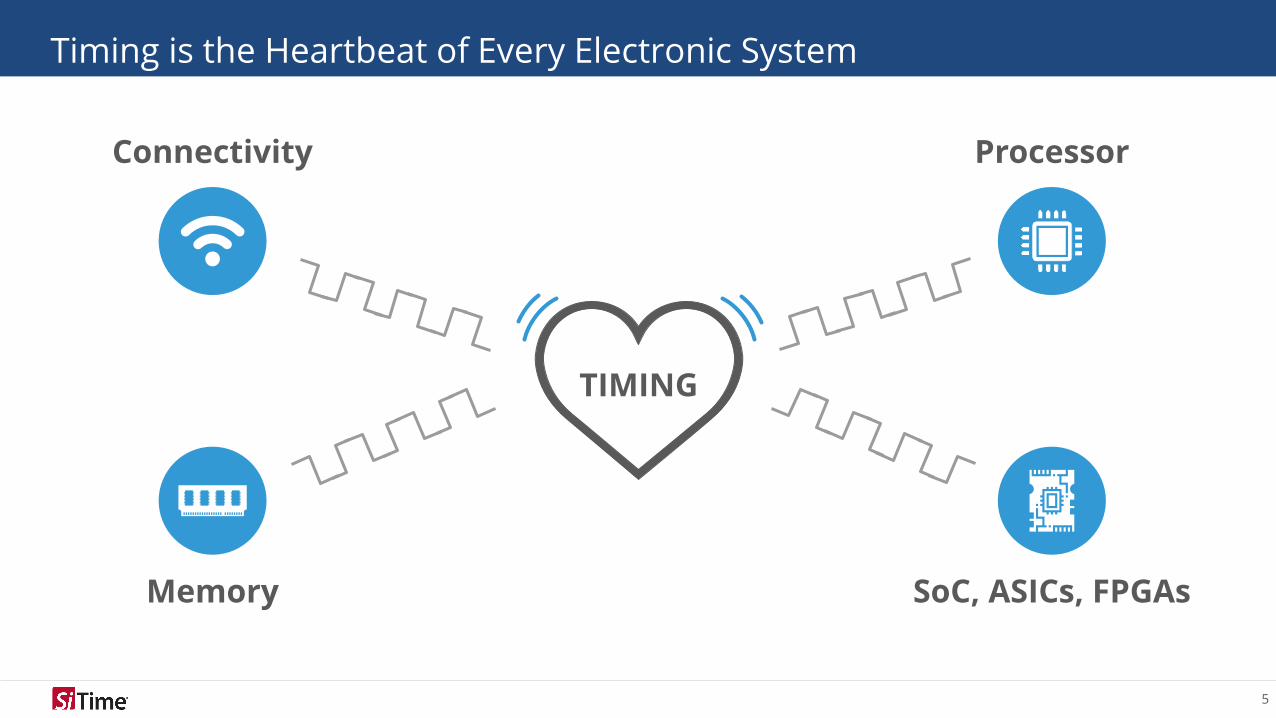
Timing is the Heartbeat of Every Electronic System
Connectivity
Memory SoC, ASICs, FPGAs
Processor
TIMING
6
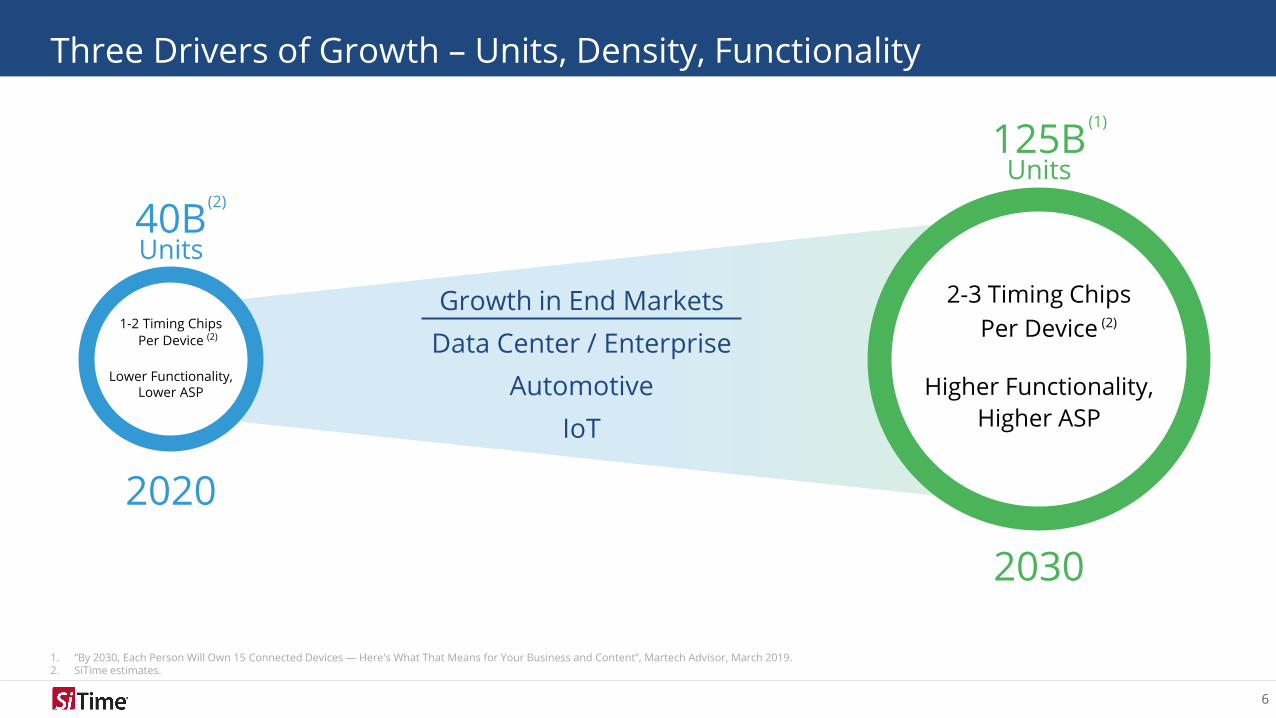
Three Drivers of Growth – Units, Density, Functionality
2020
40BUnits
(2)
1. “By 2030, Each Person Will Own 15 Connected Devices — Here's What That Means for Your Business and Content”, Martech Advisor, March 2019.2. SiTime estimates.
2-3 Timing Chips
Per Device
Higher Functionality,
Higher ASP
2030
125BUnits
(1)
(2)
Growth in End Markets
Data Center / Enterprise
Automotive
IoT
(2)1-2 Timing Chips
Per Device
Lower Functionality, Lower ASP
7
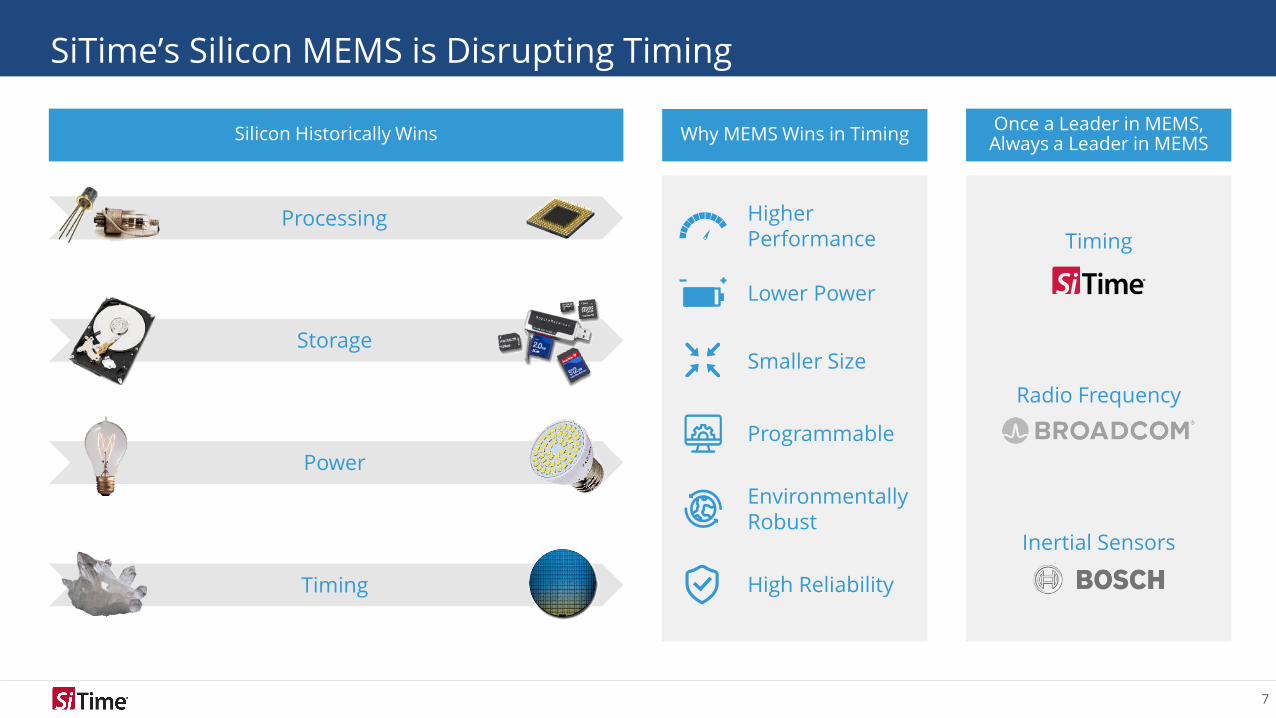
SiTime’s Silicon MEMS is Disrupting Timing
Programmable
Environmentally Robust
Lower Power
Higher Performance
Smaller Size
Why MEMS Wins in Timing
Processing
Storage
Power
Timing
Silicon Historically WinsOnce a Leader in MEMS, Always a Leader in MEMS
Timing
Inertial Sensors
High Reliability
Radio Frequency
8
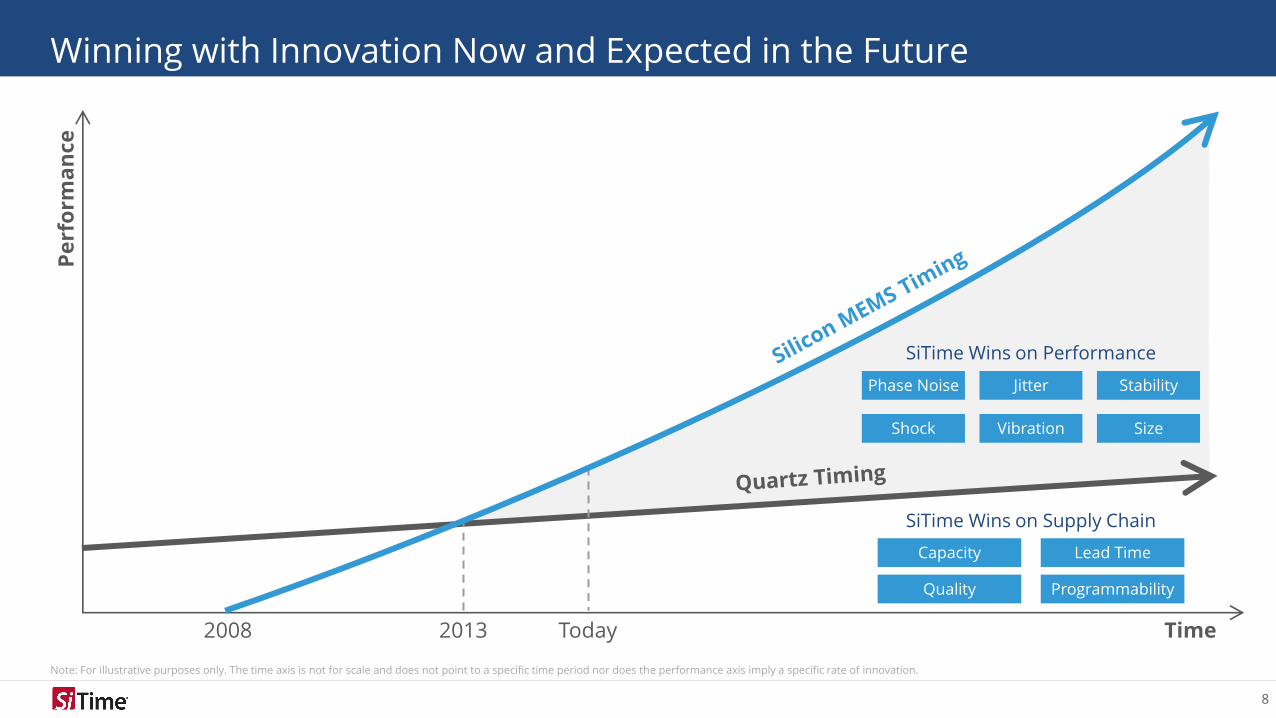
Winning with Innovation Now and Expected in the Future
Note: For illustrative purposes only. The time axis is not for scale and does not point to a specific time period nor does the performance axis imply a specific rate of innovation.
Time
Pe
rfo
rma
nce
2013 Today
Phase Noise StabilityJitter
Shock Vibration Size
SiTime Wins on Performance
SiTime Wins on Supply Chain
Quality
Lead TimeCapacity
Programmability
2008
9
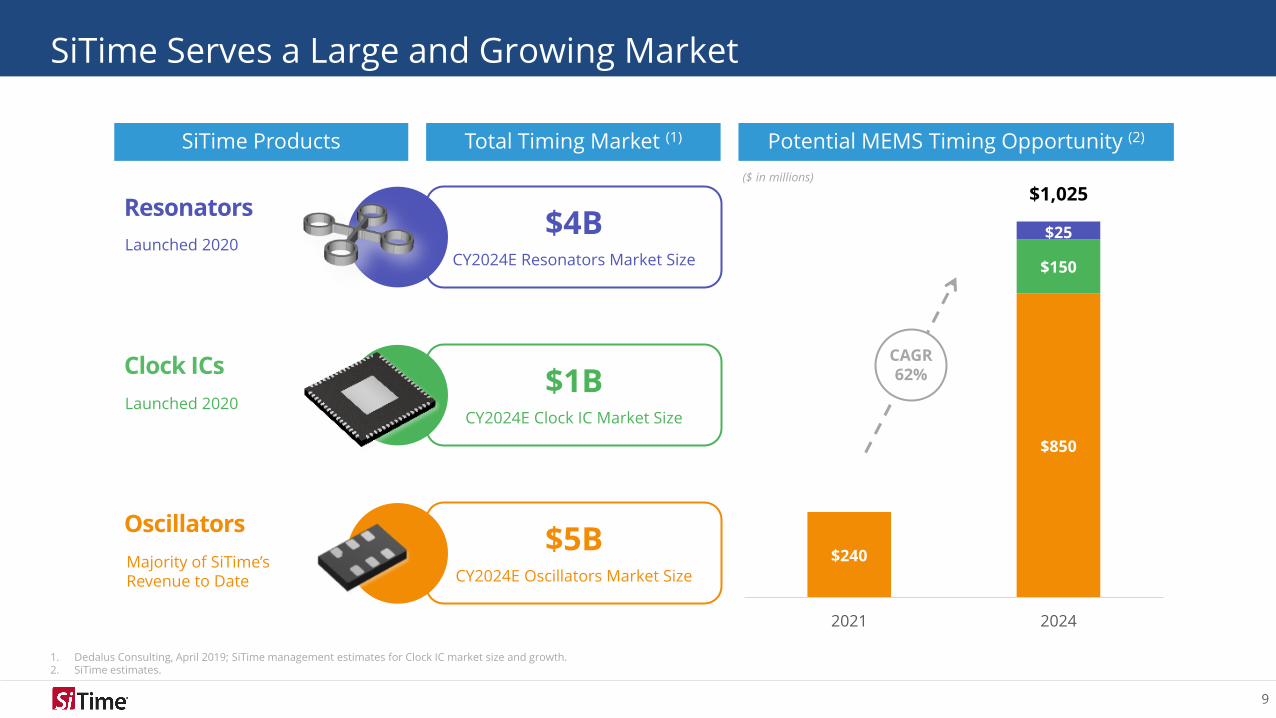
SiTime Serves a Large and Growing Market
1. Dedalus Consulting, April 2019; SiTime management estimates for Clock IC market size and growth.2. SiTime estimates.
Total Timing Market (1) Potential MEMS Timing Opportunity (2)SiTime Products
Clock ICs
Launched 2020$1B
CY2024E Clock IC Market Size
Oscillators
Resonators
Launched 2020$4B
CY2024E Resonators Market Size
Majority of SiTime’s Revenue to Date
$5BCY2024E Oscillators Market Size
($ in millions)
$240
$850
$150
$25
2021 2024
$1,025
CAGR62%
10
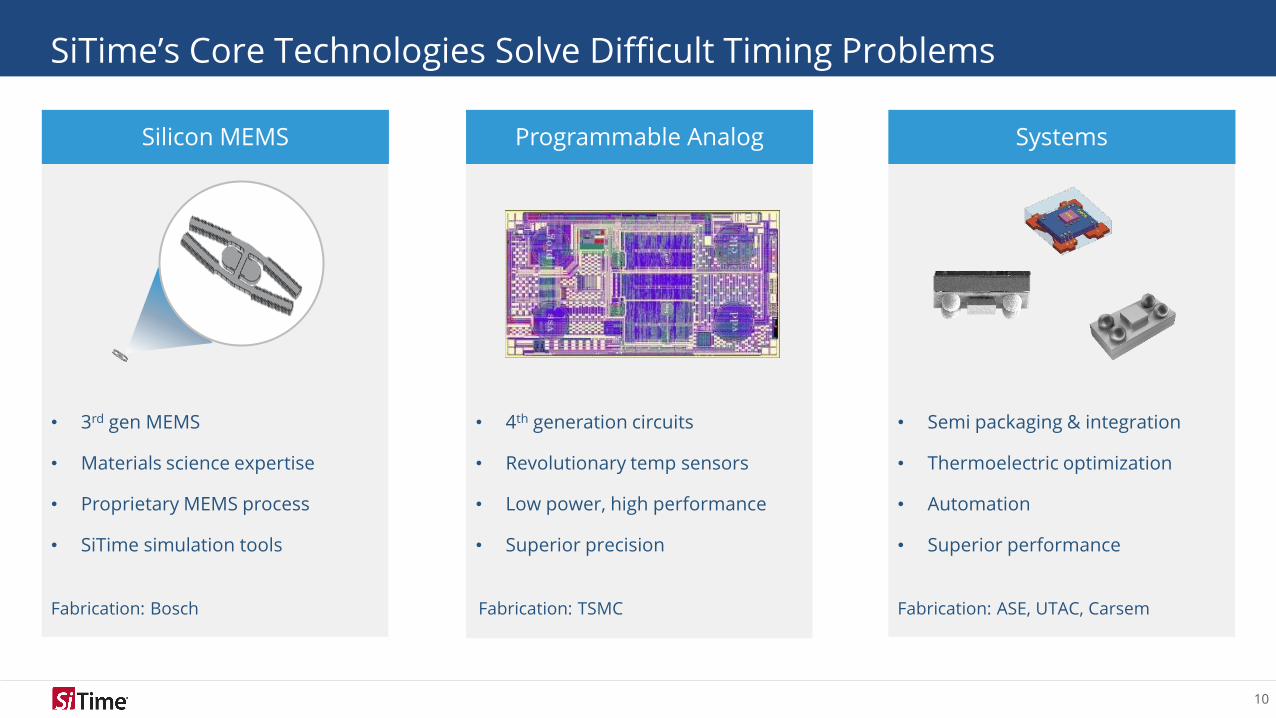
SystemsProgrammable Analog
SiTime’s Core Technologies Solve Difficult Timing Problems
• 3rd gen MEMS
• Materials science expertise
• Proprietary MEMS process
• SiTime simulation tools
• 4th generation circuits
• Revolutionary temp sensors
• Low power, high performance
• Superior precision
• Semi packaging & integration
• Thermoelectric optimization
• Automation
• Superior performance
Silicon MEMS
Fabrication: Bosch Fabrication: TSMC Fabrication: ASE, UTAC, Carsem
11
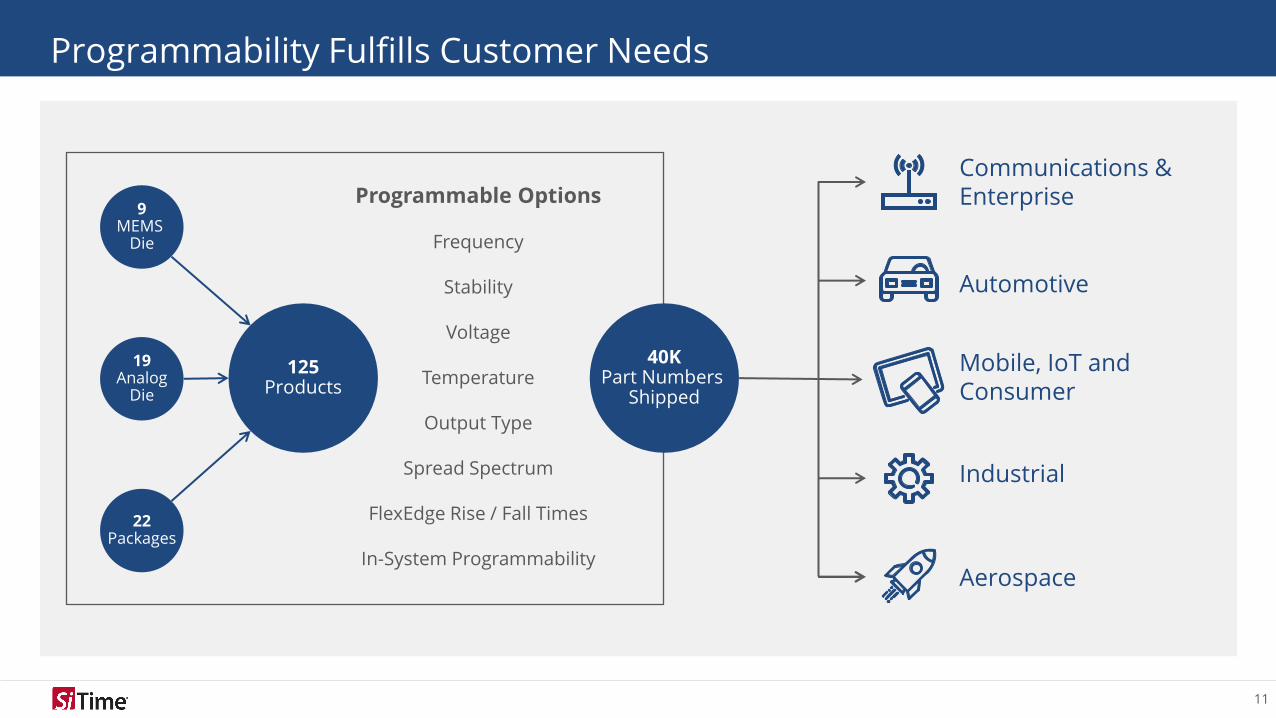
Programmability Fulfills Customer Needs
Frequency
Spread Spectrum
Stability
Output Type
Voltage
Temperature
FlexEdge Rise / Fall Times
In-System Programmability
Programmable Options
Mobile, IoT and Consumer
Industrial
Communications & Enterprise
Aerospace
Automotive
9MEMS
Die
125Products
22Packages
19Analog
Die
40KPart Numbers
Shipped
12
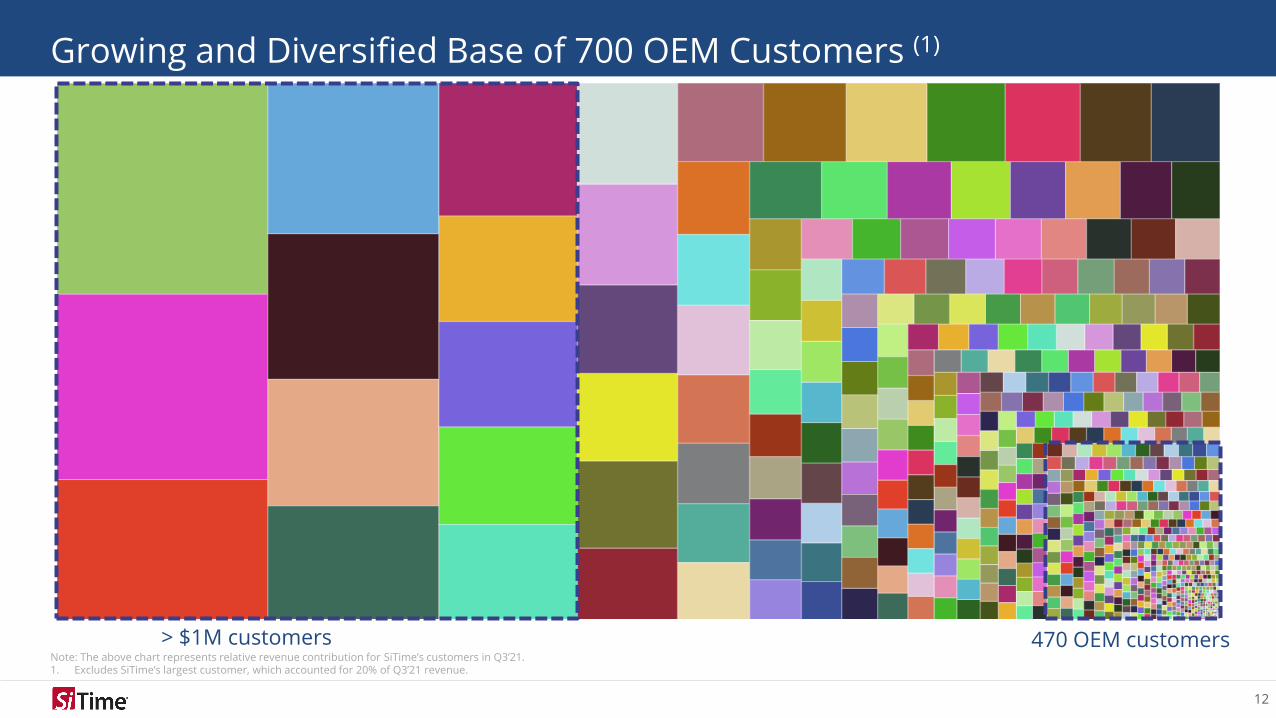
> $1M customers 470 OEM customers
Growing and Diversified Base of 700 OEM Customers (1)
Note: The above chart represents relative revenue contribution for SiTime’s customers in Q3’21.1. Excludes SiTime’s largest customer, which accounted for 20% of Q3’21 revenue.
13
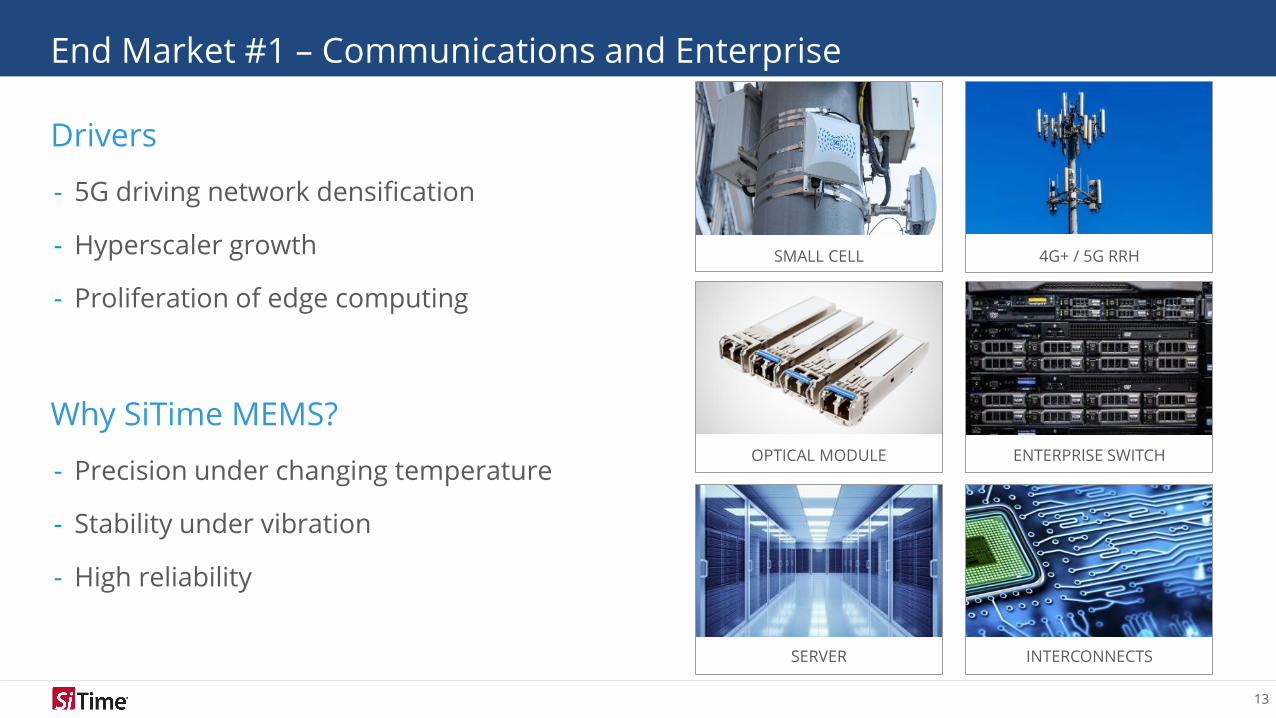
End Market #1 – Communications and Enterprise
4G+ / 5G RRH
ENTERPRISE SWITCH
SMALL CELL
OPTICAL MODULE
Drivers
- 5G driving network densification
- Hyperscaler growth
- Proliferation of edge computing
Why SiTime MEMS?
- Precision under changing temperature
- Stability under vibration
- High reliability
INTERCONNECTSSERVER
14
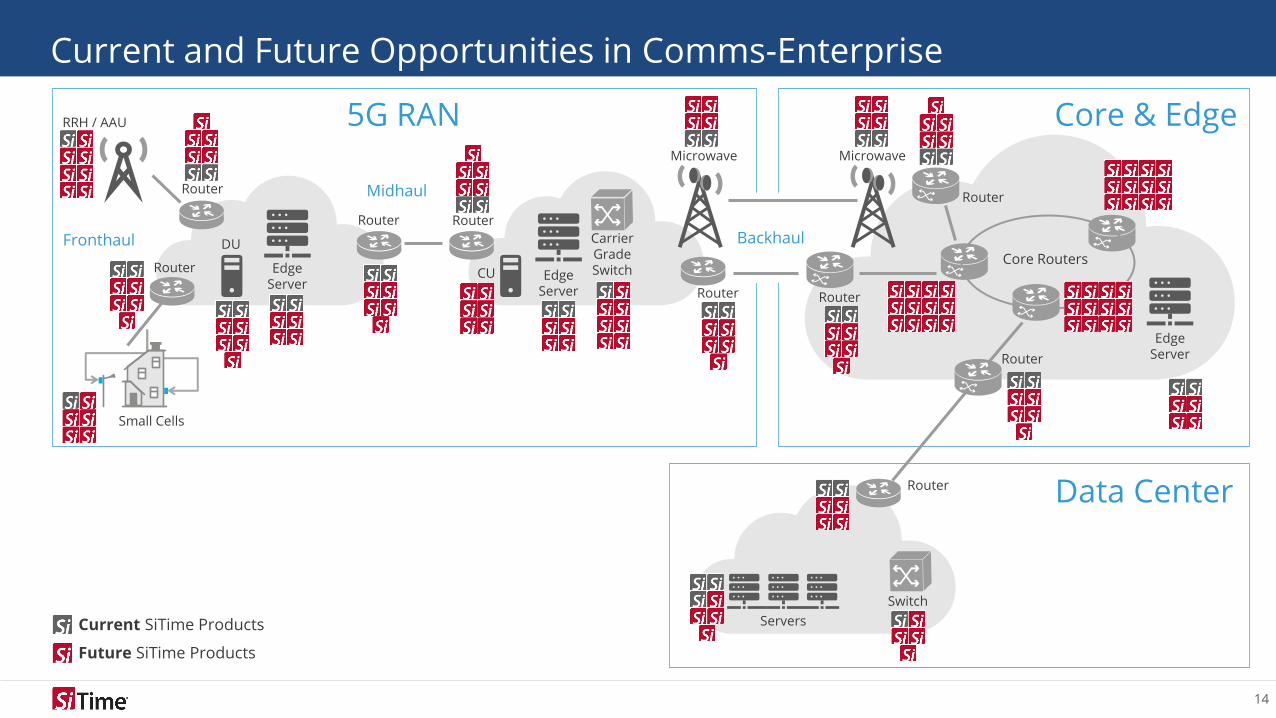
Backhaul
Current and Future Opportunities in Comms-Enterprise
RRH / AAU
Midhaul
Data Center
5G RAN
Router
Router
Fronthaul
CU
DU
Servers
Core & EdgeMicrowave
EdgeServer
EdgeServer
CarrierGrade SwitchEdge
Server
Router Router
Router
Router
RouterRouter
Router
Core Routers
Microwave
Small Cells
Switch
Current SiTime Products
Future SiTime Products
15
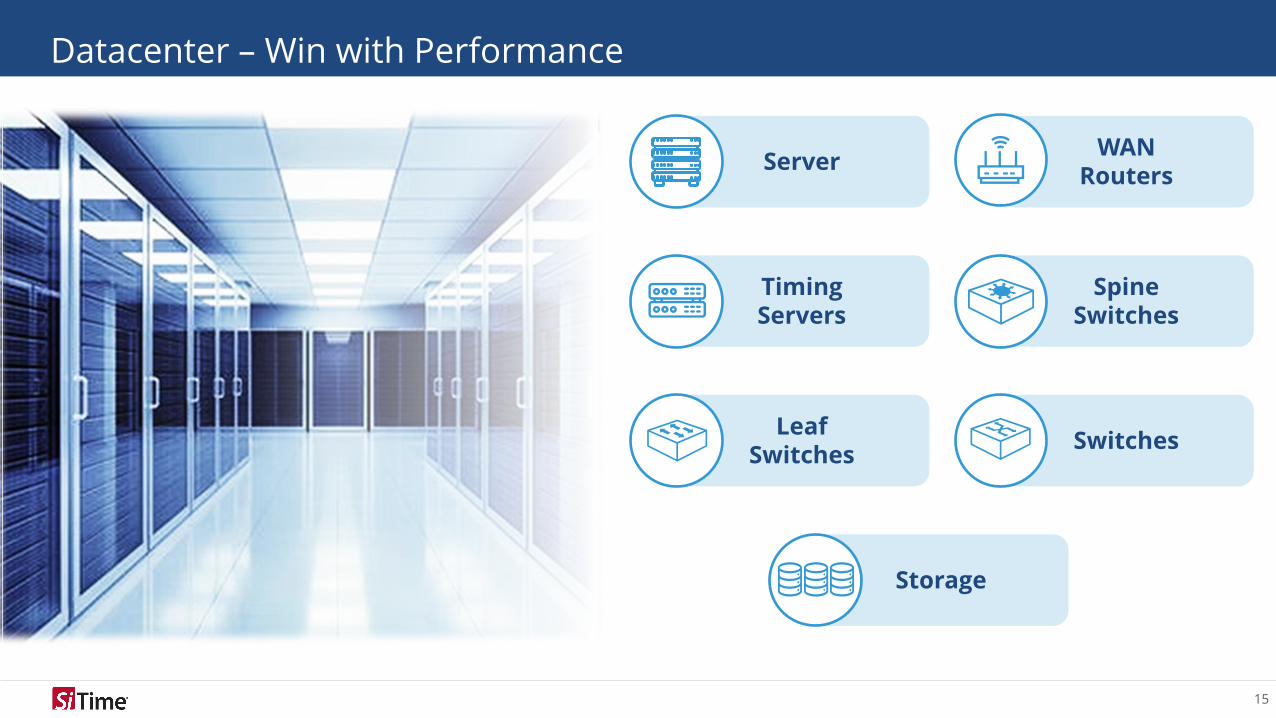
Datacenter – Win with Performance
Server
SpineSwitches
TimingServers
LeafSwitches
Storage
Switches
WANRouters
16
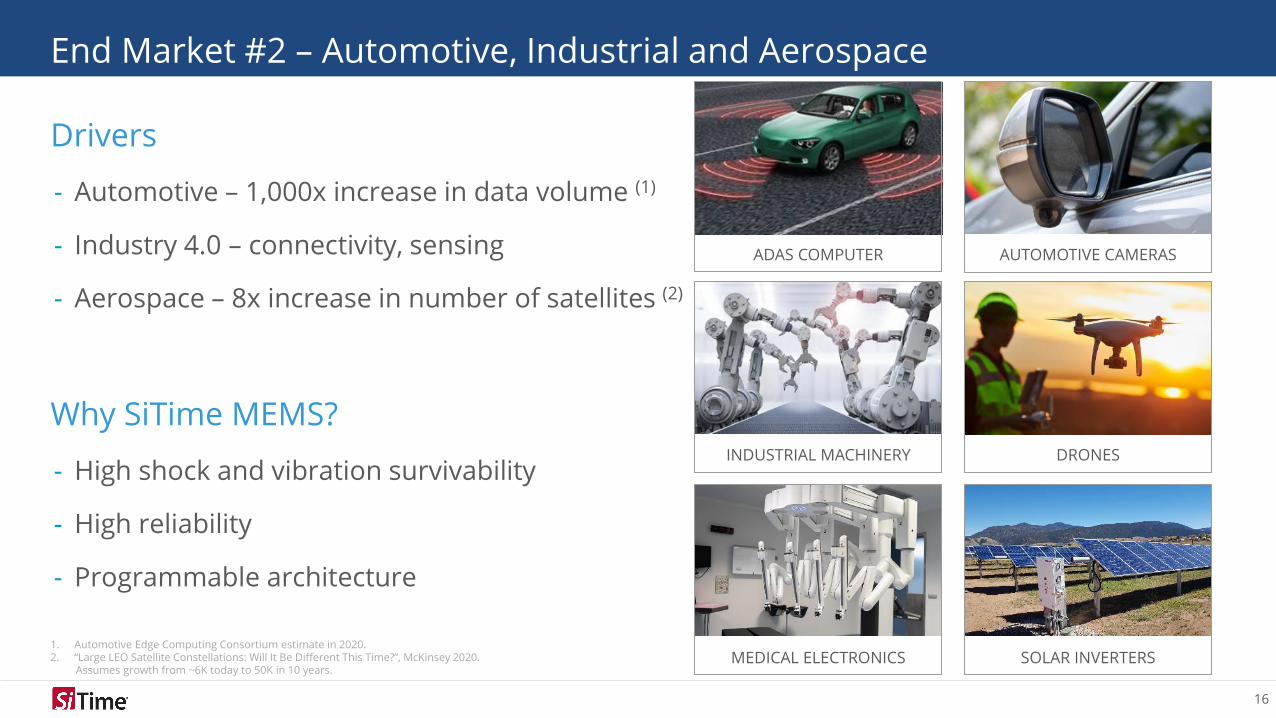
1. Automotive Edge Computing Consortium estimate in 2020.2. “Large LEO Satellite Constellations: Will It Be Different This Time?”, McKinsey 2020.
Assumes growth from ~6K today to 50K in 10 years.
End Market #2 – Automotive, Industrial and Aerospace
MEDICAL ELECTRONICS SOLAR INVERTERS
ADAS COMPUTER
DRONESINDUSTRIAL MACHINERY
AUTOMOTIVE CAMERAS
Drivers
- Automotive – 1,000x increase in data volume (1)
- Industry 4.0 – connectivity, sensing
- Aerospace – 8x increase in number of satellites (2)
Why SiTime MEMS?
- High shock and vibration survivability
- High reliability
- Programmable architecture
17
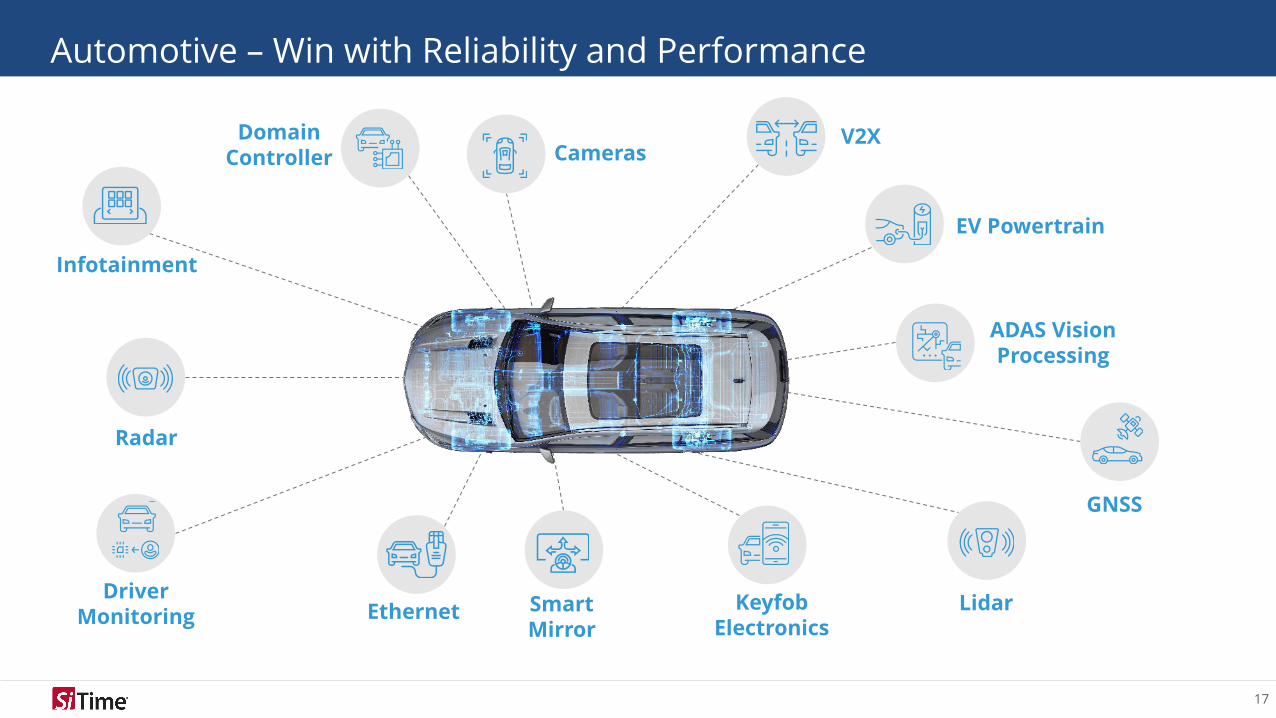
Automotive – Win with Reliability and Performance
Radar
Ethernet Lidar
DomainController
EV Powertrain
Infotainment
ADAS VisionProcessing
GNSS
SmartMirror
KeyfobElectronics
DriverMonitoring
V2XCameras
18
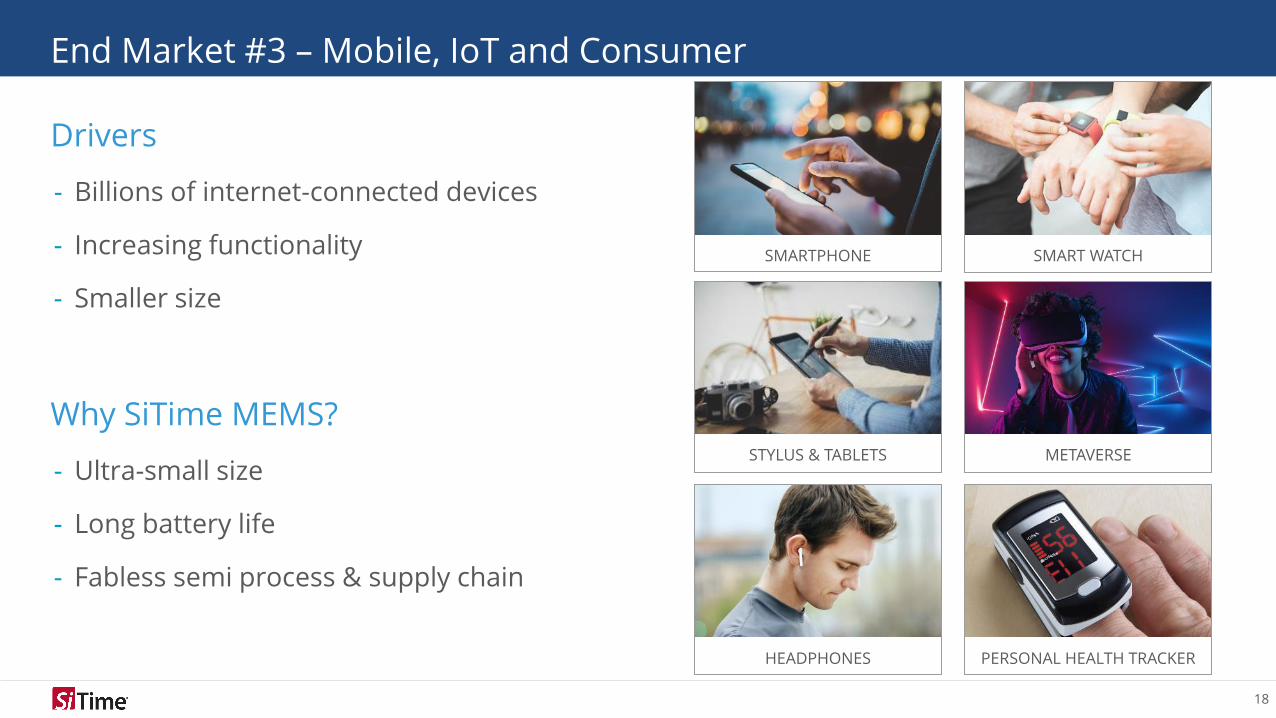
End Market #3 – Mobile, IoT and Consumer
HEADPHONES PERSONAL HEALTH TRACKER
SMARTPHONE
METAVERSESTYLUS & TABLETS
SMART WATCH
Drivers
- Billions of internet-connected devices
- Increasing functionality
- Smaller size
Why SiTime MEMS?
- Ultra-small size
- Long battery life
- Fabless semi process & supply chain
19
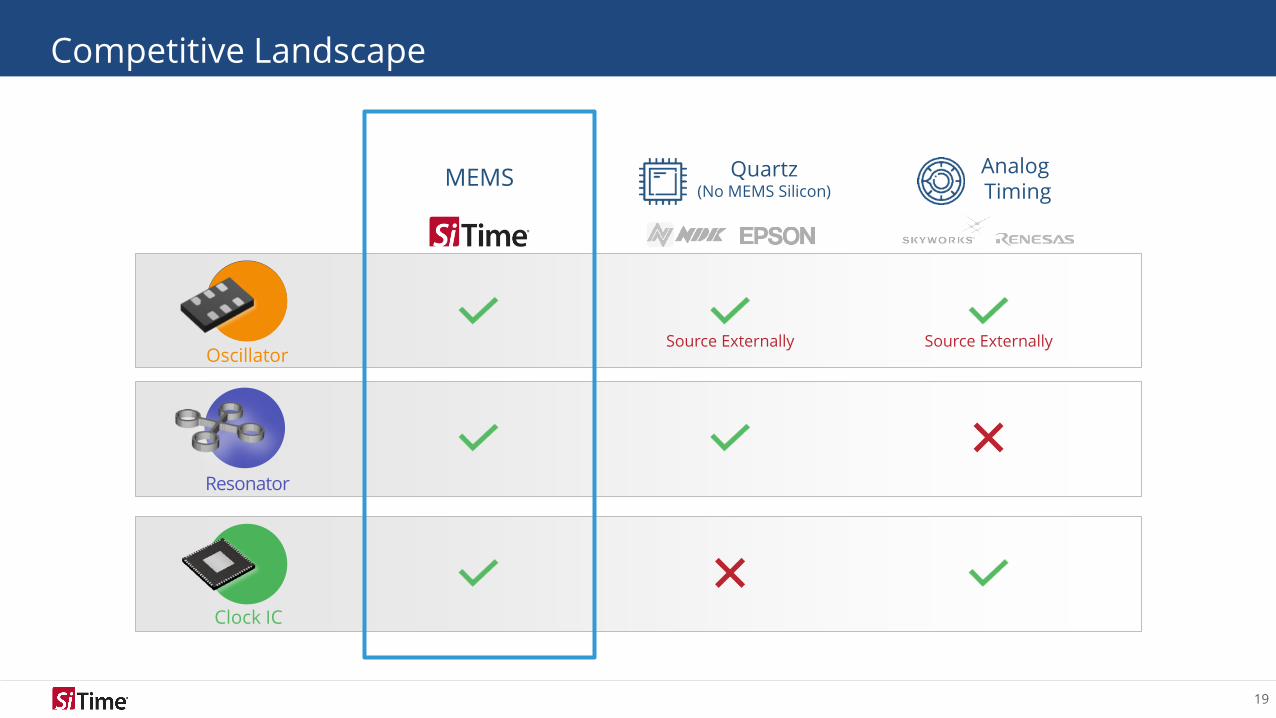
Competitive Landscape
Resonator
Oscillator
Clock IC
Source Externally
Quartz(No MEMS Silicon)
Analog Timing
MEMS
Source Externally

Financials
21
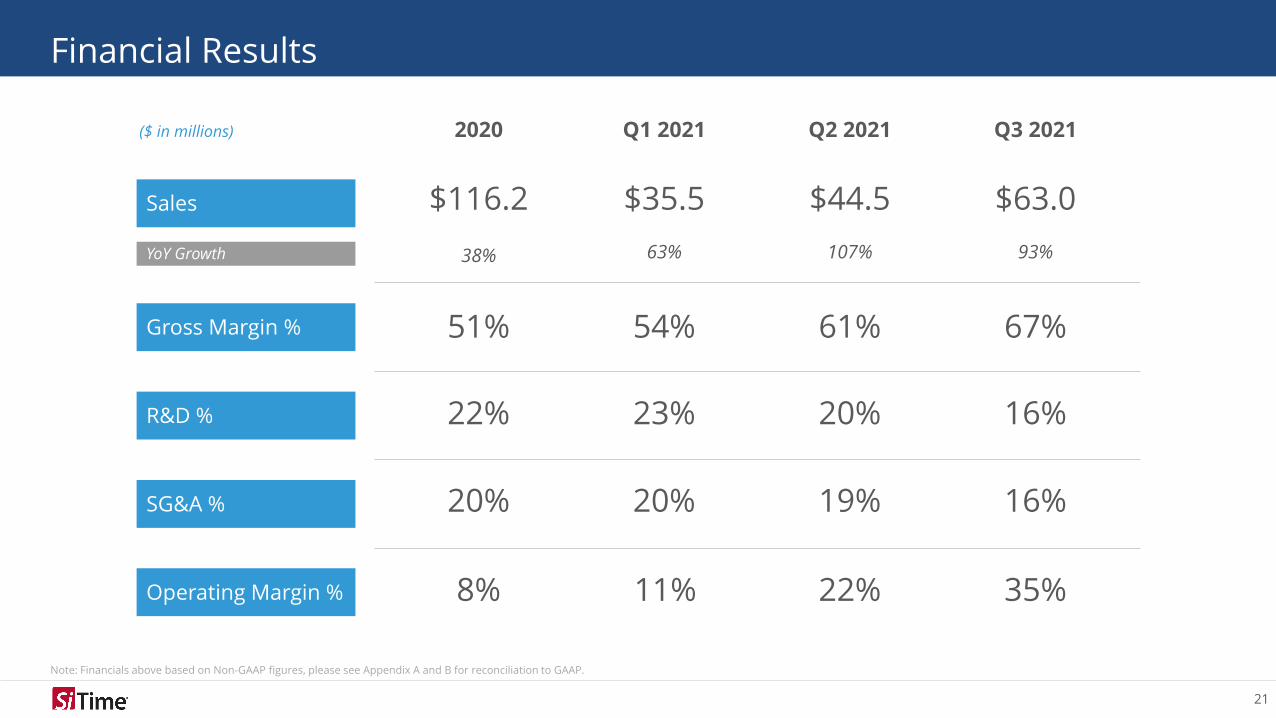
Financial Results
Note: Financials above based on Non-GAAP figures, please see Appendix A and B for reconciliation to GAAP.
R&D %
SG&A %
Operating Margin %
Gross Margin %
($ in millions)
Sales
YoY Growth
Q2 2021
$44.5
61%
20%
19%
22%
107%
Q1 2021
$35.5
54%
23%
20%
11%
63%
2020
$116.2
51%
22%
20%
8%
38%
Q3 2021
$63.0
67%
16%
16%
35%
93%
22
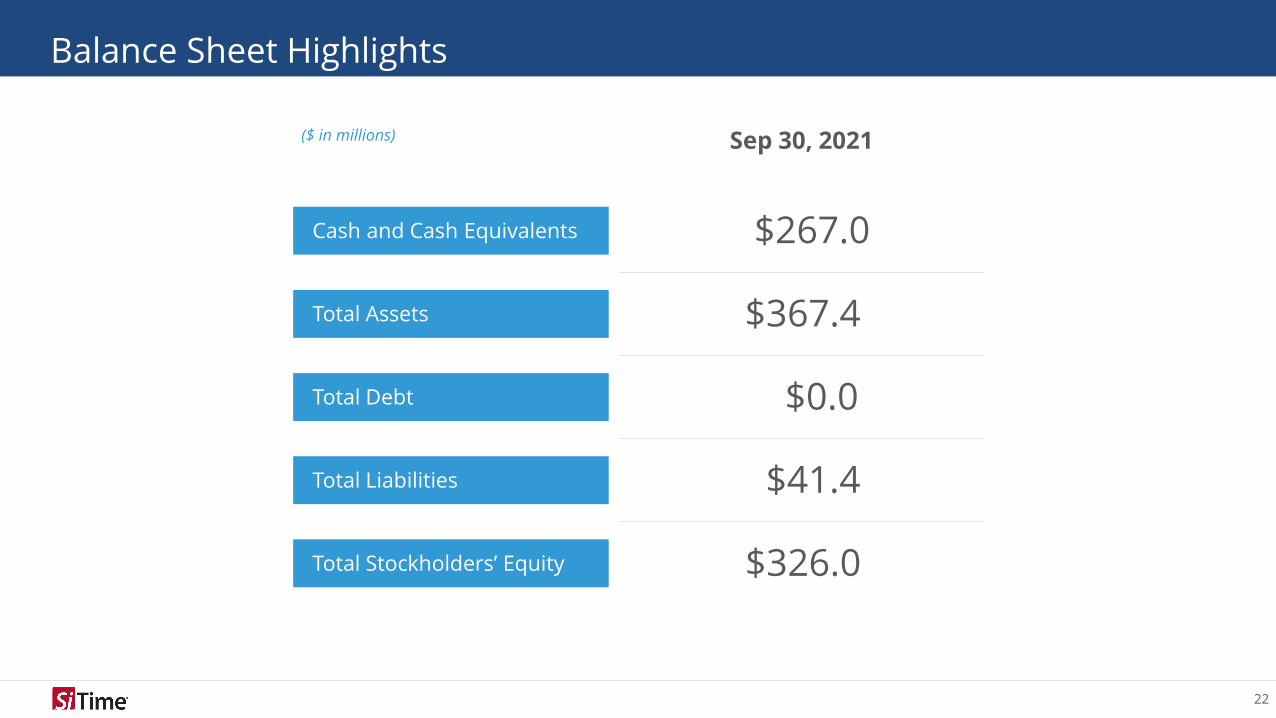
Balance Sheet Highlights
Cash and Cash Equivalents
Total Assets
Total Debt
Total Liabilities
Total Stockholders’ Equity
Sep 30, 2021
$267.0
$367.4
$0.0
$41.4
$326.0
($ in millions)

Appendix
24
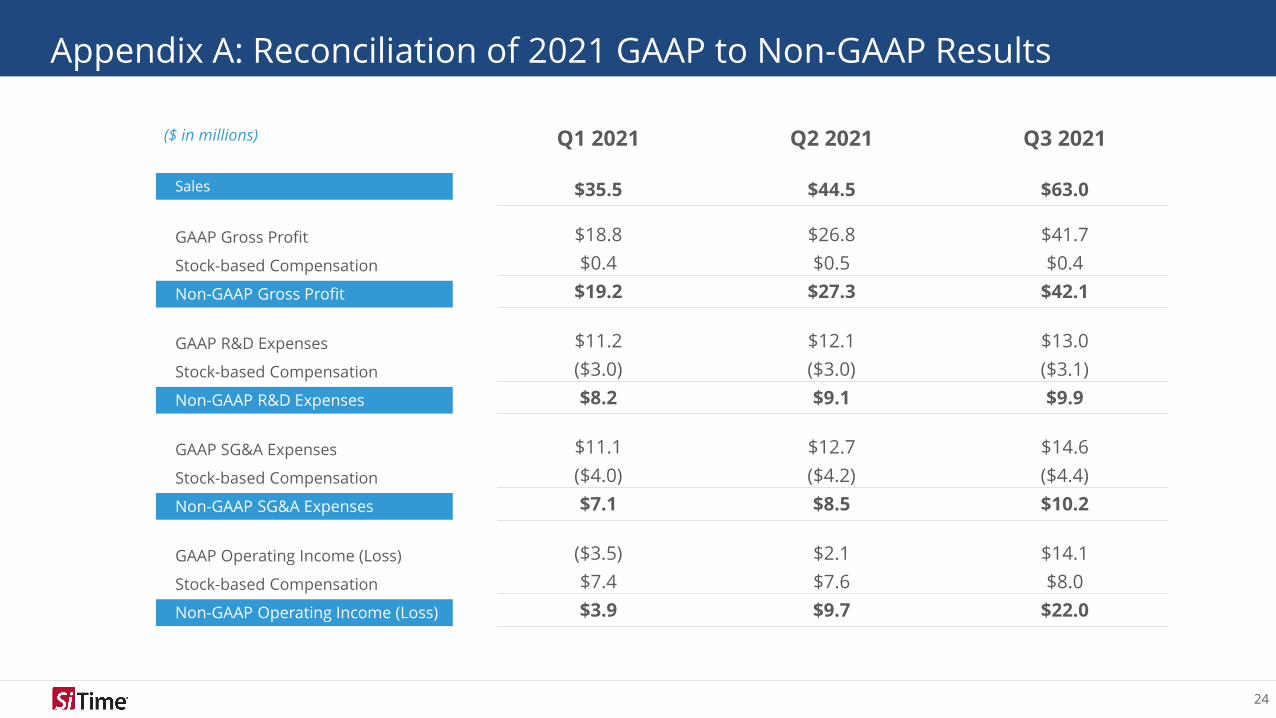
Appendix A: Reconciliation of 2021 GAAP to Non-GAAP Results
Sales
($ in millions)
GAAP Gross Profit
Stock-based Compensation
Non-GAAP Gross Profit
GAAP R&D Expenses
Stock-based Compensation
Non-GAAP R&D Expenses
GAAP SG&A Expenses
Stock-based Compensation
Non-GAAP SG&A Expenses
GAAP Operating Income (Loss)
Stock-based Compensation
Non-GAAP Operating Income (Loss)
Q1 2021
$35.5
$18.8
$0.4
$19.2
$11.2
($3.0)
$8.2
$11.1
($4.0)
$7.1
($3.5)
$7.4
$3.9
Q2 2021
$44.5
$26.8
$0.5
$27.3
$12.1
($3.0)
$9.1
$12.7
($4.2)
$8.5
$2.1
$7.6
$9.7
Q3 2021
$63.0
$41.7
$0.4
$42.1
$13.0
($3.1)
$9.9
$14.6
($4.4)
$10.2
$14.1
$8.0
$22.0
25
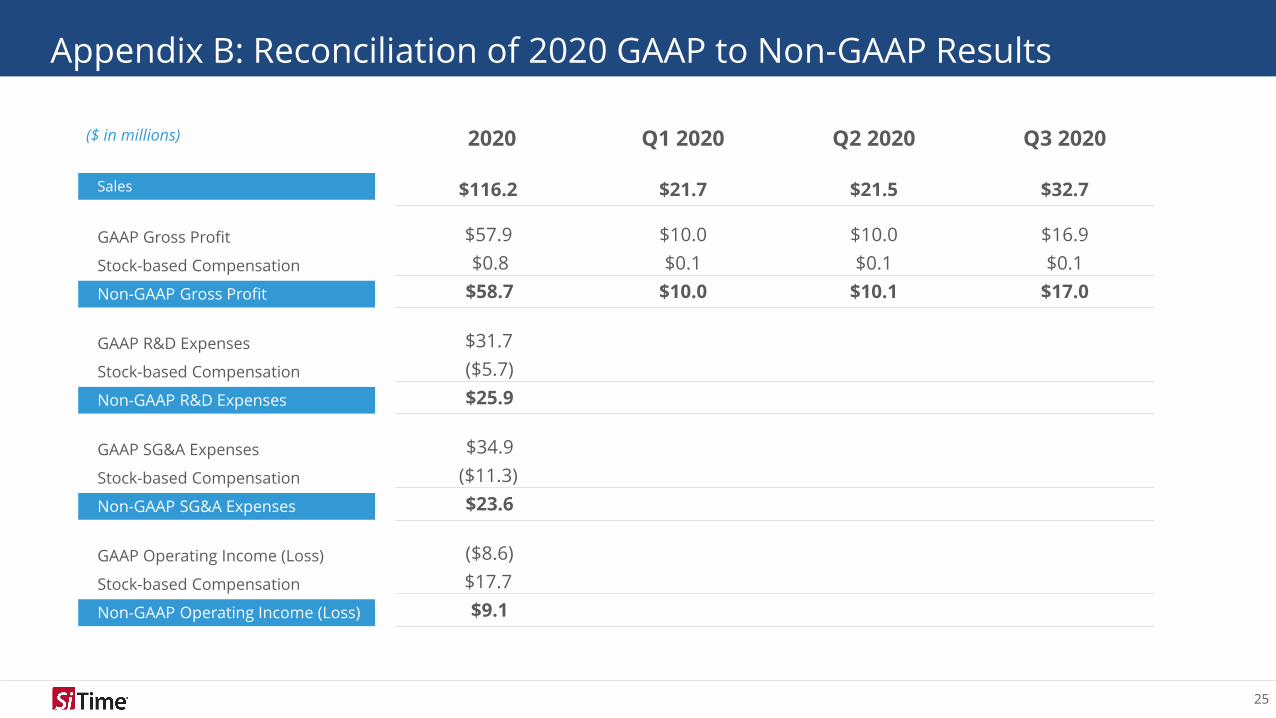
Appendix B: Reconciliation of 2020 GAAP to Non-GAAP Results
Sales
2020
$116.2
($ in millions)
GAAP Gross Profit $57.9
Stock-based Compensation $0.8
Non-GAAP Gross Profit $58.7
GAAP R&D Expenses $31.7
Stock-based Compensation ($5.7)
Non-GAAP R&D Expenses $25.9
GAAP SG&A Expenses $34.9
Stock-based Compensation ($11.3)
Non-GAAP SG&A Expenses $23.6
GAAP Operating Income (Loss) ($8.6)
Stock-based Compensation $17.7
Non-GAAP Operating Income (Loss) $9.1
Q1 2020
$21.7
$10.0
$0.1
$10.0
Q2 2020
$21.5
$10.0
$0.1
$10.1
Q3 2020
$32.7
$16.9
$0.1
$17.0