the gencode pseudogene resource - gerstein...
TRANSCRIPT
1
The GENCODE Pseudogene Resource
Authors: Baikang Pei1*, Cristina Sisu1,2*, Adam Frankish4, Cédric Howald5, Lukas Habegger1, Xinmeng
Jasmine Mu1, Rachel Harte6, Suganthi Balasubramanian1,2, Andrea Tanzer7, Mark Diekhans6, Alexandre
Reymond5, Tim J. Hubbard4, Jennifer Harrow4 and Mark B. Gerstein1,2,3‡
1Program in Computational Biology and Bioinformatics, Yale University, Bass 432, 266 Whitney
Avenue, New Haven, CT 06520, USA.
2Department of Molecular Biophysics and Biochemistry, Yale University, 266 Whitney Ave, New Haven,
CT 06520, USA.
3Department of Computer Science, Yale University, 51 Prospect Street, New Haven, CT 06511, USA
4Wellcome Trust Sanger Institute, Welcome Trust Campus, Hinxton, Cambridge CB10 1SA, UK
5Center for Integrative Genomics, University of Lausanne, Genopode building, Lausanne, 1015,
Switzerland
6Center for Biomolecular Science and Engineering University of California, 1156 High Street, Santa
Cruz, CA 95064, USA
7Centre for Genomic Regulation (CRG) and UPF, Dr, Aiguader, 08003 Barcelona, Catalonia, Spain
*These authors contributed equally to the work presented in this paper.
‡Corresponding author contact email: [email protected]
Running Title: The GENCODE Pseudogene Resource
Keywords: pseudogene, partial activity, functional genomics
2
Abstract
Background: Pseudogenes have long been considered as nonfunctional genomic sequences. However,
recent evidence suggests that many of them might have some form of biological activity, and the
possibility of functionality has increased interest in their accurate annotation and integration with
functional genomics data.
Results: As part of the GENCODE annotation of the human genome, we present the first genome-wide
pseudogene assignment for protein-coding genes, based on both large-scale manual annotation and in
silico pipelines. A key aspect of this coupled approach is that it allows us to identify pseudogenes in an
unbiased fashion as well as untangle complex events through manual evaluation. We integrate the
pseudogene annotations with the extensive ENCODE functional genomics information. In particular, we
determine the expression level, transcription-factor and RNA polymerase II binding, and chromatin marks
associated with each pseudogene. Based on their distribution, we develop simple statistical models for
each type of activity, which we validate with large-scale RT-PCR-seq experiments. Finally, we compare
our pseudogenes with conservation and variation data from primate alignments and the 1000 Genomes
project, producing lists of pseudogenes potentially under selection.
Conclusions: At one extreme, some pseudogenes possess conventional characteristics of functionality;
these may represent genes that have recently died. On the other hand, we find interesting patterns of
partial activity, which may suggest that dead genes are being resurrected as functioning ncRNAs. The
activity data of each pseudogene is stored in an associated resource, psiDR, which will be useful for the
initial identification of potentially functional pseudogenes.
3
Background
Pseudogenes are defined as defunct genomic loci with sequence similarity to functional genes but
lacking coding potential due to the presence of disruptive mutations such as frame shifts and premature
stop codons [1, 2, 3, 4]. The functional paralogs of pseudogenes are often referred to as parent genes.
Based on the mechanism of their creation, pseudogenes can be categorized into three large groups: (1)
processed pseudogenes, created by retrotransposition of mRNA from functional protein-coding loci back
into the genome, (2) duplicated (also referred to as unprocessed) pseudogenes, derived from duplication
of functional genes, and (3) unitary pseudogenes, which arise through in situ mutations in previously
functional protein-coding genes [1, 4, 5, 6].
Different types of pseudogenes exhibit different genomic features. Duplicated pseudogenes have
intron-exon-like genomic structures and may still maintain the upstream regulatory sequences of their
parents. In contrast, processed pseudogenes, having lost their introns, contain only exonic sequence and
do not retain the upstream regulatory regions. Processed pseudogenes may preserve evidence of their
insertion in the form of polyadenine features at their 3’ end. These features of processed pseudogenes are
shared with other genomic elements commonly known as retrogenes [7]. However, retrogenes differ from
pseudogenes in that they have intact coding frames and encode functional proteins [8]. The composition
of different types of pseudogenes varies among organisms [9]. In the human genome, processed
pseudogenes are the most abundant type due to a burst of retrotranspositional activity [10] in the ancestral
primates 40 million years ago (Mya) [11, 12, 13].
Pseudogenes have long been considered as nonfunctional genomic sequences. However, evidence
of transcription and conservation of some pseudogenes led to the speculation that they might be
functional (Harrison et al. 2005; Svensson et al. 2006), and several estimates of the number of transcribed
pseudogenes have been published in recent years [14, 15, 16]. More recently, studies have shown that in
some cases expressed pseudogenes can perform crucial regulatory roles through their RNA products [17,
18, 19, 20].
4
Pseudogenes have been suggested to exhibit different types of activity. Firstly, they can regulate
the expression of their parent gene by decreasing the mRNA stability of the functional gene through their
over-expression. A good example is the MYLKP1 pseudogene, which is up-regulated in cancer cells [21].
The transcription of MYLKP1 creates a noncoding RNA (ncRNA) that inhibits the mRNA expression of
its functional parent, MYLK. Moreover, studies in Drosophila and mouse have shown that siRNA
derived from processed pseudogenes can regulate gene expression by means of the RNA-interference
pathway [18, 19, 22, 23, 24], thus acting as endogenous siRNAs. In addition it has also been hypothesized
that pseudogenes with high sequence homology to their parent genes can regulate their expression
through the generation of anti-sense transcripts. A recent study by Hawkins and Morris (2010) has shown
that knocking down a noncoding RNA antisense to an Oct4 pseudogene increases the expression of both
Oct4 and its pseudogene [25]. Finally, pseudogenes can compete with their parent genes for miRNA
binding, thereby modulating the repression of the functional gene by its cognate miRNA. For example,
the pseudogene of PTEN, a crucial tumor suppressor, regulates the expression of its parent gene following
this mechanism [18]. The 3’UTR of the transcript originating from the pseudogene, PTENP1, acts as a
decoy for the miRNA that represses the parent gene. It has been suggested that this could be a general
mechanism of regulation in cancer [26].
While the above examples clearly illustrate that some pseudogenes indeed have a functional role,
the extent of this phenomenon is not clear. The large corpus of functional data from the ENCODE
consortium provides us with an opportunity to study pseudogene transcription and activity in a systematic
and comprehensive manner. It is of interest to study whether these examples are just sporadic exceptions,
or indeed represent a generic mechanism for gene regulation.
As a part of the GENCODE project, which aims to annotate all evidence-based human gene
features with high accuracy [27, 28], we carried out a comprehensive and accurate pseudogene annotation
for the entire human genome. We combined automated pipelines and manual curation into a production
5
annotation workflow. This allowed us to precisely annotate pseudogene loci and create a consensus set of
pseudogenes.
We identified potential transcribed pseudogenes from locus-specific transcription evidence (i.e.,
EST and mRNA data) and high throughput sequencing data (e.g., RNA-Seq)[29]. Candidate transcribed
pseudogenes were assessed by large-scale RT-PCR-Seq. The experimental results can serve as a
benchmark for computational models of pseudogene transcription. Finally, for each tissue tested, a list of
transcribed pseudogenes was obtained. The results indicate that pseudogene transcription is
predominantly tissue-specific. Using the functional genomics data from the ENCODE consortium
together with the pseudogene annotation, we found that the transcribed pseudogenes tend to associate
with a more active chromatin state and maintain more active promoter regions, compared to their non-
transcribed counterparts. Both the transcription and regulation of pseudogenes exhibit tissue specificity.
Alongside “fully active” pseudogenes, we also found evidence for pseudogenes showing partial
activity patterns. One hypothesis is that these pseudogenes are the result of genomic elements in the
process of either losing or gaining function. Thus, we consider pseudogenes showing partial activity as
products of “dying” genes or undergoing a “resurrection” process. Two well-known examples of “dying”
and “resurrected” pseudogenes are ACYL3 [30] and XIST [31], respectively. Partially active pseudogenes
form an interesting group of case studies for the evolution and dynamics of function development. There
can be different patterns of pseudogene partial activity. For example, duplicated pseudogenes that arise
from “dying” genes may lack transcriptional evidence, but retain some of the upstream control elements
from their parents, e.g., active transcription factor binding sites and various levels of chromatin activity.
However, these genomic elements may no longer be evolutionarily constrained. Similarly, we can
envision a scenario where processed pseudogenes that do not have their parental upstream regulatory
sequences, might gain functionality when they are inserted into a region of the genome favorable for
transcription. Such pseudogenes may gain upstream regulatory sequences and hence transcriptional
potential resulting in novel ncRNAs. The resurrection motif was previously used by Vinckenbosch et al
[7] and Kaessmann et al [32] to describe the transition of retrogenes to fully functional genes. The authors
6
suggest that retrogenes “hitch-hike” on the regulatory apparatus of nearby genes in order to obtain
transcription potential.
All the pseudogene activity data generated by this study is recorded in a pseudogene annotation
resource file where each pseudogene is “decorated” with metadata regarding transcription status,
functional genomics information, and selection pressure derived from corresponding data. The annotation
file is available online [33, 34].
Results
1. Assignment of Pseudogenes
1.1 Genome-wide Pseudogene Identification
The annotation of all pseudogenes in the human reference genome is part of the wider effort by the
GENCODE consortium which also aims to identify all protein-coding, long non-coding RNA and short
RNA genes [27, 28]. Similar to the annotation of other functional classes, the annotation of pseudogenes
contains models that have been created by the Human And Vertebrate Analysis aNd Annotation team
(HAVANA), an expert manual annotation team at the Wellcome Trust Sanger Institute. This is informed
by, and checked against, computational pseudogene predictions by the PseudoPipe [35] and Retrofinder
[36] pipelines (details in Methods). These computational pseudogene predictions provide hints to manual
annotators during the first-pass of annotation and identify potential missing features, flagging them for
manual re-investigation (Fig. 1).
A “level” index is used to represent the supportive evidence of each pseudogene from the
annotation procedure. Level 1 indicates pseudogenes that have been confirmed by both manual and
automatic annotation pipelines. Level 2 highlights elements that have been annotated by manual
inspection only. We also define level A as pseudogenes determined by automated annotation. This is
represented as PseudoPipe-specific (A-P), RetroFinder-specific (A-R) and a “2-way” consensus set

7
derived from predictions of both pipelines (2-way). Table 1 gives a summary of the pseudogenes used in
GENCODE v7 based on their annotation level.
The pseudogenes are annotated with different biotypes (e.g., processed or duplicated) based on
the mechanism by which they arose and their evolutionary histories. The pseudogene biotypes are
explained in detail in Table 2.
The GENCODE protein-coding and pseudogene annotation is completely integrated. Each
potential pseudogene locus is investigated for protein-coding potential (and vice versa) and all loci are
strictly described as either protein-coding or pseudogenic, but never both (Additional file 1, Figure s0).
Protein-coding loci derived via retrotransposition may be misidentified as processed pseudogenes due to
the structural differences when compared to their parent loci, reviewed by Kaessmann et al (2010).
However, we distinguish retrogenes from processed pseudogenes by careful manual annotation
(Additional file 1, Table s0). For example, the retrotransposed protein-coding loci USP26, KLF14 and
PGK2 are all protein-coding biotypes in the GENCODE geneset.
In this study, we focused on a pseudogene set comprised of manually annotated pseudogenes (a
union of levels 1 and 2). Polymorphic pseudogenes, which are coding genes that are pseudogenic due to
the presence of a polymorphic premature stop codon in the reference genome (GRCh37), were excluded
from our study in order to avoid the likelihood that they may have coding potential in the cell lines and
tissues studied by other ENCODE groups. We call these 11,216 pseudogenes the "surveyed set". The set
contains 138 unitary pseudogenes. For the purpose of this paper, only the processed and duplicated
pseudogenes will be discussed in detail.
The workflow used to identify the pseudogenes in this dataset is described in Figure 1. In addition
to the 11,216 pseudogenes, the “2-way” consensus set derived from the automated pipeline annotations
includes an additional 1,910 pseudogenes (including 3 level 1 polymorphic pseudogenes). As manual
annotation is done in a chromosome-by-chromosome fashion, it is not biased relative to any particular
genomic feature. Thus, we feel that our “surveyed set” is the best representative of the total pseudogenes
complement in the genome.

8
1.2 Pseudogenes Statistics
The number of manually annotated pseudogenes in the human genome has grown along with the
development of the GENCODE project. Figure 2 follows the variation of the total number of pseudogenes
in the human genome with the development of GENCODE annotation from v1 to v7. Over all the
GENCODE releases, the total number of pseudogenes follows a linear growth rate. Extrapolating from
this tendency, we estimate that the entire human genome contains approximately 12,683 protein
pseudogenes. Alternatively, using the current manually annotated pseudogenes as a benchmark, we can
estimate the accuracy of the automated pipelines, and then extrapolate it to the whole genome. With this
approach, we estimated that the number of pseudogenes in the human genome is 14,112 (Fig. 2). Details
of both approaches are described in the Methods.
The estimated number of pseudogenes in this study is smaller than that predicted from the pilot
study, where we identified 201 pseudogenes in 1% of the human genome. One reason is that the pilot
study included biased genomic regions – there was a single region containing a large cluster of olfactory
receptor pseudogenes – and is not representative of the entire human genome [15]. These estimates are
smaller than previous computational analyses reported by Torrents et al. (2003) and Zhang et al. (2004)
that predicted the presence of 19,724 [11] and 19,293 [37] pseudogenes respectively. This is due to
improvement in the genome assembly and the gene annotation datasets. The number of genes annotated in
the genome has steadily dropped with the improvement in annotation [38]. Consequently, the total
number of pseudogenes decreased due to a smaller and more accurate number of parent proteins. Thus,
spurious pseudogene annotations due to erroneous gene models are no longer present in the current
pseudogene dataset.
1.3 Difficulties in Pseudogene Annotation
The hybrid approach of pseudogene identification combining manual and automated annotation allows us
to take advantage of the strengths of both methods. Automated pipelines for the detection of pseudogenes
have significant strengths such as fast speed, comprehensive coverage and ability to detect weak
9
homologies revealing highly degraded or truncated pseudogenes. In addition, the pipelines can be
combined with comparative analysis to highlight the evolutionary origin of pseudogenes (for example to
determine whether a single exon pseudogene has arisen due to duplication or a de novo retrotransposition
event). However, automated methods are likely to introduce or propagate errors either due to mis-
annotation of parent loci, or lack of a genome-wide high-quality annotation of protein-coding genes. The
latter fact probably accounts for the large number of pseudogenes in the initial pipeline surveys.
One difficult case for pseudogene annotation is the identification of partially spliced
pseudogenes, derived via the retrotransposition of a transcript that retains at least one intron for the parent
locus. We have identified a total of eight such partially processed pseudogenes through computational
analysis followed by careful manual examination (Additional file 1, Table s3).
Manual intervention allows the assessment of the validity of a protein-coding locus used as a
parent by an automated pseudogene prediction method. It is also essential in both identifying and
elucidating those instances where pseudogenes intersect with other transcript biotypes, i.e., protein-coding
loci and long non–coding RNAs (lncRNAs), such as in the case of resurrected pseudogenes. These
pseudogenes often require only relatively small changes in structure like a single exon skip or shifted
splice junction to restore coding potential and thus are challenging to detect computationally. A number
of cases where pseudogenes intersect with functional loci are discussed below.
1.4 Pseudogene Sequences Used by Other Functional Loci
Pseudogenes can contribute sequences to other loci including coding exons, 5' UTR, 3' UTR and
polyadenine signals, via their insertion in either the sense or antisense orientation. Such loci range in
complexity from simple cases where a single pseudogene is overlapped by one transcript to instances of
greater complexity where multiple pseudogenes are overlapped by multiple transcripts, and transcriptional
read-through from proximal protein-coding and lncRNA loci (Fig. 3). For example, MST1P9 (Additional
file 1, Figure s1), whose translation is supported by mass spectrometry data, is a potential "resurrected"
pseudogene that has gained a novel function and therefore has been re-annotated as a new protein-coding
10
locus [28]. Another example is the PTEN pseudogene [18], which has been resurrected as a functioning
lncRNA that regulates its parent locus via an intermediate pathway involving shared miRNAs. In all these
cases, good annotation highlights the evolutionary history of pseudogene-derived loci, which may give
insight into any potentially new function.
We manually examined 131 pseudogene models overlapping protein-coding genes. Within this
set, 80 pseudogenes are annotated on the same strand as the protein-coding gene, of which 52 are
duplicated and 28 are processed pseudogenes. Pseudogenes overlapping annotations on different strands
comprise of 20 duplicated and 31 processed pseudogenes. All the pseudogenes overlapping protein-
coding genes fell into one of the following categories (Figure s2 and Figure s3 of Additional File 1):
1. Part of the pseudogene sequence is used to create a new alternatively spliced internal exon in the
protein-coding gene (Additional file 1, Figure s2 (a))
2. The pseudogene sequence contributes the 5’ terminal exon of the protein-coding gene (Additional
file 1, Figure s2 (b))
3. The pseudogene sequence contributes the 3’ terminal exon of the protein-coding gene (Additional
file 1, Figure s2 (c))
The role of processed pseudogenes in the evolution of protein-coding genes has already been described
[36]. Here we have found the same to be true for duplicated pseudogenes. Further analysis is required to
determine whether the translation of the acquired exon is in the same or different frame to the coding
sequence of the pseudogene’s parent and to determine whether splice sites are shared between the
overlapping genes.
2. Pseudogene Decoration Resource (psiDR)
There is a large amount of information related to pseudogene annotation that goes considerably beyond
simple genomic coordinates. To facilitate the study of pseudogene activity, we have created a resource to
“decorate” the pseudogene annotation with additional information – the pseudogene decoration resource
(psiDR). To create this resource, we consistently collected and organized a large variety of genomic
11
information relating to each pseudogene in a consistent manner, such as transcriptional activity,
chromatin features, functional genomics and evolutionary constraint. As described in the following
sections, various models and filters were applied to the corresponding data to characterize biological
features of pseudogenes. We characterized the transcriptional state of pseudogenes using the integration
of three pipelines. Furthermore, we used simple statistical models to partition the pseudognes based on
various genomic features. The distribution of functional genomics and selection signals was compared
between transcribed and non-transcribed pseudogenes. Finally, a list of quantifiers were assigned to each
pseudogene according to the output of the model, such as whether it has an active chromatin state,
associates with active promoter regions, etc. Tissue/cell line specific information was recorded wherever
applicable.
Overall, psiDR provides a variety of activity information for all the surveyed pseudogenes. It is a
valuable resource for pseudogene activity studies that can provide potential targets for further
experimental follow-up. Table 3 contains a detailed description of the pseudogene information featured in
psiDR. In the following sections, we describe each component in detail.
3. Parents of Pseudogenes
3.1 Identification of Pseudogene Parents
We refer to the functional paralog with the greatest sequence similarity to a pseudogene as its parent gene.
Identifying pseudogene parents is critical for the study of a pseudogenes’ evolutionary history and their
potential regulatory functions. Currently, we have successfully identified parents for 9,369 pseudogenes,
whereas the parents for the remaining 1,847 pseudogenes are still ambiguous and may require further
manual annotation. It is important to note, however, that it is not always possible to identify the true
parent of a pseudogene with certainty. For example when a pseudogene is highly degraded and is derived
from a parent gene with highly similar paralogs, or when the parent contains a commonly found
functional domain.
12
The total number of parent genes for all the pseudogenes is 3,391. While the majority of parents
(2,071) have just one pseudogene, some of them are associated with a large number of pseudogenes,
among these are ribosomal protein L21 (RPL21, 143 pseudogenes) and glyceraldehyde-3-phosphate
dehydrogenase (GAPDH, 68 pseudogenes). These results are consistent with the previous studies
showing that housekeeping genes tend to have more pseudogenes [13, 39, 40].
3.2 Sequence Identity to Parent Genes
Recent studies have shown that some pseudogenes can regulate their parent genes’ activity at the
transcript level [18, 19, 22, 23, 24]. For example, the pseudogene transcript sequence homologous to the
parent may either hybridize with the parent mRNA to generate endogenous siRNAs, or act as a decoy to
buffer the binding of a miRNA to parent gene transcripts. Pseudogenes with such functionalities are
expected to exhibit high sequence identity to their parent genes’ coding exons and/or 3’ UTR sequences.
Therefore, for each pseudogene, it is of interest to examine the sequence identity to its parent in these
particular regions.
We calculated sequence identity between pseudogenes and their parents by examining the
alignment of their exon sequences (see Methods). Processed and duplicated pseudogenes were shown, on
average, to have similar sequence identity to their parents' coding sequences (CDS), where their mean
identities are 80.3% (±13.2%) and 76.9% (±13.9%), respectively. However, the two classes of
pseudogenes exhibit different sequence identity distribution patterns. Processed pseudogenes have a
unimodal distribution with a specific group showing high sequence identity to their parents (around 90%).
Duplicated pseudogenes, in contrast, showed a more uniform distribution of sequence identities to their
parents’ CDS regions (Fig. 4A). These results are in accordance with previous data showing a burst of
retrotransposition events in the recent evolutionary history of the human genome that generated a large
number of young processed pseudogenes [13, 41, 42]. The relatively higher number of duplicated
pseudogenes with low sequence identity (~65%) to their parents can be an indication of a minor burst in
the creation of duplicated pseudogenes in ancient time. Both duplicated and processed pseudogenes
13
showed no significant difference in sequence identity to the 3’ UTR of their parent genes. The mean
sequence identity is 68.4% (±24.9%) for processed pseudogenes and 61.0% (±24.2%) for duplicated
pseudogenes. Both processed and duplicated pseudogenes exhibit a bimodal distribution for the 3’ UTR
sequence identity (Fig. 4B), implying that the CDS and 3’ UTR of pseudogenes may be under different
evolutionary constraints.
We next compared the CDS and 3’ UTR sequence identity of each pseudogene to its parent.
While most pseudogenes have comparable sequence identities to the two genomic regions, there are
pseudogenes that exhibit high sequence identity to 3’ UTR but poor identity to CDS, or vice versa (Fig.
4C). This inconsistency implies that mutations were rejected by natural selection non-randomly. Certain
regions in the sequence may be under higher evolutionary constraint than the others. We identified 998
pseudogenes showing a high (>80%) sequence identity to parent CDS and simultaneously poor (<60%)
sequence identity to 3’ UTR, and 36 pseudogenes with high (>80%) sequence identity to parent 3’ UTR
and small (<60%) sequence identity to CDS. These thresholds were selected to separate the two modes of
the sequence identity distributions (Fig. 4A, 4B). Using this simple approach, we partitioned the
pseudogenes into nine groups based on sequence identity between the pseudogenes and the parent genes
at CDS and 3’ UTR levels. Each pseudogene has a label corresponding to one of the nine classes, which
is recorded in psiDR.
4. Transcription of Pseudogenes
We identified pseudogene transcription on a genome-wide scale by combining computational pipelines
(Fig. 5A) and high throughput wet-lab experiments. Transcribed pseudogenes were identified with
computational models, from which a selected group was then evaluated experimentally via RT-PCR-Seq
techniques (Fig. 5B).
4.1 Pseudogene Transcription Identified by a Sequence of Computational Pipelines

14
Three computational pipelines were combined to identify transcribed pseudogenes using
various data sources. A pseudogene was considered transcribed and its status was recorded in psiDR if it
passed the selection criteria of at least one of the three (Fig. 5A). Thus, 876 transcribed pseudogenes
were identified that include 531 processed and 345 duplicated ones. We consider this to be a conservative
estimate of the total number of transcribed pseudogenes, since each of the pipelines had fairly stringent
selection parameters. The three pipelines are described as follows:
(1) The first pipeline examined manually annotated pseudogenes with locus-specific
transcription evidence derived from databases of ESTs and mRNAs [29]. The locus-specific transcription
evidence consists of a best-in-genome alignment in the pseudogene locus and clear differences when
compared to the parent locus. Using this approach, 422 pseudogenes were classified as transcribed.
(2) The second pipeline focused on the total RNA-Seq data, which is available for only two
ENCODE cell lines: GM12878 and K562. One advantage of using a total RNA sample lies in its
comprehensive inclusion of transcription products such as both mRNAs and small RNAs. In this method,
we considered a pseudogene as transcribed if one of the following two criteria was fulfilled: a) there were
reads mapped to the pseudogene sequence and no reads mapped to the parent, or b) both the pseudogene
and the parent were covered by reads but they had a low sequence similarity (<90%). Using this
conservative approach we identified 110 transcribed pseudogenes.
(3) The third pipeline was targeted at pseudogenes showing some transcriptional evidence but
not fulfilling the requirements of selection pipeline #2. In this approach we used the PseudoSeq pipeline
to analyze the data from the Illumina Human BodyMap 2.0 project. PseudoSeq analyzed the expression
patterns of a pseudogene and its parent gene using RNA-Seq data across multiple tissues (Fig. 5C).
Pseudogenes with discordant expression patterns from those of the parent genes were considered as
transcribed. The potential of a mapping artifact was ruled out by the difference in their expression
patterns. Using this approach we identified 344 pseudogenes with transcription evidence (Fig. 5D).
4.2 Experimental Validation
15
We have experimentally tested the transcription evidence of 469 transcribed pseudogenes
predicted by computational approaches (see Methods). We used RT-PCR-Seq, a method that combines
RT-PCR amplification with a highly multiplexed sequencing readout, that reaches sensitivities of 92%
and 79% for known coding and non-coding transcripts, respectively [43].
Targeted pseudogenes can be divided into three classes: i) multiexonic models in which we
assessed an exon-exon junction between exons less than 90% identical to the parent (and other duplicated
pseudogene copies); ii) monoexonic models where pseudogene-specific primers could be designed (i.e.
primers are unable to amplify the parent gene because they map to regions possessing a large number of
substitutions between parent and pseudogene); and iii) monoexonic models, where it was not feasible to
design specific primers. Therefore, the resulting amplification of both parent and pseudogene transcripts
must be discriminated by substitutions present in the amplicon. As monoexonic models are sensitive to
genomic DNA contamination, they were assessed by amplification of cDNA in which a dNTP analog was
incorporated as described in [44]. Each of these three categories was considered experimentally validated
using different criteria (see Methods) [43]. The criteria were adjusted to take advantage of the
pseudogene-specific substitutions, as well as to consider the possibility that sequencing reads mapping to
the pseudogenes could result from co-amplified expressed parental genes. We validated 7 out of 10
monoexonic pseudogenes targeted with specific primers, and 333 out of 418 regular monoexonic
pseudogenes (Fig. 5E). The validation did not reach 100%, probably due to fact that some pseudogenes
were not being transcribed in the eight tissues tested.
Among the 82 multiexonic pseudogenes, only 18 were experimentally confirmed (41
pseudogenes were also tested with monoexonic model). This lower validation rate is explained by the fact
that the transcribed pseudogenes probably function as lncRNAs rather than being translated into proteins.
Thus, it is probable that multiexon pseudogenes will not be spliced in identical fashion to their parent
proteins. This is consistent with the results that among the 41 pseudogenes that were tested by both
multiexonic model and monoexonic model, 4 were validated by both models, 35 were validated by
monoexonic model only and 2 were not validated by either model.

16
The testis transcriptome showed the highest complexity (highest percentage of validated
expressed pseudogene models at 64% from all three classes combined), which is consistent with the high
level of transcription reported in this tissue [43, 45]. The expression patterns determined by RT-PCR-Seq
are highly correlated with the expression reported by RNA-Seq. For example, the expression patterns of
all the monoexonic pseudogenes, validated with specific primers, are fully replicated by RT-PCR-Seq.
5. Evolutionary Constraint on Pseudogenes
Beyond transcription, we next focused on the evolutionary constraint of human pseudogenes. Constraint
on genomic sequences has also been regarded as indicator of biological function [46]. The availability of
whole genome sequencing data and personal genome sequencing data allows us to carry out an
evolutionary constraint study on human pseudogenes at a genome-wide scale from both the divergence
and the diversity perspectives.
Firstly, we analyzed the sequence preservation between human pseudogenes and their orthologs
in 15 different organisms ranging from chimp to lizard, where the orthologs were derived from the
multiple sequence alignments available from the UCSC genome browser. Figure 6 shows for each species
the preservation rates of protein-coding sequences, duplicated pseudogenes and processed pseudogenes.
While the preservation of duplicated pseudogenes decreases gradually with the increase of evolutionary
distance of the species from human, the preservation of processed pseudogenes exhibits an abrupt
decrease from macaque to mouse and remains low within the species more divergent than mouse. These
results are in agreement with previous findings showing that the majority of processed pseudogenes in
humans and mice are lineage-specific, arising from distinct retrotransposition bursts happening in the two
organisms after they diverged [13, 40]. The distribution of pseudogenes’ divergence between human and
chimp is shown in figure S5.
Secondly, we studied the evolutionary selection on human pseudogenes by integrating the
annotation with the variation data from the 1000 Genomes pilot project [47]. We computed the densities
of SNPs, indels and structural variations (SVs) in pseudogene sequences and their respective derived
17
allele frequencies (DAFs). The densities suggested a weak signal for differential selection on transcribed
versus non-transcribed pseudogenes (Additional file 1, Figure s6). However, no significant differences
were found in the DAF spectra (Fig. 7), and it is possible that the difference in the densities may be due to
confounding factors such as variation in mutation rates in the genome. Thus, we cannot make a strong
statement about selection in the human population on transcribed pseudogenes.
Next we analysed the pseudogenes’ divergence using sequence identity to orthologs in the
chimpanzee genome, where higher sequence identity implies lower divergence and negative selection.
The distribution of pseudogenes’ divergence was calculated and the results indicate that a fraction of the
pseudogenes exhibiting lower divergence are under evolutionary constraint (Additional file 1, Figure s5).
Divergence and diversity results indicate that although pseudogenes, as a group, are under low
selection pressure, a small subset may exhibit higher evolutionary constraint. To identify these
pseudogenes, we analyzed the divergence to orthologs in the chimp and the mouse genome under the
assumption that the conserved pseudogenes will show significantly lower divergence than neutral
background (see Method). There are 1,019 conserved pseudogenes identified in the human genome. The
conserved group is enriched with transcribed pseudogenes (195 conserved pseudogenes are transcribed,
p-value = 1.19x10⁻³⁵), strongly implying biological function. 28.1% of duplicated pseudogenes and 3.4%
of processed pseudogenes are conserved. This difference is due to the fact that most processed
pseudogenes are lineage-specific, and the fact that most of the processed pseudogenes are dead on arrival.
Evolutionary constraint information of all the pseudogenes is collected in the psiDR.
6. Chromatin Signatures of Pseudogenes
Following the study of the canonical signatures of transcription and selection of pseudogenes, we focused
on the more elusive indications of "partial activity" - chromatin marks and upstream TF binding. In
particular, we intersected the annotated pseudogene locations in the human genome with the extensive
amount of functional genomics data from the ENCODE production project. We were able to correlate
18
these results with the transcription and conservation information of pseudogenes discussed previously, to
identify pseudogene cases consistent with partial activity.
In this section, we present the results pertaining to chromatin state. Chromatin accessibility,
histone modification and genome-wide segmentation pattern on ENCODE cell lines were studied and
results for the K562 cell line are described and shown here as an example.
6.1 Chromatin Accessibility and Histone Marks of Pseudogenes
We compared the chromatin accessibility around the transcription start site (TSS) for active coding genes,
transcribed and non-transcribed pseudogenes. DNaseI hypersensitivity signals along 8-kb regions
surrounding the TSSs were averaged across all the genomic sequences in each of the three different
groups. Transcribed pseudogenes show enhanced DNaseI hypersensitivity compared to non-transcribed
pseudogenes on average, although as expected, both signal profiles were lower than that for the coding
genes (Fig. 8).
A series of histone marks were also analyzed in the same manner as for the chromatin
accessibility (Fig. 8). In general, we found that the transcribed pseudogenes show more enhanced signals
for active histone marks such as H3K4me1 and H3K4me3 than the non-transcribed pseudogenes, while
they show little difference between the signals for repressive histone marks, such as H3K27me3. Our
results show that, on average, the transcribed pseudogenes possess more transcriptional potential than
non-transcribed ones, and their regulation mechanism may be similar to that of protein-coding genes.
6.2 Chromatin States Segmentation
There is a large variety of chromatin marks available. Therefore, we decided to use the chromatin states
as a higher level feature in order to summarize all these descriptors. The chromatin states were assessed
using the Segway segmentation pattern as defined by [48]. Segway annotates the genome using 25
different labels (Additional file 1, Table s1) representing active and repressive marks. The genome-wide
distribution of the segments shows a higher density of repressive markers compared to those indicating
transcriptional activity. We analyzed the frequency of Segway markers for transcribed and non-
19
transcribed pseudogenes, and their respective parent genes (Fig. 9). We note that the non-transcribed
pseudogenes show a depletion of TSS marks compared to transcribed pseudogenes, but enrichment in
repressive marks. These results are in accordance with the trends noted earlier for histone modifications
and chromatin accessibility.
The pattern of a high frequency of TSS and gene body marks exhibited by the parent gene was
considered a hallmark of active chromatin. Based on this observation we developed a model using two
selection criteria to pinpoint pseudogenes with active chromatin states:
1. The frequency of the TSS is 3 times higher than the frequency of any repressive markers.
2. The GS, GM and GE frequencies are 2 times larger than the frequency of the repressive markers.
The selection criteria were chosen to match the segmentation behavior of the active genes. We identified
915 pseudogenes with active chromatin (92 using selection criterion #1 and 823 using the second
criterion) in the K562 cell line. Examples of pseudogenes with active chromatin states are shown in
Figure 10. The pseudogenes selected using the above criteria are indicated in the psiDR for each cell line
analyzed.
7. Upstream Regulatory Elements
Given the importance of transcription in understanding pseudogene function and biological behavior, we
focused our next analysis on the regulatory elements present in the upstream sequences of pseudogenes.
More specifically, we investigated transcription factor binding sites (TFBS), active RNA polymerase II
(Pol2) binding sites and the active promoters of pseudogenes. All the information regarding the upstream
regulatory elements of each pseudogene is recorded in psiDR.
7.1 Identification of TFBSes
We examined the TFBSes located in the upstream regions of all pseudogenes. A large fraction of
pseudogenes contain no transcription factor binding sites in their upstream sequences (i.e., 91.0%, 86.7%,
92.0%, 92.7% and 86.7% in Gm12878, K562, Helas3, H1-hesc and Hepg2, respectively). This is

20
consistent with the previous results showing most pseudogenes are not transcribed and have unfavorable
chromatin structures.
Transcription factors that bind to the upstream regions of transcribed and non-transcribed
pseudogenes were examined. Compared to the non-transcribed pseudogenes, the transcribed pseudogenes
tend to have more transcription factor binding sites in the K562 cell line, although in both groups, the
majority of pseudogenes contain 0 or very few (1 or 2) binding sites in their upstream regions (Fig. 11).
The difference between the number of TFBSes for the transcribed and non-transcribed pseudogenes is
small but statistically significant (Wilcoxon rank-sum test, p-value = 3.8x10⁻³ in K562). Similar results
can be seen in the other four cell lines (Figure S7).
7.2 Pol2 Binding Sites
Pseudogenes were also examined in each cell line for potential Pol2 binding sites in their upstream
sequences. To alleviate the potential mapping artifacts from the ChIP-Seq analysis, we applied a filter on
Pol2 binding peaks to retain only the strong signals (see Methods). Three selection criteria were used to
identify pseudogenes with active Pol2 signals.
1. Width of a Pol2 binding peak is larger than the top 5% of all Pol2 peak widths across the
ENCODE cell lines. The threshold based on ENCODE 2011 January freeze data is 519 bp.
2. Signal value of a Pol2 binding peak is larger than the top 5% of all Pol2 signal values across all
the studied ENCODE cell lines. The threshold based on ENCODE 2011 January freeze data is
2.38.
3. At least one of the Pol2 cofactors included in the ENCODE project (Taf1, Taf7, Tbp, Nelfe,
Gtf2f1, Gtf2b and Ccnt2) also binds to the upstream sequence of the pseudogene being studied.
A pseudogene that satisfied condition 1 and 2 or satisfied condition 3 was considered to have active Pol2
binding sites. There were 227, 197, 132, 117 and 115 pseudogenes in K562, Gm12878, Helas3, H1hesc
and Hepg2 cell lines, respectively, have been shown to have active Pol2 binding sites. Active Pol2
binding sites were significantly enriched in the transcribed pseudogenes, where the p-values were
21
1.95x10⁻⁹ (K562), 3.57x10⁻¹³ (Gm12878), 7.38x10⁻¹² (Helas3), 3.24x10⁻¹⁰ (H1hesc) and 1.96x10⁻¹⁰
(Hepg2).
7.3 Active Promoters for Pseudogenes
We used the random forest model developed by Yip et al. [49] to predict active promoter regions for all
the pseudogenes in each cell line. The objective of this model is to capture general properties of genomic
regions such as regulatory modules by integrating ~500 ChIP-Seq experiments for more than 100 TFs and
related factors. It calculates the likelihood of a region being an active promoter based on the chromatin
accessibility data (from both DNase I hypersensitivity and FAIRE experiments), histone modifications,
TF binding, and conservation [49]. By intersecting the resultant set of active promoters from the model
with pseudogene upstream sequences, we found 233, 215, 183, 134, and 144 pseudogenes from K562,
Gm12878, Helas3, H1hesc, and Hegp2 possess active promoters, respectively. In all the cell lines, active
promoters were significantly enriched in the transcribed pseudogenes, where the p-values were 1.19x10⁻⁵
(K562), 1.95x10⁻¹² (Gm12878), 4.45x10⁻¹⁰ (Helas3), 1.22x10⁻¹¹ (H1hesc) and 7.20x10⁻¹² (Hepg2).
8. Data Integration in psiDR
As shown in the previous sections, pseudogenes maintain diversified and complicated activity patterns,
and the same pseudogene may exhibit different activities across different tissues. In this section, we will
integrate the data in psiDR across a variety of partial activities.
8.1 Tissue Specificity of Pseudogene Activities
First, we investigated the tissue specificity patterns observed for pseudogene transcription (Fig. 5D).
Among the 344 transcribed pseudogenes from the Illumina Human BodyMap data, 10 were transcribed in
all the 16 tissues, while 190 were transcribed in one tissue only. Testis contained the largest number of
transcribed pseudogenes (127 out of 344), and skeletal muscle contained the least (16 out of 344).
The pseudogenes with upstream regulatory regions, i.e., active promoters and active Pol2 binding
sites, also exhibit tissue specificity. We measured the similarity between any two active pseudogene sets
22
from different cell lines with the Jaccard index, which is defined as the ratio of the size of the intersection
divided by the size of the union of the two sets. The similarities of active pseudogenes between each pair
of cell lines are summarized in Table 4. The values range from 0.22 to 0.39. The low similarity values
between different cell lines indicate that these cells have distinct active pseudogenes.
We also examined the transcription factors whose binding sites were enriched in the transcribed
pseudogenes compared to the non-transcribed pseudogenes. Some general-purpose factors such as Pol2
were enriched in transcribed pseudogenes of all the cell lines, while each cell line also had some unique
transcription factors (Additional file 1, Table s2). In some cases, the transcription factors unique to a cell
line were found to be associated with the biological roles of that cell. For example, Hnf4a, which is a
nuclear transcription factor playing a role in liver development, was only enriched in active pseudogenes
in the liver cell line Hepg2, while Pou2f2, which activates immunoglobulin gene expression, was only
enriched in active pseudogenes in the B-lymphocyte cell line Gm12878.
8.2 Overall Degree of Partial Activity
A graphical overview of pseudogene activity data included in psiDR for cell line K562 was plotted in
Figure 12 A. Additional activity of pseudogenes (beyond transcription) was obtained from one or more of
the statistical models for chromatin state, chromatin accessibility, Pol2 binding and upstream promoter
regions, as discussed in the previous sections. It can be seen that pseudogenes form a diversified group,
where there are very few pseudogenes showing consistently active signals across all the biological
features and many showing little or no activity.
It is interesting to note that there are pseudogenes showing all kinds of partial activity (examples
in Fig. 12 B, C, D and E). Comparing the pseudogene features indicative of genomic activity with their
parent gene counterparts we noticed a number of interesting cases.
There are 13 non-transcribed pseudogenes in K562 cell with active chromatin that have retained
the upstream regulatory regions of the parent gene and are under strong negative selection. Collectively
these features suggest that these pseudogenes are representative of “dying” genes, which may have
23
recently lost their transcription activity and are in the process of losing functionality. The UGT1A2P
duplicated pseudogene is representative of this class (Fig. 12-E1). It is still under selective constraint and
appears to be well positioned for transcription and the production of a full-length transcript, lying
proximal to active paralogs. However, it does not exhibit any transcriptional evidence. This apparent loss
of features (transcription, splice donor) appears to support the hypothesis that this duplicated pseudogene
is losing its function.
Conversely, there are examples of transcribed pseudogenes showing signals of active chromatin,
DNaseI hypersensitivity, active promoter, and Pol2 binding sites, which appear to be gaining new
functionality. A good example is FAM86EP (Fig. 12-E2). The locus has gained five splice junctions (one
acceptor and four donors), which suggest the possibility of new functionality being explored. There are
other examples of transcribed pseudogenes with active chromatin but without retention of any of the
parent gene’s upstream elements. Changes in the sequences and the upstream regulatory elements can
give rise to new transcript structures, resulting in a locus now encoding a ncRNA rather than a translated
protein product. We hypothesize that these may be dead protein genes being "resurrected" as ncRNAs.
Two genes supporting this hypothesis are shown in Figure 12-E5 and 12-E6. Figure 12-E5 shows an
EGLN1 pseudogene that has gained chromatin activity and active promoter signals via its insertion into a
transcribed duplicated pseudogene locus (SCAND2). The combined locus is transcribed and its transcripts
are subject to alternative splicing, with some transcripts incorporating sequence from both pseudogenes
and having seven novel splice features (four acceptors and three donors). The novel pseudogene shown in
Figure 12-E6 appears to have gained transcriptional signals via its insertion proximal to a CpG island,
which also supports the transcription of a long non-coding RNA on the opposite strand.
In light of these examples, we believe that the partial activity patterns are reflective of the
pseudogene evolutionary process, where a pseudogene may either be in the process of resurrection as a
ncRNA or gradually losing its functionality. Understanding why pseudogenes show partial activity may
shed light on pseudogene evolution and function.
24
Discussion
Pseudogene Annotation
In this study, we describe a set of human pseudogenes at the genome-wide scale. The pseudogene dataset
is created by manual annotation with the assistance of computational pipelines. The surveyed set of
11,216 consensus pseudogenes is the first comprehensive effort of manual annotation of human
pseudogenes at the whole genome level.
Pseudogenes and Their Parents
We combined manual annotation and sequence identity data to identify parent genes for ~86% of
pseudogenes (9,636 out of 11,216). The numbers of protein-coding genes associated with pseudogenes is
not evenly distributed: some housekeeping genes such as ribosomal proteins and GAPDH are among the
parents having the most pseudogenes.
The sequence identity between pseudogenes and their parents is of interest for studies of
pseudogenes evolution and regulatory function. We found a unimodal distribution of sequence similarity
between processed pseudogenes and parents, which reflects a recent burst of processed pseudogenes in
human evolutionary history (Fig. 4). In contrast, the uniform distribution of sequence similarity between
duplicated pseudogenes and parents indicates that the duplication process is random and happens at a
stable rate during genome evolution.
Pseudogene Transcription and Tissue Specificity
A number of recent studies have highlighted the fact that pseudogenes can play active roles through their
RNA products [50]. Using a large variety of biological data and statistical models we predict that at least
9% of the pseudogenes present in the human genome are actively transcribed. We observed that although
there are more processed pseudogenes than duplicated pseudogenes (8248 vs. 2,127) in the human
genome, the ratio between them is not maintained in the transcribed ones (520 vs. 343). The duplicated
25
pseudogenes are significantly enriched in the transcribed list (p-value close to 0). This is expected since
the duplicated pseudogenes may retain the promoter regions of their parents when duplicated, unlike the
processed pseudogenes that insert randomly into the genome and therefore require the presence of
potential regulatory sequences in the neighboring genomic locations.
Pseudogene Conservation
High sequence identity between pseudogenes and their parents does not necessarily imply
selection pressure on the former since it can be due to recent pseudogenization events where a
pseudogene has yet to accumulate mutations from neutral drift. Therefore, to better understand selection
pressure on pseudogenes, we compared the pseudogene CDS and 3’-UTR sequence identity to their
corresponding parent regions. Sequence analysis highlights a group of pseudogenes showing differential
evolutionary pressure on the two regions. Furthermore, analysis of human polymorphism data and
pseudogene conservation shows a potential weak signal for selection on transcribed pseudogenes. Overall,
we identify a number of pseudogenes under evolutionary constraint. Combined with transcription data,
this list contains pseudogenes with potential biological function and may act as a good reference for
additional experimental analysis.
Partial Activity of Pseudogenes
We have integrated a large amount of genome-wide functional genomics data, together with expression
and conservation data, to create a pseudogene annotation resource psiDR. This allows us to
comprehensively examine pseudogenes activity from different perspectives such as transcription,
regulation and evolution. We found a number of pseudogenes showing activity and more interestingly, a
group of pseudogenes exhibiting various ranges of partial activity. Partially active pseudogenes were
defined by a series of simple models based on transcription evidence, chromatin state, DNaseI
hypersensitivity, upstream regulatory elements, and selection pressure. Different combinations of those
features led to the characterization of pseudogenes as being partially active. One can speculate that partial
26
activity may correspond to the process of resurrection of a pseudogene as a ncRNA or that it is in the
process of dying and losing function. We believe that the various partially active pseudogenes provide a
rich informative resource to aid understanding of pseudogene function and evolution.
One of the key aspects in defining the partially active pseudogenes is their upstream regulatory
region. The presence or absence of regulatory elements is essential to understanding the evolutionary
stage of the partially active pseudogenes. For example, a pseudogene showing active promoters and TFBS
but lacking transcription evidence is believed to be a “dying” gene while a pseudogene with markedly
different upstream elements compared to its parent gene but showing evidence of transcription is regarded
as being potentially “resurrected”. In the present paper we define the partially active pseudogenes based
on a number of genomic features, namely transcription factor binding sites, histone marks, DNA
accessibility, etc. However, we expect that future functional genomics datasets will complete the activity
profile of pseudogenes. In particular integration of DNA methylation, nucleosome positioning, ChIA-
PET, and HITS-CLIP datasets will provide a useful addition to the ENCODE pseudogene resource.
In conclusion, by integrating GENCODE pseudogene annotation, extensive functional genomics
data from ENCODE and the variation data from the 1000 Genome project, we provide a comprehensive
resource for pseudogene annotation and activity in the human genome. This resource has allowed us to
classify pseudogenes with various attributes, which will enable interested researchers to identify
expressed pseudogenes with potential function. Recent studies have shown the various ways by which
pseudogenes regulate the expression of protein-coding genes and underscored the importance of
identifying functional pseudogenes. We believe this resource provides data that can be used to further
research in this direction. In particular, it is useful for understanding the regulatory role of pseudogenes,
especially in cancer and other developmental processes. The comprehensive annotation of human
pseudogenes also allows its comparison with pseudogenes from other model organisms such as mouse,
worm, fly, and cress, which can provide valuable information on genome evolution.
METHODS
27
Manual Annotation
The manual annotation is based on protein data from the UniProt database, which is aligned to the
individual BAC clones that make up the reference genome sequence using BLAST [51]. Gene models are
manually extrapolated from the alignments by annotators using the ZMAP annotation interface and the
otterlace annotation system [52]. Alignments were navigated using the Blixem alignment viewer [53].
Visual inspection of the dot-plot output from the Dotter tool [53] is used to resolve any alignment with
the genomic sequence that was unclear in or absent from Blixem. A model is defined as a pseudogene if it
possesses one or more of the following characteristics unless there is evidence (transcriptional, functional,
publication) showing that the locus represents a protein-coding gene with structural/functional divergence
from its parent (paralog):
1. Premature stop codon relative to parent CDS – can be introduced by nonsense or frame-shift
mutation;
2. Frame-shift in functional domain – even where length of resulting CDS is similar to parent CDS;
3. Truncation of 5’ or 3’ end of CDS relative to parent CDS;
4. Deletion of internal portion of CDS relative to parent CDS.
Processed pseudogenes loci lacking disabling mutations are annotated as “pseudogene” when they lack
locus-specific transcriptional evidence
PseudoPipe
PseudoPipe identifies pseudogenes by searching for homology to all known protein sequences in the
genome (defined in ENSEMBL) using a six-frame translational BLAST, followed by removal of
redundancies and merging of the overlapping and continuous BLAST hits. Functional paralogs (parents)
of the resulting pseudogenes are determined by sequence similarity, and the disablements in pseudogenes
are identified through alignment to the parent genes. A non-redundant set of 18,046 pseudogenes was
obtained using the human reference genome (GRch37, ENSEMBL gene release 60). Pseudogenes are
categorized into different classes as processed, duplicated or ambiguous based on their genomic
28
structures. While duplicated pseudogenes have intron-exon like structures, processed pseudogenes contain
only continuous exon sequences with no introns and have traces of polyadenine tails at the 3’ end.
Ambiguous pseudogenes indicate processed pseudogenes with decayed sequences.
RetroFinder
RetroFinder is unique among pseudogene prediction methods for using mRNA alignments to identify
retrogenes including processed pseudogenes [36]. Human mRNA and RefSeq sequences are aligned using
the Lastz [54] alignment program (based on Blastz [55]), which is very sensitive, allowing alignment
down to the level of 65% identity whereas BLAT [56] works better for sequences where identity is
greater than 95%. If one of these transcripts aligns more than once, and one of the alignments is to a
known gene locus then the additional alignments are scored on a number of features indicative of
retrotransposition:
• Multiple contiguous exons with the parent gene introns removed;
• Negatively scored introns that are distinguished from repeat insertions (SVAs, LINEs, SINEs,
Alus);
• Lack of conserved splice sites;
• Break in synteny with mouse and dog genomes using the syntenic net alignments [57] from the
UCSC Genome Browser [58];
• Polyadenine tail insertion.
Parents based on immunoglobulin and zinc finger genes are filtered out since these large gene families
cause false positives. The score threshold is set at 550 based on training with VEGA [59] processed
pseudogenes. Note that for human, VEGA genes are included in the manually annotated genes of
GENCODE. Further details of the method can be found in [36].
Consensus of Manual and Automated Annotation
29
To obtain a consensus set of pseudogenes we verified each pseudogene locus from manual annotation
against those predicted by either of the two automated pipelines (PseudoPipe and RetroFinder), using a 50
base pair overlap criterion. A pseudogene passing these overlapping tests is classified as:
• “level 1” pseudogene: if it passes tests of manual annotation against both automated pipelines, or
• “2-way consensus” pseudogene: if it only passes the test between the two automated pipelines.
As a QC (quality control) exercise to determine completeness of pseudogene annotation in chromosomes
that have been manually annotated, 2-way consensus pseudogenes are re-checked to establish their
validity and added to the manually annotated pseudogene set as appropriate.
Pseudogene Extrapolation
We estimated the total number of pseudogenes in the genome using the knowledge from PseudoPipe and
manual annotation. Using manual annotation from the chromosomes that were completely annotated as a
gold standard, we estimated the number of false positives and false negatives in PseudoPipe predictions.
We used this information to extrapolate to the entire human genome to obtain an estimate of the number
of pseudogenes in the reference genome.
Chromosome 1-11, 20, 21, 22, X, Y and p arm of 12 are fully annotated in GENCODE v7. On
these chromosomes, there are 9,776 and 12,501 pseudogenes predicted by manual inspection and by
PseudoPipe, respectively. PseudoPipe assigned 18,046 pseudogenes in the entire genome. Based on this,
the number of manually identified pseudogenes in the genome will be (9,776 * 18,046) / 12,501 ≈ 14,112.
Alternatively, we used a simple linear extrapolation to correlate the number of pseudogenes with
the size of chromosomes on which the pseudogenes are annotated. With this method, the number of
nucleotides from the fully annotated regions is 2,383,814,825, while the total number of nucleotide in the
genome is 3,092,688,347. Therefor, the predicted number of pseudogenes for the entire human genome is
(9,776 * 3,092,688,347) / 2,383,814,825 ≈ 12,683.
Identification of the Parents of Pseudogenes and Sequence Similarity to the Parent

30
We derived parents of pseudogenes from the correspondence between pseudogenes and query sequences
used by different pipelines (i.e., UniProt proteins for manual annotation and ENSEMBL peptides for
PseudoPipe), together with the sequence alignments of pseudogenes against the whole human genome.
The procedure was carried out using the following steps:
1. Use correspondence between parents and pseudogenes derived by the manual annotation;
2. One-to-one sequence alignment between pseudogenes and coding regions in the human genome
by BLAT (sequence similarity > 90%);
3. Use parent gene information provided by PseudoPipe.
When the parent identity for a pseudogene is inconsistent across different data resources, we assign the
parent based on the highest ranked data in the following order: manual annotation, BLAT alignment, and
automated curation.
Parents of 9,369 pseudogenes were unambiguously identified, while it is difficult to uniquely
identify the parent genes for 1,847 pseudogenes. The two most significant factors that confound our
ability to confidently identify a pseudogene parent are the degree of degradation of the pseudogene and
the number of closely related paralogs to the true parent gene. Therefore, for gene families with many
closely related members, even a relatively small number of mutations can render accurate identification of
the true parent difficult; while for more degraded pseudogenes from large families with common
functional domains (e.g., zinc fingers), the number and similarity of the potential parents make prediction
impossible.
To calculate the sequence identity between pseudogenes and their parents, each pseudogene
sequence was extended by 2kb at its 3’ end for a higher coverage of 3’ UTR of its parent and then aligned
to its parent sequence. Only exons of parent and pseudogene sequences were used. The alignment was
carried out using ClustalW2, with default parameters. To adapt to the large size of 3’ UTR and much
smaller size of small RNA targets in that region, a sliding window of 100bp was used for sequence
identity for a more accurate local identity. The window with the highest sequence identity was taken as
representative of the 3’ UTR and used in the following tests.
31
Pseudogene Transcription Evidence from RNA-Seq Data
The pseudogenes in GENCODE v7 were tested for transcription evidence using the following workflow:
1. We extracted the genomic coordinates of the processed and duplicated pseudogenes from
GENCODE v7 (gene_type = “pseudogene” AND transcript_type = “processed_pseudogene” OR
transcript_type = “unprocessed_pseudogene”). From this step we obtained 8,107 processed and
1,860 duplicated pseudogenes.
2. We obtained the underlying genomic sequence for each pseudogene by concatenating the
sequences of their pseudoexons.
3. We aligned each pseudogene sequence to the human reference genome using BLAT (Kent, 2002)
(with default parameters) to find all similar regions in the genome.
4. We assigned each pseudogene alignment to one of four categories:
a. pseudogenes with no similar regions in the genome (presumably these pseudogenes are
more ancient and have accumulated many mutations; therefore, they have a low sequence
similarity compared to the parent gene),
b. pseudogenes giving rise to one alignment pair (most likely the parent gene),
c. pseudogenes with 2-5 alignments,
d. pseudogenes giving rise to more than 5 sequence alignments.
For the 9,967 pseudogenes analyzed, we obtained the following counts: 3,198 pseudogenes with zero
alignments, 1,907 pseudogenes with one alignment, 2,150 pseudogenes with 2-5 alignments and 2,712
pseudogenes with more than five alignments.
In order to check for evidence of pseudogene transcription, we examined the expression pattern
of each pseudogene and its similar regions using the Illumina Human BodyMap RNA-Seq data set
consisting of 16 tissues:
1. We aligned the reads for each tissue to the human genome reference sequence in conjunction with
a splice junction library using Bowtie (Langmead et al. 2009) and RSEQtools (Habegger et al.
2011). There was no preference given for a genome match over other matches.
32
2. We generated a signal track of the mapped reads for each tissue.
3. For a given pseudogene and its similar regions in the human genome, we extracted the signal
track of mapped reads from all 16 tissues as shown in Figure 5C.
After a number of filtering steps we obtained a list of potentially transcribed pseudogenes. For example,
the set of 3,198 pseudogenes with no similar regions in the genome was reduced to 344 pseudogenes by
requiring that each pseudogene is covered by at least two reads across half of its length in at least one
tissue.
Transcribed pseudogenes subject to experimental validation
Out of the 469 pseudogenes subjected to experimental validation, 94 pseudogenes were randomly selected
from the manual pipeline output (pipeline 1 in Section 4.1); 271 pseudogenes were selected at random
from the PseudoSeq pipeline output (pipeline 3 in Section 4.1), and 97 pseudogenes were selected at
random from the TotalRNA pipeline output (pipeline 2 in Section 4.1). The remaining 7 pseudogenes
(containing 7 loci to be validated), were manually chosen by examining the expression patterns of
pseudogenes and their parents using BodyMap data and PseudoSeq (Fig. 5C). At the time of writing, the
remainder of transcribed pseudogenes are undergoing experimental validation and the results will be
constantly updated in the psiDR.
Multiple Sequence Alignment, Pseudogene Preservation and Polymorphisms in the Human
Population
1. Sequence alignment: Genomic sequence alignments of 16 species including primates, mammals, and
vertebrates were extracted from the original 46-way vertebrate sequence alignments obtained from the
UCSC genome browser. Genomes from all the species were aligned using BlastZ with a synteny filter
followed by the MultiZ method. Assembled sequences for the 2X mammal data are excluded from the
current study due to their low quality and possible false positive alignment to pseudogenes from the high-
quality assemblies.

33
2. Selection pressure: Genomic variation data consiting of SNPs, indels, and structural variations (SVs)
were from 60 individuals in the CEU population from the 1000 Genomes Project pilot data release [47].
3. Pseudogene conservation: Chimp orthologs to human pseudogenes were derived from whole genome
sequence alignments. Only pseudoexons were used in the ortholog identification and the following
analyses. The divergence is calculated as the ratio of mutated nucleotides in the chimp genome to the
length of human pseudogenes. We assume the occurrence of substitution follows a Poisson distribution
and the background substitution rate (null hypothesis mean) was set at 1.5%. The p-value for pseudogene
conservation was derived as the probability of that pseudogene having equal or fewer nucleotide
mutations than it really has under the null hypothesis. We adjusted p-values for multiple hypotheses
testing using the Benjamini and Hochberg approach [62]. All the pseudogenes were ranked by their p-
values from the most significant to the least significant. Pseudogenes with p-values less than (FDR x
Rank / COUNT) were taken as significant, where FDR is set to 0.05 and COUNT is the total number of
pseudogenes tested. Conserved pseudogenes from mouse orthologs were calculated in the same manner,
except the background substitution rate was set to 5%.
Chromatin Segmentation Using Segway
Segway segmentation labels the genome using 25 different markers. Half of them are indicative of
genomic activity (e.g. transcription factor activity, gene body, enhancers), while the other half are
repressive (e.g. CTCF). We calculated the frequency of each marker in the pseudogenes and parent genes
in a genome-wide fashion. All the frequencies were normalized with respect to the total segment
distribution across the entire genome. Two different trends were observed globally for the parent genes:
(a) TSS mark frequency is at least one order of magnitude larger than the frequency of the repressive
marks; and (b) the frequency of the GE, GM and GS marks is on average five times larger than the
frequency of the repressive marks. The segment distribution of the parent genes indicated enrichment in
TSS, GS, e/GM and GE marks and was considered as a standard indicator for active chromatin.
Transcription Factor Binding Sites in the Upstream Regions
34
Transcription factor binding sites were studied using data from ENCODE ChIP-Seq experiments. In this
study, we used the transcription factors occupancy data from the ENCODE 2011 January data freeze. The
binding peaks of all the transcription factors were called by PeakSeq, with optimal settings to reduce the
false negative results due to weak/poor biological replicates. A pseudogene was considered to have a TF
binding site if the majority of a peak for that TF is located within the genomic region 2kb upstream of the
pseudogene.
ENCODE tier 1 and tier 2 cell lines (Gm12878, K562, Helas3, H1-hesc and Hepg2) with ChIP-
Seq data for at least 40 transcription factors were included in this analysis. To avoid confusion with the
transcription factor binding signals from neighboring genomic loci, 693 pseudogenes whose 5’ ends are
less than 4kb away from TSS of protein-coding genes were excluded. In the end, this study focused on
10,523 pseudogenes, where 876 are transcribed pseudogenes.
One confounding factor in the analysis is the different number of transcription factors studied in
each cell line. However, we argue that the numbers here reflect the true tendency of TFBSes for
pseudogenes since a fairly comprehensive list of transcription factors have been studied (74, 114, 53, 40
and 61 transcription factors in Gm12878, K562, Helas3, H1-hesc and Hepg2, respectively) and the results
are consistent across all the different cell lines.
Abbreviations
CDS: coding sequence; DAF: derived allele frequency; EST: expression sequence tag; GE: gene body
end; GM: gene body middle; GS: gene body start; HAVANA: human and vertebrate analysis and
annotation; Pol2: RNA polymerase II; psiDR: pseudogene decoration resource; SNP: single nucleotide
polymorphism; SV: structure variation; TFBS: transcription factor binding site; TSS: transcription start
site; UTR: untranslated region.
Acknowledgements
35
We thank the ENCODE Project Consortium and the Illumina Human Body Map project for making their
data publicly available and members of the Lausanne Genomic Technologies Facility for technical help.
We thank the HAVANA team for their efforts on the manual annotation of pseudogenes. This work was
funded by National Human Genome Research Institute (NHGRI)/National Institutes of Health (NIH)
grants to the GENCODE (U54 HG004555) subgroup of the ENCODE project. We acknowledge grants
from the Swiss National Science Foundation to AR and from the Wellcome Trust (WT077198/Z/05/Z) to
JH, AF and TH.
Authors’ contributions
BP, CS and MG conceived of the study. BP carried out pseudogene parent analysis and upstream
analysis, participated in chromatin signature and pseudogene conservation studies and drafted the
manuscript. CS carried out chromatin segmentation studies and participated in pseudogene parent analysis
and revision of the manuscript. AF, TH and JH carried out the manual annotation of pseudogenes. CH,
AT and AR performed the experimental validation of transcribed pseudogenes. LH carried out the
automated identification of transcribed pseudogenes. XJM carried out the evolutionary selection studies.
RH and MD participated in the pseudogene annotation. SB participated in pseudogene annotation and
revision of the manuscript. MG participated in revision of the manuscript and coordinated the whole
study. All the authors read and approved the final manuscript.
Competing interests
The authors declare no competing interests.

36
Figure Legends
Figure 1: Pseudogene annotation flowchart. A flowchart to describe the GENCODE pseudogene
annotation procedure and the incorporation of functional genomics data from the 1000 Genomes Project
and ENCODE. This is an integrated procedure including manual annotation done by the HAVANA team
and two automated prediction pipelines: PseudoPipe and RetroFinder. The loci that are annotated by both
PseudoPipe and RetroFinder are collected in a subset labeled as “2-way consensus”, which is further
intersected with the manually annotated HAVANA pseudogenes. The intersection results in three subsets
of pseudogenes. Level 1 pseudogenes are loci that have been identified by all three methods (PseudoPipe,
RetroFinder and HAVANA). Level 2 pseudogenes are loci that have been discovered through manual
curation and were not found by either automated pipeline. Delta 2-way contains pseudogenes that have
been identified only by computational pipelines and were not validated by manual annotation. As a QC
(quality control) exercise to determine completeness of pseudogene annotation in chromosomes that have
been manually annotated, 2-way consensus pseudogenes are analysed by the HAVANA team to establish
their validity and are included in the manually annotated pseudogene set if appropriate. The final set of
pseudogenes are compared with functional genomics data from ENCODE and genomic variation data
from the 1000 Genome Project.
Figure 2: Growth of pseudogene annotation. The numbers of pseudogenes present in the GENCODE
dataset from version 1 to version 7 are plotted. The three colors – purple, green and yellow – represent
processed, duplicated and other types of pseudogenes, respectively. The pseudogenes were annotated
manually and/or using the automated pipelines PseudoPipe and RetroFinder. The gray bar indicates the
estimated number of pseudogenes present in the human genome.
Figure 3: Complexity of transcribed pseudogenes. Screenshots of pseudogene annotation are taken from
the Zmap annotation interface. The pseudogenes are represented as open green boxes and indicated by
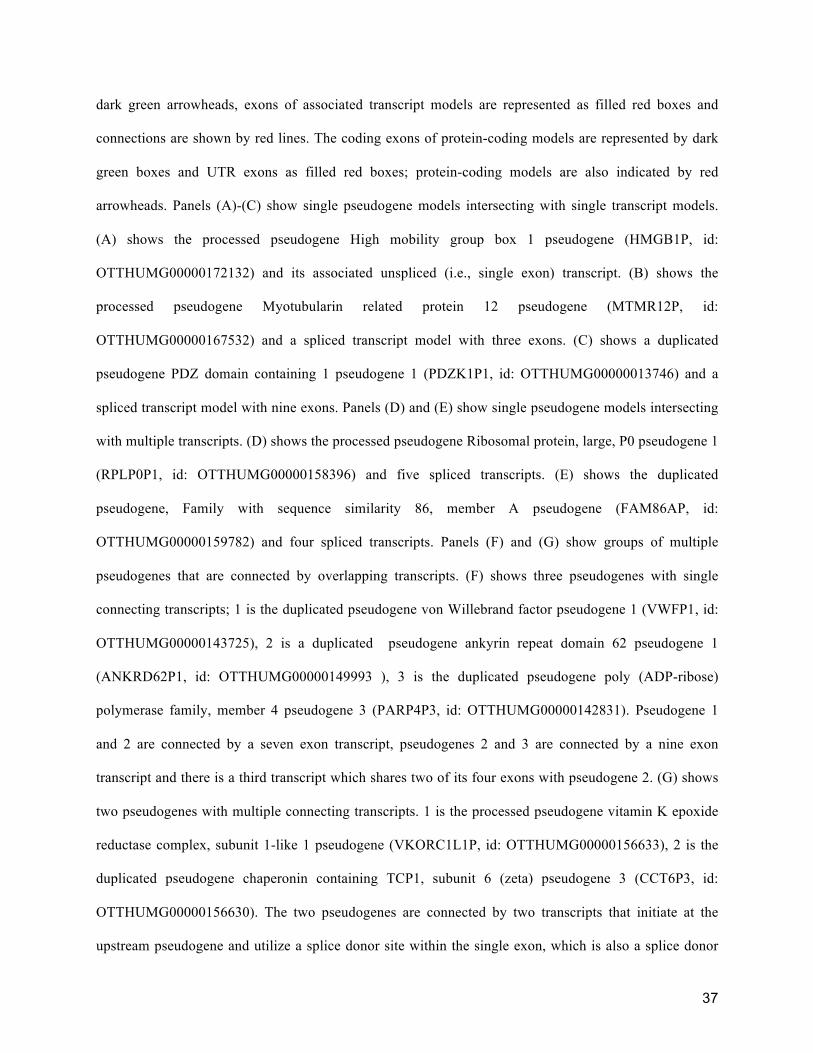
37
dark green arrowheads, exons of associated transcript models are represented as filled red boxes and
connections are shown by red lines. The coding exons of protein-coding models are represented by dark
green boxes and UTR exons as filled red boxes; protein-coding models are also indicated by red
arrowheads. Panels (A)-(C) show single pseudogene models intersecting with single transcript models.
(A) shows the processed pseudogene High mobility group box 1 pseudogene (HMGB1P, id:
OTTHUMG00000172132) and its associated unspliced (i.e., single exon) transcript. (B) shows the
processed pseudogene Myotubularin related protein 12 pseudogene (MTMR12P, id:
OTTHUMG00000167532) and a spliced transcript model with three exons. (C) shows a duplicated
pseudogene PDZ domain containing 1 pseudogene 1 (PDZK1P1, id: OTTHUMG00000013746) and a
spliced transcript model with nine exons. Panels (D) and (E) show single pseudogene models intersecting
with multiple transcripts. (D) shows the processed pseudogene Ribosomal protein, large, P0 pseudogene 1
(RPLP0P1, id: OTTHUMG00000158396) and five spliced transcripts. (E) shows the duplicated
pseudogene, Family with sequence similarity 86, member A pseudogene (FAM86AP, id:
OTTHUMG00000159782) and four spliced transcripts. Panels (F) and (G) show groups of multiple
pseudogenes that are connected by overlapping transcripts. (F) shows three pseudogenes with single
connecting transcripts; 1 is the duplicated pseudogene von Willebrand factor pseudogene 1 (VWFP1, id:
OTTHUMG00000143725), 2 is a duplicated pseudogene ankyrin repeat domain 62 pseudogene 1
(ANKRD62P1, id: OTTHUMG00000149993 ), 3 is the duplicated pseudogene poly (ADP-ribose)
polymerase family, member 4 pseudogene 3 (PARP4P3, id: OTTHUMG00000142831). Pseudogene 1
and 2 are connected by a seven exon transcript, pseudogenes 2 and 3 are connected by a nine exon
transcript and there is a third transcript which shares two of its four exons with pseudogene 2. (G) shows
two pseudogenes with multiple connecting transcripts. 1 is the processed pseudogene vitamin K epoxide
reductase complex, subunit 1-like 1 pseudogene (VKORC1L1P, id: OTTHUMG00000156633), 2 is the
duplicated pseudogene chaperonin containing TCP1, subunit 6 (zeta) pseudogene 3 (CCT6P3, id:
OTTHUMG00000156630). The two pseudogenes are connected by two transcripts that initiate at the
upstream pseudogene and utilize a splice donor site within the single exon, which is also a splice donor
38
site in the pseudogene’s parent locus. Interestingly the downstream locus hosts two small nucleolar RNAs
(snoRNAs) that are present in the parent locus and another paralog. (H) shows a very complex case where
multiple pseudogenes, connected by multiple transcripts readthrough into an adjacent protein-coding
locus. 1 is the duplicated pseudogene suppressor of G2 allele of SKP1 (S. cerevisiae) pseudogene
(SGT1P, id: OTTHUMG00000020323), 2 is a novel duplicated pseudogene (OTTHUMG00000167000),
and the protein-coding gene is C9orf174, chromosome 9 open reading frame 174
(OTTHUMG00000167001). (I) shows a similarly complex case where multiple pseudogenes, connected
by multiple transcripts, readthrough into an adjacent protein-coding locus. 1 is a duplicated pseudogene
stromal antigen 3 pseudogene (STAGP3, id:OTTHUMG00000156884), 2 is a duplicated pseudogene
poliovirus receptor related immunoglobulin domain containing pseudogene (PVRIGP, id:
OTTHUMG00000156886) and the protein-coding gene is PILRB, paired immunoglobin-like type 2
receptor beta (OTTHUMG00000155363).
Figure 4: Sequence identity between pseudogenes and their parents. (A) Distribution of pseudogene
sequence identity to coding exons (CDS) of parent genes. (B) Distribution of pseudogene sequence
identity to 3’ UTR of parent genes. (C) Scatter plot of sequence identity of all the pseudogenes to the
CDS and UTR regions of their parents.
Figure 5: Transcription of pseudogenes. (A) Pipeline for computational identification of transcribed
pseudogenes. Expressed pseudogene candidates showing transcription evidence in ESTs/mRNAs, total
RNASeq data, and BodyMap data were sent for wet-lab validation by RT-PCR or RT-PCR-seq. (B)
Process flow of experimental evaluation of pseudogene transcription. (C) User interface of PseudoSeq for
identifying transcribed pseudogenes with BodyMap data. (D) Transcribed pseudogenes identified using
Human BodyMap data. (E) Experimental validation results showing the transcription of pseudogenes in
different tissues.
39
Figure 6: Preservation of human coding sequences, processed pseudogenes and duplicated pseudogenes.
Sequences orthologous to human genomic regions from different species were studied. The sequence
preservation rate was calculated as the percentage of sequences aligned to human sequence from each
species. The calculation was based on a MultiZ multiple genome sequence alignment.
Figure 7: SNP and indel DAF spectra are shown for transcribed and non-transcribed pseudogenes.
Cumulative plots for variant DAFs in pseudogenes are also shown. The distribution of variant DAFs in
transcribed and non-transcribed pseudogenes are not statistically different.
Figure 8: Chromatin signatures: DNaseI hypersensitivity and histone modification. Average chromatin
accessibility profiles and various histone modifications surrounding the TSS for coding genes, transcribed
pseudogenes, and non-transcribed pseudogenes. The coding gene histone modification profiles around the
TSS follow known patterns, e.g. enrichment of H3K4Me1 around 1kb upstream of the TSS and the
H3K4Me3 peaks close to the TSS. [63]. Transcribed pseudogenes also show stronger H3K4 signals than
non-transcribed pseudogenes. H3K27me3, a marker commonly associated with gene repression [64],
showed depletion around the TSS for the coding gene and a distinctive peak in the same region for the
pseudogenes. H3K36me3 also shows a similar pattern as H3K27me3 at TSS, which may relate to
nucleosome depletion.
Figure 9: Segmentation. Comparison of chromatin segmentations associated with pseudogenes and
parent genes. The transcribed pseudogenes were selected based on following criteria: there is transcription
evidence from GENCODE, BodyMap or mass spectrometry studies; there is no known overlap with
annotated coding genes and there are no neighboring protein-coding genes TSS 4kb upstream or
downstream of the pseudogene start.
40
Figure 10: Examples of pseudogenes with active chromatin states. (A) Processed pseudogenes (ID:
ENST00000495909, genomic location chr5: 90650295-90650751). This pseudogene shows marks of
activity based on Segmentation-activity selection criterion #2. (B) Transcribed duplicated pseudogene
(ID: ENST00000412397.1, genomic location chr1: 998456-1004735). This pseudogene shows marks of
activity based on Segmentation-activity selection criterion #1.
Figure 11: TFBSes in upstream of pseudogene. (A) Distribution of pseudogenes with different numbers
of TFBSes in their upstream sequences. Profiles from transcribed pseudogenes and non-transcribed
pseudogene were compared. Data is from the K562 cell line. (B) Number of pseudogenes with active
promoters, active Pol2 binding sites or both in different cell lines.
Figure 12: Summary of pseudogene annotation and case studies. (A) A heatmap showing the annotation
for transcribed pseudogenes including active chromatin segmentation, DNaseI hypersensitivity, active
promoter, active Pol2, and conserved sequences. Raw data was from the K562 cell line. (B) A transcribed
duplicated pseudogene (ID: ENST00000434500.1, genomics location: chr7: 65216129-65228323)
showing consistent active chromatin accessibility, histone marks, and TFBS in its upstream sequences.
(C) A transcribed processed pseudogene (ID: ENST00000355920.3, genomic location: chr7: 72333321-
72339656) with no active chromatin features or conserved sequences. (D) A non-transcribed duplicated
psudogene showing partial activity patterns (ID: ENST00000429752.2, genomic location chr1:
109646053-109647388). (E) Examples of partially active pseudogenes. E1 and E2 are examples of
duplicated pseudogenes. E1 shows UGT1A2P (ENST00000454886), indicated by the green arrowhead.
UTG1A2P is a non-transcribed pseudogene with active chromatin and it is under negative selection.
Coding exons of protein-coding paralogous loci are represented by dark green boxes and UTR exons are
filled red boxes. E2 shows FAM86EP (ENST00000510506) as open green boxes, which is a transcribed
pseudogene with active chromatin and upstream transcription factor and Pol2 binding sites. The transcript
models associated with the locus are displayed as filled red boxes. Black arrowheads indicate features

41
novel to the pseudogene locus. E3 and E4 show two unitary pseudogenes. E3 shows DOC2GP (ID:
ENST00000514950) as open green boxes, and transcript models associated with the locus are shown as
filled red boxes. E4 shows SLC22A20 (ID: ENST00000530038), again the pseudogene model is
represented as open green boxes, transcript models associated with the locus are filled red boxes, and
black arrowheads indicate features novel to the pseudogene locus. E5 and E6 show two processed
pseudogenes. E5 shows a pseudogene EGLN1 (ID: ENST00000531623) inserted into duplicated
pseudogene SCAND2 (ID: ENST00000541103), which is a transcribed pseudogene showing active
chromatin but no upstream regulatory regions as seen in the parent gene. The pseudogene models are
represented as open green boxes, transcript models associated with the locus are displayed as filled red
boxes, and black arrowheads indicate features novel to the pseudogene locus. E6 shows a processed
pseudogene RP11-409K20 (ID: ENST00000417984), as a filled green box, which has been inserted into a
CpG island, indicated by an orange arrowhead.

42
Tables
Table 1: Pseudogenes used in GENCODE v7.
Level Pseudogenes
Level 1*§ 7,186
Level 2*§ 4,054
Polymorphic§ 24
Level A-P 18,046
Level A-R 13,644
Havana* 11,240
“2-way” consensus* 9,093
Δ-“2-way” consensus 1,907
* - including polymorphic pseudogenes
§ - excluding ENSEMBL annotated pseudogenes

43
Table 2: Pseudogene biotypes.
Biotype Definition
Processed pseudogene pseudogene created via retrotranposition of the mRNA of a
functional protein-coding parent gene followed by accumulation
of disabling mutations
Duplicated pseudogene pseudogene created via genomic duplication of a functional
protein-coding parent gene followed by accumulation of
disabling mutations
Unitary pseudogene pseudogene for which the ortholog in a reference species (mouse)
is coding but the human locus has accumulated fixed disabling
mutations
Polymorphic pseudogene locus known to be coding in some individuals but with disabling
mutations in the reference genome
IG pseudogene Immunoglobulin gene segment with disabling mutations
TR pseudogene T-cell receptor gene segment with disabling mutations
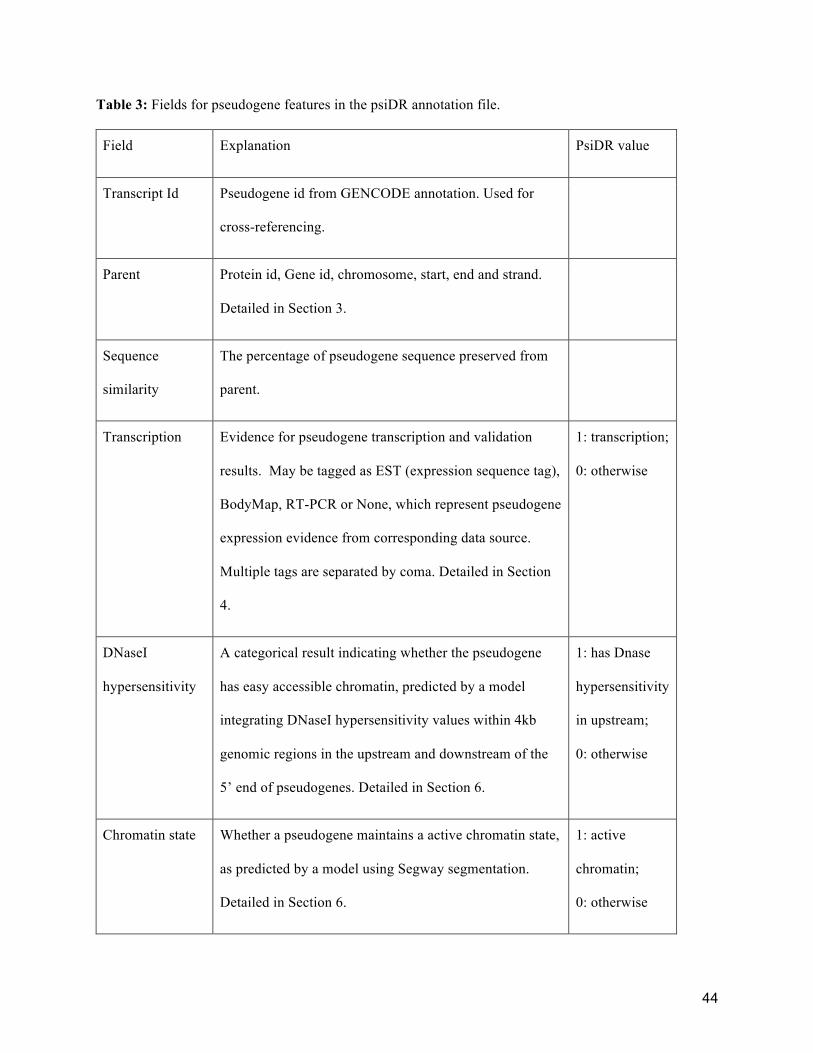
44
Table 3: Fields for pseudogene features in the psiDR annotation file.
Field Explanation PsiDR value
Transcript Id Pseudogene id from GENCODE annotation. Used for
cross-referencing.
Parent Protein id, Gene id, chromosome, start, end and strand.
Detailed in Section 3.
Sequence
similarity
The percentage of pseudogene sequence preserved from
parent.
Transcription Evidence for pseudogene transcription and validation
results. May be tagged as EST (expression sequence tag),
BodyMap, RT-PCR or None, which represent pseudogene
expression evidence from corresponding data source.
Multiple tags are separated by coma. Detailed in Section
4.
1: transcription;
0: otherwise
DNaseI
hypersensitivity
A categorical result indicating whether the pseudogene
has easy accessible chromatin, predicted by a model
integrating DNaseI hypersensitivity values within 4kb
genomic regions in the upstream and downstream of the
5’ end of pseudogenes. Detailed in Section 6.
1: has Dnase
hypersensitivity
in upstream;
0: otherwise
Chromatin state Whether a pseudogene maintains a active chromatin state,
as predicted by a model using Segway segmentation.
Detailed in Section 6.
1: active
chromatin;
0: otherwise

45
Active Pol2
binding
Whether Pol2 binds to the upstream region of a
pseudegene. Detailed in Section 7.
1: active
binding site;
0: otherwise
Active promoter
region
Whether there are active promoter regions in the upstream
of pseudogenes. Detailed in Section 7.
1: active
binding site;
0: otherwise
Conservation Conservation of pseudogenes is derived from the
divergence between human, chimp and mouse DNA
sequences. Detailed in Section 5.
1: conserved;
0: otherwise
Table 4: Similarity between pseudogenes with active promoters (upper right cells) and Pol2 binding sites
(lower left cells).
K562 Gm12878 Helas3 H1hesc Hepg2
K562 - 0.30 0.29 0.22 0.27
Gm12878 0.33 - 0.33 0.27 0.32
Helas3 0.31 0.31 - 0.30 0.39
H1hesc 0.24 0.27 0.29 - 0.27
Hepg2 0.26 0.32 0.33 0.33 -
46
Additional Files
File name: Additional file 1
File format: pdf
Description of data: supplementary tables and figures
File name: Additional file 2
File format: pdf
Title of data: GENCODE: The reference human genome annotation for the ENCODE project
Description of data: GECODE gene paper, which is a ENCODE companion paper that has been submitted
to Genome Research. We claim our current study as a nice complement for this GENCODE gene paper.
47
References
1. Mighell AJ, Smith NR, Robinson PA, Markham AF: Vertebrate pseudogenes. FEBS Lett 2000, 468:109-114. 2. Harrison PM, Echols N, Gerstein MB: Digging for dead genes: an analysis of the characteristics of the pseudogene population in the Caenorhabditis elegans genome. Nucleic Acids Res 2001, 29:818-830. 3. Echols N, Harrison PM, Balasubramanian S, Luscombe NM, Bertone P, Zhang Z, B GM: Comprehensive analysis of amino acid and nucleotide composition in eukaryotic genomes comparing genes and pseudogenes. Nucleic Acids Res 2002, 30:2515-2523. 4. Balakirev E, Ayala F: Pseudogenes: are they "junk" or functional DNA? Annu Rev Genet 2003, 37:123-151. 5. Zhang ZD, Frankish A, Hunt T, Harrow J, Gerstein MB: Identification and analysis of unitary pseudogenes: historic and contemporary gene losses in humans and other primates. Genome Biol 2010, 11:R26. 6. Harrison PM, Gerstein M: Studying genomes through the aeons: protein families pseudogenes and proteome evolution. J Mol Biol 2002, 318:1155-1174. 7. Vinckenbosch N, Dupanloup I, Kaessmann H: Evolutionary fate of retroposed gene copies Evolutionary fate of retroposed gene copies in the human genome. Proc Natl Acad Sci USA 2006, 103:3220-3225. 8. Ding W, Lin L, Chen B, Dai J: L1 elements processed pseudogenes and retrogenes in mammalian genomes. IUBMB Life 2006, 58:677-685. 9. Karro JE, Yan Y, Zheng D, Zhang Z, Carriero N, Cayting P, Harrison PM, Gerstein M: Pseudogene.org: a comprehensive database and comparison platform for pseudogene annotation. Nucleic Acids Res 2007, 35:D55-D60. 10. Ohshima K, Hattori M, Yada T, Gojobori T, Sakaki Y, Okada N: Whole-genome screening indicates a possible burst of formation of processed pseudogenes and Alu repeats by particular L1 subfamilies in ancestral primates. Genome Biol 2003, 4:R74. 11. Torrents D, Suyama M, Zdobnov E, Bork P: A Genome-Wide Survey of Human Pseudogenes. Genome Res 2003, 13:2559-2567. 12. Zhang Z, Gerstein M: Large-scale analysis of pseudogenes in the human genome. Curr Opin Genet Dev 2004, 14:328-335. 13. Balasubramanian S, Zheng D, Liu YJ, Fang G, Frankish A, Carriero N, Robilotto R, Cayting P, Gerstein M: Comparative analysis of processed ribosomal protein pseudogenes in four mammalian genomes. Genome Biol 2009, 10:R2. 14. Harrison PM, Zheng D, Zhang Z, Carriero N, Gerstein M: Transcribed processed pseudogenes in the human genome: an intermediate form of expressed retrosequence lacking protein-coding ability. Nucleic Acids Res 2005, 33:2374-2383. 15. Zheng D, Frankish A, Baertsch R, Kapranov P, Reymond A, Woh Choo S, Y L, Denoeud F, Antonarakis SE, Snyder M, Ruan Y, Wei C.L, Gingeras TR, Guigó R, Harrow J,

48
Gerstein MB: Pseudogenes in the ENCODE regions: consensus annotation analysis of transcription and evolution. Genome Res 2007, 17:839-851. 16. Firth MC, Wilming LG, Forrest A, Kawaji H, Tan SL, Washlestedt C, Bajic VB, Kai C, Kawai J, Carninci P, Hayashizaki Y, Bailey TL, Huminiecki L: Pseudo-messenger RNA: phantoms of the transcriptome. PLoS Genet 2006, 2:e23. 17. Enrique MM, Nancy M, Miguel AA: Functional evidence of post-transcriptional regulation by pseudogenes. Biochimie 2011, 93:1916-1921. 18. Poliseno L, Salmena L, Zhang J, Carver B, Haveman WJ, Pandolfi PP: A coding-independent function of gene and pseudogene mRNAs regulates tumour biology. Nature 2010, 465:1033-1038. 19. Tam OH, Aravin AA, Stein P, Girard A, Murchison EP, Cheloufi S, Hodges E, Anger M, Sachidanandam R, Schultz RM, Hannon GJ: Pseudogene-derived small interfering RNAs regulate gene expression in mouse oocytes. Nature 2008, 453:534-538. 20. Piehler AP, Hellum M, Wenzel JJ, Kaminski E, Haug KB, Kierulf P, Kaminski WE: The human ABC transporter pseudogene family: Evidence for transcription and gene-pseudogene interference. BMC Genomics 2008, 9:165. 21. Han YJ, Ma SF, Yourek G, Park YD, Garcia JG: A transcribed pseudogene of MYLK promotes cell proliferation. FASEB J 2011, 25:2305-2312. 22. Watanabe T, Totoki Y, Toyoda A, Kanedo M, Kuramochi-Miyagawa S, Obata Y, Chiba H, Kohara Y, Kono T, Nakano T, Surani MA, Sakaki Y, Sasaki H: Endogenous siRNAs from naturally formed dsRNAs regulate transcripts in mouse oocytes. Nature 2008, 453:539-543. 23. Sasidharan R, Gerstein M: Genomics: Protein fossils live on as RNA. Nature 2008, 453:729-731. 24. Guo X, Zhang Z, Gerstein MB, Zheng D: Small RNAs originated from pseudogenes: cis- or trans- acting?. PLoS Comput Biol 2009, 5:e1000449. 25. Hawkins PG, Morris KV: Transcriptional regulation of Oct4 by a long non-coding RNA antisense to Oct4-pseudogene 5. Transcription 2010, 1:165-175. 26. Salmena L, Carracedo A, Pandolfi PP: Tenets of PTEN Tumor Suppresion. Cell 2008, 133:403-414. 27. Harrow J, Denoeud F, Frankish A, Reymond A, Chen CK, Chrast J, Lagarde J, Gilbert JG, Storey R, Swarbreck D, et al: GENCODE: Producing a reference annotation for ENCODE. Genome Biol 2006, 7:S4.1-S4.9.. 28. Harrow J, Frankish A, Gonzalez JM, Tapanari E, Diekhans M, Kokocinski F, Aken B, Barrell D, Zadissa A, Searle S, Barnes I, Bignell A, Boychenko V, Hunt T, Kay M, Mukherjee G, Rajan J, Despacio-Reyes G, Saunders G, Steward C, Harte R, Lin M, Howald C, Tanzer A, Derrien T, Chrast J, Walters N, Balasubramanian S, Pei B, Tress M, Rodriguez JM, Ezkurdia I, van Baren J, Brent M, Haussler D, Kellis M, Valencia A, Reymond A, Gerstein M, Guigo R, Hubbard TJ: GENCODE: The reference human genome annotation for the ENCODE project. Genome Res 2012, GRCP0001.

49
29. Cochrane G, Karsch-Mizarchi I, Nakamura Y, International Nucleotide Sequence Database Collaboration: The International Nucleotide Sequence Database Collaboration. Nucleic Acids Res 2011, 39:D15-D18. 30. Zhu J, Sanborn JZ, Diekhans M, Lowe CB, Pringle TH, Haussler D: Comparative genomics search for losses of long-established genes on the human lineage. PLoS Comput Biol 2007, 3:e247. 31. Duret L, Chureau C, Samain S, Weissenbach J, Avner P: The Xist RNA gene evolved in eutherians by pseudogenization of a protein-coding gene. Science 2006, 312:1653-1655. 32. Kaessmann H, Vinckenbosch N, Long M: RNA-based gene duplication: mechanistic and evolutionary insights. Nat Rev Genet 2010, 10:19-31. 33. www.pseudogenes.org/psidr. Last accessed on June 9th 2012. 34. www.gencodegenes.org/psidr. Last accessed on June 9th 2012. 35. Zhang Z, Carriero N, Zheng D, Karro J, Harrison PM, Gerstein MB: PseudoPipe: an automated pseudogene identification pipeline. Bioinformatics 2006, 22:1437-1439. 36. Baertsch R, Diekans M, Kent WJ, D H, Brosius J: Retrocopy contributions to the evolution of the human genome. BMC Genomics 2008, 9:466. 37. Zhang Z, Carriero N, Gerstein M: Comparative analysis of processed pseudogenes in the mouse and human genomes. Trends Genet 2004, 20:62-67. 38. Clamp M, Fry B, Kamal M, Xie X, Cuff J, Lin MF, Kellis M, Lindblad-Toh K, Lander ES: Distinguishing protein-coding and noncoding genes in the human genome. Proc Natl Acad Sci USA 2007, 104:19428-19433. 39. Zhang Z, Harrison P, Gerstein M: Identification and analysis of over 2000 ribosomal protein pseudogenes in the human genome. Genome Res 2002, 12:1466-1482. 40. Liu YJ, Zheng D, Balasubramanian S, Carriero N, Khurana E, Robilotto R, Gerstein MB: Comprehensive analysis of the pseudogenes of glycolytic enzymes in vertebrates: the anomalously high number of GAPDH pseudogenes highlights a recent burst of retrotrans-positional activity. BMC Genomics 2009, 10:480. 41. Zhang Z, Carriero N, Gerstein MB: Comparative analysis of processed pseudogenes in the mouse and human genomes. Trends Genet 2004, 20:62-67. 42. Kim PM, Lam HY, Urban AE, Korbel JO, Affourtit J, Grubert F, Chen X, Weissman S, Snyder M, Gerstein MB: Analysis of copy number variants and segmental duplications in the human genome: Evidence for a change in the process of formation in recent evolutionary history. Genome Res 2008, 18:1865-1874. 43. Howald C, Tanzer A, Chrast J, Kokocinski F, Derrien T, Walters N, Gonzalez JM, Frankish A, Aken BL, Hourlier T, Vogel JH, White S, Searle MJ, Harrow J, Hubbard T, Guigo R, Reymond A: Experimental validation of the GENCODE annotation reveals that RNAseq transcriptome profiling pinpoints a large number of new linc genes but commonly misses rare transcripts. Genome Res 2012, GRCP046. 44. Washietl S, Pedersen JS, Korbel JO, Stocsits C, Gruber AR, Hackermüller J, Hertel J, Lindemeyer M, Reiche K, Tanzer A, Ucla C, Wyss C, Antonarakis SE, Denoeud F, Lagarde
50
J, Drenkow J, Kapranov P, Gingeras TR, Guigó R, Snyder M, Gerstein MB, Reymond A, Hofacker IL, Stadler PF: Structured RNAs in the ENCODE selected regions of the human genome. Genome Res 2007, 17:852-864. 45. Denoeud F, Kapranov P, Ucla C, Frankish A, Castelo R, Drenkow J, Lagarde J, Alioto T, Manzano C, Chrast J, Dike S, Wyss C, Henrichsen CN, Holroyd N, Dickson MC, Taylor R, Hance Z, Foissac S, Myers RM, Rogers J, Hubbard T, Harrow J, Guigó R, Gingeras TR, Antonarakis SE, Reymond A: Prominent use of distal 5′ transcription start sites and discovery of a large number of additional exons in ENCODE regions. Genome Res 2007, 17:746-759. 46. Svensson Ö, Arvestad L, Lagergren J: Genome-Wide Survey for Biologically Functional Pseudogenes. PLoS Comput Biol 2006, 2:e46. 47. The 1000 Genomes Project Consortium: A map of human genome variation from population-scale sequencing. Nature 2010, 467:1061-1073. 48. Hoffman M, Ernst J, Wilder S, Harris B, Dunham I, Hardison R, Birney E, Kellis M, Stafford Noble W: Unsupervised segmentation of ENCODE chromatin data. Genome Res 2012, GRCP011. 49. Yip KY, Cheng C, Bhardwaj N, Brown JB, Leng J, Kundaje A, Rozowsky J, Birney E, Bickel PJ, Snyder M, Gerstein MB: Genome-wide analysis of the binding sites of more than 100 transcription-related factors defines different types of genomic regions with distinct biological properties. Genome Res 2012, GRPC033. 50. Zheng D, Gerstein MB: The ambiguous boundary between genes and pseudogenes: the dead rise up or do they?. Trends Genet 2007, 23:219-224. 51. Altschul SF, Madden TL, Schäffer AA, Zhang J, Zhang Z, Miller W, Lipman DJ: Gapped BLAST and PSI-BLAST: a new generation of protein database search programs. Nucleic Acids Res 1997, 25:3389-3402. 52. Searle SM, Gilbert J, Iyer V, Clamp M: The otter annotation system. Genome Res 2004, 14:963-970. 53. Sonnhammer ELL, Durbin R: A workbench for large scale sequence homology analysis. Comput Appl Biosci 1994, 10:301-307. 54. Harris R: Improved pairwise alignment of genomic DNA. PhD Thesis 2007, Pennsylvania State University. 55. Schwartz S, Kent WJ, Smit A, Zhang Z, Baertsch R, Hardison RC, Hausler D, Miller W: Human-mouse alignments with BLASTZ. Genome Res 2003, 13:103 - 107. 56. Kent WJ: BLAT-the BLAST-like alignment tool. Genome Res 2002, 12:656-664. 57. Kent WJ, Baertsch R, Hinrichs A, Miller W, Hausler D: Evolution's cauldron: Duplication deletion and rearrangement in the mouse and human genomes. Proc Natl Acad Sci USA 2003, 100:11484-11489. 58. Fujita PA, Rhead B, Zweig AS, Hinrichs AS, Karolchik D, Cline MS, Goldman M, Barber GP, Clawson H, Coelho A, Diekhans M, Dreszer TR, Giardine BM, Harte RA, Hillman-Jackson J, Hsu F, Kirkup V, Kuhn RM, Learned K, Li CH, Meyer LR, Pohl A,
51
Raney BJ, Rosenbloom KR, Smith KE, Haussler D, Kent WJ: The UCSC Genome Browser database: update 2011. Nucleic Acids Res 2010, Database Issue:1-7. 59. Wilming LG, Gilbert JG, Howe K, Trevanion S, Hubbard T, Harrow JL: The vertebrate genome annotation (Vega) database. Nucleic Acids Res 2008, 36:D753-D760. 60. Langmead B, Trapnell C, Pop M, Salzberg SL: Ultrafast and memory-efficient alignment of short DNA sequences to the human genome. Genome Biol 2009, 10:R25. 61. Habegger L, Sboner A, Gianoulis TA, Rozowsky J, Agarwal A, Snyder M, Gerstein MB: RSEQtools: a modular framework to analyze RNA-Seq data using compact anonymized data summaries. Bioinformatics 2011, 27:281-283. 62. Benjamini Y, Hochberg Y: Controlling the false discovery rate: a practical and powerful approach to multiple testing. J Roy Stat Soc B 1995, 57:289-300. 63. Heintzman ND, Stuart RK, G, H, Fu Y, Ching CW, Hawkins RD, Barrera LO, Van Calcar S, Qu C, Ching KA, Wang W, Weng Z, Green RD, Crawford GE, Ren B: Distinct and predictive chromatin signatures of transcriptional promoters and enhancers in the human genome. Nat Genet 2007, 39:311-318. 64. Barski A, Cuddapah S, Cui K, Roh TY, Schones DE, Wang Z, Wei G, Chepelev I, Zhao K: High-resolution profiling of histone methylations in the human genome. Cell 2007, 129:823-837.
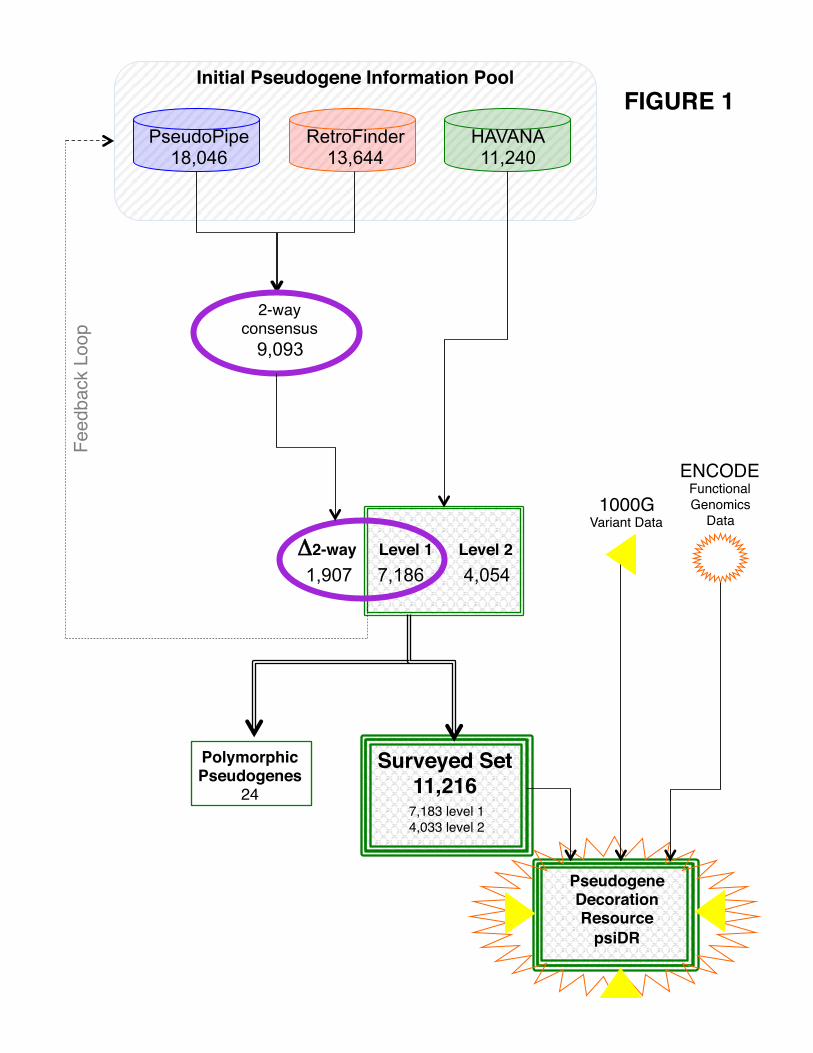
!!!!!!!!"!!!!!!!!"
!!!!!!!!"!!!!!!!!"
Initial Pseudogene Information Pool!
!!!!!!!!"Level 1! Level 2!
Fe
edback L
oop!
2-way consensus!
1000G!Variant Data!
ENCODE!Functional !
Genomics !
Data"
PseudoPipe 18,046
9,093
7,186 4,054 1,907
Polymorphic!Pseudogenes"
24!
Surveyed Set!11,216!
!
7,183 level 1!
4,033 level 2!
!
Pseudogene Decoration!Resource!
psiDR!
!2-way!
RetroFinder 13,644
HAVANA 11,240
FIGURE 1!
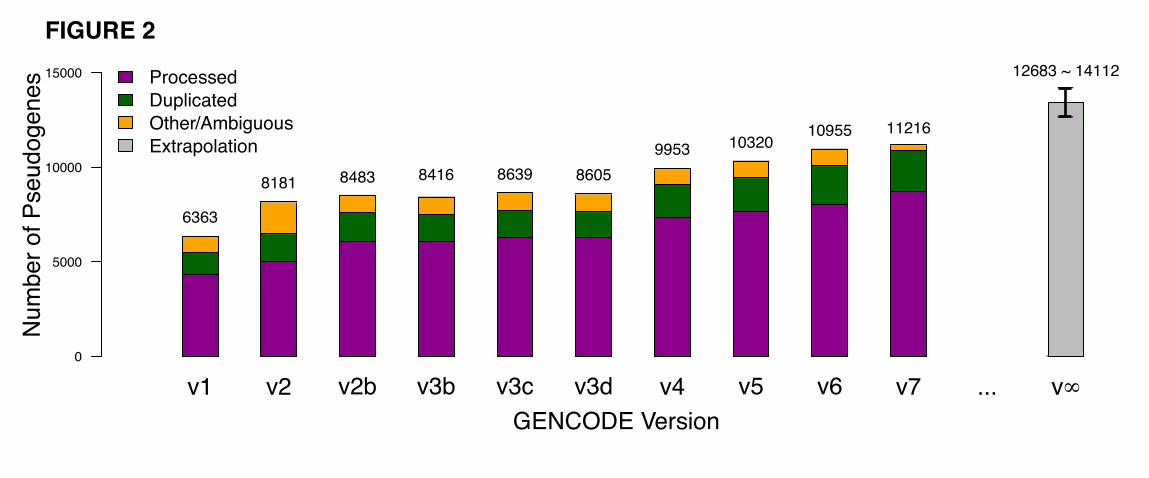
v1 v2 v2b v3b v3c v3d v4 v5 v6 v7 ... v!
GENCODE Version
Num
ber
of P
seudogenes
0
5000
10000
15000 Processed
Duplicated
Other/Ambiguous
Extrapolation
6363
8181 8483 8416 8639 8605
9953 1032010955 11216
12683 ~ 14112
FIGURE 2

A B C D E
Pseudogene intersects one transcript Pseudogene intersects multiple transcripts
HM
GB
1P
MT
MR
12P
PD
ZK
1P
1
RP
LP
0P
1
FA
M86A
P
Indicates pseudogene locus
Pseudogene model
Processed transcript model
Protein-coding model
FIGURE 3A-3E
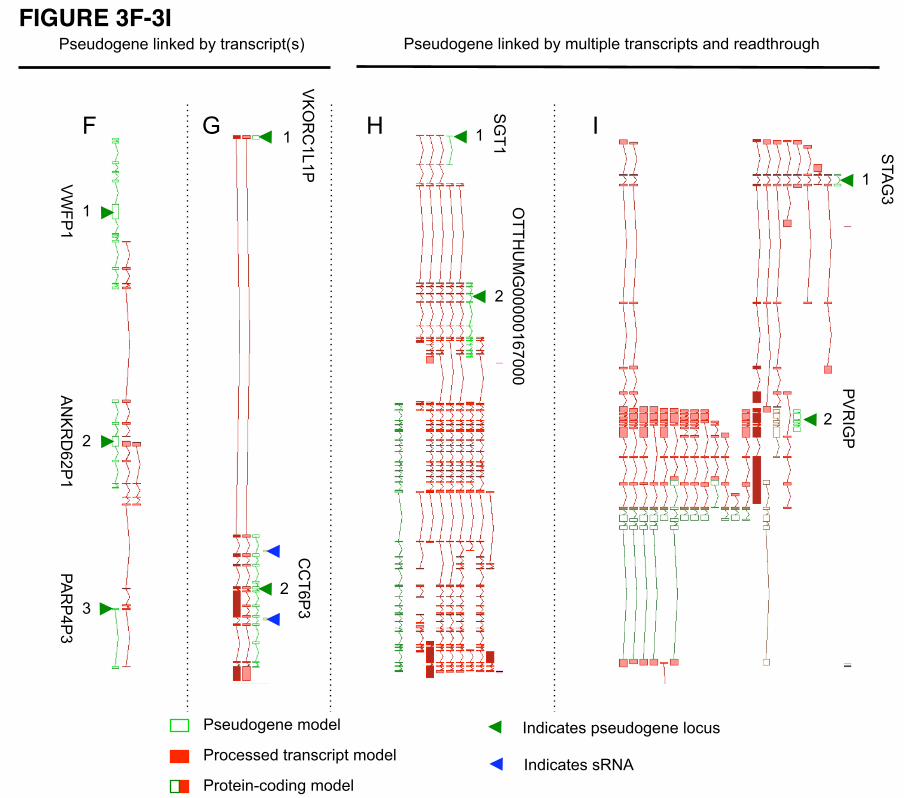
!" #" $" %"
&"
'"
("
&"
'"
'"
&"
'"
&"
)*+,-./+0+"1203+-"45"6780*972:6;*<" )*+,-./+0+"1203+-"45"=,162:1+"6780*972:6*"80-"7+8-6>7.,/>"
?@!)&""
ABCDEF')&""
)AD)G)(""
?CHDI&J&)"
IIKF)(""
L#K&""
HKK$MN#OOOOO&FPOOO""
LKA#(""
)?D%#)"
)*+,-./+0+"=.-+1"
)7.9+**+-"6780*972:6"=.-+1"
)7.6+20Q9.-20/"=.-+1"
%0-2986+*":*+,-./+0+"1.9,*"
%0-2986+*"*DBA"
FIGURE 3F-3I
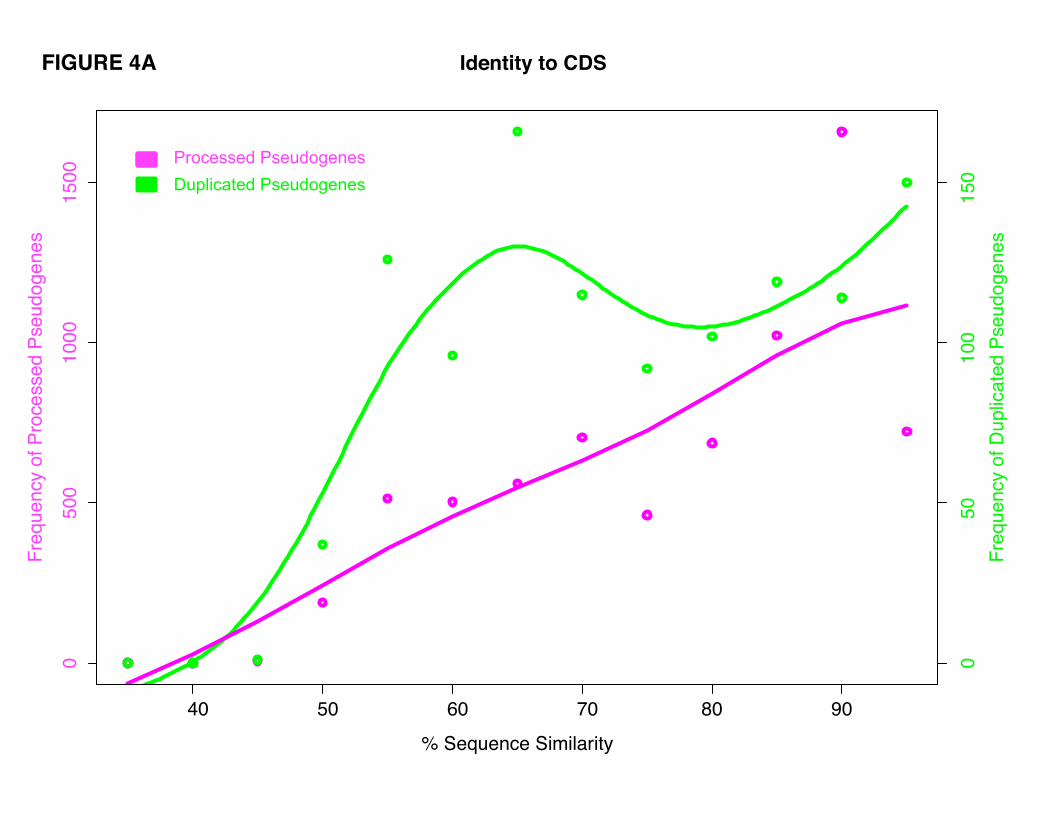
40 50 60 70 80 90
05
00
10
00
15
00
% Sequence Similarity
Fre
qu
en
cy o
f P
roce
sse
d P
se
ud
og
en
es
!"#$%&&%'(!&%)'#*%+%&
,)-./$01%'(!&%)'#*%+%&
05
01
00
15
0
Fre
qu
en
cy o
f D
up
lica
ted
Pse
ud
og
en
es
FIGURE 4A Identity to CDS
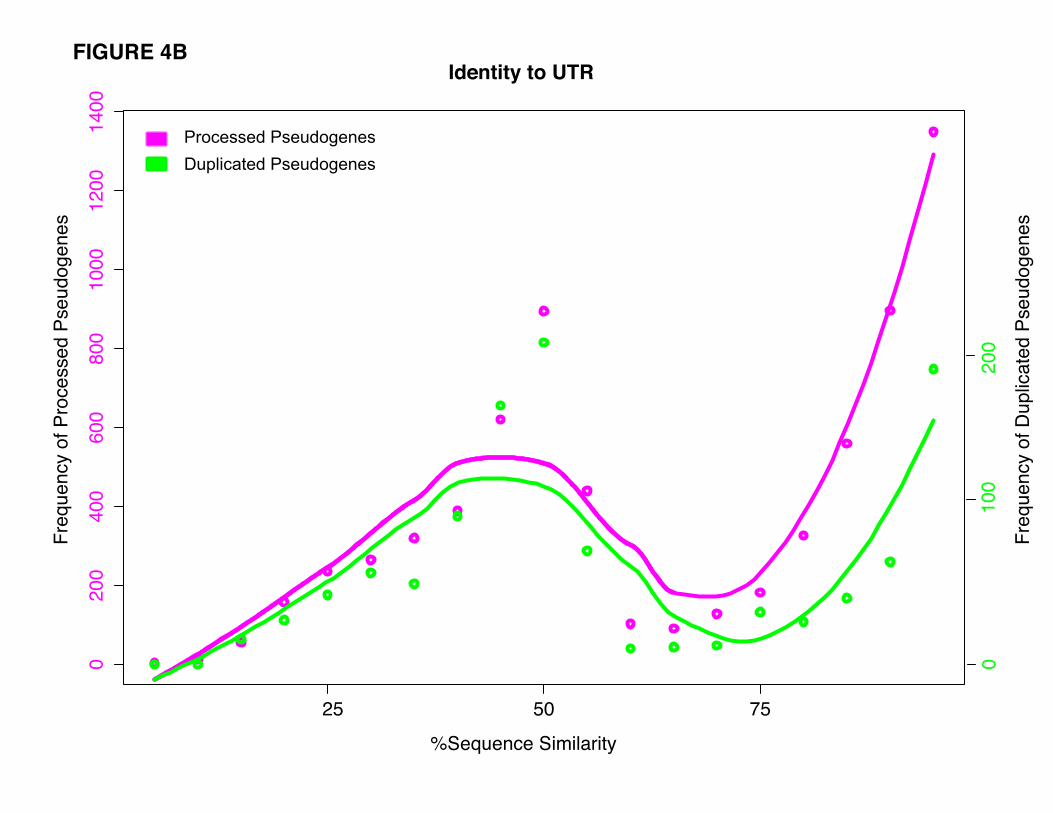
25 50 75
02
00
40
06
00
80
01
00
01
20
01
40
0
%Sequence Similarity
Fre
qu
en
cy o
f P
roce
sse
d P
se
ud
og
en
es
Fre
qu
en
cy o
f D
up
lica
ted
Pse
ud
og
en
es
!"#$%&&%'(!&%)'#*%+%&
,)-./$01%'(!&%)'#*%+%&
Identity to UTRFIGURE 4B
01
00
20
0
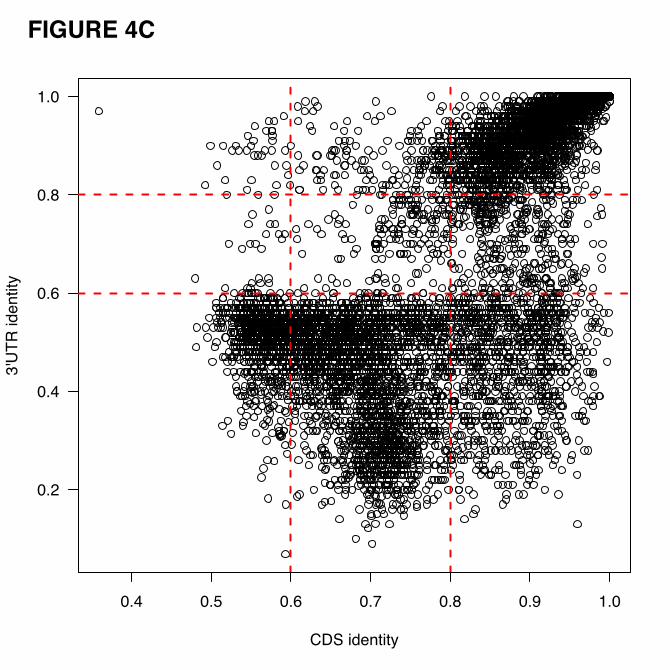
0.4 0.5 0.6 0.7 0.8 0.9 1.0
0.2
0.4
0.6
0.8
1.0
CDS identity
3'U
TR
identity
FIGURE 4C

PseudoSeq!Pipeline!
EST/mRNA evidence?!
Pgene!Expr.?!
Pgene!>> parent?!
Pgene not similar to parent?!
Yes!
Yes!
No!
Yes!
Discordant!Pattern?!
Yes!
EST or mRNA data!
ENCODE total RNA data!
Human BodyMap data!
Yes!
Transcribed Pseudogene Pool!
!"#
$$$$$$$$#$$$$$$$$#“Surveyed”!
Pseudogenes!Set!
##%&'()*+','&#-'.'/0')#1*2#34.5)46*,#
FIGURE 5A!
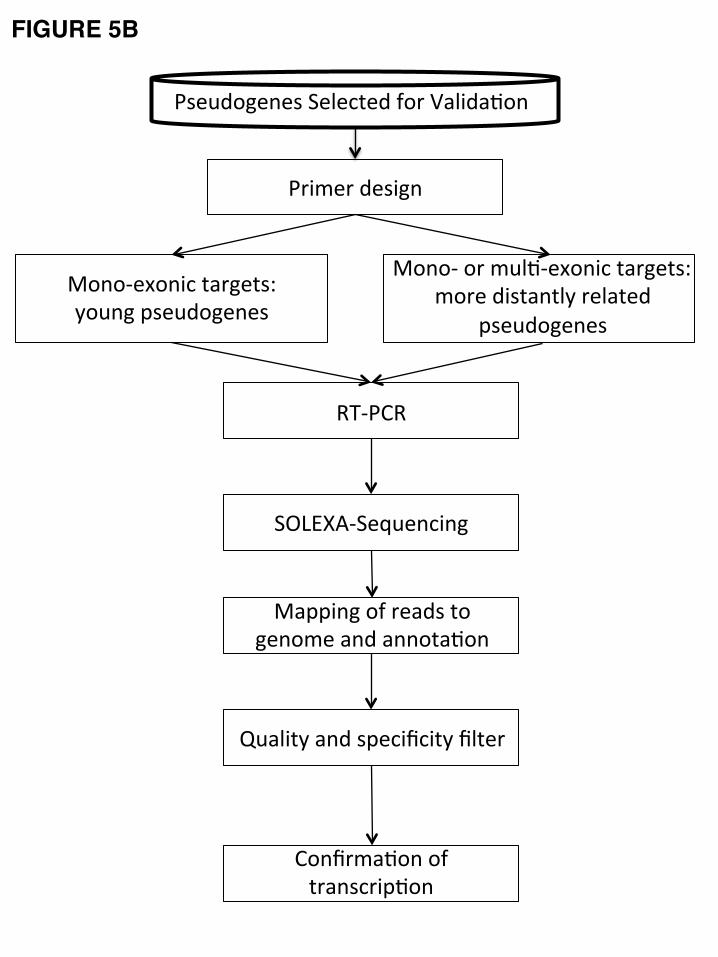
!!
!!!!!!!!!!!!!
"#$%&'($)$#!*$+$,-$&!.'/!01+2&13')!
"/24$/!&$#2()!
5')'6$7')2,!-1/($-#8!
9'%)(!:#$%&'($)$#!
5')'6!'/!4%+36$7')2,!-1/($-#8!
4'/$!&2#-1)-+9!/$+1-$&!
:#$%&'($)$#!
;<6"=;!
*>?@AB6*$C%$),2)(!
51::2)(!'.!/$1&#!-'!
($)'4$!1)&!1))'-13')!
D%1+2-9!1)&!#:$,2E,2-9!E+-$/!
=')E/413')!'.!
-/1)#,/2:3')!
FIGURE 5B!
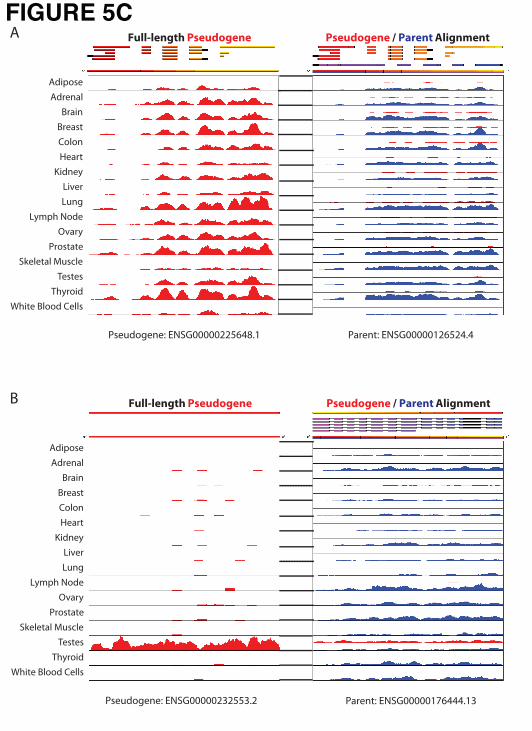
AdiposeAdrenal
BrainBreastColonHeart
KidneyLiverLung
Lymph NodeOvary
ProstateSkeletal Muscle
TestesThyroid
White Blood Cells
Full-length Pseudogene Pseudogene / Parent Alignment
Pseudogene: ENSG00000232553.2
AdiposeAdrenal
BrainBreastColonHeart
KidneyLiverLung
Lymph NodeOvary
ProstateSkeletal Muscle
TestesThyroid
White Blood Cells
Full-length Pseudogene Pseudogene / Parent Alignment
Pseudogene: ENSG00000225648.1
A
B
Parent: ENSG00000126524.4
Parent: ENSG00000176444.13
FIGURE 5C
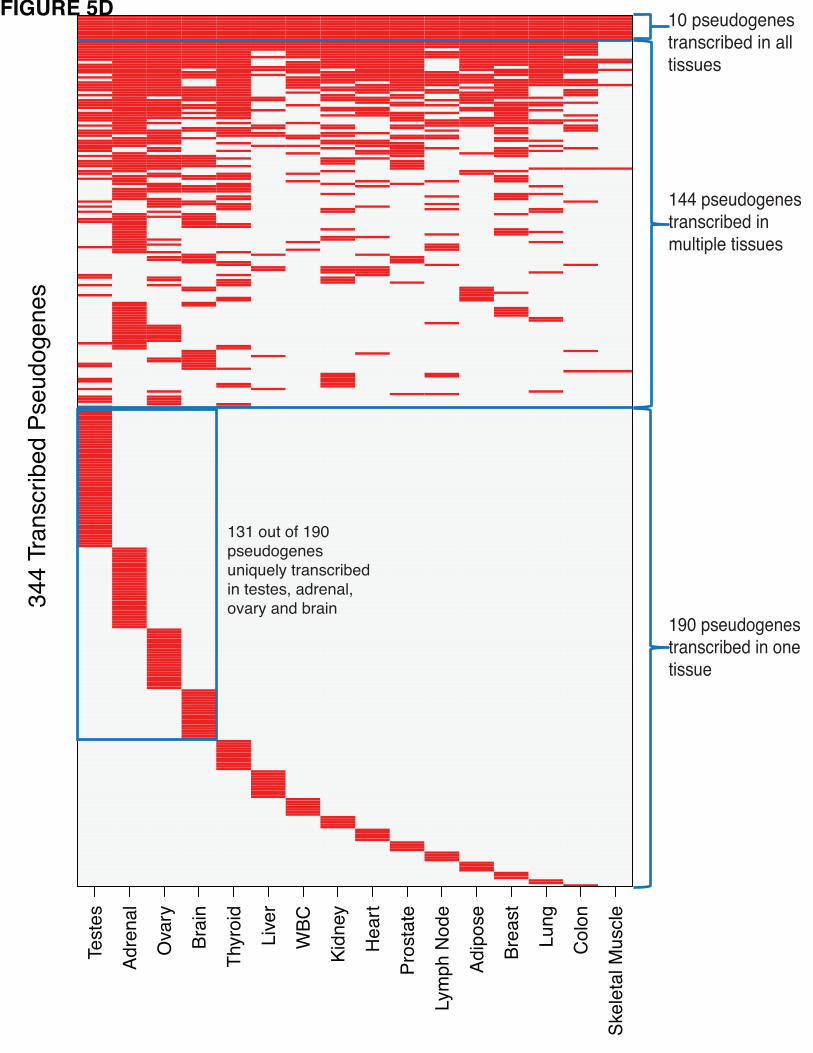
344 T
ranscri
bed P
seud
ogenes
Teste
s
Adre
nal
Ova
ry
Bra
in
Thyro
id
Liv
er
WB
C
Kid
ney
Hea
rt
Pro
sta
te
Lym
ph N
ode
Adip
ose
Bre
ast
Lung
Colo
n
Ske
leta
l M
uscle
10 pseudogenes
transcribed in all
tissues
144 pseudogenes
transcribed in
multiple tissues
190 pseudogenes
transcribed in one
tissue
131 out of 190
pseudogenes
uniquely transcribed
in testes, adrenal,
ovary and brain
FIGURE 5D
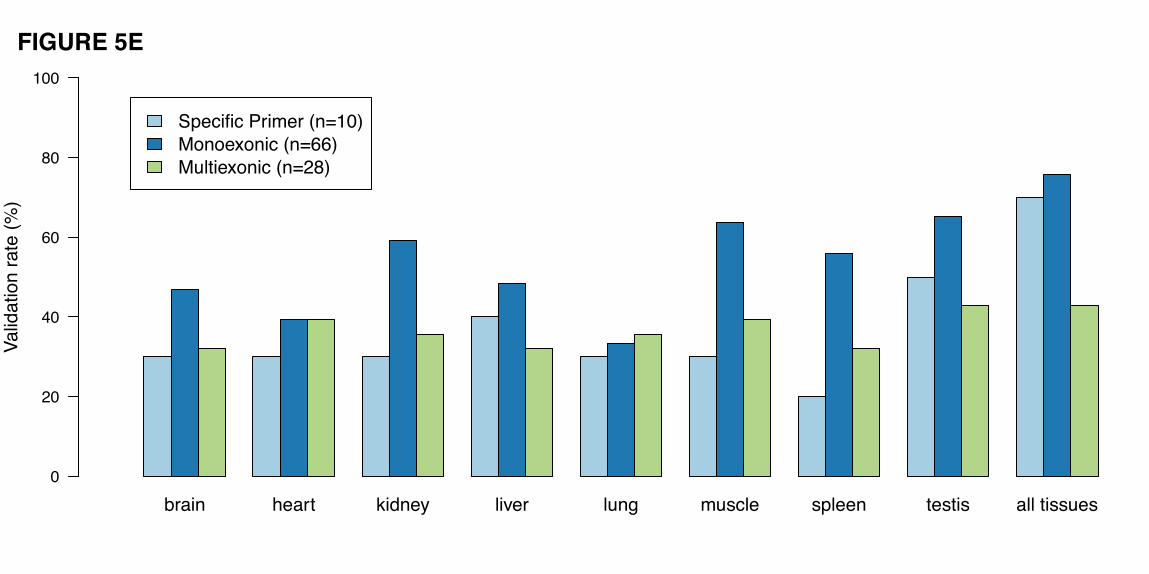
brain heart kidney liver lung muscle spleen testis all tissues
Valid
ation r
ate
(%
)
0
20
40
60
80
100
Specific Primer (n=10)
Monoexonic (n=66)
Multiexonic (n=28)
FIGURE 5E
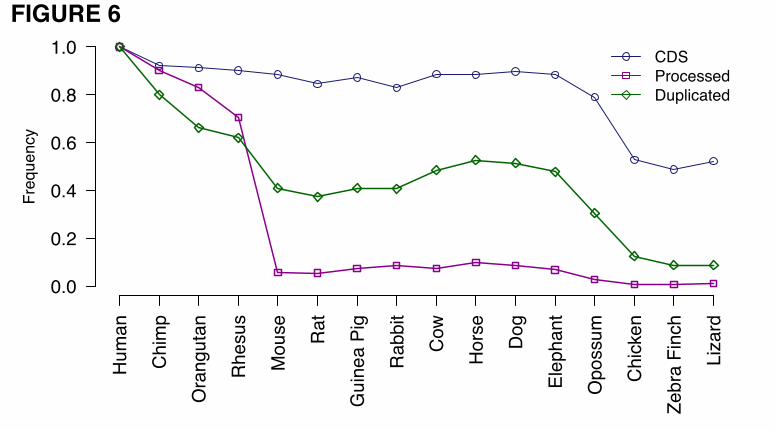
Hu
man
Ch
imp
Ora
ng
uta
n
Rh
esus
Mo
use
Rat
Guin
ea
Pig
Rabbit
Cow
Hors
e
Dog
Ele
ph
ant
Op
ossum
Ch
icken
Ze
bra
Fin
ch
Liz
ard
0.0
0.2
0.4
0.6
0.8
1.0F
requency
CDS
Processed
Duplicated
FIGURE 6
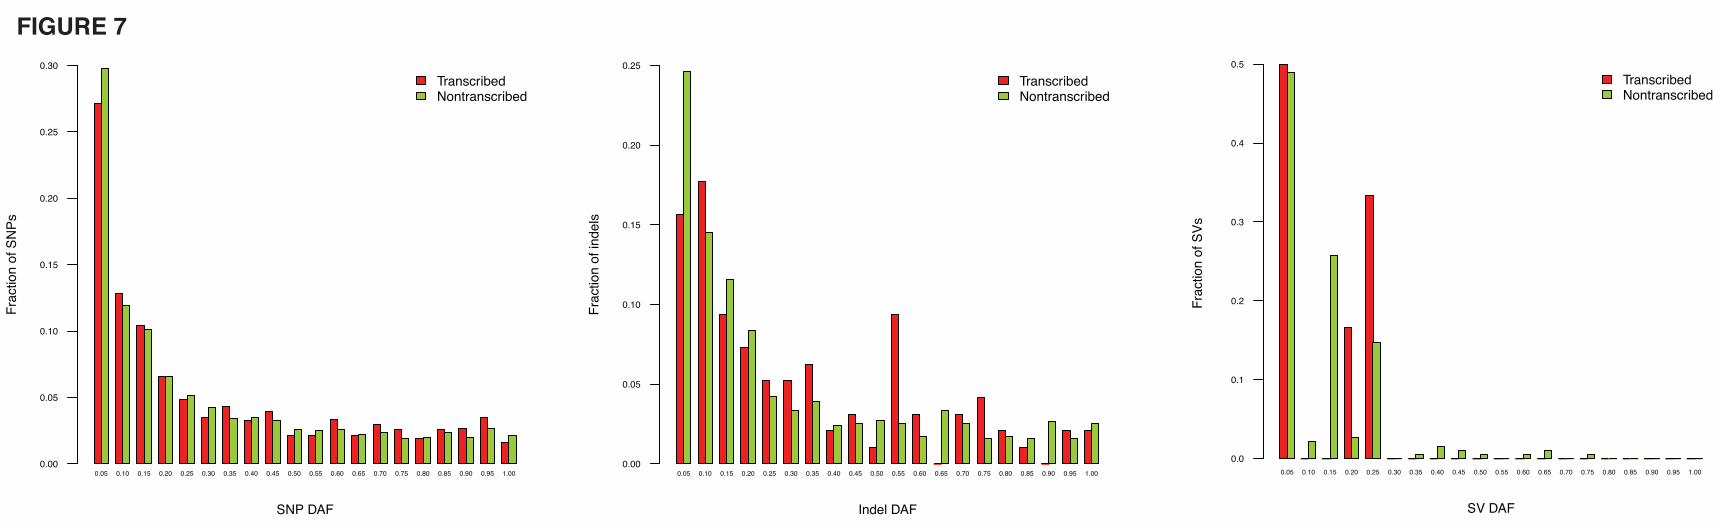
0.05 0.10 0.15 0.20 0.25 0.30 0.35 0.40 0.45 0.50 0.55 0.60 0.65 0.70 0.75 0.80 0.85 0.90 0.95 1.00
SNP DAF
Frac
tion
of S
NPs
0.00
0.05
0.10
0.15
0.20
0.25
0.30
TranscribedNontranscribed
0.05 0.10 0.15 0.20 0.25 0.30 0.35 0.40 0.45 0.50 0.55 0.60 0.65 0.70 0.75 0.80 0.85 0.90 0.95 1.00
Indel DAF
Frac
tion
of in
dels
0.00
0.05
0.10
0.15
0.20
0.25
TranscribedNontranscribed
0.05 0.10 0.15 0.20 0.25 0.30 0.35 0.40 0.45 0.50 0.55 0.60 0.65 0.70 0.75 0.80 0.85 0.90 0.95 1.00
SV DAF
Frac
tion
of S
Vs
0.0
0.1
0.2
0.3
0.4
0.5
TranscribedNontranscribed
FIGURE 7
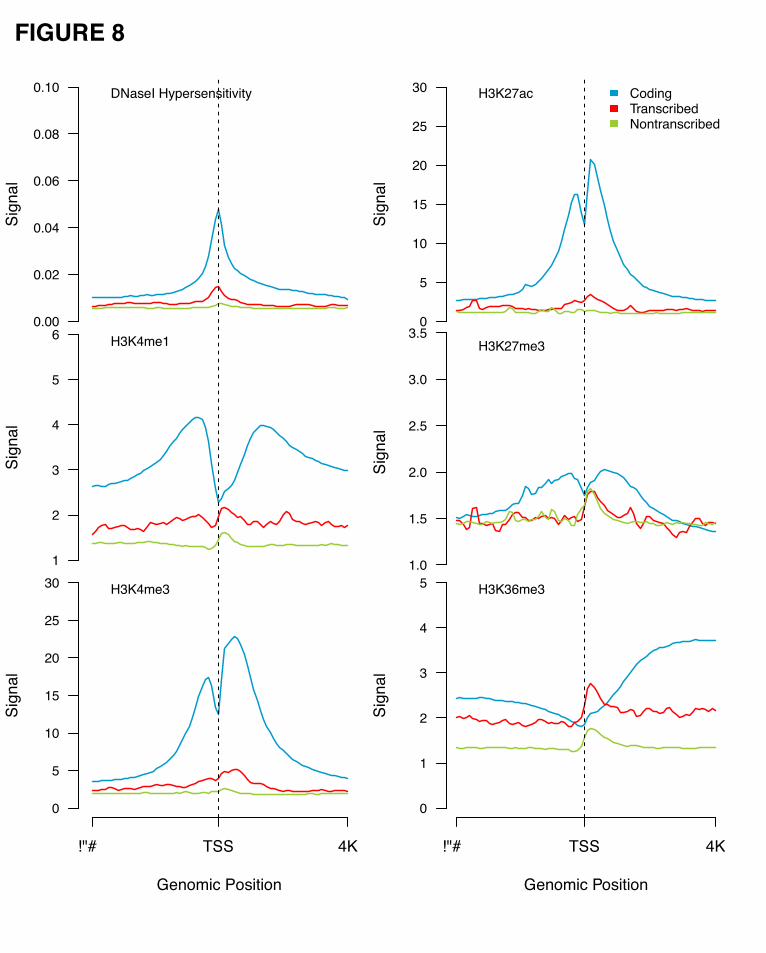
0.00
0.02
0.04
0.06
0.08
0.10
Sig
nal
DNaseI Hypersensitivity
1
2
3
4
5
6
Sig
nal
H3K4me1
!"# TSS 4K
0
5
10
15
20
25
30
Genomic Position
Sig
nal
H3K4me3
0
5
10
15
20
25
30
Sig
nal
H3K27ac CodingTranscribedNontranscribed
1.0
1.5
2.0
2.5
3.0
3.5
Sig
nal
H3K27me3
!"# TSS 4K
0
1
2
3
4
5
Genomic Position
Sig
nal
H3K36me3
FIGURE 8
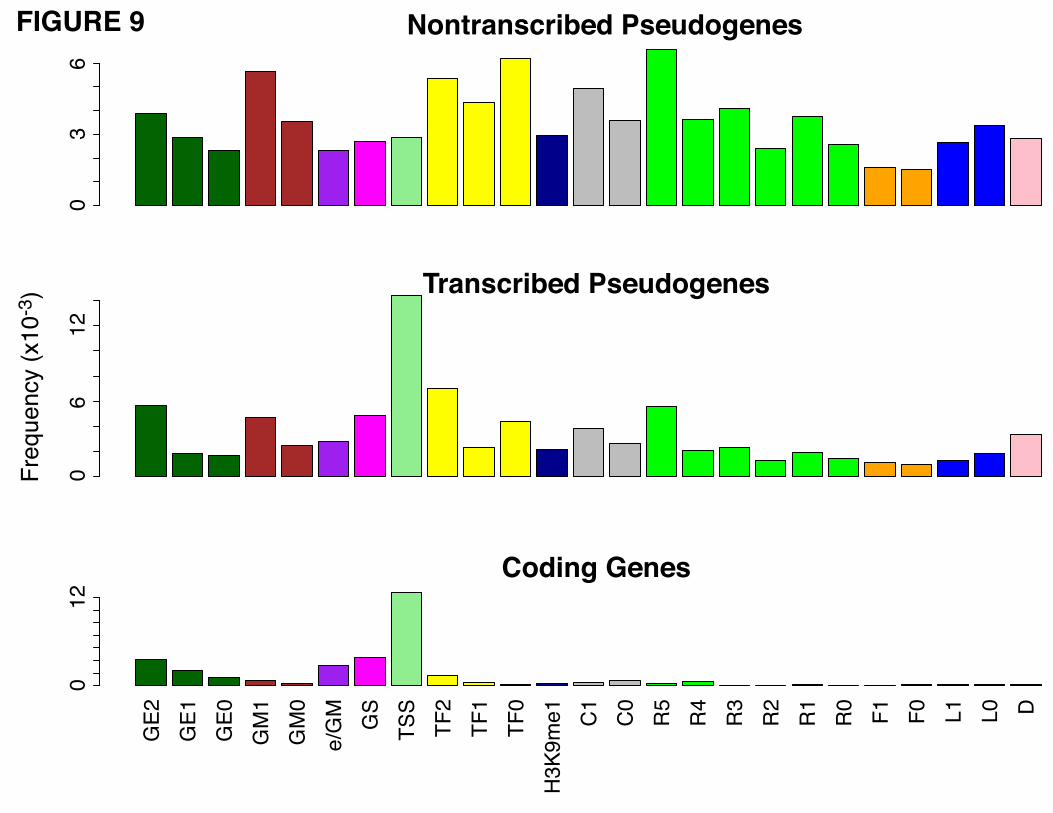
Nontranscribed Pseudogenes
03
6
Transcribed Pseudogenes
06
GE
2
GE
1
GE
0
GM
1
GM
0
e/G
M
GS
TS
S
TF
2
TF
1
TF
0
H3
K9m
e1
C1
C0
R5
R4
R3
R2
R1
R0
F1
F0
L1
L0 D
Coding Genes
012
Fre
quency (
x10
-3)
12
FIGURE 9
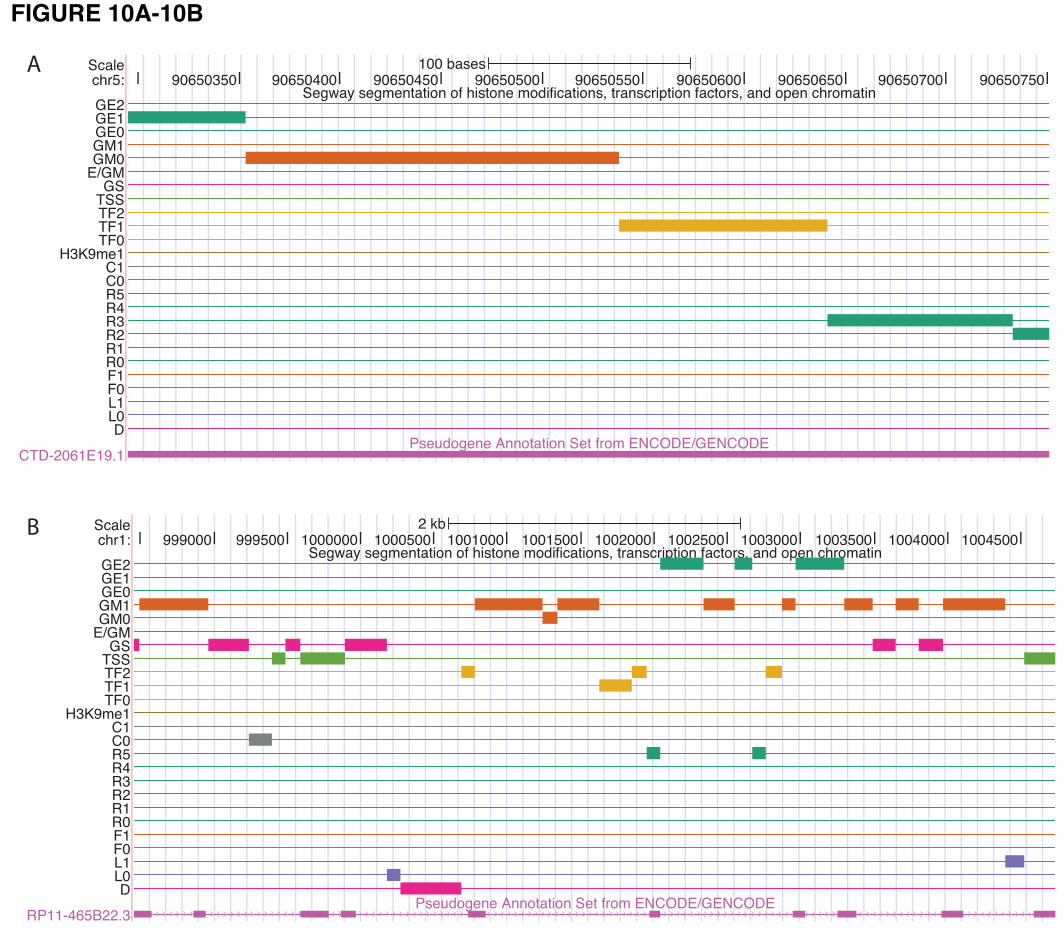
Scalechr5:
GE2GE1GE0GM1GM0
E/GMGS
TSSTF2TF1TF0
H3K9me1C1C0R5R4R3R2R1R0F1F0L1L0D
CTD-2061E19.1
100 bases90650350 90650400 90650450 90650500 90650550 90650600 90650650 90650700 90650750
Segway segmentation of histone modifications, transcription factors, and open chromatin
Pseudogene Annotation Set from ENCODE/GENCODE
Scalechr1:
GE2GE1GE0GM1GM0
E/GMGS
TSSTF2TF1TF0
H3K9me1C1C0R5R4R3R2R1R0F1F0L1L0D
RP11-465B22.3
2 kb999000 999500 1000000 1000500 1001000 1001500 1002000 1002500 1003000 1003500 1004000 1004500
Segway segmentation of histone modifications, transcription factors, and open chromatin
Pseudogene Annotation Set from ENCODE/GENCODE
FIGURE 10A-10B
A
B
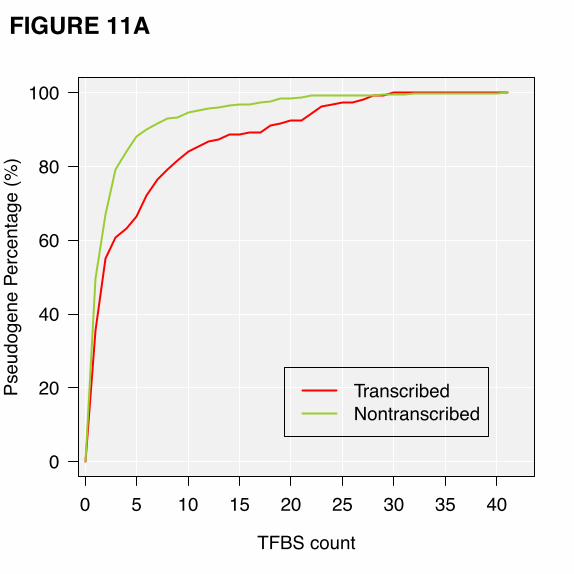
0 5 10 15 20 25 30 35 40
0
20
40
60
80
100
TFBS count
Pseudogene P
erc
enta
ge (
%)
Transcribed
Nontranscribed
FIGURE 11A
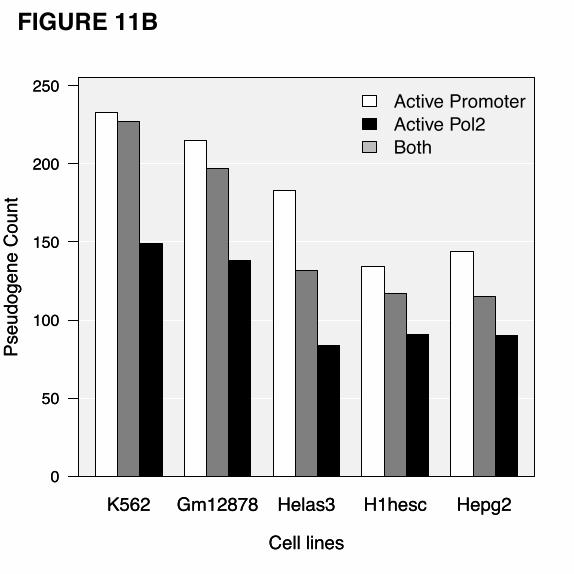
K562 Gm12878 Helas3 H1hesc Hepg2
Cell lines
Pseudogene C
ount
0
50
100
150
200
250
K562 Gm12878 Helas3 H1hesc Hepg2
Cell lines
Pseudogene C
ount
0
50
100
150
200
250Active Promoter
Active Pol2
Both
FIGURE 11B

Total Pseudogenes (11,216)
876 10,340
234 643 1,118 9,222
Transcribed?
Yes No
Additional
Activity?
Yes No
53 181 142 501 129 1,038 695 8,527Constrained?
Yes No
Active
Ch
rom
atin
DN
ase
I.
Hyp
ers
en
sitity
Pro
mo
ter
Po
l2
FIGURE 12A
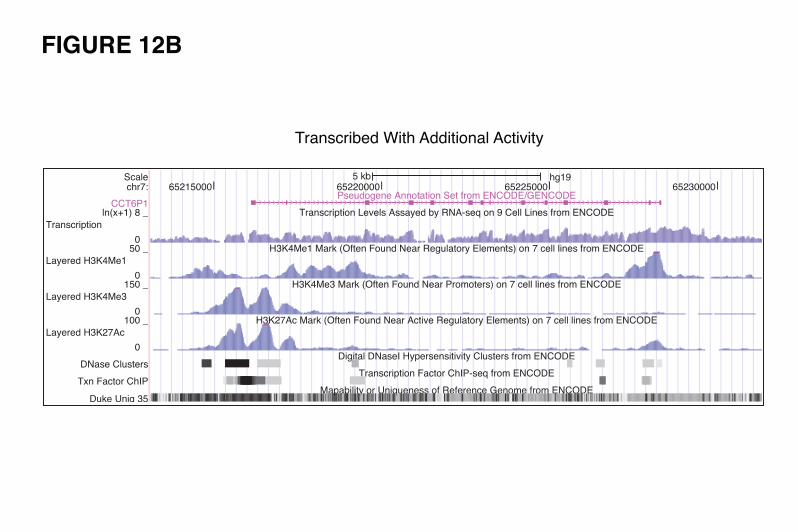
Transcribed With Additional Activity
Scalechr7:
CCT6P1
DNase Clusters
Txn Factor ChIP
5 kb hg1965215000 65220000 65225000 65230000
Pseudogene Annotation Set from ENCODE/GENCODE
Transcription Levels Assayed by RNA-seq on 9 Cell Lines from ENCODE
H3K4Me1 Mark (Often Found Near Regulatory Elements) on 7 cell lines from ENCODE
H3K4Me3 Mark (Often Found Near Promoters) on 7 cell lines from ENCODE
H3K27Ac Mark (Often Found Near Active Regulatory Elements) on 7 cell lines from ENCODE
Digital DNaseI Hypersensitivity Clusters from ENCODE
Transcription Factor ChIP-seq from ENCODE
Mapability or Uniqueness of Reference Genome from ENCODE
Transcription
ln(x+1) 8 _
0 _
Layered H3K4Me1
50 _
0 _
Layered H3K4Me3
150 _
0 _
Layered H3K27Ac
100 _
0 _
Duke Uniq 35
FIGURE 12B
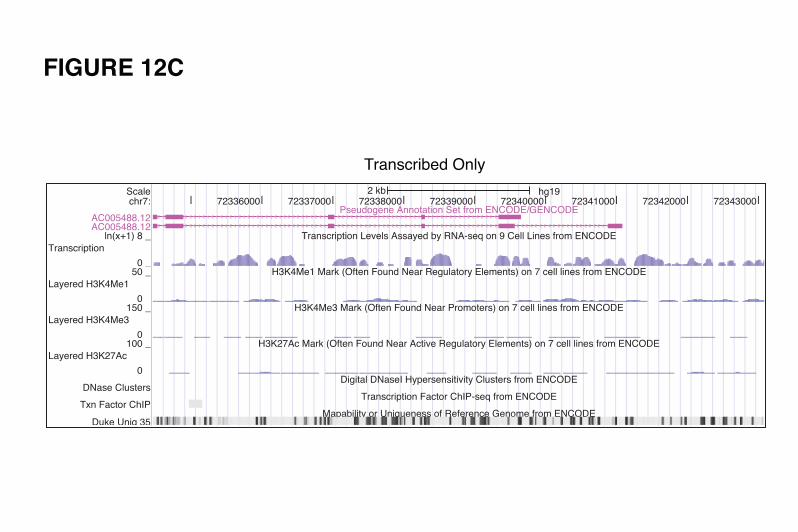
Transcribed Only
Scalechr7:
AC005488.12AC005488.12
DNase Clusters
Txn Factor ChIP
2 kb hg1972336000 72337000 72338000 72339000 72340000 72341000 72342000 72343000
Pseudogene Annotation Set from ENCODE/GENCODE
Transcription Levels Assayed by RNA-seq on 9 Cell Lines from ENCODE
H3K4Me1 Mark (Often Found Near Regulatory Elements) on 7 cell lines from ENCODE
H3K4Me3 Mark (Often Found Near Promoters) on 7 cell lines from ENCODE
H3K27Ac Mark (Often Found Near Active Regulatory Elements) on 7 cell lines from ENCODE
Digital DNaseI Hypersensitivity Clusters from ENCODE
Transcription Factor ChIP-seq from ENCODE
Mapability or Uniqueness of Reference Genome from ENCODE
Transcription
ln(x+1) 8 _
0 _
Layered H3K4Me1
50 _
0 _
Layered H3K4Me3
150 _
0 _
Layered H3K27Ac
100 _
0 _
Duke Uniq 35
FIGURE 12C
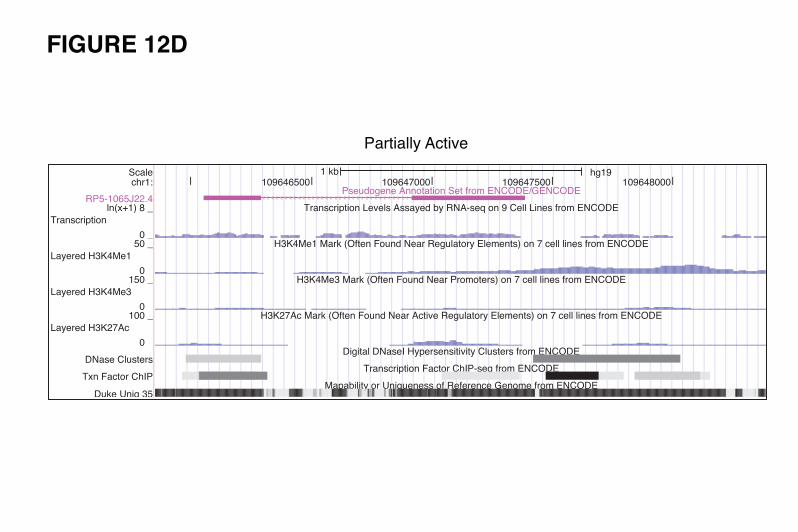
Partially Active
Scalechr1:
RP5-1065J22.4
DNase Clusters
Txn Factor ChIP
1 kb hg19109646500 109647000 109647500 109648000
Pseudogene Annotation Set from ENCODE/GENCODE
Transcription Levels Assayed by RNA-seq on 9 Cell Lines from ENCODE
H3K4Me1 Mark (Often Found Near Regulatory Elements) on 7 cell lines from ENCODE
H3K4Me3 Mark (Often Found Near Promoters) on 7 cell lines from ENCODE
H3K27Ac Mark (Often Found Near Active Regulatory Elements) on 7 cell lines from ENCODE
Digital DNaseI Hypersensitivity Clusters from ENCODE
Transcription Factor ChIP-seq from ENCODE
Mapability or Uniqueness of Reference Genome from ENCODE
Transcription
ln(x+1) 8 _
0 _
Layered H3K4Me1
50 _
0 _
Layered H3K4Me3
150 _
0 _
Layered H3K27Ac
100 _
0 _
Duke Uniq 35
FIGURE 12D
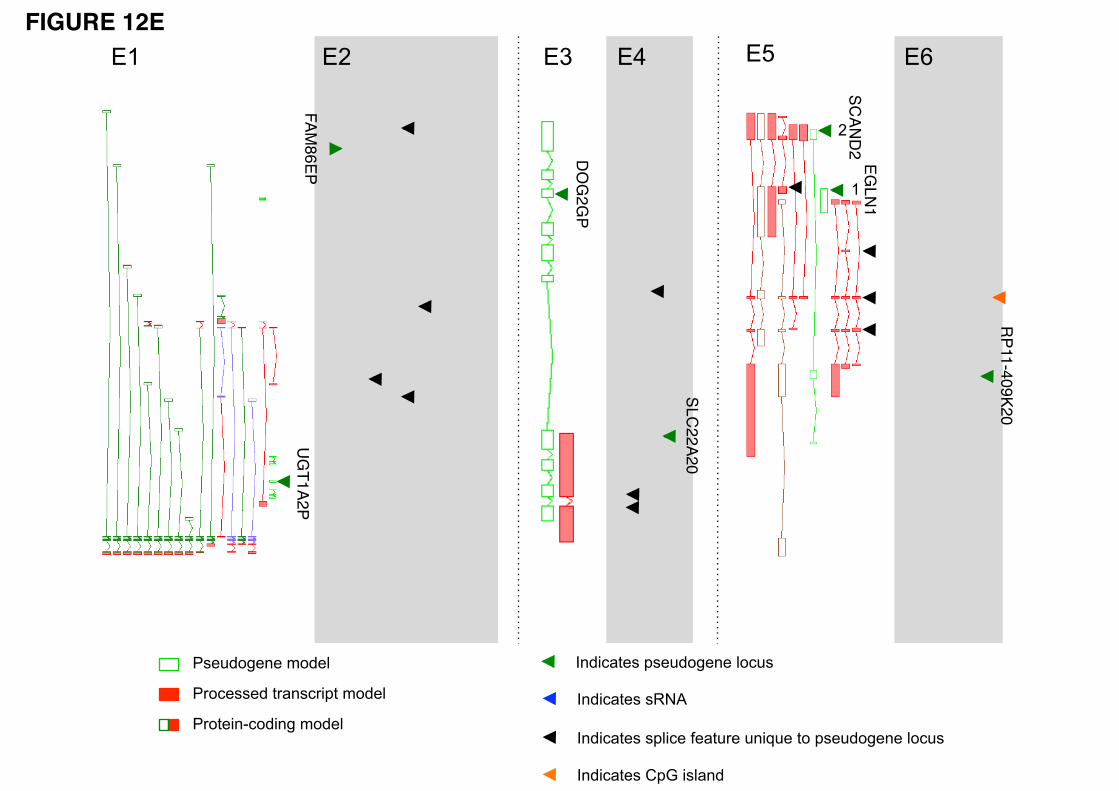
!"# !$# !%# !&# !'# !(#
"#
$#
UGT1A2P
FAM86EP
DOG2GP
SLC22A20
EGLN1
SCAND2
RP11-409K20
)*+,-./01#2103+450*0#64-31#
)*+,-./01#1789#
)*+,-./01#126,-0#:0./3;0#3*,<30#/4#2103+450*0#64-31#
)*+,-./01#=2>#,16.*+#
?103+450*0#@4+06#
?;4-0110+#/;.*1-;,2/#@4+06#
?;4/0,*A-4+,*5#@4+06#
FIGURE 12E