the furniture industry in - squarespace2008.pdf · the furniture industry in germany 10/09 ......
TRANSCRIPT

© Copyright CSIL
CSIL Milano scrl15 corso Monforte 20122 Milano Italy
tel. +39 02 796630 fax +39 02 [email protected] – www.csilmilano.com
THE FURNITURE INDUSTRY IN GERMANY SCENARIO
Multiclient Research COUNTRY REPORTS
September 08 – R2413.DE HOME FURNITURE
UPHOLSTERY
MATTRESSES
OFFICE
KITCHEN
APPLIANCES
LIGHTING
All CSIL publications are available for online purchase and immediate download from: http://www.csilmilano.com http://www.worldfurnitureonline.com Reports are also available in printed form. For further information, please contact: [email protected]

© Copyright CSIL
CSIL Milano scrl15 corso Monforte 20122 Milano Italy
tel. +39 02 796630 fax +39 02 [email protected] – www.csilmilano.com
SCENARIO
The furniture industry in Germany COUNTRY REPORTS
Report prepared by C. Pisa Coordinated by A. Tracogna HOME FURNITURE
UPHOLSTERY
MATTRESSES
OFFICE
KITCHEN
APPLIANCES
LIGHTING
All rights reserved. Neither this publication nor any part of it may be reproduced, stored in a retrieval system, or transmitted in any form or by any means, electronic, mechanical, photocopying, recording or otherwise. Any such action is an infringement of the Italian Law (L.18 August 2000 n.248) and may give rise to a legal action for damages and may be prosecuted as a criminal offence. All information in this report is verified to the best of the author's and the publisher's ability. However, CSIL does not accept responsibility for any errors and/ or omissions resulting from any source and for any loss arising from reliance on it.

The furniture industry in Germany
10/09/2008 R2413.DE
© Copyright CSIL This report is exclusively for consultation on the part of the purchaser. It may not be reproduced in whole or in part by any means whatsoever without the prior written permission of CSIL
I
CONTENTS 1. GERMANY. FURNITURE INDUSTRY SUMMARY 1 2. FORESTRY RESOURCES, SEMI-FINISHED GOODS AND TECHNOLOGY 3 3. THE FURNITURE SECTOR: BASIC DATA 5
3.1. Furniture production 7 3.2. Furniture consumption 10 3.3. Furniture distribution channels 12
4. MAJOR FURNITURE MANUFACTURERS 14 5. INTERNATIONAL TRADE 72
5.1. Furniture exports 73 5.2. Furniture imports 76
6. IMPORT AND EXPORT TABLES 82
LIST OF FIGURES AND TABLES Table 1.1 Germany. Economic indicators 1 Table 1.2 Germany. Exchange rates 1 Table 1.3 Germany. Real growth of furniture consumption: forecast 2 Table 1.4 Germany. Main furniture trading partners 2 Table 2.1 Germany. Production, exports, imports and consumption of the main semi-finished goods, 2000-2006. Thousands of cubic
metres 3 Table 3.1 Germany. The furniture sector: basic data, 2002-2007 5 Figure 3.1 Germany. The openness of the furniture market, 2002-2007. Exports/production and imports/consumption ratios 6 Figure 3.2 Germany. Furniture production, 2002-2007. Million Eur and annual percentage changes at current prices 7 Table 3.2 Germany. Furniture production prices, 2002-2007. Annual percentage changes 8 Figure 3.3 Germany. Furniture production by segment, 2002 and 2007. Percentage breakdown of value data 8 Table 3.3 Germany. Furniture production by segment, 2002-2007. Million Eur 8 Figure 3.4 Germany. Furniture consumption, 2002-2007. Million Eur and annual percentage changes at current prices 10 Figure 3.5 Germany. Furniture consumption by segment, 2002 and 2007. Percentage breakdown of value data 11 Table 3.4 Germany. Furniture consumption by segment, 2002-2007. Million Eur 11 Figure 3.6 Germany. Home furniture sales by distribution channel, 2006. Percentage breakdown of value data 13 Table 4.1 Germany. Major furniture manufacturers 14 Figure 5.1 Germany. Furniture exports, imports and trade balance, 2002-2007. Million Eur 72 Figure 5.2 Germany. Furniture exports, 2002-2007. Million Eur and annual percentage changes 73 Figure 5.3 Germany. Furniture exports by segment, 2002 and 2007. Percentage breakdown in value 74 Figure 5.4 Germany. Furniture exports by segment. Annual percentage changes at current prices 2007 on 2006 and average growth
rates, 2002-2007 75 Figure 5.5 Germany. Furniture imports, 2002-2007. Million current Euro and annual percentage changes 76 Figure 5.6 Germany. Furniture imports by segment, 2002 and 2007. Percentage breakdown in value 77 Figure 5.7 Germany. Furniture imports by segment. Annual percentage changes at current prices 2007 on 2006 and average growth
rates, 2002-2007 78 Table 6.1 Germany. Furniture exports by product, 2002-2007 83 Table 6.2 Germany. Furniture imports by product, 2002-2007 83 Table 6.3 Germany. Exports of furniture including parts by country and by geographical area, 2002-2007 84

The furniture industry in Germany
10/09/2008 R2413.DE
© Copyright CSIL This report is exclusively for consultation on the part of the purchaser. It may not be reproduced in whole or in part by any means whatsoever without the prior written permission of CSIL
II
Table 6.4 Germany. Imports of furniture including parts by country and by geographical area, 2002-2007 84 Table 6.5 Germany. Exports of furniture excluding parts by country and by geographical area, 2002-2007 85 Table 6.6 Germany. Imports of furniture excluding parts by country and by geographical area, 2002-2007 85 Table 6.7 Germany. Exports of furniture parts by country and by geographical area, 2002-2007 86 Table 6.8 Germany. Imports of furniture parts by country and by geographical area, 2002-2007 86 Table 6.9 Germany. Exports of upholstered furniture by country and by geographical area, 2002-2007 87 Table 6.10 Germany. Imports of upholstered furniture by country and by geographical area, 2002-2007 87 Table 6.11 Germany. Exports of non-upholstered seats by country and by geographical area, 2002-2007 88 Table 6.12 Germany. Imports of non-upholstered seats by country and by geographical area, 2002-2007 88 Table 6.13 Germany. Exports of bedroom furniture by country and by geographical area, 2002-2007 89 Table 6.14 Germany. Imports of bedroom furniture by country and by geographical area, 2002-2007 89 Table 6.15 Germany. Exports of kitchen furniture by country and by geographical area, 2002-2007 90 Table 6.16 Germany. Imports of kitchen furniture by country and by geographical area, 2002-2007 90 Table 6.17 Germany. Exports of office furniture by country and by geographical area, 2002-2007 91 Table 6.18 Germany. Imports of office furniture by country and by geographical area, 2002-2007 91 Table 6.19 Germany. Exports of furniture for dining and living rooms by country and by geographical area, 2002-2007 92 Table 6.20 Germany. Imports of furniture for dining and living rooms by country and by geographical area, 2002-2007 92 Table 6.21 Germany. Exports of other furniture by country and by geographical area, 2002-2007 93 Table 6.22 Germany. Imports of other furniture by country and by geographical area, 2002-2007 93 Table 6.23 Germany. Exports of furniture parts excluding parts of seats by country and by geographical area, 2002-2007 94 Table 6.24 Germany. Imports of furniture parts excluding parts of seats by country and by geographical area, 2002-2007 94 Table 6.25 Germany. Exports of parts of seats by country and by geographical area, 2002-2007 95 Table 6.26 Germany. Imports of parts of seats by country and by geographical area, 2002-2007 95
The furniture industry in Germany
10/09/2008 R2413.DE
© Copyright CSIL This report is exclusively for consultation on the part of the purchaser. It may not be reproduced in whole or in part by any means whatsoever without the prior written permission of CSIL
1
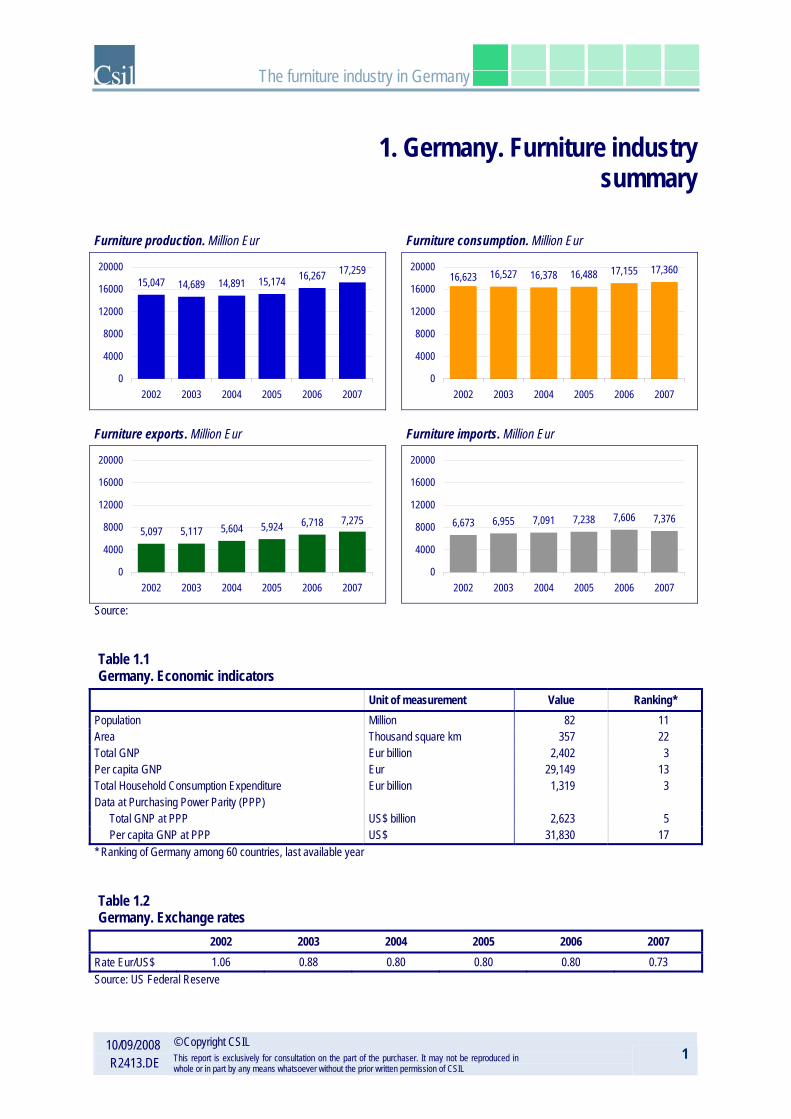
1. Germany. Furniture industry summary
Furniture production. Million Eur
Furniture consumption. Million Eur
15,047 14,689 14,891 15,174 16,267 17,259
0
4000
8000
12000
16000
20000
2002 2003 2004 2005 2006 2007
16,623 16,527 16,378 16,488 17,155 17,360
0
4000
8000
12000
16000
20000
2002 2003 2004 2005 2006 2007
Furniture exports. Million Eur
Furniture imports. Million Eur
7,2756,7185,9245,6045,1175,097
0
4000
8000
12000
16000
20000
2002 2003 2004 2005 2006 2007
7,3767,6067,2387,0916,9556,673
0
4000
8000
12000
16000
20000
2002 2003 2004 2005 2006 2007
Source:
Table 1.1 Germany. Economic indicators
Unit of measurement Value Ranking* Population Million 82 11 Area Thousand square km 357 22 Total GNP Eur billion 2,402 3 Per capita GNP Eur 29,149 13 Total Household Consumption Expenditure Eur billion 1,319 3 Data at Purchasing Power Parity (PPP)
Total GNP at PPP US$ billion 2,623 5 Per capita GNP at PPP US$ 31,830 17
* Ranking of Germany among 60 countries, last available year
Table 1.2 Germany. Exchange rates
2002 2003 2004 2005 2006 2007 Rate Eur/US$ 1.06 0.88 0.80 0.80 0.80 0.73 Source: US Federal Reserve

The furniture industry in Germany
10/09/2008 R2413.DE
© Copyright CSIL This report is exclusively for consultation on the part of the purchaser. It may not be reproduced in whole or in part by any means whatsoever without the prior written permission of CSIL
2
Table 1.3 Germany. Real growth of furniture consumption: forecast
2008 2009 1% 1%
Exports/production ratio
Imports/consumption ratio
33.9 34.8 39.0 41.3 42.237.6
0
20
40
60
80
100
2002 2003 2004 2005 2006 2007
Exports / production
40.1 42.1 43.9 44.3 42.543.3
0
20
40
60
80
100
2002 2003 2004 2005 2006 2007
Imports / consumption
Table 1.4 Germany. Main furniture trading partners
Destination of furniture exports Origin of furniture imports Netherlands 12.9% Poland 21.3% France 11.5% China 11.0% Austria 9.9% Italy 9.5% Switzerland 9.9% Czech Republic 6.7% United Kingdom 8.2% Austria 6.1% Belgium 6.4% Denmark 4.7% Spain 4.0% Hungary 4.4% United States 3.7% Slovenia 4.1% Italy 3.5% Switzerland 3.7% Czech Republic 3.3% South Africa 2.9%
Breakdown of furniture exports by area
Breakdown of furniture imports by area
0%
20%
40%
60%
80%
100%
Americas Europe Asia andPacific
MiddleEast
Africa WorldTotal
2003 2005 2007
0%
20%
40%
60%
80%
100%
Americas Europe Asia andPacific
MiddleEast
Africa WorldTotal
2003 2005 2007
Sources: CSIL, Eurostat, United Nations, World Bank and National Statistical Offices
The furniture industry in Germany
10/09/2008 R2413.DE
© Copyright CSIL This report is exclusively for consultation on the part of the purchaser. It may not be reproduced in whole or in part by any means whatsoever without the prior written permission of CSIL
3
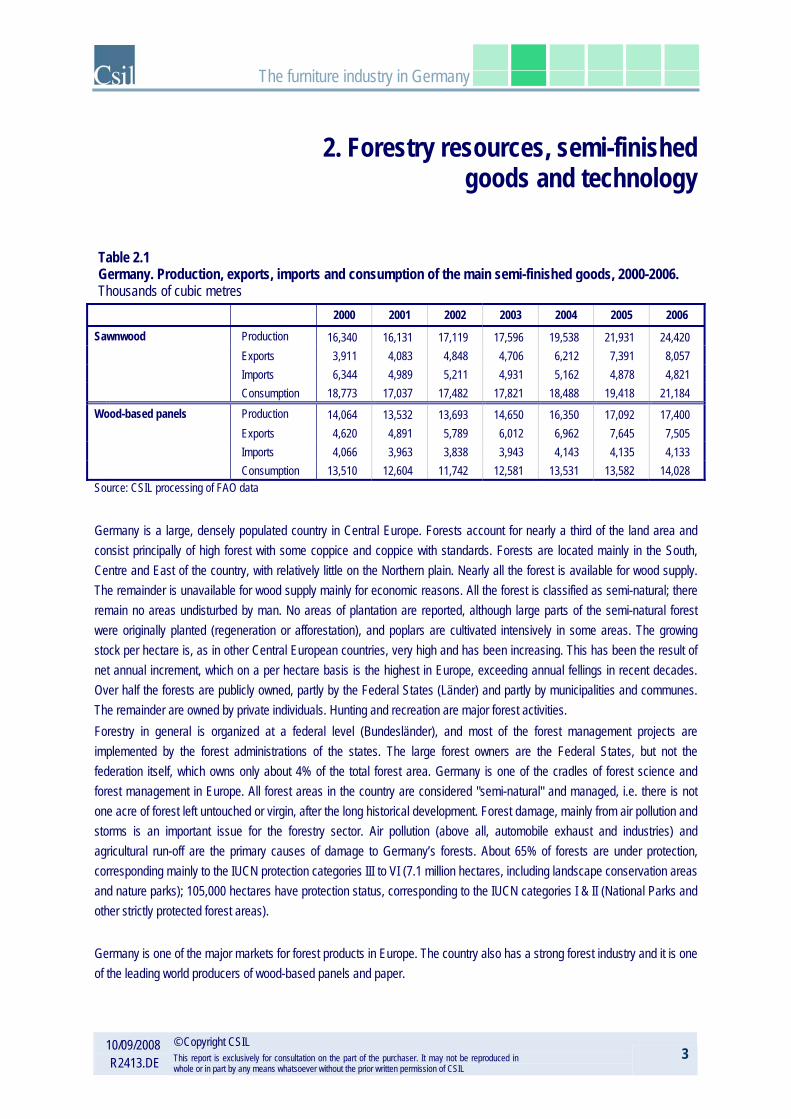
2. Forestry resources, semi-finished goods and technology
Table 2.1 Germany. Production, exports, imports and consumption of the main semi-finished goods, 2000-2006. Thousands of cubic metres
2000 2001 2002 2003 2004 2005 2006
Sawnwood Production 16,340 16,131 17,119 17,596 19,538 21,931 24,420 Exports 3,911 4,083 4,848 4,706 6,212 7,391 8,057 Imports 6,344 4,989 5,211 4,931 5,162 4,878 4,821 Consumption 18,773 17,037 17,482 17,821 18,488 19,418 21,184 Wood-based panels Production 14,064 13,532 13,693 14,650 16,350 17,092 17,400 Exports 4,620 4,891 5,789 6,012 6,962 7,645 7,505 Imports 4,066 3,963 3,838 3,943 4,143 4,135 4,133 Consumption 13,510 12,604 11,742 12,581 13,531 13,582 14,028 Source: CSIL processing of FAO data
Germany is a large, densely populated country in Central Europe. Forests account for nearly a third of the land area and consist principally of high forest with some coppice and coppice with standards. Forests are located mainly in the South, Centre and East of the country, with relatively little on the Northern plain. Nearly all the forest is available for wood supply. The remainder is unavailable for wood supply mainly for economic reasons. All the forest is classified as semi-natural; there remain no areas undisturbed by man. No areas of plantation are reported, although large parts of the semi-natural forest were originally planted (regeneration or afforestation), and poplars are cultivated intensively in some areas. The growing stock per hectare is, as in other Central European countries, very high and has been increasing. This has been the result of net annual increment, which on a per hectare basis is the highest in Europe, exceeding annual fellings in recent decades. Over half the forests are publicly owned, partly by the Federal States (Länder) and partly by municipalities and communes. The remainder are owned by private individuals. Hunting and recreation are major forest activities. Forestry in general is organized at a federal level (Bundesländer), and most of the forest management projects are implemented by the forest administrations of the states. The large forest owners are the Federal States, but not the federation itself, which owns only about 4% of the total forest area. Germany is one of the cradles of forest science and forest management in Europe. All forest areas in the country are considered "semi-natural" and managed, i.e. there is not one acre of forest left untouched or virgin, after the long historical development. Forest damage, mainly from air pollution and storms is an important issue for the forestry sector. Air pollution (above all, automobile exhaust and industries) and agricultural run-off are the primary causes of damage to Germany’s forests. About 65% of forests are under protection, corresponding mainly to the IUCN protection categories III to VI (7.1 million hectares, including landscape conservation areas and nature parks); 105,000 hectares have protection status, corresponding to the IUCN categories I & II (National Parks and other strictly protected forest areas). Germany is one of the major markets for forest products in Europe. The country also has a strong forest industry and it is one of the leading world producers of wood-based panels and paper.

The furniture industry in Germany
10/09/2008 R2413.DE
© Copyright CSIL This report is exclusively for consultation on the part of the purchaser. It may not be reproduced in whole or in part by any means whatsoever without the prior written permission of CSIL
4
In 2006 sawnwood production was rather stable (-0.8%) compared to 2005, while wood-based panels production, composed mainly (62%) by particle board panels and fibreboard panels (34%), recorded growth by 7% compared to 2005. Germany is also an important exporter of semi-finished products: in 2006 it exported 33% of its sawnwood production and 43% of wood-based panels production. Germany has the highest share of wood-based panels exports (29%) among European (EU17) countries and the second highest share of sawnwood exports (19%) after Sweden. Exports of sawnwood registered a strong increase by 9% compared to 2005, while wood-based panels decreased slightly by 1.8%. Germany has the largest engineered wood product industry in Europe, which is based partly on sawnwood imports. Two thirds of the paper production is based on imported wood pulp. Paper recycling is well organised in Germany and it is one the largest exporters and consumers of recycled paper.
The furniture industry in Germany
10/09/2008 R2413.DE
© Copyright CSIL This report is exclusively for consultation on the part of the purchaser. It may not be reproduced in whole or in part by any means whatsoever without the prior written permission of CSIL
5
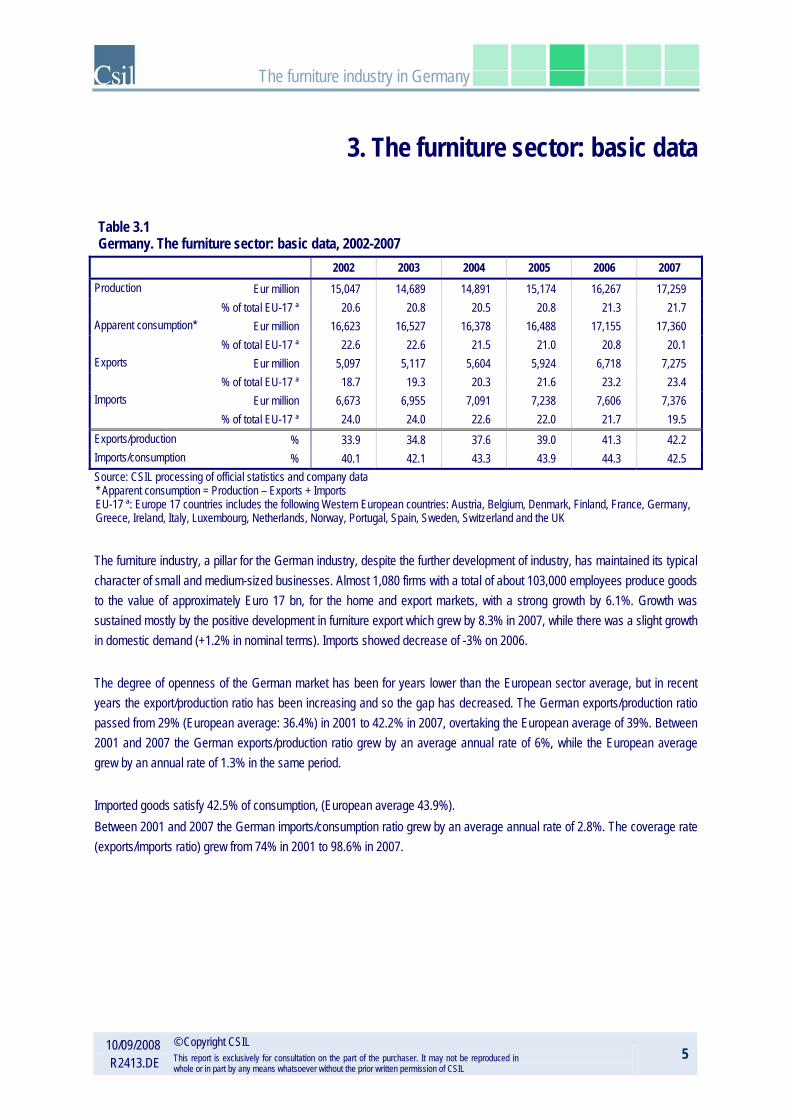
3. The furniture sector: basic data
Table 3.1 Germany. The furniture sector: basic data, 2002-2007
2002 2003 2004 2005 2006 2007 Production Eur million 15,047 14,689 14,891 15,174 16,267 17,259 % of total EU-17 ª 20.6 20.8 20.5 20.8 21.3 21.7 Apparent consumption* Eur million 16,623 16,527 16,378 16,488 17,155 17,360 % of total EU-17 ª 22.6 22.6 21.5 21.0 20.8 20.1 Exports Eur million 5,097 5,117 5,604 5,924 6,718 7,275 % of total EU-17 ª 18.7 19.3 20.3 21.6 23.2 23.4 Imports Eur million 6,673 6,955 7,091 7,238 7,606 7,376 % of total EU-17 ª 24.0 24.0 22.6 22.0 21.7 19.5 Exports/production % 33.9 34.8 37.6 39.0 41.3 42.2 Imports/consumption % 40.1 42.1 43.3 43.9 44.3 42.5 Source: CSIL processing of official statistics and company data * Apparent consumption = Production – Exports + Imports EU-17 ª: Europe 17 countries includes the following Western European countries: Austria, Belgium, Denmark, Finland, France, Germany, Greece, Ireland, Italy, Luxembourg, Netherlands, Norway, Portugal, Spain, Sweden, Switzerland and the UK
The furniture industry, a pillar for the German industry, despite the further development of industry, has maintained its typical character of small and medium-sized businesses. Almost 1,080 firms with a total of about 103,000 employees produce goods to the value of approximately Euro 17 bn, for the home and export markets, with a strong growth by 6.1%. Growth was sustained mostly by the positive development in furniture export which grew by 8.3% in 2007, while there was a slight growth in domestic demand (+1.2% in nominal terms). Imports showed decrease of -3% on 2006. The degree of openness of the German market has been for years lower than the European sector average, but in recent years the export/production ratio has been increasing and so the gap has decreased. The German exports/production ratio passed from 29% (European average: 36.4%) in 2001 to 42.2% in 2007, overtaking the European average of 39%. Between 2001 and 2007 the German exports/production ratio grew by an average annual rate of 6%, while the European average grew by an annual rate of 1.3% in the same period. Imported goods satisfy 42.5% of consumption, (European average 43.9%). Between 2001 and 2007 the German imports/consumption ratio grew by an average annual rate of 2.8%. The coverage rate (exports/imports ratio) grew from 74% in 2001 to 98.6% in 2007.
The furniture industry in Germany
10/09/2008 R2413.DE
© Copyright CSIL This report is exclusively for consultation on the part of the purchaser. It may not be reproduced in whole or in part by any means whatsoever without the prior written permission of CSIL
6
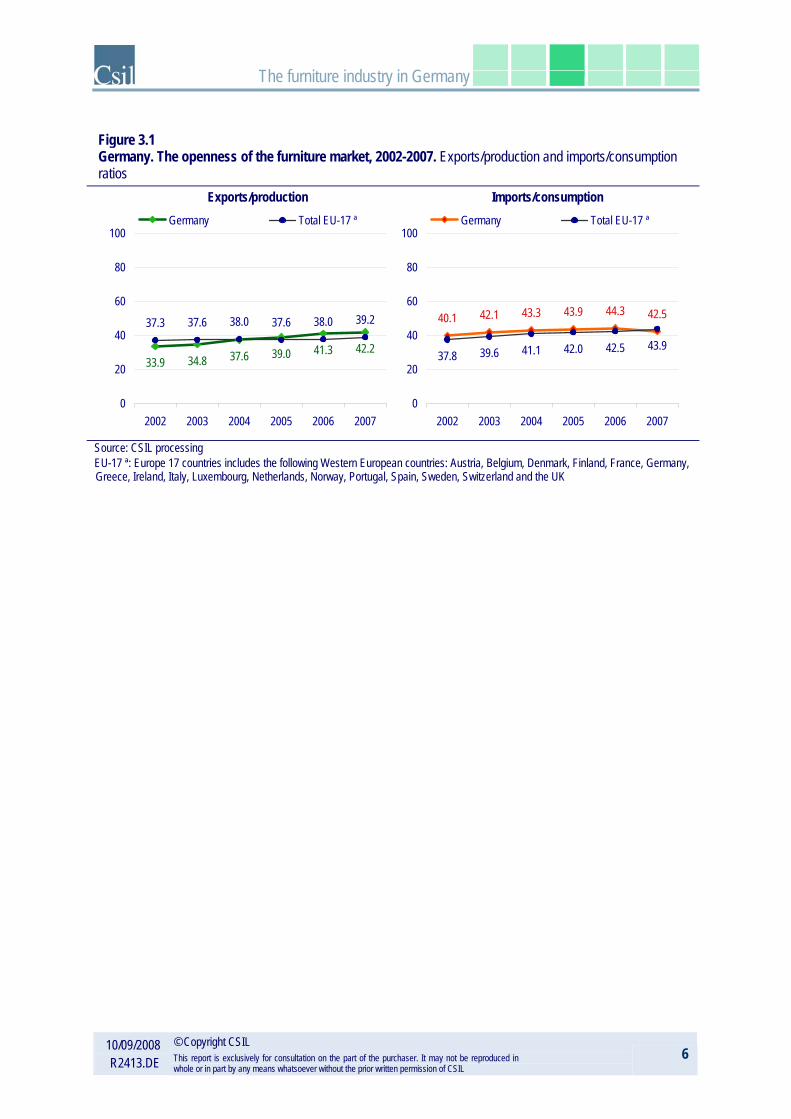
Figure 3.1 Germany. The openness of the furniture market, 2002-2007. Exports/production and imports/consumption ratios
Exports/production Imports/consumption
37.3 37.6 38.0 37.6
39.037.634.833.942.241.3
39.238.0
0
20
40
60
80
100
2002 2003 2004 2005 2006 2007
Germany Total EU-17 ª
40.1 42.1 43.3 43.9
37.8 41.1 42.0
44.3 42.5
39.6 42.5 43.9
0
20
40
60
80
100
2002 2003 2004 2005 2006 2007
Germany Total EU-17 ª
Source: CSIL processing EU-17 ª: Europe 17 countries includes the following Western European countries: Austria, Belgium, Denmark, Finland, France, Germany, Greece, Ireland, Italy, Luxembourg, Netherlands, Norway, Portugal, Spain, Sweden, Switzerland and the UK

The furniture industry in Germany
10/09/2008 R2413.DE
© Copyright CSIL This report is exclusively for consultation on the part of the purchaser. It may not be reproduced in whole or in part by any means whatsoever without the prior written permission of CSIL
7
3.1. Furniture production
Figure 3.2 Germany. Furniture production, 2002-2007. Million Eur and annual percentage changes at current prices
17,25916,26715,17414,89114,68915,047
0250050007500
1000012500150001750020000
2002 2003 2004 2005 2006 2007
million EUR
1.4
7.2
-12.8
6.1
-2.41.9
-15
-10
-5
0
5
10
2002 2003 2004 2005 2006 2007
% changes
Source: CSIL processing
Germany is Europe’s second producer of furniture after Italy: with a volume of production of Euro 17,259 million in 2007, provides 22% of total European supply. From the industrial point of view Germany is the main reference point for the economies of the euro area, and also the country that suffered most from the negative effects of the serious crisis post-2001. In 2002 and 2003 growth in GDP was zero in real terms and over the course of 2005 it increased by roughly 1% confirming the performance of 2004. Germany showed a return to growth in 2006 at a healthy rate (GDP: +2.9%), a level close to that of 2000 and also in 2007 German economy continued its positive trend (GDP: +2.5%), in spite of the initial fears linked to the global economy and to the effects of the VAT increase on private consumption. Growth was sustained by exports dynamics, which recorded decisive growth over the last year, but also by investments and public consumption. This general trend had an influence on the performance of the furniture segment, in fact, over the 2001-2004 period the average annual change in production was –4.8%. It was in these years that an extensive process of downsizing occurred, with numerous firms restructuring and closing factories with strong repercussions on employment levels. Starting in 2004, the strong increase by 7.2% in 2006 was followed by a 6% growth in 2007 (+3.8% in real terms), driven by exports which recorded increase by 8.3% in 2007.

The furniture industry in Germany
10/09/2008 R2413.DE
© Copyright CSIL This report is exclusively for consultation on the part of the purchaser. It may not be reproduced in whole or in part by any means whatsoever without the prior written permission of CSIL
8
Table 3.2 Germany. Furniture production prices, 2002-2007. Annual percentage changes
2002 2003 2004 2005 2006 2007
Furniture prices 1.9 0.4 0.9 1.9 1.6 2.2 Source: CSIL processing
Production by segment
Figure 3.3 Germany. Furniture production by segment, 2002 and 2007. Percentage breakdown of value data
1715
10
2
11
161714
22
10
6
2
11
17
8
21
0
5
10
15
20
25
Office furniture Upholsteredfurniture
Kitchenfurniture
Bedroomfurniture
Dining andliving room
furniture
Non-upholstered
seats
Other furniture Furniture partsand seating
parts
2002 2007
Source: CSIL processing
Table 3.3 Germany. Furniture production by segment, 2002-2007. Million Eur
2002 2003 2004 2005 2006 2007 Total furniture 15,047 14,689 14,891 15,174 16,267 17,259 Of which: Office furniture 2,541 2,204 2,162 2,315 2,570 2,909 Upholstered furniture 2,223 2,178 2,266 2,377 2,441 2,483 Kitchen furniture 3,164 3,048 3,185 3,307 3,690 3,882 Bedroom furniture 1,538 1,516 1,519 1,513 1,661 1,732 Dining and living room furniture 1,213 1,069 1,081 1,061 1,129 1,096 Non-upholstered seats 267 290 285 299 307 346 Other furniture 1,657 1,973 1,912 1,753 1,708 1,833 Total furniture excluding parts 12,603 12,279 12,409 12,625 13,506 14,281 Furniture parts and seating parts 2,444 2,411 2,483 2,549 2,760 2,979 Source: CSIL processing

The furniture industry in Germany
10/09/2008 R2413.DE
© Copyright CSIL This report is exclusively for consultation on the part of the purchaser. It may not be reproduced in whole or in part by any means whatsoever without the prior written permission of CSIL
9
The most important segment of the German furniture industry is the kitchen furniture segment which represents 22% of total furniture. Germany is the leading producer of kitchen furniture in Europe (27% on total European supply) and also the top market in terms of consumption. In 2007 kitchen production increased by 5.2%, reaching a total value of Euro 3,882 million. The increase in production recorded by segment firms last year was destined especially for international markets. In 2007 total exports of kitchen furniture recorded growth of 14% reaching a value of Euro 1379 million. The German kitchen furniture industry employs almost 17,000 persons in about 100 firms. Germany produces kitchens for the low (57%) and the middle (21%) segments, with a 22% share of the upper and the upper-middle segments. Germany is the second producer of upholstered furniture in Europe after Italy, with a 21% share on total European supply. After registering important decreases over the last years, upholstery production in Germany recovered in 2004 and registered another growth of 3% in real terms in 2005. In 2006 production growth remained positive and increased by 1.2% in real terms, while it became negative in 2007, decreasing by 0.3% in real terms. Along with the drop in production, export activity dropped by 8.4% in nominal terms in 2007. After a negative trend over the 2001-2004 period (the average annual change in office furniture production was -7%), in 2005 office furniture production began to grow and in 2007 it recorded the highest growth in the last decade (+9.6% in real terms), enabling production to reach a value of Euro 2,909 million. Germany is also Europe’s leading producer of office furniture, providing a quota of 30.3% of total European supply, about one percentage point higher than the previous year. Germany is also the second producer of bedroom furniture and dining and living room furniture among the European countries (EU-17), with respectively 19% and 17% share on total European supply. After a negative trend in the 2001-2005 period, in 2007 bedroom furniture production continued to grow by 4.3% in nominal terms. Living room furniture production, instead decreased by 3% at current prices. Manufacturers of living room, dining room and bedroom furniture employ approximately 45,000 persons in 480 businesses.

The furniture industry in Germany
10/09/2008 R2413.DE
© Copyright CSIL This report is exclusively for consultation on the part of the purchaser. It may not be reproduced in whole or in part by any means whatsoever without the prior written permission of CSIL
10
3.2. Furniture consumption
Figure 3.4 Germany. Furniture consumption, 2002-2007. Million Eur and annual percentage changes at current prices
17,36017,15516,48816,37816,52716,623
0250050007500
1000012500150001750020000
2002 2003 2004 2005 2006 2007
million EUR
0.74.0
-12.7
-0.9-0.6 1.2
-15
-10
-5
0
5
10
15
2002 2003 2004 2005 2006 2007
% changes
Source: CSIL processing Apparent consumption = production + imports – exports. Furniture consumption is at production prices
Germany is Europe’s largest furniture consumer: with a volume of consumption of Euro 17,360 million in 2007, it provides 20% of total European demand. After a decreasing trend between 1999-2005 (-2.4% annually) and a 4% increase in 2006, furniture consumption in Germany decreased slightly in real terms (-1%) in 2007, following the stagnation of private consumption. Despite the recovery of the German economy, which was driven by exports and by the domestic demand, in the component of gross fixed investments (+5% in 2007), families maintained a high level of saving and private consumption was rather stable (–0.1%). While the anticipation of the VAT increase led to a temporary growth in private consumption in 2006, the negative effects of this could be felt in 2007. Of greater importance, however, was the strong acceleration of inflation, which had a particular impact on consumer confidence because it is concentrated in high frequency purchases like fuel and food. In Germany there are over 39 million households. They spend annually about Euro 275 in furniture (European average: Euro 354).

The furniture industry in Germany
10/09/2008 R2413.DE
© Copyright CSIL This report is exclusively for consultation on the part of the purchaser. It may not be reproduced in whole or in part by any means whatsoever without the prior written permission of CSIL
11
The German annual per capita household furniture consumption in 2007 was Euro 131, a little lower than the average for Europe 17 (Euro 152). Between 2001 and 2007 the furniture household expenditure decreased by an average annual rate of 2.5%.
Consumption by segment
Figure 3.5 Germany. Furniture consumption by segment, 2002 and 2007. Percentage breakdown of value data
18
22
19
1213
4
13
19
23
19
11 10
5
12
0
5
10
15
20
25
Office furniture Upholsteredfurniture
Kitchen furniture Bedroom furniture Dining and livingroom furniture
Non-upholsteredseats
Other furniture
2002 2007
Source: CSIL processing
Table 3.4 Germany. Furniture consumption by segment, 2002-2007. Million Eur
2002 2003 2004 2005 2006 2007 Total furniture excluding parts 13,084 12,924 12,768 12,782 13,092 13,278 Of which: Office furniture 2,297 2,003 1,940 2,058 2,241 2,489 Upholstered furniture 2,853 2,840 2,922 3,072 3,111 3,093 Kitchen furniture 2,439 2,358 2,425 2,395 2,575 2,588 Bedroom furniture 1,548 1,498 1,463 1,434 1,522 1,502 Dining and living room furniture 1,744 1,563 1,543 1,517 1,510 1,365 Non-upholstered seats 538 621 614 631 620 671 Other furniture 1,664 2,041 1,862 1,674 1,513 1,570 Source: CSIL processing
The most important segment of the German furniture market is the upholstered furniture segment which represents 23% of total furniture, excluding parts. Germany is the second consumer of upholstered furniture in Europe (22% on total European market) after the United Kingdom. After the downturn in 2006, upholstery consumption continued to slow down, decreasing by 2.5% in real terms in 2007.

The furniture industry in Germany
10/09/2008 R2413.DE
© Copyright CSIL This report is exclusively for consultation on the part of the purchaser. It may not be reproduced in whole or in part by any means whatsoever without the prior written permission of CSIL
12
The other most important segments are the kitchen furniture and office furniture ones, with shares of 19% each on total furniture consumption. Germany is the top market of kitchen furniture in Europe, with 19% share on total European market. In 2007 stagnation of private consumption was reflected in kitchen furniture consumption which was rather stable, growing slightly by only +0.5% in nominal terms. Germany is also Europe’s leading consumer of office furniture: with a volume of consumption of Euro 2,489 million in 2007 covers 27% of total European office market. After a negative trend over the 2000-2004 period, growth in domestic demand (+3.2% at constant prices) began in 2005 and continued to follow the particularly positive trend also in 2007 (+7.6% at constant prices). The post-2000 policies of limiting industrial investments took a U-turn in 2004 and investments continued throughout 2006 at significant rates, sustained the office furniture sector in 2007, too. Office furniture consumption was sustained by domestic production, while imports decreased by 2%. Germany is also the third consumer of bedroom furniture and the second of dining and living room furniture among the European countries (EU-17), with respectively 16% and 18% share on total European supply. After a negative trend in the 1999-2005 period, in 2006 bedroom furniture grew by 6% in nominal terms, but in 2007 bedroom consumption recorded a downturn of 1.3% at current prices. Also living room furniture continued to decrease by 9.6% in nominal terms.
3.3. Furniture distribution channels In Germany 70% of the sales of home furniture are made through the large specialist retailers. In 2006 growth was recorded in this channel, which includes Buying Groups, both franchised and independent chains, although the latter are declining in importance. Growth was mainly due to the gradual expansion of the Buying Groups through the acquisition of important new members. The process of concentration within the German distribution system continued in 2006 with chains of stores and Buying Groups combining forces to share and optimize some phases of their activities. The main reason why small and medium-sized operators want to join Buying Groups is to be able to benefit from the services offered and to carry out more aggressive commercial policies (for both purchases and sales) which would be difficult to implement on a small scale. The excellent performances recorded by the major Buying Groups, including EMV, Union, Atlas and MVH, is proof of the success of the Buying Group formula. In 2006 the furniture chains belonging to an association, such as Lutz, Schaffrath Gruppe, Ostermann and Dodenhof that are all part of the most important German buying group Begros, also continued to record good results.
The furniture industry in Germany
10/09/2008 R2413.DE
© Copyright CSIL This report is exclusively for consultation on the part of the purchaser. It may not be reproduced in whole or in part by any means whatsoever without the prior written permission of CSIL
13
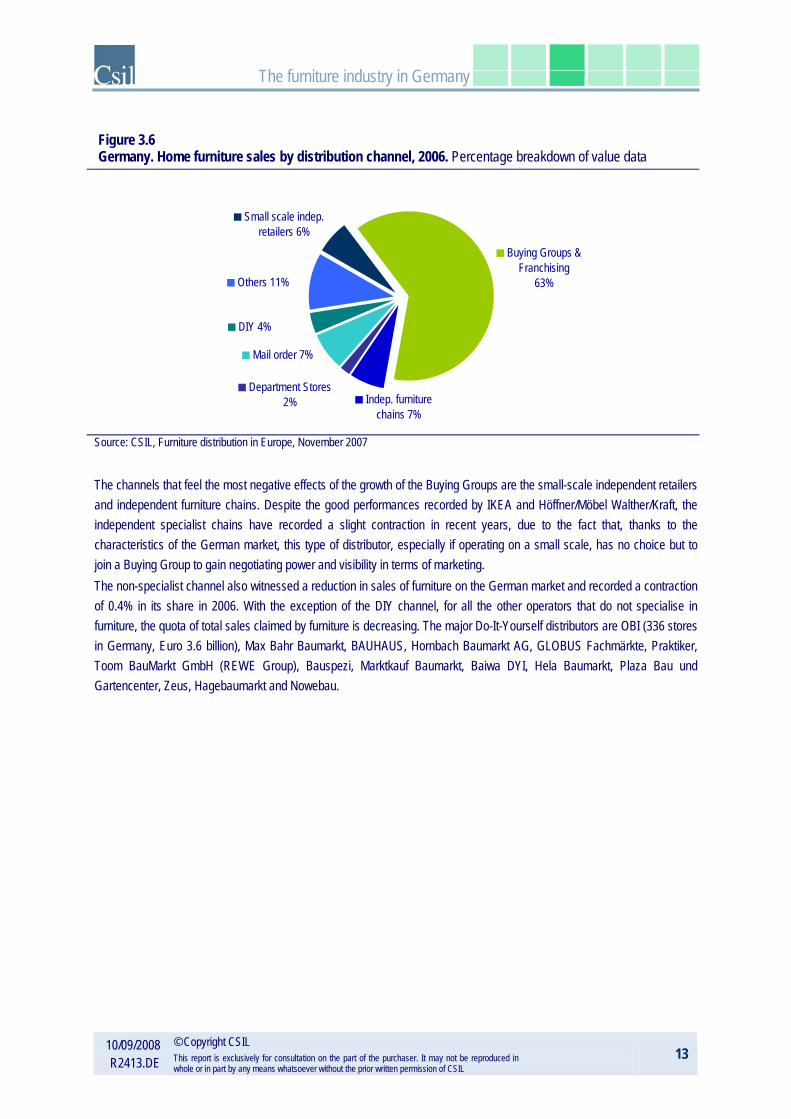
Figure 3.6 Germany. Home furniture sales by distribution channel, 2006. Percentage breakdown of value data
DIY 4%
Others 11%
Indep. furniture chains 7%
Buying Groups & Franchising
63%
Small scale indep. retailers 6%
Mail order 7%
Department Stores 2%
Source: CSIL, Furniture distribution in Europe, November 2007
The channels that feel the most negative effects of the growth of the Buying Groups are the small-scale independent retailers and independent furniture chains. Despite the good performances recorded by IKEA and Höffner/Möbel Walther/Kraft, the independent specialist chains have recorded a slight contraction in recent years, due to the fact that, thanks to the characteristics of the German market, this type of distributor, especially if operating on a small scale, has no choice but to join a Buying Group to gain negotiating power and visibility in terms of marketing. The non-specialist channel also witnessed a reduction in sales of furniture on the German market and recorded a contraction of 0.4% in its share in 2006. With the exception of the DIY channel, for all the other operators that do not specialise in furniture, the quota of total sales claimed by furniture is decreasing. The major Do-It-Yourself distributors are OBI (336 stores in Germany, Euro 3.6 billion), Max Bahr Baumarkt, BAUHAUS, Hornbach Baumarkt AG, GLOBUS Fachmärkte, Praktiker, Toom BauMarkt GmbH (REWE Group), Bauspezi, Marktkauf Baumarkt, Baiwa DYI, Hela Baumarkt, Plaza Bau und Gartencenter, Zeus, Hagebaumarkt and Nowebau.
The furniture industry in Germany
10/09/2008 R2413.DE
© Copyright CSIL This report is exclusively for consultation on the part of the purchaser. It may not be reproduced in whole or in part by any means whatsoever without the prior written permission of CSIL
14
4. Major furniture manufacturers
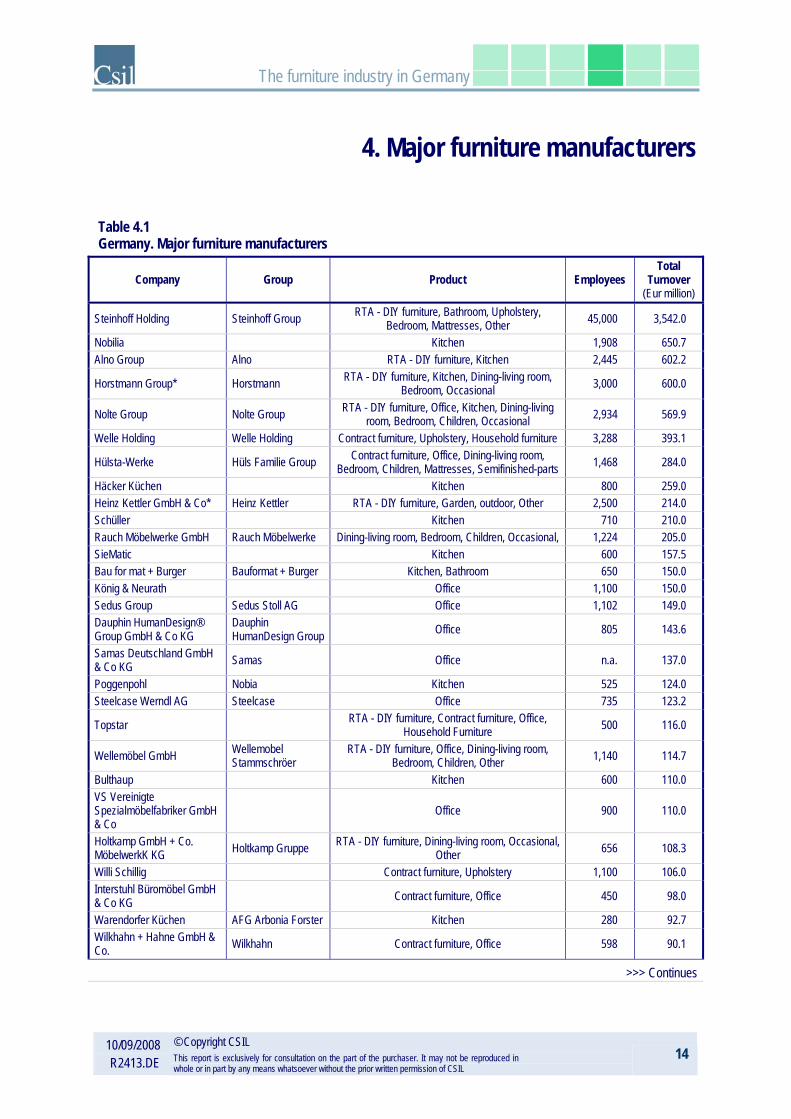
Table 4.1 Germany. Major furniture manufacturers
Company Group Product Employees Total
Turnover (Eur million)
Steinhoff Holding Steinhoff Group RTA - DIY furniture, Bathroom, Upholstery, Bedroom, Mattresses, Other 45,000 3,542.0
Nobilia Kitchen 1,908 650.7 Alno Group Alno RTA - DIY furniture, Kitchen 2,445 602.2
Horstmann Group* Horstmann RTA - DIY furniture, Kitchen, Dining-living room, Bedroom, Occasional 3,000 600.0
Nolte Group Nolte Group RTA - DIY furniture, Office, Kitchen, Dining-living room, Bedroom, Children, Occasional 2,934 569.9
Welle Holding Welle Holding Contract furniture, Upholstery, Household furniture 3,288 393.1
Hülsta-Werke Hüls Familie Group Contract furniture, Office, Dining-living room, Bedroom, Children, Mattresses, Semifinished-parts 1,468 284.0
Häcker Küchen Kitchen 800 259.0 Heinz Kettler GmbH & Co* Heinz Kettler RTA - DIY furniture, Garden, outdoor, Other 2,500 214.0 Schüller Kitchen 710 210.0 Rauch Möbelwerke GmbH Rauch Möbelwerke Dining-living room, Bedroom, Children, Occasional, 1,224 205.0 SieMatic Kitchen 600 157.5 Bau for mat + Burger Bauformat + Burger Kitchen, Bathroom 650 150.0 König & Neurath Office 1,100 150.0 Sedus Group Sedus Stoll AG Office 1,102 149.0 Dauphin HumanDesign® Group GmbH & Co KG
Dauphin HumanDesign Group Office 805 143.6
Samas Deutschland GmbH & Co KG Samas Office n.a. 137.0
Poggenpohl Nobia Kitchen 525 124.0 Steelcase Werndl AG Steelcase Office 735 123.2
Topstar RTA - DIY furniture, Contract furniture, Office, Household Furniture 500 116.0
Wellemöbel GmbH Wellemobel Stammschröer
RTA - DIY furniture, Office, Dining-living room, Bedroom, Children, Other 1,140 114.7
Bulthaup Kitchen 600 110.0 VS Vereinigte Spezialmöbelfabriker GmbH & Co
Office 900 110.0
Holtkamp GmbH + Co. MöbelwerkK KG Holtkamp Gruppe RTA - DIY furniture, Dining-living room, Occasional,
Other 656 108.3
Willi Schillig Contract furniture, Upholstery 1,100 106.0 Interstuhl Büromöbel GmbH & Co KG Contract furniture, Office 450 98.0
Warendorfer Küchen AFG Arbonia Forster Kitchen 280 92.7 Wilkhahn + Hahne GmbH & Co. Wilkhahn Contract furniture, Office 598 90.1
>>> Continues

The furniture industry in Germany
10/09/2008 R2413.DE
© Copyright CSIL This report is exclusively for consultation on the part of the purchaser. It may not be reproduced in whole or in part by any means whatsoever without the prior written permission of CSIL
15
Company Group Product Employees Total
Turnover (Eur million)
Elastoform Polstermöbel GmbH & Co Upholstery 700 90.0
Wöstmann Gruppe Upholstery, Dining-living room, Bedroom, Tables-chairs, 500 78.2
HABA Habermaaß GmbH* HABA Corporate Family Children, Other n.a. 75.0
Burgbad AG Burgbad Bathroom, Other 598 73.7 Oeseder Möbel-Industrie Mathias Wiemann GmbH & Co KG
Bedroom 373 72.7
Keuco GmbH & Co KG Bathroom, Sanitary fittings 427 72.0 Koinor Polstermöbel GmbH & Co KG Upholstery, Tables-chairs, Textiles 480 72.0
Ballerina Küchen Kitchen 240 70.0 Haworth GmbH Haworth Office n.a. 67.6 Maja-Werk Manfred Jarosch GmbH RTA - DIY furniture, Occasional, Household
Furniture, Other 450 63.2
Brunner GmbH Contract furniture, Office 350 60.0
Walter Knoll AG & Co KG Contract furniture, Office, Upholstery, Household Furniture 210 60.0
Assmann Büromöbel GmbH & Co Contract furniture, Office 256 55.0
Palmberg Büroeinrichtugen & Service GmbH Office 382 55.0
Röhr GmbH & Co Bush RTA - DIY furniture, Office, Bedroom, Children 350 50.0
Interlübke Contract furniture, Office, Dining-living room, Bedroom 328 45.7
Dedon GmbH Garden, outdoor, 400 40.0 Paschen & Companie GmbH & Co KG RTA - DIY furniture, Contract furniture, Dining-living
room, 200 40.0
Wössner GmbH Möbelwerk Dining-living room, Tables-chairs, 300 37.5 WINI Büromöbel Georg Schmidt GmbH & Co KG Contract furniture, Office 190 36.1
Rohde Büromöbelwerk Contract furniture, Office 260 30.0 Karl Vierhaus GmbH & Co KG Vierhaus Group Tables-chairs, Occasional, Household Furniture, 200 25.0
Gwinner GmbH & Co KG Office, Dining-living room, 184 24.5 SIEGER GmbH + Co Tables-chairs, Garden, outdoor, 295 23.3
Draenert Studio GmbH Contract furniture, Upholstery, Tables-chairs, Occasional, Household Furniture, 60 12.5
EMCO Bad GmbH & Co KG* Erwin Müller Gruppe Lingen Bathroom, Other n.a. n.a.
* Not furniture specialised

The furniture industry in Germany
10/09/2008 R2413.DE
© Copyright CSIL This report is exclusively for consultation on the part of the purchaser. It may not be reproduced in whole or in part by any means whatsoever without the prior written permission of CSIL
16
Alno Group Germany
HEADQUARTERS Alno AG Heiligenbergerstrasse 47 88630 Pfullendorf Germany
Tel. +49 7552 213189 Fax +49 7552 213400 www.alno.de e-mail: [email protected]
CONTROLLED COMPANIES, SUBSIDIARIES, OTHER RELATED COMPANIES Gustav Wellmann GmbH & Co. KG, Impuls Küchen GmbH, Pino Küchen GmbH
BRANDS, TRADEMARKS Alno, Impuls Küchen, Pino Küchen, Spectra Küchen, Wellmann, Geba, AME
ACTIVITY Manufacturer
MAIN PRODUCTION Furniture Specialized: 100% FURNITURE PRODUCT SPECIALISATION 100% Kitchen; RTA - DIY
STOCK EXCHANGE Stock Exchanges in Frankfurt and Stuttgart STOCK SYMBOL ANO
THE COMPANY IS PART OF Alno
YEAR OF ESTABLISHMENT 1927 EMPLOYEES 2,445 TURNOVER EUR 602.2 million
TOTAL EXPORT EUR 186.7 million % EXPORT ON TOTAL TURNOVER 31
History
Alno Group, based in Pfullendorf, Germany, is a manufacturing company.
The company was established in 1927 in Wangen bei Göppingen, Baden-Württemberg, Germany by Albert Nothdurft who opened up a small carpentry workshop.
The positive development of this workshop led to the relocation of its production facilities to Pfullendorf in 1957, and in 1958 the carpentry workshop developed into ALNO Möbelwerke GmbH + Co. KG (ALNO Furniture Production Ltd).
The company was listed on the Stock Exchanges in Frankfurt and Stuttgart in 1995 (trading symbol: ANO).
Financial Highlights
In 2007 Alno Group recorded a total turnover of Euro 602.2 million, compared to 615.5 million in 2006. Despite a decline of about 9% in the domestic market, Alno recorded only a slight drop of 2.2% in sales compared to the previous year. This was principally thanks to growth in exports, which ALNO managed to increase by 7.5 % on the year before.
Manufacturing process
The company employed 2,445 people in 2007 (-8% on 2006).
In addition to the factories in the company’s traditional home town of Pfullendorf, where fitted kitchens are manufactured under the Alno brand name, Alno AG has at its disposal various other subsidiary German production companies that manufacture kitchens for specialized market segments: Pino Küchen GmbH in Coswig-Klieken, Impuls Küchen GmbH in Brilon and Gustav Wellmann GmbH + Co. KG in Enger. Elsewhere in Europe, ALNO has eight wholly-owned marketing subsidiary companies.
The furniture industry in Germany
10/09/2008 R2413.DE
© Copyright CSIL This report is exclusively for consultation on the part of the purchaser. It may not be reproduced in whole or in part by any means whatsoever without the prior written permission of CSIL
17
In 1990 Impuls Küchen GmbH was established in Brilon and in 1992 a joint venture was set up with the Polish company Forte S.A. that enabled the company to penetrate the Polish and Eastern European markets (Forte was sold in 2003).
In 1994 Alno established another furniture manufacturing company in Klieken, called Pino Küchen GmbH.
In 1998 Alno decided to flank its Brilon factory with a new plant to produce bathroom furniture in order to diversify its product range. Puris Bad GmbH was sold to Steinhoff in 2003.
In August 2003 Alno AG merged with the Casawell Service Group, a network of companies active across the world in the fields of fitted kitchens and DIY-kitchens and in kitchen technology. Currently Casawell consists of Wellmann, the main company and brand of Casawell in the middle market range. Gustav Wellmann Ltd. was founded in 1953 as a craftsman’s business.
In mid-2005 Alno sold its company Wellpac Möbelwerke GmbH (RTA kitchen), the biggest loss maker of 2004, and disposed of its unprofitable electrical appliance warehouse in Ennigloh. Also in 2005 Alno Middle East (AME) started business and was the Alno Group's first-ever international production site.
During 2006 Alno handed over the remaining business, not including the kitchen sector with a core business increase of 1.5%.
Products
Kitchen furniture sales were Euro 602.2 million (-2.2% on 2006) and account for 100% on total turnover.
Strategic growth initiatives
In 2007 ALNO Group approved further restructuring measures, which have been completed in 2008, by cutting also jobs. The company invested around Euro 32.5 million in one-off and restructuring costs.
In 2008 ALNO AG gains a strong partner in Al Khayyat Investments L.L.C (a holding based in Dubai), who acquires 50% of shareholding in its whole subsidiary ALNO Middle East (AME). The aim is to use the strong ALNO brand and Al Khayyat’s network and experience to sustainably strengthen the long-term growth of AME across the Middle East.
The furniture industry in Germany
10/09/2008 R2413.DE
© Copyright CSIL This report is exclusively for consultation on the part of the purchaser. It may not be reproduced in whole or in part by any means whatsoever without the prior written permission of CSIL
18
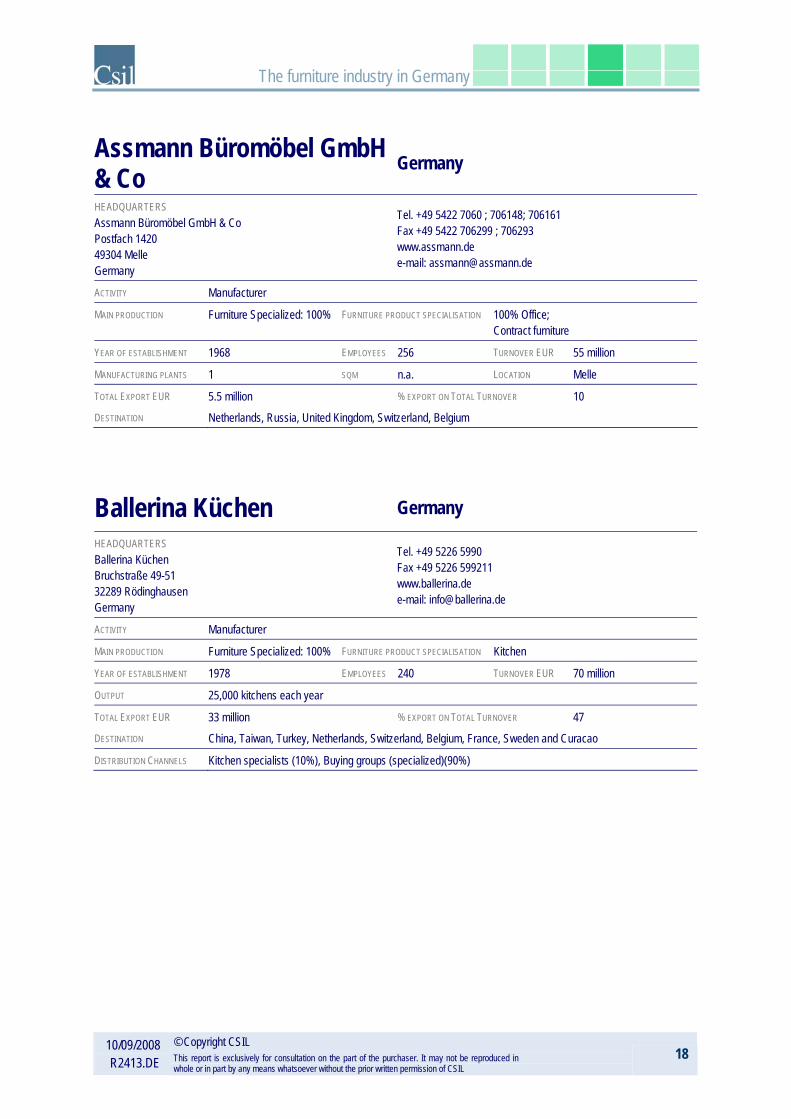
Assmann Büromöbel GmbH & Co Germany
HEADQUARTERS Assmann Büromöbel GmbH & Co Postfach 1420 49304 Melle Germany
Tel. +49 5422 7060 ; 706148; 706161 Fax +49 5422 706299 ; 706293 www.assmann.de e-mail: [email protected]
ACTIVITY Manufacturer
MAIN PRODUCTION Furniture Specialized: 100% FURNITURE PRODUCT SPECIALISATION 100% Office; Contract furniture
YEAR OF ESTABLISHMENT 1968 EMPLOYEES 256 TURNOVER EUR 55 million
MANUFACTURING PLANTS 1 SQM n.a. LOCATION Melle
TOTAL EXPORT EUR 5.5 million % EXPORT ON TOTAL TURNOVER 10 DESTINATION Netherlands, Russia, United Kingdom, Switzerland, Belgium
Ballerina Küchen Germany
HEADQUARTERS Ballerina Küchen Bruchstraße 49-51 32289 Rödinghausen Germany
Tel. +49 5226 5990 Fax +49 5226 599211 www.ballerina.de e-mail: [email protected]
ACTIVITY Manufacturer
MAIN PRODUCTION Furniture Specialized: 100% FURNITURE PRODUCT SPECIALISATION Kitchen
YEAR OF ESTABLISHMENT 1978 EMPLOYEES 240 TURNOVER EUR 70 million
OUTPUT 25,000 kitchens each year
TOTAL EXPORT EUR 33 million % EXPORT ON TOTAL TURNOVER 47 DESTINATION China, Taiwan, Turkey, Netherlands, Switzerland, Belgium, France, Sweden and Curacao
DISTRIBUTION CHANNELS Kitchen specialists (10%), Buying groups (specialized)(90%)

The furniture industry in Germany
10/09/2008 R2413.DE
© Copyright CSIL This report is exclusively for consultation on the part of the purchaser. It may not be reproduced in whole or in part by any means whatsoever without the prior written permission of CSIL
19
Bau for mat + Burger Germany
HEADQUARTERS Bau for mat Küchen GmbH & Co KG Kattwinkel 1 32584 Löhne Germany
Tel. +49 5732 1020 Fax +49 5732 102208 www.bauformat.de e-mail: [email protected]
BRANDS, TRADEMARKS Bau for mat, Burger, Badea
ACTIVITY Manufacturer
MAIN PRODUCTION Furniture Specialized: 100% FURNITURE PRODUCT SPECIALISATION Kitchen, Bathroom
THE COMPANY IS PART OF Bauformat + Burger
YEAR OF ESTABLISHMENT 1985 EMPLOYEES 650 TURNOVER EUR 150 million
MANUFACTURING PLANTS 2 SQM 51,000 LOCATION In Löhne (Westphalia) and Burg (Magdeburg)
TOTAL EXPORT EUR 47 million % EXPORT ON TOTAL TURNOVER 31.5 DESTINATION Western Europe, Eastern Europe, the USA and Asia
DISTRIBUTION CHANNELS Bau-for-mat Küchen GmbH & Co. KG and Burger Küchenmöbel GmbH products are exclusively distributed by specialist kitchen retailers and chain stores with an exclusive kitchen department.
History
Bau for mat, based in Löhne, Germany, is a manufacturing company. The company was established in 1985. Bau-for-mat Küchen GmbH & Co. KG and the Burger Küchenmöbel GmbH have worked together for many years. Both companies started with the production of kitchen buffets. In the sixties the companies started producing fitted kitchens.
Financial Highlights
In 2007 Bau for mat recorded a total turnover of Euro 150 million, of which around 60% came from Bau-for-mat and 40% from Burger. Exports account for about over 30% of Bau-for-mat + Burger’s turnover. The main export markets are Western Europe, Eastern Europe, the USA and Asia. The major outlet markets in Western Europe are the Netherlands, Belgium, Luxembourg, Switzerland and Austria.
Manufacturing process
Today Bau-for-mat Küchen GmbH & Co. KG and Burger Küchenmöbel GmbH manufacture fitted kitchens at their two production plants in Löhne, Westphalia and Burg, Magdeburg. Together, the two production sites boast a production area of 51,000 square metres (33,000 square metres for Bau-for-mat and 18,000 square metres for Burger). In addition to its kitchen furniture production Burger offers a small supply of bathroom furniture. The company Group employed 650 workers in 2006.
Products
Kitchen furniture sales were about Euro 135 million, accounting for about 90% on total turnover.
Distribution channels
Bau-for-mat Küchen GmbH & Co. KG and Burger Küchenmöbel GmbH products are exclusively distributed by specialist kitchen retailers and chain stores with an exclusive kitchen department.
The furniture industry in Germany
10/09/2008 R2413.DE
© Copyright CSIL This report is exclusively for consultation on the part of the purchaser. It may not be reproduced in whole or in part by any means whatsoever without the prior written permission of CSIL
20
Brunner GmbH Germany
HEADQUARTERS Brunner GmbH Im Salmenkopf 10 77866 Rheinau Germany
Tel. +49 7844 4020 Fax +49 7844 40280 www.brunner-stuehle.de e-mail: [email protected]
ACTIVITY Manufacturer
MAIN PRODUCTION Furniture Specialized: 100% FURNITURE PRODUCT
SPECIALISATION 20% office; 80% other household; Contract furniture, Office (contract chairs and tables for theatres, auditoriums, hotels, restaurants and offices)
YEAR OF ESTABLISHMENT 1977 EMPLOYEES 350 TURNOVER EUR 60 million
OUTPUT The firm produces 1,500 seating articles and 400 tables each day.
TOTAL EXPORT EUR 24 million % EXPORT ON TOTAL TURNOVER 40

The furniture industry in Germany
10/09/2008 R2413.DE
© Copyright CSIL This report is exclusively for consultation on the part of the purchaser. It may not be reproduced in whole or in part by any means whatsoever without the prior written permission of CSIL
21
Bulthaup Germany
HEADQUARTERS Bulthaup GmbH & Co KG Aich / Werkstraße 6 84155 Bodenkirchen Germany
Tel. +49 8741 800 Fax +49 8741 80309 www.bulthaup.com e-mail: [email protected]
ACTIVITY Manufacturer
MAIN PRODUCTION Furniture Specialized: 100% FURNITURE PRODUCT SPECIALISATION Kitchen
YEAR OF ESTABLISHMENT 1949 EMPLOYEES 600 TURNOVER EUR 110 million
OUTPUT 12,000 kitchen sets
TOTAL EXPORT EUR 82 million % EXPORT ON TOTAL TURNOVER 74.5 DESTINATION Its main export markets in Europe are the Netherlands (10% of total sales), France (7%), Spain (8%), Italy (6%),
UK (6%). Outside the EU Bulthaup gets good results in the North American Area (USA and Canada, 8%) and in the Asia Pacific area (9%)
DISTRIBUTION CHANNELS Kitchen specialists (100%)
History
Bulthaup, based in Bodenkirchen, Germany, is a manufacturing company.
The company was established in 1949 by Martin Bulthaup in Bodenkirchen, Lower Bavaria.
In 1978 Gerd Bulthaup, Martin’s son, took over as head of the company with the aim of becoming the market leader in design-oriented kitchens. In order to achieve this aim he needed to start cooperating with designers of which the most important was Otl Aicher.
Today the company manufactures contemporary design kitchen furniture for the upper-end of the market. The company has its head office in Germany and subsidiaries not only in Germany but also in the United Kingdom, France, Italy, Spain, the Netherlands, Switzerland, Japan, Hong Kong and the USA.
Financial Highlights
In 2007 Bulthaup recorded a total turnover of Euro 110 million (+17% on 2006). Exports account for about 75% of total turnover. Its main export markets in Europe are the Netherlands (10% of total sales), France (7%), Spain (8%), Italy (6%), UK (6%). Outside the EU Bulthaup gets good results in the North American Area (USA and Canada, 8%) and in the Asia Pacific area (9%).
Manufacturing process
The company employed around 600 employees in 2007 (+ 3% on 2006).
Products
Kitchen furniture sales were Euro 110 million and accounts 100% on total turnover. In the same year it produced around 12,000 kitchen sets.

The furniture industry in Germany
10/09/2008 R2413.DE
© Copyright CSIL This report is exclusively for consultation on the part of the purchaser. It may not be reproduced in whole or in part by any means whatsoever without the prior written permission of CSIL
22
Marketing In recent years the firm has been more and more oriented towards reinforcing the Bulthaup brand on the world markets. Its strategy was not only designed to remind people of its product lines, but at the same time to give greater value to the articles.
The communication strategy is moving towards showing that the products are not only aesthetically attractive, but also boast ergonomic features and are of excellent quality.
Distribution channels
Bulthaup distributes mostly throughout a network of exclusive kitchen specialists in some 50 countries worldwide. The company sells also to furniture retailers.
The company has showrooms in major cities including Munich, Milan, London, New York and Tokyo.
The furniture industry in Germany
10/09/2008 R2413.DE
© Copyright CSIL This report is exclusively for consultation on the part of the purchaser. It may not be reproduced in whole or in part by any means whatsoever without the prior written permission of CSIL
23
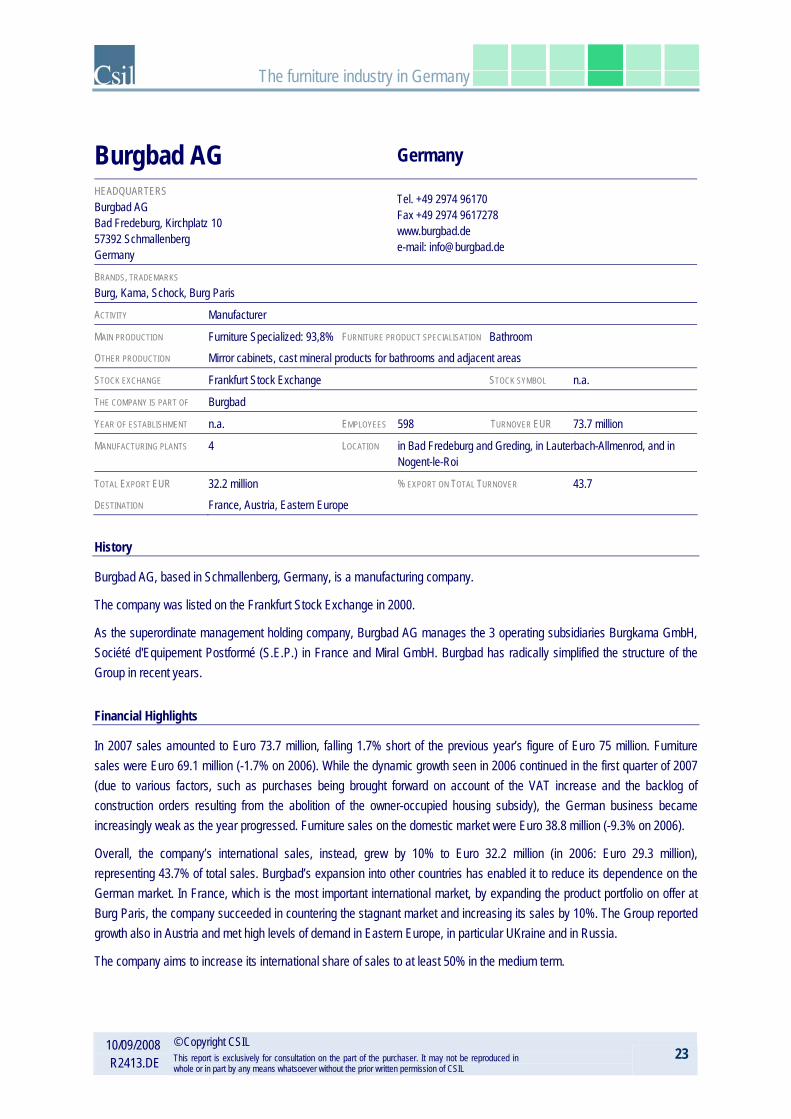
Burgbad AG Germany
HEADQUARTERS Burgbad AG Bad Fredeburg, Kirchplatz 10 57392 Schmallenberg Germany
Tel. +49 2974 96170 Fax +49 2974 9617278 www.burgbad.de e-mail: [email protected]
BRANDS, TRADEMARKS Burg, Kama, Schock, Burg Paris
ACTIVITY Manufacturer
MAIN PRODUCTION Furniture Specialized: 93,8% FURNITURE PRODUCT SPECIALISATION Bathroom OTHER PRODUCTION Mirror cabinets, cast mineral products for bathrooms and adjacent areas
STOCK EXCHANGE Frankfurt Stock Exchange STOCK SYMBOL n.a.
THE COMPANY IS PART OF Burgbad
YEAR OF ESTABLISHMENT n.a. EMPLOYEES 598 TURNOVER EUR 73.7 million
MANUFACTURING PLANTS 4 LOCATION in Bad Fredeburg and Greding, in Lauterbach-Allmenrod, and in Nogent-le-Roi
TOTAL EXPORT EUR 32.2 million % EXPORT ON TOTAL TURNOVER 43.7 DESTINATION France, Austria, Eastern Europe
History
Burgbad AG, based in Schmallenberg, Germany, is a manufacturing company.
The company was listed on the Frankfurt Stock Exchange in 2000.
As the superordinate management holding company, Burgbad AG manages the 3 operating subsidiaries Burgkama GmbH, Société d'Equipement Postformé (S.E.P.) in France and Miral GmbH. Burgbad has radically simplified the structure of the Group in recent years.
Financial Highlights
In 2007 sales amounted to Euro 73.7 million, falling 1.7% short of the previous year’s figure of Euro 75 million. Furniture sales were Euro 69.1 million (-1.7% on 2006). While the dynamic growth seen in 2006 continued in the first quarter of 2007 (due to various factors, such as purchases being brought forward on account of the VAT increase and the backlog of construction orders resulting from the abolition of the owner-occupied housing subsidy), the German business became increasingly weak as the year progressed. Furniture sales on the domestic market were Euro 38.8 million (-9.3% on 2006).
Overall, the company’s international sales, instead, grew by 10% to Euro 32.2 million (in 2006: Euro 29.3 million), representing 43.7% of total sales. Burgbad’s expansion into other countries has enabled it to reduce its dependence on the German market. In France, which is the most important international market, by expanding the product portfolio on offer at Burg Paris, the company succeeded in countering the stagnant market and increasing its sales by 10%. The Group reported growth also in Austria and met high levels of demand in Eastern Europe, in particular UKraine and in Russia.
The company aims to increase its international share of sales to at least 50% in the medium term.
The furniture industry in Germany
10/09/2008 R2413.DE
© Copyright CSIL This report is exclusively for consultation on the part of the purchaser. It may not be reproduced in whole or in part by any means whatsoever without the prior written permission of CSIL
24
Manufacturing process
The company employed 598 employees in 2007 (+ 2% on 2006).
The Group has four production plants: with locations in Bad Fredeburg and Greding, Burgkama GmbH is responsible for the Burg, Kama and Schock brands. The cast mineral products are supplied by Miral GmbH in Lauterbach-Allmenrod. The French market is supplied by the subsidiary S.E.P. in Nogent-le-Roi in France.
Products
Burgbad manufactures and sells high quality bathroom furniture, room concepts, mirror cabinets, cast mineral products for bathrooms and adjacent areas.
The business activities of the Group are divided into 3 primary segments: bathroom furniture, cast mineral products and consolidation and other segment (Holding company and transactions within the Group).
At Euro 69.1 million, sales in the bathroom furniture matched the level of sales reported in 2006 (Euro 70.4 million), thanks to the strength of the international business. In the cast mineral segment, Burgbad achieved slight sales growth from Euro 11.3 million to Euro 11.5 million.
Marketing Burgbad pursues a multi-brand strategy with Burg, Kama, Schock and Burg Paris. Each brand is specifically tailored to the needs of the respective target group. Today the subsidiary Burgkama produces and sells furniture concepts for Burg, Kama and Schock brands at two locations. The company has a separate brand for the French market - Burg Paris - for which the subsidiary Société d'Equipement Postformé is responsible. The subsidiary Miral GmbH produces cast mineral products, such as washstands, bathtubs and shower basins, both for the Burgbad Group and for external customers.
Strategic growth initiatives
Burgbad intends to strengthen its position in the European market and to expand into high-margin markets in the future. During 2007 Burgbad established the structures required to access the US market, where sales activities are due to take up in 2008. It is also planned to step up the company’s sales and marketing activities in Southern Europe (Italy).
The company has an investment policy which focuses on modernising and enhancing the efficiency of its machines and production processes in order to reduce costs. In 2007 the Group invested in a new edge processing facility at its Greding location. Total investments in property, plant and equipement rose by 45% from Euro 2.6 million to Euro 3.8 million in 2007.

The furniture industry in Germany
10/09/2008 R2413.DE
© Copyright CSIL This report is exclusively for consultation on the part of the purchaser. It may not be reproduced in whole or in part by any means whatsoever without the prior written permission of CSIL
25
DAUPHIN Germany
HEADQUARTERS Dauphin HumanDesign® Group GmbH & Co KG Espanstrasse 36 91238 Offenhausen Germany
Tel. +49 9158 17550 Fax +49 9158 17787 www.dauphin-group.com e-mail: [email protected]
CONTROLLED COMPANIES, SUBSIDIARIES, OTHER RELATED COMPANIES Trend!Office, Züco Bürositzmöbel AG, Dauphin Components, Artifex GmbH, Dauphin Entwicklungs- und Beteiligungs GmbH BRANDS, TRADEMARKS Dauphin, Zuco, Trend!Office, Bosse
ACTIVITY Manufacturer
MAIN PRODUCTION Furniture Specialized: 100% FURNITURE PRODUCT SPECIALISATION 100% Office
THE COMPANY IS PART OF Dauphin HumanDesign Group
YEAR OF ESTABLISHMENT 1969 EMPLOYEES 805 TURNOVER EUR 143.6 million
CERTIFICATION ISO 9001, ISO 14001
TOTAL EXPORT EUR 71.8 million % EXPORT ON TOTAL TURNOVER 50 DESTINATION Austria, Switzerland, France, United Kingdom, Belgium, Netherlands
History
Dauphin HumanDesign® Group GmbH & Co KG, based in Offenhausen, Germany, is a manufacturing company.
The company was established in 1969.
The family-owned company in 1992 became a 100% subsidiary of the Dauphin Office Interiors GmbH & Co. KG holding company. Dauphin has developed enormously thanks to a series of acquisitions and the setting up of new companies: in the nineties it acquired two seating producers, Zueco (CH) and Trend!Office (DE), while Bosse Design of Höxter (DE) was incorporated in order to introduce the firm to the market of wall-to-wall units and partition walls; Dauphin Components (mechanisms for seating) and Artifex GmbH (coverings and fillings) were created in Germany in 1993 with two production plants that supply all the firms in the group. In 2002 an operation of consolidation resulted in the creation of Dauphin Human Design Group which, in 2004, was flanked by another new firm specialising in the planning and design of working space and in consultancy: Sectio Aurea Consult GmbH & Co KG based in Munich.
Financial Highlights
In 2007 DAUPHIN recorded a total turnover of Euro 143.6 million (+8.8% on 2006). Furniture sales on the domestic market were Euro 71.8 million. Main exporting countries are: Austria, Switzerland, France, United Kingdom, Belgium, Netherlands.
Manufacturing process
The company employed 805 employees in 2007 (+ 6% on 2006).
At an international level the firm has 14 subsidiaries in the United States, South Africa, the United Kingdom, Spain, Singapore, France, Denmark, Benelux, Italy and Switzerland; six production plants and numerous licensed partners and agencies in more than 50 countries.

The furniture industry in Germany
10/09/2008 R2413.DE
© Copyright CSIL This report is exclusively for consultation on the part of the purchaser. It may not be reproduced in whole or in part by any means whatsoever without the prior written permission of CSIL
26
Products
The Dauphin HumanDesign Group creates ergonomic working environments for people living in the 21st century.
Office furniture sales were Euro 143.6 million (+ 8.8% on 2006) and accounts for 100% on total turnover.

The furniture industry in Germany
10/09/2008 R2413.DE
© Copyright CSIL This report is exclusively for consultation on the part of the purchaser. It may not be reproduced in whole or in part by any means whatsoever without the prior written permission of CSIL
27
Dedon GmbH Germany
HEADQUARTERS Dedon GmbH Stadtkoppel 26 21337 Lüneburg Germany
Tel. +49 4131 224470 Fax +49 4131 2244730 www.dedon.de e-mail: [email protected]
ACTIVITY Manufacturer
MAIN PRODUCTION Furniture Specialized FURNITURE PRODUCT SPECIALISATION Garden, outdoor OTHER PRODUCTION Fabrics
YEAR OF ESTABLISHMENT 1990 EMPLOYEES 400 TURNOVER EUR 40 million
MANUFACTURING PLANTS n.a. LOCATION Island of Cebu (Philippines)
EXPORT DESTINATION More than 65 markets
DISTRIBUTION CHANNELS The contract segment accounts for an estimated 40% (5 star hotels, spas, restaurants, lounges and on the sundecks of international cruise liners etc.). Dedon operates company owned showrooms in Barcelona, Vienna, Paris and plans to open further showrooms. Besides, products are distributed in independent upper rangefurniture stores and outdoor specialists. In France Dedon products are imported by Sifas, in the UK products are imported by Leisure Plan, in Italy products are imported by Roda.
History
Dedon GmbH, based in Lüneburg, Germany, is a manufacturing company. The company was established in 1990 by Bobby Dekeyser.
Financial Highlights
Dedon GmbH has an annual total turnover of about Euro 40 million.
Manufacturing process
The company employed about 3,000 people in 2006 (80-90 employees in admnistration and sales, 310 in Cebu and about 3,000 all over the world). Its product range focuses on the mix of aluminium parts and synthetic fibre (the synthetic material called Hularo was developed by the company in the end of the 80’s, rattan like but weatherproof, resistant to UV light). The synthetic fibre is produced at the company’s North German headquarters in Lüneburg. The company’s furniture production plant is based on the Island of Cebu (Philippines). Each article is a one-of-a-kind piece of hand-woven hand crafted furniture.
Products
Dedon is specialised in upper end outdoor furniture and focuses increasingly also the indoor market. This is due to the development of the lifestyles and that outdoor design is being increasingly adapted for indoor use and indoor furniture increasingly made of material adapted for outdoor use. Products manufactured include dining, low seating, modular, bench chair, signature pieces, accessories and fabrics.
In 2007 production of accessories has been increasing and is planned to further increase in 2008. According to Dedon the accessory offer is getting increasingly important for the marketing of the production.

The furniture industry in Germany
10/09/2008 R2413.DE
© Copyright CSIL This report is exclusively for consultation on the part of the purchaser. It may not be reproduced in whole or in part by any means whatsoever without the prior written permission of CSIL
28
Draenert Studio GmbH Germany
HEADQUARTERS Draenert Studio GmbH Steigwiesen 3 88090 Immenstaad am Bodensee Germany
Tel. +49 7545 2080 Fax +49 7545 20810 www.draenert.de e-mail: [email protected]
CONTROLLED COMPANIES, SUBSIDIARIES, OTHER RELATED COMPANIES Draenert Swiss AG
ACTIVITY Manufacturer
MAIN PRODUCTION Furniture Specialized:100% FURNITURE PRODUCT SPECIALISATION Contract, Tables-chairs, Upholstery, Occasional
YEAR OF ESTABLISHMENT 1968 EMPLOYEES 60 TURNOVER EUR 12.5 million
TOTAL EXPORT EUR 4.1 million % EXPORT ON TOTAL TURNOVER 33 DESTINATION 30 countries
OTHER INFO The company is specialised in the production of dining and coffee tables with patented extension-mechanisms, as well as chairs matching in form and style. The brand is representative since four decades for art and designer furniture, traditional craftsmanship, quality and first-class workmanship. Due to the big sales of chairs, the exclusive upholstery factory DRAENERT SWISS AG was founded inSwitzerland. The future strategy lies in the development, as well as production of full programmes in the seatingfurniture area. In addition, the company is known as stone specialist with a huge stone collection. The cooperation with well-known designers like Werner Aisslinger and Prof. Wulf Schneider gave DRAENERT several awards up to the red dot "Best of the best". In the autumn 2007, it was opened a cooperation withPoggenpohl: the trend of joining kitchen and living/dining area is taken account of by the so-called Dining Desk.

The furniture industry in Germany
10/09/2008 R2413.DE
© Copyright CSIL This report is exclusively for consultation on the part of the purchaser. It may not be reproduced in whole or in part by any means whatsoever without the prior written permission of CSIL
29
Elastoform Germany
HEADQUARTERS Elastoform Polstermöbel GmbH & Co Postfach 14 12 40 47228 Duisburg/Rheinhausen Germany
Tel. +49 2065 6990 Fax +49 2065 699109 www.elastoform.de e-mail: [email protected]
BRANDS, TRADEMARKS Formart, Teleform, Ergoform, Wohnform, Multiform, Cosyform, Pure
ACTIVITY Manufacturer
MAIN PRODUCTION Furniture Specialized: 100% FURNITURE PRODUCT SPECIALISATION 100% Upholstery
YEAR OF ESTABLISHMENT 1919 EMPLOYEES 700 TURNOVER EUR 90 million
MANUFACTURING PLANTS n.a. SQM 75,000 LOCATION n.a.
TOTAL EXPORT EUR 17.7 million % EXPORT ON TOTAL TURNOVER 19.6 DESTINATION Main export markets are the Netherlands and France
DISTRIBUTION CHANNELS Elastoform sells its products throughout Buying Groups and through independent specialists and upholstery specialist retailers. The company operates a permanent exhibition of its complete product range on a 4,200 square metre showroom.
History
Elastoform Polstermöbel GmbH & Co, based in Duisburg/Rheinhausen, Germany, is a manufacturing company.
The company was established in 1919 by Gerhard Brinkel.
Financial Highlights
In 2007 Elastoform recorded a total turnover of Euro 90 million of which 19.6% came from exports. Main export markets are the Netherlands and France.
Manufacturing process
Today the company counts around 700 employees, producing several hundred pieces of furniture daily in a 75,000 square metres production plant.
Products
The company offers 125 different models, each available in a wide range of fabrics and leathers. Leather coverings represent 80% of total company sales. Motion upholstery represents about 40% of total production.
The company offers eight different lines:
- Wohnform includes upholstered furniture. Familiar, classical shapes are the hallmark of this line of armchairs, two- and three-seater sofas, and corner combinations.
- Multiform integrated chaises-lounges, beds and bedding boxes, sofas and variable corner and side units.
- Teleform TV recliners have a range of sophisticated technical features.

The furniture industry in Germany
10/09/2008 R2413.DE
© Copyright CSIL This report is exclusively for consultation on the part of the purchaser. It may not be reproduced in whole or in part by any means whatsoever without the prior written permission of CSIL
30
- Formart is a programme of sophisticated upholstered furniture in modern styles.
- Formart relax is the offer of recliners.
- Cosy sofas.
- Cosyform seats have integrated foot parts.
- Pure is the luxurious line.
Distribution channels
Elastoform sells its products throughout Buying Groups and through independent specialists and upholstery specialist retailers. The company operates a permanent exhibition of its complete product range on a 4,200 square metre showroom.
The furniture industry in Germany
10/09/2008 R2413.DE
© Copyright CSIL This report is exclusively for consultation on the part of the purchaser. It may not be reproduced in whole or in part by any means whatsoever without the prior written permission of CSIL
31
EMCO Bad GmbH & Co KG Germany
HEADQUARTERS EMCO Bad GmbH & Co KG Breslauer Straße 34-38 49803 Lingen (Ems) Germany
Tel. +49 591 9140194 Fax +49 591 9140812 www.emco-bad.de
ACTIVITY Manufacturer
MAIN PRODUCTION FURNITURE PRODUCT SPECIALISATION Bathroom OTHER PRODUCTION Bathroom accessories, mirrors, lamps
THE COMPANY IS PART OF Erwin Müller Gruppe Lingen
YEAR OF ESTABLISHMENT 1952 EMPLOYEES n.a. TURNOVER EUR n.a.
CERTIFICATION ISO En 9001
OTHER INFO Emco bad has been operating for 50 years as a manufacturer of design-orientated bathroom furnishings. The product range includes bathroom accessories such as paper, glass and towel holders, mirrors, lamps andluminaires as well as high-quality bathroom furniture. Emco Bad belongs to the Lingen-based group of companies Erwin Müller. The Erwin Müller Group is a holding that unites five strong brands under one roof: NOVUS (staplers, perforators,desktop accessoires and tools for both the DIY and the professional trade) and the three Emco subsidiaries, Emco Bau (products for residential and commercial entrance areas), Emco Klima (products for air conditioning, heating and ventilation technology) and Emco Bad, as well as the Dahle company (guillotines, trimmers, heavy duty cutters, scissors and cutting accessoires...) in Coburg. With five distribution companies abroad, three foreign subsidiaries in China, the Czech Republic and France, with majority holdings domestically, over 900employees, 590 of these (including 30 trainees) in Lingen and annual turnover in excess of Euro 100 million, the Erwin Müller Group is one of the world's leading companies on the market.
Gwinner GmbH & Co KG Germany
HEADQUARTERS Gwinner GmbH & Co KG Postfach 1149 72281 Pfalzgrafenweiler Germany
Tel. +49 7445 1830 Fax +49 7445 183199 www.gwinner.de e-mail: [email protected]
ACTIVITY Manufacturer
MAIN PRODUCTION Furniture Specialized:100% FURNITURE PRODUCT
SPECIALISATION Wood veneer furniture Office, Dining-living room (specialised in wall units and modular construction systems for the home sector and in furnishings for management and executive offices)
YEAR OF ESTABLISHMENT 1930 EMPLOYEES 184 TURNOVER EUR 24.5 million
MANUFACTURING PLANTS 3 SQM 20,000 LOCATION n.a.
CERTIFICATION ISO 9001

The furniture industry in Germany
10/09/2008 R2413.DE
© Copyright CSIL This report is exclusively for consultation on the part of the purchaser. It may not be reproduced in whole or in part by any means whatsoever without the prior written permission of CSIL
32
HABA Habermaaß GmbH Germany
HEADQUARTERS HABA Habermaaß GmbH Postfach 1107 96476 Bad Rodach Germany
Tel. +49 9564 929100 Fax +49 9564 3513 www.haba.de e-mail: [email protected]
CONTROLLED COMPANIES, SUBSIDIARIES, OTHER RELATED COMPANIES JAKO-O, Wehrfritz GmbH
ACTIVITY Manufacturer and Retailer
MAIN PRODUCTION Not Furniture Specialized FURNITURE PRODUCT SPECIALISATION Children furniture OTHER PRODUCTION Toys, games, jewelry, porcelain dishes and textiles
THE COMPANY IS PART OF HABA Corporate Family (Turnover: Euro 230 mn, 1,500 employees)
YEAR OF ESTABLISHMENT 1938 EMPLOYEES n.a. TURNOVER EUR 75 million
CERTIFICATION ISO 9001, ISO 14001
OUTPUT Small parts production of wooden articles focusing on toys, approx. 40,000 active basic parts. Furniture production with about 30,000 active basic parts, 50,000 cupboards, 75,000 chairs, 15,000 tables. Outdoor play equipment with 1,500 units.
DISTRIBUTION CHANNELS Three distribution channels: specialized trade, institutions, catalog mail order. Under the HABA brand names the complete range of products are distributed to some 6,000 specialized dealers and social institutions all over the world. Besides the branches in France and the USA, HABA has its own agencies in 20 other countries, including Switzerland, Japan, Italy, Korea, Russia and Slovenia.
OTHER INFO Members of the HABA Corporate Family are: - HABA, a wood manufacturing company of high-quality baby and children's toys, as well as children's games
and furniture. The company is expanding the product portfolio beyond wood products, thus, offering also jewelry, porcelain dishes and textiles.
- JAKO-O, the mail order firm, set up in 1978, offering toys, clothing and other Haba products. - Wehrfritz, a single-source supplier for furnishing social care facilities.

The furniture industry in Germany
10/09/2008 R2413.DE
© Copyright CSIL This report is exclusively for consultation on the part of the purchaser. It may not be reproduced in whole or in part by any means whatsoever without the prior written permission of CSIL
33
Häcker Küchen Germany
HEADQUARTERS Häcker Küchen GmbH & Co KG Werkstrasse 3 32289 Rödinghausen Germany
Tel. +49 5746 9400 Fax +49 5746 940301 www.haecker-kuechen.de e-mail: [email protected]
BRANDS, TRADEMARKS Systemat, Classic
ACTIVITY Manufacturer
MAIN PRODUCTION Furniture Specialized: 100% FURNITURE PRODUCT SPECIALISATION Kitchen
YEAR OF ESTABLISHMENT 1938 EMPLOYEES 800 TURNOVER EUR 259 million
MANUFACTURING PLANTS n.a. SQM 191,000 LOCATION n.a.
CERTIFICATION ISO 9001
TOTAL EXPORT EUR 121.7 million % EXPORT ON TOTAL TURNOVER 47 DESTINATION Switzerland, UK, Netherlands
DISTRIBUTION CHANNELS Häcker-Küchen furniture is exclusively distributed through specialist kitchen retailers and furniture retailers with a kitchen department. The company works with a total of 2,500 trading partners in 37 countries in the kitchen tradeand with furniture stores that have specialist departments.
History
Häcker Küchen, based in Rödinghausen, Germany, is a manufacturing company.
The company was established in 1938 by Friedrich Häcker as a joinery and in 1972 the company transformed from a workshop to an industrial manufacturer.
Financial Highlights
In 2007 Häcker Küchen recorded a total turnover of Euro 259 million (+5.3% on 2006).
Furniture sales on the domestic market were Euro 137.3 million (-3.8% on 2006). The export share rose from 33% in 2003 to 47% in 2007. The most dynamic markets for Häcker-Küchen are the Netherlands, the UK, Belgium, France, Switzerland and Austria.
Manufacturing process
The company covers an area of 191,000 sqm of which 106,000 sqm of production area and 16,000 sqm of administration area.
The company employed 800 people in 2007, working in three factories.
Products
The company, specialized in the production of kitchen furniture, offers two line of kitchen: Classic and Systemat. Systemat is the high quality and ergonomic kitchen with a sophisticated design.

The furniture industry in Germany
10/09/2008 R2413.DE
© Copyright CSIL This report is exclusively for consultation on the part of the purchaser. It may not be reproduced in whole or in part by any means whatsoever without the prior written permission of CSIL
34
Häcker-Küchen operates in the middle price range.
Distribution channels Häcker-Küchen furniture is exclusively distributed through specialist kitchen retailers and furniture retailers with a kitchen department. The company works with a total of 2,500 trading partners in 37 countries in the kitchen trade and with furniture stores that have specialist departments.

The furniture industry in Germany
10/09/2008 R2413.DE
© Copyright CSIL This report is exclusively for consultation on the part of the purchaser. It may not be reproduced in whole or in part by any means whatsoever without the prior written permission of CSIL
35
Haworth GmbH Germany
HEADQUARTERS Haworth GmbH Von-Achenbach-Straße 21-23 59229 Ahlen Germany
Tel. +49 2382 7810 ; 781117 Fax +49 2382 781182 www.haworth.de
BRANDS, TRADEMARKS Art.collection, Comforto, Dyes, Röder and Nestler
ACTIVITY Manufacturer
MAIN PRODUCTION Furniture Specialized: 100% FURNITURE PRODUCT SPECIALISATION 100% Office
THE COMPANY IS PART OF Haworth (Haworth Europe’s turnover: Euro 298 mn; employees: 2,031)
YEAR OF ESTABLISHMENT n.a. EMPLOYEES n.a. TURNOVER EUR 67.5 million
OTHER INFO Haworth Europe’s turnover on the European market amounted to Euro 298 million, an increase of 6% compared to 2006. The Haworth group is active in Europe with a number of production plants in Italy (3), Switzerland (1),Germany, France (2), Spain (1), Portugal (2); it also has branches in the United Kingdom, Ireland, theNetherlands, the Czech Republic, Hungary and Russia. Following the policy of acquisitions carried out on theEuropean market, the firm has concentrated its portfolio around four main “brands”: Art.Collection, Castelli,Comforto and Dyes. Haworth’s head office is in Holland, in Michigan (USA) and in addition to its production in the US, it also has two factories in the Far East and one in Canada. In financial 2007 the global turnoveramounted to US$ 1.66 billion. Haworth has carried out numerous acquisitions in Germany over the course of the years. The brands used by the group on the German market are: Dyes (Dyes & Co. founded in 1901 produces desks and storage furniture, in the 1970s it introduced a collection of adjustable desks), Comforto (founded in 1863 as a producer of metal components, the firm entered the seating market in 1967 and four years later introduced the “Comforto” trademark), Art.collection, Röder and Nestler.

The furniture industry in Germany
10/09/2008 R2413.DE
© Copyright CSIL This report is exclusively for consultation on the part of the purchaser. It may not be reproduced in whole or in part by any means whatsoever without the prior written permission of CSIL
36
Heinz Kettler GmbH & Co Germany
HEADQUARTERS Heinz Kettler GmbH & Co Hauptstrasse 28 59469 Ense-Parsit Germany
Tel. +49 2938 810 Fax +49 2938 2022 www.kettler.net e-mail: [email protected]
BRANDS, TRADEMARKS Kettler, Herlag, MWH, MWH Möbel Ideen, MWH Profiline, Royal Garden, MWH Objetc and Design, Sonnetex
ACTIVITY Manufacturer
MAIN PRODUCTION Not Furniture Specialized: 59% (e) FURNITURE PRODUCT SPECIALISATION RTA - DIY, Garden, outdoor OTHER PRODUCTION Sport articles, bicycles, toys
THE COMPANY IS PART OF Heinz Kettler
YEAR OF ESTABLISHMENT 1949 EMPLOYEES 2,500 TURNOVER EUR 214 million
MANUFACTURING PLANTS 15 LOCATION In Germany, USA, Poland, Italy, UK, Austria, France, Belgium and the Netherlands.
DISTRIBUTION CHANNELS The company has direct sales in 4 of its plant. Further the brands Kettler, Herlag and MWH outdoor furniture are distributed in Garden centres, independent specialised retailers and furniture retailers.
(e): estimate
History
Heinz Kettler, based in Ense-Parsit, Germany, was established in 1949 and is an important manufacturer of leisure articles.
Metallwerk Helmstadt GmbH (MWH), established in 1975, is the company, part of the Heinz Kettler Goup, specialised in outdoor furniture.
Financial Highlights
Heinz Kettler has an annual turnover of about Euro 214 million.
Since 1994 MWH has enjoyed growth in the two-digit percentage area, and in the years 2000 to 2005 it doubled sales. The company has an annual estimated turnover of about Euro 88 million. An estimated 40% of the outdoor furniture production is exported mainly to France and Spain.
Manufacturing process
Heinz Kettler employs about 2,500 people and can count on 15 plants in Germany, USA, Poland, Italy, UK, Austria, France, Belgium and the Netherlands. The company operates 7 manufacturing plants in Germany (Ense-Parsit, Werk Mersch, Werk WKW, Werk Sönnern I, Rohrwerk Sönnern, Werk Kamen I, Werk Kamen II, Werk Hanweiler, MWH Metallwerk Heimstadt GmbH, Sonntex Freizeitprodukte GmbH). The MWH Metallwerk Helmstadt plant, with about 428 employees, manufactures the MWH outdoor furniture. Further Heinz Kettler operates plants in the USA, Poland, Italy, UK, Austria, France, Belgium and the Netherlands.

The furniture industry in Germany
10/09/2008 R2413.DE
© Copyright CSIL This report is exclusively for consultation on the part of the purchaser. It may not be reproduced in whole or in part by any means whatsoever without the prior written permission of CSIL
37
Products
The company has operations for sport articles, bicycles, toys, kit furniture, outdoor furniture. MWH develops, produces and distributes weatherproof garden furniture, catering trade furniture, cushions, sunshades and object furniture. Products are made in plastics, iron, teak and aluminium.
Marketing Brands include MWH Möbel Ideen, MWH Profiline, Royal Garden (is the brand for exclusive metal furniture), MWH Object and Design (contract furniture), Sonnetex (textile). Garden furniture are made under the Kettler, Herlag and MWH brands.
Distribution channels
The company has direct sales in 4 of its plant. Further the brands Kettler, Herlag and MWH outdoor furniture are distributed in Garden centres, independent specialised retailers and furniture retailers.
The furniture industry in Germany
10/09/2008 R2413.DE
© Copyright CSIL This report is exclusively for consultation on the part of the purchaser. It may not be reproduced in whole or in part by any means whatsoever without the prior written permission of CSIL
38
Holtkamp Group Germany
HEADQUARTERS Holtkamp GmbH + Co MöbelwerkK KG Betonstraße 19 49324 Melle Germany
Tel. +49 5422 7070 Fax +49 5422 707120 www.holtkamp-wohnideen.de e-mail: [email protected]
CONTROLLED COMPANIES, SUBSIDIARIES, OTHER RELATED COMPANIES Meyenburger Möbel GmbH, Märkisch Prignitzer Möbel
ACTIVITY Manufacturer
MAIN PRODUCTION Furniture Specialized: 100% FURNITURE PRODUCT SPECIALISATION Dining-living room, Occasional, Hall
THE COMPANY IS PART OF Holtkamp Gruppe
YEAR OF ESTABLISHMENT 1901 EMPLOYEES 656 TURNOVER EUR 108.3 million
TOTAL EXPORT EUR 62.9 million % EXPORT ON TOTAL TURNOVER 58.1

The furniture industry in Germany
10/09/2008 R2413.DE
© Copyright CSIL This report is exclusively for consultation on the part of the purchaser. It may not be reproduced in whole or in part by any means whatsoever without the prior written permission of CSIL
39
Horstmann Group Germany
HEADQUARTERS Horstmann Group Carl-Severing-Strasse 192 33649 Bielefeld Germany
Tel. +49 521 459901 Fax +49 521 4599123 www.horstmanngroup.de e-mail: [email protected]
BRANDS, TRADEMARKS FDM, Beckermann Küchen, Hofemeier Einbauküchen, Herzküchen, Stallmann and Domina
ACTIVITY Manufacturer
MAIN PRODUCTION Not Furniture Specialized FURNITURE PRODUCT SPECIALISATION RTA - DIY, Kitchen, Dining-living room, Bedroom, Occasional
OTHER PRODUCTION Graphic, Food, Metall Working, IT&DP Industries
THE COMPANY IS PART OF Horstmann
YEAR OF ESTABLISHMENT 1975 EMPLOYEES 3,000 TURNOVER EUR 600 million
History
Horstmann Group, established in 1975 by Jürgen Horstmann in Bielefeld, is a medium-sized group of manufacturing companies with a high degree of diversity.
Today the Group is active through 30 companies in different industry segments: Graphic, Food, Metall Working, IT&DP and, since 1980, also in furniture manufacturing with the kitchen companies FMD, Beckermann Küchen, Hofemeier Einbauküchen and since 2004 the bedroom furniture specialist Stallmann and Domina.
Financial Highlights
In 2006 Horstmann Group recorded a total turnover of about Euro 600 million.
Manufacturing process
The company employed about 3,000 employees in 2006. With regard to the furniture division, it includes the following companies:
- FMD Möbel GmbH was founded by the Horstmann Group in 1980 and since 1993 has specialised in discount RTA furniture for the “Young Living” segment. FMD furniture is manufactured exclusively in Germany. In 2001 the company doubled its production space. In 2007 the firm recorded a total turnover of about Euro 50 million with 155 employees.
- Beckermann Küchen GmbH and Herzküchen GmbH (Cappeln, Germany), both kitchen specialists, were acquired by Horstmann in 1993. Beckermann was first founded in 1886. Today Beckermann Küchen is a medium-sized company with approx. 200 employees. In 2006 Beckermann recorded a turnover of Euro 30 million (+13% on 2005). Exports sales make round 39% of the total turnover. Its main exporting countries are France, USA, UK, Switzerland, the Netherlands and Belgium.
- Hofemeier Einbauküchen was established in 1961 and was taken over by Horstmann in 2001.

The furniture industry in Germany
10/09/2008 R2413.DE
© Copyright CSIL This report is exclusively for consultation on the part of the purchaser. It may not be reproduced in whole or in part by any means whatsoever without the prior written permission of CSIL
40
The Stallmann company which joined the Horstmann group in 2004, produces an extensive range of furniture including beds, lockers with revolving, folding and sliding doors, furnishing accessories, accessible wardrobes and tailor-made bespoke manufacturing.
Domina, acquired by Horstmann group in 1995, manufactures 100% of its furniture in Germany. Production space amounts to 15,000 square metres with 70 employees.

The furniture industry in Germany
10/09/2008 R2413.DE
© Copyright CSIL This report is exclusively for consultation on the part of the purchaser. It may not be reproduced in whole or in part by any means whatsoever without the prior written permission of CSIL
41
Hülsta-Werke Germany
HEADQUARTERS Hülsta-Werke Hüls GmbH & Co KG Karl-Hüls-Strasse 1 48703 Stadtlohn Germany
Tel. +49 2563 861220 ; 861278 Fax +49 2563 861259; 861417 www.huelsta.de e-mail: [email protected]
BRANDS, TRADEMARKS Hülsta, Now by Hülsta
ACTIVITY Manufacturer
MAIN PRODUCTION Furniture Specialized FURNITURE PRODUCT SPECIALISATION Contract, Office, Dining-living room, Bedroom, Children
OTHER PRODUCTION Mattresses
THE COMPANY IS PART OF Hüls Familie Group
YEAR OF ESTABLISHMENT 1940 EMPLOYEES 1,468 TURNOVER EUR 284 million
MANUFACTURING PLANTS 3 LOCATION Stadtlohn, Ottenstein and Heek
DISTRIBUTION CHANNELS All Hülsta brand products are exclusively sold through specialist dealers, both in Germany and abroad.
History
Hülsta-Werke, based in Stadtlohn, Germany, is a manufacturing company.
The company was established in 1940 in Stadtlohn (Westphalia). In 2002 Hülsta took over Omina Möbelwerke Ernst Hilker GmbH.
Financial Highlights
In 2007 Hülsta-Werke recorded a total turnover of Euro 284 million (-4.4% on 2006).
Furniture sales were Euro 284 million (-4.4% on 2006). Investments in tangible assets amounted to approximately Euro 8.5 million, an increase compared to Euro 5.3 million of the previous year.
Manufacturing process
The company employed 1,468 people in 2007.
The company can count on 3 plants in Stadtlohn, Ottenstein and Heek, but it is planning to close, gradually, in the next two years (2008-2009), the Heek plant and to concentrate the production in Ottenstein plant.
Hülsta’s headquarters, the marketing centre as well as showrooms in excess of 6,000 sqm displaying the current Hülsta collection are located in Stadtlohn.
Hülsta belongs to the Hüls Familie Group (Euro 722 million in 2006 compared to Euro 672,3 million in 2005), which includes the following affiliated firms:
Rolf Benz AG has been controlled by the Hüls Family since December 1998 when the Welle Holding AG sold its majority share in the company. Rolf Benz is an upmarket German furniture group. When the company was de-listed from the Stuttgart Stock exchange in November 2000, Rolf Benz converted into an AG & Co KG. Rolf Benz manufactures modern style
The furniture industry in Germany
10/09/2008 R2413.DE
© Copyright CSIL This report is exclusively for consultation on the part of the purchaser. It may not be reproduced in whole or in part by any means whatsoever without the prior written permission of CSIL
42
upholstered furniture for the home. Rolf Benz furniture is entirely manufactured in Germany in Baden Württemberg in 2 different production sites. Total Group turnover in 2007 amounted to slightly over Euro 100 million of which an estimated Euro 76 million exclusively for the Rolf Benz brand. Upholstered furniture represents 80% of total turnover. With local sales decreasing; the export business reached almost 40% of sales. Rolf Benz sells its brand products in over 50 countries, with major markets being the Netherlands (the most dynamic market for Rolf Benz products), Austria and Switzerland. Further the United Kingdom, Eastern Europe and Asia are becoming increasingly important markets for Rolf Benz. Rolf Benz exports its products currently into 61 different countries. In Germany Rolf Benz is today present in over 320 sales points. In Nagold near the company’s head office Rolf Benz has an exclusive showroom. The company employed in 2007 about 550 people. For 2008 the company plans to develop a larger carpet collection.
Ruf Betten, established in 1926, is active in the bedding segment. The company is specialised in manufacturing products for a healthy sleep, especially upholstered beds, lacquer wardrobes and wooden beds in the middle and upper end of the market and represents about 25% of the Groups turnover. Ruf exports to over 50 countries worldwide. Exports increased over the last 5 years from 6% to 16%. The company’s head office is in Rastatt (Germany). Factory area covers 56,000 square metres and the company employs a total of about 200 people.
Arte M is specialised in the production of modern furniture for any sector (except for bathroom and kitchen). The manufacturing base is in Schramberg. It employs about 350 people.
Loddenkemper Group is one of the leading German bedroom furniture manufacturers, but it manufactures also living-dining room furniture and upholstery. The Loddenkemper Group includes also Femira Schlafsysteme GmbH, specialised in the production of mattresses.
Parador manufacturers laminate and wooden floors (675 employees).
Hobb, founded in 1993, specializes in the processing of raw veneers (200 employees).
Halco, specialised in the manufacturing of furniture components (180 employees). Together Halco and Hobb supply Hülsta with around 60% of their production.
Products
Products range from living and dining rooms (40%), to bedrooms and sleeping systems (50%), home office (5%), children’s rooms and office furniture. Hülsta is Germany’s best-known quality brand with a brand recognition exceeding 50%. The collection ranges from middle-lower range furniture up to upper-end furniture.
Marketing In 2007 Hülsta invested 7% of its turnover in advertising.
Distribution channels
All Hülsta brand products are exclusively sold through specialist dealers, both in Germany and abroad.
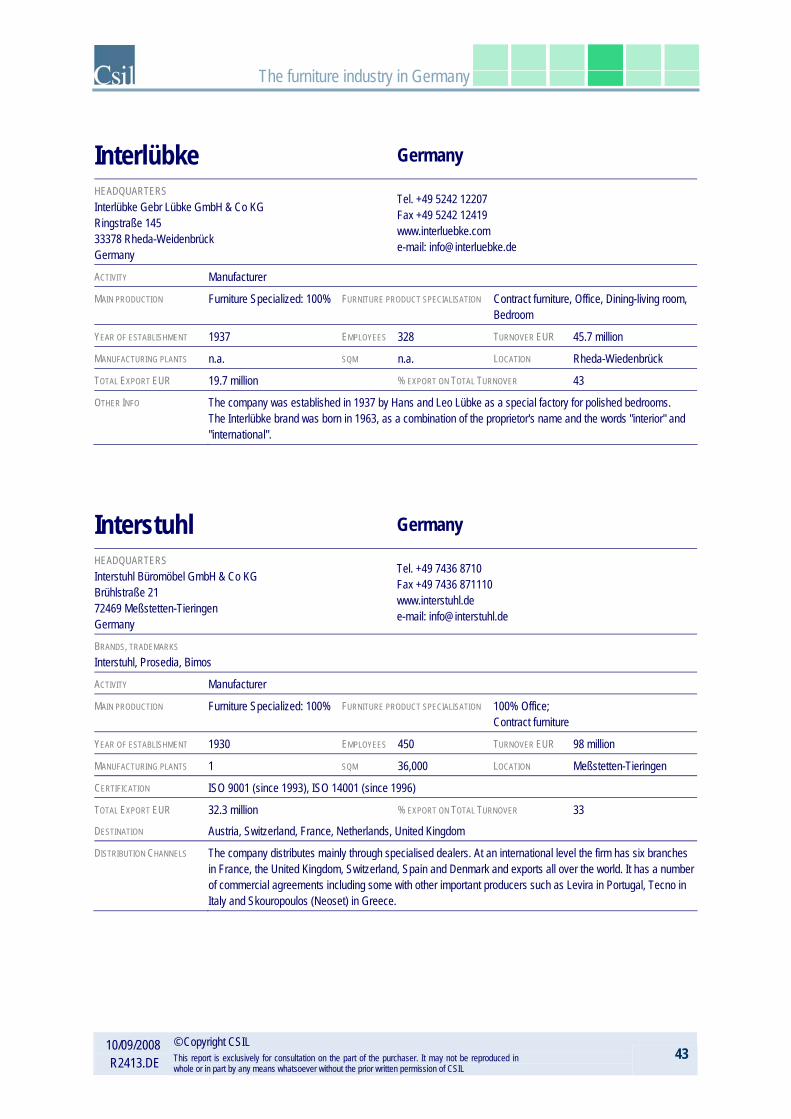
The furniture industry in Germany
10/09/2008 R2413.DE
© Copyright CSIL This report is exclusively for consultation on the part of the purchaser. It may not be reproduced in whole or in part by any means whatsoever without the prior written permission of CSIL
43
Interlübke Germany
HEADQUARTERS Interlübke Gebr Lübke GmbH & Co KG Ringstraße 145 33378 Rheda-Weidenbrück Germany
Tel. +49 5242 12207 Fax +49 5242 12419 www.interluebke.com e-mail: [email protected]
ACTIVITY Manufacturer
MAIN PRODUCTION Furniture Specialized: 100% FURNITURE PRODUCT SPECIALISATION Contract furniture, Office, Dining-living room, Bedroom
YEAR OF ESTABLISHMENT 1937 EMPLOYEES 328 TURNOVER EUR 45.7 million
MANUFACTURING PLANTS n.a. SQM n.a. LOCATION Rheda-Wiedenbrück
TOTAL EXPORT EUR 19.7 million % EXPORT ON TOTAL TURNOVER 43
OTHER INFO The company was established in 1937 by Hans and Leo Lübke as a special factory for polished bedrooms. The Interlübke brand was born in 1963, as a combination of the proprietor's name and the words "interior" and "international".
Interstuhl Germany
HEADQUARTERS Interstuhl Büromöbel GmbH & Co KG Brühlstraße 21 72469 Meßstetten-Tieringen Germany
Tel. +49 7436 8710 Fax +49 7436 871110 www.interstuhl.de e-mail: [email protected]
BRANDS, TRADEMARKS Interstuhl, Prosedia, Bimos
ACTIVITY Manufacturer
MAIN PRODUCTION Furniture Specialized: 100% FURNITURE PRODUCT SPECIALISATION 100% Office; Contract furniture
YEAR OF ESTABLISHMENT 1930 EMPLOYEES 450 TURNOVER EUR 98 million
MANUFACTURING PLANTS 1 SQM 36,000 LOCATION Meßstetten-Tieringen
CERTIFICATION ISO 9001 (since 1993), ISO 14001 (since 1996)
TOTAL EXPORT EUR 32.3 million % EXPORT ON TOTAL TURNOVER 33 DESTINATION Austria, Switzerland, France, Netherlands, United Kingdom
DISTRIBUTION CHANNELS The company distributes mainly through specialised dealers. At an international level the firm has six branches in France, the United Kingdom, Switzerland, Spain and Denmark and exports all over the world. It has a number of commercial agreements including some with other important producers such as Levira in Portugal, Tecno in Italy and Skouropoulos (Neoset) in Greece.

The furniture industry in Germany
10/09/2008 R2413.DE
© Copyright CSIL This report is exclusively for consultation on the part of the purchaser. It may not be reproduced in whole or in part by any means whatsoever without the prior written permission of CSIL
44
Karl Vierhaus GmbH & Co KG Germany
HEADQUARTERS Karl Vierhaus GmbH & Co KG Anholter Strasse 60a 46459 Rees Germany
Tel. +49 2851 8780 Fax +49 2851 8491 www.vierhaus.de e-mail: [email protected]
CONTROLLED COMPANIES, SUBSIDIARIES, OTHER RELATED COMPANIES Möbelwerk Ilse GmbH & Co KG, Pick-Up Mitnahmemöbel GmbH, Rasant
ACTIVITY Manufacturer
MAIN PRODUCTION Furniture Specialized: 100% FURNITURE PRODUCT SPECIALISATION Tables-chairs, Occasional
THE COMPANY IS PART OF Vierhaus Group
YEAR OF ESTABLISHMENT 1908 EMPLOYEES 200 TURNOVER EUR 25 million
OTHER INFO The company belongs to the Vierhaus Group which includes also the following companies, specialized in the manufacturing of coffee tables, chairs, media furniture: - Möbelwerk Ilse GmbH & Co KG, founded in 1890 in Uslar, specialized in the manufacturing of tables for living
rooms and caravans. The company joined the Group in 1990. - Pick-Up Mitnahmemöbel GmbH, founded in 1991, specialized in the manufacturing of coffee tables. - Rasant, which is the specialist for quantity buyers like dispatchers etc.
Keuco GmbH & Co KG Germany
HEADQUARTERS Keuco GmbH & Co KG Postfach 1365 58653 Hemer Germany
Tel. +49 2372 9040 Fax +49 2372 9047266 www.keuco.de e-mail: [email protected]
ACTIVITY Manufacturer
MAIN PRODUCTION Furniture Specialized FURNITURE PRODUCT SPECIALISATION Bathroom OTHER PRODUCTION Sanitary fittings
YEAR OF ESTABLISHMENT 1953 EMPLOYEES 427 TURNOVER EUR 72 million

The furniture industry in Germany
10/09/2008 R2413.DE
© Copyright CSIL This report is exclusively for consultation on the part of the purchaser. It may not be reproduced in whole or in part by any means whatsoever without the prior written permission of CSIL
45
Koinor Germany
HEADQUARTERS Koinor Polstermöbel GmbH & Co KG Postfach 1229 96247 Michelau, Ofr. Germany
Tel. +49 9571 8920 , 892227 ; 892323 Fax +49 9571 83703 ; 83310 www.koinor.com ; loft-by-koinor.com e-mail: [email protected] ; [email protected]
ACTIVITY Manufacturer
MAIN PRODUCTION Furniture Specialized: 100% FURNITURE PRODUCT SPECIALISATION Upholstery, Tables-chairs, Textiles
YEAR OF ESTABLISHMENT n.a. EMPLOYEES 480 TURNOVER EUR 72 million
TOTAL EXPORT EUR 21.6 million % EXPORT ON TOTAL TURNOVER 30 DESTINATION Major export markets include Switzerland, Austria and the Netherlands.

The furniture industry in Germany
10/09/2008 R2413.DE
© Copyright CSIL This report is exclusively for consultation on the part of the purchaser. It may not be reproduced in whole or in part by any means whatsoever without the prior written permission of CSIL
46
König & Neurath Germany
HEADQUARTERS König & Neurath AG Industriestraße 1-3 61184 Karben Germany
Tel. +49 6039 483-245 Fax +49 6039 483-508 www.koenig-neurath.de e-mail: [email protected]
ACTIVITY Manufacturer
MAIN PRODUCTION Furniture Specialized: 100% FURNITURE PRODUCT SPECIALISATION 100% Office
YEAR OF ESTABLISHMENT 1925 EMPLOYEES 1,100 TURNOVER EUR 150 million
MANUFACTURING PLANTS 3 SQM 150,000 LOCATION in Karben/Frankfurt am Main, Weißensee/Thuringia and Saarwellingen
TOTAL EXPORT EUR 37.5 million % EXPORT ON TOTAL TURNOVER 25
DISTRIBUTION CHANNELS In Spain, Portugal, the USA, Mexico and Australia, the market is covered by licence partnerships. König + Neurath is also represented in the Far East, with licence partnerships in Indonesia and Thailand, as well as reciprocal trade agreements in China's major cities, Singapore, Malaysia and the Philippines.
History
König + Neurath was established in Karben near Frankfurt in 1925.
It is today a traditional family enterprise and is one of the leading office furniture manufacturers in Europe.
The Company’s head office and administration is in Karben near Frankfurt.
Financial Highlights
In 2007 König + Neurath recorded a total turnover of Euro 150 million (+18% on 2006). About 25% came from exports.
Manufacturing process
The company employed 1,100 people in 2007.
König + Neurath office furniture is manufactured into the production sites in Karben/Frankfurt am Main (73,200 square metres for chair and furniture manufacture), Weißensee/Thuringia (22,500 square metres production space for furniture manufacture) and Saarwellingen (12,000 square metres for metal processing and furniture manufacture).
Products
Over the past 25 years K+N has become established as a supplier of office furniture systems, partitions/storage walls and seating. The product collection includes both wooden and steel furniture. In 2007 construction was completed on a new production plant near to the firm’s main factory (Karben) which offers a total productive area of 150,000 square metres.
Marketing
To reinforce its market position abroad, König + Neurath has five showrooms and three commercial branches in the United Kingdom, Switzerland and the Netherlands.
The furniture industry in Germany
10/09/2008 R2413.DE
© Copyright CSIL This report is exclusively for consultation on the part of the purchaser. It may not be reproduced in whole or in part by any means whatsoever without the prior written permission of CSIL
47
In addition, there are co-operation agreements with partner dealerships in almost every country in Western Europe, as well as several in Eastern Europe (Belgium, Denmark, Greece, Iceland, Italy, Luxembourg, Norway, Austria, Poland, Switzerland, the Czech and Slovak Republics, Turkey and Hungary) and the Middle East.
Distribution channels
In Spain, Portugal, the USA, Mexico and Australia, the market is covered by licence partnerships.
König + Neurath is also represented in the Far East, with licence partnerships in Indonesia and Thailand, as well as reciprocal trade agreements in China's major cities, Singapore, Malaysia and the Philippines.
The furniture industry in Germany
10/09/2008 R2413.DE
© Copyright CSIL This report is exclusively for consultation on the part of the purchaser. It may not be reproduced in whole or in part by any means whatsoever without the prior written permission of CSIL
48
Maja-Werk Manfred Jarosch GmbH Germany
HEADQUARTERS Maja-Werk Manfred Jarosch GmbH Postfach 7 Kasendorf Germany
Tel. +49 9228 790 Fax +49 9228 5171 www.maja-moebel.de e-mail: [email protected]
ACTIVITY Manufacturer
MAIN PRODUCTION Furniture Specialized: 100% FURNITURE PRODUCT SPECIALISATION RTA - DIY, Occasional, Small storage furniture (entrance hall furniture, CD Holders), TV tables and home office
YEAR OF ESTABLISHMENT 1964 EMPLOYEES 450 TURNOVER EUR 63.2 million
MANUFACTURING PLANTS 2 SQM 58,900 LOCATION Kasendorf, Wittichenau
TOTAL EXPORT EUR 29.7 million % EXPORT ON TOTAL TURNOVER 47
DISTRIBUTION CHANNELS Products are distributed through large specialist chains (Höffner)
OTHER INFO In 2008 the company has been acquired by MMB Verwaltungs GmbH, located in München.
Nobilia Germany
HEADQUARTERS Nobilia - Werke J Stickling GmbH & Co Waldstraße 53-57 33415 Verl Germany
Tel. +49 5246 5080 Fax +49 5246 50896999 www.nobilia.de ; www.noblessa.de e-mail: [email protected]
BRANDS, TRADEMARKS Nobilia, Noblessa
ACTIVITY Manufacturer
MAIN PRODUCTION Furniture Specialized: 100% FURNITURE PRODUCT SPECIALISATION 100% Kitchen
YEAR OF ESTABLISHMENT 1945 EMPLOYEES 1908 TURNOVER EUR 650.7 million
MANUFACTURING PLANTS 2 SQM 160,000
LOCATION 2 factories in Verl (110,000 sqm for the Verl-Sürenheide factory; 50,000 sqm for the Verl-Kaunitz one)
CERTIFICATION ISO 9001:2000; ISO 14001GS; "Golden M" of DGM, Deutsche Gütegemeinschaft Möbel
OUTPUT 420,000 kitchens per year; 2,000 kitchens per day; 20,000 types per day; 5,000 electrical appliances per day
TOTAL EXPORT EUR 216 million % EXPORT ON TOTAL TURNOVER 33.2 DESTINATION France (27% of total exports), Belgium (18%), Austria (17%), Netherlands (9%), Spain (6%), Sweden (5%)

The furniture industry in Germany
10/09/2008 R2413.DE
© Copyright CSIL This report is exclusively for consultation on the part of the purchaser. It may not be reproduced in whole or in part by any means whatsoever without the prior written permission of CSIL
49
Nolte Group Germany
HEADQUARTERS Nolte Moebel-industrie Holding GmbH & Co KG Konrad-Nolte-Straße 20 76726 Germersheim Germany
Tel. +49 7274 51233 Fax +49 7274 51555 www.nolte.de e-mail: [email protected]
CONTROLLED COMPANIES, SUBSIDIARIES, OTHER RELATED COMPANIES Nolte Küchen, Nolte Möbel, CS Schmalmöbel, Drum, Express, Nolte Holzwerkstoff
BRANDS, TRADEMARKS CS Schmal, Drum Systeme, Express, Nolte Germersheim, Nolte Holzwerkstoffe, Nolte Küchen
ACTIVITY Manufacturer
MAIN PRODUCTION Furniture Specialized: 93,5% FURNITURE PRODUCT SPECIALISATION RTA - DIY, Office, Kitchen, Dining-living room, Bedroom, Children, Occasional
OTHER PRODUCTION Chipboard (6%)
THE COMPANY IS PART OF Nolte Group
YEAR OF ESTABLISHMENT 1923 EMPLOYEES 2,934 TURNOVER EUR 569.9 million
MANUFACTURING PLANTS 4 SQM 453,000 LOCATION Germersheim, Löhne, Waldmohr
TOTAL EXPORT EUR 166.6 million % EXPORT ON TOTAL TURNOVER 29.2
History
Nolte Group, based in Germersheim, Germany, is a manufacturing company.
The Company was established in 1923 by George Nolte as a manufacturing polishing wheels in the Westphalian town of Rheda. The Company then began building furniture during the 1930s. The acquisition of a small furniture factory in Delbrück in 1932 was followed in 1937 by the founding of a second plant in Brilon. George Nolte’s son Konrad took the helm of the company in Rheda in 1945. In 1947 the Nolte Group was strategically expanded. Konrad Nolte implemented an assembly line, this was pioneering work that revolutionized the entire furniture industry. The foundation for the Germersheim plant was laid in 1956. Its initial role was as a supplier of plywood boards. From 1960 kitchens were produced in the Löhne factory and just two years later bedroom production was started in Germersheim. Further production lines for wardrobes with sliding doors and a range of system wardrobes were added at the end of the 1970s completing the product range. An additional chipboard plant was then founded in Germersheim. The next strategic move followed in 1995, with the acquisition of CS Schmalmöbel - the European leader in flat-pack furniture. In September 1999 the Nolte Holding took this business over as Drum GmbH & Co KG. In 2005 Ada and Nolte Germersheim started to work together on a new project. Nolte manufactures wardrobes and Ada beds, bases and mattresses for the new Joop! bedroom collection.
Financial Highlights
In 2006 Nolte Group recorded a total turnover of Euro 569.9 million (+5.7% on 2005). Furniture sales were Euro 533.1 million (+6.2% on 2005). Furniture sales on the domestic market were Euro 384.1 million (+6.2% on 2005).

The furniture industry in Germany
10/09/2008 R2413.DE
© Copyright CSIL This report is exclusively for consultation on the part of the purchaser. It may not be reproduced in whole or in part by any means whatsoever without the prior written permission of CSIL
50
Manufacturing process
The company employed 2,934 people in 2006 (+2% on 2005). The company can count on 4 plants in Germersheim, Löhne, Waldmohr. The Nolte Germersheim production site covers 160,000 square metres.
The Group includes the following companies: Nolte Küchen (Löhne), Nolte Möbel (Germersheim), CS Schmalmöbel (Waldmohr), Drum (Waldmohr), Express (Germersheim) and Nolte Holzwerkstoff (Germersheim).
- Nolte Küchen is a manufacturer of fitted kitchens in the mid-range segment. Nolte’s kitchen furniture ranges from a classical to modern styles. The company’s logistics centre is based in Melle. Production facilities are based in Löhne and Melle. The total production area covers 77,000 square metres. The company employed 1,036 people in 2006. Total sales amounted to Euro 285 million in 2006 with approximately 20% coming from exports. Products are distributed through specialist retailers only.
- Nolte Möbel recorded a turnover of around Euro 120.4 million. The company employs around 840 people and manufactures bedroom furniture and system wardrobes.
- CS Schmal was acquired by the Nolte Group in 1995 and is based in Waldmohr. CS Schmal is one of the market leaders in RTA furniture. Its production facility covers 210,000 square metres. The company manufactures up to 24,000 pieces per day with more than 500 employees. Total sales amount to around Euro 100 million. The company exports around 33% of its production.
- Drum Systeme was purchased by the Nolte Group in 1999. One of the company’s featured products is its transparent partitioning system. The company operates a 6,000 square metre manufacturing facility in Waldmohr, near Kaiserslautern. Orders are received from all over Europe and sometimes the rest of the world. Drum employs around 60 people and its turnover is about Euro 10.5 million.
- Express take-away furniture is the latest member of the Nolte Group. Founded in 2000, it is a specialist producer of standardized, ready-to-assemble stand-alone cabinets. The acquisition has enabled Nolte to participate in a market niche that the company was unable to service from its existing product portfolio.
The furniture industry in Germany
10/09/2008 R2413.DE
© Copyright CSIL This report is exclusively for consultation on the part of the purchaser. It may not be reproduced in whole or in part by any means whatsoever without the prior written permission of CSIL
51
Oeseder Möbel-Industrie Mathias Wiemann GmbH & Co KG
Germany
HEADQUARTERS Oeseder Möbel-Industrie Mathias Wiemann GmbH & Co KG Postfach 1460 Georgsmarienhütte Germany
Tel. +49 5401 8520 Fax +49 5401 852104 www.wiemann.siteassistant-cms.net e-mail: [email protected]
ACTIVITY Manufacturer
MAIN PRODUCTION Furniture Specialized: 100% FURNITURE PRODUCT SPECIALISATION Bedroom
YEAR OF ESTABLISHMENT 1900 EMPLOYEES 373 TURNOVER EUR 72.7 million
MANUFACTURING PLANTS 1 SQM 48,000 LOCATION Georgsmarienhütte
TOTAL EXPORT EUR 25.4 million % EXPORT ON TOTAL TURNOVER 35 DESTINATION European Union, Eastern Europe, Middle East
Palmberg Germany
HEADQUARTERS Palmberg Büroeinrichtugen & Service GmbH Am Palmberg 9 23923 Schönberg Germany
Tel. +49 38828 380 Fax +49 38828 38136 www.palmberg.de e-mail: [email protected]
ACTIVITY Manufacturer
MAIN PRODUCTION Furniture Specialized: 100% FURNITURE PRODUCT SPECIALISATION 100% Office
YEAR OF ESTABLISHMENT 1926 EMPLOYEES 382 TURNOVER EUR 55 million
MANUFACTURING PLANTS 1 SQM 15,000 LOCATION Schönberg
CERTIFICATION ISO 9001, ISO 14001
TOTAL EXPORT EUR 5.5 million % EXPORT ON TOTAL TURNOVER 10 DESTINATION Netherlands, Belgium, Switzerland
DISTRIBUTION CHANNELS The company ditributes through a network of specialised dealers
OTHER INFO When the company started its activity the attention was directed to the production of high-grade living-room cabinets. In 1951 the factory was nationalized. In the seventies it first became part of the combined collective “Möbelkombinat Nord” and a few years later of the Schwerin furniture works “Möbelwerk Schwerin”. The emphasis was put on the production of bedroom furniture. After the political change the former Palmberg Möbel GmbH was extracted from the Schwerin works in September 1990, in order to start the company´s future with the manufacturing of office furniture. On 1 September 1991 – after tough negotiations with the trust company “Treuhand” – Palmberg was definitively privatized. The nineties can be considered to be the years of a constantly increasing number of employees and especially the time of an active investment expenditure. The range of products was enlarged, in 1992 the distribution was extended, and at the same time machines and equipment were modernized. In 1996 the integrated management system according to DIN EN ISO 9001 (quality), DIN EN ISO 14001 (environment) and the European EC-ECO-AUDIT regulation was successfully certificated.

The furniture industry in Germany
10/09/2008 R2413.DE
© Copyright CSIL This report is exclusively for consultation on the part of the purchaser. It may not be reproduced in whole or in part by any means whatsoever without the prior written permission of CSIL
52
Paschen & Companie GmbH & Co KG Germany
HEADQUARTERS Paschen & Companie GmbH & Co KG Postfach 1240 59392 Wadersloh Germany
Tel. +49 2523 280 Fax +49 2523 1091 www.paschen.de e-mail: [email protected]
ACTIVITY Manufacturer
MAIN PRODUCTION Furniture Specialized: 100% FURNITURE PRODUCT SPECIALISATION RTA - DIY, Contract, Dining-living room (libraries)
YEAR OF ESTABLISHMENT 1883 EMPLOYEES 200 TURNOVER EUR 40 million
OUTPUT About 15,000 libraries per year
TOTAL EXPORT EUR 10 million % EXPORT ON TOTAL TURNOVER 25 DESTINATION France, Russia, UK
OTHER INFO The company was established in 1883 by Carl Paschen in Hamburg as a factory for fine cut veneers. Thecompany specialised in fine cigar boxes made from these woods. The company is a family-run business that is now in the 5th generation. It has a workforce of 200 people. Paschen developed its first successful bookshelf systems in the 1970s. But the idea of making them into truelibraries, of truly setting ourselves apart, had to wait until 1990. It was then that the firm began producing theOriginal Paschen Library, the “prototype library,” which all later product lines were based on.
Poggenpohl Germany
HEADQUARTERS Poggenpohl Möbelwerke GmbH Poggenpohlstraße 1 32051 Herford Germany
Tel. +49 5221 3810 Fax +49 5221 381208 www.poggenpohl.de e-mail: [email protected]
RELATED COMPANIES EWE Küchen GmbH, FM Küchen GmbH, Gower Furniture Ltd, HTH Køkkener A/S, Hygena Cuisines, Invita Køkkener A/S, Magnet Ltd, Marbodal AB, Myresjökök AB, Norema AS, Novart Oy, Optifit Jaka Möbel GmbH, Pronorm Einbauküchen GmbH, Sigdal Kjøkken AS, Uno Form
ACTIVITY Manufacturer
MAIN PRODUCTION Furniture Specialized: 100% FURNITURE PRODUCT SPECIALISATION 100% Kitchen
THE COMPANY IS PART OF Nobia (turnover: Euro 1,795 mn, more details in the Swedish section of the report) Other German firms, part of Nobia: Optifit (turnover: Euro 52.4 million), Pronorm (turnover: Euro 62.9 million), Michael Marquardt (acquired in 2007)
YEAR OF ESTABLISHMENT 1892 EMPLOYEES 525 TURNOVER EUR 124 million
TOTAL EXPORT EUR 93 million % EXPORT ON TOTAL TURNOVER 75
DISTRIBUTION CHANNELS Poggenpohl now has a worldwide total of 31 sales studios of its own in parallel with approximately 420 dealer-run kitchen studios, including 140 exclusive to this brand. Another 40 to 60 own showrooms will be establishedin the next four years, in large cities, primarily in Europe and the US.
OTHER INFO Poggenpohl manufactures kitchens in the premium price segment that are sold throughout the world.

The furniture industry in Germany
10/09/2008 R2413.DE
© Copyright CSIL This report is exclusively for consultation on the part of the purchaser. It may not be reproduced in whole or in part by any means whatsoever without the prior written permission of CSIL
53
Rauch Germany
HEADQUARTERS Rauch Möbelwerke GmbH Wendelin Rauch Straße 97893 Freudenberg Germany
Tel. +49 9375 810 Fax +49 9375 81700 www.rauchmoebel.de e-mail: [email protected]
CONTROLLED COMPANIES, SUBSIDIARIES, OTHER RELATED COMPANIES Steffen
BRANDS, TRADEMARKS Dialog, Pack’s, Select-Art
ACTIVITY Manufacturer
MAIN PRODUCTION Furniture Specialized: 100% FURNITURE PRODUCT SPECIALISATION Dining-living room, Bedroom, Children, Occasional
THE COMPANY IS PART OF Rauch Möbelwerke
YEAR OF ESTABLISHMENT 1897 EMPLOYEES 1224 TURNOVER EUR 205 million
MANUFACTURING PLANTS 2 SQM 150,000 LOCATION Freudenberg and Bürgstadt
TOTAL EXPORT EUR 82 million % EXPORT ON TOTAL TURNOVER 40
DISTRIBUTION CHANNELS Rauch works exclusively on a made-to-order basis and every year, over 8 million packages are delivered to 5,000 furniture customers. In 2007 Rauch has opened a new showroom centre on an area of 4,000 square metres.
History
Rauch Möbelwerke GmbH, based in Freudenberg, Germany, is a manufacturing company.
The company was established in 1897. In 1999 Rauch took over a part of Steffen AG in Mastershausen in order to increase its capacity in the bedroom segment. Finally in 2004 the Rauch family took over the whole of Steffen GmbH, Mastershausen.
Financial Highlights
In 2006 Rauch recorded a total turnover of Euro 205 million.
Furniture sales were Euro 205 million. Approximately 40% of turnover comes from exports.
Manufacturing process
The company employed 1,224 people in 2006.
The company can count on 2 plants in Freudenberg and Bürgstadt, occupying a total area of 150,000 sqm.
Products
The company specializes in the manufacture of RTA bedrooms, wardrobes, occasional furniture and youth room furniture.
The furniture industry in Germany
10/09/2008 R2413.DE
© Copyright CSIL This report is exclusively for consultation on the part of the purchaser. It may not be reproduced in whole or in part by any means whatsoever without the prior written permission of CSIL
54
Rohde Group Germany
HEADQUARTERS Rohde Büromöbelwerk Gewerbegebiet Auf dem Acker 3 31595 Steyerberg Germany
Tel. +49 5764 29931 Fax +49 5764 29955 www.rohde-grahl.com e-mail: [email protected]
ACTIVITY Manufacturer
MAIN PRODUCTION Furniture Specialized: 100% FURNITURE PRODUCT SPECIALISATION 100% Office; Contract furniture
YEAR OF ESTABLISHMENT n.a. EMPLOYEES 260 TURNOVER EUR 30 million
MANUFACTURING PLANTS 2 SQM 45,000 LOCATION Steyerberg and Steyerberg-Voigtei
TOTAL EXPORT EUR 8.5 million % EXPORT ON TOTAL TURNOVER 28.3 DESTINATION Netherlands, Middle East
OTHER INFO Rohde Group is a German group that comprises Eron (office seating and special furnishings for hospitals) and Grahl (office furniture and seating). It makes sizeable quotas of sales in the Netherlands (about 17%), where its market share increased after Grahl joined the group (it has a branch in the Netherlands), and in the Middle East (15% of sales). The range of products offered is very wide: office seating makes up about 67% of turnover, followed by operative systems (12%), filing and office storage (14.4%), the rest comprises executive offices, walls and furnishings for communal areas.
Röhr Germany
HEADQUARTERS Röhr GmbH & Co Dammstr. 32 33397 Rietberg-Mastholte Germany
Tel. +49 2944 9810 Fax +49 2944 981362 www.roehr-bush.de e-mail: [email protected]
ACTIVITY Manufacturer
MAIN PRODUCTION Furniture Specialized: 100% FURNITURE PRODUCT SPECIALISATION RTA - DIY, Office, Bedroom, Children
THE COMPANY IS PART OF Bush
YEAR OF ESTABLISHMENT 1953 EMPLOYEES 350 TURNOVER EUR 50 million
MANUFACTURING PLANTS 5 SQM 130,000 LOCATION 4 in Rietberg-Mastholte and 1 in Salzkotten-Mantinghausen
OUTPUT 40,000 Children’s rooms, 30,000 office systems
TOTAL EXPORT EUR 10 million % EXPORT ON TOTAL TURNOVER 20
DISTRIBUTION CHANNELS The main distribution channels are buying associations (over 60%) and furniture chains, but the firm also sells via mail order.
OTHER INFO In June 1997, Bush Industries, a leading producer of home furniture and especially RTA furniture in the UnitedStates, acquired a 51% equity interest in the Röhr Gruppe. In 2000 Bush acquired the remaining 49% of RöhrGruppe. In 2007 the firm changed its old name Röhr-Bush into Röhr, but still belongs to Bush Industries.

The furniture industry in Germany
10/09/2008 R2413.DE
© Copyright CSIL This report is exclusively for consultation on the part of the purchaser. It may not be reproduced in whole or in part by any means whatsoever without the prior written permission of CSIL
55
Samas Deutschland Germany
HEADQUARTERS Samas Deutschland GmbH & Co KG Mainzer Straße 183 67547 Worms Germany
Tel. +49 6241 40030 Fax +49 6241 4003281 www.samas.com
RELATED COMPANIES Erco Interieurbouw B.V., Samas België NV, Samas GmbH & Co. KG, Samas Office GmbH, Drabert GmbH, Fortschritt GmbH, Märkische Büromöbelwerke Trebbin GmbH, Schärf Büromöbel GmbH, Nick Metallbau, Samas UK Ltd, Samas France, Samas Office, Roneo, Sansen, Sitag AG (CH), Samas Hungaria Irodabútor Kft., TUSbuero (Uzbekistan), Samas Office Polska sp. z o. o., Samas Romania, Samas Slovakia spol. s r.o., Samas Ceska Republika spol. s r.o.
BRANDS, TRADEMARKS Samas, Märkische Büromöbelwerke, Schärf, Fortschritt, Falpro, Roneo, Sansen, Martin Stoll, Sitag
ACTIVITY Manufacturer
MAIN PRODUCTION Furniture Specialized: 100% FURNITURE PRODUCT SPECIALISATION Office
THE COMPANY IS PART OF Samas (turnover: Euro 352.4 mn, more details in the Dutch section of the report)
YEAR OF ESTABLISHMENT n.a. EMPLOYEES n.a. TURNOVER EUR 137 million
Other info
The Dutch multinational Samas is the leader of the German office furniture market. The Group is structured into a number of divisions. Sales in Germany in 2007 are estimated to amount to around Euro 137 million, equivalent to 39% of total turnover. This market is the most important for the Group from the point of view of both sales and production. Recent years have witnessed a period of difficult transition with considerable productive reorganisation, the closure of plants and reductions in the workforce. In 2007 the “Martin Stoll” factory in Waldshut was completely closed and its production of seating concentrated in Minden (Sitag Sitzmöbel GmbH) and at the Schaerf-ROVI factory in the Czech Republic.
Samas is active in Germany with the following structure:
- the Office Furniture division comprises four companies. Fortschritt (who divested itself of its factory in Freiburg and incorporated production into its Trebbin plant) produces exclusive furnishing elements for offices in wood, some of them with fine veneer finishings. Schärf, in Worms, covers the middle range of the market for wood furniture. Märkische Büro Werke (MBT) in Trebbin is active in the middle-economic range of the wooden office furniture market. All three firms exclusively supply the German market. Nick is the local supplier of metal components for all three firms.
- the Office Seating division in Germany also has four firms. Drabert in Minden concentrates on the middle market range with traditional and classical styles. The activities of Sitag are split between two firms. Production is carried out in Sennwald, Switzerland, where the firm produces seating and a compact line of exclusive furniture for reception rooms for the Swiss market. Sitag’s sales offices are in Minden, Germany. In Waldshut Martin Stoll produces and sells mainly for the classic segment at the upper-end. The commercial network is managed by Samas-Office.

The furniture industry in Germany
10/09/2008 R2413.DE
© Copyright CSIL This report is exclusively for consultation on the part of the purchaser. It may not be reproduced in whole or in part by any means whatsoever without the prior written permission of CSIL
56
Schüller Germany
HEADQUARTERS Schüller Möbelwerk KG Rother Straße 1 91567 Herrieden Germany
Tel. +49 9825 830 Fax +49 9825 83121 www.schueller.de ; www.next125.de ; www.nxline.de e-mail: [email protected]
BRANDS, TRADEMARKS Creative, Next125, Nexline
ACTIVITY Manufacturer
MAIN PRODUCTION Furniture Specialized: 100% FURNITURE PRODUCT SPECIALISATION Kitchen
YEAR OF ESTABLISHMENT 1937 EMPLOYEES 710 TURNOVER EUR 210 million
MANUFACTURING PLANTS n.a. SQM 180,000 LOCATION n.a.
CERTIFICATION ISO 9001:2000
TOTAL EXPORT EUR 39.9 million % EXPORT ON TOTAL TURNOVER 19
DISTRIBUTION CHANNELS Kitchen specialists (50%), Furniture retailers (independent)(50%)

The furniture industry in Germany
10/09/2008 R2413.DE
© Copyright CSIL This report is exclusively for consultation on the part of the purchaser. It may not be reproduced in whole or in part by any means whatsoever without the prior written permission of CSIL
57
Sedus Group Germany
HEADQUARTERS Sedus Stoll AG Postfach 1942 79761 Waldshut Germany
Tel. +49 7751 84231 ; 84402 Fax +49 7751 84335 www.sedus.de e-mail: [email protected]
CONTROLLED COMPANIES, SUBSIDIARIES, OTHER RELATED COMPANIES Kloeber GmbH, Gesika
ACTIVITY Manufacturer
MAIN PRODUCTION Furniture Specialized: 100% FURNITURE PRODUCT SPECIALISATION 100% Office
THE COMPANY IS PART OF Sedus Stoll AG
YEAR OF ESTABLISHMENT 1871 EMPLOYEES 1,102 TURNOVER EUR 149 million
MANUFACTURING PLANTS 2 SQM n.a. LOCATION Waldshut and Geseke
TOTAL EXPORT EUR 49.2 million % EXPORT ON TOTAL TURNOVER 33
DISTRIBUTION CHANNELS Its showrooms are located in Germany (Waldshut, Geseke, Berlin, Hannover, Frankfurt), Italy (Lurate Caccivio near Como), United Kingdom (London), France (Paris), Netherlands (Rotterdam), Spain (Madrid), Austria (Wien) and Belgium (Wetteren).
History
Sedus Group, based in Waldshut, Germany, is a manufacturing company.
Sedus Stoll AG was founded in 1871, and in 1995 it was transformed into Sedus Stoll Aktiengesellschaft, a public limited company. Sedus Stoll is specialised in the manufacture of upper-middle range office seating, conference furniture, healthy back furniture and multipurpose chairs. The headquarters have been in Waldshut/Dogern in Southern Germany since 1871.
In 1999 the Group acquired the majority share of office furniture manufacturer Kloeber GmbH, Überlingen.
In 2002 Sedus Stoll AG made a worldwide licence agreement with Knoll Inc, New York.
Also in 2002 the company merged with Gesika Büromöbelwerk GmbH.
Financial Highlights
In 2007 Sedus Group recorded a consolidated turnover of Euro 149 million (+7.2% on 2006).
Furniture sales on the domestic market were Euro 99.8 million (+26% on 2006).
Manufacturing process
The group employed 1,102 people in 2007 (+ 14% on 2006).
The company can count on 2 plants: one in Waldshut and the other in Geseke.
Over the course of 2007 the group acquired a majority stake in the Planbüro Group, based in Cologne and founded Transform Consult GmbH. In 2008 Gesika Büromöbelwerk GmbH became Sedus Systems GmbH. Thus the group is currently made up of:

The furniture industry in Germany
10/09/2008 R2413.DE
© Copyright CSIL This report is exclusively for consultation on the part of the purchaser. It may not be reproduced in whole or in part by any means whatsoever without the prior written permission of CSIL
58
- Sedus Stoll AG, with a production plant in Waldshut
- Sedus System GmbH (ex Gesika) with a production plant in Geseke.
- Kloeber.
The group also has eight subsidiaries in Europe. 2009 will see the completion of the extension to the headquarters that will include a new R&D department, for a total investment of Euro 7 million.
Distribution channels
Its showrooms are located in Germany (Waldshut, Geseke, Berlin, Hannover, Frankfurt), Italy (Lurate Caccivio near Como), United Kingdom (London), France (Paris), Netherlands (Rotterdam), Spain (Madrid), Austria (Wien) and Belgium (Wetteren).
In May 2008 it opened a new showroom in Munich.

The furniture industry in Germany
10/09/2008 R2413.DE
© Copyright CSIL This report is exclusively for consultation on the part of the purchaser. It may not be reproduced in whole or in part by any means whatsoever without the prior written permission of CSIL
59
SIEGER GmbH + Co Germany
HEADQUARTERS SIEGER GmbH + Co Postfach 60 77837 Lichtenau Germany
Tel. +49 7227 5090 Fax +49 7227 509164 www.sieger-gmbh.de e-mail: [email protected]
ACTIVITY Manufacturer
MAIN PRODUCTION Furniture Specialized: 100% FURNITURE PRODUCT SPECIALISATION Tables-chairs, Garden, outdoor
YEAR OF ESTABLISHMENT 1925 EMPLOYEES 295 TURNOVER EUR 23.3 million
MANUFACTURING PLANTS 1 SQM n.a. LOCATION Lichtenau
OTHER INFO Sieger is one of the leading outdoor furniture brands in Germany and on the European market. For many yearsSieger products have been manufactured and designed in the company’s factory in Lichtenau near the town ofBaden-Baden. Contrarily to other German companies, branded quality "made in Germany" has always been aguideline of the company's philosophy. The company has two furniture collections "Sieger exclusiv" and "Sieger"outdoor furniture. Sieger Exclusive includes resin garden furniture, aluminium garden furniture combined with synthetic Textilux fabric, teak wood or Yellow Balau wood or Solana wickerwork and tables with table tops madefrom Polytec, mineral marble, teak, glass or mecalit-pro. Sieger includes resin garden furniture, steel tube garden and camping furniture, aluminium garden furniture.
SieMatic Germany
HEADQUARTERS SieMatic GmbH & Co August Siekmann Straße 1-5 32584 Löhne Germany
Tel. +49 5732 670 ; 671 Fax +49 5732 67297 www.siematic.com e-mail: [email protected]
BRANDS, TRADEMARKS SieMatic
ACTIVITY Manufacturer
MAIN PRODUCTION Furniture Specialized: 100% FURNITURE PRODUCT SPECIALISATION Kitchen
YEAR OF ESTABLISHMENT 1929 EMPLOYEES 600 TURNOVER EUR 157.5 million
MANUFACTURING PLANTS n.a. SQM 63,000 LOCATION n.a.
DISTRIBUTION CHANNELS SieMatic realises around 80% of its turnover through specialist retailers (distributing exclusively SieMaticproducts). Its future objective is to reach 100%. In 2006 the company opened a new showroom in Dubai. In general the shops are around 150 square metres and display at least 6 models. In summer 2007 SieMatic announced further growth of its UK dealershipbase with four new stores.
The furniture industry in Germany
10/09/2008 R2413.DE
© Copyright CSIL This report is exclusively for consultation on the part of the purchaser. It may not be reproduced in whole or in part by any means whatsoever without the prior written permission of CSIL
60
Steelcase Werndl AG Germany
HEADQUARTERS Steelcase Werndl AG Georg Aicher Straße 7 83026 Rosenheim Germany
Tel. +49 8031 4050 Fax +49 8031 405100 www.werndl.de e-mail: [email protected]
ACTIVITY Manufacturer
MAIN PRODUCTION Furniture Specialized: 100% FURNITURE PRODUCT SPECIALISATION 100% Office
THE COMPANY IS PART OF Steelcase (turnover: Euro 606.4 mn, more details in the French section of the report)
YEAR OF ESTABLISHMENT 1998 EMPLOYEES 735 TURNOVER EUR 123.2 million
OTHER INFO Werndl Büromöbel AG was founded in Rosenheim in 1895. In 1998 Steelcase acquired Werndl Büromöbel AGthat was transformed into Steelcase Werndl AG. The investment gave the firm important productive support thatallowed for continuous development of sales. Steelcase is present in Germany with a sizeable market share (4.9% in 2007).

The furniture industry in Germany
10/09/2008 R2413.DE
© Copyright CSIL This report is exclusively for consultation on the part of the purchaser. It may not be reproduced in whole or in part by any means whatsoever without the prior written permission of CSIL
61
Steinhoff Germany
HEADQUARTERS Steinhoff International Holdings Ltd PO Box 1955 2018 Bramley South Africa
Tel: +27 11 4453000 Fax: +27 11 4453135 www.steinhoffinternational.com e-mail: [email protected]
BRANDS, TRADEMARKS Alpine Lounge, Andante, Atelier, Bakker & Steyger, Bayswiss, Beechfurn, Bensons for Beds, Bison Bord, Bruno Steinhoff, Cargo,Collection, Capt'n Snooze, Depol, Danubia, Deccon, Designwerk, Die Klose Kollektion, Dieter Knoll Collection, diModa, Dining@home,Divany, Dreamland, Edblo, Egoform, Esprit Home, Fabryka Mebli Prudnik, Factory Shack, Formica, Freedom, G&G, Gommagomma,Grafton Everest, Habufa Meubelen, Harveys, Henders & Hazel, High Point, House of York, Hukla, H2L, ICM Meble Spolka, InnerACT,Italine, Janosch, Kolekcja Mebli Klose, Kolekcja Steinhoff, KPM, Lazboy, Leather Republic, Levene, Linea Italia, LivingTex, Longlife, Mago,Mattex, Melawood, Milano Decor, Moja, Nexus, Norma, Novalife, Option, Pat Cornick, Pennypinchers, PO.CO., PolsterGalerie, Pritex, PGBison, Puris Bad, Quattro Mobili, Redi2Fit, Re'flex, Relyon, Sealy, Sleepmasters, Slumberland, Softex, Solid Core, Sprung Slumber,Steinhoff Home, Steinhoff Market, Steinhoff Möbel, Steinhoff UK Upholstery, Steinpol, Supawood, Surrino, The Bed Shed, Ther-A-Pedic, Timbercity, Trend Design, Victoria Lewis, Vitafoam, Wim for kids, Woodline, 1913
ACTIVITY Manufacturer; Trade
MAIN PRODUCTION Furniture Specialized FURNITURE PRODUCT SPECIALISATION RTA - DIY furniture, Bathroom, Upholstery, Bedroom, Dining-living room
OTHER PRODUCTION Mattresses, Doors and Windows, Other
STOCK EXCHANGE Johannesburg Stock Exchange STOCK SYMBOL SHF
THE COMPANY IS PART OF Steinhoff Group
YEAR OF ESTABLISHMENT 1965 EMPLOYEES 45,000 TURNOVER EUR 3,542 million
History
Steinhoff International Holdings Ltd, based in Bramley, South Africa, is a manufacturing and trading company.
The company was established in 1965 and today is a holding company which manufacturs, warehouses and distributes household goods (mainly bedding, case goods, dining room furniture, upholstery and timber products) but also provides financial and management services to Group companies.
Currently the Group has two corporate offices, one in Johannesburg, where Steinhoff Africa and Steinhoff International are based and one in Westerstede, Germany, the traditional headquarters of Steinhoff.
Worldwide, Steinhoff is present with more than 90 companies.
The company has been quoted on the Johannesburg Stock Exchange since September 1998 (trading symbol: SHF).
As a result of going public, the company began a process of reorganisation at the end of 1998. This ended ten months later with the consolidation of the five partner companies into a single organisation: Steinhoff International Holdings Limited.
Steinhoff continues to extend its presence in Europe, broadening its distribution network with its entry into the United Kingdom through the acquisition of Relyon in 2000.
Towards the end of 2000, it acquired the German factories of the Klose Group, which is a prestige brand of dining room furniture in Europe.
Steinhoff Poland also acquired Prudnik from the Polish government during one of the last privatisations.

The furniture industry in Germany
10/09/2008 R2413.DE
© Copyright CSIL This report is exclusively for consultation on the part of the purchaser. It may not be reproduced in whole or in part by any means whatsoever without the prior written permission of CSIL
62
In 2001 Steinhoff acquired the top lifestyle brands Dieter Knoll Collection and Egoform to add to its portfolio of brands. Moreover in 2001 the Group set up a joint venture (50%-50%) with the US biggest manufacturer of motion chairs, La-Z-Boy USA. La-Z-Boy Europe was created with head office in the Netherlands and a production site in Germany. La-Z-Boy Europe designs, manufactures and distributes motion furniture throughout Europe.
In 2003 Steinhoff acquired the German Puris Bad from Alno and the UK bedding company Sprung Slumber from Airsprung.
In October 2004 and following the liquidation of Hukla Möbelwerke GmbH, the German Steinhoff division acquired Hukla Möbelwerke Group from the liquidator. The acquisition included the assets, including designs, brands, trademarks, drawings and manufacturing of the well-known Hukla brand (upholstery, recliners and mattress market).
In 2006 Steinhoff International Holdings acquired the majority stake of the Homestyle group. The competitive situation in the United Kingdom led to the acquisition, with effect from 30 June 2005, of a 60.8% interest in Homestyle. Since inception the supply chain in the United Kingdom has developed from being only a distributor of furniture, to manufacturing and sourcing beds and mattresses, converting and adding value to foam products, and manufacturing and sourcing upholstered furniture, to retailing household goods to the end consumer.
Financial Highlights
In 2007 Steinhoff Holding recorded a total turnover of Euro 3,542 million (+13% on 2006 in LCU, -0.2% in Euro). Manufacturing represented in 2007 about 40% of total revenue.
Sales made in the European Union (including the United Kingdom, Benelux division, the German region with Hungary and the Eastern European division) accounted for about 42% in 2007. Germany is the largest furniture market in Europe, but the Group is expanding towards neighbouring markets such as Benelux, Austria, Switzerland and Eastern Europe.
Manufactring process
The Group’s business model is centred on vertical integration, which allows participation throughout the supply chain.
It operates more than 70 factories spanning the United Kingdom, Netherlands, Germany, Poland, Hungary, UKraine, South Africa, India, Australia and New Zealand.
The Group operates in approximately 16 countries in Europe, Southern Africa and the Pacific Rim and employs, directly and indirectly, approximately 45,000 people of which 5,900 in Western Europe and 6,800 in Central Europe.
The Group manufactures about 5,500 sets of upholstered furniture a day. Production ranges from small units for niche goods to large facilities for mass production, located in Germany, Poland, Hungary, UKraine, India, South Africa, Australia and New Zealand. Upholstery production is carried out in the following factories in Europe: Germany with 5 factories, 2 for upholstery, one for bathroom furniture, and one mattress factory (among others Die Klose Kollection, Schönbrun, Dormira, Bruno Steinhoff, Visita, Puris Bad, Ego, Dieter Knoll Collection, Conforta, La-Z-Boy, Hukla); Hungary with 2 factories of which one is specialized in upper end leather upholstery production; Poland with 7 factories (of which 4 exclusively dedicated to production of upholstery).
Production is to 65% made for re-exportation. Further the Group operates one factory in the UKraine, which is mainly producing for the local and the Russian market.

The furniture industry in Germany
10/09/2008 R2413.DE
© Copyright CSIL This report is exclusively for consultation on the part of the purchaser. It may not be reproduced in whole or in part by any means whatsoever without the prior written permission of CSIL
63
Marketing
The Group further produces a wide range of brands that cover the different sectors of the household goods market.
Distribution channels
It operates its own warehouses and distribution networks (including its JSE listed subsidiary, Unitrans Limited). Household goods are distributed to end customers through its retail networks in United Kingdom (Harveys, Bensons for Beds, Sleepmaster, Bed Shed), Hungary (Quattro Mobili) and Australia and New Zealand (Freedom, Leather Republic, and Snooze) and South Africa (Pennypinchers and Timber City) and Unitrans Motors and its own retail concerns through Homestyle Group plc (United Kingdom) and Steinhoff Asia Pacific (including Freedom) retail chains, which have 631 and 186 retail outlets, respectively.
The Group operates a total of more than 18 distribution centres and almost 1,000 retail outlets.
In the German region, the group continues to grow through its existing brand and product strategy, and relationships with major retailers, mail order companies and buying group.
Strategic growth initiatives
The Group continues to investigate opportunities for brand expansion, through its own brand development and acquisitions. The successful Henders & Hazel store-in-store concept of the Benelux operations is being extended to other European destinations.
In Europe, the group will continue to participate in the consolidation trends prevalent in key markets. Retail alliances will be expanded and the group is continuously considering opportunities which, if implemented, will expand its geographic reach and distribution base.
Possible European joint ventures in raw materials are also presenting interesting growth opportunities. The United Kingdom retail operations make their required contribution, after management changes, repositioning of trading formats, adjusted product mixes and merchandising changes have been effected.

The furniture industry in Germany
10/09/2008 R2413.DE
© Copyright CSIL This report is exclusively for consultation on the part of the purchaser. It may not be reproduced in whole or in part by any means whatsoever without the prior written permission of CSIL
64
Topstar Germany
HEADQUARTERS Topstar GmbH Augsburger Straße 29 86863 Langenneufnach Germany
Tel. +49 8239 7890 Fax +49 8239 789240 www.topstar.de e-mail: [email protected]
ACTIVITY Manufacturer
MAIN PRODUCTION Furniture Specialized: 100% FURNITURE PRODUCT SPECIALISATION 80% Office; RTA - DIY furniture, Contract furniture, Household Furniture
YEAR OF ESTABLISHMENT 1949 EMPLOYEES 500 TURNOVER EUR 116 million
MANUFACTURING PLANTS 1 SQM 50,000 LOCATION Langenneufnach
OUTPUT 20,000 chairs per day
TOTAL EXPORT EUR 38.3 million % EXPORT ON TOTAL TURNOVER 33 DESTINATION Austria, France, Switzerland, United Kingdom
OTHER INFO In the year 1949, Mr. Moritz Wagner began to produce wooden chairs industrially. In 1976, the business was continued by the second generation under the name TOPSTAR. This company haspermanently developed to one of the most successful and most modern manufacturers of swivel chairs andseating furniture. Adapted to the requirements and demands of the 21st century, the Wagner family has started to produce theirgrandfather’s brand WAGNER again. This brand stands for highly developed, innovative products and concepts,which constitute a harmonic connection between aesthetics and ergonomics.
VS Möbel Germany
HEADQUARTERS VS Vereinigte Spezialmöbelfabriker GmbH & Co Hochhäuser Strasse 8 97941 Tauberbischofsheim Germany
Tel. +49 93 4188700 Fax +49 93 4188707 www.vs-moebel.de e-mail: [email protected]
ACTIVITY Manufacturer
MAIN PRODUCTION Furniture Specialized: 100% FURNITURE PRODUCT SPECIALISATION 50% Office; 50% Other household
YEAR OF ESTABLISHMENT n.a. EMPLOYEES 900 TURNOVER EUR 110 million
MANUFACTURING PLANTS 1 SQM n.a. LOCATION Tauberbischofsheim
TOTAL EXPORT EUR 33 million % EXPORT ON TOTAL TURNOVER 30
OTHER INFO V/S Möbel is a firm established at the beginning of the 1900s from the merger of four artisans active in theproduction of tables and chairs for educational structures. This segment was the firm’s core business until the seventies when it also began to produce office furniture, enormously expanding its range of products andfocussing the majority of business in this area.

The furniture industry in Germany
10/09/2008 R2413.DE
© Copyright CSIL This report is exclusively for consultation on the part of the purchaser. It may not be reproduced in whole or in part by any means whatsoever without the prior written permission of CSIL
65
Walter Knoll Germany
HEADQUARTERS Walter Knoll AG & Co KG Postfach 1252 71083 Herrenberg Germany
Tel. +49 7032 2080 ; 208115 Fax +49 7032 208250 www.walterknoll.de e-mail: [email protected]
ACTIVITY Manufacturer
MAIN PRODUCTION Furniture Specialized: 100% FURNITURE PRODUCT SPECIALISATION 50% office; 50% other household; Contract furniture, Upholstery, Household Furniture
YEAR OF ESTABLISHMENT 1925 EMPLOYEES 210 TURNOVER EUR 60 million
MANUFACTURING PLANTS 2 SQM n.a. LOCATION Herrenberg, Mötzingen
TOTAL EXPORT EUR 30 million % EXPORT ON TOTAL TURNOVER 50
DISTRIBUTION CHANNELS 45% direct sales, 55% office furniture dealers and home furniture dealers
OTHER INFO The Walter Knoll company’s HQ is located in Herrenberg. In Mötzingen, ten kilometres from Herrenberg, there isa further production location.The first part of the production site was finished in 2001. The production hall was awared from the architectural association of Baden Württemberg with the price "Exemplary Construction withinthe district Böblingen 1996-2003".
Warendorfer Küchen Germany
HEADQUARTERS Warendorfer Küchen GmbH (Miele Kitchens) Mielestrasse 1 48231 Warendorf Germany
Tel. +49 2581 591313 Fax +49 2581 591300 www.miele-kuechen.de e-mail: [email protected]
BRANDS, TRADEMARKS Miele Kitchens
ACTIVITY Manufacturer
MAIN PRODUCTION Furniture Specialized: 100% FURNITURE PRODUCT SPECIALISATION Kitchen
THE COMPANY IS PART OF AFG Arbonia Forster (turnover: Euro 894.4 million, more details in the Swiss section of the report)
YEAR OF ESTABLISHMENT 2005 EMPLOYEES 280 TURNOVER EUR 92.7 million
MANUFACTURING PLANTS 1 SQM 40,000 LOCATION Warendorf
TOTAL EXPORT EUR 43 million % EXPORT ON TOTAL TURNOVER 46.4
DISTRIBUTION CHANNELS Kitchen specialists (100%)
OTHER INFO In 2005 AFG Arbonia-Forster-Holding AG acquired the Miele Kitchens production and distribution business(based in Warendorf, in the German Westphalia region and manufacturing kitchens since 1975) from Germancompany Miele & Cie. KG in Gütersloh.
The furniture industry in Germany
10/09/2008 R2413.DE
© Copyright CSIL This report is exclusively for consultation on the part of the purchaser. It may not be reproduced in whole or in part by any means whatsoever without the prior written permission of CSIL
66
Welle Holding Germany
HEADQUARTERS Himolla Polstermöbelwerk GmbH Landshuster Strasse 38 84416 Taufkirchen/Vils Germany
Tel. +49 8084 250 Fax +49 8084 25558 www.himolla.com
CONTROLLED COMPANIES, SUBSIDIARIES, OTHER RELATED COMPANIES Nordica GmbH, Olympia, Leicht, Paidi, Bürstadt Furniture
BRANDS, TRADEMARKS Nordica GmbH, Olympia, Leicht
ACTIVITY Manufacturer
MAIN PRODUCTION Furniture Specialized: 100% FURNITURE PRODUCT SPECIALISATION Contract furniture, Upholstery, Household furniture
THE COMPANY IS PART OF Welle Holding
YEAR OF ESTABLISHMENT 1829 EMPLOYEES 3,288 TURNOVER EUR 393.1 million
MANUFACTURING PLANTS n.a. LOCATION Germany, the United Kingdom, Hungary, France and Poland
TOTAL EXPORT EUR 171 million % EXPORT ON TOTAL TURNOVER 43.5
History
At the beginning of 2002 Welle restructured and set up Welle Holding, which is now heading legally independent operating subsidiaries.
Financial Highlights
In 2006 Welle Holding recorded a total turnover of Euro 393.1 million (+1.1% on 2005).
Furniture sales on the domestic market were Euro 222 million. Exports account for around 44%. Welle Holding’s products are exported to Europe, Asia and the Pacific region, Central Asia, Central and Eastern Europe, North America, the Middle East and some African countries.
Manufacturing process
The company employed 3288 employees in 2006, of which 2,536 in production.
Welle Holding includes, among others:
- Himolla was established in 1829 by Carl Hierl in Taufkirchen, Germany and in 1946 the company started industrial upholstery production. In 1957 the company was renamed Himolla Polstermöbel GmbH. Since 1993 the Himolla Group is part of the Welle Holding. Turnover in 2007 was Euro 210 million of which 34% came from exports. Company’s brands are Himolla, Maximilian, Zerostress and Multimaster. In November 2007 Himolla took over Krauss & Weinbeer which was recalled K&W (Komfort und Wohnen) Polstermöbel GmbH. The company continues to manufacture upholstery but the imported wooden banks segment was discontinued. The upholstery production will be focussing on the Young Living segment.

The furniture industry in Germany
10/09/2008 R2413.DE
© Copyright CSIL This report is exclusively for consultation on the part of the purchaser. It may not be reproduced in whole or in part by any means whatsoever without the prior written permission of CSIL
67
- The Nordica GmbH upholstery specialist is part of the Himolla Group. In 2003 Himolla and the French Cauval Industries set up an alliance meaning that Cauval took over 75% of the Nordica parts. Today Cauval Industries owns 50.1% of Nordica and Welle Holding owns the remaining 49.9%. Nordica registered in 2007 a turnover of Euro 85 million of which around 20% came from exports.
- Olympia is also part of Himolla group, although it operates only on the British market and its main client is IKEA.
- Leicht Küchen a top range kitchen manufacturer with a turnover in 2007 of Euro 80 million of which approximately 50% came from exports. Leicht exports its kitchen furniture worldwide.
- Paidi, with headquarters in Hafenlohr and established in 1935, is a leading brand manufacturer in Germany of furniture for babies, children, and adolescents. The group manufactures and distributes its furniture from Hafenlohr and Kolbuszowa/Poland. With some 600 employees, the company generated sales of Euro 50 million in 2007, of which about 20% generated by exports. Main exporting countries are: France, Spain, Austria, Belgium, the Netherlands, Greece, Middle East. In 2007 DZ Equity Partner GmbH (a financial investor specializing in equity investment in medium sized companies) and Welle Holding acquired joint control of Paidi by way of purchase of securities.
- Bürstadt Furniture, one of the suppliers to IKEA, is specialized in casegoods - 60% kitchens, the rest wardrobe. Its standard offerings are melamine-coated. The business is broken into parts: prefabrication, furniture packaging and delivery. Bürstadt practices lean manufacturing and produces highvolume orders on three lines that extend the length of the factory — from the panel sizing saws straight through to packaging. The factory processes 450,000 single boards per week and 26,000 packages are sent out per day.
Manufacturing process
Welle Holding has production sites in Germany, the United Kingdom, Hungary, France and Poland.
The furniture industry in Germany
10/09/2008 R2413.DE
© Copyright CSIL This report is exclusively for consultation on the part of the purchaser. It may not be reproduced in whole or in part by any means whatsoever without the prior written permission of CSIL
68
Wellemöbel Germany
HEADQUARTERS Wellemöbel GmbH Wollmarktstraße 121 33098 Paderborn Germany
Tel. +49 5251 8830 Fax +49 5251 883585 www.welle-moebel.de e-mail: [email protected]
CONTROLLED COMPANIES, SUBSIDIARIES, OTHER RELATED COMPANIES Stammschröer, Howelpa Logistik GmbH
ACTIVITY Manufacturer
MAIN PRODUCTION Furniture Specialized: 100% FURNITURE PRODUCT SPECIALISATION RTA - DIY, Office, Dining-living room, Bedroom, Children
THE COMPANY IS PART OF Wellemobel Stammschröer
YEAR OF ESTABLISHMENT 2002 EMPLOYEES 1,140 TURNOVER EUR 114.7 million
MANUFACTURING PLANTS 4 LOCATION Paderborn, Alsfeld, Detmold, Bad Lippspringe.
TOTAL EXPORT EUR 34.4 million % EXPORT ON TOTAL TURNOVER 30 DESTINATION Austria, the UK, Ireland, Switzerland, Belgium, France, Netherlands
DISTRIBUTION CHANNELS Wellemöbel covers all ranges from discount items to the upper-middle range. In Germany Wellemöbel sells its products through mainly through independent furniture retailers.
History
Wellemöbel GmbH, based in Paderborn, Germany, is a manufacturing company.
Wellemöbel GmbH was founded as a rescue company for furniture producer Welle Möbel GmbH, which had filed for insolvency in May 2002. The newly-founded Wellemöbel started operating on 1 September 2002. Since 2003 Wellemöbel GmbH has been independent of the Welle Group. In February 2004 Wellemöbel was taken over by four partners.
In September 2004 the partners further acquired the logistic specialist Howelpa Logistik GmbH (employing around 115 people) in order to reinforce its position in this field. The company is based in Paderborn. In 2006 the management team of Wellemöbel took over the insolvent bedroom manufacturer Stammschröer, which employed around 207 people.
Financial Highlights
In 2007 Wellemöbel recorded a total turnover of Euro 115 million.
Furniture sales were Euro 115 million. Exports amount to about 30% of total turnover. Export markets include Austria, the UK, Ireland, Switzerland, Belgium, France, Netherlands.
Manufacturing process
The company employed about 1,140 people in 2007. It operates production plants in Paderborn (the head office is over 102,160 square metres with a production space of 3,779 square metres), Detmold (34,000 square metres with production space of 4,488 square metres) and Alsfeld (30,089 square metres with a production space of 7,707 square metres). Stammschröer is located in Bad Lippspringe.
Products
Office furniture represents around 33%, youth rooms around 32%, bedroom furniture 21% and infant furniture around 14%.

The furniture industry in Germany
10/09/2008 R2413.DE
© Copyright CSIL This report is exclusively for consultation on the part of the purchaser. It may not be reproduced in whole or in part by any means whatsoever without the prior written permission of CSIL
69
Wilkhahn Germany
HEADQUARTERS Wilkhahn + Hahne GmbH & Co. Postfach 2035 31844 Bad Münder Germany
Tel. +49 5042 9990 Fax +49 5042 999226 www.wilkhahn.com e-mail: [email protected]
CONTROLLED COMPANIES, SUBSIDIARIES, OTHER RELATED COMPANIES Wilkhahn Asia Pacific (Australia), Wilkhahn HandelsgesmbH (Austria), Wilkhahn Belgium, Wilkhahn Middle East (Dubai), Wilkahan Sarl (France), Wilkhahn Netherlands, Wilkhahn Poland and others
ACTIVITY Manufacturer
MAIN PRODUCTION Furniture Specialized: 100% FURNITURE PRODUCT SPECIALISATION 100% Office; Contract furniture
THE COMPANY IS PART OF Wilkhahn
YEAR OF ESTABLISHMENT 1907 EMPLOYEES 598 TURNOVER EUR 90.1 million
MANUFACTURING PLANTS 1 SQM 100,000 LOCATION Bad Münder
TOTAL EXPORT EUR 54.1 million % EXPORT ON TOTAL TURNOVER 60 DESTINATION Austria, Switzerland, France, Spain
OTHER INFO Wilkhahn was founded in 1907 and currently has its headquarters and production plant of 100,000 square metres (25,000 square metres of which are covered) in Bad Münder near Hannover. In 2007 the firm recorded total sales of Euro 90 million, showing an increase of 18% on the previous year thanksmainly to the growth in sales on export markets, especially the Asia-Pacific area and Japan. Wilkhahn is particularly active in the seating segment, with articles for conferencing, offices and waitingareas/receptions.
The furniture industry in Germany
10/09/2008 R2413.DE
© Copyright CSIL This report is exclusively for consultation on the part of the purchaser. It may not be reproduced in whole or in part by any means whatsoever without the prior written permission of CSIL
70
Willi Schillig Germany
HEADQUARTERS Willi Schillig Postelmöbelwerke GmbH & Co KG Postfach 1220 96237 Ebersdorf-Frohnlach Germany
Tel. +49 9562 370 ; 37111 ; 37190 ; 37191 Fax +49 9562 37500 ; 37192 www.schillig.com e-mail: [email protected]
ACTIVITY Manufacturer
MAIN PRODUCTION Furniture Specialized: 100% FURNITURE PRODUCT SPECIALISATION 100% Upholstery. Contract furniture
YEAR OF ESTABLISHMENT 1997 EMPLOYEES 1,100 TURNOVER EUR 106 million
CERTIFICATION ISO 9001. The firm is a member of the Quality Association [Gütegemeinschaft] "Deutsche Möbel".
TOTAL EXPORT EUR 30.7 million % EXPORT ON TOTAL TURNOVER 29 DESTINATION Austria, switzerland, UK, Netherlands, Belgium, Denmark, USA, Asia Pacific
OTHER INFO In 2003 the company built a new furniture production site in Hungary and in 2005/2006 the company built a new production facility in the Czech Republic. The company employs an average of 600 people in Germany and atotal of 1,100. Willi Schillig covers thoroughly the following market segments: furniture for the young, modern upholstery sofaand classics, comfort systems and functional furniture (Ergoline Models). About 86% of the company’sproduction is covered with leather. Willi Schillig manufactures primarily sectionals and groups in a contemporarystyle.
Wini Germany
HEADQUARTERS WINI Büromöbel Georg Schmidt GmbH & Co KG Auhagenstraße 79 31863 Coppenbrügge Germany
Tel. +49 5156 9790 ; 979148 Fax +49 5156 979100 ; 979129 www.wini.de e-mail: [email protected]
ACTIVITY Manufacturer
MAIN PRODUCTION Furniture Specialized: 100% FURNITURE PRODUCT SPECIALISATION 100% Office; Contract furniture
YEAR OF ESTABLISHMENT 1908 EMPLOYEES 190 TURNOVER EUR 36.1 million
MANUFACTURING PLANTS 1 SQM n.a. LOCATION Marienau - Coppenbrügge
TOTAL EXPORT EUR 4.3 million % EXPORT ON TOTAL TURNOVER 12 DESTINATION Switzerland, Austria, Netherlands
DISTRIBUTION CHANNELS The company distributes the 95% of its production through specialised dealers. Direct sales accounts for theremaining 5%.

The furniture industry in Germany
10/09/2008 R2413.DE
© Copyright CSIL This report is exclusively for consultation on the part of the purchaser. It may not be reproduced in whole or in part by any means whatsoever without the prior written permission of CSIL
71
Wössner GmbH Möbelwerk Germany
HEADQUARTERS Wössner GmbH Möbelwerk Hartensteinstr. 25 2172 Sulz Germany
Tel. +49 7454 740 Fax +49 7454 74249 www.woessner.de e-mail: [email protected]
ACTIVITY Manufacturer
MAIN PRODUCTION Furniture Specialized: 100% FURNITURE PRODUCT SPECIALISATION Dining-living room, Tables-chairs
YEAR OF ESTABLISHMENT 1906 EMPLOYEES 300 TURNOVER EUR 37.5 million
MANUFACTURING PLANTS n.a. SQM 34,000 LOCATION n.a.
EXPORT DESTINATION Austria, Switzerland, Belgium, the Netherlands, France, Luxembourg, Russia
DISTRIBUTION CHANNELS Via company’s sales representatives, exclusively through specialist furniture stores and furniture warehouses
OTHER INFO In 1931 the three brothers, Fritz, Eugen and Alfred Wössner took over a bedroom manufacturing company inSulz and relocated production to Sulz am Neckar. Wössner is a founder member of the "Deutsche Gütegemeinschaft Möbel e.V.". The company's furniture carriesthe golden “M” and is tested annually by the LGA for harmful substances, functionality and safety. Also thefurniture is certificated by DIN GOST-R for Russia. For more than 30 years Wössner has specialised in the development and manufacture of dining furniture. The company has a 1,500 m² factory showroom with approx. 80 different sets of dining furniture.
Wöstmann Gruppe Germany
HEADQUARTERS Wöstmann Möbelvertrieb GmbH Kolbeplatz 9 Gütersloh Germany
Tel. +49 5241 4000630 Fax +49 5241 4000633
ACTIVITY Manufacturer
MAIN PRODUCTION Furniture Specialized: 100% FURNITURE PRODUCT SPECIALISATION Upholstery, Dining-living room, Bedroom, Tables-chairs
YEAR OF ESTABLISHMENT n.a. EMPLOYEES 500 TURNOVER EUR 78.2 million
MANUFACTURING PLANTS 5 SQM n.a. LOCATION 4 in Nordrhein-Westfalen
TOTAL EXPORT EUR 3.1 million % EXPORT ON TOTAL TURNOVER 4 DESTINATION Austria, Switzerland

The furniture industry in Germany
10/09/2008 R2413.DE
© Copyright CSIL This report is exclusively for consultation on the part of the purchaser. It may not be reproduced in whole or in part by any means whatsoever without the prior written permission of CSIL
72
5. International trade
Figure 5.1 Germany. Furniture exports, imports and trade balance, 2002-2007. Million Eur
-1,576 -1,486
-101-888-1,314
-1,838-3000-2000-1000
010002000300040005000600070008000
2002 2003 2004 2005 2006 2007
Exports Imports Trade balance
Source: CSIL processing
Over the period 2000-2006 the balance of trade in the furniture sector in Germany was always negative, but since 2004 the deficit began to decrease, thanks to increases in furniture exports and to a slowdown in furniture imports growth (+1.3% annually between 2004 and 2007).

The furniture industry in Germany
10/09/2008 R2413.DE
© Copyright CSIL This report is exclusively for consultation on the part of the purchaser. It may not be reproduced in whole or in part by any means whatsoever without the prior written permission of CSIL
73
5.1. Furniture exports
Figure 5.2 Germany. Furniture exports, 2002-2007. Million Eur and annual percentage changes
5,097 5,1175,604 5,924
6,7187,275
010002000300040005000600070008000
2002 2003 2004 2005 2006 2007
million EUR
0.5 0.4
9.55.7
13.4
8.3
-5
0
5
10
15
20
2002 2003 2004 2005 2006 2007
% changes
Source: CSIL processing
Germany is the second exporter of furniture among the European (17) countries after Italy, with 23.4% share on total European exports. Over the course of the years the propensity to export of German furniture firms has progressively increased, from 22% in 1998 to 42% in 2007, strongly encouraged by the excess production capacity not absorbed by the domestic market. Over the period 2002-2007 furniture exports grew by an average annual rate of 7.4%. About 89% of the export flows are destined for other European countries. The main countries of destination for German furniture exports are its neighbours, the Netherlands, France, Austria, Switzerland, and the United Kingdom, which together absorb 52% of total exports. Among its extra-European trading partners the largest quotas are absorbed by the Americas (+11% compared to 2006) and by Asia and Pacific (+21%). As far as performances are concerned, all of the countries mentioned recorded growth in 2007, in particular France and the United Kingdom.

The furniture industry in Germany
10/09/2008 R2413.DE
© Copyright CSIL This report is exclusively for consultation on the part of the purchaser. It may not be reproduced in whole or in part by any means whatsoever without the prior written permission of CSIL
74
Exports by segment
Figure 5.3 Germany. Furniture exports by segment, 2002 and 2007. Percentage breakdown in value
9.9 10.88.4
5.83.3
8.7
18.9
7.24.9 2.9
19.6
28.3
15.6
27.9
18.3
9.4
05
101520253035
Officefurniture
Upholsteredfurniture
Kitchenfurniture
Bedroomfurniture
Dining andliving room
furniture
Non-upholstered
seats
Otherfurniture
Furnitureparts and
seating parts
2002 2007
Source: CSIL processing
In 2007 exports reached a value of Euro 7,275 million and can be divided into the following segments: - office furniture worth Euro 684 million (in 2002: worth Euro 504 million); - upholstered furniture worth Euro 636 million (in 2002: worth Euro 552 million); - kitchen furniture worth Euro 1379 million (in 2002: worth Euro 796 million); - bedroom furniture worth Euro 523 million (in 2002: worth Euro 430 million); - dining and living room furniture worth Euro 360 million (in 2002: worth Euro 295 million); - non-upholstered seats worth Euro 210 million (in 2002: worth Euro 167 million); - other furniture worth Euro 1428 million (in 2002: worth Euro 931 million); - furniture parts and seating parts worth Euro 2056 million (in 2002: worth Euro 1422 million).
The segments which recorded most important increases in 2007 in exports were the kitchen furniture and the office furniture ones. Germany is the first largest exporter of kitchen furniture in Europe, accounting for a 50% share in 2007. In 2007 total exports of kitchen furniture recorded growth of 14%, following the positive trend started in 2004. Over the course of the years the propensity to export of German kitchen firms has progressively increased, from 17.4% in 1998 to 35.5% in 2007. This can also be seen from the imports/consumption ratio, which, at 3.3%, is noticeably lower than the European average (14%). Germany is also the first largest exporter of office furniture in Europe, accounting for a 23% share in 2007. German exports of office furniture witnessed healthy growth in 2007 with an overall increase of +14%. The seating segment recorded the fastest growth with +17.7%, while the furniture segment recorded +12.4%. Exports of office furniture are destined mainly for countries in the Eurozone and the United States (3% share, however decreasing since 2002).

The furniture industry in Germany
10/09/2008 R2413.DE
© Copyright CSIL This report is exclusively for consultation on the part of the purchaser. It may not be reproduced in whole or in part by any means whatsoever without the prior written permission of CSIL
75
Germany is the second largest exporter of upholstery in Europe, accounting for a 15% share in 2007. Germany which is traditionally a very export oriented country managed to increase its share of exports among European countries by 3 percentage points over the last 6 years. After a growth of 20.6% in 2006, Germany registered a downturn in export activity in 2007. Upholstery exports dropped by 8.4% in 2007. Average growth between 2002 and 2007 was of 2.9%. Major outlet market remained the European Union (EU17) which absorbed 84% of total exports. Switzerland remained Germany’s major upholstery outlet receiving a 19.7% share in 2007. Switzerland was followed by the Netherlands which accounted for a 19.6% share. Exports to both destinations registered however a drop in 2007. Major drop in upholstery exports was registered by France which received 46.8% less of German upholstery exports in 2007 than in 2006. Germany is also the first largest exporter of bedroom furniture in Europe, accounting for a 26% share in 2007. Exports of bedroom furniture are destined mainly for European countries. Major outlet countries are Austria, the Netherlands, Switzerland, the United Kingdom and Belgium which together absorb about 71% of total exports. Germany is also an important exporter of dining and living room furniture. Exports which recorded growth by 5.7% in 2007, are destined mainly for countries in the enlarged European Union which absorbed 71% of total exports, and the United States (6.3% share) where exports increased by 8% in 2007, despite the strength of Euro.
Figure 5.4 Germany. Furniture exports by segment. Annual percentage changes at current prices 2007 on 2006 and average growth rates, 2002-2007
14.4
-8.4
14.4 12.58.36.3
2.9
11.6
4.17.7 7.4
4.74.08.9
2.34.15.7
11.7
-15-10-505
10152025
Officefurniture
Upholsteredfurniture
Kitchenfurniture
Bedroomfurniture
Dining andliving room
furniture
Non-upholstered
seats
Otherfurniture
Furnitureparts and
seating parts
Totalfurniture
av 02-07 07/06
Source: CSIL processing

The furniture industry in Germany
10/09/2008 R2413.DE
© Copyright CSIL This report is exclusively for consultation on the part of the purchaser. It may not be reproduced in whole or in part by any means whatsoever without the prior written permission of CSIL
76
5.2. Furniture imports
Figure 5.5 Germany. Furniture imports, 2002-2007. Million current Euro and annual percentage changes
7,3767,6067,2387,0916,9556,673
0100020003000400050006000700080009000
10000
2002 2003 2004 2005 2006 2007
million EUR
-2.6
4.21.9 2.1
5.1
-3.0-5
0
5
10
15
20
2002 2003 2004 2005 2006 2007
% changes
Source: CSIL processing
Among the European (17) countries Germany claims a 20% share of total furniture imports and it is the largest furniture importer. Imported goods satisfy 42.5% of consumption (European average 44%). Over the period 2001-2007 furniture imports grew by an average annual rate of 1.2%. Imports showed decrease of -3% on 2006, being domestic demand quite flat. The main countries of origin of German furniture imports are Poland, China, Italy, Czech Republic and Austria which together absorb 55% of total imports. In 2007 Italy’s exports to Germany were overpassed by China, now in second position as German furniture supplier. As far as performances are concerned, all the countries mentioned recorded decreases, with the exception of China which witnessed strong growth in 2007 (+31%). About 80% of the import flows come from other European countries, among which the new European members claim the largest share (42%). Imports from Asia and Pacific which claim a quota of about 16% on total imports, grew by an average annual rate of 21% over the 2002-2007 period.

The furniture industry in Germany
10/09/2008 R2413.DE
© Copyright CSIL This report is exclusively for consultation on the part of the purchaser. It may not be reproduced in whole or in part by any means whatsoever without the prior written permission of CSIL
77
Imports by segment
Figure 5.6 Germany. Furniture imports by segment, 2002 and 2007. Percentage breakdown in value
3.9
17.7
1.1
12.4
3.6 4.08.5 7.36.6
14.1
37.7
6.61.1
42.8
15.816.9
0
10
20
30
40
50
Officefurniture
Upholsteredfurniture
Kitchenfurniture
Bedroomfurniture
Dining andliving room
furniture
Non-upholstered
seats
Otherfurniture
Furnitureparts and
seating parts
2002 2007
Source: CSIL processing
In 2007 imports reached a value of Euro 7,376 million and can be divided into the following segments: - office furniture worth Euro 263 million (in 2002: worth Euro 260 million); - upholstered furniture worth Euro 1,247 million (in 2002: worth Euro 1,182 million); - kitchen furniture worth Euro 85 million (in 2002: worth Euro 71 million); - bedroom furniture worth Euro 293 million (in 2002: worth Euro 440 million); - dining and living room furniture worth Euro 629 million (in 2002: worth Euro 826 million); - non-upholstered seats worth Euro 535 million (in 2002: worth Euro 438 million); - other furniture worth Euro 1,165 million (in 2002: worth Euro 938 million); - furniture parts and seating parts worth Euro 3,160 million (in 2002: worth Euro 2,517 million).
Germany imports mainly furniture parts and seating parts, followed by upholstered furniture. Germany is Europe’s major importer of upholstered furniture. In 2007 import activity continued however to slow down and decreased by 8.6%. Over the last 6 years imports grew by an average of only 1.1%. Major upholstery supplier is Poland which accounts for half of Germany’s upholstery imports. It is however to mention, that this share is for a large part made up of re-importation activity of German companies which de-located parts or the totality of their manufacturing activity to Poland. An increasing share comes from the Asian and Pacific region (+35.8% in 2007) and especially from China which accounts for a 12.3% share of total German upholstery imports (2.5% share in 2002). Average growth rate of imports from China was of 38.9% between 2002 and 2007. China has been taking market shares of Poland over the last few years. The degree of openness of the German office furniture market is noticeably lower than the European sector average. Germany exported 23.5% of total production (the European average is 31%) and imported goods satisfied only 10.6% of consumption (European average 28.3%). Compared to 2006, imports recorded a reduction of 2% bringing the imports/consumption ration down to 10.6%. China is the leading supplier providing a quota of 18% of the total (in 2000 its

The furniture industry in Germany
10/09/2008 R2413.DE
© Copyright CSIL This report is exclusively for consultation on the part of the purchaser. It may not be reproduced in whole or in part by any means whatsoever without the prior written permission of CSIL
78
share was 2.8%). In the non-seating segment roughly 50% of imports are provided by five countries (Austria, Poland, Switzerland, Turkey and Denmark). It has to be noted the strong downturn of imports coming from Italy, decreased by 35% compared to 2006. As regards imports of office furniture, Poland is the second supplier, thanks mainly to the policies of productive relocation in recent years aimed at reducing production costs, which have also affected Turkey and China. Since 2004 China has been the top supplier of office seating (43% of total imports), having overtaken Italy, and recording average growth rates of 39%. The value of kitchen furniture imports is roughly sixteen times lower than that of exports (Euro 85 million against Euro 1380 million). In 2007 imports decreased of -6% compared to the previous year.
Figure 5.7 Germany. Furniture imports by segment. Annual percentage changes at current prices 2007 on 2006 and average growth rates, 2002-2007
-1.9-5.8
-10.2
3.40.5
-3.0
4.42.00.3
4.11.1
-5.3
3.50.2
-7.8
-0.9
-8.6
-12.8-20-15-10-505
101520
Officefurniture
Upholsteredfurniture
Kitchenfurniture
Bedroomfurniture
Dining andliving room
furniture
Non-upholstered
seats
Otherfurniture
Furnitureparts and
seating parts
Totalfurniture
av 02-07 07/06
Source: CSIL processing
The furniture industry in Germany
10/09/2008 R2413.DE
© Copyright CSIL This report is exclusively for consultation on the part of the purchaser. It may not be reproduced in whole or in part by any means whatsoever without the prior written permission of CSIL
79
Methodological notes This Report is the result of: - processing of macroeconomic and sector statistics from 2002 to 2007; - over 300 interviews with leading European companies; - analysis of sector documentation from CSIL’s databases which were created in 1980 and have been updated annually. In addition to information supplied directly by the companies themselves, we have also referred to specialist sector publications, company balance sheets, annual reports and our own estimates for a further insight into company data. Although the utmost care has been taken in processing the data (cross-checks and subsequent verification with the interested parties and informed observers) CSIL cannot be held responsible for any errors and/or omissions in the data supplied at source.
Definitions used in the report The FURNITURE aggregate includes the following products: - Office furniture: Visitor chairs without wheels, Office chairs with wheels, Executive chairs, Folding/stackable chairs,
Chairs for waiting rooms, Chairs for airports, auditoriums, cinemas etc., Chairs for the community (hospitals, clinics etc.), Operative and Management furnishing systems, desks that include bases (units which can be fitted/incorporated under a desk), Partitions, Office bookcases/shelving, Filing cabinets, Cupboards and various Storage items complementary to Operative workstations, Filing Systems, Wall-to-wall units (Roof-high equipped partition walls in panels, metal, plasterboard or glass), Furniture for communication areas (counters, reception, benches for auditoriums and break rooms).
- Upholstered furniture: Seats convertible into beds (excl. garden seats and camping equipment, and medical, dental or surgical furniture), Upholstered seats with wooden and metal frames.
- Non upholstered seats: Non-upholstered seats with wooden frames (excl. swivel seats), Seats of wood, cane, osier, bamboo or similar materials, Other seats (excl. Seats for aircraft and for motor vehicles).
- Kitchen furniture: Furniture of a kind used in kitchens (excl. seats), Fitted kitchen units. - Bedroom furniture: Cupboards, drawers, beds (excluding mattresses and mattress supports), bedside tables, bedroom
storage systems. - Dining and living room furniture: Tables, bookshelves, sideboards, and other furniture for dining-living rooms (excl.
seats). - Other furniture: Other kind of furniture for outdoor, the garden, bathroom (excl. medical, dental, surgical or veterinary,
and seats), Furniture for shops (incl. shop, bar and hotel fittings, modular shop fitting systems, coat stands…), Occasional furniture.
- Furniture parts and seating parts: Furniture parts (excl. for medical, surgical, dental or veterinary furniture, seats - for specially designed furniture for hi-fi systems, videos or televisions) and Parts of seats (excl. for aircraft, for medical, surgical, dental or veterinary seats, barbers' and similar chairs).
The furniture industry in Germany
10/09/2008 R2413.DE
© Copyright CSIL This report is exclusively for consultation on the part of the purchaser. It may not be reproduced in whole or in part by any means whatsoever without the prior written permission of CSIL
80
Contract: refers to a situation when simple furnishing supply is accompanied by a series of collateral services under the contracting formula (responsibility for all the work involved in a specific order), such as space planning support and supplier research, and coordination for the completion of the furnishing. Employees: the total number of people who work in the company as well as persons who work outside the company, but who belong to it and are paid by it (e.g. sales representatives, delivery personnel, repair and maintenance teams); persons absent for a short period (e.g. sick leave, paid leave or special leave), and also those on strike, part-time workers, seasonal workers, apprentices and home workers on the payroll. Company turnover: consolidated turnover that comprises the sales of the parent company and the subsidiaries, eliminating intra-group transactions. Furthermore we asked for the sales value, net of discounts and at factory prices. Some firms were not able to satisfy these requirements (they gave us gross sales and/or at consumer prices instead) or did not provide any information.
DISTRIBUTION CHANNELS - Independent Chains: Chains under the same ownership specialising mainly in the sale of furniture, accessories and
products for the home. - Organised Chains (furniture specialized): Distribution chains, consisting of both directly controlled and franchised sales
outlets. - Franchises (furniture specialized): System of collaboration between independent companies, bound by contract, under
which one company (the franchisor) grants the other (the franchisee) the right to use a brand name and a commercial formula, including a logo, under certain conditions and on payment. The franchisor also guarantees assistance and regular support services.
- Buying Groups (furniture specialized): Associations between retailers, each retaining his own legal status and financial independence, which mainly aim to make purchases and provide joint sales services, such as training, technological equipment, research, communication, promotion and financial services.
- Small Scale Independent Retailers (furniture specialized): Small independent sales outlets that do not form part of any kind of organised structure.
- Hypermarkets (not furniture specialized): Retail sales outlets divided into departments (food and non-food) which have respectively the characteristics of a supermarket and a department store.
- Department Stores (not furniture specialized): Retail sales outlets operating in the non-food field, dedicated to the sale of articles belonging to different sectors and mostly of large-scale consumption.
- Do It Yourself (not furniture specialized): Sale of articles for home maintenance and do-it-yourself. - Mail Order (not furniture specialized): Sales of various types of product via catalogue.
NOTES: - The source of trade data is Eurostat. Following recent changes and updatings of Eurostat data, the data series in this
report have been modified and are not directly comparable with similar data in previous editions of the report.

The furniture industry in Germany
10/09/2008 R2413.DE
© Copyright CSIL This report is exclusively for consultation on the part of the purchaser. It may not be reproduced in whole or in part by any means whatsoever without the prior written permission of CSIL
81
- The export/production and the import/consumption ratios may exceed 100% for countries where there are large amounts of imports for re-export. Official trade statistics do not allow to determine the actual amount of re-exports included in exports.
- Values of production, domestic consumption, exports and imports are at ex-factory prices (value of goods from
producer). - All figures are in current EUR unless otherwise indicated. Data in local currencies were converted to EUR using
exchange rates from the US Federal Reserve. - Real terms: when we refer in the text to annual percentage changes of production and consumption in real terms, we
refer to annual percentage changes from which the influence of prices fluctuations on the presented data is excluded, but which are calculated on value data expressed in current currencies.
Note on the discrepancy of data supplied by Eurostat for foreign trade With regard to the treatment of foreign trade data for the furniture sector, CSIL makes a selection of products based on the Combined Nomenclature and carries out an aggregation of the data per geographical area on the basis of its own subdivision of trading partners. As far as the statistics for the single countries are concerned, however, CSIL publishes the official data as they stand, without any adjustment or estimates. Thus these data should be considered the official Eurostat statistics. Discrepancies can be found in the data for foreign trade related to intra- community flows, and in its own methodological note about the trade of goods (available on request) Eurostat lists a series of possible reasons. We think it is useful to draw your attention to the following: the system of thresholds, which makes it possible to exempt a large share of the operators (especially small and medium-sized firms) from statistical formalities, the high rate of non-response errors in the classification of goods, residual methodological differences at a national level, regarding aspects of information gathering (especially due to simplification) not yet bound by rules of uniformity in the data collection process. When faced with conflicting statistics, the intensive work of analysing and comparing data that CSIL carries out in the course of its activity of monitoring the furniture sector suggests that it is preferable, in principle, to focus attention on the outward flows.

The furniture industry in Germany
10/09/2008 R2413.DE
© Copyright CSIL This report is exclusively for consultation on the part of the purchaser. It may not be reproduced in whole or in part by any means whatsoever without the prior written permission of CSIL
82
6. Import and export tables

Table 6.1 GermanyFurniture exports by product, 2002-2007
% share Annual % changes
2002 2003 2004 2005 2006 2007 2002 2007 2007/06 Aver. 02-07
Upholstered furniture 552 564 601 576 694 636 10.8 8.7 -8.4 2.9
Non-upholstered seats 167 158 176 192 205 210 3.3 2.9 2.3 4.7
Parts of seats 1030 1095 1179 1128 1198 1224 20.2 16.8 2.1 3.5
Bedroom furniture 430 446 449 453 465 523 8.4 7.2 12.5 4.0
Kitchen furniture 796 770 845 1001 1205 1379 15.6 18.9 14.4 11.6
Furniture for dining and living rooms 295 282 294 302 340 360 5.8 4.9 5.7 4.1
Office furniture 504 453 477 523 597 684 9.9 9.4 14.4 6.3
Other furniture 931 924 1113 1206 1371 1428 18.3 19.6 4.1 8.9
Parts of furniture, excluding parts of seats 392 425 471 543 642 832 7.7 11.4 29.7 16.2
Furniture including parts 5097 5117 5604 5924 6718 7275 100.0 100.0 8.3 7.4Source: CSIL processing of official data
Table 6.2 GermanyFurniture imports by product, 2002-2007
% share Annual % changes
2002 2003 2004 2005 2006 2007 2002 2007 2007/06 Aver. 02-07
Upholstered furniture 1182 1226 1257 1271 1364 1247 17.7 16.9 -8.6 1.1
Non-upholstered seats 438 489 505 524 518 535 6.6 7.3 3.4 4.1
Parts of seats 1831 2011 2115 2076 2311 2284 27.4 31.0 -1.2 4.5
Bedroom furniture 440 428 393 374 327 293 6.6 4.0 -10.2 -7.8
Kitchen furniture 71 81 85 88 90 85 1.1 1.1 -5.8 3.5
Furniture for dining and living rooms 826 775 756 758 721 629 12.4 8.5 -12.8 -5.3
Office furniture 260 253 255 267 268 263 3.9 3.6 -1.9 0.2
Other furniture 938 991 1063 1127 1176 1165 14.1 15.8 -0.9 4.4
Parts of furniture, excluding parts of seats 686 702 662 752 831 876 10.3 11.9 5.4 5.0
Furniture including parts 6673 6955 7091 7238 7606 7376 100.0 100.0 -3.0 2.0Source: CSIL processing of official data
EUR million
EUR million
10/09/2008 © Copyright CSILR2413.DE 83

Table 6.3 GermanyExports of furniture including parts by country and by geographical area, 2002-2007
% share Annual % changes2002 2003 2004 2005 2006 2007 2002 2007 2007/06 Aver. 02-07
Netherlands 847.5 801.2 822.6 833.9 914.2 936.0 16.6 12.9 2.4 2.0France 571.1 569.3 608.0 637.8 758.1 837.5 11.2 11.5 10.5 8.0Austria 592.8 552.4 591.7 636.7 692.5 721.6 11.6 9.9 4.2 4.0Switzerland 565.0 564.9 582.7 623.9 670.1 717.4 11.1 9.9 7.1 4.9United Kingdom 399.8 424.3 475.6 489.8 538.5 594.6 7.8 8.2 10.4 8.3Belgium 392.7 362.7 492.1 459.8 456.3 463.4 7.7 6.4 1.5 3.4Spain 164.5 183.9 218.7 248.0 281.3 288.1 3.2 4.0 2.4 11.9United States 210.9 202.1 215.2 227.3 247.7 272.7 4.1 3.7 10.1 5.3Italy 127.4 135.2 155.7 184.9 242.5 252.6 2.5 3.5 4.2 14.7Czech Republic 159.2 156.3 152.2 203.6 220.3 239.3 3.1 3.3 8.6 8.5Top 10 4031.0 3952.3 4314.5 4545.8 5021.5 5323.0 79.1 73.2 6.0 5.7Others 1066.4 1164.7 1289.7 1378.4 1696.6 1952.1 20.9 26.8 15.1 12.9
Americas 281.4 252.3 258.9 287.3 320.0 355.9 5.5 4.9 11.2 4.8- North America 228.3 217.0 231.8 252.4 281.6 310.6 4.5 4.3 10.3 6.4- Central-South America 53.1 35.3 27.1 34.8 38.4 45.3 1.0 0.6 17.8 -3.1Asia and Pacific 206.8 264.2 267.7 241.1 272.1 329.9 4.1 4.5 21.2 9.8Europe 4533.6 4534.1 5004.8 5310.6 6013.0 6462.8 88.9 88.8 7.5 7.3- European Union (15) 3386.8 3360.9 3745.7 3884.4 4337.6 4576.0 66.4 62.9 5.5 6.2- New EU Members (12) 444.3 464.9 507.4 606.2 735.3 830.7 8.7 11.4 13.0 13.3- Enlarged EU (27) 3831.1 3825.8 4253.1 4490.7 5072.8 5406.7 75.2 74.3 6.6 7.1- Norway & Switzerland 579.0 580.3 602.5 647.5 699.1 754.6 11.4 10.4 7.9 5.4- Other Europe 123.5 128.0 149.2 172.4 241.1 301.5 2.4 4.1 25.1 19.5Middle East 38.2 33.5 40.1 47.5 73.4 79.7 0.7 1.1 8.6 15.9Africa 34.5 30.3 30.9 35.7 39.2 46.5 0.7 0.6 18.6 6.1Other Countries 3.0 2.6 1.7 2.1 0.3 0.2 0.1 0.0 -12.2 -39.8World Total 5097.4 5117.0 5604.2 5924.2 6718.1 7275.1 100.0 100.0 8.3 7.4Source: CSIL processing of official data n.a.: not available; n.s.: not significant; n.c.: not calculable
Table 6.4 GermanyImports of furniture including parts by country and by geographical area, 2002-2007
% share Annual % changes2002 2003 2004 2005 2006 2007 2002 2007 2007/06 Aver. 02-07
Poland 1333.0 1568.5 1517.9 1641.8 1691.8 1573.9 20.0 21.3 -7.0 3.4China 209.7 299.3 412.1 517.3 617.3 811.4 3.1 11.0 31.4 31.1Italy 907.7 815.9 779.3 790.2 791.1 697.9 13.6 9.5 -11.8 -5.1Czech Republic 552.4 583.6 489.2 446.4 575.3 497.2 8.3 6.7 -13.6 -2.1Austria 436.0 423.0 401.9 463.4 515.1 450.3 6.5 6.1 -12.6 0.6Denmark 419.1 438.1 476.4 441.5 395.0 349.8 6.3 4.7 -11.5 -3.6Hungary 218.0 226.9 212.3 225.0 304.3 324.9 3.3 4.4 6.7 8.3Slovenia 297.5 267.4 382.3 318.4 309.8 303.0 4.5 4.1 -2.2 0.4Switzerland 214.7 210.2 202.9 213.3 230.4 273.1 3.2 3.7 18.5 4.9South Africa 266.0 268.1 296.5 246.4 234.7 213.9 4.0 2.9 -8.8 -4.3Top 10 4854.2 5101.1 5170.8 5303.8 5664.8 5495.4 72.7 74.5 -3.0 2.5Others 1818.8 1854.0 1919.8 1934.4 1941.3 1880.7 27.3 25.5 -3.1 0.7
Americas 79.4 80.0 76.7 78.2 77.4 95.8 1.2 1.3 23.9 3.8- North America 31.5 34.1 27.1 20.8 23.7 27.4 0.5 0.4 15.4 -2.8- Central-South America 47.9 45.9 49.6 57.4 53.6 68.5 0.7 0.9 27.7 7.4Asia and Pacific 462.0 600.1 739.2 845.5 945.1 1178.0 6.9 16.0 24.6 20.6Europe 5851.1 5992.6 5967.1 6056.0 6337.9 5877.5 87.7 79.7 -7.3 0.1- European Union (15) 2643.1 2498.7 2492.5 2546.4 2519.4 2178.8 39.6 29.5 -13.5 -3.8- New EU Members (12) 2760.9 3041.7 3006.5 3053.1 3320.6 3112.4 41.4 42.2 -6.3 2.4- Enlarged EU (27) 5404.0 5540.4 5499.0 5599.5 5840.0 5291.2 81.0 71.7 -9.4 -0.4- Norway & Switzerland 267.1 229.4 219.2 225.1 234.8 276.3 4.0 3.7 17.7 0.7- Other Europe 180.0 222.7 249.0 231.5 263.0 310.0 2.7 4.2 17.9 11.5Middle East 12.2 11.8 8.2 9.9 8.9 8.9 0.2 0.1 0.0 -6.2Africa 268.3 270.6 299.1 248.7 236.9 215.9 4.0 2.9 -8.9 -4.2Other Countries 0.0 0.0 0.3 0.0 0.0 0.0 0.0 0.0 n.c. n.s. World Total 6673.0 6955.1 7090.7 7238.2 7606.1 7376.1 100.0 100.0 -3.0 2.0Source: CSIL processing of official data n.a.: not available; n.s.: not significant; n.c.: not calculable
EUR million
EUR million
10/09/2008 © Copyright CSILR2413.DE 84

Table 6.5 GermanyExports of furniture excluding parts by country and by geographical area, 2002-2007
% share Annual % changes2002 2003 2004 2005 2006 2007 2002 2007 2007/06 Aver. 02-07
Netherlands 784.5 739.3 737.9 739.1 812.5 822.6 21.3 15.8 1.2 1.0Switzerland 496.5 490.8 515.6 552.6 594.4 630.4 13.5 12.1 6.1 4.9Austria 502.8 466.5 505.4 538.9 589.9 629.7 13.7 12.1 6.7 4.6France 392.9 378.5 448.0 480.5 608.0 623.5 10.7 11.9 2.6 9.7United Kingdom 304.9 321.6 374.5 362.5 411.1 427.2 8.3 8.2 3.9 7.0Belgium 249.4 243.6 290.9 296.6 323.0 354.4 6.8 6.8 9.7 7.3United States 121.6 110.8 128.3 149.5 162.3 181.2 3.3 3.5 11.6 8.3Spain 78.4 88.1 108.8 148.0 165.7 174.3 2.1 3.3 5.2 17.3Italy 95.8 98.6 116.8 141.9 170.6 173.0 2.6 3.3 1.4 12.5Russia 56.8 60.0 66.8 81.1 116.1 145.1 1.5 2.8 24.9 20.6Top 10 3083.6 2997.7 3293.0 3490.7 3953.6 4161.4 83.9 79.7 5.3 6.2Others 591.8 599.9 661.4 762.3 924.8 1057.9 16.1 20.3 14.4 12.3
Americas 143.7 128.0 147.0 173.2 196.8 216.8 3.9 4.2 10.2 8.6- North America 132.5 119.4 138.8 164.1 178.0 202.8 3.6 3.9 13.9 8.9- Central-South America 11.2 8.7 8.2 9.1 18.8 14.1 0.3 0.3 -25.1 4.6Asia and Pacific 127.4 127.4 130.9 144.9 171.0 204.9 3.5 3.9 19.8 10.0Europe 3355.5 3299.9 3631.8 3879.3 4434.0 4711.4 91.3 90.3 6.3 7.0- European Union (15) 2608.0 2551.1 2818.3 2979.7 3376.4 3516.8 71.0 67.4 4.2 6.2- New EU Members (12) 147.9 146.0 166.2 197.1 253.0 297.4 4.0 5.7 17.5 15.0- Enlarged EU (27) 2755.9 2697.0 2984.6 3176.9 3629.4 3814.1 75.0 73.1 5.1 6.7- Norway & Switzerland 506.8 503.2 531.5 570.4 616.0 659.0 13.8 12.6 7.0 5.4- Other Europe 92.8 99.7 115.7 132.0 188.6 238.2 2.5 4.6 26.3 20.7Middle East 30.7 26.4 30.4 39.3 57.9 60.1 0.8 1.2 3.9 14.4Africa 15.9 13.8 12.9 14.4 18.5 25.9 0.4 0.5 39.9 10.2Other Countries 2.3 2.1 1.4 1.9 0.3 0.2 0.1 0.0 -34.0 -40.8World Total 3675.4 3597.6 3954.4 4253.0 4878.4 5219.3 100.0 100.0 7.0 7.3Source: CSIL processing of official data n.a.: not available; n.s.: not significant; n.c.: not calculable
Table 6.6 GermanyImports of furniture excluding parts by country and by geographical area, 2002-2007
% share Annual % changes2002 2003 2004 2005 2006 2007 2002 2007 2007/06 Aver. 02-07
Poland 1079.6 1182.9 1102.4 1143.6 1181.1 991.1 26.0 23.5 -16.1 -1.7China 188.3 267.8 364.0 456.8 543.6 690.6 4.5 16.4 27.1 29.7Italy 641.9 563.4 538.0 492.2 464.3 372.8 15.4 8.8 -19.7 -10.3Denmark 400.7 417.0 454.3 419.8 380.6 336.2 9.6 8.0 -11.7 -3.5Switzerland 140.5 137.7 138.1 141.5 144.4 176.0 3.4 4.2 21.9 4.6Netherlands 153.8 173.3 186.0 219.4 197.1 172.6 3.7 4.1 -12.4 2.3Slovakia 85.0 107.4 102.6 115.0 113.7 142.6 2.0 3.4 25.4 10.9Austria 135.5 117.7 139.3 141.4 161.7 139.0 3.3 3.3 -14.0 0.5France 154.0 143.3 134.7 137.5 140.3 136.4 3.7 3.2 -2.7 -2.4Vietnam 26.5 52.1 70.1 82.4 89.1 112.0 0.6 2.7 25.7 33.4Top 10 3005.8 3162.7 3229.4 3349.7 3415.8 3269.4 72.3 77.5 -4.3 1.7Others 1150.2 1080.1 1084.7 1060.9 1047.9 947.2 27.7 22.5 -9.6 -3.8
Americas 41.8 43.7 39.9 40.9 38.8 47.8 1.0 1.1 23.2 2.7- North America 19.3 15.4 14.3 12.2 16.0 19.3 0.5 0.5 20.7 0.0- Central-South America 22.5 28.3 25.7 28.6 22.8 28.5 0.5 0.7 25.0 4.8Asia and Pacific 411.7 536.8 651.6 752.5 841.0 1022.0 9.9 24.2 21.5 19.9Europe 3687.0 3647.4 3611.1 3604.8 3572.8 3136.2 88.7 74.4 -12.2 -3.2- European Union (15) 1779.2 1648.1 1676.0 1641.3 1564.6 1304.4 42.8 30.9 -16.6 -6.0- New EU Members (12) 1627.3 1738.2 1654.0 1688.8 1726.4 1508.4 39.2 35.8 -12.6 -1.5- Enlarged EU (27) 3406.6 3386.3 3330.0 3330.1 3291.0 2812.8 82.0 66.7 -14.5 -3.8- Norway & Switzerland 189.4 155.3 151.8 150.1 147.5 178.5 4.6 4.2 21.0 -1.2- Other Europe 91.0 105.8 129.3 124.7 134.2 144.8 2.2 3.4 7.9 9.7Middle East 12.0 11.5 7.8 9.4 8.3 8.3 0.3 0.2 -0.2 -7.1Africa 3.6 3.4 3.5 3.1 2.9 2.3 0.1 0.1 -19.9 -8.1Other Countries 0.0 0.0 0.2 0.0 0.0 0.0 0.0 0.0 n.c. n.s. World Total 4156.1 4242.9 4314.1 4410.6 4463.8 4216.6 100.0 100.0 -5.5 0.3Source: CSIL processing of official data n.a.: not available; n.s.: not significant; n.c.: not calculable
EUR million
EUR million
10/09/2008 © Copyright CSILR2413.DE 85

Table 6.7 GermanyExports of furniture parts by country and by geographical area, 2002-2007
% share Annual % changes2002 2003 2004 2005 2006 2007 2002 2007 2007/06 Aver. 02-07
France 178.3 190.8 160.0 157.3 150.2 214.0 12.5 10.4 42.5 3.7United Kingdom 94.9 102.8 101.1 127.3 127.4 167.4 6.7 8.1 31.4 12.0Czech Republic 117.3 114.3 103.6 144.0 153.8 163.0 8.2 7.9 6.0 6.8Slovakia 21.9 49.5 87.9 105.2 114.0 144.0 1.5 7.0 26.4 45.8Poland 87.7 100.5 102.3 98.1 135.5 123.3 6.2 6.0 -9.0 7.1Spain 86.1 95.8 109.9 100.0 115.6 113.7 6.1 5.5 -1.6 5.7Netherlands 63.1 61.8 84.8 94.8 101.7 113.3 4.4 5.5 11.5 12.4Belgium 143.3 119.1 201.1 163.3 133.3 109.0 10.1 5.3 -18.2 -5.3Austria 90.0 85.9 86.3 97.8 102.5 91.9 6.3 4.5 -10.4 0.4United States 89.3 91.4 86.9 77.8 85.4 91.4 6.3 4.4 7.1 0.5Top 10 971.8 1011.9 1123.9 1165.6 1219.3 1331.0 68.3 64.7 9.2 6.5Others 450.2 507.5 525.9 505.5 620.4 724.7 31.7 35.3 16.8 10.0
Americas 137.7 124.3 111.9 114.0 123.2 139.1 9.7 6.8 12.9 0.2- North America 95.8 97.6 93.0 88.3 103.6 107.9 6.7 5.2 4.2 2.4- Central-South America 41.9 26.7 18.9 25.7 19.7 31.2 2.9 1.5 58.9 -5.7Asia and Pacific 79.4 136.8 136.8 96.2 101.1 125.0 5.6 6.1 23.6 9.5Europe 1178.1 1234.2 1373.0 1431.3 1579.0 1751.4 82.8 85.2 10.9 8.3- European Union (15) 778.9 809.8 927.4 904.7 961.2 1059.2 54.8 51.5 10.2 6.3- New EU Members (12) 296.4 319.0 341.1 409.1 482.2 533.4 20.8 25.9 10.6 12.5- Enlarged EU (27) 1075.2 1128.8 1268.6 1313.8 1443.4 1592.6 75.6 77.5 10.3 8.2- Norway & Switzerland 72.2 77.1 71.0 77.1 83.1 95.6 5.1 4.7 15.0 5.8- Other Europe 30.6 28.3 33.4 40.4 52.5 63.3 2.2 3.1 20.6 15.6Middle East 7.5 7.1 9.7 8.2 15.6 19.7 0.5 1.0 26.2 21.2Africa 18.6 16.5 18.0 21.3 20.7 20.6 1.3 1.0 -0.5 2.0Other Countries 0.7 0.5 0.3 0.2 0.0 0.1 0.0 0.0 n.s. -36.8World Total 1422.0 1519.4 1649.8 1671.2 1839.6 2055.8 100.0 100.0 11.7 7.7Source: CSIL processing of official data n.a.: not available; n.s.: not significant; n.c.: not calculable
Table 6.8 GermanyImports of furniture parts by country and by geographical area, 2002-2007
% share Annual % changes2002 2003 2004 2005 2006 2007 2002 2007 2007/06 Aver. 02-07
Poland 253.4 385.6 415.6 498.2 510.7 582.9 10.1 18.4 14.1 18.1Czech Republic 406.4 435.6 381.0 342.4 474.8 388.2 16.1 12.3 -18.2 -0.9Italy 265.8 252.5 241.4 298.0 326.8 325.1 10.6 10.3 -0.5 4.1Austria 300.5 305.4 262.6 321.9 353.4 311.3 11.9 9.9 -11.9 0.7Slovenia 250.3 227.0 342.3 280.1 279.0 279.9 9.9 8.9 0.3 2.3Hungary 154.0 176.0 128.7 146.2 223.5 244.1 6.1 7.7 9.2 9.7South Africa 264.0 266.6 295.3 245.5 233.8 213.4 10.5 6.8 -8.7 -4.2Turkey 56.4 71.2 70.7 70.4 88.4 123.2 2.2 3.9 39.4 16.9China 21.4 31.5 48.1 60.5 73.7 120.7 0.9 3.8 63.8 41.3Switzerland 74.2 72.5 64.9 71.8 86.0 97.1 2.9 3.1 13.0 5.5Top 10 2046.4 2223.8 2250.4 2335.0 2649.9 2686.0 81.3 85.0 1.4 5.6Others 470.5 488.4 526.1 492.6 492.4 473.6 18.7 15.0 -3.8 0.1
Americas 37.6 36.3 36.8 37.3 38.6 48.1 1.5 1.5 24.6 5.0- North America 12.2 18.7 12.8 8.6 7.7 8.1 0.5 0.3 4.5 -7.9- Central-South America 25.4 17.6 24.0 28.7 30.9 40.0 1.0 1.3 29.6 9.5Asia and Pacific 50.4 63.4 87.6 93.0 104.1 156.0 2.0 4.9 49.8 25.4Europe 2164.1 2345.2 2356.1 2451.2 2765.1 2741.4 86.0 86.8 -0.9 4.8- European Union (15) 863.9 850.6 816.5 905.2 954.8 874.4 34.3 27.7 -8.4 0.2- New EU Members (12) 1133.5 1303.5 1352.5 1364.2 1594.2 1604.0 45.0 50.8 0.6 7.2- Enlarged EU (27) 1997.4 2154.1 2169.0 2269.4 2549.0 2478.4 79.4 78.4 -2.8 4.4- Norway & Switzerland 77.7 74.1 67.4 75.0 87.3 97.7 3.1 3.1 12.0 4.7- Other Europe 89.0 116.9 119.7 106.8 128.8 165.2 3.5 5.2 28.3 13.2Middle East 0.2 0.2 0.4 0.5 0.6 0.6 0.0 0.0 2.9 21.1Africa 264.7 267.2 295.5 245.6 234.0 213.6 10.5 6.8 -8.7 -4.2Other Countries 0.0 0.0 0.1 0.0 0.0 0.0 0.0 0.0 n.c. n.s. World Total 2516.9 2712.2 2776.5 2827.6 3142.3 3159.5 100.0 100.0 0.5 4.7Source: CSIL processing of official data n.a.: not available; n.s.: not significant; n.c.: not calculable
EUR million
EUR million
10/09/2008 © Copyright CSILR2413.DE 86

Table 6.9 GermanyExports of upholstered furniture by country and by geographical area, 2002-2007
% share Annual % changes2002 2003 2004 2005 2006 2007 2002 2007 2007/06 Aver. 02-07
Switzerland 109.7 105.5 116.3 114.5 127.2 125.5 19.9 19.7 -1.4 2.7Netherlands 144.5 150.0 146.1 130.9 142.8 124.6 26.2 19.6 -12.7 -2.9Austria 84.1 86.6 95.0 93.3 99.1 106.8 15.2 16.8 7.8 4.9Belgium 39.0 44.6 48.6 43.8 44.4 48.1 7.1 7.6 8.3 4.3France 50.8 39.4 41.3 36.9 83.5 44.4 9.2 7.0 -46.8 -2.7United Kingdom 20.0 22.7 29.9 25.1 34.2 30.7 3.6 4.8 -10.2 8.9Russia 8.0 8.8 8.7 9.6 14.7 17.0 1.4 2.7 15.4 16.3Luxembourg 10.0 11.9 13.2 12.9 14.9 15.0 1.8 2.4 0.5 8.4Italy 11.1 15.2 12.0 13.3 17.5 12.8 2.0 2.0 -26.8 3.0Spain 6.3 6.8 8.5 11.1 10.3 11.1 1.1 1.7 7.4 12.1Top 10 483.4 491.4 519.5 491.5 588.7 536.0 87.6 84.3 -8.9 2.1Others 68.4 72.2 81.5 84.4 105.5 100.2 12.4 15.7 -5.0 7.9
Americas 15.4 17.2 17.0 18.3 16.3 13.7 2.8 2.2 -15.9 -2.4- North America 14.6 16.6 16.5 17.5 14.4 11.4 2.6 1.8 -21.0 -4.8- Central-South America 0.9 0.6 0.6 0.8 1.8 2.3 0.2 0.4 25.1 21.2Asia and Pacific 16.1 16.0 19.3 21.2 22.6 22.1 2.9 3.5 -2.3 6.6Europe 514.3 525.3 560.6 531.6 648.7 592.0 93.2 93.0 -8.7 2.9- European Union (15) 376.2 390.6 405.7 380.3 464.0 409.1 68.2 64.3 -11.8 1.7- New EU Members (12) 15.2 16.0 23.4 20.2 33.4 29.6 2.8 4.6 -11.4 14.2- Enlarged EU (27) 391.4 406.6 429.2 400.4 497.3 438.7 70.9 69.0 -11.8 2.3- Norway & Switzerland 111.2 106.4 117.4 116.2 129.5 127.9 20.2 20.1 -1.3 2.8- Other Europe 11.7 12.3 14.0 14.9 21.8 25.4 2.1 4.0 16.3 16.8Middle East 4.1 3.7 3.1 3.2 5.1 5.6 0.8 0.9 9.4 6.1Africa 1.5 1.0 0.9 1.4 1.5 2.9 0.3 0.5 89.3 14.9Other Countries 0.4 0.4 0.2 0.2 0.0 0.0 0.1 0.0 n.s. n.s. World Total 551.8 563.6 601.0 575.8 694.2 636.2 100.0 100.0 -8.4 2.9Source: CSIL processing of official data n.a.: not available; n.s.: not significant; n.c.: not calculable
Table 6.10 GermanyImports of upholstered furniture by country and by geographical area, 2002-2007
% share Annual % changes2002 2003 2004 2005 2006 2007 2002 2007 2007/06 Aver. 02-07
Poland 619.9 679.9 641.0 635.4 687.7 558.9 52.4 44.8 -18.7 -2.1China 29.6 42.2 61.1 79.1 104.3 152.9 2.5 12.3 46.6 38.9Italy 172.2 151.5 145.6 132.2 126.0 95.9 14.6 7.7 -23.9 -11.0Slovakia 20.4 27.2 30.3 38.5 48.1 50.7 1.7 4.1 5.3 20.0Denmark 30.5 59.6 71.3 65.5 69.3 48.7 2.6 3.9 -29.8 9.8Hungary 39.6 31.9 54.1 51.6 44.9 46.1 3.3 3.7 2.5 3.1France 29.6 20.4 24.8 26.9 31.1 36.6 2.5 2.9 17.5 4.3Romania 30.4 21.9 31.3 46.1 48.0 35.9 2.6 2.9 -25.2 3.4Netherlands 17.9 18.2 22.8 28.3 26.4 31.3 1.5 2.5 18.5 11.8Switzerland 22.3 24.1 23.4 23.7 26.7 28.9 1.9 2.3 8.4 5.3Top 10 1012.4 1076.8 1105.9 1127.2 1212.6 1085.8 85.6 87.1 -10.5 1.4Others 169.7 149.1 151.5 144.2 151.5 160.7 14.4 12.9 6.1 -1.1
Americas 3.4 3.0 3.7 2.7 4.3 7.9 0.3 0.6 86.7 18.3- North America 3.3 2.9 2.5 1.5 3.8 7.1 0.3 0.6 85.2 16.4- Central-South America 0.1 0.2 1.3 1.2 0.4 0.8 0.0 0.1 n.s. 51.9Asia and Pacific 39.1 56.2 80.0 103.9 135.3 183.8 3.3 14.7 35.8 36.3Europe 1139.2 1166.0 1173.0 1164.1 1223.5 1054.1 96.4 84.6 -13.8 -1.5- European Union (15) 295.0 290.0 302.8 293.4 293.8 246.8 25.0 19.8 -16.0 -3.5- New EU Members (12) 756.7 809.1 798.0 806.8 864.2 727.0 64.0 58.3 -15.9 -0.8- Enlarged EU (27) 1051.7 1099.1 1100.8 1100.2 1158.0 973.8 89.0 78.1 -15.9 -1.5- Norway & Switzerland 58.9 30.5 29.9 28.3 28.0 30.0 5.0 2.4 7.5 -12.6- Other Europe 28.6 36.4 42.2 35.6 37.6 50.2 2.4 4.0 33.5 11.9Middle East 0.2 0.3 0.3 0.1 0.4 0.3 0.0 0.0 -24.0 12.0Africa 0.3 0.4 0.4 0.7 0.6 0.5 0.0 0.0 -21.3 11.6Other Countries 0.0 0.0 0.1 0.0 0.0 0.0 0.0 0.0 n.c. n.s. World Total 1182.1 1225.9 1257.4 1271.4 1364.1 1246.6 100.0 100.0 -8.6 1.1Source: CSIL processing of official data n.a.: not available; n.s.: not significant; n.c.: not calculable
EUR million
EUR million
10/09/2008 © Copyright CSILR2413.DE 87

Table 6.11 GermanyExports of non-upholstered seats by country and by geographical area, 2002-2007
% share Annual % changes2002 2003 2004 2005 2006 2007 2002 2007 2007/06 Aver. 02-07
Austria 24.6 22.7 25.7 25.9 31.2 28.9 14.7 13.8 -7.4 3.3Switzerland 28.1 26.4 25.2 29.0 29.0 28.9 16.8 13.8 -0.6 0.5Netherlands 30.2 28.5 31.7 28.0 28.7 26.1 18.1 12.4 -9.2 -2.9France 15.9 17.2 18.9 20.8 20.6 24.3 9.5 11.6 18.1 8.8Poland 1.8 1.8 2.0 2.2 4.2 10.4 1.1 5.0 n.s. 41.9Italy 5.2 4.7 9.0 8.9 10.9 10.3 3.1 4.9 -5.2 14.7Belgium 11.5 8.6 9.8 10.1 11.3 9.5 6.9 4.5 -15.7 -3.7United Kingdom 10.8 9.3 9.9 11.2 11.0 8.9 6.5 4.2 -18.9 -3.8Spain 4.7 4.9 5.7 8.3 7.5 8.2 2.8 3.9 9.0 12.1United States 5.9 5.2 5.8 5.6 6.6 5.9 3.6 2.8 -10.8 -0.1Top 10 138.8 129.2 143.6 149.8 161.2 161.5 83.1 76.9 0.2 3.1Others 28.3 28.9 32.2 42.1 44.0 48.4 16.9 23.1 10.1 11.3
Americas 6.6 5.5 6.2 6.2 8.0 6.8 4.0 3.2 -15.4 0.4- North America 6.2 5.3 5.9 5.8 6.7 6.0 3.7 2.9 -10.8 -0.8- Central-South America 0.4 0.2 0.3 0.4 1.3 0.8 0.2 0.4 -40.0 15.8Asia and Pacific 5.8 5.3 5.2 5.6 7.0 8.0 3.5 3.8 13.2 6.5Europe 152.6 144.9 162.8 178.0 186.9 192.0 91.3 91.5 2.7 4.7- European Union (15) 114.6 108.0 124.7 132.9 137.0 131.9 68.6 62.8 -3.7 2.8- New EU Members (12) 6.4 6.8 7.5 9.5 13.8 21.3 3.8 10.1 54.5 27.3- Enlarged EU (27) 121.0 114.8 132.2 142.4 150.7 153.2 72.4 73.0 1.6 4.8- Norway & Switzerland 28.6 27.3 27.5 31.9 30.6 31.2 17.1 14.9 1.8 1.8- Other Europe 3.0 2.7 3.1 3.7 5.5 7.6 1.8 3.6 38.3 20.8Middle East 0.9 0.9 0.8 1.6 2.4 1.9 0.5 0.9 -20.3 16.3Africa 1.0 1.5 0.7 0.5 0.9 1.3 0.6 0.6 41.7 5.4Other Countries 0.2 0.2 0.1 0.1 0.0 0.0 0.1 0.0 n.c. n.s. World Total 167.0 158.2 175.8 192.0 205.2 209.9 100.0 100.0 2.3 4.7Source: CSIL processing of official data n.a.: not available; n.s.: not significant; n.c.: not calculable
Table 6.12 GermanyImports of non-upholstered seats by country and by geographical area, 2002-2007
% share Annual % changes2002 2003 2004 2005 2006 2007 2002 2007 2007/06 Aver. 02-07
China 51.9 71.9 96.0 117.2 141.4 170.9 11.8 32.0 20.9 26.9Vietnam 15.9 30.6 40.5 45.9 47.3 62.1 3.6 11.6 31.4 31.4Indonesia 62.9 69.1 68.3 64.2 55.9 58.8 14.4 11.0 5.2 -1.3Denmark 28.0 35.0 36.9 41.7 35.6 46.9 6.4 8.8 31.7 10.9Netherlands 27.2 34.3 38.2 41.3 34.5 36.8 6.2 6.9 6.6 6.2Italy 49.7 43.6 38.8 39.1 35.1 25.7 11.3 4.8 -26.8 -12.4Poland 29.5 33.3 27.9 34.0 33.1 21.2 6.7 4.0 -35.8 -6.4Czech Republic 17.7 21.6 15.5 13.0 13.7 14.6 4.0 2.7 6.4 -3.8Austria 17.0 9.7 10.2 10.8 15.5 12.0 3.9 2.2 -22.6 -6.7France 25.0 26.8 18.9 17.8 10.9 10.4 5.7 1.9 -5.0 -16.1Top 10 324.8 375.9 391.3 425.0 423.1 459.5 74.1 85.9 8.6 7.2Others 113.4 113.3 114.0 99.4 94.5 75.5 25.9 14.1 -20.1 -7.8
Americas 5.6 6.6 6.1 7.0 4.1 3.4 1.3 0.6 -18.0 -9.5- North America 2.2 2.4 2.1 2.0 2.3 1.9 0.5 0.3 -19.6 -3.4- Central-South America 3.4 4.3 4.1 5.0 1.8 1.5 0.8 0.3 -16.1 -14.5Asia and Pacific 150.3 194.8 231.6 251.1 266.1 316.0 34.3 59.1 18.7 16.0Europe 281.0 286.3 265.9 264.9 246.0 214.9 64.1 40.2 -12.6 -5.2- European Union (15) 168.0 170.4 163.1 170.6 155.0 140.4 38.3 26.2 -9.4 -3.5- New EU Members (12) 84.1 87.0 76.5 75.1 70.8 56.1 19.2 10.5 -20.8 -7.8- Enlarged EU (27) 252.1 257.4 239.6 245.8 225.8 196.5 57.5 36.7 -13.0 -4.9- Norway & Switzerland 12.7 13.3 9.7 5.0 4.3 5.0 2.9 0.9 16.0 -17.2- Other Europe 16.2 15.7 16.6 14.1 15.9 13.4 3.7 2.5 -15.5 -3.6Middle East 0.5 0.6 0.4 0.7 0.7 0.5 0.1 0.1 -32.3 0.0Africa 0.9 0.8 1.1 0.7 0.6 0.2 0.2 0.0 n.s. -26.9Other Countries 0.0 0.0 0.0 0.0 0.0 0.0 0.0 0.0 n.c. n.s. World Total 438.2 489.2 505.2 524.5 517.6 535.0 100.0 100.0 3.4 4.1Source: CSIL processing of official data n.a.: not available; n.s.: not significant; n.c.: not calculable
EUR million
EUR million
10/09/2008 © Copyright CSILR2413.DE 88

Table 6.13 GermanyExports of bedroom furniture by country and by geographical area, 2002-2007
% share Annual % changes2002 2003 2004 2005 2006 2007 2002 2007 2007/06 Aver. 02-07
Austria 107.7 99.3 98.3 103.3 104.8 116.2 25.0 22.2 10.9 1.5Netherlands 78.6 89.5 79.4 73.6 77.0 89.4 18.3 17.1 16.1 2.6Switzerland 54.6 56.6 55.8 53.3 60.6 61.1 12.7 11.7 0.7 2.2United Kingdom 54.4 75.9 76.2 59.9 54.1 58.4 12.6 11.2 7.9 1.4Belgium 41.3 40.9 38.9 39.0 39.0 45.0 9.6 8.6 15.3 1.7France 32.3 23.6 24.0 33.6 28.2 31.8 7.5 6.1 12.6 -0.3Italy 4.0 4.4 8.5 17.2 18.6 17.5 0.9 3.3 -6.2 34.4Czech Republic 5.9 5.8 7.3 9.1 9.6 13.4 1.4 2.6 39.6 17.9Luxembourg 10.1 10.5 10.8 11.0 12.5 12.1 2.4 2.3 -3.1 3.7Russia 5.7 4.6 6.1 6.4 8.8 11.3 1.3 2.2 28.9 14.6Top 10 394.8 411.1 405.3 406.4 413.3 456.1 91.7 87.2 10.4 2.9Others 35.5 35.3 43.9 46.3 52.0 67.2 8.3 12.8 29.3 13.6
Americas 2.4 2.7 7.0 5.6 2.5 3.2 0.6 0.6 27.6 6.0- North America 2.2 2.4 6.7 5.3 2.2 2.8 0.5 0.5 29.6 5.2- Central-South America 0.2 0.3 0.4 0.3 0.4 0.4 0.1 0.1 15.8 12.9Asia and Pacific 6.7 7.1 5.1 3.7 3.2 7.0 1.6 1.3 n.s. 1.0Europe 417.5 433.2 434.9 441.9 457.0 509.8 97.0 97.4 11.6 4.1- European Union (15) 337.0 352.6 344.9 348.3 351.0 388.5 78.3 74.2 10.7 2.9- New EU Members (12) 15.2 14.4 17.0 25.4 27.2 37.9 3.5 7.2 39.3 20.1- Enlarged EU (27) 352.2 366.9 361.9 373.8 378.2 426.3 81.9 81.5 12.7 3.9- Norway & Switzerland 55.2 57.3 56.3 53.8 61.2 61.8 12.8 11.8 1.1 2.3- Other Europe 10.1 8.9 16.7 14.3 17.6 21.6 2.3 4.1 23.0 16.4Middle East 2.7 1.9 1.2 1.0 2.0 2.6 0.6 0.5 30.8 -0.6Africa 0.7 1.2 0.8 0.4 0.6 0.7 0.2 0.1 15.9 2.2Other Countries 0.3 0.4 0.1 0.2 0.0 0.0 0.1 0.0 n.c. n.s. World Total 430.3 446.4 449.2 452.7 465.3 523.4 100.0 100.0 12.5 4.0Source: CSIL processing of official data n.a.: not available; n.s.: not significant; n.c.: not calculable
Table 6.14 GermanyImports of bedroom furniture by country and by geographical area, 2002-2007
% share Annual % changes2002 2003 2004 2005 2006 2007 2002 2007 2007/06 Aver. 02-07
Denmark 119.1 110.3 114.4 101.5 86.0 65.7 27.1 22.4 -23.6 -11.2Poland 119.6 125.9 96.6 82.8 68.0 52.8 27.2 18.0 -22.4 -15.1Switzerland 25.8 26.0 28.8 31.5 24.8 26.8 5.9 9.2 8.1 0.8Italy 34.7 31.3 25.7 25.3 22.5 21.4 7.9 7.3 -4.8 -9.2Czech Republic 22.1 21.3 21.0 28.7 19.8 20.4 5.0 6.9 3.1 -1.6China 2.6 5.6 6.2 9.7 15.5 18.6 0.6 6.3 19.9 48.4Slovakia 5.1 13.9 11.1 11.2 4.2 18.3 1.2 6.2 n.s. 29.2Austria 18.7 10.7 9.8 11.0 15.5 13.7 4.2 4.7 -11.2 -6.0France 19.8 18.2 15.4 15.0 12.8 10.1 4.5 3.4 -21.0 -12.7Lithuania 2.4 3.1 4.1 2.4 3.6 5.0 0.5 1.7 39.9 16.0Top 10 369.8 366.2 333.2 319.1 272.6 252.7 84.0 86.2 -7.3 -7.3Others 70.3 62.2 59.7 54.8 54.0 40.5 16.0 13.8 -24.9 -10.4
Americas 5.2 5.3 4.6 3.2 3.4 4.5 1.2 1.5 32.3 -2.8- North America 1.7 1.7 1.3 1.0 0.9 0.5 0.4 0.2 -37.7 -20.1- Central-South America 3.5 3.6 3.3 2.2 2.5 3.9 0.8 1.3 56.2 2.3Asia and Pacific 4.5 10.1 9.5 11.9 19.0 23.2 1.0 7.9 22.0 38.7Europe 429.8 412.4 378.4 358.7 304.1 265.4 97.6 90.5 -12.7 -9.2- European Union (15) 220.7 189.4 187.7 172.1 153.2 123.3 50.1 42.0 -19.5 -11.0- New EU Members (12) 176.3 189.8 153.2 145.1 115.0 103.5 40.0 35.3 -10.0 -10.1- Enlarged EU (27) 397.0 379.2 341.0 317.2 268.2 226.8 90.2 77.3 -15.5 -10.6- Norway & Switzerland 26.0 26.0 28.9 31.5 24.8 26.9 5.9 9.2 8.2 0.7- Other Europe 6.8 7.1 8.5 10.0 11.0 11.7 1.5 4.0 6.3 11.6Middle East 0.4 0.3 0.1 0.0 0.0 0.2 0.1 0.1 n.s. -14.5Africa 0.3 0.2 0.1 0.0 0.0 0.0 0.1 0.0 -24.5 -35.7Other Countries 0.0 0.0 0.0 0.0 0.0 0.0 0.0 0.0 n.c. n.s. World Total 440.1 428.3 392.9 373.9 326.6 293.3 100.0 100.0 -10.2 -7.8Source: CSIL processing of official data n.a.: not available; n.s.: not significant; n.c.: not calculable
EUR million
EUR million
10/09/2008 © Copyright CSILR2413.DE 89
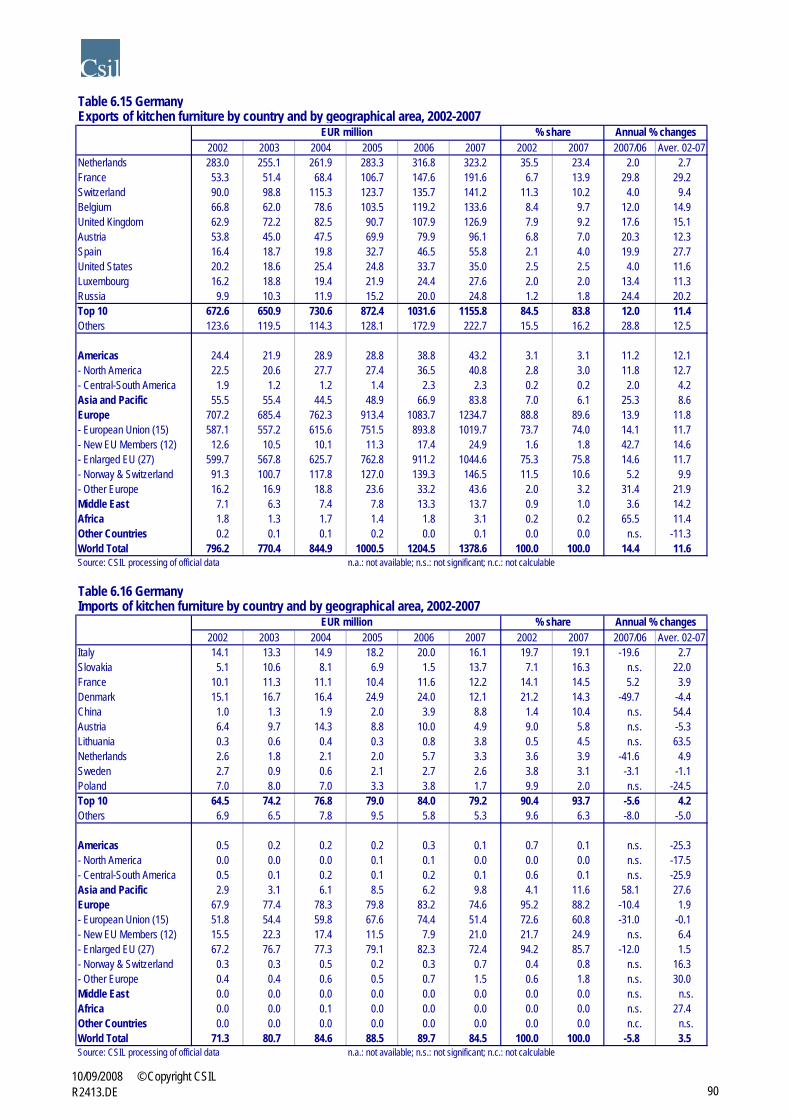
Table 6.15 GermanyExports of kitchen furniture by country and by geographical area, 2002-2007
% share Annual % changes2002 2003 2004 2005 2006 2007 2002 2007 2007/06 Aver. 02-07
Netherlands 283.0 255.1 261.9 283.3 316.8 323.2 35.5 23.4 2.0 2.7France 53.3 51.4 68.4 106.7 147.6 191.6 6.7 13.9 29.8 29.2Switzerland 90.0 98.8 115.3 123.7 135.7 141.2 11.3 10.2 4.0 9.4Belgium 66.8 62.0 78.6 103.5 119.2 133.6 8.4 9.7 12.0 14.9United Kingdom 62.9 72.2 82.5 90.7 107.9 126.9 7.9 9.2 17.6 15.1Austria 53.8 45.0 47.5 69.9 79.9 96.1 6.8 7.0 20.3 12.3Spain 16.4 18.7 19.8 32.7 46.5 55.8 2.1 4.0 19.9 27.7United States 20.2 18.6 25.4 24.8 33.7 35.0 2.5 2.5 4.0 11.6Luxembourg 16.2 18.8 19.4 21.9 24.4 27.6 2.0 2.0 13.4 11.3Russia 9.9 10.3 11.9 15.2 20.0 24.8 1.2 1.8 24.4 20.2Top 10 672.6 650.9 730.6 872.4 1031.6 1155.8 84.5 83.8 12.0 11.4Others 123.6 119.5 114.3 128.1 172.9 222.7 15.5 16.2 28.8 12.5
Americas 24.4 21.9 28.9 28.8 38.8 43.2 3.1 3.1 11.2 12.1- North America 22.5 20.6 27.7 27.4 36.5 40.8 2.8 3.0 11.8 12.7- Central-South America 1.9 1.2 1.2 1.4 2.3 2.3 0.2 0.2 2.0 4.2Asia and Pacific 55.5 55.4 44.5 48.9 66.9 83.8 7.0 6.1 25.3 8.6Europe 707.2 685.4 762.3 913.4 1083.7 1234.7 88.8 89.6 13.9 11.8- European Union (15) 587.1 557.2 615.6 751.5 893.8 1019.7 73.7 74.0 14.1 11.7- New EU Members (12) 12.6 10.5 10.1 11.3 17.4 24.9 1.6 1.8 42.7 14.6- Enlarged EU (27) 599.7 567.8 625.7 762.8 911.2 1044.6 75.3 75.8 14.6 11.7- Norway & Switzerland 91.3 100.7 117.8 127.0 139.3 146.5 11.5 10.6 5.2 9.9- Other Europe 16.2 16.9 18.8 23.6 33.2 43.6 2.0 3.2 31.4 21.9Middle East 7.1 6.3 7.4 7.8 13.3 13.7 0.9 1.0 3.6 14.2Africa 1.8 1.3 1.7 1.4 1.8 3.1 0.2 0.2 65.5 11.4Other Countries 0.2 0.1 0.1 0.2 0.0 0.1 0.0 0.0 n.s. -11.3World Total 796.2 770.4 844.9 1000.5 1204.5 1378.6 100.0 100.0 14.4 11.6Source: CSIL processing of official data n.a.: not available; n.s.: not significant; n.c.: not calculable
Table 6.16 GermanyImports of kitchen furniture by country and by geographical area, 2002-2007
% share Annual % changes2002 2003 2004 2005 2006 2007 2002 2007 2007/06 Aver. 02-07
Italy 14.1 13.3 14.9 18.2 20.0 16.1 19.7 19.1 -19.6 2.7Slovakia 5.1 10.6 8.1 6.9 1.5 13.7 7.1 16.3 n.s. 22.0France 10.1 11.3 11.1 10.4 11.6 12.2 14.1 14.5 5.2 3.9Denmark 15.1 16.7 16.4 24.9 24.0 12.1 21.2 14.3 -49.7 -4.4China 1.0 1.3 1.9 2.0 3.9 8.8 1.4 10.4 n.s. 54.4Austria 6.4 9.7 14.3 8.8 10.0 4.9 9.0 5.8 n.s. -5.3Lithuania 0.3 0.6 0.4 0.3 0.8 3.8 0.5 4.5 n.s. 63.5Netherlands 2.6 1.8 2.1 2.0 5.7 3.3 3.6 3.9 -41.6 4.9Sweden 2.7 0.9 0.6 2.1 2.7 2.6 3.8 3.1 -3.1 -1.1Poland 7.0 8.0 7.0 3.3 3.8 1.7 9.9 2.0 n.s. -24.5Top 10 64.5 74.2 76.8 79.0 84.0 79.2 90.4 93.7 -5.6 4.2Others 6.9 6.5 7.8 9.5 5.8 5.3 9.6 6.3 -8.0 -5.0
Americas 0.5 0.2 0.2 0.2 0.3 0.1 0.7 0.1 n.s. -25.3- North America 0.0 0.0 0.0 0.1 0.1 0.0 0.0 0.0 n.s. -17.5- Central-South America 0.5 0.1 0.2 0.1 0.2 0.1 0.6 0.1 n.s. -25.9Asia and Pacific 2.9 3.1 6.1 8.5 6.2 9.8 4.1 11.6 58.1 27.6Europe 67.9 77.4 78.3 79.8 83.2 74.6 95.2 88.2 -10.4 1.9- European Union (15) 51.8 54.4 59.8 67.6 74.4 51.4 72.6 60.8 -31.0 -0.1- New EU Members (12) 15.5 22.3 17.4 11.5 7.9 21.0 21.7 24.9 n.s. 6.4- Enlarged EU (27) 67.2 76.7 77.3 79.1 82.3 72.4 94.2 85.7 -12.0 1.5- Norway & Switzerland 0.3 0.3 0.5 0.2 0.3 0.7 0.4 0.8 n.s. 16.3- Other Europe 0.4 0.4 0.6 0.5 0.7 1.5 0.6 1.8 n.s. 30.0Middle East 0.0 0.0 0.0 0.0 0.0 0.0 0.0 0.0 n.s. n.s. Africa 0.0 0.0 0.1 0.0 0.0 0.0 0.0 0.0 n.s. 27.4Other Countries 0.0 0.0 0.0 0.0 0.0 0.0 0.0 0.0 n.c. n.s. World Total 71.3 80.7 84.6 88.5 89.7 84.5 100.0 100.0 -5.8 3.5Source: CSIL processing of official data n.a.: not available; n.s.: not significant; n.c.: not calculable
EUR million
EUR million
10/09/2008 © Copyright CSILR2413.DE 90
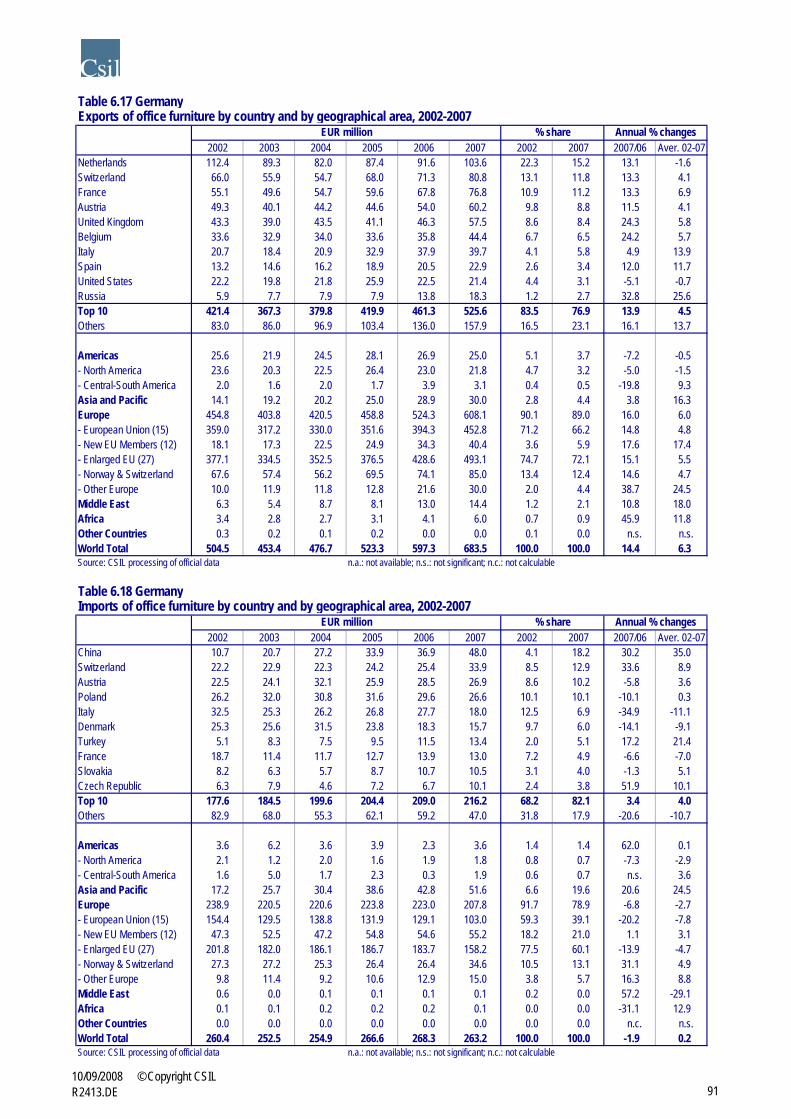
Table 6.17 GermanyExports of office furniture by country and by geographical area, 2002-2007
% share Annual % changes2002 2003 2004 2005 2006 2007 2002 2007 2007/06 Aver. 02-07
Netherlands 112.4 89.3 82.0 87.4 91.6 103.6 22.3 15.2 13.1 -1.6Switzerland 66.0 55.9 54.7 68.0 71.3 80.8 13.1 11.8 13.3 4.1France 55.1 49.6 54.7 59.6 67.8 76.8 10.9 11.2 13.3 6.9Austria 49.3 40.1 44.2 44.6 54.0 60.2 9.8 8.8 11.5 4.1United Kingdom 43.3 39.0 43.5 41.1 46.3 57.5 8.6 8.4 24.3 5.8Belgium 33.6 32.9 34.0 33.6 35.8 44.4 6.7 6.5 24.2 5.7Italy 20.7 18.4 20.9 32.9 37.9 39.7 4.1 5.8 4.9 13.9Spain 13.2 14.6 16.2 18.9 20.5 22.9 2.6 3.4 12.0 11.7United States 22.2 19.8 21.8 25.9 22.5 21.4 4.4 3.1 -5.1 -0.7Russia 5.9 7.7 7.9 7.9 13.8 18.3 1.2 2.7 32.8 25.6Top 10 421.4 367.3 379.8 419.9 461.3 525.6 83.5 76.9 13.9 4.5Others 83.0 86.0 96.9 103.4 136.0 157.9 16.5 23.1 16.1 13.7
Americas 25.6 21.9 24.5 28.1 26.9 25.0 5.1 3.7 -7.2 -0.5- North America 23.6 20.3 22.5 26.4 23.0 21.8 4.7 3.2 -5.0 -1.5- Central-South America 2.0 1.6 2.0 1.7 3.9 3.1 0.4 0.5 -19.8 9.3Asia and Pacific 14.1 19.2 20.2 25.0 28.9 30.0 2.8 4.4 3.8 16.3Europe 454.8 403.8 420.5 458.8 524.3 608.1 90.1 89.0 16.0 6.0- European Union (15) 359.0 317.2 330.0 351.6 394.3 452.8 71.2 66.2 14.8 4.8- New EU Members (12) 18.1 17.3 22.5 24.9 34.3 40.4 3.6 5.9 17.6 17.4- Enlarged EU (27) 377.1 334.5 352.5 376.5 428.6 493.1 74.7 72.1 15.1 5.5- Norway & Switzerland 67.6 57.4 56.2 69.5 74.1 85.0 13.4 12.4 14.6 4.7- Other Europe 10.0 11.9 11.8 12.8 21.6 30.0 2.0 4.4 38.7 24.5Middle East 6.3 5.4 8.7 8.1 13.0 14.4 1.2 2.1 10.8 18.0Africa 3.4 2.8 2.7 3.1 4.1 6.0 0.7 0.9 45.9 11.8Other Countries 0.3 0.2 0.1 0.2 0.0 0.0 0.1 0.0 n.s. n.s. World Total 504.5 453.4 476.7 523.3 597.3 683.5 100.0 100.0 14.4 6.3Source: CSIL processing of official data n.a.: not available; n.s.: not significant; n.c.: not calculable
Table 6.18 GermanyImports of office furniture by country and by geographical area, 2002-2007
% share Annual % changes2002 2003 2004 2005 2006 2007 2002 2007 2007/06 Aver. 02-07
China 10.7 20.7 27.2 33.9 36.9 48.0 4.1 18.2 30.2 35.0Switzerland 22.2 22.9 22.3 24.2 25.4 33.9 8.5 12.9 33.6 8.9Austria 22.5 24.1 32.1 25.9 28.5 26.9 8.6 10.2 -5.8 3.6Poland 26.2 32.0 30.8 31.6 29.6 26.6 10.1 10.1 -10.1 0.3Italy 32.5 25.3 26.2 26.8 27.7 18.0 12.5 6.9 -34.9 -11.1Denmark 25.3 25.6 31.5 23.8 18.3 15.7 9.7 6.0 -14.1 -9.1Turkey 5.1 8.3 7.5 9.5 11.5 13.4 2.0 5.1 17.2 21.4France 18.7 11.4 11.7 12.7 13.9 13.0 7.2 4.9 -6.6 -7.0Slovakia 8.2 6.3 5.7 8.7 10.7 10.5 3.1 4.0 -1.3 5.1Czech Republic 6.3 7.9 4.6 7.2 6.7 10.1 2.4 3.8 51.9 10.1Top 10 177.6 184.5 199.6 204.4 209.0 216.2 68.2 82.1 3.4 4.0Others 82.9 68.0 55.3 62.1 59.2 47.0 31.8 17.9 -20.6 -10.7
Americas 3.6 6.2 3.6 3.9 2.3 3.6 1.4 1.4 62.0 0.1- North America 2.1 1.2 2.0 1.6 1.9 1.8 0.8 0.7 -7.3 -2.9- Central-South America 1.6 5.0 1.7 2.3 0.3 1.9 0.6 0.7 n.s. 3.6Asia and Pacific 17.2 25.7 30.4 38.6 42.8 51.6 6.6 19.6 20.6 24.5Europe 238.9 220.5 220.6 223.8 223.0 207.8 91.7 78.9 -6.8 -2.7- European Union (15) 154.4 129.5 138.8 131.9 129.1 103.0 59.3 39.1 -20.2 -7.8- New EU Members (12) 47.3 52.5 47.2 54.8 54.6 55.2 18.2 21.0 1.1 3.1- Enlarged EU (27) 201.8 182.0 186.1 186.7 183.7 158.2 77.5 60.1 -13.9 -4.7- Norway & Switzerland 27.3 27.2 25.3 26.4 26.4 34.6 10.5 13.1 31.1 4.9- Other Europe 9.8 11.4 9.2 10.6 12.9 15.0 3.8 5.7 16.3 8.8Middle East 0.6 0.0 0.1 0.1 0.1 0.1 0.2 0.0 57.2 -29.1Africa 0.1 0.1 0.2 0.2 0.2 0.1 0.0 0.0 -31.1 12.9Other Countries 0.0 0.0 0.0 0.0 0.0 0.0 0.0 0.0 n.c. n.s. World Total 260.4 252.5 254.9 266.6 268.3 263.2 100.0 100.0 -1.9 0.2Source: CSIL processing of official data n.a.: not available; n.s.: not significant; n.c.: not calculable
EUR million
EUR million
10/09/2008 © Copyright CSILR2413.DE 91

Table 6.19 GermanyExports of furniture for dining and living rooms by country and by geographical area, 2002-2007
% share Annual % changes2002 2003 2004 2005 2006 2007 2002 2007 2007/06 Aver. 02-07
Austria 66.0 52.2 58.1 59.1 69.9 66.7 22.4 18.5 -4.6 0.2Switzerland 40.8 40.3 35.8 36.2 39.5 42.5 13.9 11.8 7.5 0.8France 26.1 24.6 27.7 30.8 37.3 42.1 8.8 11.7 13.0 10.1Netherlands 35.1 27.9 19.9 18.2 22.0 28.8 11.9 8.0 31.0 -3.9United Kingdom 20.4 24.5 31.8 29.1 27.9 27.9 6.9 7.8 0.0 6.5United States 15.1 16.0 18.3 17.5 21.0 22.7 5.1 6.3 7.9 8.4Belgium 17.1 18.1 19.6 17.0 16.6 18.3 5.8 5.1 10.0 1.4Sweden 12.8 13.3 15.4 16.9 16.4 15.9 4.4 4.4 -3.1 4.3Russia 6.9 7.9 9.0 8.8 10.7 13.1 2.3 3.6 22.1 13.7Luxembourg 8.6 9.2 10.6 10.2 13.1 12.8 2.9 3.6 -2.7 8.3Top 10 248.9 234.0 246.2 243.9 274.5 290.7 84.4 80.8 5.9 3.2Others 45.9 47.7 47.4 58.5 65.9 69.2 15.6 19.2 4.9 8.6
Americas 21.1 20.4 22.7 24.8 30.5 32.2 7.1 9.0 5.7 8.9- North America 20.0 20.0 22.5 24.5 30.3 32.0 6.8 8.9 5.8 9.9- Central-South America 1.1 0.4 0.2 0.2 0.2 0.2 0.4 0.1 -12.2 -27.4Asia and Pacific 6.3 4.9 7.3 6.3 8.1 7.8 2.1 2.2 -4.1 4.2Europe 265.6 254.9 262.1 269.4 300.4 318.0 90.1 88.4 5.9 3.7- European Union (15) 195.8 183.4 199.4 204.0 224.6 236.3 66.4 65.7 5.2 3.8- New EU Members (12) 18.6 17.8 13.8 15.8 19.2 18.9 6.3 5.2 -1.8 0.3- Enlarged EU (27) 214.3 201.2 213.2 219.7 243.8 255.1 72.7 70.9 4.7 3.5- Norway & Switzerland 41.0 41.8 36.6 37.1 41.3 43.7 13.9 12.1 5.8 1.3- Other Europe 10.3 11.8 12.3 12.6 15.3 19.2 3.5 5.3 25.1 13.3Middle East 1.0 0.6 0.5 0.6 0.6 1.2 0.3 0.3 97.7 4.5Africa 0.6 0.6 0.8 1.0 0.7 0.6 0.2 0.2 -7.9 0.3Other Countries 0.2 0.2 0.2 0.4 0.1 0.0 0.1 0.0 n.s. -41.8World Total 294.8 281.6 293.6 302.4 340.4 359.9 100.0 100.0 5.7 4.1Source: CSIL processing of official data n.a.: not available; n.s.: not significant; n.c.: not calculable
Table 6.20 GermanyImports of furniture for dining and living rooms by country and by geographical area, 2002-2007
% share Annual % changes2002 2003 2004 2005 2006 2007 2002 2007 2007/06 Aver. 02-07
Poland 184.7 185.6 183.8 217.3 199.8 168.1 22.4 26.7 -15.8 -1.9Italy 157.4 139.1 127.7 107.2 89.7 73.5 19.1 11.7 -18.0 -14.1Denmark 119.3 101.7 107.6 96.7 86.2 69.9 14.4 11.1 -18.9 -10.1China 14.1 22.2 26.2 30.5 40.2 58.1 1.7 9.2 44.5 32.7Netherlands 34.2 33.4 30.1 28.0 29.7 27.6 4.1 4.4 -7.0 -4.2Austria 22.2 16.5 18.5 21.8 23.6 20.9 2.7 3.3 -11.6 -1.2Slovakia 16.7 20.4 20.3 21.2 19.4 20.3 2.0 3.2 4.2 3.9Romania 43.2 47.1 50.0 46.4 38.8 16.8 5.2 2.7 n.s. -17.2France 15.9 16.5 18.6 19.1 18.1 15.4 1.9 2.4 -14.9 -0.7India 3.1 3.5 4.7 7.0 7.6 15.1 0.4 2.4 97.6 37.2Top 10 610.9 586.1 587.5 595.4 553.0 485.6 74.0 77.2 -12.2 -4.5Others 214.9 189.0 168.3 162.9 168.1 143.1 26.0 22.8 -14.9 -7.8
Americas 8.6 9.5 9.1 10.9 13.1 15.7 1.0 2.5 19.5 12.7- North America 1.2 1.4 0.8 0.7 0.8 1.3 0.2 0.2 60.6 0.6- Central-South America 7.4 8.0 8.3 10.2 12.3 14.4 0.9 2.3 16.8 14.3Asia and Pacific 37.1 42.5 48.6 55.9 69.7 96.1 4.5 15.3 37.9 20.9Europe 779.2 722.3 697.1 690.9 637.5 516.0 94.4 82.1 -19.1 -7.9- European Union (15) 428.6 380.6 361.2 335.0 297.7 239.8 51.9 38.1 -19.4 -11.0- New EU Members (12) 323.5 316.4 300.5 320.1 300.3 239.0 39.2 38.0 -20.4 -5.9- Enlarged EU (27) 752.1 697.0 661.7 655.1 598.0 478.8 91.1 76.2 -19.9 -8.6- Norway & Switzerland 11.5 9.4 10.3 9.3 9.6 11.5 1.4 1.8 19.3 0.0- Other Europe 15.6 15.9 25.1 26.6 29.9 25.7 1.9 4.1 -14.2 10.5Middle East 0.2 0.2 0.4 0.2 0.2 0.4 0.0 0.1 n.s. 9.6Africa 0.6 0.5 0.5 0.5 0.6 0.6 0.1 0.1 -7.2 0.7Other Countries 0.0 0.0 0.0 0.0 0.0 0.0 0.0 0.0 n.c. n.s. World Total 825.8 775.1 755.9 758.3 721.2 628.7 100.0 100.0 -12.8 -5.3Source: CSIL processing of official data n.a.: not available; n.s.: not significant; n.c.: not calculable
EUR million
EUR million
10/09/2008 © Copyright CSILR2413.DE 92

Table 6.21 GermanyExports of other furniture by country and by geographical area, 2002-2007
% share Annual % changes2002 2003 2004 2005 2006 2007 2002 2007 2007/06 Aver. 02-07
France 159.4 172.7 213.0 192.0 223.0 212.4 17.1 14.9 -4.7 5.9Austria 117.3 120.5 136.7 142.8 151.0 154.9 12.6 10.8 2.6 5.7Switzerland 107.2 107.4 112.6 127.8 131.0 150.6 11.5 10.5 14.9 7.0Netherlands 100.7 99.0 117.0 117.6 133.6 126.8 10.8 8.9 -5.1 4.7United Kingdom 93.1 77.9 100.7 105.5 129.7 116.9 10.0 8.2 -9.9 4.7United States 41.9 32.7 35.6 54.6 62.6 82.7 4.5 5.8 32.0 14.6Italy 35.5 35.3 44.7 46.7 58.6 62.8 3.8 4.4 7.1 12.1Spain 34.4 38.9 51.6 66.3 67.8 61.5 3.7 4.3 -9.3 12.3Russia 18.9 19.3 21.4 31.3 45.2 56.3 2.0 3.9 24.5 24.3Belgium 40.2 36.5 61.5 49.6 56.7 55.5 4.3 3.9 -2.1 6.7Top 10 748.4 740.2 894.7 934.3 1059.3 1080.3 80.4 75.7 2.0 7.6Others 182.4 183.8 218.4 272.0 312.2 347.5 19.6 24.3 11.3 13.8
Americas 48.2 38.4 40.6 61.4 73.8 92.8 5.2 6.5 25.8 14.0- North America 43.4 34.1 37.1 57.2 64.9 87.9 4.7 6.2 35.4 15.1- Central-South America 4.8 4.3 3.6 4.2 8.9 4.9 0.5 0.3 -44.7 0.7Asia and Pacific 22.8 19.6 29.3 34.2 34.3 46.3 2.5 3.2 34.9 15.2Europe 843.6 852.5 1028.7 1086.3 1233.1 1256.9 90.6 88.0 1.9 8.3- European Union (15) 638.2 642.1 798.0 811.2 911.8 878.5 68.6 61.5 -3.6 6.6- New EU Members (12) 61.9 63.2 71.8 90.1 107.7 124.6 6.6 8.7 15.6 15.0- Enlarged EU (27) 700.1 705.2 869.9 901.3 1019.5 1003.1 75.2 70.3 -1.6 7.5- Norway & Switzerland 111.9 112.2 119.7 134.9 140.0 163.0 12.0 11.4 16.4 7.8- Other Europe 31.6 35.1 39.1 50.1 73.6 90.8 3.4 6.4 23.4 23.5Middle East 8.6 7.5 8.7 17.1 21.5 20.6 0.9 1.4 -4.1 19.2Africa 7.0 5.4 5.3 6.7 8.8 11.3 0.7 0.8 28.3 10.1Other Countries 0.7 0.6 0.6 0.6 0.1 0.0 0.1 0.0 -46.5 -45.8World Total 930.8 924.1 1113.2 1206.3 1371.5 1427.9 100.0 100.0 4.1 8.9Source: CSIL processing of official data n.a.: not available; n.s.: not significant; n.c.: not calculable
Table 6.22 GermanyImports of other furniture by country and by geographical area, 2002-2007
% share Annual % changes2002 2003 2004 2005 2006 2007 2002 2007 2007/06 Aver. 02-07
China 78.4 103.8 145.3 184.4 201.5 233.4 8.4 20.0 15.8 24.4Poland 92.7 118.1 115.2 139.2 159.1 161.7 9.9 13.9 1.6 11.8Italy 181.3 159.4 159.1 143.4 143.3 122.1 19.3 10.5 -14.8 -7.6Denmark 63.5 68.3 76.2 65.7 61.2 77.3 6.8 6.6 26.2 4.0Switzerland 52.0 48.2 46.7 48.2 53.7 69.6 5.5 6.0 29.7 6.0Netherlands 51.1 65.8 74.0 96.4 82.7 61.1 5.4 5.2 -26.1 3.7Austria 29.6 29.1 35.9 44.6 48.9 40.1 3.2 3.4 -17.9 6.3Vietnam 8.7 17.8 23.7 26.4 32.4 39.2 0.9 3.4 20.9 35.0France 34.8 38.7 34.2 35.5 41.8 38.8 3.7 3.3 -7.2 2.2Czech Republic 38.2 41.7 32.9 32.6 33.8 36.4 4.1 3.1 7.6 -1.0Top 10 630.3 690.9 743.2 816.5 858.4 879.7 67.2 75.5 2.5 6.9Others 307.7 300.3 320.0 311.0 317.9 285.6 32.8 24.5 -10.2 -1.5
Americas 14.9 12.9 12.5 13.0 11.3 12.5 1.6 1.1 10.8 -3.4- North America 8.8 5.8 5.6 5.4 6.2 6.8 0.9 0.6 8.9 -5.2- Central-South America 6.1 7.1 7.0 7.5 5.1 5.8 0.6 0.5 13.2 -1.0Asia and Pacific 160.5 204.4 245.3 282.6 301.9 341.6 17.1 29.3 13.2 16.3Europe 751.1 762.4 797.8 822.7 855.3 803.4 80.1 68.9 -6.1 1.4- European Union (15) 460.8 433.9 462.5 470.6 461.3 399.7 49.1 34.3 -13.4 -2.8- New EU Members (12) 224.0 261.0 261.1 275.4 313.6 306.6 23.9 26.3 -2.2 6.5- Enlarged EU (27) 684.8 694.9 723.5 746.0 775.0 706.3 73.0 60.6 -8.9 0.6- Norway & Switzerland 52.7 48.7 47.2 49.3 54.2 69.9 5.6 6.0 29.0 5.8- Other Europe 13.6 18.8 27.1 27.3 26.2 27.2 1.5 2.3 3.9 14.8Middle East 10.0 10.1 6.5 8.3 7.0 6.9 1.1 0.6 -1.2 -7.3Africa 1.5 1.4 1.2 0.9 0.9 0.9 0.2 0.1 3.6 -9.2Other Countries 0.0 0.0 0.0 0.0 0.0 0.0 0.0 0.0 n.c. n.s. World Total 938.0 991.2 1063.3 1127.5 1176.3 1165.3 100.0 100.0 -0.9 4.4Source: CSIL processing of official data n.a.: not available; n.s.: not significant; n.c.: not calculable
EUR million
EUR million
10/09/2008 © Copyright CSILR2413.DE 93

Table 6.23 GermanyExports of furniture parts excluding parts of seats by country and by geographical area, 2002-2007
% share Annual % changes2002 2003 2004 2005 2006 2007 2002 2007 2007/06 Aver. 02-07
France 40.3 49.5 52.6 58.1 63.8 110.9 10.3 13.3 73.7 22.4Netherlands 40.8 38.8 45.3 53.4 62.9 77.2 10.4 9.3 22.6 13.6United Kingdom 39.3 43.4 46.6 51.9 60.4 76.2 10.0 9.2 26.2 14.2Switzerland 51.7 56.0 52.1 56.2 60.1 67.7 13.2 8.1 12.6 5.5Austria 41.0 38.8 41.4 45.9 47.8 54.6 10.5 6.6 14.1 5.9Spain 12.7 18.6 20.7 25.5 31.3 49.6 3.2 6.0 58.6 31.3Belgium 23.2 20.9 22.1 31.6 34.3 45.8 5.9 5.5 33.3 14.5Italy 14.2 19.1 24.3 25.8 29.2 40.5 3.6 4.9 38.9 23.3Denmark 20.7 21.0 24.8 31.9 35.8 36.9 5.3 4.4 3.1 12.3United States 17.8 16.7 19.2 20.6 24.1 28.1 4.5 3.4 16.7 9.5Top 10 301.8 322.8 349.1 401.0 449.7 587.4 77.0 70.6 30.6 14.2Others 90.3 101.9 122.1 142.1 192.0 244.8 23.0 29.4 27.5 22.1
Americas 21.1 19.7 22.8 26.0 31.1 38.3 5.4 4.6 23.4 12.7- North America 19.6 18.3 21.5 24.3 28.5 35.9 5.0 4.3 25.6 12.8- Central-South America 1.5 1.3 1.3 1.6 2.5 2.5 0.4 0.3 -1.3 10.8Asia and Pacific 22.1 27.4 27.9 33.6 35.0 53.0 5.6 6.4 51.2 19.1Europe 341.2 370.3 411.2 473.4 560.9 721.0 87.0 86.6 28.6 16.1- European Union (15) 248.1 272.1 304.7 357.2 406.0 539.5 63.3 64.8 32.9 16.8- New EU Members (12) 29.3 31.6 40.7 41.7 64.2 73.8 7.5 8.9 14.9 20.3- Enlarged EU (27) 277.4 303.7 345.4 398.9 470.2 613.2 70.7 73.7 30.4 17.2- Norway & Switzerland 53.4 57.5 54.2 58.8 63.9 73.1 13.6 8.8 14.5 6.5- Other Europe 10.5 9.2 11.6 15.6 26.8 34.6 2.7 4.2 29.3 26.9Middle East 5.4 5.8 7.3 7.0 12.6 17.1 1.4 2.1 35.6 26.0Africa 1.8 1.3 1.8 3.0 2.2 2.7 0.5 0.3 24.2 8.6Other Countries 0.5 0.3 0.2 0.2 0.0 0.1 0.1 0.0 n.s. -32.2World Total 392.1 424.7 471.2 543.1 641.8 832.2 100.0 100.0 29.7 16.2Source: CSIL processing of official data n.a.: not available; n.s.: not significant; n.c.: not calculable
Table 6.24 GermanyImports of furniture parts excluding parts of seats by country and by geographical area, 2002-2007
% share Annual % changes2002 2003 2004 2005 2006 2007 2002 2007 2007/06 Aver. 02-07
Italy 188.6 179.7 171.2 207.6 235.5 236.0 27.5 26.9 0.2 4.6Austria 63.9 64.8 74.7 106.3 114.2 94.8 9.3 10.8 -17.0 8.2Switzerland 69.7 66.3 59.6 66.0 79.9 92.4 10.2 10.6 15.7 5.8Poland 74.4 87.7 65.7 52.1 67.3 80.3 10.8 9.2 19.2 1.5Sweden 48.7 44.6 40.3 62.7 66.6 64.9 7.1 7.4 -2.5 5.9China 14.2 20.4 28.7 31.8 39.6 61.9 2.1 7.1 56.3 34.2Czech Republic 51.2 48.7 39.6 33.5 38.1 33.6 7.5 3.8 -11.7 -8.0Hungary 22.8 27.5 24.5 20.0 17.7 28.3 3.3 3.2 60.0 4.4Slovakia 17.4 21.4 20.5 25.1 26.5 27.4 2.5 3.1 3.7 9.5Lithuania 5.6 9.2 7.5 12.4 13.6 23.4 0.8 2.7 72.0 33.2Top 10 556.4 570.3 532.1 617.5 699.0 743.1 81.1 84.8 6.3 6.0Others 129.8 131.3 129.7 134.0 132.4 132.9 18.9 15.2 0.3 0.5
Americas 3.6 2.5 1.7 1.4 1.5 1.7 0.5 0.2 15.9 -13.9- North America 2.8 1.8 1.2 1.1 1.2 1.3 0.4 0.2 8.6 -14.1- Central-South America 0.7 0.7 0.5 0.4 0.2 0.4 0.1 0.0 52.7 -13.2Asia and Pacific 31.9 36.4 43.0 44.7 60.8 87.6 4.6 10.0 44.1 22.4Europe 650.4 662.3 616.9 705.2 768.9 786.5 94.8 89.8 2.3 3.9- European Union (15) 361.2 352.0 351.1 457.3 482.2 456.2 52.6 52.1 -5.4 4.8- New EU Members (12) 201.0 222.8 180.0 159.8 184.5 214.9 29.3 24.5 16.5 1.3- Enlarged EU (27) 562.2 574.8 531.1 617.2 666.7 671.2 81.9 76.6 0.7 3.6- Norway & Switzerland 70.0 66.5 59.9 66.6 80.2 92.5 10.2 10.6 15.4 5.7- Other Europe 18.2 21.0 25.8 21.4 22.0 22.8 2.7 2.6 3.6 4.6Middle East 0.2 0.1 0.1 0.1 0.1 0.0 0.0 0.0 n.s. -22.7Africa 0.2 0.2 0.1 0.1 0.1 0.1 0.0 0.0 -17.0 -11.3Other Countries 0.0 0.0 0.1 0.0 0.0 0.0 0.0 0.0 n.c. n.s. World Total 686.3 701.6 661.8 751.5 831.5 876.0 100.0 100.0 5.4 5.0Source: CSIL processing of official data n.a.: not available; n.s.: not significant; n.c.: not calculable
EUR million
EUR million
10/09/2008 © Copyright CSILR2413.DE 94
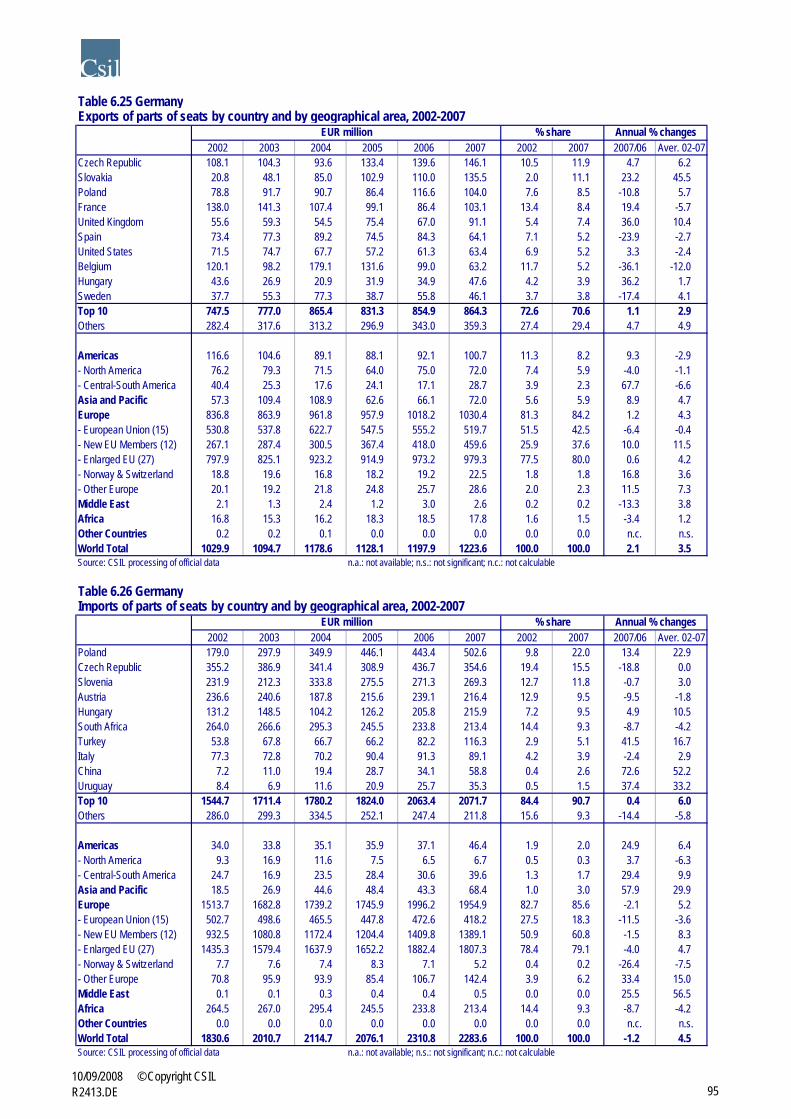
Table 6.25 GermanyExports of parts of seats by country and by geographical area, 2002-2007
% share Annual % changes2002 2003 2004 2005 2006 2007 2002 2007 2007/06 Aver. 02-07
Czech Republic 108.1 104.3 93.6 133.4 139.6 146.1 10.5 11.9 4.7 6.2Slovakia 20.8 48.1 85.0 102.9 110.0 135.5 2.0 11.1 23.2 45.5Poland 78.8 91.7 90.7 86.4 116.6 104.0 7.6 8.5 -10.8 5.7France 138.0 141.3 107.4 99.1 86.4 103.1 13.4 8.4 19.4 -5.7United Kingdom 55.6 59.3 54.5 75.4 67.0 91.1 5.4 7.4 36.0 10.4Spain 73.4 77.3 89.2 74.5 84.3 64.1 7.1 5.2 -23.9 -2.7United States 71.5 74.7 67.7 57.2 61.3 63.4 6.9 5.2 3.3 -2.4Belgium 120.1 98.2 179.1 131.6 99.0 63.2 11.7 5.2 -36.1 -12.0Hungary 43.6 26.9 20.9 31.9 34.9 47.6 4.2 3.9 36.2 1.7Sweden 37.7 55.3 77.3 38.7 55.8 46.1 3.7 3.8 -17.4 4.1Top 10 747.5 777.0 865.4 831.3 854.9 864.3 72.6 70.6 1.1 2.9Others 282.4 317.6 313.2 296.9 343.0 359.3 27.4 29.4 4.7 4.9
Americas 116.6 104.6 89.1 88.1 92.1 100.7 11.3 8.2 9.3 -2.9- North America 76.2 79.3 71.5 64.0 75.0 72.0 7.4 5.9 -4.0 -1.1- Central-South America 40.4 25.3 17.6 24.1 17.1 28.7 3.9 2.3 67.7 -6.6Asia and Pacific 57.3 109.4 108.9 62.6 66.1 72.0 5.6 5.9 8.9 4.7Europe 836.8 863.9 961.8 957.9 1018.2 1030.4 81.3 84.2 1.2 4.3- European Union (15) 530.8 537.8 622.7 547.5 555.2 519.7 51.5 42.5 -6.4 -0.4- New EU Members (12) 267.1 287.4 300.5 367.4 418.0 459.6 25.9 37.6 10.0 11.5- Enlarged EU (27) 797.9 825.1 923.2 914.9 973.2 979.3 77.5 80.0 0.6 4.2- Norway & Switzerland 18.8 19.6 16.8 18.2 19.2 22.5 1.8 1.8 16.8 3.6- Other Europe 20.1 19.2 21.8 24.8 25.7 28.6 2.0 2.3 11.5 7.3Middle East 2.1 1.3 2.4 1.2 3.0 2.6 0.2 0.2 -13.3 3.8Africa 16.8 15.3 16.2 18.3 18.5 17.8 1.6 1.5 -3.4 1.2Other Countries 0.2 0.2 0.1 0.0 0.0 0.0 0.0 0.0 n.c. n.s. World Total 1029.9 1094.7 1178.6 1128.1 1197.9 1223.6 100.0 100.0 2.1 3.5Source: CSIL processing of official data n.a.: not available; n.s.: not significant; n.c.: not calculable
Table 6.26 GermanyImports of parts of seats by country and by geographical area, 2002-2007
% share Annual % changes2002 2003 2004 2005 2006 2007 2002 2007 2007/06 Aver. 02-07
Poland 179.0 297.9 349.9 446.1 443.4 502.6 9.8 22.0 13.4 22.9Czech Republic 355.2 386.9 341.4 308.9 436.7 354.6 19.4 15.5 -18.8 0.0Slovenia 231.9 212.3 333.8 275.5 271.3 269.3 12.7 11.8 -0.7 3.0Austria 236.6 240.6 187.8 215.6 239.1 216.4 12.9 9.5 -9.5 -1.8Hungary 131.2 148.5 104.2 126.2 205.8 215.9 7.2 9.5 4.9 10.5South Africa 264.0 266.6 295.3 245.5 233.8 213.4 14.4 9.3 -8.7 -4.2Turkey 53.8 67.8 66.7 66.2 82.2 116.3 2.9 5.1 41.5 16.7Italy 77.3 72.8 70.2 90.4 91.3 89.1 4.2 3.9 -2.4 2.9China 7.2 11.0 19.4 28.7 34.1 58.8 0.4 2.6 72.6 52.2Uruguay 8.4 6.9 11.6 20.9 25.7 35.3 0.5 1.5 37.4 33.2Top 10 1544.7 1711.4 1780.2 1824.0 2063.4 2071.7 84.4 90.7 0.4 6.0Others 286.0 299.3 334.5 252.1 247.4 211.8 15.6 9.3 -14.4 -5.8
Americas 34.0 33.8 35.1 35.9 37.1 46.4 1.9 2.0 24.9 6.4- North America 9.3 16.9 11.6 7.5 6.5 6.7 0.5 0.3 3.7 -6.3- Central-South America 24.7 16.9 23.5 28.4 30.6 39.6 1.3 1.7 29.4 9.9Asia and Pacific 18.5 26.9 44.6 48.4 43.3 68.4 1.0 3.0 57.9 29.9Europe 1513.7 1682.8 1739.2 1745.9 1996.2 1954.9 82.7 85.6 -2.1 5.2- European Union (15) 502.7 498.6 465.5 447.8 472.6 418.2 27.5 18.3 -11.5 -3.6- New EU Members (12) 932.5 1080.8 1172.4 1204.4 1409.8 1389.1 50.9 60.8 -1.5 8.3- Enlarged EU (27) 1435.3 1579.4 1637.9 1652.2 1882.4 1807.3 78.4 79.1 -4.0 4.7- Norway & Switzerland 7.7 7.6 7.4 8.3 7.1 5.2 0.4 0.2 -26.4 -7.5- Other Europe 70.8 95.9 93.9 85.4 106.7 142.4 3.9 6.2 33.4 15.0Middle East 0.1 0.1 0.3 0.4 0.4 0.5 0.0 0.0 25.5 56.5Africa 264.5 267.0 295.4 245.5 233.8 213.4 14.4 9.3 -8.7 -4.2Other Countries 0.0 0.0 0.0 0.0 0.0 0.0 0.0 0.0 n.c. n.s. World Total 1830.6 2010.7 2114.7 2076.1 2310.8 2283.6 100.0 100.0 -1.2 4.5Source: CSIL processing of official data n.a.: not available; n.s.: not significant; n.c.: not calculable
EUR million
EUR million
10/09/2008 © Copyright CSILR2413.DE 95