the frustration-aggression hypothesis revisited: a
TRANSCRIPT

THE FRUSTRATION-AGGRESSION HYPOTHESIS REVISITED:
A DEVIANCE CONGRUENCE PERSPECTIVE
by
WAYNE S. CRAWFORD, JR.
DIANE E. JOHNSON, COMMITTEE CO-CHAIR
K. MICHELE KACMAR, COMMITTEE CO-CHAIR
MARK B. GAVIN
KIM SYDOW CAMPBELL
MARILYN V. WHITMAN
A DISSERTATION
Submitted in partial fulfillment of the requirements
for the degree of Doctor of Philosophy
in the Department of Management
in the Graduate School of
The University of Alabama
TUSCALOOSA, ALABAMA
2015

Copyright Wayne S. Crawford, Jr. 2015
ALL RIGHTS RESERVED

ii
ABSTRACT
In 1939, Dollard and colleagues presented the frustration-aggression theory. The main tenet of
the theory posits that individuals become frustrated when goal attainment is prohibited or
interrupted. Further, following frustrating events, individuals will respond with aggressive
behaviors as a form of retaliation against agents of the frustrating events. Organizational
deviance has been posited as one such aggressive reaction (Fox & Spector, 1999). This
dissertation takes a unique perspective on organizational deviance; I argue that situations may
arise when organizational deviance perceptions also serve as an antecedent of frustration.
Specifically, I argue that in circumstances where supervisors’ and subordinates’ perceptions of
employee deviance are incongruent, or misaligned, employees will become frustrated. Frustrated
employees engage in aggressive behaviors in the form of retaliation and displaced aggression
(Berkowitz, 1989). In the current study, I propose that frustrated employees may both retaliate at
work and displace their aggression in both the work and family domains. Thus, I argue
frustration leads to higher levels of coworker abuse, greater levels of relationship conflict, and
greater work-to-family conflict. I also hypothesize that frustration will result in employees
engaging in fewer interpersonal citizenship behaviors, which is also detrimental to organizations.
This dissertation uses a time-lagged research design and field sample to test the hypotheses
offered. A sample of 215 supervisor-subordinate dyads from a large municipality in the
southeastern United States was used for hypothesis testing. I followed the latent congruence
modeling procedures to test the hypotheses offered (Cheung, 2009). The structural-equation
based latent congruence model allowed me to test the effects of incongruence on the mediator

iii
and whether frustration ultimately predicted the outcome variables. I did not find support for the
hypothesized mediation model using congruence analysis.

iv
DEDICATION
I would like to dedicate this dissertation to all of my family, friends, and professors that
have supported me throughout this journey. Your guidance, faith, love, and support have been,
and continue to be, what makes it possible for me to continue pushing forward.

v
LIST OF ABBREVIATIONS AND SYMBOLS
N Sample Size
+ Positive Relationship
- Negative Relationship
SD Standard Deviation
M Mean
LCM-1 Confirmatory Factor Analysis Component of Latent Congruence Model
LCM-2 Congruence Analysis Component of Latent Congruence Model
LCM-3 Component Analysis Component of Latent Congruence Model
CFA Confirmatory Factor Analysis
√ Square Root
AVE Average Variance Explained
r Correlation
< Less Than
= Equal to
p Significance Level
s.e. Standard Error of the Estimate
b Unstandardized Beta Coefficient
χ2 Chi-square Statistic
df Degrees of Freedom

vi
∆χ2 Change in Chi-square Statistic
∆df Change in Degrees of Freedom
† Employee-rated Variable
‡ Supervisor-rated Variable

vii
ACKNOWLEDGMENTS
This dissertation is the culmination of many fortunate events, people, and God’s
providence. I am unable to express in words the respect, love, indebtedness, appreciation, and
gratitude that I have for all of my family, friends, and professors that have taught and supported
me throughout my life. I would like to first thank God, and my savior Jesus Christ. I would also
like to thank my family for being entirely supportive and loving throughout this process.
Specifically, to my wife, Brandee Crawford, thank you for being patient, loving, caring, and
supportive to me over the last few years. To my parents, Wayne and Katy Crawford, and my
father-in-law and mother-in-law, Scott and Gwynne Adams, I truly appreciate all of the love and
support that you have all provided. To my brother, Aaron Crawford, I deeply appreciate how our
relationship has grown with us. To my grandfather and grandmother, Marge and Gil Gunn, thank
you for everything that you have done for Brandee and I, and for the great model of love that you
both continue to demonstrate. To my sisters-in-law, Aimee Drummond and Casee Adams, I
always enjoy our time and laughs together. To my brother-in-law, Doran Drummond, thank you
for all the help that you’ve been over the years. Thank you all for the love and support that you
have demonstrated towards me throughout the Ph. D. program. I wish that my grandfather and
grandmother, the late Joseph and Jonette Crawford, were alive to enjoy this moment with me.
I would like to give special thanks to my dissertation committee. First, to my co-chair and
Ph. D. advisor, Dr. Micki Kacmar. You have helped me beyond measure both personally and
professionally. Without your support and encouragement I would have never made it to this
point. To my co-chair, Dr. Diane Johnson, thank you for your thoughts and expertise on this

viii
project. You have helped me think of new ideas and further develop my understanding of
research. To Dr. Mark Gavin, Dr. Kim Sydow Campbell, and Dr. Marilyn Whitman, I truly
appreciate the thoughts, comments, and time you have contributed to this project. I would like to
thank you all collectively for being instrumental to my development as an academic and scholar.
I could not have had a better committee. Thank you all for the support, encouragement, and
knowledge that you have shared with me. To Alabama professors, Dr. Jonathon Halbesleben, Dr.
Will Jackson, Dr. James King, Dr. George Franke, Dr. Jim Combs, Dr. Jeff Martin, Dr. Eric
Williams, Dr. Craig Armstrong, Mr. David Ford, and Mr. Larry Baldwin, thank you for
contributing to such a wonderful experience at the University of Alabama. I cannot express my
gratitude and appreciation for your assistance, teaching, and encouragement. To Dr. Gordon
Cheung, thank you for helping me understand the latent congruence modeling technique.
To my academic brothers Dr. Justice Tillman and Dr. Anthony Hood. Thank you for your
advice and encouragement. To all of the Alabama Ph. D. students, thank you for the knowledge
and conversations that we have shared over the years. I have developed substantially over the last
few years due to our conversations which I have truly enjoyed. I would also like to thank the
faculty at Southeastern Louisiana University, specifically my mentors, Drs. Carl and Toni
Phillips, for preparing me for future educational opportunities and life in general. I will always
appreciate my time in Hammond, La. I would also like to thank Jan Moyer, Marla Scott, and
Angel Oswalt for contributing to such a wonderful program at the University of Alabama.

ix
CONTENTS
ABSTRACT .................................................................................................................................... ii
DEDICATION ............................................................................................................................... iv
LIST OF ABBREVIATIONS AND SYMBOLS ........................................................................... v
ACKNOWLEDGMENTS ............................................................................................................ vii
LIST OF TABLES .......................................................................................................................... x
LIST OF FIGURES ....................................................................................................................... xi
CHAPTER 1 - INTRODUCTION .................................................................................................. 1
CHAPTER 2 - REVIEW OF LITERATURE ................................................................................. 7
CHAPTER 3 - METHODS ........................................................................................................... 21
CHAPTER 4 - RESULTS ............................................................................................................. 36
CHAPTER 5 - DISCUSSION ...................................................................................................... 52
REFERENCES ............................................................................................................................. 66
APPENDIX ................................................................................................................................... 73

x
LIST OF TABLES
Table 1: Means, Standard Deviations, and Correlations.............................................................. 36
Table 2: Confirmatory Factor Analyses ....................................................................................... 38
Table 3: Measurement Equivalence Tests for Deviance .............................................................. 41
Table 4: Descriptive Statistics for Latent Deviance Variables .................................................... 44
Table 5: Results of LCM-2 .......................................................................................................... 46
Table 6: Results of Tests of Indirect Effects ................................................................................ 48
Table 7: Results of LCM-3 .......................................................................................................... 50

xi
LIST OF FIGURES
Figure 1: Conceptual Dissertation Model ...................................................................................... 6
Figure 2: Congruence Component of Measurement Model ........................................................ 29
Figure 3: Depiction of LCM-2 Structural Model ......................................................................... 33
Figure 4: Depiction of LCM-3 Structural Model ......................................................................... 34

1
CHAPTER 1
INTRODUCTION
Frustrated employees make up 20 percent or more of the workforce of a typical company
(Royal & Agnew, 2011). Within some industries, frustrated employees comprise up to half of the
workforce (Royal & Agnew, 2011). Noting the prevalence of employee frustration,
understanding and reducing frustration in the workplace should be a key concern for both
researchers and managers. Frustration occurs when an individual striving to obtain a goal
experiences an interruption that conflicts with the attainment of that goal (Dollard, Miller, Doob,
Mowrer, & Sears, 1939). There can be a number of sources of employee frustration, some of
which are dispositional while others are situational. Examples of dispositional influences on
frustration include employee personality traits such as anger and anxiety (Fox & Spector, 1999).
Examples of situational influences on frustration include violations of generally accepted rules of
conduct (Pastore, 1952). Frustrating events in the workplace are sometimes understood as
constraints in the workplace, such as bad physical conditions, that block employees from
completing valued work (Peters and O’Connor, 1980).
Employees experience a multitude of behavioral choices in organizational life. Of
particular interest to managers should be the impact that frustration can have on employees’
behavioral choices. For example, employees can choose to perform job duties and
responsibilities at an optimal or suboptimal level, and the level of frustration they feel should
play a role in determining at what level and which behaviors they perform. Employee behavioral

2
choices following frustration can be immensely detrimental to the organization. One such
behavior that employees are likely to choose following frustration is aggression.
Workplace aggression represents efforts by individuals to harm current or former
coworkers, or the organizations in which they are or were previously employed. Aggression is a
common response to employee frustration. Some even argue that frustration always leads to
some type of aggression (Dollard et al., 1939). Employees might retaliate against the source of
frustration and also displace their aggression on innocent third parties. Thus, frustration
encountered in the workplace may have negative implications for the work and family domains
(Hoobler & Brass, 2006).
Frustration is posited to occur when an individual’s behavioral sequence to obtaining a
goal is interrupted or prohibited. If no substitute exists for obtaining the valued goal or outcome,
the individual’s frustration may elicit an aggressive action (Dollard et al., 1939). The extent to
which an aggressive response will be provoked by one’s frustration directly varies with the level
of punishment anticipated for the aggressive act. That is, when an individual can get away with
an aggressive response, it will be provoked. Researchers focusing on negative workplace
behaviors, such as counterproductive (Storms & Spector, 1987), deviant (Robinson & Bennett,
1995), and maladaptive (Perlow & Latham, 1993) behaviors, have often relied on the frustration-
aggression theory as an explanatory mechanism. The frustration-aggression theory has its roots
in work by Dollard and colleagues (1939). This theoretical perspective models aggression, or
negative workplace behaviors, as an outcome of frustration.
One negative workplace behavior, workplace deviance, involves voluntary employee
behavior that contravenes organizational norms and jeopardizes the well-being of the
organization and its members (Robinson & Bennett, 1995). Organizational deviance is behavior

3
detrimental to and aimed at the organization, such as arriving for work late, or leaving early.
Interpersonal deviance is behavior targeted at others in the workplace, such as swearing at a
coworker or gossiping about one’s supervisor. Previous research has interpreted employee
deviance (organizational and interpersonal) as an outcome of employee frustration (Fox &
Spector, 1999: Hershcovis et al., 2007). However, I submit that there are circumstances in which
deviance may serve as an antecedent to employee frustration.
In the employment relationship, both supervisors and subordinates develop perceptions of
an employee’s deviance. I argue that the extent to which an employee is viewed as deviant will
lead to employee frustration. Specifically, when the supervisor and subordinate both consider the
subordinate deviant, employee frustration will ensue. Frustration should occur when goal
attainment is interrupted (Dollard et al., 1939). Even if the dyad is in agreement, and both parties
view the subordinate as deviant, it is unlikely that the supervisor will be distributing favorable
outcomes (e.g., promotions, inflated performance ratings, etc.) to that subordinate. On the other
hand, if the supervisor and focal employee both agree that he or she is not a deviant employee,
the employee will be less likely to experience frustration. Thus, I posit that as the average level
of deviance ratings between supervisors and subordinates increase, employee frustration also
increases.
I also argue that when the two sets of deviance perceptions are incongruent, employees
will become frustrated as their path to goal attainment is interrupted. This reaction is most likely
to occur when the supervisor views the subordinate as deviant, but the subordinate does not. The
greater the difference in the supervisor and subordinate perceptions of an employee’s deviant
behavior, the less likely the employee will be able to obtain his or her goals. Thus, one purpose

4
of this manuscript is to determine whether incongruent deviance perceptions lead to employee
frustration.
Once the employee is frustrated, he or she will seek an avenue to release this pressure.
Retaliating against those viewed as responsible or those in close proximity is one mechanism that
can be used. Another purpose of this manuscript is to investigate a host of retaliatory behaviors I
posit will be associated with employee frustration. Organizational scholars have argued that
retaliation allows victims an opportunity to get even with the aggressor, or source of frustration
(Mitchell & Ambrose, 2007). While there is clear support for the retaliation proposition (e.g., see
Anderson & Bushman, 2002), employees are at a disadvantage when considering retaliation
against their supervisors. According to the displaced aggression tenet of the frustration-
aggression theory (Dollard et al., 1939), situations that hinder individuals from directly
retaliating against the true source of their frustration will result in displaced aggression.
Specifically, frustrated individuals unwilling to retaliate directly against the source of their
frustration will target others with their aggressive behavioral responses. In the workplace,
potential targets include peers, but employees’ frustration also may spillover into the home,
where employees may displace their aggression on family members (Hoobler & Brass, 2006).
Thus, I argue that employees’ frustration will lead to negative workplace behaviors as employees
attempt to retaliate against the source of frustration (supervisors) and other, more accessible
targets (coworkers). Additionally, I submit that frustration experienced in the workplace may
spillover to the family domain and increase work-to-family conflict (WFC).
Other than displacing aggression towards others in the work and family domains,
frustrated employees also may actively retaliate by withdrawing behaviors that benefit the
organization and those in it. Retaliating against the organization offers frustrated employees a

5
way of indirectly retaliating against their supervisors, or the source of frustration. One way of
indirectly retaliating following a frustrating event would be to engage in less citizenship
behaviors. Organizational citizenship behaviors (OCBs) have been defined as employee
behaviors that support the broader social and psychological environment in organizations
(Organ, 1997). One type of OCB is interpersonal citizenship (OCBI) which include behaviors
directed at fellow employees. Examples of OCBIs are helping coworkers when their workload
becomes unmanageable or listening to their problems. A second type of OCB is organizational
citizenship (OCBO) which includes behaviors directed at the organization. OCBO has been
labeled as sportsmanship (e.g., not complaining about trivial matters) and civic virtue (e.g.,
keeping up with matters that affect the organization) (Lepine, Erez, & Johnson, 2002; Organ,
1988). Though employees may be unwilling to retaliate against their supervisors directly, the
extent to which they engage in OCBs is completely under their control. Therefore, I argue that in
addition to experiencing conflict at home and in the workplace, frustrated employees will
actively withdraw from positive organizational behaviors in the form of OCBs directed at their
coworkers, supervisor, and organization.
The relationships described above are depicted in the conceptual model shown in Figure
1. As shown in Figure 1, my dissertation seeks to advance the field by determining the extent to
which incongruent perceptions between a subordinate and supervisor regarding the subordinate’s
deviance leads to employee frustration. I also examine whether this frustration leads to a host of
negative outcomes affecting both the work and family domains.

6
Conceptual Dissertation Model
Figure 1. Conceptual Dissertation Model.
+
+
+
Time 3 Time 2 Time 1
+
–
+
–
Coworker Abuse
(Supervisor-rated)
Relationship
Conflict
(Supervisor-rated)
Work-to-family
Conflict
(Subordinate-
rated)
Interpersonal
Citizenship
Behaviors
(Supervisor-rated)
Perceived
Frustration
(Subordinate-
rated)
Organizational
Deviance
(Supervisor-rated)
Organizational
Deviance
(Subordinate-
rated)
Organizational
Deviance
Incongruence
Organizational
Deviance
Level
Organizational
Citizenship
Behaviors
(Supervisor-rated)

7
CHAPTER 2
REVIEW OF LITERATURE
Frustration-Aggression Theory
When the frustration-aggression hypothesis was developed, frustration was defined as
“an interference with the occurrence of an instigated goal-response at its proper time in the
behavior sequence” (Dollard et al., 1939, pg. 7). The basic premise was that individuals would
become frustrated if they were kept from the satisfactions they expected due to their goal-
directed behavior. General support for the notion that frustration leads to aggression has been
found. For example, early studies have provided evidence that frustrating scenarios produce
aggressive responses from participants (Buss, 1963). Additionally, studies have found frustration
has been demonstrated to elicit anger and verbal aggression from subjects (Kulik & Brown,
1979).
However, this definition has received criticism since its origination. Subsequent research
has treated frustration as an emotional reaction spurred by frustrating events. Berkowitz argued
one issue with the original formulation of the frustration-aggression hypothesis was the disregard
of the role of the arousal of negative emotion. That is, sources of frustration may lead to
aggression in the workplace, but these events first lead to a negative emotion such as perceived
frustration, which in turn may lead to aggressive behavior. Sources of frustration can include
constraints in the workplace that hinder goal attainment (Peters & O’Connor, 1980). In the
workplace, sources of frustration may occur and produce an emotional reaction within

8
employees. The emotional reaction to frustration can be defined as perceived frustration (Storms
& Spector, 1987). Thus, modeling frustration as an emotional reaction spurred from a frustrating
event is more appropriate than arguing that a frustrating event directly impacts behavioral
reactions.
The notion that a frustrating event will elicit aggressive behavioral responses is rooted in
Dollard et al.’s (1939) book, titled Frustration and Aggression. Dollard and his colleagues
postulated that human aggression is driven by frustration. In fact, the authors’ original
manuscript went as far as to say, “Aggression is always a consequence of frustration” (pg. 1).
Dollard et al. originally defined frustration as occurring when an individual, who is striving to
obtain a goal, experiences an interruption that conflicts with the attainment of that goal. For
example, in the employment context, an employee’s attainment of favorable performance ratings
may be thwarted by a variety of situational and relational constraints.
Several characteristics are used to predict the strength of an aggressive response. First,
the more an employee anticipates satisfaction from obtaining a goal, the more aggressively
inclined he or she becomes when denied that level of satisfaction (Dollard et al., 1939).
Therefore, goals that produce less satisfaction to employees should elicit less aggressive
responses. Second, the aggressive response will reflect the extent to which the transgressor
interrupted goal attainment. Specifically, an employee will respond less aggressively if his or her
goal attainment efforts are only moderately interrupted. Third, the frequency with which an
employee experiences frustrating events will impact the extent to which he or she responds in an
aggressive manner.
Dollard et al. (1939) argued that aggression could be defined as behaviors engaged in by
an individual with the goal of inflicting harm on or injuring the target of the aggression. Though

9
frustration is posited to incite aggressive behavioral responses, some situational constraints can
deter aggressive responses. Specifically, Dollard and colleagues theorized that aggressive
behaviors targeted towards the source of frustration would have an inverse relationship with
perceptions of possible punishment. Individuals will be less likely to respond with aggressive
behaviors following frustrating events if they perceive that they, or their loved ones, will be
punished in return. In addition, the authors argued that, when faced with the threat of
punishment, individuals identify other targets on whom to displace their aggression. In the
employment context, displaced aggression is a plausible result of frustration when the source of
the frustration is the supervisor, as the supervisor has the upper hand in the relationship.
However, scholars have questioned the original hypothesis, particularly regarding the
events that lead to aggression. First, though confirming evidence of the original hypothesis
exists, some have argued that only events or situations that violate generally accepted rules of
conduct cause frustration (Pastore, 1952). Nevertheless, even legitimate violations or accidents,
can spur frustration as well, though the frustration may be to a lesser extent (Berkowitz, 1989).
Second, attributions have been argued to determine the extent to which aggressive behaviors
follow from thwarted goal attainment. Hostility towards transgressors can be lessened by
providing mitigating information which explains that mistreatment is not a deliberate personal
attack (Zillman, 1978). It is noteworthy that deliberately blocking goal progression will likely
produce a more direct aggressive response, particularly retaliation towards the source of
frustration. Nonetheless, a large portion of people express anger even following a legitimate
event or accident (Averill, 1982). This highlights that frustrations, and subsequent aggressive
behaviors, may be elicited without necessarily attributing purposeful wrongdoings to the
transgressor.

10
Another criticism of Dollard et al.’s (1939) original hypothesis is the need to consider the
emotional reaction of the individual experiencing frustration. That is, researchers have since
hypothesized that Dollard et al. missed the mediating mechanism that operates between the
frustrating event and the aggressive behavior. As Berkowitz (1989) noted, “It is not the exact
nature of the aversive incident that is important but how intense the resulting negative affect is”
(pg. 10). Thus, the key to the frustration-aggression relationship is the affective response to the
frustrating situation (Fox & Spector, 1999).
While frustration typically leads to aggression targeted at the agent who provoked it,
some situations also elicit displaced aggression. Displaced aggression will likely occur in
situations where the source of frustration is not available, intangible, and retaliation or
punishment is feared (Miller, 1941). The employment relationship presents one such situation.
Frustration provoked by a supervisor, who has the upper hand, may lead frustrated subordinates
to displace their aggression in some way. For example, rather than directing their aggression at
the source of frustration (i.e., supervisor), they may direct their aggression to less powerful or
more available targets. The extent of displaced aggression is inversely related to how intensely
an individual is provoked (Marcus-Newhall, Pederson, Carlson, & Miller, 2000). Employees
who are more extensively provoked to frustration will directly retaliate against the source of
frustration. When the provocation is less extreme, employees are more likely to displace their
aggression. In addition, the level of displaced aggression will be greater in settings viewed as
negative (Miller & Marcus-Newhall, 1997), and when the target of the displaced aggression is
perceived as similar to the instigator of the frustration (Marcus-Newhall et al., 2000).
Workplace aggression represents efforts by individuals to harm others or the organization
in which they are employed (Neuman & Baron, 1998). Workplace aggression has been

11
differentiated from workplace violence, which encompasses extreme acts of aggression
involving physical assault. Workplace aggression can take many forms of behaviors and is much
more prevalent than workplace violence. Workplace aggression consists of an interpersonal
(aggression targeted at others) and an organizational (aggression targeted at the organization)
dimension (Robinson & Bennett, 1995). Workplace aggression may take multiple forms,
including deviance (e.g., Bennett & Robinson, 2000), interpersonal conflict (e.g., Spector & Jex,
1998), and retaliation (e.g., Skarlicki & Folger, 1997). Employee deviance is typically treated as
an aggressive response. However, as shown in Figure 1, I believe there are circumstances when
deviance perceptions may elicit frustration. Specifically, if supervisors and subordinates hold
incongruent beliefs regarding the employee’s deviance, goal-directed behaviors may be thwarted.
Deviance - Incongruence
Workplace deviance involves voluntary employee behavior that violates organizational
norms and threatens the well-being of the organization and its members (Robinson & Bennett,
1995). Examples of deviant behaviors include violence, vandalism, drug use, and leaving work
early or arriving late. Deviant behaviors are problematic for organizations due to the costs and
production loss associated with such behaviors. For example, yearly organizational losses due to
employee theft are estimated to be over 40 billion dollars (Coffin, 2003). Predictors of workplace
deviance include abusive supervision (Wang, Mao, Wu, & Liu, 2012), sleep deprivation
(Christian & Ellis, 2011), justice perceptions (O’Neill, Lewis, & Carswell, 2011), and
personality (Oh, Lee, Ashton, & de Vries, 2011). Workplace deviance can take the form of
interpersonal (e.g., gossip or violence) and organizational (e.g., arriving late or completing
personal activities on the job) deviance (Berry, Ones, & Sackett, 2007; Robinson & Bennett,
1995).

12
Many theoretical mechanisms have been utilized by researchers to offer explanations for
employee deviance. From a social exchange perspective, employees may experience
mistreatment, or be the victim of workplace aggression, and engage in subsequent deviant
behaviors aimed at both the organization and those within it to balance the exchange relationship
(O’Boyle, Forsyth, Banks, & McDaniel, 2012). From an uncertainty management viewpoint,
alternate leadership styles may lead to varying levels of situational uncertainty. Uncertain
situations can then result in higher levels of deviance following abusive supervision (Thau,
Bennett, Mitchell, & Marrs, 2009). From a self-determination lens, employees will engage in
deviant behaviors if their key needs go unsatisfied, which can occur due to negative events such
as abusive supervision (Lian, Ferris, & Brown, 2012). Thus, while multiple theoretical
mechanisms have been drawn upon to understand the predictors of employee deviance,
researchers have solely focused on deviance as an outcome. As an outcome, deviance occurs due
to frustrating events, negative situations, or imbalances in exchange relationships.
Applying frustration-aggression theory, I suggest that deviance also can serve as a
predictor of employee frustration. In the employment relationship, employees may become
frustrated following the interruption of goal attainment (Dollard et al., 1939). Goal attainment, in
the employment context, could be associated with obtaining good work assignments, increased
time off, favorable performance ratings, and subsequent rewards. The attainment of these
favorable outcomes may be hindered if the supervisor and subordinate have incongruent
perceptions regarding the employee’s deviance. In circumstances where large differences exist
between supervisor and subordinate deviance perceptions, the employee may experience
frustration as it could become more difficult to obtain favorable outcomes if the supervisor views
him or her as deviant. Employees may be reluctant to admit to their deviant behaviors due to the

13
fear of consequences. However, supervisors should not be as reluctant to rate their subordinates’
deviance, as there is no fear of consequences. Additionally, supervisor perceptions may be biased
or contain error. Nonetheless, if the supervisor perceives an employee as deviant, it will be
unlikely that the employee will accomplish his or her goals. Thus, if a supervisor views a
subordinate as deviant, and the subordinate reports engaging in low levels of employee deviance,
I expect the employee to become frustrated. Frustration may arise as subordinates are not seen as
they believe themselves to be. In this situation, employees may be unable to obtain goals at work
due to being viewed as deviant by their supervisor. Negative emotions experienced by the
employee following frustrating events is the key to the frustration-aggression hypothesis (Fox &
Spector, 1999). That is, subordinates may experience frustration as their own deviance
perceptions become incongruent with their supervisors’ perceptions. Thus, I propose that
incongruent perceptions from subordinates’ and supervisors’ ratings of employee deviance will
be associated with employees’ perceived frustration.
Hypothesis 1. Incongruent perceptions of deviance which occur when the subordinate's
ratings of deviance are lower than the supervisor's ratings of deviance, will be positively
related to employee perceptions of frustration.
Deviance - Level
In addition to the shared perception supervisors and subordinates may hold regarding an
employee’s deviance, the average level of deviance ratings also may produce employee
frustration. Frustration may occur due to constraints in the workplace that keep employees from
completing work (Peters & O’Connor, 1980). As supervisors’ and subordinates’ average level of
deviance perceptions increases, it may become difficult for subordinates to accomplish work. As
subordinates’ perceptions of their own deviance increases, I expect that they will be more

14
frustrated at work. That is, I expect that as employees engage in deviant acts, they are less able to
complete work. Moreover, as supervisors report higher levels of employee deviance, employees
are likely to be treated unfavorably and, in turn, become frustrated. As the average level of the
combined supervisor and subordinate ratings of the subordinate’s deviance increases, it will be
even less likely that the subordinate can obtain favored outcomes. Thus, as shown in Figure 1, I
argue that as the average level of deviance reported by a supervisor-subordinate dyad increases,
it will be associated with increased frustration.
Hypothesis 2. The average level of deviance reported by a supervisor-subordinate dyad
will be positively related to employee perceptions of frustration.
Outcomes of Frustration
Frustration in the workplace arises due to the thwarting of goal-directed behaviors
(Dollard et. al, 1939). The frustration-aggression hypothesis rests on the proposition that
aggression follows frustration. Research supports these contentions and has shown that
subordinates will retaliate against supervisors for frustrating events by engaging in negative
workplace behaviors (Dupré, Inness, Connelly, Barling, & Hoption, 2006; Thau et al., 2009).
However, employees may be reluctant to respond directly against their supervisors. In addition to
organizations prohibiting negative workplace behaviors, the supervisor also has more power in
the relationship and may control desired resources. Therefore, I argue that rather than directly
retaliating with aggressive behaviors targeted at the supervisor, subordinates may find more
subtle ways to retaliate.
One way to accomplish retaliation would be to limit engagement in OCBs. OCBs are
often discretionary acts that promote the functioning of the organization (Organ, 1990). One
form of OCBs, OCBO, is directed solely at the organization. Examples of OCBO include

15
protecting the organization from potential problems and expressing loyalty to the organization.
Due to the discretionary nature of such behaviors, subordinates directly control the extent to
which they engage in OCBs. Thus, employees may first resort to more covert retaliation by
withdrawing from citizenship behaviors (Jermier, Knights, & Nord, 1994). From a social
exchange theory perspective (Gouldner, 1960), if an employee becomes frustrated in the
workplace, he or she will try to balance the exchange relationship. To balance the relationship,
the employee could limit his or her OCBs. By limiting OCBs, an employee may be able to
covertly retaliate against the organization and supervisor, and also balance the exchange
relationship in his or her own mind. Though the effects of withdrawing from OCBs are not as
dramatic as other forms of retaliation (e.g., workplace violence), withdrawing from such
behaviors may produce adverse consequences for organizations (Skarlicki & Folger, 1997).
Thus, as shown in Figure 1, I suggest that one behavioral reaction to frustration in the workplace
will be the withdrawal of OCBO. Greater levels of employee frustration should be associated
with lower levels of OCBO.
Hypothesis 3. Perceived frustration will be negatively related to citizenship behaviors
directed at the organization.
Although violence may be the most aggressive behavior at the employee’s discretion, this
type of behavior has been considered “the tip of the iceberg” concerning negative behaviors in
the workplace (see Folger & Baron, 1996). Employees having no power advantage may resort to
more stealthy acts in the workplace (Homans, 1961). Another way of releasing frustration could
be to limit the extent to which one participates in citizenship behaviors directed at others within
the organization. This form of OCBs, OCBI, primarily involves helping others at work. Although
an employee’s coworkers may not be the source of perceived frustration, OCBs promote the

16
effectiveness of the organization (Organ, 1990). Similarly to OCBOs, OCBIs offer another
opportunity for the employee to balance the exchange relationship. Specifically, frustrated
employees may be reluctant to continue engaging in OCBIs as they were before they experienced
frustration. Following from social exchange theory, the employee will view the relationship as
imbalanced once their frustration surfaces. Since an immediate supervisor personifies the
organization to the aggrieved employee (Eisenberger, Stinglhamber, Vandenberghe, Sucharski,
& Rhoades, 2002), secretly retaliating against the individual members in the organization in
order to hinder performance may be a consequence of employee frustration. Therefore,
employees may covertly retaliate against other members in the organization, albeit indirectly, by
lessening the amount of OCBI in which they participate. That is, the greater an employee’s
frustration, the less he or she will engage in citizenship behaviors directed at others within the
organization.
Hypothesis 4. Perceived frustration will be negatively related to citizenship behaviors
directed at others within the organization.
Following frustrating experiences, behavioral responses also can take more visible,
aggressive forms, such as making negative comments about, or expressing anger towards, others
in the workplace. While retaliation directed at the transgressor is a common response in the
aggression literature (Mitchell & Ambrose, 2012), some situations do not allow for such
retaliatory behaviors. In circumstances where individuals are at a power disadvantage, such as
subordinates in the employment relationship, displacing aggression towards less powerful others
is a possible course of action. Displaced aggression represents the redirection of one’s harm-
doing behaviors from a primary to a secondary target (Tedeschi & Norman, 1985). Research has
provided evidence that due to the nature of the employment relationship, displaced aggression

17
can be triggered towards others in the workplace and at home (Hoobler & Brass, 2006; Miller,
Pedersen, Earleywine, & Pollock, 2003). Subordinates may turn to displaced aggression when
frustration in the workplace stems from their supervisor since employees are less likely to
directly retaliate against their supervisors due to the fear of punishment (Miller, 1941).
One way of alleviating frustration indirectly is to displace one’s aggression on his or her
coworkers. Employees may be less hesitant to react aggressively towards their coworkers
because the likelihood of being disciplined is lessened (Harris, Harvey, & Booth, 2010).
Coworker abuse can be defined as the display of hostile verbal and nonverbal behaviors aimed at
coworkers. This type of abuse in the workplace is similar to that of abusive supervision (Tepper,
2000), only the abuse passes from coworker to coworker, rather than from supervisor to
subordinate. Coworker abuse can take both indirect and direct forms. Indirect coworker abuse
represents “softer” behaviors, such as breaking promises made to others, while direct abuse
represents aggressive behaviors such as making negative comments towards others and
expressing anger at them. Aggressively responding towards coworkers is a much safer practice
than aggressively responding towards one’s supervisor (Hoobler & Brass, 2006). Therefore, as
shown in Figure 1, I argue that greater levels of employee frustration will be associated with
higher levels of coworker abuse. The greater one’s frustration, the more frequently he or she will
abuse his or her coworkers.
Hypothesis 5. Perceived frustration will be positively related to coworker abuse.
Frustrated employees’ retaliation efforts may take multiple forms. As discussed above,
one way to accomplish retaliation indirectly is by targeting one’s coworkers. When targeting
coworkers, the fear of retaliation is lessened as the authority shared by an employee and his or
her coworkers is the same (Jehn, Northcraft, & Neale, 1999). Thus, frustrated employees are

18
likely to increase conflict in their work group. Relationship conflict in work groups represents an
awareness of incompatibilities amongst coworkers (Jehn & Mannix, 2001). Conflict in the
relationship between employees and their coworkers can be in the form of personality and
emotional conflicts or general tension with the work group. Relationship conflict can be
detrimental to organizations by decreasing creativity, consensus building, productivity, and
satisfaction in groups (Evan, 1965; Gladstein, 1984; Pelled, 1996; Wall & Nolan, 1986). By
introducing or increasing the conflict in their work groups, employees may relieve some of their
frustration caused by their supervisors. Targeting coworkers is much more covert than directly
targeting supervisors as coworkers have no power advantage. As shown in Figure 1, I argue that
supervisors will view frustrated employees as the center of conflict in their work group.
Specifically, I posit there will be a positive relationship between an employee’s perceived
frustration and the extent to which that employee engages in conflict with members of his or her
work group.
Hypothesis 6. Perceived frustration will be positively related to relationship conflict
between subordinates and their coworkers.
Research investigating employee aggression largely emphasizes retaliation in the work
domain. However, employees also may take their frustration home if they are unable to relieve
their frustration at work. Spillover has been established as a key linkage between the work and
family domains (Grzywacz, Almeida, & McDonald, 2002). One type of spillover, work-family
conflict, represents “a form of interrole conflict in which the role pressures from the work and
family domains are mutually incompatible in some respect (Greenhaus & Beutell, 1985, p. 77).
This type of negative spillover can take two directions (Frone, 2003): work-to-family conflict
(WFC), or when one’s work role interferes with one’s family role, and family-to-work conflict

19
(FWC), or when one’s family role interferes with one’s work role. Frustration in the workplace
can impact the family domain by leading to WFC. Three forms of WFC have been delineated in
the literature: time-based conflict (the extent to which time expended in the work role hinders
effective functioning in the family role), strain-based conflict (the extent to which strain
experienced at work intrudes into and interferes with participation in the family), and behavior-
based conflict (when behaviors required at work are incompatible with behaviors required at
home) (Carlson, Kacmar, & Williams, 2000; Greenhaus & Beutell, 1985). Frustration
experienced in the workplace may hinder an individual from being as effective in the family
domain as he or she may be otherwise. Thus, I hypothesize that there will be a positive
relationship between employee frustration and work-to-family conflict.
Hypothesis 7. Perceived frustration will be positively related to subordinates’ work-to-
family conflict.
In addition to the hypotheses above, I also argue that employees’ perceived frustration is
the mediating mechanism that links incongruent perceptions regarding employee deviance to the
host of outcomes previously identified. Previous calls have been made to not only examine
workplace aggression and its antecedents as a single event, but look at the social interactions
within which aggression takes place over time (Andersson & Pearson, 1999; Hoobler & Brass,
2006). Resulting employee affect can be just as, or more important in eliciting aggressive
behavioral responses than the event that spurred the frustration (Berkowitz, 1989). Indeed, the
emotional reaction that the employee experiences following the frustrating incident is the key to
the frustration-aggression hypothesis (Fox & Spector, 1999). Thus, I argue that rather than
frustrating events directly provoking an aggressive response, these events provoke perceived
frustration in employees. In turn, frustrated employees will respond with a host of negative

20
behaviors, which may include aggression. This approach to workplace aggression complements
the proposed model in Figure 1, in that it models frustrating events, affective reactions, and
subsequent behavioral reactions in both the work and family domain. Thus, I suggest that
perceived frustration serves as the mediating mechanism between incongruent deviance
perceptions and multiple behavioral responses.
Hypothesis 8. Perceived frustration mediates the relationship between incongruent
deviant perceptions and the subsequent reduction of positive behaviors and the increase
in negative behaviors.

21
CHAPTER 3
METHODS
Overview of Research Design
Prior to surveying employees, I obtained approval from the Institutional Review Board at
the University of Alabama. All participants for the current study were provided with an informed
consent page explaining the participants’ rights prior to the first administration of surveys. I
tested my hypotheses using a time-lagged study design where the data were collected over three
points in time. The independent variables were collected at Time 1, the mediating variable was
collected at Time 2, and the dependent variables were collected at Time 3. There was
approximately six weeks between each time point. Six weeks allows time between sessions to
reduce participant fatigue in addition to being adequate time for the organization to organize
employees in sessions to optimize survey efforts. Participants were provided with paper copies of
the surveys. All subordinates were provided with a subordinate survey. All supervisors also were
provided with a supervisor survey, in addition to the subordinate survey, and were asked to
complete both surveys.
Sample
To determine the sample size that would be needed to adequately test the hypotheses in
the current study, I conducted a power analysis. Using the a-priori sample size calculator for
structural equation models, offered at http://www.danielsoper.com/statcalc3/calc.aspx?id=89, the
recommended minimum sample size is 313 (Cohen, 1988; Soper, 2014; Westland, 2010). This
number was obtained by inputting a small effect size (i.e., .1), a desired power level of .95, 10

22
latent variables, 46 indicator variables, and a probability level of .05. I used a small effect size to
obtain a conservative estimate of sample size.
Some researchers have offered rule-of-thumb suggestions for selecting an appropriate
sample size. For instance, Bentler and Chou (1987) recommended a ratio of 5:1 between sample
size and number of free parameters to be estimated while Bollen (1989) suggested a sample size
of at least several cases per observed variable. These approaches would suggest I need a sample
size of between 180 and 230. More recent studies based on Monte Carlo simulations, would
suggest using an indicator-to-latent variable ratio approach to determine minimum sample size
(Westland, 2010). The estimate obtained from Daniel Soper’s website follows this approach.
Thus, I attempted to collect data from a sample of 350 supervisor-subordinate dyads.
I used a sample of employees from a public, government agency in the southeastern
region of the United States. Through a personal contact, I proposed the research project to an
attorney of the municipality and a Human Resource representative for the agency. Following
this, I personally contacted each of the directors of the departments from which I collected data.
Also, I collected demographic information of the participants from the departments’
administrative assistants in an effort to use multiple sources and to gather the most accurate
descriptive information about the participants.
The two departments were composed of approximately 375 supervisor-subordinate dyads
that covered all levels of the departments. Following a listwise deletion method, which included
only respondents who provided a response to every item for the study variables, usable data was
returned for 215 dyads (approximately 57% response rate). Using this deletion method resulted
in no missing data being replaced or estimated.
Procedure

23
Prior to survey administration, the director of each department asked all individuals who
supervise others to notify their direct reports about the upcoming survey administration. The
directors were asked to distribute memorandums prior to the beginning of the survey
administration as well as once before each wave of surveys. The memorandums notified all
employees of the purpose of the research and demonstrated the directors’ support for the project.
I worked with the directors and supervisors to schedule survey distributions on site, where all
surveys were completed.
Employees were scheduled to attend a one-hour session during each wave of survey
administration. Each wave took approximately one week to complete. Employees completed the
surveys in groups ranging in size from five to thirty. All supervisors were separated from
subordinates so that confidential performance ratings of their direct reports could be made. I
arrived to each site, distributed all surveys, picked up completed surveys, and left the location
with all completed materials. This procedure was repeated for each survey administration. Prior
to distributing the surveys, I introduced myself to all participants, briefly explained the format
and layout of the survey, ensured participant confidentiality, and explained how the study results
would be presented to the organization in an aggregated form.
Following each survey administration, I recoded all reverse coded data. All data was
coded such that high values represent high levels of the constructs collected. Throughout the
coding process, any employees who did not complete the survey, or completed the entire survey
with only one response (i.e., flat-lined), were removed. I also examined all data to ensure that the
responses were within plausible ranges (i.e., between one and five). Following each wave of
survey administration, I examined the internal reliability estimates for each scale to make any
necessary changes accordingly. Next, I created scale level variables by averaging the items that

24
comprised each scale. I then examined the means of the scale to ensure the means were as
expected. Additionally, I ran correlations between the scale level variables to examine whether
the correlations between the variables of interest were as expected in both direction and
magnitude.
Measures
Unless otherwise noted, responses to all measures used in this study were assessed using
a 5-point Likert-scale ranging from 1 (strongly disagree) to 5 (strongly agree). All items that
were used can be found in the Appendix.
Subordinate-rated measures
Organizational deviance. To measure organizational deviance, I used an 8-item measure
developed by Aquino, Lewis, and Bradfield (1999). Participants were asked to indicate how
often they have engaged in a variety of deviant behaviors, such as “intentionally arrived late for
work,” and “lied about the number of hours I worked,” over the previous six months. Participants
responded with a scale ranging from 1 (never) to 5 (often). The Cronbach’s alpha for this scale
was .71. Deviance from the subordinate was captured during the first round of survey
administration.
Frustration. To measure frustration, I used a 3-item measure developed by Peters,
O’Connor, and Rudolf (1980). A sample item included, “Trying to get this job done is a very
frustrating experience.” The Cronbach’s alpha for this scale was .71. Frustration was collected
during the second round of survey administration.
Work-to-family conflict. To measure WFC, I used the shortened version of the 9-item
WFC scale developed by Carlson et al. (2000). The shortened version is a 3-item scale developed
by Matthews, Kath, and Barnes-Farrell (2010). The shortened version includes one item from

25
each dimension of WFC. A sample item included, “I have to miss family activities due to the
amount of time I must spend on work responsibilities.” The Cronbach’s alpha for this scale was
.60. Work-to-family conflict was measured during the third round of survey administration.
Supervisor-rated measures
Organizational deviance. To measure organizational deviance, I used the same 8-item
measure developed by Aquino et al. (1999). Supervisors were asked to indicate how often they
believe their subordinates have engaged in a variety of deviant behaviors, such as “intentionally
arrived late for work,” and “lied about the number of hours they worked,” over the previous six
months. Similarly to participants, supervisors responded with a scale ranging from 1 (never) to 5
(often). This scale had a Cronbach’s alpha of .80. Deviance from the supervisor was collected
during the first round of survey administration.
Organizational citizenship behaviors. To measure OCBO, I used a 6-item measure
developed by Williams and Anderson (1991). A sample item included, “This individual adheres
to informal rules devised to maintain order.” This scale had a Cronbach’s alpha of .73.
Organizational citizenship behaviors were measured during the third survey administration.
Interpersonal citizenship behaviors. To measure OCBI, I used an 8-item measure
developed by Settoon and Mossholder (2002). A sample item included, “This subordinate
compliments coworkers when they succeed at work.” This scale had a Cronbach’s alpha of .92.
Interpersonal citizenship behaviors were captured during the third survey administration.
Coworker abuse. To measure coworker abuse, I used six items from the scale developed
by Tepper (2000). The items were reworded in order to reflect supervisors’ perceptions of the
extent to which subordinates engage in abusive behaviors. A sample item included, “This

26
subordinate makes negative comments about others in the workplace.” This scale had a
Cronbach’s alpha of .90. Coworker abuse was collected during the third survey administration.
Relationship conflict. To measure relationship conflict, I used a 4-item scale developed
by Jehn and Bendersky (2003). A sample item included, “This subordinate has personality
conflicts with group members.” This scale demonstrated a Cronbach’s alpha of .94. Relationship
conflict was measured during the third survey administration.
Control variables
Based on previous research, I controlled for two variables that may explain variation in
the dependent variables among participants. Locus of control (LOC) is a personality trait that
refers to differences in individuals regarding generalized beliefs in internal versus external
control of reinforcement (Rotter, 1966). LOC may change the experience of frustration for
employees in the workplace (Fox & Spector, 1999). To measure LOC, I used four items from the
measure developed by Levenson (1981). A sample item includes, “Whether or not I get to be a
leader depends mostly on my ability.” This scale demonstrated a Cronbach’s alpha of .62.
Additionally, I controlled for negative affect (NA). NA is a mood factor that represents a
general dimension of distress and unpleasurable engagement that includes mood states such as
anger and disgust (Watson, Clark, & Tellegen, 1988). To measure NA, I used a 10-item measure
developed by Watson, Clark, and Tellegen (1988). Participants were asked to think about how
often they feel certain moods, such as, “irritable,” and “hostile.” The participants will provide
responses on a scale from 1 (very slightly or not at all) to 5 (extremely). This scale had a
Cronbach’s alpha of .81. Both control variables were collected during the second survey
administration.

27
LOC and NA may make certain individuals more prone to experiencing frustration. Thus,
I controlled for both variables in my analyses. Due to the significant correlations found in Table
1 between the control variables and the variables of interest to this study, I included the control
variables in my analyses. I regressed all five dependent variables on both control variables in the
congruence and components models. Both control variables were collected during the second
survey administration.
Analysis Strategy
The data were analyzed using Mplus 7 (Muthén & Muthén, 2012). The primary analysis
strategy that I used to test the hypotheses offered in this dissertation was a structural equation
modeling-based latent congruence model (LCM; Cheung, 2009). The LCM utilizes subordinate
and supervisor ratings of deviance to create two second-order factors, as shown in Figure 1. The
second-order factors, level and incongruence, represent the mean (level) and difference
(incongruence) of the two first-order latent variables. Cheung (2009) demonstrated that by
specifically constraining the factor loadings from the first-order latent variables to the second-
order latent variables, the second-order factors represent the mean and incongruence of the
lower-order factors. Considering deviance, the deviance level variable can be defined as a
second-order factor with subordinate- and supervisor-rated deviance as first-order factors, with
loadings constrained to one. In effect, the deviance level variable equals the mean of
subordinate- and supervisor-rated deviance. The deviance incongruence variable can be defined
as a second-order factor with subordinate- and supervisor-rated deviance as first order factors,
with loadings constrained to -0.5 and 0.5, respectively. Thus, the deviance incongruence variable
equals the difference between subordinate- and supervisor-rated deviance (Cheung, 2009).
Figure 2 visually illustrates the congruence analysis component of the measurement model.

28
Measurement equivalence
When using the LCM approach to model incongruence, the latent means of the
component variables are compared (Cheung, 2009). Thus, prior to comparing subordinate- and
supervisor-rated deviance, I tested for measurement equivalence between supervisor and
subordinate ratings of deviance. Obtaining measurement equivalence is a prerequisite to
evaluating substantive hypotheses between groups (Vandenberg & Lance, 2000). In my case, I
compared ratings of organizational deviance across two groups: subordinates and supervisors.
Thus, measurement equivalence should be investigated prior to comparing constructs (Cheung,
2009). To test for measurement equivalence, I ran a series of confirmatory factor analyses
(CFA). First, I conducted a CFA with no constraints on the subordinate- and supervisor-rated
deviance variables. This model forms the configural equivalence model. Following this, I also
used CFA to test for metric and scalar equivalence as well. This determines whether the factor
loadings and item intercepts for the deviance items vary across subordinate and supervisor
groups. This model is labeled as the LCM-1 model.
To examine metric equivalence, I ran the configural model with the loadings for the items
constrained to be equal across groups. For example, the factor loading for the second deviance
item was constrained to be the same for both subordinates and supervisors. I then compared the
metric equivalence model to the configural model and examined the Δχ2 and degrees of freedom.
A non-significant Δχ2 provides evidence that the loadings are the same across both groups, and
metric equivalence has been obtained. Upon finding metric equivalence, I also constrained the
item intercepts to be constant across groups to test for scalar equivalence. Similarly, a non-
significant Δχ2 when comparing the scalar equivalence model to the metric equivalence model
provides evidence that the item intercepts are the same across both groups, and scalar

29
equivalence has been obtained. To analyze the data using the LCM, at least partial metric and
scalar equivalence should be obtained before comparing the component measures of subordinate-
and supervisor-rated deviance (Cheung, 2009).

30
Figure 2. Congruence Component of Measurement Model.
Organizational
Deviance
Level
Organizational
Deviance
Congruence
Organizational
Deviance
(Supervisor-rated)
Organizational
Deviance
(Subordinate-rated)
r(con, lvl)
1
1 .5
-.5

31
Latent mean comparisons
The means for both the level and congruence variable should be examined to determine
the average level of the combined subordinate and supervisor ratings of subordinate deviance. I
also examined the mean of the incongruence variable. This allowed me to determine which set of
ratings of employee deviance were higher on average. Specifically, a positive value for the mean
of the incongruence variable indicates that, on average, supervisors produced higher ratings of
employee deviance than subordinates. A negative value for the mean of the incongruence
variable indicates that subordinates produced higher ratings than supervisors on average. I also
examined the correlations between the level and congruence variable to ensure that the variables
actually represent unique constructs.
Congruence Analysis
The LCM-1 model was then extended to a congruence model (LCM-2). In this model, I
examined the effects of the level and incongruence of deviance variables on perceived
frustration. This model is depicted in Figure 3. First, I examined the extent to which the
incongruence variable effects frustration. A significant, positive coefficient indicates support for
Hypothesis 1. This effect indicates that as the difference between supervisors and subordinates
increases, employee frustration also increases. Following this, I also examined the extent to
which the level variable impacts perceived frustration. A significant, positive coefficient
indicates support for Hypothesis 2. Additionally, I examined whether the congruence and level
variables were directly related to the outcomes.
Component Analysis
Following an examination of the effects of the second-order factors on frustration, I also
extended the LCM-2 to the LCM-3 model, in which direct effects from the component measures

32
to perceived frustration are added, as well as direct effects from the component measures to the
outcomes. That is, I examined the extent to which the subordinate and supervisor ratings of
deviance directly impact perceived frustration and the outcome variables. The component
analysis provides evidence as to which ratings directly predict the mediator and outcome
variables. The LCM-3 is depicted in Figure 4.
Outcomes
Following the congruence and component analysis, I also examined the extent to which
perceived frustration impacts each of the outcome variables. First, I determined if an employee’s
frustration predicts supervisors’ ratings of organizational and interpersonal citizenship behaviors.
Specifically, I expected frustrated employees to withdraw from these behaviors, which should be
reflected in supervisors’ ratings of citizenship behaviors being decreased. Finding a significant,
negative effect between frustration and citizenship behaviors provides support for Hypotheses 3
and 4.
I also expected frustrated employees to be abusive towards their coworkers. If this is
correct, I should find a significant, positive effect for the relationship between frustration and
supervisor-rated coworker abuse. This would provide evidence in support of Hypothesis 5.
Additionally, I expected that supervisors would view frustrated employees as the center of
conflict in their work group. This also would be reflected by a significant, positive coefficient
between frustration and coworker abuse. Finding this would provide evidence in support of
Hypothesis 6.
Regarding the family domain, I expected to find that frustrated employees experience
work-to-family conflict as their frustration from the workplace spills over into the family
domain. Thus, I expected to find a significant, positive relationship between frustration and

33
work-to-family conflict. This would provide support for Hypothesis 7. Finally, I expected
frustration to serve as the mediator between the incongruence variable and the outcomes. Thus, I
tested the indirect effects for each variable. Estimates of indirect effects can be obtained by
multiplying each of the direct effects that comprise the indirect effect. Finding significant
indirect effects provides support for Hypothesis 8.

34
Figure 3. Depiction of LCM-2 structural model.
Organizational
Deviance
Incongruence
Organizational
Deviance
Level
Coworker
Abuse
Relationship
Conflict
Work-to-family
Conflict
Interpersonal
Citizenship
Behaviors
Perceived
Frustration
Organizational
Citizenship
Behaviors

35
Figure 4. Depiction of LCM-3 structural model.
Organizational
Deviance
(Subordinate-rated)
Organizational
Deviance
(Supervisor-rated)
Coworker
Abuse
Relationship
Conflict
Work-to-family
Conflict
Interpersonal
Citizenship
Behaviors
Perceived
Frustration
Organizational
Citizenship
Behaviors

36
CHAPTER 4
RESULTS
Table 1 illustrates the descriptive statistics of, and correlations among, all study and
control variables. Additionally, I included the square root of the average variance explained for
each construct on the diagonal of the correlation matrix. This value should be greater in absolute
value than all correlations on the same row or column to demonstrate discriminant validity
(Fornell & Larcker, 1981). I found evidence for discriminant validity for all constructs except
OCBOs. The correlation between OCBO and coworker abuse (r = -.61, p < .01) was larger than
the square root of the average variance explained (√AVEOCB = .55) for OCBOs. Thus, I explored
further discriminant validity tests to ensure that each construct represented a unique latent
variable.
Confirmatory Factor Analyses
I utilized structural equation modeling to further test for discriminant validity. A series of
nested CFAs can be used to examine the discriminant validity of a group of constructs.
Specifically, combining constructs that appear theoretically similar in alternative models, and
comparing the alternatives to the hypothesized model allows researchers to investigate whether
alternative models fit the data as well as the hypothesized model. The chi-square difference test
can then be used to compare the chi-square statistics and degrees of freedom for each model. In
relation to the alternative models, the hypothesized model should produce a lower chi-square
statistics. This provides evidence that the hypothesized model is the best representation of the

37
data when considering the alternatives. Thus, I compared the CFA of the hypothesized
measurement model to a number of alternatives. I particularly wanted to compare the
hypothesized model to a model where variables rated by the same party were collapsed, variables
rated during the same time were collapsed, and a model where theoretically similar variables
were collapsed as well. The results of the CFAs are presented in Table 2.
As can be seen in Table 2, the hypothesized model (χ2 = 2485.47, df = 961, CFI = .74,
TLI = .72, RMSEA = .09, p < .01), was the best fitting model when compared to the alternatives.
Through each iteration, as the measurement model was further collapsed, the fit became
noticeably worse. Compared to the hypothesized model, a 7-factor model with both sets of
deviance ratings loading on a single factor fit the data significantly worse (χ2 = 2728.74, df =
968, CFI = .69, TLI = .67, RMSEA = .09, ∆ χ2 = 243.27, ∆df = 7, p < .01). Following this, I
compared the hypothesized model to a 5-factor model (χ2 = 3382.68, df = 979, CFI = .58, TLI =
.56, RMSEA = .11, ∆ χ2 = 897.21, ∆df = 18, p < .01) where all supervisor outcomes loaded on
the same factor. This model fit the data significantly worse than the hypothesized model. Next, I
compared the hypothesized model to a 3-factor model (χ2 = 3745.08, df = 986, CFI = .52, TLI =
.50, RMSEA = .11, ∆ χ2 = 1259.61, ∆df = 25, p < .01) where all items collected at the same time
loaded on a factor. Finally, I compared the hypothesized model to a two-factor model (χ2 =
4065.79, df = 988, CFI = .47, TLI = .44, RMSEA = .12, ∆ χ2 = 1580.32, ∆df = 27, p < .01) where
all items rated by the same party (e.g., supervisor, subordinate) loaded on a single factor.
However, it is important to note that the fit statistics for the hypothesized model fell outside of
the acceptable ranges (i.e., CFI > .95, RMSEA < .08).

38
Table 1
Means, Standard Deviations, and Correlations
Variable M SD 1 2 3 4 5 6 7 8 9 10
1. Organizational deviance† 1.23 .30 (.52)
2. Organizational deviance ‡ 1.99 .47 .13 (.61)
3. Frustration† 2.72 .81 .11 .06 (.75)
4. Organizational citizenship behaviors‡ 3.61 .48 -.14* -.47*** -.00 (.55)
5. Interpersonal citizenship behaviors‡ 3.44 .52 -.05 -.32*** -.08 .45*** (.76)
6. Coworker abuse‡ 2.41 .59 .01 .31*** .08 -.61*** -.58*** (.78)
7. Relationship conflict‡ 2.27 .68 -.05 .27*** -.04 -.49*** -.59*** .70*** (.90)
8. Work-to-family conflict† 2.48 .64 -.01 .13 .14* -.15* -.17* .12 .08 (.74)
9. Negative affect† 1.37 .40 .04 .12 .26*** -.17* -.07 .13 .11 .08
10. Locus of control† 3.30 .68 -.00 -.07 -.14* .08 .02 -.09 .05 -.05 -.10
Note: Listwise N = 215. * p < .05; ** p < .01; *** p < .001. † indicates an employee-rated variable. ‡ indicates a supervisor-rated
variable.

39
Table 2
Confirmatory Factor Analyses
Model χ2 df ∆ χ2 ∆df RMSEA TLI CFI SRMR
8-factor (hypothesized) 2485.47 961 .09 .72 .74 .08
7-factor (deviance collapsed) 2728.74 968 243.27* 7 .09 .67 .69 .09
5-factor (supervisor outcomes collapsed) 3382.68 979 897.21* 18 .11 .56 .58 .09
3-factor (collapsed by time) 3745.08 986 1259.61* 25 .11 .50 .52 .10
2-factor (collapsed by rater) 4065.79 988 1580.32* 27 .12 .44 .47 .11
Independence 6789.38 1035 4303.91* 74
Note: Listwise N = 215. Change in chi-square is relative to the hypothesized model. RMSEA = root mean
squared error of approximation; TLI = Tucker-Lewis index; CFI = comparative fit index; SRMR = standardized root
mean square residual. * p < .001.

40
Measurement Equivalence
Having found that the hypothesized model fit the data better than each of the alternatives,
the next step in latent congruence modeling is to examine whether appropriate measurement
equivalence can be demonstrated for the variables which will be compared. In this dissertation,
supervisors’ and subordinates’ ratings of employee deviance were compared. Thus, it is
appropriate to demonstrate metric and scalar equivalence prior to examining the LCM-2 and
LCM-3 models (Cheung, 2009). Upon finding measurement equivalence, the results of
congruence analysis can then be interpreted unambiguously (Vandenberg & Lance, 2000). I
tested for measurement equivalence across the supervisor and subordinate ratings of employee
deviance. The results are presented in Table 3. Measurement equivalence can be tested using a
series of nested CFAs. The baseline CFA requires the two latent variables that are being
compared to be associated with the same set of items. That is, the organizational deviance items
rated by the supervisor loaded on one latent variable, while the organizational deviance items
rated by the subordinate loaded on a second latent variable. The eight organizational deviance
items are used for each latent variable, though the first set of eight items includes the deviance
items rated by the supervisor and the second set of eight items includes the deviance items rated
by the subordinate. This is the configural model. Establishing configural equivalence provides
evidence that the two sets of raters rated the same variable conceptually. Following this, I tested
for metric equivalence by comparing the configural model to a model where similar items across
raters are constrained to be equal. In other words, the loading for the second item of the deviance
scale rated by subordinates would be constrained to equal the loading for the second item of the
deviance scale rated by supervisors. Evidence of metric equivalence implies that the relationship
between the items and the latent variables are not different across groups. Metric equivalence is

41
established if the chi-square difference test is not significant when comparing the configural
model to the metric model.
Upon establishing metric equivalence, the next step is to establish scalar equivalence
which provides evidence that the item intercepts are similar across groups. Similar to metric
equivalence, similar items across raters are required to be equivalent for the measures to have
demonstrated scalar equivalence. Scalar equivalence is tested by constraining the item intercepts
for similar items to be the equal across raters. Finding scalar equivalence ensures that similar
items calibrate equally across raters. Thus, providing evidence of scalar equivalence suggests
that each item relates to the latent variable similarly across raters and similar items have the same
origin. Finally, a non-significant chi-square difference test when comparing the metric and scalar
models provides evidence for scalar equivalence.
As can be seen in Table 3, the deviance scale in the current study violates the chi-square
difference test for both metric and scalar equivalence. The configural model (χ2 = 353.42, df =
103, CFI = .74, TLI = .70, RMSEA = .11), which is a baseline CFA model with both sets of
deviance items, fit the data significantly better than the metric model (χ2 = 416.14, df = 110, CFI
= .68, TLI = .65, RMSEA = .11, ∆ χ2 = 62.72, ∆df = 7, p < .01), where the item loadings are
constrained to be equal across raters. This suggests that the items have a different relationship
with the latent variable when being compared across raters. Additionally, I also found a
significant chi-square difference test when comparing the metric (χ2 = 416.14, df = 110, CFI =
.68, TLI = .65, RMSEA = .11) and scalar (χ2 = 534.44, df = 117, CFI = .56, TLI = .55, RMSEA =
.13, ∆ χ2 = 118.30, ∆df = 7, p < .01) models. This suggests that the items do not calibrate equally
across raters. Findings of invariant measures, which I have found in this dissertation, suggest that
the comparison of latent means that is to follow may not compare solely substantive differences
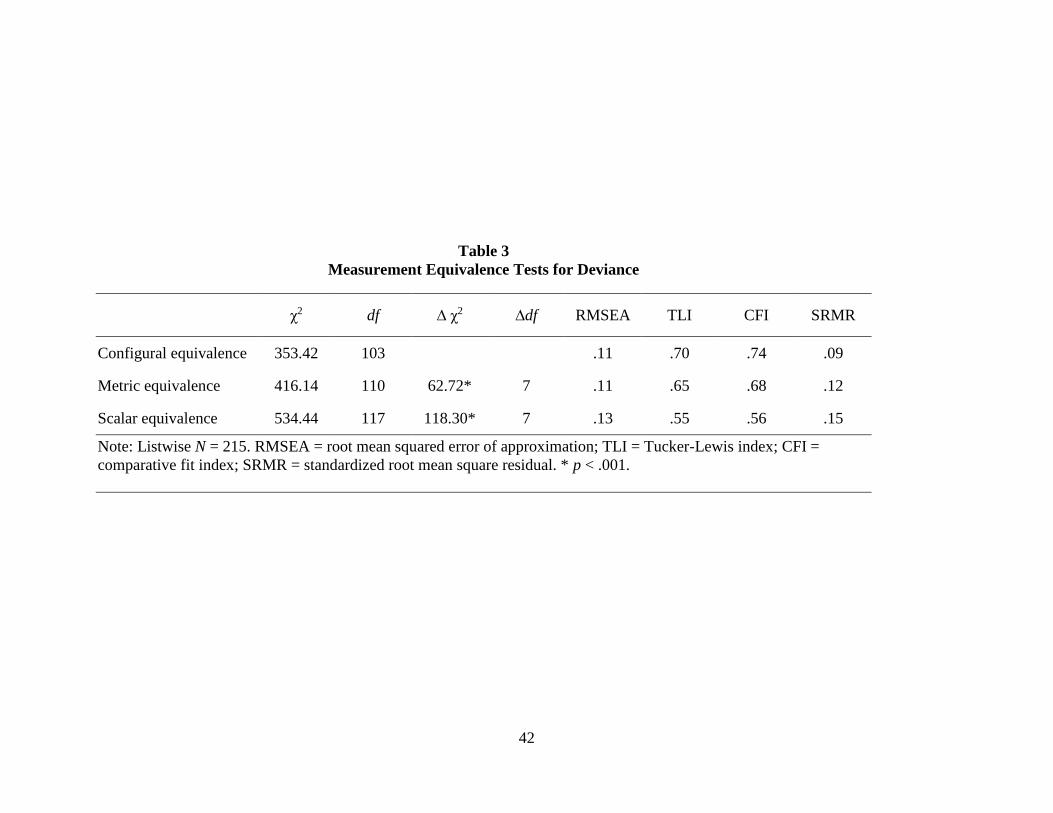
42
Table 3
Measurement Equivalence Tests for Deviance
χ2 df ∆ χ2 ∆df RMSEA TLI CFI SRMR
Configural equivalence 353.42 103 .11 .70 .74 .09
Metric equivalence 416.14 110 62.72* 7 .11 .65 .68 .12
Scalar equivalence 534.44 117 118.30* 7 .13 .55 .56 .15
Note: Listwise N = 215. RMSEA = root mean squared error of approximation; TLI = Tucker-Lewis index; CFI =
comparative fit index; SRMR = standardized root mean square residual. * p < .001.

43
in the constructs of interest. That is, differences found by comparing the latent means of the
deviance ratings in the current study may be confounded by differences in the scale and origin of
the latent means that exist across groups.
Latent Mean Comparisons
The next step in my analyses was to compare the latent means of the deviance ratings
across groups. Hypothesis 1 suggests that deviance incongruence would be positively related to
subsequent employee frustration. Specifically, I hypothesized that employees would become
frustrated in situations where the supervisors’ rating of the focal employee’s deviance was higher
than the self-rating the employee provided of his or her own deviance. Thus, it is appropriate to
determine whether supervisors provided higher ratings of deviance than subordinates on average.
The estimated latent means and standard deviations for subordinate and supervisor ratings, as
well as the level (mean) and incongruence (difference between supervisor and subordinate
ratings) are presented in Table 4. As can be seen, supervisors (M = 1.84, s.d. = .31) provided
higher ratings of deviance than subordinates (M = 1.27, s.d. = .10) on average. It is interesting to
note that the correlation between supervisor and subordinate ratings of deviance is very low. This
suggests that the variations in deviance ratings provided by supervisors were not associated with
subordinate ratings. Due to the constraints on the higher-order factor of level, the mean of the
level variable can be obtained using the following formula:
Ml = (Ms1 + Ms2)/2,
where Ml is the mean of the level variable, Ms1 is the mean of the supervisors’ deviance ratings,
and Ms2 is the mean of the subordinates’ self-ratings of deviance. Additionally, the mean of the
incongruence variable can be obtained with the following formula:
Mc = (Ms1 - Ms2),

44
where Mc is the mean of the incongruence variable, Ms1 is the mean of the supervisors’ deviance
ratings, and Ms2 is the mean of the subordinates’ self-ratings of deviance. It is noteworthy to
recognize the positive value for the mean of the incongruence variable (M = .57, s.d. = .33). This
again provides evidence that, on average, supervisors provided higher ratings of deviance than
did subordinates. Finally, the level and incongruence variables were correlated (r = .04, p < .01),
which suggests that as the overall average of deviance increased for a dyad, the incongruence in
deviance ratings for that dyad also increased.
Analysis of LCM-2
The LCM-1 (measurement equivalence model) was extended to model congruence
analysis (LCM-2), which allowed me to examine whether the level of, and the incongruence
between, supervisors’ and subordinates’ ratings of deviance predicted employee frustration and
subsequent work outcomes. This model will allow for testing all of the hypothesized
relationships in this dissertation. The model being tested in the LCM-2 is akin to the conceptual
model presented in Figure 3. First, I examined the effects of level and incongruence on
frustration, to test Hypotheses 1 and 2. Second, I examined the effects of frustration on each of
the outcomes, to test Hypotheses 3 through 7. Third, I examined the indirect effects from
incongruence to each of the outcomes, through frustration, to test Hypothesis 8. Finally, I also
examined the direct effects from level and congruence to each of the outcomes. The results of the
LCM-2 model are presented in Table 5. I also included the effects from the control variables to
each of the outcomes, all of which were nonsignificant. Due to negative residual variances, I
constrained the residual variances for the second frustration item and third WFC item to small
positive values (i.e., .10).
The relationship between organizational deviance incongruence and frustration was
hypothesized to be positive, suggesting that the more incongruent perceptions about an

45
Table 4
Descriptive Statistics for Latent Deviance Variables
Subordinate Supervisor Level Incongruence
Mean
Standard
Deviation Mean
Standard
Deviation r(sub,sup) Mean
Standard
Deviation Mean
Standard
Deviation r(lvl,con)
Organizational
Deviance 1.27 .10 1.84 .31 .01 1.56 .16 .57 .33 .04*
Note: Listwise N = 215. * p < .001.

46
employee’s deviance between an employee and his or her supervisor are, the more frustrated the
employee will become. The coefficient for this portion of the structural model (b = .04, s.e. =.27)
was positive, but not significant. Thus, Hypothesis 1 was not supported. Additionally, I
hypothesized that the average level of deviance ratings for a supervisor-subordinate dyad would
be positively related to employee frustration. Similarly to congruence, the corresponding
coefficient for this relationship (b = .27, s.e. = .58) was positive, but not significant. Thus,
Hypothesis 2 was not supported. Next, I examined whether frustration was related to each of the
outcome variables. An examination of the associated coefficients will provide tests for
Hypotheses 3-8.
First, I inspected whether frustration was related to supervisors’ ratings of employees’
citizenship behaviors directed at the organization and others within the organization. The
associated coefficients for OCBOs (b = .04, s.e. = .04) and OCBIs (b = -.05, s.e. = .05) were both
insignificant. Thus, Hypotheses 3 and 4 were not supported. Following this, I examined whether
employee frustration was related to negative outcomes rated by the supervisor, namely coworker
abuse and relationship conflict. Again, I found an insignificant coefficient for the relationship
between frustration and coworker abuse (b = .02, s.e. = .05). Therefore, Hypothesis 5 was not
supported. The coefficient for the relationship between frustration and relationship conflict (b = -
-.09, s.e. = .06) was not significant. This provides evidence that Hypothesis 6 was not supported.
Finally, I investigated whether employee frustration significantly impacted employees’ work-to-
family conflict. The corresponding coefficient (b = .05, s.e. = .06) was not significant. Thus,
Hypothesis 7 was not supported.
To test Hypothesis 8, that frustration serves as the mediator between deviance
incongruence and the outcome variables, I examined the indirect effects. The indirect effects are

47
Table 5
Results of LCM-2
Frustration Level Incongruence NA LOC
Frustration .27 (.58) .04 (.27)
Organizational citizenship behaviors .04 (.04) -1.32** (.41) .07 (.15) -.10 (.09) .04 (.06)
Interpersonal citizenship behaviors -.05 (.05) -.83* (.40) -.02 (.18) -.03 (.11) -.03 (.07)
Coworker abuse .02 (.05) .87* (.44) .10 (.19) .11 (.12) -.04 (.07)
Relationship conflict -.09 (.06) .53 (.45) .22 (.21) .22 (.14) .10 (.08)
Work-to-family conflict .05 (.03) .14 (.45) -.01 (.21) .01 (.13) -.06 (.08)
Note: Listwise N = 215. Estimates are unstandardized regression coefficients. Estimated standard errors of the coefficients appear
in parentheses. * p < .05; ** p < .01.

48
presented in Table 6. As can be seen, all of the indirect effects were zero and nonsignificant. This
was expected as the relationships between deviance incongruence and frustration, as well as
those between frustration and the outcomes, were all nonsignificant. This provides evidence that
Hypothesis 8 was not supported. Therefore, frustration does not serve as the mediating
mechanism between deviance incongruence and employee outcomes. Upon examination of the
indirect effects, and the hypothesized direct effects, I also included the direct effects from the
level and incongruence variables to each of the outcomes. While I found that frustration does not
serve as the mediator between these variables, I wanted to determine whether level and
incongruence directly impacted important work outcomes. The direct effects are presented in
Table 5. As can be seen there, three of the direct effects from level to outcomes were significant.
I found significant coefficients from level to OCBs (b = -1.32, s.e. = .41, p < .01), from level to
ICBs (b = -.83, s.e. = .40, p < .05), and from level to coworker abuse (b = .87, s.e. = .44, p < .05).
Although my original hypotheses were not supported, it is noteworthy that deviance level was
significantly related to a few of the outcomes.
Analysis of LCM-3
The final step in my analysis was to examine the LCM-3 model, where the direct effects
from incongruence and level were replaced with direct effects from supervisor- and subordinate-
rated deviance to frustration and each of the outcomes. Cheung (2009) suggests doing this as a
way to determine which sets of ratings are more influential in the congruence analysis. The
results from the LCM-3 are presented in Table 7. Once again, I included the effects from the
control variables to each of the outcomes and found no significant results. Further, I again
constrained the residual variances for the same frustration and WFC items to small positive
values (i.e., .10).

49
Table 6
Results of Tests of Indirect Effects
Path Estimate S.E. p-value
Deviance incongruence → Frustration → OCBO .00 .011 .898
Deviance incongruence → Frustration → OCBI -.00 .015 .898
Deviance incongruence → Frustration → Coworker abuse .00 .005 .906
Deviance incongruence → Frustration → Relationship conflict -.00 .024 .898
Deviance incongruence → Frustration → WFC .00 .013 .899
Note: Listwise N = 215. OCBO = Organizational citizenship behaviors. OCBI = Interpersonal citizenship behaviors.
WFC = Work-to-family conflict.

50
Examining the direct effects from the supervisor and subordinate ratings, I found one
significant relationship for subordinate ratings, and four significant relationships for supervisor
ratings. Specifically, I found subordinates’ self-ratings of deviance to be negatively related to
OCBs (b = -.74, s.e. = .32, p < .05). Additionally, I found significant ratings between
supervisors’ ratings of employee deviance and OCBs (b = -.59, s.e. = .14, p < .01), ICBs (b = -
.43, s.e. = .12, p < .01), coworker abuse (b = .54, s.e. = .13, p < .01), and relationship conflict (b
= .49, s.e. = .13, p < .01). These results provide evidence that supervisors’ ratings of employee
deviance were more influential in predicting the selected outcomes than were subordinates’ self-
ratings of deviance.

51
Table 7
Results of LCM-3
Deviance
Frustration Subordinate Supervisor NA LOC
Frustration .10 (.54) .17 (.15)
Organizational citizenship behaviors .04 (.04) -.74* (.32) -.59** (.14) -.10 (.09) .04 (.06)
Interpersonal citizenship behaviors -.05 (.05) -.40 (.36) -.43** (.12) -.03 (.11) -.03 (.07)
Coworker abuse .02 (.05) .33 (.39) .54** (.13) .11 (.12) -.04 (.07)
Relationship conflict -.09 (.06) .04 (.41) .49** (.13) .22 (.14) .10 (.08)
Work-to-family conflict .05 (.06) .08 (.42) .06 (.11) .01 (.13) -.06 (.08)
Note: Listwise N = 215. Estimates are unstandardized regression coefficients. Estimated standard errors of the coefficients appear in
parentheses. * p < .05; ** p < .001.

52
CHAPTER 5
DISCUSSION
This dissertation sought to examine the impact of deviance perceptions on outcomes such
as employee frustration and behavioral outcomes relating to both the work and family domains.
In this chapter I will discuss both theoretical and managerial implications of the current research,
recognize limitations that should be considered in light of this study, and provide suggestions for
future research efforts. I will first discuss the objectives of this dissertation and explain the
research questions studied. I will then discuss the results that were found, followed by a
discussion of the implications for theory and managers. Finally, I will discuss the limitations to
the current research and discuss suggestions for how future research might overcome these
limitations and extend the current research.
This dissertation sought to examine whether supervisors’ and subordinates’ perceptions
predicted employee frustration. Additionally, I suggested frustration leads to a host of work and
family outcomes. The hope of this research was to extend the organizational deviance literature
by suggesting deviance perceptions may serve as predictors in the workplace. Until now,
deviance has been positioned as only an outcome in the literature (e.g., Fox & Spector, 1999).
However, the current research provides theoretical rationale demonstrating that deviance may, in
some instances, serve as an antecedent in organizational research. I also contribute to the
frustration-aggression theory by investigating whether incongruent perceptions in dyadic
relationships may spur affective frustration and subsequent aggressive responses. Further, the

53
outcomes assessed in this dissertation provide an empirical test of how incongruent dyadic
perceptions may lead to displaced aggression in both the work and family domains. Finally, this
dissertation applies latent congruence modeling (Cheung, 2009) as a feasible way to study shared
perceptions within dyadic research.
Using a multiple-wave survey administration, I tested a series of eight hypotheses to
investigate the relationships between the variables of interest in this study. Prior to the current
research, deviance has only been examined as an outcome in organizational research. Thus, I
investigate whether organizational deviance perceptions serve as an antecedent to employee
frustration. Based on the frustration-aggression theory I suggest that frustration is associated with
both positive and negative workplace outcomes, as well as spillover in to the family domain. I
also investigated the indirect effects to make conclusions based on the current research.
Deviance Perceptions and Employee Outcomes
In this study, I did not find evidence that deviance perceptions influenced employee
frustration. I examined two circumstances where I expected perceptions of deviance would be
positively related to frustration. First, I expected disagreement regarding employee deviance
between supervisors and their subordinates to be positively related to frustration. Second, I
expected that the average level of deviance perceptions reported by the supervisor-subordinate
dyad also would be positively related to employee frustration. Unfortunately, neither of these
direct effects between the interaction of deviance perceptions and employee frustration were
significant.
Perhaps one suggestion for why the results were insignificant results is the reduced power
due to using a listwise deletion procedure. Thus, by utilizing a larger sample and retesting the
hypothesized effects, significant results may be produced. Further, in the current study

54
employees’ perceived frustration was measured approximately six weeks following the
measurement of deviance perceptions. While employee frustration may have occurred due the
interaction between deviance perceptions, it is very likely that the resulting frustration occurred
more immediately. Additionally, the frustration measure used was a general frustration measure
that may not have captured the direct frustration employees might experience toward their
immediate supervisors. Finally, there is a possibility that the subordinates were somewhat
unaware of the perceptions held by their supervisors regarding the employees’ deviance. In
organizational settings, one caveat to obtaining valuable information from employees is having
to ensure anonymity. Thus, there is no practical way to provide an employee’s supervisor’s
perceptions of the employee’s deviance back to the employee. In the future, it would be
beneficial to determine the extent to which employees are able to know the level of deviance
perceived by the supervisor. By comparing this type of rating to the actual rating provided by the
supervisor, we could investigate the extent to which employees are able to understand their
supervisor’s perceptions.
In this research, frustration was predicted to serve as the mediator between perceptions of
deviance and employee behaviors. Based on the frustration-aggression theory, rather than a
direct relationship between interacting deviance perceptions and employee outcomes, I suspected
that employees would experience frustration in the workplace before “acting out.” Unfortunately,
my findings did not support this prediction. I found no significant relationships between
employee frustration and the outcome variables. Similarly to the issue of timing mentioned
above, it is plausible that the six week delay between measuring frustration and outcomes, may
be hindering the ability to find significant results. Specifically, employee behavioral actions

55
brought about by frustration experienced in the workplace may occur soon after the frustration is
experienced.
In addition to testing the direct effects of incongruence and level on frustration, and
frustration on each of the outcomes, I also tested the indirect effects by multiplying the
components of each indirect effect to determine the overall effect from incongruence to each
outcome, mediated by frustration. Unfortunately, almost all of the indirect effects were estimated
to be zero. This was due to the low values of the direct effects. This provides evidence that
perceived frustration did not serve as the mediator between incongruent deviance perceptions
and employee outcomes in the current study. Perceived frustration in the workplace was not
found to be related to any of the outcome variables, nor deviance perceptions. The timing of the
measurement of frustration is therefore critical when studying frustration-aggression theory.
Following this, I examined the direct effects from the incongruence and level variables to each of
the work and family outcomes. None of the effects associated with the incongruence variable
were significant, though three of the five effects associated with the level variable were
significant. Specifically, as the level of deviance reported by the supervisor-subordinate dyad
increased, employees engaged in fewer organizational and interpersonal citizenship behaviors,
and were more abusive towards their coworkers. Thus, there is evidence that for the current
research the level of deviance reported by the dyad was more influential than incongruence in
predicting the variables of interest. However, the findings associated with the level variable are
likely driven by the relationships between the supervisor-ratings of deviance and supervisor-
rated outcomes. As noted below, the relationships may be inflated due to the common rating
source.

56
Finally, following Cheung’s (2009) recommendation. I supplemented the LCM-2 model
by also running the LCM-3 model which replaces the effects from level and incongruence with
direct effects from supervisor- and subordinate-rated deviance to each of the outcome variables.
Subordinates’ self-ratings of deviance were negatively related to organizational citizenship
behaviors. The other four effects were nonsignificant. Also, the supervisors’ ratings of deviance
were significantly related to all of the supervisor-rated outcome variables. That is, as supervisors
provided higher levels of deviance, subordinates engaged in fewer organizational and
interpersonal citizenship behaviors, and were both more abusive towards, and were more likely
to cause conflict among, their coworkers. One suggestion for these significant findings may be
common rater bias. That is, the significant findings associated with supervisors/ ratings of
deviance may be due to having a single rater for both variables. This provides assurance that the
study was designed in such a way that allowed me to investigate substantive relationships
between the variables of interest. That is, I designed the study so that I would be unable to
capitalize on significant relationships that may be biased by using a common rater or method by
using multiple raters over multiple time periods.
Theoretical Implications
The theoretical implications of the current study primarily revolve around deviance
perceptions and the frustration-aggression theory. First, this dissertation demonstrates the utility
of understanding perceptions held by both parties in the employment relationship. Using the
latent congruence model, I demonstrated that results could be highly biased by solely considering
only supervisor (or subordinate) perceptions (Podsakoff, MacKenzie, Lee, & Podsakoff, 2003).
Specifically, when using only supervisor ratings, I found significant relationships to all
supervisor-rated outcome variables. The significant relationships found across time exhibit the

57
strength of bias that can exist when examining relationships between variables collected from a
single source. Further, when using the average level of deviance provided by the dyad, I found
similar significant results to the supervisor-rated outcome variables. These results were probably
driven by the same common source issues found in the relationships when using only supervisor
ratings of deviance.
An alternative implication may be that the interaction between perceptions of deviance
held by supervisors and subordinates may not be valuable in predicting workplace outcomes.
That is, specifically assessing individually-held deviance perceptions may be more beneficial
than expected prior to analyzing the data for this dissertation. It may be that outcomes rated by
the supervisors, such as citizenship behaviors and conflict are influenced by only supervisor
ratings. In addition to the variables being rated by a common source, the supervisor’s perceptions
of subordinate outcomes may only be influenced by that supervisor’s perceptions of the
employee’s deviance. In other words, the driver of supervisors’ outcome ratings may be their
own perceptions of employee deviance, due to theoretically supported relationships rather than
for solely common source reasons. Supervisors’ perceptions of employee behaviors may be
driven by their perceptions of deviance regardless of the employees’ own behaviors.
Regarding subordinate-rated outcomes, including both employee frustration and WFC,
there may be a number of reasons for the results found in the current study. First, the employees
who participated in the current study were not given any indication as to the level of deviance
that was provided by their respective supervisors. Thus, one possibility for the insignificant
findings is that employee frustration may not have been driven by incongruent deviance
perceptions since subordinates were only aware of their self-reported deviance. Due to the
required anonymity associated with the data collection used in this study, I was not allowed to

58
give subordinates any information regarding their supervisors’ reports, or vice versa.
Additionally, in the current study most employees working within the departments surveyed
worked very closely with several other members in the organization. The work completed by the
departments allowed for teams to work consistently over time with a small group of members
within the department. The groups also worked consistently for the same supervisor. Further,
upon analyzing the data collected, it appears that neither employees nor supervisors were
satisfied with the organization as a whole. Thus, one rationale for the findings is that the
supervisors may have been covering for their employees by providing very low ratings of
employee deviance. Very low ratings provided by supervisors combined with little variation
found in subordinates’ self-ratings may be the source of the insignificant findings found in the
current research.
Due to the idiosyncrasies associated with the data set, including the relationship
dynamics and the potential for covering up negative behaviors, the relationships investigated
may warrant further investigation. The relationships found in the current study may not replicate
in other samples. In addition to the characteristics of the sample being unique, the relationship
dynamics within the organization also make the current findings less generalizable to other
samples. All of the reasons mentioned above provide evidence that replication in an independent
sample may be warranted. While the theoretical implications hold validity based on the findings
of this study, such implications should be viewed in light of the unique characteristics of the
sample.
Managerial Implications
The findings of this dissertation have several implications for managers regarding
employee frustration and behaviors in the workplace. First, it should be recognized that there is

59
the potential for bias in ratings. Organizations interested in implementing survey research to
further understand the dynamic relationships between workplace behaviors and performance
outcomes should implement safeguards in their surveys to combat bias. For example, in the
current study, the significant relationships were mostly found between supervisor ratings and
supervisor outcomes. While the results may illustrate significant, valid relationships, there is also
the potential that bias due to the common source may be the basis of the relationships (making
the relationships artificial). Unfortunately, it may be hard to completely eliminate such biases.
One recommendation would be to inform managers that without honest ratings, the survey
research becomes ineffective. In this study, it may have been that supervisors were inflating
favorable ratings, and deflating negative ratings, for their own subordinates in order to make
their crew look better. Thus, obtaining honest ratings is crucial to analyzing the hypothesized
relationships. However, this may not be enough to obtain fully honest ratings. Another
recommendation would be to use short, succinct measures to decrease supervisors’ fatigue.
Regarding the findings of the current study, managers should pay attention to employee
deviance. Employee deviance (based on both supervisor and subordinates ratings) was found to
be negatively related to positive organizational behaviors. Until this point, deviance has been
positioned as an outcome, suggesting that deviance does not serve as a predictor. This
dissertation provides preliminary evidence that perceptions of deviance may predict other
employee behaviors Additionally, I found supervisors’ perception of employee deviance to
significantly predict their ratings of employees’ OCBI, relationship conflict, and coworker abuse.
This again provides evidence that deviance should not only be regarded as an outcome, and that
deviance scholars should also investigate outcomes of deviance perceptions. Finally, anonymity
remains a major concern in survey-based research. During the current data collection, animosity

60
existed between the researchers and the participants due to anonymity concerns. Regardless of
the explanations for how the data would be treated, the participants did not trust that their
responses would be anonymous. Thus, subordinates also may have deflated their deviance
ratings since the participants had concerns that their individual ratings would be reported to the
organization.
Limitations
While implications for both scholars and managers can be derived from the findings of
the current study, the implications should be understood in light of a number of limitations also
associated with this dissertation. Perhaps the most significant limitation in the current study is
the inability to control the environment and, in turn, establish true causality. I designed the
dissertation study in such a way that I would be able to reduce some of the ambiguity regarding
the direction of causality between the variables of interest. Specifically, I built in six week
periods to allow the independent variables to be collected prior to the mediator, which was
collected prior to the outcomes.
Another major concern based on the findings of the current study is the timing that was
used between the measurement of each set of variables. First, the appropriate amount of time
between a frustrating event and the affective state of frustration the employee experiences
remains unknown. In this dissertation, I chose to allow six weeks between the survey
administrations. I argue that after several weeks of experiencing incongruent perceptions within
the dyad, the employee will experience an affective state of frustration. However, it is plausible
that employees may experience frustration much sooner than six weeks. The amount of time
passing between frustrating events and employee frustration could also vary from soon after the
event to weeks after the event. Considering incongruent deviance perceptions, the amount of

61
time required for frustration to be experienced may covary with the extent to which employees
are informed of incongruent perceptions. That is, if an employee was given a copy of his or her
supervisor’s ratings of the employee’s deviance, and those were incongruent with the self-ratings
of deviance, employee frustration may occur very quickly. However, if the employee has no
knowledge of the ratings and is only able to indirectly infer the supervisor’s perceptions of
deviance, employee frustration may take longer to occur. Further, the current study inquired
about general frustration associated with the job. A more targeted frustration measure may
capture employee frustration due to incongruent perceptions more effectively. I also asked
employees to think about frustration without providing a direct referent regarding time. That is, I
did not ask employees to think about a given time period regarding their frustration. Such a
measure may more accurately reflect the conceptual experience of frustration that is of interest to
the current study.
Regarding the outcome variables of interest in this dissertation, I specifically focused on
displaced aggression and indirect retaliation. The outcome variables were either indirect
retaliation against the supervisor (e.g., reduced organizational and interpersonal citizenship
behaviors), or displaced aggression targeted at coworkers (e.g., coworker abuse and relationship
conflict). Based on the frustration-aggression theory, I argued that due to being at a power
disadvantage the employee would retaliate indirectly against the supervisor rather than retaliating
with direct behaviors such as verbal of physical abuse. However, there is also an opportunity for
employees to retaliate aggressively against their supervisors if the employees are significantly
frustrated. This type of aggression will more likely take the form of verbal abuse, as this is less
extreme than physical abuse. In this context, direct retaliation would be less likely due to the
close-knit relationship between supervisors and their crews. On the other hand, in occupations

62
where employees work autonomously, a larger number of employees report to a single
supervisor, and little interaction exists between supervisors and their direct reports, direct
retaliation may become more evident.
Finally, in the current study I assumed that employees’ goals would be unfulfilled due to
frustration in the workplace. Dollard and colleagues (1939) originally asserted that when goal
attainment was blocked, individuals would become frustrated. In my dissertation, rather than
actually measuring whether goals were unfulfilled, I used incongruent deviance perceptions as a
proxy, arguing that due to being in disagreement with their supervisor about their deviance,
employees would not be able to obtain their goals, and in turn become frustrated. Using an actual
measure of goal fulfillment may have produced different results.
Future Directions
Notwithstanding that unfortunately most of the hypotheses presented in the current
dissertation were not supported, a number of fruitful avenues for future research exist. First, I
suggest that the data be re-analyzed using an alternative approach to handling missing data. In
the current study I used a listwise deletion procedure, which also has been used in countless
studies published in the management literature (e.g., Richter, Hirst, van Knippenberg, & Baer,
2012; Swider, Boswell, & Zimmerman, 2011). However, recent studies on organizational
research methods have demonstrated the benefits of using alternative methods for estimating
missing data, such as multiple imputation and full information maximum likelihood (FIML;
Newman, 2014). Newman (2014) demonstrates that listwise procedures may produce biased
estimates and limit the generalizability of results to only those who choose to complete entire
surveys. In the dataset used in this study, using FIML may increase the sample size by
approximately 30% by using the information provided by respondents who may have data

63
missing at either the item- or construct-level on some variables. A second suggestion is to fully
replicate this study using an independent sample. This action will allow for increased
generalizability and provide evidence as to whether the results found in this dissertation may
have been sample specific due to the idiosyncrasies in the dataset.
Berkowitz (1989) argued that researchers studying the frustration-aggression theory
should consider individual emotion in the process. Unfortunately, direct results have yet to be
produced as to what length of time should be built into one’s research design between frustrating
events and the experienced frustration. Future research might benefit by considering the lapse of
time that should occur, perhaps studying different degrees of transgressions experienced, and
differing lapses of time. For example, a diary study might be used to understand whether
employees experience frustration on a more immediate, or frequent, basis in the workplace. The
lack of significant results in the current study may be due to the amount of time that occurred
between each wave of measurement. Diary studies have been used to understand how work
demands impact daily emotions of employees (Xanthopoulou, Bakker, Demerouti, & Schaufeli,
2012). Similarly, diaries may allow researchers to examine frustration in the workplace that may
be experienced on a daily basis due to occurrences of incongruent perceptions with their
supervisor.
Another area that may benefit from future investigation is directly measuring
interruptions to goal attainment. In the current study, I used incongruence and level as a proxy
for goal attainment. In other words, I argued that when deviance perceptions were higher and/or
incongruent employee would be unable to accomplish their goals. Employees’ goals may range
from obtaining higher performance ratings to being promoted, receiving a raise, or being

64
transferred to a different location or department. Truly testing the frustration-aggression theory
would require explicitly capturing the extent to which such goal attainment was interrupted.
Considering the idiosyncrasies associated with the current data, team member evaluations
may also provide interesting results. The employee data used in this dissertation included a
majority of employees who worked in teams or with crews who were relatively stable over the
period of the data collection. Thus, team member evaluations of employee deviance may provide
interesting and more accurate results than employees’ self-ratings. Since employees were
required to self-disclose the deviant behaviors they engaged in, social desirability was likely
present which may have resulted in inaccurate self-ratings. Additionally, frustration may serve as
a moderator rather than a mediator. Reviewing the results, frustration did not serve as a mediator.
It may be interesting to determine whether there is an interaction between frustration and both
level and incongruence. That is, if employees experience high levels of deviance, or an
incongruence in deviance perceptions in relation to their immediate supervisor, and are also
frustrated, some of the outcomes may increase or decrease dramatically.
The current dissertation specifically focused on indirect retaliation, highlighting the
displaced aggression tenet of the frustration-aggression theory (Dollard et al., 1939; Miller,
1941). Future research might examine whether direct retaliation occurs in the workplace. For
example, rather than reducing one’s citizenship behaviors to indirectly retaliate against the
supervisor, he or she may prefer to stay true to his or her self-concept. Thus, employees might
respond aggressively rather than try to change who they are and what they do at work. Such a
situation might consist of an employee retaliating by being verbally aggressive to demonstrate
his or her frustration with the incongruent perceptions held by the supervisor. Additionally,
within certain industries and/or types of firms, this type of behavior might be more acceptable.

65
For example, verbal aggression toward the supervisor may be more acceptable when engaged in
by family members working in family-owned firms. In that case, firm ownership might moderate
the relationships predicted in the current study.
Conclusion
This dissertation sought to extend the frustration-aggression theory to dyadic
relationships by considering both supervisor and subordinate perceptions of a key employee
characteristic. Although I did not find support for my entire model, the current research
demonstrates the value of considering both parties of the employment relationship when studying
employee attitudes and behaviors. Using latent congruence modeling, I found that the interaction
between supervisor and subordinate perceptions of employee deviance (level of deviance
reported by the dyad) was significantly related to a number of critical workplace outcomes.
Further, using this type of analysis in future research designs provides a promising opportunity to
more fully understand the employment relationship.

66
REFERENCES
Anderson, C. A., & Bushman, B. J. (2002). Human aggression. Psychology, 53, 27-51.
doi:10.1146/annurev.psych.53.100901.135231
Andersson, L. M., & Pearson, C. M. (1999). Tit for tat? The spiraling effect of incivility in the
workplace. Academy of Management Review, 24, 452-471. doi:
10.5465/AMR.1999.2202131
Aquino, K., Lewis, M. U., & Bradfield, M. (1999). Justice constructs, negative affectivity, and
employee deviance: A proposed model and empirical test. Journal of Organizational
Behavior, 20, 1073-1091. doi: 10.1002/(SICI)1099-1379(199912)20:7<1073::AID-
JOB943>3.0.CO;2-7
Averill, J. R. (1982). Anger and aggression: An essay for emotion. New York, NY: Springer-
Verlag.
Bennett, R. J., & Robinson, S. L. (2000). Development of a measure of workplace deviance.
Journal of Applied Psychology, 85, 349-360. doi: 10.1037/0021-9010.85.3.349
Bentler, P. M., & Chou, C. P. (1987). Practical issues in structural modeling. Sociological
Methods & Research, 16, 78-117. doi: 10.1177/0049124187016001004
Berkowitz, L. (1989). Frustration-aggression hypothesis: Examination and reformulation.
Psychological Bulletin, 106, 59-73. doi: 10.1037/0033-2909.106.1.59
Berry, C. M., Ones, D. S., & Sackett, P. R. (2007). Interpersonal deviance, organizational
deviance, and their common correlates: a review and meta-analysis. Journal of Applied
Psychology, 92, 410-424. doi: 10.1037/0021-9010.92.2.410
Bollen, K. A. (1989). A new incremental fit index for general structural equation models.
Sociological Methods & Research, 17, 303-316. doi: 10.1177/0049124189017003004
Buss, A. H. (1963). Physical aggression in relation to different frustrations. The Journal of
Abnormal and Social Psychology, 67, 1-7. doi: 10.1037/h0040505
Carlson, D. S., Kacmar, K. M., & Williams, L. J. (2000). Construction and initial validation of a
multidimensional measure of work–family conflict. Journal of Vocational Behavior, 56,
249-276. doi: 10.1006/jvbe.1999.1713

67
Cheung, G. W. (2009). Introducing the latent congruence model for improving the assessment of
similarity, agreement, and fit in organizational research. Organizational Research
Methods, 12, 6-33. doi: 10.1177/1094428107308914
Christian, M. S., & Ellis, A. P. (2011). Examining the effects of sleep deprivation on workplace
deviance: A self-regulatory perspective. Academy of Management Journal, 54, 913-934.
doi: 10.5465/amj.2010.0179
Cohen, J. (1988). Statistical Power Analysis for the Behavioral Sciences (2nd Edition). Hillsdale,
NJ: Lawrence Earlbaum Associates.
Coffin, B. (2003). Breaking the silence on white collar crime. Risk Management, 50.
Dollard, J., Miller, N. E., Doob, L. W., Mowrer, O. H., & Sears, R. R. (1939). Frustration and
aggression. New Haven, CT: Yale University Press. doi: 10.1037/10022-000
Dupré, K. E., Inness, M., Connelly, C. E., Barling, J., & Hoption, C. (2006). Workplace
aggression in teenage part-time employees. Journal of Applied Psychology, 91, 987-997.
doi: 10.1037/0021-9010.91.5.987
Eisenberger, R., Stinglhamber, F., Vandenberghe, C., Sucharski, I. L., & Rhoades, L. (2002).
Perceived supervisor support: contributions to perceived organizational support and
employee retention. Journal of Applied Psychology, 87, 565-573. doi: 10.1037/0021-
9010.87.3.565
Evan, W. (1965). Conflict and performance in R&D organizations. Industrial Management
Review, 7, 37–46.
Folger, R., & Baron, R. A. (1996). Violence and hostility at work: A model of reactions to
perceived injustice. In G. R. VandenBos & E. Bulatao (Eds.). Violence on the job:
Identifying risks and developing solutions (pp.51-85). Washington, DC: American
Psychological Association. doi: 10.1037/10215-002
Fornell, C., & Larcker, D. F. (1981). Evaluating structural equation models with unobservable
variables and measurement error. Journal of Marketing Research, 18, 39-50. doi:
10.2307/3151312
Fox, S., & Spector, P. E. (1999). A model of work frustration–aggression. Journal of
Organizational Behavior, 20, 915-931. doi: 10.1002/(SICI)1099-
1379(199911)20:6<915::AID-JOB918>3.0.CO;2-6
Frone, M. R. (2003). Work–family balance. In J. C. Quick, & L. E. Tetrick (Eds.), Handbook of
occupational health psychology (pp. 143–162). Washington, DC: American
Psychological Association.
Gladstein, D. (1984). Groups in context: A model of task group effectiveness. Administrative
Science Quarterly, 29, 499–517. doi: 10.2307/2392936

68
Gouldner, A. W. (1960). The norm of reciprocity: A preliminary statement. American
Sociological Review, 25, 161-178.
Greenhaus, J. H., & Beutell, N. J. (1985). Sources of conflict between work and family roles.
Academy of Management Review, 10, 76-88. doi: 10.5465/AMR.1985.4277352
Grzywacz, J. G., Almeida, D. M., & McDonald, D. A. (2002). Work–Family Spillover and Daily
Reports of Work and Family Stress in the Adult Labor Force. Family Relations, 51, 28-
36. doi: 10.1111/j.1741-3729.2002.00028.x
Harris, K. J., Harvey, P., & Booth, S. L. (2010). Who abuses their coworkers? An examination of
personality and situational variables. The Journal of Social Psychology, 150, 608-627.
doi: 10.1080/00224540903365489
Hershcovis, M. S., Turner, N., Barling, J., Arnold, K. A., Dupré, K. E., Inness, M., Leblanc, M.
M., & Sivanathan, N. (2007). Predicting workplace aggression: a meta-analysis. Journal
of Applied Psychology, 92, 228-238. doi: 10.1037/0021-9010.92.1.228
Homans, G. C. (1961). Social behavior: Its elementary forms. New York, NY: Harcourt, Brace
& World.
Hoobler, J. M., & Brass, D. J. (2006). Abusive supervision and family undermining as displaced
aggression. Journal of Applied Psychology, 91, 1125-1133. doi: 10.1037/0021-
9010.91.5.1125
Jehn, K. A., & Bendersky, C. (2003). Intragroup conflict in organizations: A contingency
perspective on the conflict-outcome relationship. Research in Organizational Behavior,
25, 187-242. doi: 10.1016/S0191-3085(03)25005-X
Jehn, K. A., & Mannix, E. A. (2001). The dynamic nature of conflict: A longitudinal study of
intragroup conflict and group performance. Academy of Management Journal, 44, 238-
251. doi: 10.2307/3069453
Jehn, K. A., Northcraft, G. B., & Neale, M. A. (1999). Why differences make a difference: A
field study of diversity, conflict and performance in workgroups. Administrative Science
Quarterly, 44, 741-763. doi: 10.2307/2667054
Jermier, J. M., Knights, D. E., & Nord, W. R. (1994). Resistance and power in organizations.
London: Routledge.
Kulik, J. A., & Brown, R. (1979). Frustration, attribution of blame, and aggression. Journal of
Experimental Social Psychology, 15, 183-194. doi: 10.1016/0022-1031(79)90029-5
LePine, J. A., Erez, A., & Johnson, D. E. (2002). The nature and dimensionality of
organizational citizenship behavior: a critical review and meta-analysis. Journal of
Applied Psychology, 87, 52-65. doi: 10.1037/0021-9010.87.1.52

69
Levenson, H. (1981). Differentiating among internality, powerful others, and chance. In H. M.
Lefcourt (Ed.), Research with the locus of control construct, 1, 15-63. New York:
Academic Press.
Lian, H., Lance Ferris, D., & Brown, D. J. (2012). Does taking the good with the bad make
things worse? How abusive supervision and leader–member exchange interact to impact
need satisfaction and organizational deviance. Organizational Behavior and Human
Decision Processes, 117, 41-52. doi: 10.1016/j.obhdp.2011.10.003
Marcus-Newhall, A., Pedersen, W. C., Carlson, M., & Miller, N. (2000). Displaced aggression is
alive and well: a meta-analytic review. Journal of Personality and Social Psychology, 78,
670-689. doi: 10.1037/0022-3514.78.4.670
Matthews, R. A., Kath, L. M., & Barnes-Farrell, J. L. (2010). A short, valid, predictive measure
of work–family conflict: Item selection and scale validation. Journal of Occupational
Health Psychology, 15, 75-90. doi: 10.1037/a0017443
Miller, N. E. (1941). The frustration-aggression hypothesis. Psychological Review, 48, 337-342.
Miller, N., & Marcus-Newhall, A. (1997). A conceptual analysis of displaced aggression. In R.
Ben-Ari & Y. Rich (Eds.). Enhancing education in heterogeneous schools (pp. 69-108).
Ramat-Gan, Israel: Bar-Ilan University Press.
Miller, N., Pedersen, W. C., Earleywine, M., & Pollock, V. E. (2003). A theoretical model of
triggered displaced aggression. Personality and Social Psychology Review, 7, 75-97. doi:
10.1207/S15327957PSPR0701_5
Mitchell, M. S., & Ambrose, M. L. (2007). Abusive supervision and workplace deviance and the
moderating effects of negative reciprocity beliefs. Journal of Applied Psychology, 92,
1159-1168. doi: 10.1037/0021-9010.92.4.1159
Mitchell, M. S., & Ambrose, M. L. (2012). Employees' behavioral reactions to supervisor
aggression: An examination of individual and situational factors. Journal of Applied
Psychology, 97, 1148-1170. doi: 10.1037/a0029452
Muthén, B. O., & Muthén, L. K. (2012). Mplus 7 base program. Muthén & Muthén: Los
Angeles, CA.
Neuman, J. H., & Baron, R. A. (1998). Workplace violence and workplace aggression: Evidence
concerning specific forms, potential causes, and preferred targets. Journal of
Management, 24, 391-419. doi: 10.1016/S0149-2063(99)80066-X
Newman, D. A. (2014). Missing data five practical guidelines. Organizational Research
Methods, 17, 372-411. doi: 10.1177/1094428114548590
O'Boyle Jr, E. H., Forsyth, D. R., Banks, G. C., & McDaniel, M. A. (2012). A meta-analysis of
the dark triad and work behavior: A social exchange perspective. Journal of Applied
Psychology, 97, 557-579. doi: 10.1037/a0025679

70
O’Neill, T. A., Lewis, R. J., & Carswell, J. J. (2011). Employee personality, justice perceptions,
and the prediction of workplace deviance. Personality and Individual Differences, 51,
595-600. doi: 10.1016/j.paid.2011.05.025
Oh, I. S., Lee, K., Ashton, M. C., & de Vries, R. E. (2011). Are Dishonest Extraverts More
Harmful than Dishonest Introverts? The Interaction Effects of Honesty‐Humility and
Extraversion in Predicting Workplace Deviance. Applied Psychology, 60, 496-516. doi:
10.1111/j.1464-0597.2011.00445.x
Organ, D. W. (1988). Organizational citizenship behavior: The good soldier syndrome.
Lexington Books/DC Heath and Com.
Organ, D. W. (1990). The motivational basis of organization citizenship behavior. Research in
Organizational Behavior, 12, 43-72.
Organ, D. W. (1997). Organizational citizenship behavior: It's construct clean-up time. Human
Performance, 10, 85-97. doi: 10.1207/s15327043hup1002_2
Pastore, N. (1952). The role of arbitrariness in the frustration-aggression hypothesis. The Journal
of Abnormal and Social Psychology, 47, 728-731.
Pelled, L. H. (1996). Demographic diversity, conflict, and work group outcomes: An intervening
process theory. Organization Science, 6, 615–631. doi: 10.1287/orsc.7.6.615
Perlow, R., & Latham, L. L. (1993). Relationship of client abuse with locus of control and
gender: a longitudinal study in mental retardation facilities. Journal of Applied
Psychology, 78, 831-834. doi: 10.1037/0021-9010.78.5.831
Peters, L. H., & O’Connor, E. J. (1980). Situational constraints and work outcomes: The
influences of a frequently overlooked construct. Academy of Management Review, 5,
391-397. doi: 10.5465/AMR.1980.4288856
Peters, L. H., O'Connor, E. J., & Rudolf, C. J. (1980). The behavioral and affective consequences
of performance-relevant situational variables. Organizational Behavior and Human
Performance, 25, 79-96. doi: 10.1016/0030-5073(80)90026-4
Podsakoff, P. M., MacKenzie, S. B., Lee, J. Y., & Podsakoff, N. P. (2003). Common method
biases in behavioral research: a critical review of the literature and recommended
remedies. Journal of Applied Psychology, 88, 879-903. doi: 10.1037/0021-9010.88.5.879
Richter, A. W., Hirst, G., Van Knippenberg, D., & Baer, M. (2012). Creative self-efficacy and
individual creativity in team contexts: Cross-level interactions with team informational
resources. Journal of Applied Psychology, 97, 1282-1290. doi: 10.1037/a0029359
Robinson, S. L., & Bennett, R. J. (1995). A typology of deviant workplace behaviors: A
multidimensional scaling study. Academy of Management Journal, 38, 555-572. doi:
10.2307/256693
71
Rotter, J. B. (1966). Generalized expectancies for internal versus external control of
reinforcement. Psychological monographs: General and applied, 80, 1-28. doi:
10.1037/h0092976
Royal, M. & Agnew, T. (2011). Workplace Frustration is the Silent Killer According to New
Book ‘The Enemy of Engagement’. Bullish on Books. Retrieved from
http://www.cnbc.com/id/45080681#.
Settoon, R. P., & Mossholder, K. W. (2002). Relationship quality and relationship context as
antecedents of person-and task-focused interpersonal citizenship behavior. Journal of
Applied Psychology, 87, 255-267. doi: 10.1037/0021-9010.87.2.255
Skarlicki, D. P., & Folger, R. (1997). Retaliation in the workplace: The roles of distributive,
procedural, and interactional justice. Journal of Applied Psychology, 82, 434-443. doi:
10.1037/0021-9010.82.3.434
Soper, D.S. (2014). A-priori Sample Size Calculator for Structural Equation Models [Software].
Available from http://www.danielsoper.com/statcalc
Spector, P. E., & Jex, S. M. (1998). Development of four self-report measures of job stressors
and strain: Interpersonal Conflict at Work Scale, Organizational Constraints Scale,
Quantitative Workload Inventory, and Physical Symptoms Inventory. Journal of
Occupational Health Psychology, 3, 356-367. doi: 10.1037/1076-8998.3.4.356
Storms, P. L., & Spector, P. E. (1987). Relationships of organizational frustration with reported
behavioural reactions: The moderating effect of locus of control. Journal of Occupational
Psychology, 60, 227-234. doi: 10.1111/j.2044-8325.1987.tb00255.x
Swider, B. W., Boswell, W. R., & Zimmerman, R. D. (2011). Examining the job search–turnover
relationship: The role of embeddedness, job satisfaction, and available alternatives.
Journal of Applied Psychology, 96, 432-. doi: 10.1037/a0021676
Tedeschi, J. T., & Norman, N. M. (1985). A social psychological interpretation of displaced
aggression. Advances in Group Processes, 2, 29–56.
Tepper, B. J. (2000). Consequences of abusive supervision. Academy of Management Journal,
43, 178-190. doi: 10.2307/1556375
Thau, S., Bennett, R. J., Mitchell, M. S., & Marrs, M. B. (2009). How management style
moderates the relationship between abusive supervision and workplace deviance: An
uncertainty management theory perspective. Organizational Behavior and Human
Decision Processes, 108, 79-92. doi: 10.1016/j.obhdp.2008.06.003
Vandenberg, R. J., & Lance, C. E. (2000). A review and synthesis of the measurement invariance
literature: Suggestions, practices, and recommendations for organizational research.
Organizational Research Methods, 3, 4-70. doi: 10.1177/109442810031002

72
Wall, V., & Nolan, L. (1986). Perceptions of inequality, satisfaction, and conflict in task oriented
groups. Human Relations, 39, 1033–1052. doi: 10.1177/001872678603901106
Wang, W., Mao, J., Wu, W., & Liu, J. (2012). Abusive supervision and workplace deviance: The
mediating role of interactional justice and the moderating role of power distance. Asia
Pacific Journal of Human Resources, 50, 43-60. doi: 10.1111/j.1744-7941.2011.00004.x
Watson, D., Clark, L. A., & Tellegen, A. (1988). Development and validation of brief measures
of positive and negative affect: the PANAS scales. Journal of Personality and Social
Psychology, 54, 1063-1070. doi: 10.1037/0022-3514.54.6.1063
Westland, J.C. (2010). Lower bounds on sample size in structural equation modeling. Electronic
Commerce Research and Applications, 9, 476-487. doi: 10.1016/j.elerap.2010.07.003
Williams, L. J., & Anderson, S. E. (1991). Job satisfaction and organizational commitment as
predictors of organizational citizenship and in-role behaviors. Journal of Management,
17, 601-617. doi: 10.1177/014920639101700305
Xanthopoulou, D., Bakker, A. B., Demerouti, E., & Schaufeli, W. B. (2012). A diary study on
the happy worker: How job resources relate to positive emotions and personal resources.
European Journal of Work and Organizational Psychology, 21, 489-517. doi:
10.1080/1359432X.2011.584386
Zillmann, D. (1978). Attribution and misattribution of excitatory reactions. New directions in
attribution research: Vol. 2, Hillsdale, NJ: Erlbaum.

73
Appendix A
Scale Items
Organizational Deviance Scale
Citation:
Aquino, K., Lewis, M., & Bradfield, M. (1999). Justice constructs, negative affectivity, and
employee deviance: A proposed model and empirical test. Journal of Organizational
Behavior, 20, 1073-1091.
Instructions:
Please indicate the extent to which you have engaged in the following behaviors during the
past 6 months by placing a number in the blank in front of each item using the scale
provided below.
Response scale:
Never Rarely Sometimes Occasionally Often
1------------------------2------------------------3--------------------------4-----------------------------5
Items:
_____ Intentionally arrived late for work.
_____ Called in sick when I was not really ill.
_____ Took undeserved breaks to avoid work.
_____ Made unauthorized use of organizational property.
_____ Left work early without permission.
_____ Lied about the number of hours I worked.
_____ Worked on a personal matter on the job instead of working for my employer.
_____ Purposely ignored my supervisor’s instructions.

74
Frustration Scale
Citation:
Peters, L. H., O'Connor, E. J., & Rudolf, C. J. (1980). The behavioral and affective consequences
of performance-relevant situational variables. Organizational Behavior and Human
Performance, 25, 79-96.
Instructions:
Please indicate your level of agreement with the following statements regarding your organization by
placing a number in the blank in front of each item using the scale provided below.
Response scale:
Strongly Disagree Neither Agree Agree Strongly
Disagree nor Disagree Agree
1----------------------2---------------------------3-------------------------------4--------------------------5
Items:
_____ Trying to get this job done is a very frustrating experience.
_____ Being frustrated comes with this job.
_____ Overall, I experience very little frustration on this job. *Recode*

75
Organizational Citizenship Behaviors (OCBO) Scale
Citation:
Williams, L. J., & Anderson, S. E. (1991). Job satisfaction and organizational commitment as
predictors of organizational citizenship and in-role behaviors. Journal of Management,
17, 601-617.
Instructions:
Using the scale below, please indicate your level of agreement with the following statements
regarding each subordinate by placing a number in the cell under the subordinate’s name.
Response scale:
Strongly Disagree Neither Agree Agree Strongly
Disagree nor Disagree Agree
1----------------------2---------------------------3-------------------------------4--------------------------5
Items:
_____ This individual’s attendance at work is above the norm.
_____ This individual gives advance notice when unable to come to work.
_____ This individual takes undeserved work breaks. *Recode*
_____ This individual spends a great deal of time with personal phone conversations. *Recode*
_____ This individual complains about insignificant things at work. *Recode*
_____ This individual adheres to informal rules devised to maintain order.

76
Interpersonal Citizenship Behaviors (OCBI) Scale
Citation:
Settoon, R. P., & Mossholder, K. W. (2002). Relationship quality and relationship context as
antecedents of person-and task-focused interpersonal citizenship behavior. Journal of
Applied Psychology, 87, 255-267.
Instructions:
Using the scale below, please indicate your level of agreement with the following statements
regarding each subordinate by placing a number in the cell under the subordinate’s name.
Response scale:
Strongly Disagree Neither Agree Agree Strongly
Disagree nor Disagree Agree
1----------------------2---------------------------3-------------------------------4--------------------------5
Items:
_____ This subordinate listens to coworkers when they have to get something off their chest.
_____ This subordinate takes time to listen to coworkers’ problems and worries.
_____ This subordinate takes a personal interest in coworkers.
_____ This subordinate shows concern and courtesy toward coworkers, even under the most
trying business situations.
_____ This subordinate makes an extra effort to understand coworkers’ problems.
_____ This subordinate always goes out of the way to make newer employees feel welcome in
the work group.
_____ This subordinate tries to cheer up coworkers who are having a bad day.
_____ This subordinate compliments coworkers when they succeed at work.

77
Coworker Abuse Scale
Citation:
Tepper, B. J. (2000). Consequences of abusive supervision. Academy of Management Journal,
43, 178-190.
Instructions:
Using the scale below, please indicate your level of agreement with the following statements
regarding each subordinate by placing a number in the cell under the subordinate’s name.
Response scale:
Strongly Disagree Neither Agree Agree Strongly
Disagree nor Disagree Agree
1----------------------2---------------------------3-------------------------------4--------------------------5
Items:
_____ This subordinate expresses anger at others in the workplace when s/he is mad for another
reason.
_____ This subordinate makes negative comments about others in the workplace.
_____ This subordinate breaks promises s/he makes to others in the workplace.
_____ This subordinate gives others the silent treatment in the workplace.
_____ This subordinate puts others down in front of others in the workplace.
_____ This subordinate is rude to others in the workplace.

78
Relationship Conflict Scale
Citation:
Jehn, K.A., & Bendersky, C. (2003). Intragroup conflict in organizations: A contingency
perspective on the conflict-outcome relationship. Research in Organizational Behavior,
25, 187-242.
Instructions:
Using the scale below, please indicate your level of agreement with the following statements
regarding each subordinate by placing a number in the cell under the subordinate’s name.
Response scale:
Strongly Disagree Neither Agree Agree Strongly
Disagree nor Disagree Agree
1----------------------2---------------------------3-------------------------------4--------------------------5
Items:
_____ This subordinate has emotional conflicts with group members.
_____ This subordinate has personality conflicts with group members.
_____ This subordinate causes friction among group members.
_____ This subordinate is at the source of tension among group members.

79
Work-to-Family Conflict Scale
Citation:
Matthews, R. A., Kath, L. M., & Barnes-Farrell, J. L. (2010). A short, valid, predictive measure
of work–family conflict: Item selection and scale validation. Journal of Occupational Health
Psychology, 15, 75-90.
Instructions:
Please indicate your level of agreement with the following statements regarding your job by
placing a number in the blank in front of each item using the scale provided below.
Response scale:
Strongly Disagree Neither Agree Agree Strongly
Disagree nor Disagree Agree
1----------------------2---------------------------3-------------------------------4--------------------------5
Items:
_____ I have to miss family activities due to the amount of time I must spend on work
responsibilities.
_____ I am often so emotionally drained when I get home from work that it prevents me from
contributing to my family.
_____ The behaviors I perform that make me effective at work do not help me to be a better
parent and spouse.

80
Locus of Control Scale
Citation:
Levenson, H. (1981). Differentiating among internality, powerful others, and chance. In H. M.
Lefcourt (Ed.), Research with the locus of control construct, 1, pp. 15-63. New York: Academic
Press.
Instructions:
Please indicate your level of agreement with the following statements regarding your immediate
supervisor by placing a number in the blank in front of each item using the scale provided
below.
Response scale:
Strongly Disagree Neither Agree Agree Strongly
Disagree nor Disagree Agree
1----------------------2---------------------------3-------------------------------4--------------------------5
Items:
_____ Whether or not I get to be a leader depends mostly on my ability.
_____ Whether or not I get into a car accident depends mostly on how good of a driver I am.
_____ When I make plans, I am almost certain to make them work.
_____ How many friends I have depends on how nice of a person I am.

81
Negative Affect Scale
Citation:
Watson, D., Clark, L. A., & Tellegen, A. (1988). Development and validation of brief measures
of positive and negative affect: the PANAS scales. Journal of Personality and Social
Psychology, 54, 1063-1070.
Instructions:
Using the scale below, please indicate how often you generally feel....
Very Slightly A little Moderately Quite a bit Extremely
or not at all
1----------------------2---------------------------3-------------------------------4--------------------------5
_____ Irritable _____ Upset _____ Scared _____ Afraid _____ Guilty
_____ Distressed _____ Nervous _____ Hostile _____ Ashamed _____ Jittery

82
Appendix B
IRB Approval

83

84