the five-parameter grain boundary curvature distribution
TRANSCRIPT

Full length article
The five-parameter grain boundary curvature distribution in anaustenitic and ferritic steel
Xiaoting Zhong a, David J. Rowenhorst b, Hossein Beladi c, Gregory S. Rohrer a, *
a Department of Materials Science and Engineering, Carnegie Mellon University, Pittsburgh, PA 15213, USAb Materials Science and Technology Division, The US Naval Research Laboratory, Washington, D.C. 20375, USAc Institute for Frontier Materials, Deakin University, Geelong, VIC 3216, Australia
a r t i c l e i n f o
Article history:Received 29 July 2016Received in revised form21 September 2016Accepted 11 October 2016
Keywords:3D microstructureGrain boundary curvatureGrain boundariesMicrostructure
a b s t r a c t
The distribution of grain boundary curvatures as a function of five independent crystallographic pa-rameters is measured in an austenitic and a ferritic steel. Both local curvatures and integral mean cur-vatures are measured from three dimensional electron backscattered diffraction data. The method is firstvalidated on ideal shapes. When applied to real microstructures, it is found that the grain boundary meancurvature varies with the boundary crystallography and is more sensitive to the grain boundary planeorientation than to the disorientation. The grain boundaries with the smallest curvatures also have lowgrain boundary energy and large relative areas. The results also show that the curvature is influenced bythe grain size and by the number of nearest neighbors. For austenite, when the number of faces on agrain is equal to the average number of faces of its neighbors, it has zero integral mean curvature.
© 2016 Acta Materialia Inc. Published by Elsevier Ltd. All rights reserved.
1. Introduction
Recent advances in three-dimensional (3D) materials charac-terization methods have made it possible to collect the first largesets of data on grain shape [1,2], grain topology [3], grain boundarypopulations [4], the evolution of the grain boundary population [5],and grain boundary energies [6]. Grain boundary curvature is one ofthe most important properties of a microstructure because theproduct of the curvature and energy provide the driving force forgrain growth. Using measurements from about 2000 b-Ti grains,Rowenhorst et al. [3] found that grains with 15 or fewer faces have,on average, a positive integralmean curvature and grainswith 16 ormore faces have, on average, a negative integral mean curvature.Although the integral mean grain boundary curvature is known tobe correlated to the grain size and the number of grain faces [3], lessis known about its correlation to grain boundary crystallography.
Grain boundaries have five independent crystallographic pa-rameters; three describe the lattice misorientation (Dg) and twodescribe the grain boundary plane orientation (n) [7].While studiesof lattice misorientations have a long history, it has only been
through 3D studies that direct measurements of the grain boundaryplane orientations have been possible. Grain boundary properties,and the macroscopic properties of polycrystals, can be sensitive tograin boundary plane orientations [8e10]. Therefore, the charac-terization of all five parameters can be important for establishingstructure-property relations for polycrystalline materials. A num-ber of measurements have been reported of grain boundary pop-ulations and grain boundary energies as a function of all fiveparameters [11e15]. One general conclusion is that in microstruc-tures formed by normal grain growth, the grain boundary popu-lation is inversely correlated to the grain boundary energy [16].
It has not yet been established whether a relationship existsbetween local grain boundary curvature and the local grainboundary crystallography. However, based on anecdotal observa-tions of microstructure, there is support for a correlation. Forexample, the coherent twin boundary in FCC metals, which has awell-defined crystallography, is often very flat (it has minimalcurvature). The coherent twin boundary also has minimal energyand a relative large area fraction [12].
Grain growth theories usually assume that, at any instance intime, there is a constant mean field chemical potential in themicrostructure and that local deviations from this mean value drivegrain growth [17,18]. For example, in Hillert's [17,18] classic graingrowth theory, there is a critical radius (rcr) above which grainsgrow and below which they shrink; the time rate of change of a
* Corresponding author.E-mail addresses: [email protected] (X. Zhong), david.rowenhorst@nrl.
navy.mil (D.J. Rowenhorst), [email protected] (H. Beladi), [email protected] (G.S. Rohrer).
Contents lists available at ScienceDirect
Acta Materialia
journal homepage: www.elsevier .com/locate/actamat
http://dx.doi.org/10.1016/j.actamat.2016.10.0301359-6454/© 2016 Acta Materialia Inc. Published by Elsevier Ltd. All rights reserved.
Acta Materialia 123 (2017) 136e145
grain with radius r is then proportional to the difference betweenthe chemical potential of a grain with radius and r and one withradius rcr, which has the mean field chemical potential. In Hillert'sformulation, the chemical potential is not dependent the grainboundary crystallography. However, the chemical potential in itsmost general form does depend on the grain boundary crystallog-raphy. This is clear from the way Herring [19e21] expressed thechemical potential ðmnsÞ of a non-singular surface at a specific pointin equilibrium:
mns ¼
gðDg;nÞ;þv2gðDg;nÞ
vq21
!
k1 þ
gðDg;nÞ þv2gðDg;nÞ
vq22
!
k2
(1)
where g(Dg, n) is the grain boundary energy, k1 and k2 are theprincipal curvatures, q1 is the angle between the normal to thegrain boundary at the point of interest and another normal at anearby point on the boundary that is also in the plane of principalcurvature corresponding to k1 and q2 is the corresponding quantityfor the perpendicular plane. In other words, the derivative terms inEqn. (1) characterize variations of the grain boundary energywithin the planes of principal curvature. If we ignore the secondderivatives for themoment and define themean curvature asH (Dg,n) ¼ 1/2 (k1 þ k2), then Eqn. (1) reduces to the simplified form:
mns ¼ 2HðDg;nÞgðDg;nÞ (2)
Assuming a constant mean field chemical potential, Eqn. (2)argues for an inverse relationship between the mean curvatureand the grain boundary energy. Because the grain boundary energyvaries with grain boundary crystallography, the mean curvatureshould also depend on the grain boundary crystallography. Grainboundary energies have been measured based on the assumptionof local equilibrium at triple junctions [6,11e15] and the measure-ments produce results that are consistent with calculations, at leastof the most common, lowest energy grain boundaries [22]. Unfor-tunately, the energies of grain boundaries that occur infrequentlyare not well-determined and, because of this, the second de-rivatives of the measured grain boundary energies needed to applyEqn. (1) are not likely to be meaningful.
The argument above applies to grain boundaries with non-singular orientations, which are orientations where the grainboundary energy versus orientation at fixed disorientation,g(Dgjn), is continuous and differentiable. The same will not be truefor singular orientations, which occur at cusps in g(Dgjn) [23]. Thechemical potential of a singular grain boundary is proportional toits weightedmean curvature (which is inversely proportional to thesize of the grain and is comparable to curvature of a non-singularboundary) [24] multiplied by the area weighted average energyof the boundaries that are on the periphery of the singular inter-face, <gðDg
!!npÞ> [19]. In other words, it is not the energy of thesingular interface that determines its chemical potential, it is theenergies of the boundaries that are nearest to the singular plane inorientation space [19,20,24]. The reason for this is that the energychange that occurs when a flat facet advances (retracts) is pro-portional to the energy required to extend (shrink) the boundarieson the periphery of the facet. The exact form of the chemical po-tential of a singular boundary depends on its exact geometry andthe details can be found in Refs. [19,20,24]. We can write anapproximate expression for the chemical potential of a singularboundary, ms, that is analogous to Eqn. (2):
msza$<g"Dg
!!np#> (3)
where a is the weighted mean curvature and includes geometric
terms that are specific for each singular interface; the expressionignores a variable but small contribution from the singularboundary itself. While Eqn. (3) is highly approximate, it illustratesthe most important difference between the chemical potential of asingular and non-singular boundary: the chemical potential of thenon-singular boundary is proportional to the energy of thatboundary while the chemical potential of a singular grain boundarydepends on the energies of the grain boundaries that are peripheralto the singular orientation. In every case where there is more thanone stable orientation, the peripheral orientations have higherenergies than the singular orientation [23].
Based on what is known about the chemical potentials of sin-gular and non-singular grain boundaries, and the assumption of aconstant average chemical potential, we expect the correlationbetween grain boundary energy and curvature to be different fordifferent types of boundaries. Singular grain boundary orientationsshould have low curvatures and low energies. This is consistentwith the observation that twin boundaries are flat and have lowenergies. For non-singular grain boundaries, on the other hand, lowenergy boundaries are expected to have relatively highercurvatures.
The purpose of this paper is to test the hypothesis that the meangrain boundary curvature depends on the grain boundary crystal-lography. We test the hypothesis through a new analysis of 3Dmicrostructure data from an austenitic steel and a ferritic steel forwhich the five-parameter grain boundary area and energy distri-butions have already been measured [14,15]. Before analyzing thereal microstructures, the accuracy of the grain boundary curvaturemeasurement is tested on ideal shapes to establish how the un-certainty varies with the resolution and reconstruction procedures.We then determine how the integral mean curvature of the grainsvaries with the number of grain faces and with the average numberof faces of its nearest neighbors. Finally, we compute the five-parameter grain boundary curvature distribution for austeniteand ferrite and compare it to the measured grain boundary energy.
2. Procedures
In this paper, we analyzed 3D orientation maps previously re-ported for two steels. The first is an austenitic twinning-inducedplasticity (TWIP) steel with the face-centered cubic (FCC) struc-ture and the second is a ferritic steel with the body-centered cubic(BCC) structure. Throughout this paper, these samples will simplybe referred to as the austenitic and ferritic steels. The compositionof the austenitic steel was 0.6Ce18Mne1.5Al (wt.%) and thecomposition of the ferritic steel was 0.04 Ce1.52 Mne0.2 Sie0.22Moe0.08 Tie0.033 Al (wt.%). The orientation map of the austeniticsteel was 65 % 40 % 20 mm3 and contained 3185 grains. There weretwo orientation maps for the ferritic steel. One was40 % 35 % 14 mm3 and contained 1113 grains and the other was30% 50% 22 mm3 and contained 558 grains. Further details of thesesamples, including the processing used to produce these micro-structures, have already been reported [14,15].
The 3D orientation maps were constructed from stacks of par-allel two-dimensional (2D) orientation maps obtained by electronbackscatter diffraction (EBSD). The serial sectioning was carried outin a dual beam focused ion beam scanning electronmicroscope (FEIQuanta 3D FEGSEM). The raw data are available at the grainboundary data archive [25]. Open source software, DREAM.3D [26],was then used to reconstruct the 3D orientation maps. Afterreading in the data, voxels with low image quality (&120) or con-fidence index (&0.1) were ignored. Image quality and confidenceindex are metrics that indicate the quality of the diffraction patternand the confidence in the orientation assignment, respectively, thatare assigned by the TSL OIM software (EDAX, Mahwah, NJ) that is
X. Zhong et al. / Acta Materialia 123 (2017) 136e145 137
used to collect the data [27]. Next, centroid and misorientationbased algorithms were used to correct sub-pixel misalignmentbetween the 2D sections. To segment the volume into grains, theorientation of each voxel was compared to its neighbors and voxelswith orientations that differed by & 5' were grouped together andassigned a unique grain identification (ID) number. Furthermore,grains had to have at least 100 voxels and at least two neighboringgrains. After this process, the microstructure contained gapscreated by groups with fewer than 100 voxels, mostly made up ofvoxels with unknown orientations. The gaps were eliminated bydilating neighboring grains uniformly using a procedure inDREAM.3D [28,29,26]. In the final step, all of the voxels within thegrain were assigned the average orientation of all of the voxels inthe group. The voxels that make up the data create stair-steppedboundaries and triple lines that must be smoothed to extractgrain boundary plane distributions and grain boundary curvaturedistributions. While a method has recently been developed tocompute average face curvatures from voxelated microstructures[30], we are interested in local curvatures and thus must representthe boundary as a surface composed of discrete triangles. A multi-material marching cube meshing algorithm was used to model thegrain boundaries as triangular nets and a restricted Laplaciansmoothing was used to create smoothly curved grain boundaries[3]. The details of the parameters used for the smoothing procedureand their effect on the results are considered in x3.1. At this stage,the reconstruction is complete and the microstructures arecomposed of discrete grains with unique ID numbers, bounded by atriangular mesh. Associated with each triangle in the mesh are thegrain ID numbers on each side, the orientations of the grains oneach side, the disorientation across the triangle, the surface normal,the area, and the curvature (the calculation of the curvature isdescribed in the next paragraph). This makes it possible to mapthese quantities locally and to define how they are distributed overthe crystallographic, volumetric, and topological parameters.
Grain boundary (mean) curvature was calculated locally for thetriangles using the previously established cubic-order algorithmdescribed in Ref. [31] and implemented in DREAM.3D [3,26]. In thisalgorithm, a patch of contiguous triangles surrounding the triangleof interest, for which we know the crystallographic properties, is fitto a parabola. The size of neighborhood patch used in our calcula-tion includes 2nd and 3rd nearest neighbors of the center triangle.After using a least-squares procedure to fit the parabola, theWeingarten matrix of this surface patch can be obtained and itseigenvalues are the principal curvatures k1 and k2. Triangle meancurvature is then k1 þ k2=2 and its sign is defined as positive forconvex and negative for concave. However, note that only the ab-solute values of the triangle mean curvatures were used in calcu-lations of the grain boundary curvature distribution as a function ofcrystallographic parameters. The reason lies in the inversion sym-metry between neighboring grains. While convex and concave areexplicit for an individual grain, there is no way to define such aproperty for the network of boundaries between grains. Aftercalculating the curvature value, each triangle was then classified ina discrete distribution according to its crystallographic parametersusing the same methods that have been used to compute the grainboundary character and energy distributions [32,6,33]. Briefly, thefive grain boundary parameters are the three Euler angles (41, F,42), specifying the lattice misorientation, and the two sphericalangles, (Q, 4), specifying boundary normal direction. Because ofcrystal symmetries, there are many indistinguishable representa-tions of each boundary in the complete domain of boundary types.Here, we classify the angles 41, F, 42 into discrete bins within therange from 0 to 90'. Similarly, we classify the spherical angle Q, 4into discrete bins within the range from 0 to 90' and 0e360',respectively [7]. The discrete bins have equal volume and there are
9 bins per 90'. The five parameters of every triangle were examinedand its triangle curvature value was added to the correspondingbin. Because of cubic crystal symmetry, there are 36 physicallyindistinguishable representations or combinations of angles foreach triangle within the range of angles considered [7]. Afterapplying the symmetry operators, the curvature was also added toall bins corresponding to indistinguishable representations. Afterall of the triangles were binned, the curvature values in each binwere averaged and this gives us the symmetry averaged curvaturefor the grain boundary curvature distribution (GBCurD).
3. Results
3.1. Curvature measurements of spheres
It should be recognized that curvatures measured from discretevoxelized data are necessarily approximations of the true grainboundary curvature. Intuitively, the accuracy of this approximationshould depend on the resolution of the data (defined as the size of avoxel compared to the size of a grain) and the way that the trian-gular mesh representing the grain boundary is smoothed.Furthermore, when the curvature of an individual triangle is clas-sified in the discrete five-parameter distribution, it will be averagedwith boundaries that have similar parameters. Therefore, thesymmetry averaged curvatures will also be affected by the discretenature of the distribution. To understand how these factors influ-ence the curvature measurement, we examined the effect of thedata processing on the measured curvatures of simulated sphericalgrains.
Ten spheres were created and labeled with different resolutions.For example, S4 denotes a spherewith 4 voxels per radius. Note thatthe number of voxels per object is the critical resolution in thecurvature measurement that allows comparison to experiments.The actual physical dimensions of each voxel are arbitrary for thesesimulations; here, a voxel size of 0.2 mm was used to be consistentwith the experiment. When single crystal spheres were createdwithin single crystal grains, the smoothing procedure led to a sig-nificant loss of volume. This corresponds to a shrinking of theradius and an increase in the curvature. The constrained smoothingin DREAM.3D uses nearly stationary triple lines and quadruplepoints to ameliorate this, so we constructed the spheres at thecenter of an assembly of eight other grains that all have the samedisorientation (45'/[100]) with center grain. So, while there areeight distinct grain boundaries surrounding the sphere, they havecrystallographically indistinguishable disorientations.
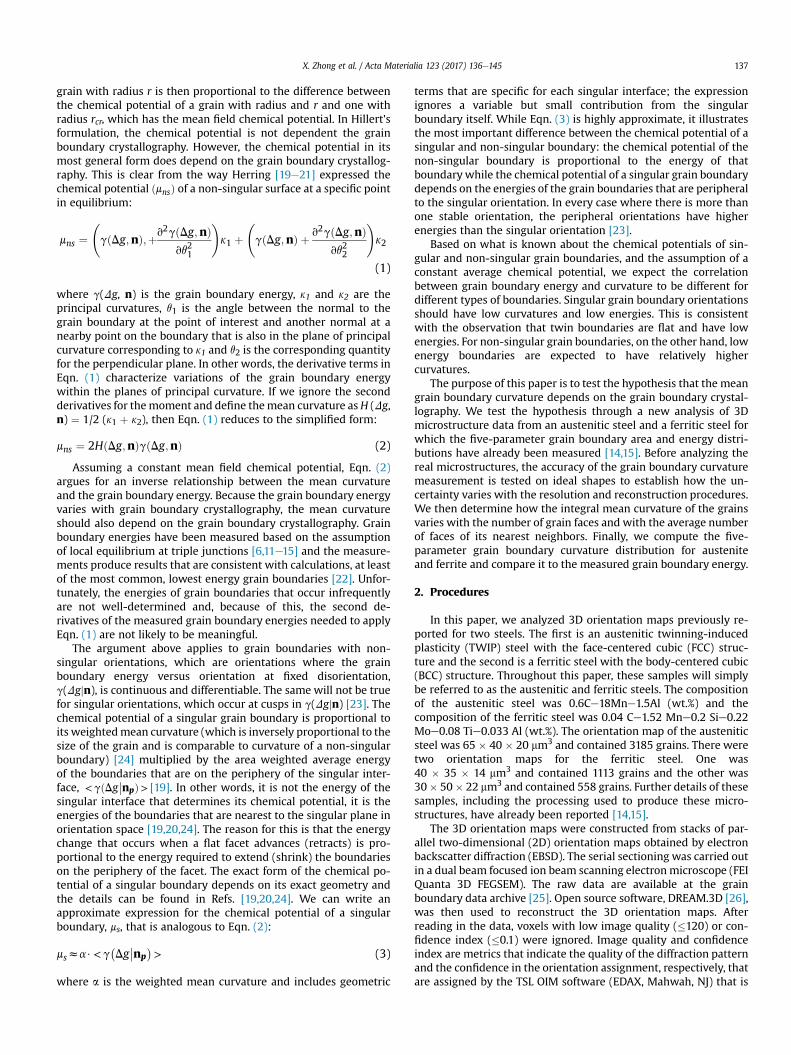
Two of the spherical grains are illustrated in Fig.1. An example ofa relatively low-resolution sphere (S6) is illustrated in Fig. 1(a). Inthis case, there are six voxels per radius and the cube shaped voxelsmake a rather crude approximation of the sphere. A higher reso-lution sphere (S28) is shown in Fig. 1(d); in this case there are 28voxels per radius and the spherical shape is much more accuratelyreproduced. The triangular mesh created by the marching cubealgorithm in DREAM.3D has to be smoothed to remove stair-stepped structures. The parameters for the smoothing routine arethe number of iterations, N, and a weighting factor, l. Theweighting factor controls how far a node moves on each iterationand varies between 0 (no smoothing) and 1 (maximum). We testeda number of combinations of N and l, and found that the strengthor degree of smoothing increases with the product of these values.Based on these initial tests, and to cover a range of smoothing thatseemed practical, we selected four trial values for l and N. Theseconditions have the following labels (values of l/N) that correspondto increased smoothing: I (0.05/50), II (0.1/100), III (0.2/200), and IV(0.4/400). The effects of these different parameters are illustrated inFig. 1. With smoothing I, S6 (Fig. 1(b)) is a fairly good approximation
X. Zhong et al. / Acta Materialia 123 (2017) 136e145138
of a sphere. However, voxel-like steps can still be seen on the sur-face of the higher resolution sphere S28 (Fig. 1(e)), indicatinginadequate smoothing. Note that protrusions on the spheres showthe locations of the triple lines (12) and quad points (6) that wereadded to reduce shrinkage; smoothing is constrained at these lo-cations. When smoothing III was applied, the higher resolutionsphere S28 (Fig. 1(f)) became smooth and sphere-like while thelower resolution sphere, S6 (Fig. 1(c)), was over-smoothed and ismore like an octahedron than a sphere. This illustrates that fixedsmoothing parameters are not ideal for all grain sizes at a singleresolution.
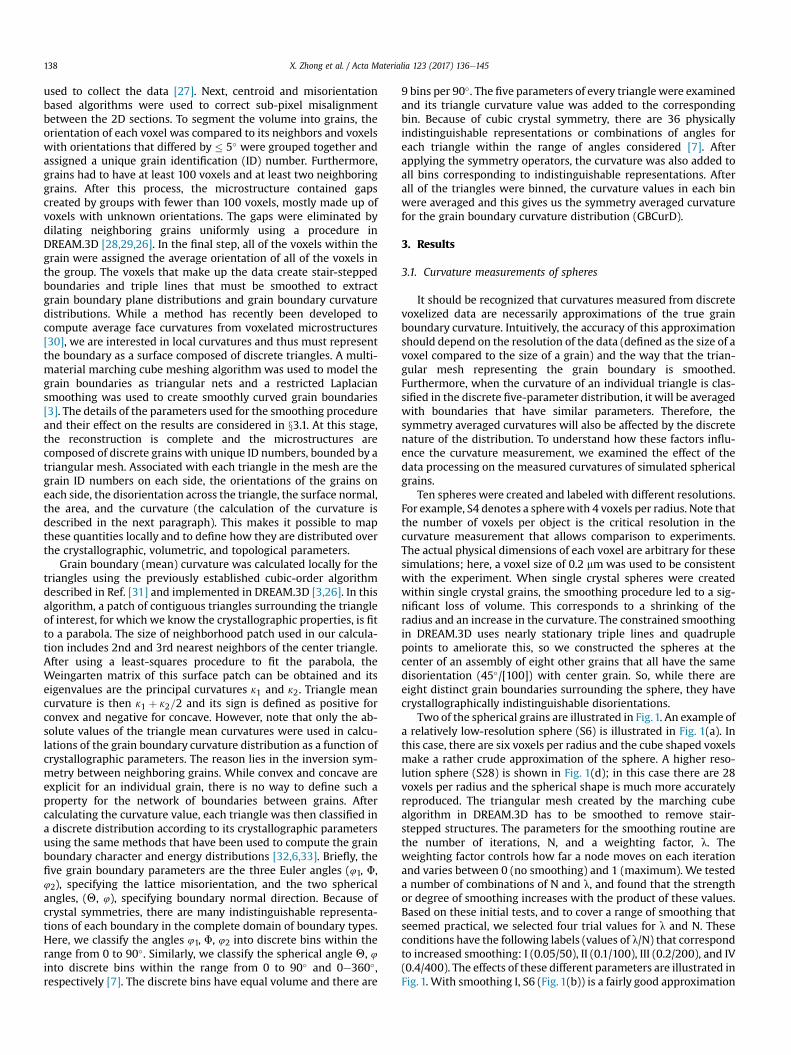
The results for the curvatures computed for the triangles asso-ciatedwith the different spheres and different smoothing processesare summarized in Fig. 2. The dashed line indicates the ideal cur-vature value calculated from sphere radius (R(1) and the markersare the average values of the triangle curvatures for each sphere.
The difference between a marker and the corresponding point onthe dashed line measures the quality of the reconstruction. Thesmaller the difference, the better the reconstruction and the betterthe calculated curvature approximates the true curvature. From theplot, we can see that the optimal smoothing parameters are relatedto the resolution and feature size. Lower resolution spheres arebetter smoothed with smaller smoothing parameters while largersmoothing parameters worked better for the higher resolutionspheres. This is consistent with the visual interpretation of Fig. 1.The Laplacian smoothing method makes changes in the meshnodes in proportion to local gradients. The low-resolution sphere(S6) has larger gradients between voxels and was thereforesmoothed in a few iterations. The higher resolution sphere, S28,had smaller gradients, so more iterations and larger values of lwere required for optimal smoothing. The three exceptions to thistrend in Fig. 2 are S4, S6, and S9with smoothing VI; in this case theywere so over smoothed that their shapes collapsed so that theywere polyhedral rather than spherical.
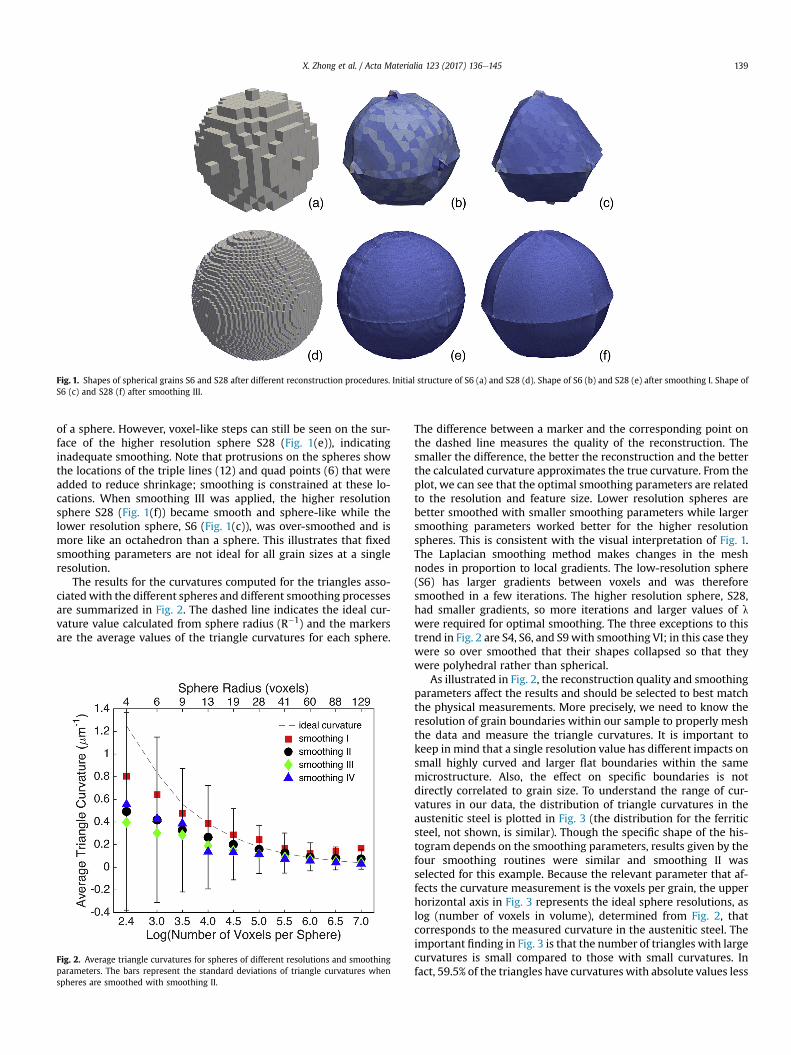
As illustrated in Fig. 2, the reconstruction quality and smoothingparameters affect the results and should be selected to best matchthe physical measurements. More precisely, we need to know theresolution of grain boundaries within our sample to properly meshthe data and measure the triangle curvatures. It is important tokeep in mind that a single resolution value has different impacts onsmall highly curved and larger flat boundaries within the samemicrostructure. Also, the effect on specific boundaries is notdirectly correlated to grain size. To understand the range of cur-vatures in our data, the distribution of triangle curvatures in theaustenitic steel is plotted in Fig. 3 (the distribution for the ferriticsteel, not shown, is similar). Though the specific shape of the his-togram depends on the smoothing parameters, results given by thefour smoothing routines were similar and smoothing II wasselected for this example. Because the relevant parameter that af-fects the curvature measurement is the voxels per grain, the upperhorizontal axis in Fig. 3 represents the ideal sphere resolutions, aslog (number of voxels in volume), determined from Fig. 2, thatcorresponds to the measured curvature in the austenitic steel. Theimportant finding in Fig. 3 is that the number of triangles with largecurvatures is small compared to those with small curvatures. Infact, 59.5% of the triangles have curvatures with absolute values less
Fig. 1. Shapes of spherical grains S6 and S28 after different reconstruction procedures. Initial structure of S6 (a) and S28 (d). Shape of S6 (b) and S28 (e) after smoothing I. Shape ofS6 (c) and S28 (f) after smoothing III.
Fig. 2. Average triangle curvatures for spheres of different resolutions and smoothingparameters. The bars represent the standard deviations of triangle curvatures whenspheres are smoothed with smoothing II.
X. Zhong et al. / Acta Materialia 123 (2017) 136e145 139
than 0.5 mm(1 for the austenitic steel. For ferrite, 55.6% of the tri-angle curvatures have absolute values less than 0.5 mm(1. In otherwords, most of the grain boundaries in our microstructure mapswere relatively flat and were comparable to the surfaces of thelarger ideal spheres. Therefore, smoothing II was selected for thisstudy because it gave the best relative accuracy in the majority lowcurvature boundaries and acceptable accuracy for the higher cur-vature boundaries.
When the curvature distribution is considered as a function ofany of the crystallographic parameters, it is affected by the discretebinning and symmetry averaging. When the discrete triangles areclassified according to their crystallography, they are grouped intobins of finite width and averaged. When the curvature of a partic-ular type of grain boundary is retrieved from these discrete bins, itis the average of 36 separate bins. Therefore, it is reasonable toexpect there would be a disparity between triangle curvatures andsymmetry averaged curvatures. This effect is not expected tochange with the resolution of the mesh.
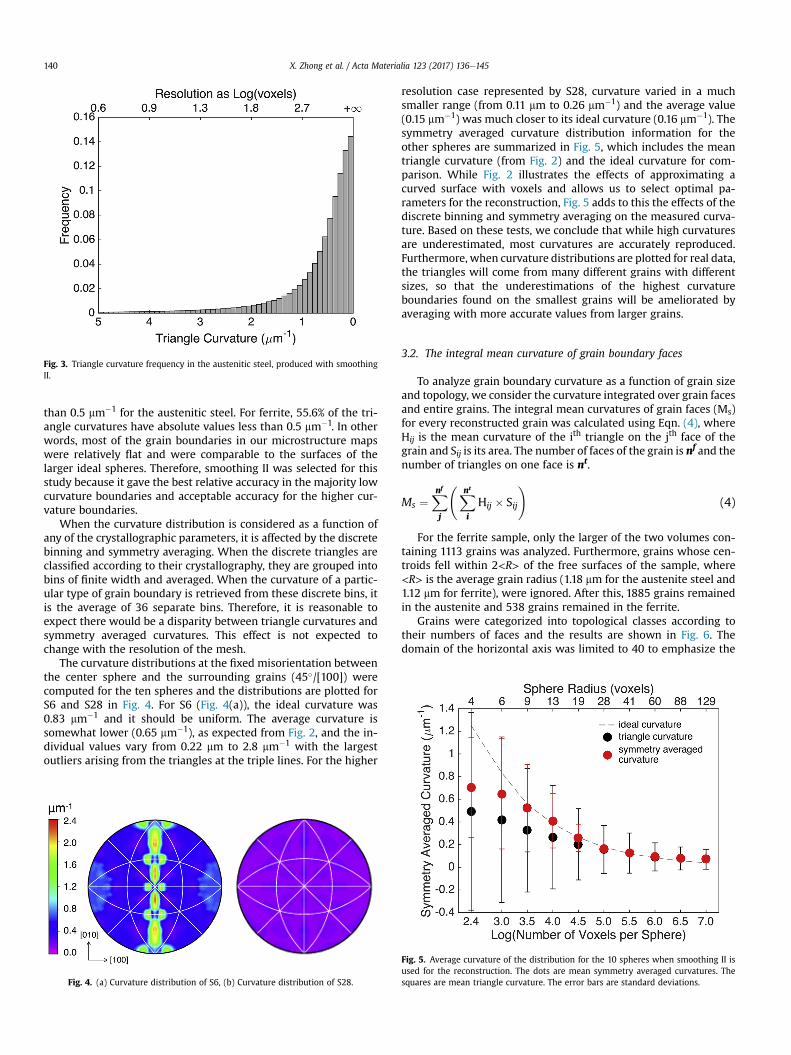
The curvature distributions at the fixed misorientation betweenthe center sphere and the surrounding grains (45'/[100]) werecomputed for the ten spheres and the distributions are plotted forS6 and S28 in Fig. 4. For S6 (Fig. 4(a)), the ideal curvature was0.83 mm(1 and it should be uniform. The average curvature issomewhat lower (0.65 mm(1), as expected from Fig. 2, and the in-dividual values vary from 0.22 mm to 2.8 mm(1 with the largestoutliers arising from the triangles at the triple lines. For the higher
resolution case represented by S28, curvature varied in a muchsmaller range (from 0.11 mm to 0.26 mm(1) and the average value(0.15 mm(1) was much closer to its ideal curvature (0.16 mm(1). Thesymmetry averaged curvature distribution information for theother spheres are summarized in Fig. 5, which includes the meantriangle curvature (from Fig. 2) and the ideal curvature for com-parison. While Fig. 2 illustrates the effects of approximating acurved surface with voxels and allows us to select optimal pa-rameters for the reconstruction, Fig. 5 adds to this the effects of thediscrete binning and symmetry averaging on the measured curva-ture. Based on these tests, we conclude that while high curvaturesare underestimated, most curvatures are accurately reproduced.Furthermore, when curvature distributions are plotted for real data,the triangles will come from many different grains with differentsizes, so that the underestimations of the highest curvatureboundaries found on the smallest grains will be ameliorated byaveraging with more accurate values from larger grains.
3.2. The integral mean curvature of grain boundary faces
To analyze grain boundary curvature as a function of grain sizeand topology, we consider the curvature integrated over grain facesand entire grains. The integral mean curvatures of grain faces (Ms)for every reconstructed grain was calculated using Eqn. (4), whereHij is the mean curvature of the ith triangle on the jth face of thegrain and Sij is its area. The number of faces of the grain is nf and thenumber of triangles on one face is nt.
Ms ¼Xnf
j
Xnt
iHij % Sij
!
(4)
For the ferrite sample, only the larger of the two volumes con-taining 1113 grains was analyzed. Furthermore, grains whose cen-troids fell within 2<R> of the free surfaces of the sample, where<R> is the average grain radius (1.18 mm for the austenite steel and1.12 mm for ferrite), were ignored. After this, 1885 grains remainedin the austenite and 538 grains remained in the ferrite.
Grains were categorized into topological classes according totheir numbers of faces and the results are shown in Fig. 6. Thedomain of the horizontal axis was limited to 40 to emphasize the
Fig. 3. Triangle curvature frequency in the austenitic steel, produced with smoothingII.
Fig. 4. (a) Curvature distribution of S6, (b) Curvature distribution of S28.
Fig. 5. Average curvature of the distribution for the 10 spheres when smoothing II isused for the reconstruction. The dots are mean symmetry averaged curvatures. Thesquares are mean triangle curvature. The error bars are standard deviations.
X. Zhong et al. / Acta Materialia 123 (2017) 136e145140

points near the zero crossing; this excludes only 3.35% of the grains.The integral mean curvature was positive for grains with a smallernumber of faces and negative for grains with a large number offaces. This is consistent with theories of grain growth that suggestgrains with many faces grow and those with few faces shrink. Notethat for grains within each class, Ms is a distribution rather than aconstant. The ferrite data is noisier than the austenite data, espe-cially for classes with a large number of faces (>25). This is probablybecause there are fewer grains in the ferrite sample. For ferrite, theclasses with F > 25 faces contain no more than 5 grains. Most of thegrains with between 3 and 20 faces and have smaller standarddeviations in both datasets. Note that the standard deviation in-creases again for grains with the fewest faces and the largest cur-vatures. This is probably because larger curvatures are notmeasured as accurately as smaller curvatures, as illustrated in Fig. 2.The integral mean curvature crosses zero at about 17 grain faces forboth the austenitic and ferritic steel. Changing the minimum grainsize did not significantly alter the results.
Rowenhorst et al. [3] proposed that zero curvature grains werethose whose numbers of faces (F) were the same as the average
numbers of faces of their nearest neighbors, <FNN>. We tested thesame idea on the austenitic steel data (see Fig. 7). The normalizedintegral mean curvature of grain faces is calculated as G 0 ¼ Ms=R,where R is the sphere equivalent radius of the grain. The set ofgrains for this local topology analysis was limited to ones whosenearest neighbors also fall 2<R> from free surfaces of the sample,leaving 930 grains for analysis in austenite. The grey dots in Fig. 10are normalized grain curvatures of individual grains. Red squaresare average normalized grain curvature for each F-<FNN> class. Theline for the average in each class passes almost exactly through thepoint with F-<FNN> ¼ 0 and G 0 ¼ 0. The results for the ferritic steelare not shown because after grains with incomplete neighborswere also removed, there were not enough grains left to support astatistical analysis. Note that a finite number of grains with twofaces were found and observed to be either twins or lens shapedgrains at boundaries.
3.3. Grain boundary curvature distributions in the austenitic andferritic steels
In the remainder of this paper, we refer to the symmetry aver-aged GBCurD simply as the GBCurD. The simplest projection of thefive-parameter GBCurD is the average curvature as a function ofdisorientation angle, or the smallest misorientation angle amongall indistinguishable representations for each triangle. The resultsfor the two samples are shown in Fig. 8, where each point is theaverage curvature of all of the triangles with that disorientation.The data for the austenite and ferrite have the characteristic thatlow angle grain boundaries (LAGBs) have curvatures that increasewith decreasing disorientation. The exception is for the lowestdisorientation angle, which had significantly fewer observations.There is also an increase in curvature at angles near 60'. For theaustenite sample, the average curvature of coherent twin bound-aries is shown separately and, as expected, this represents a mini-mum (0.3 mm(1). The coherent twinsmake up 14.6% of the length ofall boundaries in the austenite and tend to be very flat and lie on(111) planes. For the ferrite sample, the average curvature of sym-metric tilt ð211Þ S3 boundaries is also shown. The most populousgrain boundary type in BCC ferrite is the ð211Þ S3 boundary; itmakes up ~ 2.5% of total boundary area. The curvature of the ð211ÞS3 boundary is not significantly less than the average of otherboundaries, even though (as illustrated below) it has the minimumcurvature for all S3 boundaries. When considering these results,keep in mind that at each of the other points, the value is averagedover all disorientation axes and grain boundary plane orientations.Therefore, the higher curvatures at low disorientation angles andnear 60' represent significant trends in the data. Other than thesefeatures, the average curvature is approximately constant between15' and 55'. The fact that the ferrite data set had fewer grains thanthe austenite data set contributes to the greater scatter in the ferritecurvature distribution.
The data in Fig. 8 suggest that the boundaries at 60' have cur-vatures that are slightly greater than at other angles. Also, we knowthat the singular coherent twin boundary and {211} symmetric tiltboundary occur at these disorientations. Furthermore, these sam-ples have more boundaries with this disorientation than any othertype, which means that our measurements of these boundaries arethe most reliable. Therefore, we examine the curvature as a func-tion of the grain boundary plane orientation for grain boundarieswith a 60' disorientation about the [111] axis (S3) for the austeniteand ferrite samples. The curvature in Fig. 9 is plotted in stereo-graphic projection with [001] and [100] pointing normal to theplane of the paper and to the right, respectively. The grain boundarypopulations and relative energies, reported earlier [14,15] areshown for comparison. Note that the grain boundary populations
Fig. 6. Integral mean curvature of grain faces (Ms) as a function of number of faces ofgrains (F). The markers represent average Ms for each grain class and the error barsshow the standard deviation within the grain class.
Fig. 7. Normalized integral curvature of grain faces ðG 0Þ as a function of F-<FNN> inaustenite. F-<FNN> is difference between number of faces of one grain (F) and theaverage number of faces of its nearest neighbors (<FNN>).
X. Zhong et al. / Acta Materialia 123 (2017) 136e145 141
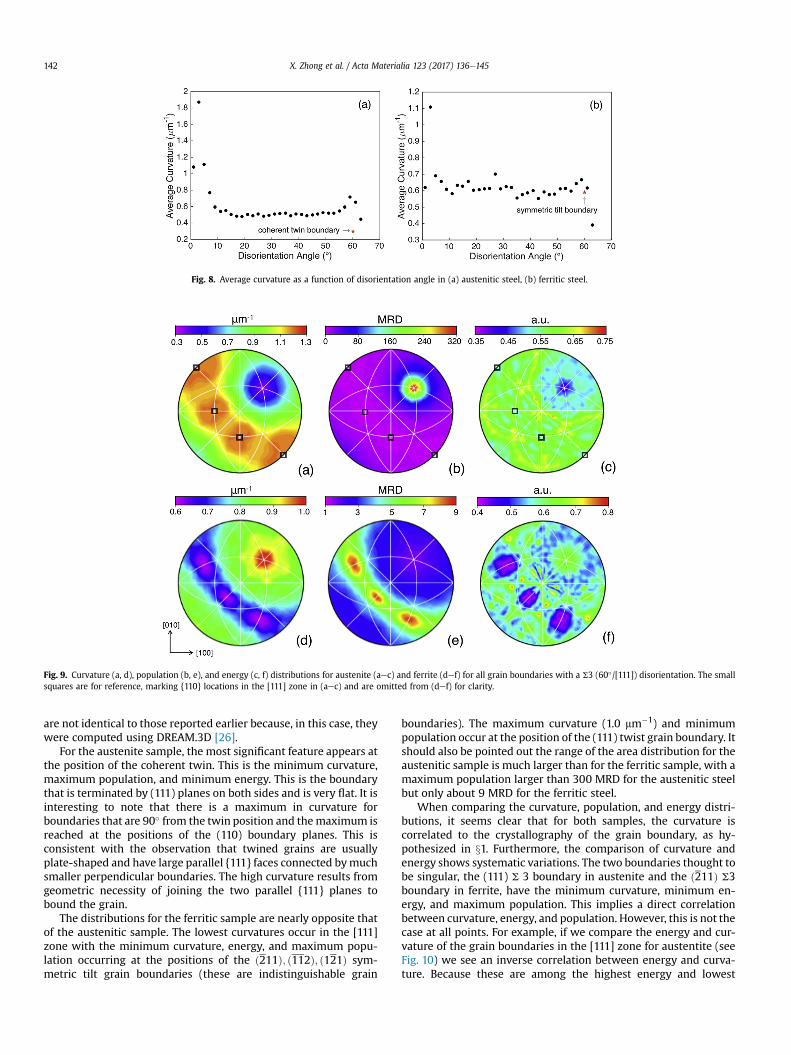
are not identical to those reported earlier because, in this case, theywere computed using DREAM.3D [26].
For the austenite sample, the most significant feature appears atthe position of the coherent twin. This is the minimum curvature,maximum population, and minimum energy. This is the boundarythat is terminated by (111) planes on both sides and is very flat. It isinteresting to note that there is a maximum in curvature forboundaries that are 90' from the twin position and themaximum isreached at the positions of the (110) boundary planes. This isconsistent with the observation that twined grains are usuallyplate-shaped and have large parallel {111} faces connected bymuchsmaller perpendicular boundaries. The high curvature results fromgeometric necessity of joining the two parallel {111} planes tobound the grain.
The distributions for the ferritic sample are nearly opposite thatof the austenitic sample. The lowest curvatures occur in the [111]zone with the minimum curvature, energy, and maximum popu-lation occurring at the positions of the ð211Þ; ð112Þ; ð121Þ sym-metric tilt grain boundaries (these are indistinguishable grain
boundaries). The maximum curvature (1.0 mm(1) and minimumpopulation occur at the position of the (111) twist grain boundary. Itshould also be pointed out the range of the area distribution for theaustenitic sample is much larger than for the ferritic sample, with amaximum population larger than 300 MRD for the austenitic steelbut only about 9 MRD for the ferritic steel.
When comparing the curvature, population, and energy distri-butions, it seems clear that for both samples, the curvature iscorrelated to the crystallography of the grain boundary, as hy-pothesized in x1. Furthermore, the comparison of curvature andenergy shows systematic variations. The two boundaries thought tobe singular, the (111) S 3 boundary in austenite and the ð211Þ S3boundary in ferrite, have the minimum curvature, minimum en-ergy, and maximum population. This implies a direct correlationbetween curvature, energy, and population. However, this is not thecase at all points. For example, if we compare the energy and cur-vature of the grain boundaries in the [111] zone for austentite (seeFig. 10) we see an inverse correlation between energy and curva-ture. Because these are among the highest energy and lowest
Fig. 8. Average curvature as a function of disorientation angle in (a) austenitic steel, (b) ferritic steel.
Fig. 9. Curvature (a, d), population (b, e), and energy (c, f) distributions for austenite (aec) and ferrite (def) for all grain boundaries with a S3 (60'/[111]) disorientation. The smallsquares are for reference, marking {110} locations in the [111] zone in (aec) and are omitted from (def) for clarity.
X. Zhong et al. / Acta Materialia 123 (2017) 136e145142

population of the S3 grain boundaries, we also assume that theseare non-singular orientations.
4. Discussion
The results in x3.1 indicate that measuring curvatures from adiscrete triangular mesh using the method of Goldfeather andInterrante [31] is accurate provided that there is sufficient resolu-tion compared to the range of curvature to be measured. A basiclimitation will always be that there is a wide range of grain sizeswith different curvatures and no single smoothing procedure willbe ideal for all grains. Fortunately, the largest fraction of boundarieshas relatively low curvatures that are more accurately measuredand these will dominate the distribution. For example, the curva-tures of specific grain boundary types, as illustrated in Figs. 8e10,will be the average of values from the majority low curvature grainboundaries that are accurately measured and the minority highcurvature boundaries whose curvatures are underestimated. So,while the underestimated curvature of some boundaries will affectthe results, the effect will be diluted by the majority boundariesthat are measured more accurately.
Because the curvature-energy product is the driving force forgrain growth, there is an extensive literature, dating back to thework of Smith [34], relating grain topology, integral mean curva-ture, and the tendency of grains to grow or shrink. Theoreticaltreatments of the problem led to the prediction that grains withmore than 13 or 14 faces grow and those with fewer shrink[35e37]. Rowenhorst et al. [3] reported that zero curvature grainshad 15.5 faces, Mason et al. [38], based on simulations of isotropicgrain growth, found the crossover from negative to positive to takeplace around 15 faces, and in the current workwe find it is about 17.The difference between the value we report and the values re-ported in the earlier workmight not be significant. Note that whilethe data follow the trend of decreasing integral mean curvaturewith an increasing number of faces, the curvatures of grains withbetween 15 and 20 faces are less than the standard deviation, so theexact point where the curvature is zero is not clear. We note thatthe average numbers of faces per grain in the austenite and ferritewas 13.6 and 13.7, respectively, which are consistent with thenumber reported for b-Ti (13.7) [3] and similar to that reported fora-Ti (14.2). [39]
MacPherson and Srolovitz [40,41] recently showed that the
number of faces alone does not determine the growth rate of agrain. Using data from more than 2000 b-Ti grains, Rowenhorstet al. [3] demonstrated the validity of the idea that zero curvaturegrains were those whose numbers of faces (F) were the same as theaverage numbers of faces of their nearest neighbors, <FNN>. Thefact that we get the same result from an austenitic steel (see Fig. 7),which has a significantly different microstructure, suggests thatthis is a general feature of microstructures undergoing graingrowth.
The observations reported in Figs. 8e10 provide clear evidencethat the mean curvature of the grain boundary depends on itscrystallographic parameters. In an isotropic system, one wouldexpect the curvature be dictated by the size of the grain face. Whileit seems sensible that the grain and face size will still play a role,there is a clear effect of both lattice disorientation (Fig. 8) and thegrain boundary plane orientation (Figs. 9 and 10). In Fig. 9(a), thecurvature for the 60'/[111] boundary in austenite varies from0.3 mm(1 at the position of the (111) twist boundary to 1.2 mm(1 atthe (110)-type positions 90' away. There are also significant cur-vature variations for the 60'/[111] boundary in ferrite, even thoughthe anisotropy in the grain boundary population is 30 timessmaller. The variations with grain boundary plane at both of thesedisorientations are greater than the average values at differentdisorientations (see Fig. 8).
The data in Fig. 6 show that there is a strong correlation betweencurvature and the number of faces. Because it is known that grainswith more faces are larger, there is also an intuitive correlationbetween curvature and grain size [42,3,39]. When the GBCurD iscomputed, all grains are included. This means that for a singlecrystallographic type, triangles from small, higher curvature,shrinking grains are averaged together with triangles from large,lower curvature, growing grains. Despite this, there is still a crys-tallographic correlation. One might think this is because theGBCurD is area weighted, so the larger grains have a more signifi-cant effect on the distribution than small grains. However, the largegrowing grains necessarily share boundaries with smaller shrink-ing grains, so one cannot attribute the distribution solely to thelarge grains.
While the GBCurD is clearly sensitive to crystallography, there isno single correlation between curvature and energy or curvatureand population. The one trend that is clear is that the lowest energyboundaries also have small curvature and large areas. If theseboundaries are presumed to be singular and in contact the samemean field chemical potential, then the curvature should beinversely proportional to the energies of the boundaries peripheralto the singular surface. Such boundaries are always have higherenergies than the singular surface, leading to a direct proportion-ality between the energy of the singular surface and the curvature.This is certainly obvious from the distributions plotted in Fig. 9.However, there are also examples of opposite correlations. Oneexample is clearly illustrated in Fig. 8, which shows that lowdisorientation angle grain boundaries have curvatures that increaseas the disorientation decreases. It is well known that the grainboundary energy decreases at low disorientation angles [43],where the curvature is observed to increase. A second example isillustrated in Fig. 10. As noted in x1, non-singular boundaries incontact with a constant mean field chemical potential should havecurvatures that are inversely correlated to the energy.
Some of the preceding arguments are based on a mean fieldchemical potential for the grain boundaries. It should be noted thateach individual boundary is not assumed to have the same chem-ical potential. However, computing the curvature of a certain typeof boundary involves averaging over many boundaries at differentchemical potentials. The average curvature that results is thereforerepresentative of mean chemical potential of the boundaries with
Fig. 10. Comparison of the curvature and relative energies of grain boundaries in the[111] zone of austenite, beginning at the ð110Þ orientation. Because of bicrystal sym-metry, the values repeat in periods of 60' .
X. Zhong et al. / Acta Materialia 123 (2017) 136e145 143
the same crystallography.The data in Figs. 9 and 10 show only a small portion of all grain
boundary types. When the data is examined for all grain bound-aries, the curvature is not strongly correlated to the population orenergy, although the curvature and energy have a weak negativecorrelation. The absence of a strong correlation may be because ofthe competing behaviors of the singular and non-singular in-terfaces. Unfortunately, at the present time, is it not obvious how toclassify the boundary types into these categories. It should also bepointed out the lower the population of a boundary, the greater theuncertainty in the curvature and energymeasurements, so thismayalso play a role and mask any correlations that might exist. Whatwe can saywith confidence is that for themost commonly observedgrain boundaries, the dominant trend is that low curvatureboundaries have low energy and larger areas. However, there are nostrong overall correlations between curvature and energy or area,similar to the area-energy correlation that was observed in manymaterials. [16]
5. Conclusions
Grain boundary mean curvatures can be accurately measuredfrom discrete triangular meshes, but the highest curvatures areunderestimated. The curvatures measured for an austenitic steeland a ferritic steel show the expected trend that the integral meancurvature of the grains decreases as the number of grain faces in-creases. The curvatures are also related to grain topology. Inaustenite, when the number of faces on a grain is equal to theaverage number of faces of its neighbors, it has zero integral meancurvature. We find that the crystallography of the grain boundarystrongly influences the curvature. The variation of the curvaturewith the grain boundary plane orientation is stronger than thevariation with grain boundary disorientation angle. The lowestcurvature grain boundaries also have the lowest grain boundaryenergies and highest grain boundary areas. However, when allgrain boundaries are considered, the curvature is not stronglycorrelated to energy or area and this might be the result of con-flicting mechanisms that determine the curvatures of singular andnon-singular boundaries.
Acknowledgements
G.S.R. acknowledges support from the National Science Foun-dation under grant DMR 1628994 and, for equipment, MRI grantDMR 1428480. D.J.R. Acknowledges the support from the OfficeNaval Research under the Structural Materials Program. The au-thors acknowledge use of the Materials Characterization Facility atCarnegie Mellon University supported by grant MCF-677785. A partof this work was conducted with the support of the DeakinAdvanced Characterization Facility.
References
[1] M.A. Groeber, B.K. Haley, M.D. Uchic, D.M. Dimiduk, S. Ghosh, 3D recon-struction and characterization of polycrystalline microstructures using a FIB-SEM system, Mater. Charact. 57 (2006) 259e273, http://dx.doi.org/10.1016/j.matchar.2006.01.019.
[2] M.D. Uchic, M.A. Groeber, D.M. Dimiduk, J.P. Simmons, 3D microstructuralcharacterization of nickel superalloys via serial-sectioning using a dual beamFIB-SEM, Scr. Mater 55 (2006) 23e28, http://dx.doi.org/10.1016/j.scriptamat.2006.02.039.
[3] D.J. Rowenhorst, A.C. Lewis, G. Spanos, Three-dimensional analysis of graintopology and interface curvature in a beta-titanium alloy, Acta Mater. 58(2010) 5511e5519, http://dx.doi.org/10.1016/j.actamat.2010.06.030.
[4] D.M. Saylor, A. Morawiec, G.S. Rohrer, Distribution and energies of grainboundaries in magnesia as a function of five degrees of freedom, J. Am. Ceram.Soc. 85 (2002) 3081e3083.
[5] B. Lin, Y. Jin, C.M. Hefferan, S.F. Li, J. Lind, R.M. Suter, M. Bernacki, N. Bozzolo,
A.D. Rollett, G.S. Rohrer, Observation of annealing twin nucleation at triplelines in nickel during grain growth, Acta Mater. 99 (2015) 63e68, http://dx.doi.org/10.1016/j.actamat.2015.07.041.
[6] D.M. Saylor, A. Morawiec, G.S. Rohrer, The relative free energies of grainboundaries in magnesia as a function of five macroscopic parameters, ActaMater. 51 (2003) 3675e3686, http://dx.doi.org/10.1016/S1359-6454(03)00182-4.
[7] G. Rohrer, D. Saylor, B. El Dasher, B. Adams, A. Rollett, P. Wynblatt, The dis-tribution of internal interfaces in polycrystals, Z. Fur Met. 95 (2004) 197e214.
[8] V. Randle, Twinning-related grain boundary engineering, Acta Mater. 52(2004) 4067e4081, http://dx.doi.org/10.1016/j.actamat.2004.05.031.
[9] C.S. Kim, A.D. Rollett, G.S. Rohrer, Grain boundary planes: new dimensions inthe grain boundary character distribution, Scr. Mater 54 (2006) 1005e1009,http://dx.doi.org/10.1016/j.scriptamat.2005.11.071.
[10] V. Randle, Role of grain boundary plane in grain boundary engineering, Mater.Sci. Tech. 26 (2010) 774e780, http://dx.doi.org/10.1179/026708309x12567268926641.
[11] S.J. Dillon, G.S. Rohrer, Characterization of the grain-boundary character andenergy distributions of Yttria using automated serial sectioning and EBSD inthe FIB, J. Am. Ceram. Soc. 92 (2009) 1580e1585, http://dx.doi.org/10.1111/j.1551-2916.2009.03064.x.
[12] J. Li, S.J. Dillon, G.S. Rohrer, Relative grain boundary area and energy distri-butions in nickel, Acta Mater. 57 (2009) 4304e4311, http://dx.doi.org/10.1016/j.actamat.2009.06.004.
[13] G.S. Rohrer, J. Li, S. Lee, A.D. Rollett, M. Groeber, M.D. Uchic, Deriving grainboundary character distributions and relative grain boundary energies fromthree-dimensional EBSD data, Mater. Sci. Tech. 26 (2010) 661e669, http://dx.doi.org/10.1179/026708309x12468927349370.
[14] H. Beladi, G.S. Rohrer, The relative grain boundary area and energy distribu-tions in a ferritic steel determined from three-dimensional electron back-scatter diffraction maps, Acta Mater. 61 (2013) 1404e1412, http://dx.doi.org/10.1016/j.actamat.2012.11.017.
[15] H. Beladi, N.T. Nuhfer, G.S. Rohrer, The five-parameter grain boundary char-acter and energy distributions of a fully austenitic high-manganese steel usingthree dimensional data, Acta Mater. 70 (2014) 281e289, http://dx.doi.org/10.1016/j.actamat.2014.02.038.
[16] G.S. Rohrer, Grain boundary energy anisotropy: a review, J. Mater. Sci. 46(2011) 5881e5895, http://dx.doi.org/10.1007/s10853-011-5677-3.
[17] M. Hillert, On theory of normal and abnormal grain growth, Acta Metall. 13(1965) 227e238, http://dx.doi.org/10.1016/0001-6160(65)90200-2.
[18] J. Jeppsson, J. Agren, M. Hillert, Modified mean field models of normal graingrowth, Acta Mater. 56 (2008) 5188e5201, http://dx.doi.org/10.1016/j.actamat.2008.06.034.
[19] C. Herring, Surface tension as a motivation for sintering, in: W.E. Kingston(Ed.), The Physics of Powder Metallurgy, McGraw-Hill, New York, 1951, p. 36.
[20] C. Herring, The use of classical macroscopic concepts in surface energyproblems, in: R. Gomer, C.S. Smith (Eds.), Structure and Properties of SolidSurfaces; Proceedings of a Conference Arranged by the National ResearchCouncil and Held in September, 1952, in Lake Geneva, Wisconsin, USA, Uni-versity of Chicago Press, Chicago, 1953, pp. 5e81.
[21] W.W. Mullins, Capillarity-induced surface morphologies, Int. Sci. 9 (2001)9e20, http://dx.doi.org/10.1023/a:1011258510496.
[22] G.S. Rohrer, E.A. Holm, A.D. Rollett, S.M. Foiles, J. Li, D.L. Olmsted, Comparingcalculated and measured grain boundary energies in nickel, Acta Mater. 58(2010) 5063e5069, http://dx.doi.org/10.1016/j.actamat.2010.05.042.
[23] C. Herring, Some theorems on the free energies of crystal surfaces, Phys. Rev.82 (1951) 87e93, http://dx.doi.org/10.1103/PhysRev.82.87.
[24] J.E. Taylor, Mean-curvature and weighted mean-curvature. 2, Acta Metall.Mater. 40 (1992) 1475e1485, http://dx.doi.org/10.1016/0956-7151(92)90091-r.
[25] G.S. Rohrer, Grain Boundary Data Archive, 2015. http://mimp.materials.cmu.edu/~gr20/Grain_Boundary_Data_Archive/.
[26] M.A. Groeber, M.A. Jackson, DREAM.3D: a Digital Representation Environmentfor the Analysis of, Microstructure in 3D, 2014, 3:5, Integrating Materials andManufacturing Innovation 3, 2014, p. 5.
[27] S.I. Wright, M.M. Nowell, EBSD image quality mapping, Microsc. Microanal. 12(2006) 72e84, http://dx.doi.org/10.1017/s1431927606060090.
[28] Y. Bhandari, S. Sarkar, M. Groeber, M.D. Uchic, D.M. Dimiduk, S. Ghosh, 3Dpolycrystalline microstructure reconstruction from FIB generated serial sec-tions for FE analysis, Comput. Mater. Sci. 41 (2007) 222e235, http://dx.doi.org/10.1016/j.commatsci.2007.04.007.
[29] S. Ghosh, Y. BlIandari, M. Groeber, CAD-based reconstruction of 3D poly-crystalline alloy microstructures from FIB generated serial sections, Com-puter-Aided Des. 40 (2008) 293e310, http://dx.doi.org/10.1016/j.cad.2007.11.003.
[30] B.R. Patterson, D.J. Rowenhorst, V. Tikare, R.T. DeHoff, T.M. Kaub, Affinities fortopological arrangements in grain structures, Acta Mater. 79 (2014) 411e420,http://dx.doi.org/10.1016/j.actamat.2013.10.020.
[31] J. Goldfeather, V. Interrante, A novel cubic-order algorithm for approximatingprincipal direction vectors, ACM Trans. Graph 23 (2004) 45e63, http://dx.doi.org/10.1145/966131.966134.
[32] A. Morawiec, Method to calculate the grain boundary energy distribution overthe space of macroscopic boundary parameters from the geometry of triplejunctions, Acta Mater. 48 (2000) 3525e3532.
[33] D.M. Saylor, A. Morawiec, G.S. Rohrer, Distribution of grain boundaries in
X. Zhong et al. / Acta Materialia 123 (2017) 136e145144

magnesia as a function of five macroscopic parameters, Acta Mater. 51 (2003)3663e3674, http://dx.doi.org/10.1016/s1359-6454(03)00181-2.
[34] C.S. Smith, Grains, phases, and interfaces - an interpretation of microstructure,Trans. Am. Inst. Min. Metall. Eng. 175 (1948) 15e51.
[35] W.W. Mullins, Estimation of the geometrical rate-constant in idealized 3dimensional grain-growth, Acta Metall. 37 (1989) 2979e2984, http://dx.doi.org/10.1016/0001-6160(89)90333-7.
[36] S. Hilgenfeldt, A.M. Kraynik, S.A. Koehler, H.A. Stone, An accurate von Neu-mann's law for three-dimensional foams, Phys. Rev. Lett. 86 (2001)2685e2688, http://dx.doi.org/10.1103/PhysRevLett.86.2685.
[37] M.E. Glicksman, Analysis of 3-D network structures, Phil. Mag. 85 (2005)3e31, http://dx.doi.org/10.1080/14786430412331329892.
[38] J.K. Mason, E.A. Lazar, R.D. MacPherson, D.J. Srolovitz, Geometric and topo-logical properties of the canonical grain-growth microstructure, Phys. Rev. E92 (2015), http://dx.doi.org/10.1103/PhysRevE.92.063308.
[39] M.N. Kelly, K. Glowinski, N.T. Nuhfer, G.S. Rohrer, The five parameter grainboundary character distribution of alpha-Ti determined from three-dimensional orientation data, Acta Mater. 111 (2016) 22e30, http://dx.doi.org/10.1016/j.actamat.2016.03.029.
[40] R.D. MacPherson, D.J. Srolovitz, The von Neumann relation generalized tocoarsening of three-dimensional microstructures, Nature 446 (2007)1053e1055, http://dx.doi.org/10.1038/nature05745.
[41] E.A. Lazar, J.K. Mason, R.D. MacPherson, D.J. Srolovitz, A more accurate three-dimensional grain growth algorithm, Acta Mater. 59 (2011) 6837e6847,http://dx.doi.org/10.1016/j.actamat.2011.07.052.
[42] F.C. Hull, Plane section and spatial characteristics of equiaxed beta-brassgrains, Mater. Sci. Tech. 4 (1988) 778e785.
[43] W.T. Read, W. Shockley, Dislocation models of crystal grain boundaries, Phys.Rev. 78 (1950) 275e289.
X. Zhong et al. / Acta Materialia 123 (2017) 136e145 145