7he effects of curvature on the turbulent boundary...
TRANSCRIPT

R. & M, No. 3599
MINISTRY OF TECHNOLOGY
d' 3'
i . '
AERONAUTICAL RESEARCH COUNCIL
REPORTS AND MEMORANDA
7"he Effects of Curvature on the Turbulent Boundary Layer
By V. C. PATEL
Cambridge University Engineering Department
LONDON: HER MAJESTY'S STATIONER~( OFFICE
1969
PRICE 17S. 6d. NET

The Effects of Curvature on the Turbulent Boundary Layer
By V. C. PATEL
Cambridge University Engineering Department
Reports and Memoranda No. 3599* August, 1968
Summary.
Preliminary measurements in the turbulent boundary layers on a circular cylinder and the convex wall of a 90 degree curved duct are described. The results indicate quite significant effects of longitudinal surface curvature on the development of the boundary layer. In particular it is shown that (a) curvature has a marked influence on the velocity profiles, (b) the usual momentum integral equation for fiat surface flow breaks down in the presence of large static-pressure variations across the boundary layer, and (c) none of the existing boundary-layer calculation methods adequately predicts the development of the shape factor. A more general momentum integral equation has been derived from first principles. This gives reasonable agreement with the experimental development of the momentum thickness.
LIST OF CONTENTS
Section
1. Introduction
2. Review of Previous Work
2.1
2.2
2.3
2.4
Fully developed flows
Curved jets and entrainment
Turbulent boundary layer on curved surfaces
General comments on the review of literature
. Experiments on a Circular Cylinder
3.1 Measurements
3.2 R o development
3.3 H development, velocity profiles and entrainment considerations
3.4 Conclusions from cylinder measurements
*Replaces A.R.C. 30 427.

.
.
6.
7.
Experiments on the Convex Surface of a Curved Channel
4.1 Introductory
4.2 Description of the apparatus
4.3 Measurements
4.4 Evaluation of fi, ~* and 0
4.5 Comparison of measured R o and H with flat surface predictions
The Momentum Integral Equation for Boundary Layers on a Curved Surface
Discussion and Conclusions
Acknowledgement
References
Appendix
Tables
Illustrations--Figs. 1 to 16
Detachable Abstract Cards
1. Introduction.
In the development of two- and three-dimensional boundary-layer calculation methods, whether based on integral or differential equations, it has been customary in the past to assume that the curvature of the streamlines in planes normal to the surface, and the associated variation of the static pressure through the boundary layer, do not influence the flow significantly. The results of such calculation methods, however, have often been compared with experimental measurements in which such an assump- tion does not strictly remain valid. Large variations in static pressure through the boundary layer can arise due to the curvature of the streamlines not only in a boundary layer growing on a curved surface but also in the neighbourhood of separation on flat surfaces. In fact, in experiments such as those of Schmidbauer 22, Schubauer and Klebanoff 23, and others, which are still being used to guide the construct- tion of present-day boundary-layer calculation methods, it is found that the curvature of the streamlines is not small enough to be ignored.
If the usual two-dimensional curvilinear co-ordinate system formed by the distances along and normal to a curved surface is used, and first-order curvature terms are retained, it is found that the Navier-Stokes equations and the simplified boundary-layer equations contain terms involving the curvature of the surface (see, for example, GoldsteinT). These equations therefore suggest the use of a characteristic surface-curvature parameter such as 6/R, where 6 is the boundary-layer thickness and R the radius of curvature of the surface, to correlate curved and flat surface boundary layers. For laminar flow several analyses have in fact been carried out in the past using ~/R as an additional parameter. It is, however, worth pointing out that, while this ratio gives some indication of the effects of curvature, it is unlikely, especially for turbulent flows, to correlate all the influences of curvature since, in general, the curvature of the streamlines within the boundary layer is not simply related to and uniquely fixed by the curvature of the surface and since it is the curvature of the streamlines which primarily influences the detail flow mechanisms within the layer. This distinction between streamline curvature and surface curvature is

essential for proper assessment of curvature effects, since in many flow situations of practical importance substantial curvature of the streamlines can arise not as a result of surface curvature but due to other influences such as a rapid growth in boundary-layer thickness due to, say, an adverse pressure gradient or fluid injection from the surface.
The work to be described in this Report was carried out some three years ago and at the time the results were not thought to be conclusive enough to merit a publication. In recent years, however, there has been a resurgence of interest in the effects of curvature on turbulent boundary layers and since the early results have not been superseded in any way it has been thought proper to make them more widely available.
When the present work was started the various methods of calculating the development of the turbulent boundary layer were based on integral equations and from the more successful of these methods, namely those of Head 9 and Thompson 27, it appeared that surface curvature may have been one of the causes of disagreement between calculations and some of the many experimental results with which they were compared. In view of this, the experiments reported here were designed primarily to obtain some empirical information concerning the effects of curvature so that existing calculation methods could be improved to take account of these effects.
Previous work on curved shear flows has been reviewed in the next Section in an effort to point out the need for further work in this field and to indicate the most profitable lines of attack. Two types of prelimin- ary experiment are then described. The first set of measurements were made in the turbulent boundary layer developing on a circular cylinder. This case is an ideal example of flows in which the curvature of the streamlines within the boundary layer is influenced both by the convex curvature of the surface and by the rather severe pressure gradients. The second set of measurements were made on the convex wall of a parallel curved duct of constant radius with a total turning angle of 90 degrees. In this case the curvature of the streamlines within the boundary layer could easily be related to the curvature of the surface. Quite substantial effects of curvature have been observed in both cases. The results showed that (a) curvature influences the mean velocity distribution in both the inner and the outer regions of the boundary layer, (b) the usual momentum integral equation for flat surface flows, namely
~x 0 dU1 Cy +(H+2) U1 dx - 2 '
breaks down in the presence of large static-pressure variations acro.ss, the boundary layer and (c) none of the existing boundary-layer calculation methods adequately p ~ . c t s the development of the shape factor of the velocity profiles. A more general momentum integral equation derived from first principles including the first order curvature terms has been found to give reasonable agreement with the experi- mental development of the momentum-thickness Reynolds number.
For reasons which will become apparent later, the restilts of the preliminary experiments referred to above were not considered conclusive enough and therefore a more elaborate set of experiments was undertaken in a parallel curved duct of constant radius with a total turning angle of 180 degrees. Although this investigation has not been completed, the results which have already been obtained are described in a separate paper 18. These results have some bearing on the measurements described here and also have several features of interest to workers contemplating further experiments in turbulent boundary layers on curved surfaces.
2. Review of Previous Work. 2.1. Fully Developed Flows.
Fully developed turbulent flow in parallel channels of constant curvature has been investigated quite thoroughly by Wattendorf 28, Eskinazi 4, Eskinazi and Yeh 5 and Yeh, Rose and Lien a°. There are several features of this flow which may be expected to apply in turbulent boundary layers with curved stream- lines. Wattendorf made extensive measurements of mean velocity profiles and static-pressure variations across two curved channels, with half-width to mean radius of curvature ratios of 1/19 (Channel I) and

1/9 (Channel II), and compared them with measurements in a straight channel. His results showed, amongst other things, that curvature has a marked influence on the mean velocity distribution and that the usual law of the wall obtained from straight channels does not apply. Wattendorf's inner-law results of Channel II are reproduced, along with similar measurements made later by Eskinazi, in Figure 1. Comparison of these results with the velocity distributions measured in severe adverse and favourable pressure gradient boundary layers by PateP 6 and Patel and Head ~8 suggests a startling resemblance between the effects of streamline curvature and those of pressure gradients : the inner-law velocity profiles on the inner convex surface appear to be similar to those measured in severe adverse pressure gradients while the profiles on the outer concave surface are similar to those obtaining in severe favourable pressure gradients. Notice that a small favourable pressure gradient exists on both surfaces of the curved duct and that this is very much smaller than the pressure gradients which were required to produce departures of similar magnitude from the usual, semi-logarithmic inner-law in the experiments of Patel, and Patel and Head. Since the observed departures from the usual inner-law are produced by two entirely different, and apparently unrelated, phenomena we cannot, in the absence of further evidence, draw any firm conclusions regarding the rather remarkable similarity between the effects of curvature and those of pressure gradients. Perhaps all that can be said at this stage is that under zero streamwise pressure gradient the boundary layer on a curved surface may still behave, in certain respects, as if it were developing on a flat surface under the influence of a streamwise pressure gradient. This is one point which needs to be examined by further experiments.
Eskinazi, Yeh and co-workers have made very detailed measurements of mean velocity and turbulence in a parallel curved duct of half-width to mean-radius ratio of 1/19. Their mean-flow results are qualitative- ly similar to those of Wattendorf. It is, however, their turbulence measurements which are of considerable interest since a comparison with the straight-channel data shows that the production of turbulence and the turbulence intensities are larger near the outer concave wall and smaller near the inner convex wall than those occurring at corresponding points in a straight channel. This observation is in agreement with the stability criterion for curved flows proposed by Rayleigh~ 9. According to this criterion, which is explained in some detail by Wattendorf, the motion of a fluid with mean tangential velocity U at a distance r from the centre of curvature of the streamline, is stable if the radial gradient of the product (Ur) is positive and unstable if it is negative. Thus, in the case of the curved channel the flow in the neighbourhood of the concave surface is expected to be unstable and show amplification in the level of turbulence. Conversely, near the convex surface the flow is expected to be stable and turbulence will be damped. Further experi- ments are needed to confirm that these observations apply also to boundary layers developing on curved surfaces.
2.2. Curved Jets and Entrainment.
Turbulence measurements in curved mixing layers and jets blowing tangentially on curved surfaces have been made by Margolis 1°. His results are in agreement with the observations of Eskinazi and Yeh. He also found that the turbulence is amplified in regions where the gradient of (Ur) indicates instability and damped in regions where the gradient of(Ur) indicates stability. Perhaps the most important observ- ation which is of immediate interest in the study of curved turbulent boundary layers is that the investiga- tions in curved jets made by Newman 14, Fekete 6, Sawyer 21, Stratford, Jawor and Golesworthy 26, Mar- golis ~°, Guitton 8 and others, all suggest that a jet on a convex wall grows more rapidly (and that on a concave surface grows less rapidly) than a corresponding jet on a flat surface. This result was to be expected from the turbulence measurements of Margolis and also from Rayleigh's stability criterion. In the convex wall jet there is a large outer region which is unstable and therefore the turbulent movements are amplified, the entrainment is increased and the jet spreads more rapidly. The converse is true for a concave wall jet. If these ideas are extended to boundary-layer flow they lead us to expect instability and increased entrain- ment in a boundary layer with concave streamlines, and stability and reduction in entrainment in a boundary layer with convex streamlines. This observation also needs further examination in future experiments.
The theoretical studies in wall jets are restricted only to the prediction of mean flow properties and

again the simplifying assumption of negligible static-pressure variation across the jet is made. This, however, is one case of curve~t flow in which such an assumption may be justified since the centrifugal force on the fluid elements within the jet decreases due to the decrease in velocity with distance from the surface.
So far we have considered only curved wall jets developing in the absence of an external stream. It will be clear that quite different considerations of stability and amplification of turbulence will apply when an external stream is present since markedly different distributions of (Ur) may occur depending on the magnitude of the stream velocity.
2.3. Turbulent Boundary Layer on Curved Surfaces. The well known experiments of von Doenhoff and Tetervin 3, Schubauer and Klebanoff 23 and Strat-
ford 25, which were primarily devised to investigate the effects of pressure gradient on the development of a turbulent boundary layer, employed curved surfaces to produce the desired pressure distributions. Prior to these experiments, Wilcken 29 and Schmidbauer 22 had made measurements specifically to study the effects of surface curvature. The ratio of boundary-layer thickness ~ (defined as the distance from the surface at which U/U1 = 0"995) to the radius of curvature of the surface R did not exceed 0"025 in any of these experiments. With the exception of Wilcken's measurements it is found that the effects of curvature in these measurements are overshadowed by the rather large pressure gradients Which were present. Wilcken, however, did find that the boundary layer on a convex surface grew at a slower rate, and that on a concave surface at a faster rate, than on a corresponding flat surface. This result is in accordance with the observations in curved channels and wall jets on curved surfaces noted previously.
Thompson 27 was perhaps the first author to include the influence of surface curvature in a calculation method for turbulent boundary layers. From an examination of the various experimental investigations he concluded that even though the curvature in these experiments was not large enough to cause sub- stantial changes in the velocity profiles calculated by assuming negligible static-pressure variation (and hence in the evaluation of the usual integral parameters such as the displacement and momentum thick- nesses) the streamwise growth of the shape factor H and the momentum-thickness Reynolds number Ro did show a consistent and fairly marked dependence on surface curvature. Thompson attributed this dependence to the effects of streamline curvature on entrainment and proceeded to refine his entrainment equation by including an empirical factor which was assumed to be a simple function of the ratio 6/R. The inclusion of this curvature term improved the agreement between experiments and the predictions of his calculation method. While the actual procedure followed by Thompson was neither elegant nor wholly staisfactory, his results suggested the important conclusion that the primary influence of streamline curvature was not so much on the shape of the velocity profiles, skin-friction relation, the momentum integral equation and the usual assumption of negligible variation in static pressure across the boundary layer, as on the detailed turbulent motions and the entrainment of freestream fluid into the layer. It was for this reason that the preliminary experiments reported here were undertaken. The main aim of these experiments was to establish a suitable empirical correlation between the entrainment and a curvature parameter such as 6/R so that the then existing entrainment methods of Head 9 and Thompson 27 could be improved to take account of surface curvature. It will be seen later that this aim was not realised due partly to the fact that the effects of curvature were grossly underestimated and partly to the difficulty of satisfactorily isolating the influence of curvature from that of pressure gradients.
In a recent paper Bradshaw 1 has drawn attention to the analogy between meteorological parameters, such as the Richardson number, and the parameters describing the effect of streamline curvature on turbulent flow. Using this analogy, in conjunction with existing meteorological data obtained from the earth's boundary layer, Bradshaw has shown that the effects of curvature on the turbulence, and in particular on the apparent mixing length, are appreciable if the boundary-layer thickness is greater than roughly 1/300 of the radius of curvature. This limit on the ratio 6/R suggests that we may expect quite substantial curvature effects in the experiments of the various authors mentioned above. Furthermore, it leads to the conclusion that the influence of curvature can be large even when the static-pressure variation across the boundary layer is negligibly small. Bradshaw has incorporated the modified distribution of
5

apparent mixing length, or more precisely, the modified distribution of his dissipation length parameter L~, in the Bradshaw, Ferris and Atwell 2 calculation method and recalculated the boundary-layer develop- ments measured by Schmidbauer and Schubauer and Klebanoff. The inclusion of the curvature modification leads to a much better agreement between the experimental developments of 6" and C~ and the calculations. The development of Ro remains more or less unaffected. Bradshaw's calculations have therefore shown quite conclusively that the influence of surface curvature can be quite significant even in experiments where curved surfaces are employed primarily to produce the desired pressure distributions and in cases where the static-pressure variation through the boundary layer can still be regarded as negligible.
2.4. General Comments on the Review of Literature. From the survey of previous work outlined in the last three Sections it will be clear that prior to the
work of Bradshaw, which was published after the present work had been concluded, the information available on the effects of curvature on turbulent boundary layers was very sketchy. In particular it was not known what constituted large curvature and how the static-pressure variation through the boundary layer affected the various integral and differential equations which are generally used to predict the streamwise development of the boundary layer. From the theoretical work of Murphy 11, Schultz-Grunow and Breuer 24, Narasimha and Ojha 12, and others on laminar boundary layers on curved surfaces it appeared that quite significant curvature effects can be expected when the ratio of boundary-layer thick- ness to radius of curvature takes values of the order of 0.05. The recent work of Bradshaw has, to some extent, narrowed the gap but according to him curvature effects become significant even when the ratio b/R is as small as 1/300 and the static-pressure variation is still negligible. This therefore leads to the conclusion that when 6/R is much larger than 1/300 we may expect quite severe and first order effects of curvature and that we may have to revise our equations to include the static-pressure variation across the boundary layer. In the experiments to be described 6/R takes values as high as 0.1 and it is demonstrated that for such severe curvatures, which are not all that uncommon in practical aerodynamic situations, we need to reconsider almost all the equations which are generally used in the analysis of two-dimensional turbulent boundary layers.
3. Experiments on a Circular Cylinder.
The first set of experiments was performed on the boundary layer developing on a 6 in. diameter circular cylinder. This set-up was chosen mainly for its simplicity. A 4 ft. long cylinder was mounted vertically in the 4 ft. x 5½ ft. working section of the Cambridge University Engineering Department's low-speed wind tunnel. The maximum tunnel speed was in the region of 180 ft./sec. The static pressure on the cylinder surface was measured by means of a row of static tappings spaced at 5 deg. intervals at mid- span. Transition of the boundary layer was fixed by means of two 0.040 in. diameter wires at ~b = + 45 ° from the forward stagnation line. A typical pressure distribution with the trip wires in position is shown in Figure 2.
The top 1 foot length of the cylinder was sprayed with china-clay to investigate transition and separation positions. Transition was found to be complete immediately behind the trip wires and separation, as detected by the evaporation of paraffin uniformly spread on the china-clay, occurred at ~b = 110 °. The position of the separation point was constant along the 1 foot length except very close to the tunnel wall, and no noticeable change in this position occurred over the Reynolds-number range in which the boundary-layer developments reported below were measured.
The traverse mechanism used to measure the total-pressure profiles consisted of a stem with a stream- lined leg spring-loaded on to the cylinder surface. Inside this stem was fitted a micrometer screw which carried a flattened pitot with a mouth 0.0076 in. deep. The stem was supported from a vertical streamlined strut spanning the tunnel approximately 15 in. away from the cylinder. The spring-loaded leg on the cylinder was kept 2 in. away from the circumferential line along which the development of the boundary layer was measured. Thus the interference from the strut and the stem was negligible. The micrometer
6
screw and the pitot were actuated in 0.001 in. steps from outside the tunnel by means of a flexible cable drive.
3.1. Measurements.
Total pressure traverses were made at six circumferential stations (q~ = 60 °, 70 °, 80 °, 90 °, 95 ° and 100 °) at mid-span for two cylinder Reynolds numbers (Re = Uo~ D/v = 3.53 x 10⁵ and 5"01 x 10 s, where Uoo is the undisturbed free-stream velocity, D is the cylinder diameter and v the kinematic viscosity). Because of the rather small thickness encountered it was not possible to measure the static-pressure variation through the boundary layer directly. Therefore the velocity profiles and corresponding integral parameters 6* and 0 were all evaluated assuming that the static pressure remained constant through the boundary layer and equal to its value measured at the surface of the cylinder. The justifications for making this assumption are discussed later on. Velocity profiles at the higher Reynolds number are shown in Figure 3 and the corresponding H and R o developments and U1 (the velocity at the edge of the boundary layer) variation are shown in Figure 4. Figure 5 shows the H, R o and U1 values at the lower Reynolds number.
3.2. Ro Development.
Using the measured value of Ro at q~ = 60 °, the measured H distribution, Thompson's 2v skin-friction charts and the usual flat-surface momentum-integral equation,
dRo b(H+l) R° dU1 _ U1 C I dx U1 d ~ v 2 ' (1)
the subsequent development of R o has been predicted by quadrature for both Reynolds numbers. These predictions are compared with the experimental values in Figures 4 and 5. The agreement between the two can be considered satisfactory even though the predicted values tend to be slightly higher than the observed ones. This agreement can be interpreted in at least two ways: (a) if the flow is assumed to be two-dimensional then equation (1) can be considered satisfactory, and (b) if the validity of equation (1) is accepted then the flow can be considered two-dimensional. At this stage, therefore, the experimental evidence for or against the validity of the flat-surface momentum-integral equation cannot be considered conclusive. This is particularly so since we have taken no account of the static pressure variation through the boundary layer even though the surface curvature is quite large (0-030 < 6/R < 0.051) compared with the previous measurements of Schmidbauer and others. The procedure followed here does, however, illustrate what conclusions may be drawn from using the standard approach of neglecting curvature effects. The static-pressure variation has not been considered in this first experiment for several reasons:
(1) Such variations could not be measured directly owing to the very thin boundary layer. (2) No reliable estimate for the curvature of the streamlines could be obtained. It will be clear that the
curvature of the streamlines is not simply related to that of the surface owing to the rather severe pressure gradient effects. In fact, for ~b > 90 ° the rapid growth of the layer towards separation cancels, to some extent, the curvature imposed by the surface. This may indeed lead to negligible pressure variation across the boundary layer.
(3) Thompson's reanalysis of Stratford's zs measurements had shown that the inclusion of pressure variation led to differences in the values of 6* and 0 only of the order of 3 per cent. Thus, it was thought that the direct effect on H and R o due to the evaluation of velocities using the wall static pressure will be negligible.
3.3. H Development, Velocity Profiles and Entrainment Considerations.
Head 9 suggested a simple method of calculating H development based on considerations of the entrain- ment of freestream fluid into the layer. IfQ is the quantity of fluid within a unit width of the layer, the rate of entrainment is
- u dy = ( u ~ ( 6 - 6 . ) } = v (H* Ro), (2) dx 'dx o
where H* = (6 -6" ) /0 . Head proposed that the rate of entrainment is a function of the local velocity profile shape, the external velocity U1 and some measure of the boundary-layer thickness. Assumption of a one-parameter family of profiles allowed the choice of either H* or H as the parameter specifying the profile shape, and the quantity (3-6") was conveniently chosen as the measure of the boundary-layer thickness. Thus,
d {U~ ( 6 - 6 " ) } = f(H* or H, 6-6", U~) dx
1 d {UI (6-6*)}, = F(H*) "" U1 dx
(3)
and H* = G(H). (4)
Functions F and G were obtained by Head from the experimental data of Newman 13 and Schubauer and Klebanoff 23. Thompson has applied Head's method as outlined here to boundary layer developments measured by several authors and found it to be generally satisfactory provided three-dimensionality and curvature effect are absent. He also put forward a more refined calculation method, also based on the entrainment process, and made empirical allowances for curvature and three-dimensionality. To obtain agreement between the measurements of Schubauer and Klebanoff, Schmidbauer and von Doenhoff and Tetervin and his new auxiliary equation he found the need to decrease the entrainment for convex surfaces and to increase it for concave surfaces. The ratio 6/R was used as the curvature parameter in these con- siderations.
For the present experiments, the measured R o values and the value of H at ~ = 60 ° have been used in Head's method to predict the subsequent development of H on the cylinder. Comparison of these calcula- tions with the measured developments, as shown in Figures 4 and 5, indicates that the measured values are consistently higher than the predicted ones. From Head's curves of F and G, reproduced in Figure 6, it is seen that higher H values indicate a reduction in the rate of entrainment. Thus, the present results can be interpreted as confirmation of the trends observed by Thompson and also, indirectly, the expect- ations from the experiments on wall jets and fully-developed flows. As mentioned earlier, convex curvature is expected to suppress the turbulence and therefore reduce the amount of fluid entrained by the large eddies in the outer region of the boundary layer.
The cylinder results are also in agreement with the conclusions of Bradshaw 1 who showed that his flat surface calculation method consistently underestimates the development of H in the convex surface measurements of Schmidbauer 22 and Schubauer and Klebanoff 23.
The dependence of entrainment and the development of H on curvature had in fact been suspected at the start of the present series of experiments. Examination of Head's F versus H* relationship (Figure 6a) shows that the points corresponding to the convex surface in Schubauer and Klebanoff's measurements lie below the mean line drawn by Head, indicating a decrease in entrainment, while Newman's results lie above the mean line, indicating an increase in entrainment due to the concave curvature of the stream- lines associated with the rapid growth of the boundary layer towards separation on a flat surface. Initially, therefore, it was thought that Head's calculation method could be extended to take account of curvature effects if the dependence of the entrainment function F on a suitable curvature parameter could be established by experiment. The use of 6/R as this parameter cannot really be justified simply because the increase or decrease of entrainment (which results from an increase or decrease in mixing due to the centrifugal forces) depends on the curvature of the mean flow streamlines and not that of the surface. As was mentioned previously the assumption of nearly-constant streamline curvature through the boundary layer could lead to serious errors especially in regions where the rate of growth of the layer is large.

In spite of these difficulties, it is interesting to compare the F and G functions given by Head with those required to give agreement with the present measurements. Figure 7 shows the experimental values of the quantity H*Ro (which is a measure of the total flux in the boundary layer, since
f x U1F H*Ro = __U1 (6-~*) = dx) V xo Y
compared with those predicted by using measured R0 and ~ead's F(H*) relationship. The rather close agreement between the two indicates that the correctio~ 'required in the original F curve to account for curvature effects is small. Head's G curve is compared with the measurements of H* and H in Figure 6b. The large disagreement shows that the assumption of a single-parametric set of velocity profiles is not a very good one. Thompson has constructed a two-parameter family of profiles using the law of the wall and Sarnecki's 2° intermittency correlation, and found it to be in excellent agreement with the measure- ments of Newman, Schubauer and Klebanoff, and others. The function G deduced from this family is now dependent on H and Ro, and is also shown in Figure 6b. It is seen that Thompson's curves represent the data of Newman and Schubauer and Klebanoff better than Head's, especially at low H values. Present measurements are, however, in good agreement with Thompson only at low H values. Thus, there appears to be a dependence of H* versus H curves on both Ro and curvature. The Ro dependence is more marked and obscures the effects of curvature.
The measured velocity profiles (at the higher cylinder Reynolds number) are compared with those obtained from Thompson's charts in Figure 3. It is seen that the measured profiles tend to be fuller and indicate a consistent departure from Thompson's in both the inner and outer regions.
3.4. Conclusions from Cylinder Measurements. From the experiments on the circular cylinder the following general comments can be made. (a) The effect of curvature on the growth of Ro can only be established by direct measurements of
static-pressure distribution through the boundary layer and comparing the rates of change of the pressure forces with the other terms in the momentum integral equation. Experiments should be devised such that the radius of curvature of the mean-flow streamlines within the boundary layer can be easily estimated.
(b) The effect of curvature on entrainment has not clearly been verified. The fact that Head's F curve can be used to give agreement with measured H* without any major changes while the H* versus H relationship exhibits greater dependence on R o than on curvature, does not confirm the drop in entrain- ment for convex surfaces as was expected from previous work.
(c) The measured velocity profiles indicate a systematic effect of curvature. Comparison with Thomp- son's profiles suggests that a curvature parameter is required to account for the differences.
4. Experiments on the Convex Surface of a Curved Channel. 4.1. Introductory.
After the experiments on the circular cylinder it was felt desirable to make measurements in fairly thick boundary layers so that accurate static-pressure traverses could be made. This would enable a direct check to be made on the momentum integral equation. A constant-radius curved channel was available and was considered very suitable for the proposed experiments since the potential flow outside the boundary layer closely follows that of a free vortex, so that the static-pressure variation in the outer region could be predicted and compared with measurements. Secondly, the pressure gradient in the streamwise direction would be small and the streamlines in the boundary layer nearly parallel. The radius of curvature of the streamlines is then simply (R + y), R being the radius of curvature of the wall and y the normal distance from it.
4.2. Description of the Apparatus. The general layout of the apparatus is shown in Figure 8. It consisted of a blower tunnel with a con-
ventional 5:1 contraction and several screens. The tunnel working section was a straight duct 10 ft. long,
1 ft. wide and 5 ft. high. A 90 degree curved duct of the same 5 ft. x 1 ft. cross-section and inner-wall radius of 2 ft. was fitted on the end of the straight duct. Care was taken to ensure that the join between the tunnel and the curved section was smooth and free from leaks. Satic-pressure tappings were provided along the mid-span of the convex surface and the straight wall of the tunnel continuous with it. The boundary-layer measurements described below were made on these surfaces.
Transition was promoted at the end of the tunnel contraction by means of a 3 in. wide glass-paper strip and a ½ in. diameter trip wire (the latter being introduced primarily to thicken the boundary layer) on the test side and only the glass-paper strip on the opposite side.
Both the static probe and the total-head tube were made of 0.040 in. diameter hypodermic tubing and were mounted on ½ in. diameter stems attached to the traverse gear situated outside the tunnel The mouth of the total-head tube was flattened to an overall height of 0"008 in. The traverse gear consisted of a dial- gauge capable of registering distances up to 2"2 in. within 0.001 in. One end of the gauge spindle carried the pitot (or static) stem and the other was moved by means of a screw-thread.
4.3. Measurements.
Total and static-pressure traverses were made on the test wall boundary layer at 16 stations situated on the tunnel centreline. The Reynolds number per foot at Station 1 (42 in. downstream of transition) was kept constant and equal to 2.42 x l0 s. The positions of the measuring stations and the static-pressure variation along the test wall are shown in Figure 8, and further details are given in Tables 1 and 2. The favourable pressure gradient at the join between the flat and convex surfaces is associated with the change in curvature of the streamlines and is therefore unavoidable. An adverse gradient of similar magnitude exists on the outer surface. Conversely, an adverse gradient on the convex wall and a favourable gradient on the concave wall exist at the exit from the curved channel. The magnitudes and the effects of these pressure gradients are discussed at a later stage.
As a typical example of the measurements on the convex surface, Figure 9 shows the total and static- pressure variations through the boundary layer at Station 14 (where x - x o = 92.25 in. and q5 = 44.3°), and the corresponding velocity profile is shown in Figure 10.
4.4. Evaluation of b, 6" and O.
From the typical velocity profile shown in Figure 10, it will be clear that the velocity in the potential flow outside the boundary layer is not constant with distance from the surface. For this reason we cannot obtain fi, ~* and 0 in the usual way. To calculate meaningful values of these quantities we need to consider the difference between the measured velocity distribution and the velocity distribution obtaining under identical conditions if the flow were potential.
Using a curvilinear co-ordinate system formed by the distances along (x) and normal to (y) a wall of radius of curvature R (R being positive for convex curvature) it is easily shown that, for two-dimensional flow, the condition for zero vorticity in the potential flow for (y/R) 2 < < 1 can be written
Uv 4 oUr R ~Vv R + y Oy R + y ~x - 0 " (5)
Suffix p denotes potential flow and U and V are the velocity components in the x and y directions respectively. By taking examples such as the flow past a circular cylinder it can be shown that the third term in this equation is small provided terms of the order (y/R) 2 can be neglected in comparison with unity. Thus, the potential-flow velocity field can be approximated by
OUp Up - O, (6) Oy ~ R + y
i.e. Uv(1 + y/R) = Uvw , (7)
10

where w denotes the value at the wall (i.e. at y = 0). The velocity distribution in a boundary layer on a curved surface must therefore approach Up at its outer edge in the manner shown in Figure 10.
We now adopt the conventional definitions of 6, 6* and 0. The boundary-layer thickness 6 is defined as the value ofy at which U/Up = 0.995.6* and 0 represent the mass and momentum flux defects within the boundary layer, and are therefore defined by the relations.
f 6* f ,J Updy = (Up- U)dy (8)
0 0
and f o U~dy f '~ = U(Up- U)dy. (9) 0 0
Substitution of Up from equation (7) then leads to
f' (up-v) R In (1 + 6*/R) = dy (8.1) 0 Upw
0 f, and I+O/R- o-U--~w,, -O~p,~ dy. (9.1)
So far in the analysis we have retained terms of the order 6/R. But since from flat surface boundary layers we expect 6*/6 and 0/6 to be of the order of 1/5 to 1/10, a*/R and O/R will be small in comparison with unity provided 6/R does not exceed 1/10. We can therefore approximate equations (8.1) and (9.1) by
Ups, ) dy (8.2)
and o = f '~ u@~ ( Up- U ) dy Up,,, (9.2)
In the present experiments, the distribution of UJUpw was first found using equation (7) in conjunction with the observed velocity at some y greater than 6. The values of 6* and 0 were then computed from the measured profiles with the use of equations (8.2) and (9.2). For the measurements on the flat surface 6" and 0 were obtained in the usual way by assuming Up = Upw = U1, the free-stream velocity. The entire development of momentum-thickness Reynolds number R o (defined as U~O/v) and the shape parameter H (= 6"/0) is shown in Figure 11.
It will be recalled that the values of 6* and 0 quoted earlier for the circular cylinder measurements were not evaluated in the manner described above. To assess the effects of assuming constant static pressure through the boundary layer in those results, the measurements on the present convex surface have been reanalysed using only the wall static pressure and the total-pressure profiles. This procedure was found to give values of 6* and 0 which are approximately 10 per cent and 12 per cent, respectively, LOWER than the values computed using the correct definitions of equations (8.2) and (9.2). The corresponding values of Uo/v were about 4 per cent HIGHER than the correct ones and therefore the net result was an overestimation in Ro of about 8 per cent and an underestimation in H of about 3 per cent.
These calculations suggest that the H development in the cylinder experiments would remain sub- stantially unaltered but the measurements of Ro, if corrected for static-pressure variation, would lie below the values shown in Figures 4 and 5. The correction will of course be smaller than the 8 per cent in the channel results due to the reduction in streamline curvature caused by the rather strong adverse pressure gradients on the rear of the cylinder.
11

4.5. Comparison of Measured R o and H with Flat-Surface Predictions.
Following the procedure outlined in Sections 3.2 and 3.3 for the cylinder experiments, two calculations have been performed: (a) the flat-surface momentum-integral equation (1), the Ludwieg-Tillmann skit#friction formula and the measured H distribution have been used to predict the growth of Ro down- stream of the first measuring station, and (b) the measured Ro has been used along with Head's F and G curves to predict the development of H. The results of these calculations are compared with the measure- ments in Figure 11. It will be seen that the flat surface predictions are in good agreement with experiment only up to (x-x0) = 50 in., and that thereafter the momentum integral equation gives R o values which are too high while Head's method considerably underestimates H. We also notice that the favourable pressure gradient which, as seen from Figure 8, exists from (X-Xo) = 50 in. to 85 in. is not large enough to account for the sudden drop of R o in this region.
Thompson 27 and others have suggested that any disagreement between R o predicted by using the flat surface momentum integral equation and the measured R o can be explained by the existence of three- dimensionality. Following Thompson, then, the rather low values of R o measured on the convex surface lead to the conclusion that the flow is divergent. This, however, is contrary to what will be expected from considerations of secondary flows within the curved duct. The radial centrifugal pressure gradient will give rise to inward (i.e. from the concave to the convex surface) cross-flows within the boundary layers on the roof and the floor of the channel and these in turn lead to cross-flows towards the outer corners on the concave surface and away from the inner corners on the convex surface. Thus, the flow on the centreline of the convex surface, if at all influenced by the inner corners, is expected to be convergent , leading to measured values of Ro higher than those predicted by the momentum integral equation. In the present experiments no check on the two-dimensionality of the flow has been made but later experiments with a 180 degree channel (of the same cross-section and mean radius) which are described in a separate paper by the author I v have substantiated the cross-flow picture just outlined and in particular shown that the flow in the region of the centreline of the convex wall is fairly two-dimensional for at least the first 80 degrees. The disagreement in R o development of the present experiments cannot therefore be attributed to three-dimensionality.
The above considerations are of course based on the assumption that the usual momentum integral equation, equation (1), is valid for two-dimensional flow in the present situation. The rather gross dis- agreement in the Ro development therefore leads one to question the validity of this equation. Newman 13 has in fact observed that the static-pressure variation through a rapidly growing boundary layer can make a significant contribution to the growth of R o. By integrating the equations of motion on a flat surface and assuming p = p(x,y) within the boundary layer, he has shown that the integrated momentum equation can be written
dO 0 dU1 Zw 1 d (" ~ - - - J (p~-p) dy , (10) dx~' (H+Z) u a dx pU 2 pU~ dx o
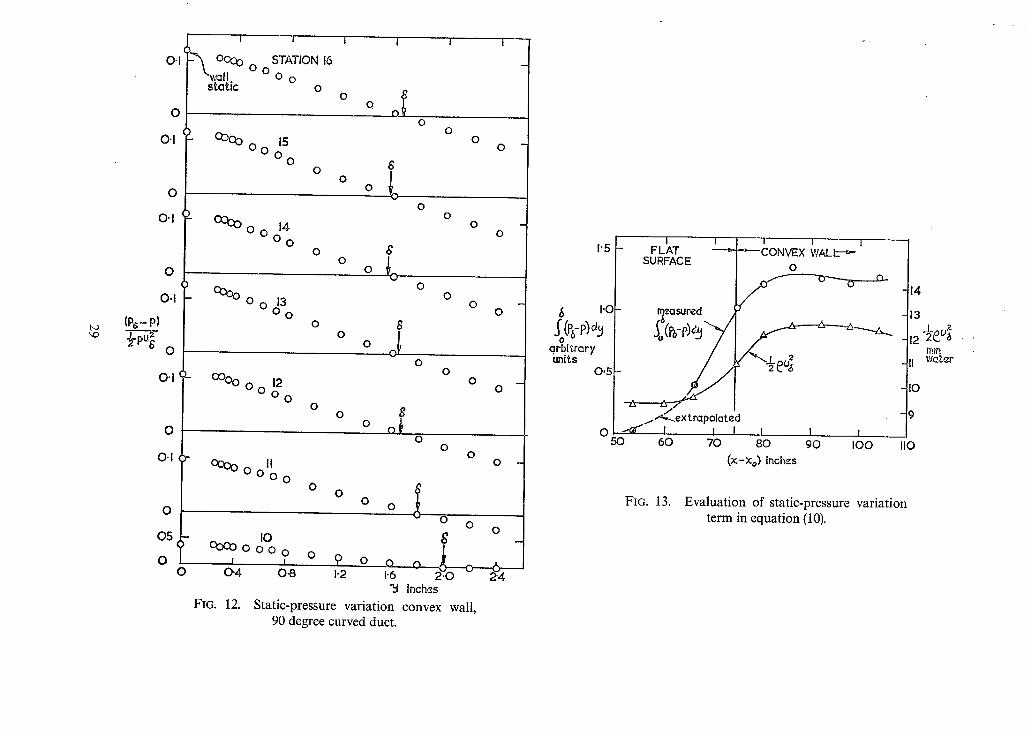
where po is the static pressure at y = 6. This equation is applicable only if the pressure remains constant with y outside the boundary layer. While this condition is not strictly satisfied in the present experiments on the convex surface, it is possible to estimate the influence of the additional pressure variation term for the flat surface boundary layer between (x-Xo) = 55 in. and 73.75 in. Since the radius of curvature of the streamlines (and hence the centrifugal pressure field) changes very abruptly in this region, the correction term, which is a rate of change of the integrated pressure force across the boundary layer, is large in comparison with both the pressure gradient and the skin-friction terms in the momentum integral equation. Figure 12 shows the measured static-pressure distributions at Stations 10 to 16 and Figure 13 shows the variation of the integral in the last term of equation (10). This latter figure has been used to obtain plausible estimates of the last term in equation (10) and starting from Station 7 the subsequent development of R o has been calculated using the same procedure as before. The result of this calculation is shown in Figure 11. It will be clear that owing to the rather large streamwise distances between the measuring stations and graphical differentiation of the faired curve in Figure 12, the accuracy of such a calculation is very small. Nevertheless, the agreement between the calculated and measured development
12

of Ro in the region 55 in. < (X-Xo) < 73.75 in. is quite encouraging and leads unmistakably to the conclusion that the usual momentum integral equation, equation (1), cannot be used not only on flat surfaces where static pressure does not remain constant through the boundary layer but also on heavily curved surfaces.
The development of the shape factor, H, measured on the flat and convex surface is compared in Figure 11 with that predicted by using Head's method. As in the cylinder experiments it is observed that the measured values are considerably higher than the predicted ones on the convex surface. The velocity profiles measured on the convex surface when compared with Thompson's two-parameter family also indicate the same trends as those observed for the cylinder (Figure 3). This suggests therefore that a curvature parameter is required, in addition to H and Ro, to describe these profiles completely. For reasons mentioned previously the fact that the measured H values are lower than those predicted by Head's method cannot be regarded as sufficient evidence for the expected reduction in entrainment.
5. The Momentum Integral Equation for Boundary Layers on a Curved Surface. The experimental evidence of the last two sections shows quite conclusively that the usual momentum
integral equation,
d ~ + ( H + l ) 0 dU1 zw u1 dx pu~ - O' (1)
breaks down whenever there is a large variation of static pressure across the boundary layer. It has also been shown that Newman's modified relation, equation (10), can be used where static-pressure variation arises on flat surfaces due to streamline curvature caused by a rapid growth of the layer. There remains, however, a need to reconsider the boundary layer on a curved surface where substantial static- pressure variations can occur when the growth of the layer is negligibly small.
Two separate attempts were made to obtain a momentum integral equation for curved-surface boundary layers. In the first attempt, boundary-layer equations in curvilinear co-ordinates (retaining first order curvature terms) were integrated. The result, however, was a rather elaborate integral equation in which the various correction terms could not be reduced to closed forms and had to be estimated by making arbitrary assumptions about the boundary-layer velocity profiles. The details of this equation have been described by Patel '5. In the second and more fruitful attempt boundary-layer equations in polar co- ordinates have been considered. The details of the derivation of the corresponding integral equation are set out in the Appendix. There it is shown that for a surface of CONSTANT radius of curvature, R, the momentum (or angular-momentum) integral equation can be written
d19 l d ~ ~ R 2 1 d {1 ~2 r~ ffS r t dq~ ~-(A*+219) ddp p - ~ - - - p - ~ ~ 2P In-~+ prd , (11)
where "~ ¢0 dr =Ulrl, o) = Ur, 19 = 1 - - -
A * = 1 - - -
R r
and the suffix 1 refers to conditions on a line of CONSTANT radius r 1 immediately outside the boundary layer. In the outer irrotational flow f~ is constant with r and therefore the values of 19 and A* are inde- pendent of the outer limit of integration. 19 and A* are related to the usual defect thicknesses 0 and (5* of equations (9) and (8) by
o - (] + ~/R) O/R
and zX* = ,WR. (12)
13

Using these relations it is easy to show that the left-hand side of equation (11), when put equal to zero, reduces identically to equation (1) for sufficiently small values of ~/R. The curvature correction term on the right-hand side of equation (11) is similar to the pressure term introduced by Newman in equation (10) and can readily be calculated either from the known static-pressure profiles or from the measured velocity profiles using the radial equilibrium equation,
U z 1 ap
r p dr ' (13)
to relate the velocity and static-pressure fields.
Profiles of 09/f2 measured at the six streamwise stations on the 90 degree convex wall are shown in Figure 14. These were integrated to obtain the experimental development of ® and A* shown in Figure 15. To calculate the development of ® according to equation (11), use has been made of (a) r~ = 26 inches, (b) the measured distribution of fR~b), (c) the measured development of A*, (d) the measured static- pressure profiles shown in Figure 12, and (e) the Ludwieg-Tillmann skin-friction formula to relate Zw/~pl U2 to H ( _= A*/®) and R o ( =- U 1 ® R/v). Equation (11) was integrated in the usual way by a step-by-step procedure starting with the experimental value of® at Station 11. The development of® predicted in this manner is compared with the experimental results in Figure 15. A similar calculation was performed using
dO 1 dO % R 2 d--~ + ( A * + 2 o ) f ~ dq~ p f ~ = 0 (14)
in place of equation (11) to show clearly the effect of the last term in equation (11). The result of this calculation is also shown in Figure 15. Even though the graphical differentiation of experimental data somewhat reduces the accuracy of these calculations, it will be seen that equation (11) gives quite good agreement with the measured development of ® while equation (14) gives values of ® which are very much higher than the measured ones. The difference between the two calculated developments shows quite conclusively that the static-pressure variation through the boundary layer has a marked influence on the overall growth of the layer. For surfaces of large curvature it is therefore necessary to include the curvature (and static-pressure variation) terms in both the integral as well as the differential forms of the boundary-layer equations.
6. Discussion and Conclusions.
The preliminary experiments on the circular cylinder and the 90 degree convex wall reported here suggest that we may expect quite substantial effects of streamline curvature on the overall development of the boundary layer when the ratio of the boundary-layer thickness, 6, to the radius of curvature of the surface, R, is in the region of 1/30 to 1/10. The values of 6/R occurring in these experiments are somewhat higher than those encountered in previous measurements and very much higher than the 1/300 quoted by Bradshaw 1 as being the highest value below which curvature effects may be neglected.
For sufficiently large curvature it becomes necessary to re-define the conventional integral parameters 6* and 0 owing to the fact that the velocity in the irrotational flow immediately outside the boundary layer no longer remains constant with distance from the surface. In the present work logical definitions are suggested and these have been used wherever possible.
It has been shown that the usual fiat-surface momentum integral equation breaks down in cases where the static pressure does not remain substantially constant across the boundary layer. Newman's modified relation has been shown to apply in boundary layers where large static-pressure variations occur as a result of streamline curvature on flat surfaces. A new integral equation has been obtained for the boundary layer on a surface of constant curvature. This equation gives good agreement with experiments.
Values of the shape factor H measured on convex surfaces are found to be very much higher than those
14

predicted by the method of Head 9. Since this method has been shown to be fairly successful in predicting the development of H on flat surfaces, it is concluded that the observed differences between calculation and measurements are a direct result of curvature effects. Such differences have also been observed in the convex surface boundary-layer measurements of Schmidbauer 22 and Schubauer and Klebanoff 23 by Bradshaw. The observation that the values of H measured on convex surfaces are consistently higher than flat-surface predictions superficially suggests that convex curvature reduces the entrainment of free-stream fluid into the boundary layer. This result was to be expected from considerations of Rayleigh's stability criterion for curved flows and also from previous measurements in curved wall jets and in fully developed flow in curved channels, but it has not been possible to obtain any direct evidence of this here.
The measured velocity profiles show a marked dependence on curvature in both the inner and the outer regions. In particular, it is found that they are not adequately described by the two-parameter family of profiles constructed for flat surface boundary layers by Thompson 27. The influence of curvature on the entire profile suggests that the detail turbulent motions within the boundary layer are affected by stream- line curvature. Some evidence in support of this observation has already been put forward by Bradshaw.
While the present investigation has led to many important conclusions it will be obvious that much further work is required to clarify several points. The experiments reported here, being preliminary in nature, have suffered from several drawbacks: (a) We had grossly underestimated the influence of curvature and therefore employed rather large values of 6/R. In future experiments it will be more profitable to work with smaller curvature, say 1/50 > 6/R > 1/300. (b) It has not been possible to isolate satisfactorily the effects of streamwise pressure gradients from those of curvature. In the cylinder experiments the curvature of the streamlines could not be estimated accurately enough, while the pressure gradients associated with the abrupt changes in surface curvature in the duct experiments made the interpretation of curvature effects rather difficult. In future work, therefore, it is suggested that an attempt should be made to produce a predominantly zero streamwise pressure gradient boundary layer on a curved surface. Comparison of measurements in such a layer with the well-established results of flat plane boundary layers will shed much light on the influence of curvature. (c) To obtain the conditions just mentioned it is necessary to use curved ducts. Other experiments reported by the author 17 suggest that the absence of three- dimensionality must be rigorously checked and if necessary the end-wall boundary layers must be con- trolled. (d) Experiments have not so far been carried out to assess the influence of concave curvature. In future attempts to study boundary layers on concave surfaces the G6rtler-Taylor type instability vortices must be taken into account. A study of such vortices in turbulent boundary layers may in itself be profitable. (e) More refined and detailed measurements are obviously needed to check (i) the new momentum integral equation, (ii) the expected dependence of entrainment on streamline curvature, and (iii) the influence of curvature on the turbulence properties and mean velocity distributions in order to provide more direct evidence for Bradshaw's mixing-length modifications.
7. Acknowledgement. The author would like to express his sincere gratitude to Dr. M. R. Head for his many invaluable
suggestions and discussions during the course of this work.
15

No. Author(s)
1 P. Bradshaw
P. Bradshaw, . . D. H. Ferriss and N. P. Atwell
3 A.E. von Doenhoffand N. Tetervin
4 S. Eskinazi . . . .
5 S. Eskinazi and H. Yeh
6 G. I . Fekete . . . .
7 S. Goldstein . . . .
8 D.E. Guitton . .
9 M.R. Head . . . .
10 Margolis, D .P . . .
11 J. & M u r p h y ..
12 R. Narasimha and .. S. K. Ojha
13 B.G. Newman ..
REFERENCES
Title, etc.
The analogy between streamline curvature and turbulent shear flow.
A.R.C. 29, 048. 1968 (unpublished).
buoyancy in
Calculation of boundary-layer development using the turbulent energy equation.
J. Fluid Mech. Vol. 28, p. 593. 1967.
Determination of general relations for the behaviour of turbulent boundary layers.
N.A.C.A. Report 772. 1943.
An investigation of fully developed turbulent flow in a curved channel.
Johns Hopkins Univ. Report 1-20. 1954.
An investigation of fully developed turbulent flow in a curved channel.
J. Aero. Sci. Vol. 23, p. 23. 1956.
Coanda flow of a two-dimensional wall jet on the outside of a circular cylinder.
McGill Univ. Report 63-11. 1963.
Modern Developments in Fluid Dynamics. Vol. 1, p. 119, Oxford Univ. Press (also Dover Publications). 1938.
Two-dimensional turbulent wall jets over curved surfaces. McGill Univ. Report 64-7. 1964.
Entrainment in the turbulent boundary layer. A.R.C.R. & M. 3152. 1958.
A study of the effect of curvature on turbulent flow. Penn. State Univ. Project No. 3227--E Report. 1963.
Some effects of surface curvature on laminar boundary-layer flow. J. Aero. Sci. Vol. 20, p. 338. 1953.
Effect of longitudinal surface curvature on boundary layers. Indian Inst. Sci. Bangalore, Report AE 164 A. 1966.
Some contributions to the study of the turbulent boundary layer near separation.
Aust. Dept. Supply, Report ACA-53. 1951.
16

No. Author(s)
14 B.'G. Newman ..
15 V.C. Patel . . . .
16 V.C. Patel . . . .
17 V.C. Patel . . . .
18 V.C. Patel and . . M. R. Head
19 J .W.S . Rayleigh . .
20 A.J. Sarnecki . .
21 R.A. Sawyer . .
22 H. Schmidbauer ..
23 G.B. Schubauer and P. S. Klebanoff
24 F. Schultz-Grunow and W. Breuer
25 B.S. Stratford ..
26 B. S. Stratford, . . Z. M. Jawor and G. I. Golesworthy ..
27 B .G. J . Thompson ..
REFERENCES--continued
Title, etc.
The deflection of plane jets by adjacent boundar ies~2oanda effect.
Boundary Layer Control, Ed. G. V. Lachmann, Pergamon Press, p. 232. 1961.
Ph.D. Thesis, Cambridge University. 1965.
Calibration of the Preston tube and limitations on its use in pressure gradients.
J. Fluid Mech. Vol. 23, p. 185, 1965.
Measurements of secondary flow in the boundary layers of a 180 ° curved channel.
A.R.C.C.P. 1043. 1968.
Reversion of turbulent to laminar flow. A.R.C. 29,859 (unpublished). J. Fluid Mech. Vol. 34, p. 371. 1968.
The dynamics of revolving fluids. Proc. Roy. Soc. Vol. 6A, 19. 148. 1916.
Ph.D. Thesis, Cambridge University. 1959.
Two-dimensional reattaching jet flows including the effects of curvature on entrainment.
J. Fluid Mech. Vol. 17, p. 481. 1963.
Turbulent friction layers along convex surfaces. N.A.C.A.T.M. 791 (translation of Luftfahrtforschung, Vol. 13,
p. 160). 1966.
Investigation of separation of the turbulent boundary layer. N.A.C.A. Report 1030. 1951.
Laminar boundary layers at curved surfaces. Institut fiir Mechanik, Tech. Univ. Aachen, Report 3. 1963.
An experimental flow with zero skin-friction throughout its region of development.
J. Fluid Mech. Vol. 5, p. 17. 1959.
The mixing with ambient air of a cold airstream in a centrifugal field.
A.R.C.C.P. 687. 1962.
Ph.D. Thesis, Cambridge University. 1963.
17

No. Author(s)
28 F .L . Wattendorf . .
29 H. Wilcken . . . .
30 H. Yeh, W. G. Rose and .. H. Lien . . . . . .
REFERENCES--continued
Title, etc.
A study of the effect of curvature on fully developed turbulent flow. Proc. Roy. Soc. Vol. 148A, p. 565. 1935.
Turbulente Grenzschichten an gew61bten Flgchen. Ing. Archiv. Vol. 1, p. 357. 1930.
Further investigations on fully developed turbulent flows in a curved channel.
Johns Hopkins Univ., Contract Nonr - -248 (33) Report. 1956.
18

APPENDIX
Momentum Integral Equation for a Boundary Layer on a Surface of Constant Curvature.
Using the notation and the co-ordinate system shown in Figure 16, the two-dimensional boundary- layer equations can be written
u OU + v OU.+ UV 1 Op f o2u l OU u ~ ~o~ a~ - 7 - = p r ~ ~ ~ ~ - J + 7 Or rTJ
(A.1)
U 2 1 Op and - (A.2)
r ' p Or "
The continuity equation is
0U l~r ra~F~ (Vr)=O. (A.3)
We now consider boundary-layer flow on a surface of constant radius of curvature, R, and assume that the boundary-layer thickness, 6, is small enough for terms of the order (6/R) 2 to be neglected in com- parison with unity. Then it is readily shown that in the irrotational flow outside the boundary layer the product Ur becomes independent of r, i.e.
Ulr~= f~ (q~), (A.4)
where the suffix 1 represents conditions outside the boundary layer. Notice that equation (A.4) is exact when the streamlines in the outer flow are circular.
With the use of the substitution
Ur = co, (A.5)
the boundary conditions
O U _ z,,,at r =__R U = ,0, Or /~
and U --~ U1, Ulr I = ~~ (~) for r = r l ,
and the equation of continuity, equation (A.1) can be integrated with respect to r from the wall (r to some r (r. = rl) outside the boundary layer to obtain,
c3q5 R -~--dr-f~ --°9dr " R r ' P O ~ R
(A.6)
R)
zwR 2 plrl dr1 pr dr - - 2vf~-t . (A.7)
p p d4,
This equation can also be derived by considerations of the flux of angular momentum through a small control volume in the usual way. The third, viscous term on the right-hand side of this equation arises from the fact that the flow outside the boundary layer is not free from shear. This term can, however, be neglected since it is reciprocal of the Reynolds number based on the velocity and radius of curvature of the streamlines outside the boundary layer.
If we now define two integral length scales by the relations
19

;(, ) f o( A * = co d r a n d O = g l_O~dr R 1 - ~ r R flJr'
(A.8)
equation (A.7) can be reduced to the form
d® idf~ zwR2 1 d f ~ f ~ } dq~ ~-(A* + 20) de pf~ 2 pf~2 de ½pf~2 In + prd r
R
1 I 2 I dr1 p~z (~P~ + Pl r2) r~ d--C" (A.9)
This is the basic form of the new momentum integral equation. Some of the notable features of this equation are listed below.
(1) The integral parameters A* and ® are based on the defects of Ur and are defined to ensure that their values are independent of the choice of r~. It is, however, easy to show that they are related to the usual mass and momentum-flux defect thicknesses (defined by equations (8) and (9) in the text, Section 4.4) by the relations
A* = 6*/R
and ® (1 + ~5/R) O/R + terms of order ( ~ / R ) 2 .
(2) Since dx = Rd¢, 6" = RA*, 0 - (1 + 6/R)- 1 R @, f~ = Ulrx and (r 1 - R) is of the order of 6, it can readilly be shown that the left-hand side of equation (A.9) (when put equal to zero) reduces identically to the usual flat surface momentum integral equation, equation (1), for sufficiently small values of 6/R.
(3) The first term on the right-hand side of equation (A:9) includes the static-pressure variation across the boundary layer and is in many ways similar to the pressure term occurring in the modified integral equation (10) suggested by Newman. The 90 ° convex wall boundary-layer measurements described in the text suggest that this term can be quite large in comparison with the other terms on the left-hand side. The magnitude of this term depends on rl.
(4) The last term in equation (A.9) arises due to the fact that the choice of the outer limit of integration (r = rl) has been left arbitrary with the only restriction that (rl - R ) is of the order of the boundary-layer thickness. We can of course choose r 1 = 6, as is customary, but then this term cannot be evaluated with any great accuracy due to the uncertainty of defining 6. It is therefore better to choose r~ = constant with ¢ so as to make this term zero. Notice also that the quantity within the brackets in the laSt term is no more than 2 pours, Po~ being the total pressure at r = rl.
(5) Equation (A.9) can be re-cast into several different forms. In particular, we may substitute the static-pressure variation given by the equation of radial equilibrium, equation (A.2), in the integral occurring in the second term on the right-hand side to obtain terms involving A*, O and other quantities. We have, however, choosen the above form since (a) it shows how the usual flat surface equation is re- produced for small 6/R, (b) a single 'curvature correction term' is obtained when r~ = constant, and (c) this correction term can easily be evaluated from the measurements which have been made.
(6) Equation (A.9) with constant r~ has been used in the text to calculate the development of ® on the 90 degree convex surface.
20

TABLE 1
Details of Measuring Stations in the 90 de#ree Curved Duct
Station number
4 5 6 7 8 9
10 11 12 13 14 15 16
Distance from
transition x inches
42-0 53.0 62-0 71.0 77-0 83"0 ~89.0 95.5
102.0 108.0 116.25 122.25 128.25 134.25 140.25 146.25
Distance from
Station 1 ( x - xo) inches
0 11-0 20.0 29"0 35.0 41.0 47-0 53-5 60"0 66"0 74.25 80"25 86.25 92.25 98.25
104.25
21

TABLE 2
Static Pressure Distribution on the Test Wall of the 90 degree Duct
x
inches
42 45 48 51 54
P s t - P r e f
mm water
3'37 3.34 3.33 3"29 3.28
P s t - P1 Cp - T 2 7 7 ~ ~pU1
0 - "0033 - .0045 - .0089 - .0100
57 60 63 66 69 72 75 78 81 84 87 90 93 96 99
102 105 108 111 117.75 120"75 123.75 126.75 129.75 132.75 135.75 138.75 141.75 144.75 147.75 150.75
3.27 3.27 3.23 3.25 3-27 3-26 3.21 3.20 3.26 3.25 3.21 3.16 3.07 3.01 2-93 2.78 2.60 2.42 2"09 0
-0 .84 - 1.51 - 1 " 9 3
- 1 - 9 9
- 1 . 8 9
- 1 . 9 0
- 2.04 -2 .20 -2 .24 -2 .11 -1 .51
- .0106 - .0106 --0162 - -0134 - .0112 - .0117 - .0178 - .0190 - .0123 - .0139 - .0178 - .0234 - .0334 --0401 - .0490 - .0652 - ' 0859 - .1060 - .1428 - .3760 - .4700 --5445 - .5905 - .5980 - ' 5 8 6 0 - .5875 - .6040 - .6210 - .6260 - .6110 - .5445
Suffix 1 refers to Station 1
22

l ' -O
30
25
2O
15
I0
m
0
I0
I I I I I I ! I I J I I I I 1 I I 1 I I I I I I I I
A A&
A A ~ -u A =u_y_Z. ,, Ao A
/ ~ o
~ ~ ~ I ~ ~ ~ u A 0 = ESKINAZl (1954} u ~ 0 u WATTENDO~F (1935) _
u ~ OUTER CONCAVE WALL o e STRAIGHT CHANNEL A ,~ INNER CONVEX WALL
I I ! 1 ! I I 1 1 I 1 I I I I w ~ I 1
~o ~ ~o ~
FIG. 1. Law of the wall in curved channel flows.
I
~__L
t I J t I I
~c~

P-R Cp=
O
-I 'O
FIG. 2.
i i I i I t
u~
• 040 dia / t r i p wires " • / . pitot traverse
mechanism
Cp: l -4 sin =
,I ¢t =45 ° ~= 110 °
\ ~,\ !/ observed separat ion \ ~? six measuring I position
- . - 0 - - 0 . - - 0 . , . - 0 - -
Re = 5-01 x IO s
I I 20 ° 4 0 ° 60 ° 8 0 ° 100 ° 120 ° 140 ° ~ 160 ° IBO °
Experimental arrangement of cylinder and a typical pressure distribution.
~4
12
10
8
0
¢*
6O
70
8O 90 95 I00
I 0"2
0 0.2 0.6 O.B 1.0 I I I I
inches ) s ° e ~.~ ~ ¢ ~°° ~ ° ° 90 ° 9s ° ~d
.0102.0073o91 o3o I
'0101 "0071 '091 "030 .0112 -0078 .C)97 -032 ~DI48 "(3100 "109 "036 .0210 "0136 '130 "043 /
'0369 "0191 "154 "051 ]
o EXPERIMENT / ° "
~ t - - " - ~-----! ~--I--
FIG. 3.
0-4
) I80o )
' 0 /
/ i , %.-e
0.4 o ~ O.B I'O I-O tO
%, Velocity profiles in cylinder experiments, Re = 5"01 x 105.
?
/
1.0 I'O
(
(
G Q
I'0
24

bo
2 0 0 0 -
R 0
I 000
0
ZgO-
Z T O -
250-
U I
11)~ ",measured
50 do "/o ~ ,;b ~6o degrees
FIG. 4. Boundary- layer development on circular cylinder, Re = 5.01 x 10⁵.
-2.0
-1"8
H
-1'6
-I.4
I I10
,~o:
Re
1200-
800-
400-
0 50
~.oo-
Ul
:80 -
160-
7 - - - - - - j M~d~ II memod II
" .,.,,.~meosured
--o ~ Re
I I I I I
6 0 7 0 8 0 9 0 IOO ¢ degrees
FIG. 5. Boundary- layer development on circular cylinder, Re = 3.53 x 10⁵.
-2.C
-I'8
H
-I,6
-1.4
| -
I10

F
. 0 5 -
, 0 4 -
' 03
. 0 2 ¸
' 0 1 -
o 0
(a}
0
0
o Newman (1951) x+ Schubaucr and
Klebonoff (1951)
G
12-
I0-
B-
6-
4-
2-
o
H *
I I I ~ / o & : = O . 0 3 • l ~¢;'~ II ~ , ~ • R¢:B'OtxlO 5
.~L \ e a¢=3"53xlOS
61R'=-0 ' 0 4
>' • ~ \ \ % = 2 o o o
',, ~ 7 ~ : 400 +~N' \ ' x - - ~ / / - - - - - : I0 "~
+ - o ~ . . - - ~ Z ~ . . . .
-g
Heads mean curv~
"(~
,',4 ,~ ~.2 2;.s H
3<)
FIG. 6. Head's 19 F(H*) and G(H) functions.
14
1 2 -
I 0 -
8 -
6
FIG. 7.
I I I I
0 O
: • I 0 ~' -
• . ~ 1 0 s
I I I I I
6 O 7 O 8 0 9 0 ~ ) 0 % d e g r e e s
Comparison of measured mass flux with that predicted from Head's F vs. H* relation. Cylinder experiments.
i 10
26

contraction__,. screens
ctc ~ - - * - X
glass paper and t r ip wire
4
3
Ps" Pr¢ f 2 rnH3
water I
0
-I
-2
-~" -0.6~5
O
~ f
O
7-.I <]L ol _ ~ R 4
--,~
- , 6
- , 7 --3 I I I I ~' I I I ! I I I I I
O 2 0 4 0 6 0 8 0 IOO 1120 140 I 160 x Inches ~ CONVEX
WALL
FIG. 8. General layout of 90 degree curved duct and wall static-pressure distribution.
2"4 i t ~ I t I / 2"0-
3 inche~. 2 _
(Pu~t°l- Pr¢f)
O ~ - STATION 14
0 .4-
0 ~ " , ' , , ~ o i - 2 0 2 4 6 8 IO 12
mill wa'~r
FIG. 9. Typical measurements of total and static-pressure distributions.
27

2,0
1.6
inches
1'2
H =1'33
potentiol flow v~1ocit distribution
EQN. 7
= 2980
0.8 0
5000-
RO 4000 -
3000"
2000-
I000-
0
0-4
0 l 0
FIO. 10.
0 0 0
o
o
o
o o
o
0 2 0 .4 0-6 0.8 1.0
U/U ITIQX
Typical velocity profile (derived from data of Figure 9).
I I I I I t I I l I
FLAT I~,~ -SURFACE. = CONVEX WALL
13 14 15 -I,6
-1"5
o
• - ~ . _ ~
I
o l~ 2b 30 1o so ~ 76 8b 9'0 J6o (X-Xo) inch~s
FIG. 11. H and R o developments for 90 degree curved duct.
-1"4 H
-13
-I'2
-I'I
I'0
28
bO
I
0 . 1 ( ~ OOoo - -v,~l l
static
O ,,
0.1 OOoo
0
0.1
0
0-1
(p~- p)
0'1
0
0"1
0
05
0 0
I I I I . . . . . I
STATION 16 O o
O o O
O
15 0000
O
14 O C ~ O O O O
o 8
o L
o 8
° o~ o
of 0
0 0
0
0 0
0 0
0 0
~° ° o d~o o o 8
o ol
12 °°°o o o o °
0 o g
o~
II 0 0 0 0 0 0 0 0
O O
O O
O O
O O
0 f o o o ~ o o
o IO 8
Oooo o o o o o 2~ 4 I I Q 0 0 0
0'4 O~ 1"2 1"6 inches
FIG. 12. Static-pressure variation convex wall, 90 degree curved duct.
1"5
I'0
arbitrary hnits
0.5
O
I I l a i l - F L A T SURFACE -- -~CONVEX WALL--~
measured l / / ° ' + + ' ~ ~ " ~ - ~
I 6 "'%ou 2, -'-'P__a ~ z k. e
/ - ' ~ e x t rapolated -.at" I I I I 1 I
50 60 70 80 90 I00
(x-xo) inches
14
13
m~ II wc.t.er
1o
IIO
FIG. 13. Evaluation of static-pressure variation term in equation (10).

o
O O O O O O 0.2 O.4 0-6 O'8
2 . C -
inch¢s
1-6-
i . 2 -
0 " 8 -
0 4 -
0 0
I 0-2
STATION I!
(
0
0
0
0
0
0
0
O
O
O O
oO 0 O
O C t , , ® ® o O ~,
0 .4 0-6 0"8
4
12 L3
G @
O C Q O
® 0
@
O
O
O
14
4
C ©
O
®
® 0 0
@ 0 ®
0 0 0
I, o - 0 0 C
o~1 o / o O ooO .,~oo -o@ ~oo¢
• 0 I-0 I ' 0 I -0
15 c
I0 0
0 Q
0 ®
O, ®
0 Q
0 Q ®
Q ®
I'O co&
I-O
G
O G
@
O
_]
I-O
fco FIG. 14. Profi les o ~ on the 90 degree convex wall.

T~ .q"
5 ~
©
> T
v
• 0 0 8 -
®
,O07 -
,006 -
' 0 0 5
,OO4
,OO3
,OO2
'OOI
0
(~-~u) radians • 0 .25 "50 "75 bOO 1.25
I i I i I I
equa t ion (14 ) \ .--
measured ®
+ -P 4- + q- .+ II 12 13 14 15 16
s ta t ion s
. m~sured / -
- ' 0 0 7
I I I I 1 I , 006 O 6 12 18 24 30
[ x -X l j ) inches
'009
"00~
FIG. 15. O and A* developments on the 90 degree convex wall.
~V < 3 '
\
FIG. 16. Co-ordinate system and notation.

R. & M, No. 3599
(C) Crown copyright 1969
Published by HER MAJESTY'S STATIONERY OFFICE
To be purchased from 49 High Holborn, London w.c.l
13A Castle Street, Edinburgh EH2 3AR 109 St. Mary Street, Cardiff CFI 1JW
Brazennose Street, Manchester M60 8AS 50 Fairfa× Street, Bristol 8sl 3DE 258 Broad Street, Birmingham 1
7 Linenhail Street, Belfast BT2 8A',' or through any bookseller
R. & M° No. 3599
SBN 11 470200 4