the end of the beginning - cbre
TRANSCRIPT

The End of the BeginningN O R T H A M E R I C A F L E X I B L E O F F I C E M A R K E T I N 2 0 2 0

The flexible office industry is withstanding its greatest challenge and adapting to meet new office requirements.
Flexible office space is no longer seen as a niche sector but as a strategic solution for a broad range of companies. As this shift begins to unfold, certain structural changes in the way flexibility is being delivered to the market are underway. Strong players and alliances between flexible office operators and building
owners are emerging, new markets are being explored and new business models are being developed to engage office users. The upheaval that has defined 2020 will lead to the evolution of the flexible office industry to a more mature state in the years to come.
2 North America Flexible Office Market in 2020

Figure 1: Total Flexible Office Inventory (U.S. & Canada)
100
60
20
80
40
0
90
50
10
70
30
Downtown SuburbanInventory (MSF)
H1 2010 H1 2014H1 2012 H1 2016 H1 2019H1 2011 H1 2015 H1 2018H1 2013 H1 2017 H1 2020
Source: CBRE Research, Q2 2020.Note: CBRE tracks flexible office space in 49 markets (U.S. & Canada).
3© 2020 CBRE, Inc.

Executive Summary
Positive Demand OutlookLike the overall office market, demand for flexible office space has been challenged in the near term. The long-term outlook is positive when tenants return to the workplace.
Moderating GrowthAnnual supply growth of flexible office space slowed to just 7% for the year ending in Q2 2020. Rightsizing efforts are ongoing. However, in the first half of 2020, only 1% of flex space was closed from an operational standpoint.
Acceleration of Partnerships Landlords and flex providers are working together in a more transparent way this year to support their viability during the COVID-induced market downturn. These relationships are increasingly moving toward partnership agreements and away from traditional lease structures.
4 North America Flexible Office Market in 2020

Mainstream AdoptionOccupier sentiment toward agile real estate solutions is strong, as evidenced by a recent CBRE occupier survey in which 86% of respondents see flexible office space as a key component of their future real estate strategies.
Evolving ModelsFlexible office providers are evolving their business models to meet current and future demand. Interest is growing in subscription-based models that support a more distributed network of people and suite offerings to promote privacy over community.
Competition from LandlordsBuilding owners are increasingly offering their own flexible office options in the form of owner-operated space or pre-built suites, sometimes using flexible office providers to operate the space on their behalf.
5© 2020 CBRE, Inc.

Contents
08 Initial impacts of the COVID-induced recession24 Expected demand increase from enterprise tenants29 Evolution of flexible office space models38 Landlords playing a more prominent role 46 Conclusion51 Individual market profiles
6 North America Flexible Office Market in 2020

7© 2020 CBRE, Inc.

Initial impacts of the COVID-induced recession As flexible office space grew over the past decade, the biggest cause for concern was what would happen during a recession.
We now have this experience. During the recession, and with the pandemic exacerbating the operational challenges in many locations, evidence has emerged of flexible office providers’ resiliency. The following six key emerging trends are positive indicators for the future of the flexible office market environment.
8 North America Flexible Office Market in 2020

9© 2020 CBRE, Inc.

1/ Strong Activity PipelineIn the short-term, flexible office membership has been negatively impacted as individuals revert to work-from-home options. But activity pipelines, especially from enterprise tenants, give reason for optimism.
Demand for flexible office space has fallen off this year as more people work remotely and are reluctant to return to office settings due to health concerns. However, the pipeline for future leasing activity is encouraging, especially from enterprise tenants—traditional corporate office users as opposed to just startup companies and entrepreneurs.
Inquiries, occupancy and membership all fell significantly for flexible office providers in the months following the first round of pandemic lockdowns. Initially, it was government restrictions that hampered access to the physical space. Since those restrictions have eased, the reluctance of individuals to return until the pandemic is under control has prolonged the challenges.
As with the overall real estate recovery efforts, not all markets and submarkets perform equally. Suburban locations have fared better than urban ones. For example, monthly key swipes in suburban office buildings are averaging 33% vs. 12% in Manhattan office buildings, although both are increasing.
Inquiry levels for flexible office space have recently ticked up. There is anecdotal evidence of workers who don’t yet have access to company offices using flex locations for distraction-free workspace away from their homes. Additionally, enterprise tenants are exploring new ways to fulfill their space requirements in an uncertain environment. As a result, flexible office leasing is expected to increase next year once COVID transmission moderates.
China provides an example of what the future may hold for the U.S. flex office market. Major flex provider WeWork had consistently falling membership visits in China until the pandemic was controlled there. Since then, WeWork’s Chinese member visits have increased. Flex office membership visits in North America and EMEA remain substantially lower than they were before the pandemic, but both have improved over the past few months and will continue to improve as the pandemic is controlled.
10 North America Flexible Office Market in 2020
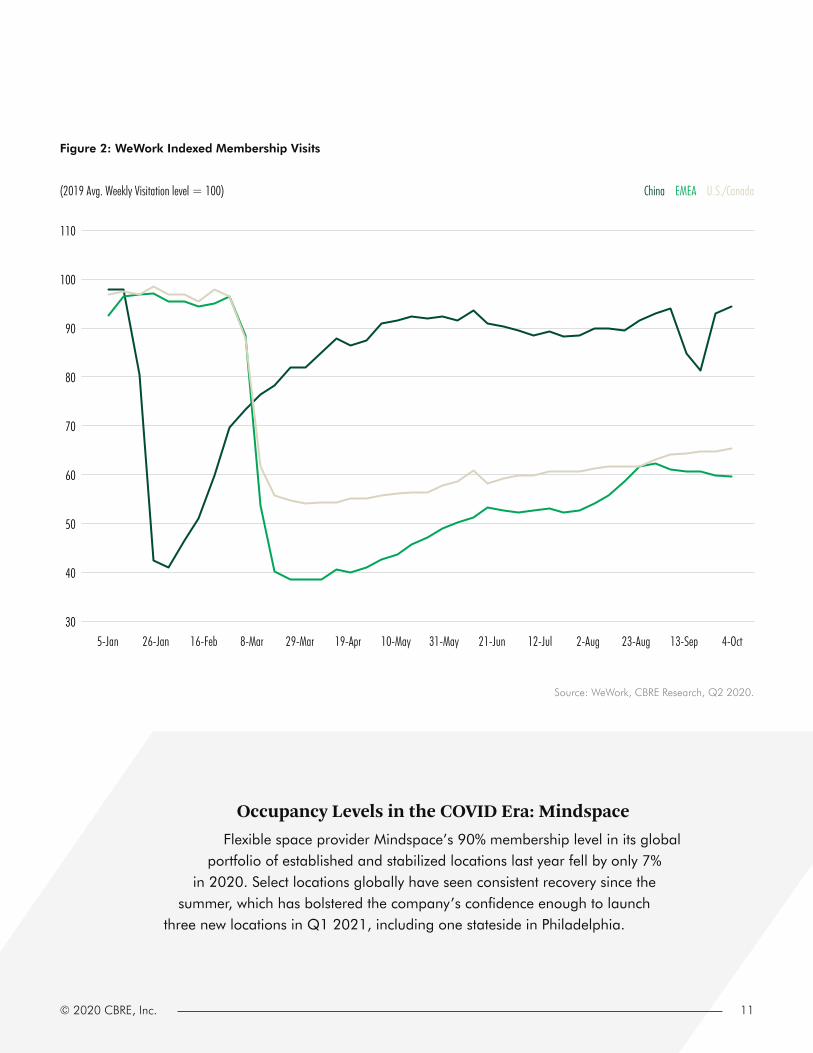
Figure 2: WeWork Indexed Membership Visits
110
60
80
40
30
90
100
50
70
China EMEA U.S./Canada(2019 Avg. Weekly Visitation level = 100)
5-Jan 29-Mar16-Feb 10-May 12-Jul 13-Sep26-Jan 19-Apr 21-Jun 23-Aug8-Mar 31-May 2-Aug 4-Oct
Source: WeWork, CBRE Research, Q2 2020.
Occupancy Levels in the COVID Era: MindspaceFlexible space provider Mindspace’s 90% membership level in its global
portfolio of established and stabilized locations last year fell by only 7% in 2020. Select locations globally have seen consistent recovery since the
summer, which has bolstered the company’s confidence enough to launch three new locations in Q1 2021, including one stateside in Philadelphia.
11© 2020 CBRE, Inc.

12 North America Flexible Office Market in 2020

2/ Pent-up Demand BuildingEnterprise tenants are executing short-term lease renewals and space reductions as future headcount requirements remain uncertain. When demand picks up, flexible office space is expected to be a key component of new requirements.
In a recessionary environment, tenant behavior becomes more cautious, especially one like today where the dependence on office is being challenged. Overall office metrics to date are highlighting the uncertainty in the market. Leasing activity fell by 45% year-over-year and the share of renewals increased significantly in Q2 2020. The overall term of space renewals was 8.2% less than a year ago. Additionally, many tenants placed their excess space on the sublease market. All this signals that occupiers are lowering their traditional lease liabilities as they wait to see what the future holds.
Once tenant demand returns, flexible space will be a viable option that was not available during the recovery period of the Global Financial Crisis. The structural shift toward a more fluid workforce, which is less dependent on any one physical location, is making more agile real estate options top of mind
for occupiers today. The availability of options today along with a structural shift in tenant behavior likely will be a tailwind for flexible office space in the future.
Figure 3: Change in Key Office Metrics from Q2 2019 to Q2 2020
Decline in renewal term length since mid-2019
Increase in sublease space since March 2020
Decline in leasing since mid 2019-45.0%
-8.2%41.0%
Source: CBRE Research, Q2 2020.
13© 2020 CBRE, Inc.

3/ Greater TransparencyBuilding owners and flexible office providers are working together in a more transparent way to support their viability during the COVID-induced market downturn.
Flexible office space operators increased their leasing activity during the recent expansion cycle as rents marched higher. As such, many operators executed leases at rents near the cycle high and are now often burdened with above-market rents. Additionally, flexible office providers are struggling with lower revenues and the complexity and expense of making their environments safe to reenter amid the pandemic. Combined, this is creating a financial burden for some providers.
Some landlords offered rent abatements and deferrals in the early days of the pandemic to help their flex office tenants avoid permanent closure. But rent relief measures have since moderated as landlords focus on keeping existing tenancy amid rising vacancies and less demand. Although the flexible space market is under pressure today, many still believe in its staying power. Landlords and flex providers are now working together in a more transparent way to identify creative structures that ensure their mutual viability.
14 North America Flexible Office Market in 2020

Figure 4: Rent Cycle & Flex Office Expansion
140 8
105 -6
115 -2
95 -10
90 -12
120 0
125 2
130 4
135 6
100 -8
110 -4
Class A Rent Index (L) Y-o-Y Class A Rent Growth (R) Period of Flexible Office ExpansionClass A Rent Index (2009 = 100) Class A Rent Growth (%)
2009 20132011 2015 20182010 2014 2017 20202012 2016 2019
Source: CBRE Research, CBRE EA, Q3 2020.
15© 2020 CBRE, Inc.

4/ Partnership Agreements AcceleratingEvolved thinking is leading to variation on partnership agreements between landlords and providers that are more sustainable today and in the future.
16 North America Flexible Office Market in 2020

creating an environment where creative agreements are on the table.
Flex provider Industrious, which has not signed a lease since 2017, estimates that 75% of its portfolio will consist of landlord partnership agreements by the end of 2020. The company recently announced a deal with EQ Office for 52,000 sq. ft. in Chicago’s Willis Tower. Similarly, all of flex provider Premier Workspaces’ newly committed space in 2019 was a mix of landlord partnership arrangements. These agreements allow flex providers to engage with the marketplace in a more sustainable way and allow landlords to share in the revenue as demand begins to stabilize and grow.
Landlords are beginning to move away from traditional lease structures and toward partnership agreements with their flex office providers in which they share in profits, losses and capital expenditures. These agreements range from a simple revenue-sharing model that resembles a retail lease to a pure management fee for the provider to operate the space on behalf of the landlord. This is an acceleration of a trend that was already occurring in the market. Flex providers are finding that the traditional lease model is unsustainable, especially in the current environment, while landlords are realizing flex options will be in even more demand by tenants in the future. This convergence of enlightenment is
Figure 5: Industrious Annual Space Commitments by Type
1.6
0.8
1.2
0.4
0.0
1.4
0.6
1.0
0.2
Traditional Lease Management Agreement(MSF)
2013 20172015 20192014 20182016
Source: Industrious, H1 2020.
17© 2020 CBRE, Inc.

5/ Rightsizing Efforts UnderwayAlthough some flex providers are undertaking strategic expansions, many are in the process of rightsizing their portfolios.
Current market conditions are making some operations unsustainable, but the industry has remained relatively resilient. The nation’s total flex office inventory was reduced by only about 1% in H1 2020, primarily by the largest flex operators in select underperforming locations. WeWork and IWG, which account for more than 50% of total U.S. flex office inventory, are both reducing their global footprints. WeWork plans to reduce its 840 global locations by about 4-5% this year. Additionally, almost 100 entities associated with IWG’s Regus and Spaces brands have filed for Chapter 11 bankruptcy this year. As a result, the company has indicated that up to 4% of its global portfolio could close.
Many of these large providers have leases structured under special purpose entities that allow them
to close individual locations without risking the remaining portfolio. Other smaller providers have been harder hit during the pandemic, such as Riveter’s cessation of business operations in May and Servcorp’s closure of half its locations in July.
In the longer-term, it is likely that more closures will occur as government assistance wanes, membership demand regulates and flexibility gets delivered in more competitive ways. Although all operators have reason for duress under the current environment, the 32% of the market made up of small local or regional players is especially important to monitor as members of this type of space may revert in the mid-term to work-from-home arrangements. Given the pandemic-led recession, the limited supply closure activity is painting quite a resilient picture.
18 North America Flexible Office Market in 2020
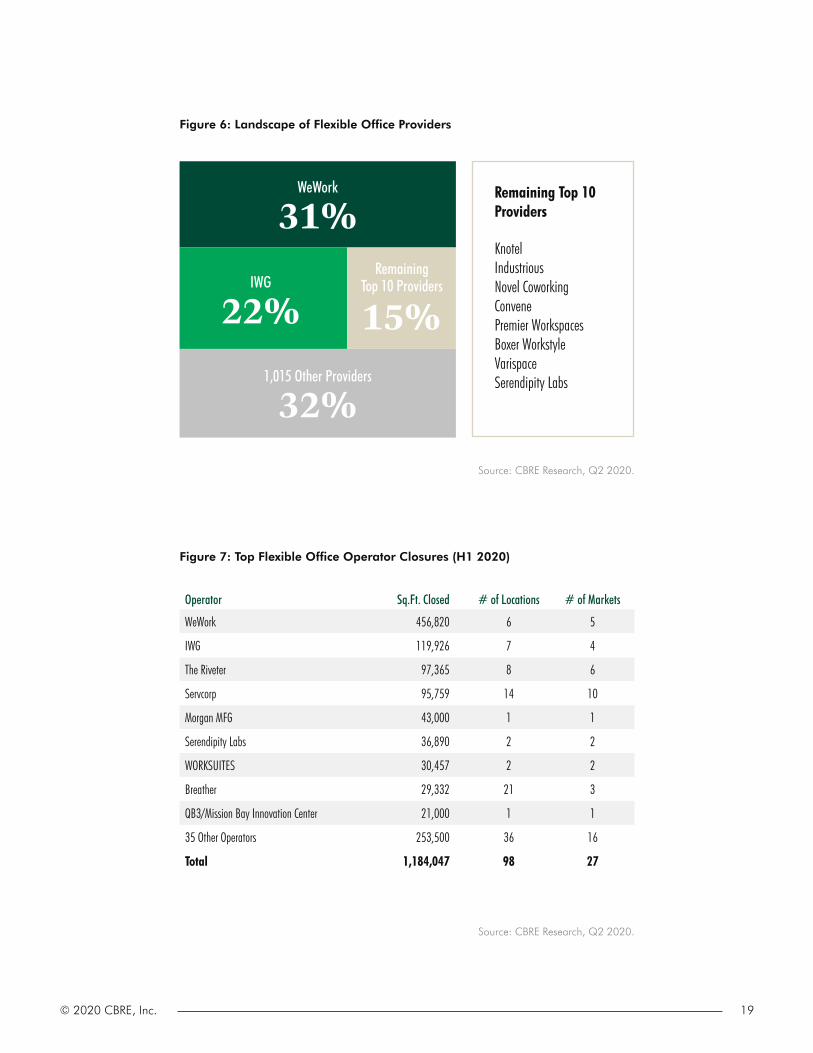
Figure 7: Top Flexible Office Operator Closures (H1 2020)
Operator Sq.Ft. Closed # of Locations # of Markets
WeWork 456,820 6 5
IWG 119,926 7 4
The Riveter 97,365 8 6
Servcorp 95,759 14 10
Morgan MFG 43,000 1 1
Serendipity Labs 36,890 2 2
WORKSUITES 30,457 2 2
Breather 29,332 21 3
QB3/Mission Bay Innovation Center 21,000 1 1
35 Other Operators 253,500 36 16
Total 1,184,047 98 27
Source: CBRE Research, Q2 2020.
Figure 6: Landscape of Flexible Office Providers
Source: CBRE Research, Q2 2020.
WeWork
31%
1,015 Other Providers
32%
IWG
22%Remaining
Top 10 Providers
15%
Remaining Top 10 Providers
KnotelIndustriousNovel CoworkingConvenePremier Workspaces Boxer WorkstyleVarispaceSerendipity Labs
19© 2020 CBRE, Inc.

20 North America Flexible Office Market in 2020

6/ Supply Growth SlowsExpansion by flexible office providers has slowed as they focus on sustaining operations in existing locations and increasing their strategic partnership agreements.
U.S. office market fundamentals have deteriorated from the impacts of the COVID-19 pandemic and subsequent recession. As of mid-2020, new office leasing activity was down 35% year-over-year, driven by occupier uncertainty about the future use of office space. New leasing by flexible space providers also has dropped as providers are more cautious about expanding portfolios in an uncertain environment.
Flexible office supply growth slowed to 7% year-over-year in Q2 from a peak of 41% in the same period a year ago. This slowdown began after WeWork’s
unsuccessful IPO in Q3 2019 and accelerated once COVID-related government restrictions were imposed in late March. Muted supply growth is a positive indicator that, at least for now, the industry is remaining resilient during this period.
Only 3% of the 8.5 million sq. ft. of gross flexible office supply added over the past year was delivered in Q2 2020. Assuming there are no additional large-scale closures, the annualized growth rate of flex office supply as of Q2 would be 1.1% as flex providers focus on profitability rather than expansion.
21© 2020 CBRE, Inc.

Figure 8: Flexible Office Supply Growth (U.S. & Canada)
H1 2011
19.3%
24.1%26.0% 25.3%
26.7%
32.1%
41.2%
7.3%
28.2% 28.4%
H1 2015 H1 2018H1 2013 H1 2017 H1 2020H1 2012 H1 2016 H1 2019H1 2014
Note: Represents annualized growth. Source: CBRE Research, Q2 2020.
45%
25%
35%
15%
5%
40%
20%
30%
10%
0%
22 North America Flexible Office Market in 2020

Figure 9: Historical Gross Flex Office Space Additions
Q2 2018
3.2 MSF
5.8 MSF 5.8 MSF
4.9 MSF
6.4 MSF
6.8 MSF
Q2 2019 Q1 2020Q4 2018 Q4 2019Q3 2018 Q3 2019 Q2 2020Q1 2019
Source: CBRE Research, 2020.
2.1 MSF
1.3 MSF
0.2 MSF
23© 2020 CBRE, Inc.
Expected demand increase from enterprise tenants CBRE’s September 2020 Occupier Sentiment Survey reveals that occupiers anticipate more use of flexible office space as they integrate agile strategies into their portfolio planning.
The need for agility by traditional enterprise tenants stems from continued economic uncertainty and new workforce behaviors. COVID-19 has accelerated many trends, the most transformational of which may be employee work patterns. Choice, mobility and autonomy are words that describe workstyles in the future. As the role of the office evolves, so too will its design, location and utilization. Flexible office space is poised to play a significant role in this evolution as it allows enterprise occupiers to better balance supply and demand in the future. The reasons for engaging with flex space are also evolving from ones that were focused on simply exploring the concept to ones that are more sophisticated, indicating that a more programmatic approach to using flex in real estate planning is underway.
24 North America Flexible Office Market in 2020

25© 2020 CBRE, Inc.

“Companies are planning to experiment much more broadly with using workplace-as-a-service in 2021. The question is: How will they feel about the outcome of that experiment? If companies feel they get an adequate workplace outcome, flex will continue to grow at a healthy clip. But if they feel the outcome was not just adequate, but better than traditional modes of occupancy, it will transform commercial real estate faster than anyone expects.”
O N W O R K P L A C E A S A S E R V I C E
JAMIE HODARICEO, INDUSTRIOUS
26 North America Flexible Office Market in 2020

Figure 10: What role will flexible office play in your long-term real estate strategy?
Source: 2020 Global Occupier Sentiment Survey, CBRE Research, September 2020.
Significant role Significant role
Some kind of role Some kind of role73%23%
86%36%
JUNE SEPTEMBER
Figure 11: Main reasons for use of a flexible office space
Source: 2020 Global Occupier Sentiment Survey, CBRE Research, September 2020.
Provide a network of locations for more mobile workforce access
Test of alternate workspace or occupancy models
Short-term space solution for temporary dispersed workforce
Access new services or amenities
Enter a new market(s)
Swing space while leased space is under construction
Reduce capital expenditure
Access more modern workplace design
Other
45.5%
43.9%
42.4%
40.9%
37.9%
25.8%
9.1%
7.6%
6.1%
27© 2020 CBRE, Inc.

28 North America Flexible Office Market in 2020

Evolution of flexible office models Many flexible office providers are evolving their models and diversifying their products to meet new demands on an individual, local, regional, national and even global scale. CBRE has identified the following three key strategies to attract new occupiers.
“With real estate and workplace choices now in the hands of individual employees, commercial real estate planning becomes
increasingly difficult. Flexible office solutions allow for a faster and more
efficient matching process between varying employees needs and space.”
CHRISTELLE BRONAMERICAS AGILE PRACTICE LEADER
CBRE
29© 2020 CBRE, Inc.

1/ On-Demand & Subscription-based Membership StructuresMany regional and national flex office providers are offering on-demand “pay-by-use” memberships or subscription-based services.
Examples include WeWork’s All-Access plan, Oasis by Industrious and IWG’s mobility program that offer their members access to the full network of locations in an efficient cost-effective way. These are highly configurable models that allow providers to
flex their supply of real estate with real-time demand and manage it using technology-driven apps and dashboards. This emerging model gives providers more flexibility as workers return to the office.
30 North America Flexible Office Market in 2020

31© 2020 CBRE, Inc.

Long-Term Distributed Workforce: The trend toward a more distributed workforce is placing less dependence on centralized hubs and more reliance on a larger network of spaces to get work done. While urban-core locations still play an important role, they will be only part of a larger ecosystem of locations. Flexible office space will be one component of this ecosystem and will offer a ready-made network of locations from which employees can work and seamlessly access through mobile technology. While not all categories of employees may benefit from this, those that have more mobile profiles could achieve productivity gains from accessing this type of space structure depending on location.
Other concerns that these emerging membership services can help address include:
Near-Term Dedensification: As companies gradually reopen their workplaces, social distancing guidelines are restricting office capacities. Although remote working has been a viable solution for many, there are increased reports that social isolation, home distractions and imbalance between personal and professional life are affecting employee engagement. Offering a network of locations to supplement reduced office capacity can help companies prioritize employee health & well-being.
Distributed Workforce in the Real World: DropboxDropbox recently announced its plan to become a “virtual first” company,
an approach that provides the increased flexibility of working in distributed teams while maintaining meaningful access to in-person engagement.
Dropbox employees will be able to work from anywhere, including a network of leased Dropbox offices, flex office suites, private offices and
meeting & training rooms on demand. The physical spaces, called Dropbox Studios, will be hubs to spark creativity, build community and maintain
company culture. However, these workplaces will not be used for daily individual work.
By balancing the flexibility and freedom of remote work while also retaining in-person engagement, Dropbox hopes it will gain the best of both worlds
and see clear long-term benefits.
32 North America Flexible Office Market in 2020

preferred suburban locations in the past, in recent years it has expanded heavily in downtown areas, mostly through its Spaces brand. Likewise, WeWork primarily located in downtown locations expanding to suburban locations beginning in 2017. Knotel has recently announced plans for space in select suburban locations in New York and San Francisco.
The good news for occupiers is that there are options from providers of all types in all kinds of locations. Even among the 10 largest operators, while there is a clear preference to be in Class A space, many also have suburban locations. IWG, the second largest flexible office operator, is almost equally weighted between downtown and suburban locations. While IWG (best known for its Regus brand) has
Figure 12: Largest Flexible Office Operators Composition
Convene
WeWork
KnotelNovel Coworking
Boxer Workstyle Executive Suites
Premier WorkspacesVarispace
IWGSerendipity Labs
Industrious
Class A Class B/C
Subu
rban
Down
town
Source: CBRE Research, Q2 2020.
33© 2020 CBRE, Inc.

2/ Integrated Enterprise Solutions Some flexible office providers are bundling all the elements of real estate planning and execution in one place to make the process more efficient and effective.
This reduces capital outlay for occupiers and allows them to capitalize on efficiencies of scale from flex providers. This solution is typically best for larger teams that have a mid-term requirement for a single-market location, privacy and potentially some level of customization to reflect branding. These requirements can be met through tailored workspace services such as Geometry (Knotel), Canvas (Industrious), Spaces
(IWG), Teams (Hana) and Headquarters (WeWork). Occupiers may be interested in this strategy as they look to open individual offices in a more efficient way. The number of leases of less than 75,000 sq. ft. have been declining and are at historically low levels, signaling a desire for this size space requirement to be satisfied in other ways once demand returns.
34 North America Flexible Office Market in 2020

Integrating Flexible Solutions in Overall Strategy:
The Lily Pad ApproachA fast-growing San Francisco Bay Area tech company was finding it
difficult to develop a long-term real estate strategy and stick to it. It ultimately adopted what CBRE terms the “lily pad approach,” which
incorporates flexible office space to support hyper-growth until sufficient scale is reached to justify a long-term lease. In line with the tech industry
philosophy of “build fast, fail fast,” the lily pad approach allowed this occupier to enter new markets quickly and tap into new talent pools.
By using this type of standardized and programmatic approach to integrating flexible solutions into its portfolio, this company has
maintained an agile and stable growth strategy.
35© 2020 CBRE, Inc.

3/ Private Suite OfferingsMany flexible office providers are offering more private suite solutions vs. pure coworking space to enterprise tenants that desire privacy and security over community.
As with integrated enterprise solutions, this reduces capital outlay and allows occupiers to capitalize on efficiencies of scale and to access shared conference, lobby and social spaces. Although customization is limited, terms are more flexible and the ability to flex space requirements is more easily attained as this type of space is usually easy to reconfigure.
36 North America Flexible Office Market in 2020

37© 2020 CBRE, Inc.

Landlords playing a more prominent roleOffice occupiers are increasingly considering flexible space solutions as part of their long-term real estate strategies.
Landlords are responding with their own flex offerings, ranging from on-demand coworking options to turnkey solutions. These offerings are becoming part of an integrated suite of solutions that progressive landlords are building into their portfolios to engage and attract tenants. This is challenging the precedent of the last decade where flexible space options were delivered by third-party providers often under scrutiny by the landlords that engaged with them.
38 North America Flexible Office Market in 2020

39© 2020 CBRE, Inc.

Figure 13: What are the most desired building attributes by tenants in the future?
Source: 2020 Global Occupier Sentiment Survey, CBRE Research, September 2020.
Flexible office space options
Sustainable building design
Indoor air quality
Onsite café food and beverage
Shared meeting space
Touchless technologies
Connected technologies/Building apps
Public transportation access
Fitness facilities
Outdoor amenities
Concierge services
82.0%
74.0%
68.0%
62.0%
52.0%
51.0%
48.0%
33.0%
27.0%
22.0%
18.0%
40 North America Flexible Office Market in 2020

Although speculative office suites are often offered for shorter traditional lease terms, they satisfy the speed to market and capital expense savings that many occupiers desire. Manhattan, the birthplace of coworking and the most prominent flexible space market, offers a good example of what the future may hold for this product type. Spec suite growth in Manhattan has hovered around 90% to 100%
annually over the past few years and nearly 90 building owners now offer a combined total of more than 300 spec suite spaces. Amid the COVID-19 pandemic, only 48% of this square footage is currently occupied. As companies begin to develop business plans for 2021, spec suites could offer many of them a ready-made alternative to renewing in place with traditional space.
Figure 14: Manhattan Spec Suite Footprint
3.0
1.0
2.0
0.0
2.5
0.5
1.5
Total Spec Suite Footprint New Spec Suite Listing(MSF)
2014 201820162015 20192017 2020*
*Represents 2020 through Q2.Source: CBRE Research, Q2 2020.
2.57
1.33
0.68
0.310.230.120.06
41© 2020 CBRE, Inc.

THAIS GALLIMANAGING DIRECTOR, INNOVATION
TISHMAN SPEYER (STUDIO)
“Tishman Speyer is driven by the goal to offer best-in-class spaces, services and experiences to our customers, independently of what their needs are. For that reason, we believe that the future of the workspace will be more flexible and with greater focus on the workspace experience, something that cannot be replicated at home, which has driven us to be the first landlord to launch its own global flex platform.”
42 North America Flexible Office Market in 2020

A Traditional Owner’s Commitment to Flex
Tishman Speyer was one of the first traditional office owners to offer coworking and private office space when it launched its Studio brand in
2018. Studio now operates 500,000 sq. ft. of flexible office space in 10 Tishman Speyer buildings across seven markets.
Even amid the COVID pandemic, Tishman Speyer plans to open an additional 700,000 sq. ft. of flexible space over the next two years in the
U.S., Brazil and Western Europe. The company estimates that as much as 20% of its overall portfolio could be flexible in nature over the next
10 years. This would entail not only retail coworking space and private offices, but also more flexible terms for traditional occupiers.
43© 2020 CBRE, Inc.
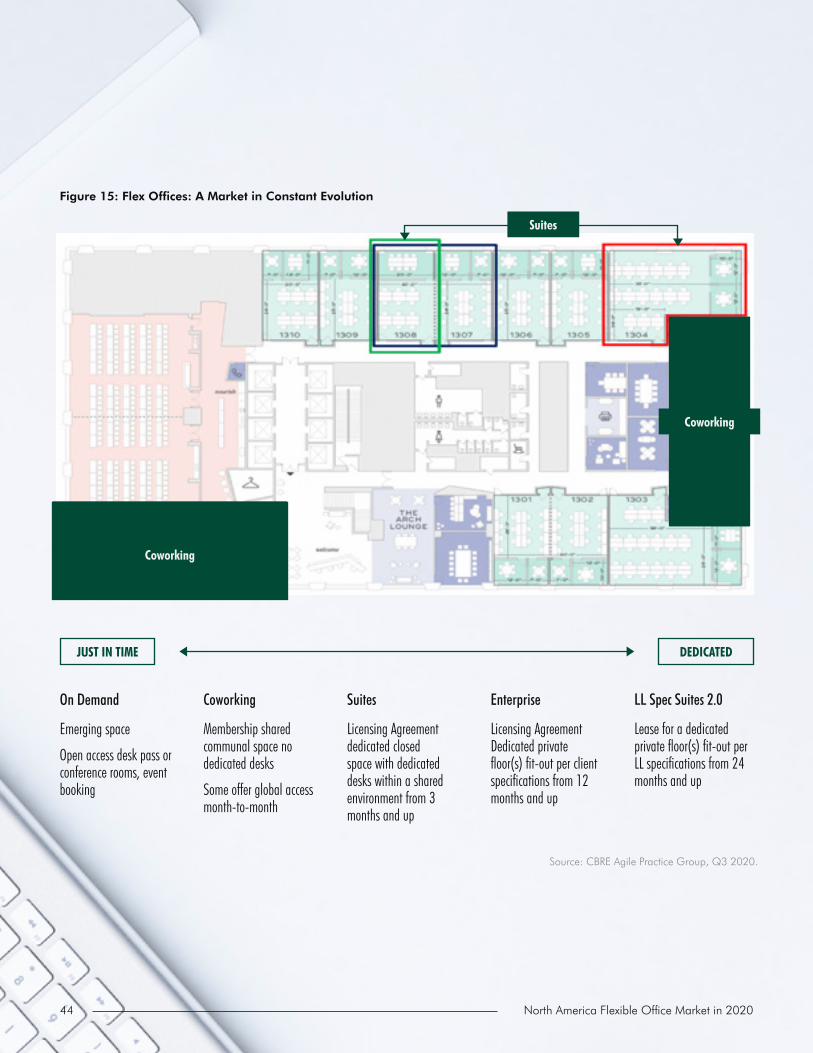
Figure 15: Flex Offices: A Market in Constant Evolution
Source: CBRE Agile Practice Group, Q3 2020.
Coworking
Coworking
Suites
JUST IN TIME DEDICATED
On Demand
Emerging space
Open access desk pass or conference rooms, event booking
Coworking
Membership shared communal space no dedicated desks
Some offer global access month-to-month
Suites
Licensing Agreement dedicated closed space with dedicated desks within a shared environment from 3 months and up
Enterprise
Licensing Agreement Dedicated private floor(s) fit-out per client specifications from 12 months and up
LL Spec Suites 2.0
Lease for a dedicated private floor(s) fit-out per LL specifications from 24 months and up
44 North America Flexible Office Market in 2020

45© 2020 CBRE, Inc.

ConclusionThe flexible office industry is facing the dual challenge of a recession and a pandemic that is hindering use of its product.
Even in the face of these obstacles, industry leaders remain optimistic about the viability of flex solutions for enterprise office occupiers. Flexible space ultimately will become an integral part of office buildings and a sought-after solution for the enterprise tenants that occupy them. Following are the biggest trends that will drive change in the flexible office landscape next year:
46 North America Flexible Office Market in 2020

47© 2020 CBRE, Inc.

1. “Consumerization,” fueled by a rise in digital real estate: 2021 will mark a new era in which employee or “consumer” wants or preferences influence office requirements. One of the ways consumers will impact real estate decisions is by using consumer-oriented digital real estate tools like concierge apps that connect employees to amenities and communities.
2. Occupiers adopting Core + Flex models: Post- pandemic, companies will place increased value on flexibility in their real estate portfolios. As a result, companies will seek to bring employees back to the office while avoiding large capital commitments. They also will look for ways to create more flexibility within their long-term commitments, including mixing conventional and flex leases within the same building.
3. The rise of management agreements and revenue-sharing structures: The global pandemic’s pervasive and unpredictable impact highlights the value of flexible space as an asset class. As a result, flex providers and landlords will increasingly coalesce around capital-light deal structures with landlords, including management agreements, that offer higher returns for owners with limited capital commitment from operators.
4. Hybrid models driven by cost savings: Global occupiers will increasingly realize that incorporating flexible space in their real estate portfolios can result in significant cost savings. Their focus will shift to finding the right balance of agile and long-term commitments to cut costs while maximizing productivity. This will give rise to a new, dominant hybrid workforce model that includes concepts such as hub-and-spoke, on-demand coworking and project offices.
5. An emphasis on health, safety and community: Flex operators have adopted a range of best practices to mitigate COVID and promote well-being in their facilities. They will continue to focus on both virtual and in-person community events that foster collaboration and set them apart from other office providers.
6. The expansion of flex space into more asset types: Coworking and shared-office concepts will become more prevalent in diverse asset types, such as industrial, labs, studios and retail. Emerging players like Saltbox, Peerspace, Ghost Kitchens and others are early manifestations of this trend.
The flexible office industry’s many challenges this year are giving way to opportunities in 2021. The way in which occupiers use flexible space continues to evolve and will be the impetus for demand over the long-term. The industry is now at the “end of the beginning” and its future looks bright.
48 North America Flexible Office Market in 2020

Figure 16: The Office of the Future
Source: CBRE Research, Q3 2020.
ROOF TERRACE/EVENT SPACE BAR/RESTAURANT
ACTIVATED COMMUNITY AREAS/EVENT SPACES
SHARED FOOD HALL/CONFERENCE AUDITORIUM
CONCIERGE/BIKE STORAGE/GYM & LEISURE FACILITIES
FITTED/SPEC SUITES
CONVENTIONAL FLOORS WITH LONG TERM LEASES
SPACE AS A SERVICE
49© 2020 CBRE, Inc.

50 North America Flexible Office Market in 2020

Individual market profilesATLANTA
LAS VEGAS
PHILADELPHIA
CALGARY
MIAMI
RALEIGH-DURHAM
DETROIT
NORTHERN VIRGINIA
SAN FRANCISCO
TAMPA
WALNUT CREEK/I-680 CORRIDOR
BALTIMORE
MADISON, WI
PITTSBURGH
DALLAS/FT. WORTH
NASHVILLE
SAN ANTONIO
ST. LOUIS
CHICAGO
MINNEAPOLIS/ST. PAUL
SACRAMENTO
SEATTLE
INDIANAPOLIS
ORANGE COUNTY
AUSTIN
LOS ANGELES
PHOENIX
CHARLOTTE
MILWAUKEE
RICHMOND, VA
HOUSTON
OAKLAND
SAN FRANCISCO PENINSULA
TORONTO
WASHINGTON, D.C.
BOSTON
MANHATTAN
PORTLAND
DENVER
NEW JERSEY
SAN DIEGO
SUBURBAN MARYLAND
VANCOUVER
COLUMBUS
MONTREAL
SALT LAKE CITY
SILICON VALLEY
KANSAS CITY
ORLANDO
51© 2020 CBRE, Inc.

FLEXIBLE OFFICE HISTORICAL INVENTORY FLEXIBLE OFFICE INVENTORY – COMPOSITION OVER TIME
LARGEST FLEXIBLE OPERATOR TRANSACTIONS Q3 2019 – Q2 2020
TOP FLEXIBLE SPACE OPERATORS MARKET STATISTICS
H1 2019
H1 2019
H1 2015
H1 2015
H1 2012
H1 2012
H1 2018
H1 2018
H1 2014
H1 2014
H1 2011
H1 2011
H1 2017
H1 2017
H1 2013
H1 2013
H1 2010
H1 2010
H1 2020
H1 2020
H1 2016
H1 2016
Sq. Ft. (%)Downtown (L) Suburban (L) Penetration % (R) Downtown Suburban
3,000,000 100
2,500,000 80
90
2,000,00060
70
1,500,000
40
50
1,000,000
20
30
500,00010
0 0
(%)
2.5
2.0
1.5
1.0
0.5
0.0
APPENDIX HOME
Source: CBRE Research, Q2 2020.
Operator Size (SF) Quarter SubmarketBuilding
ClassSpaces 29,000 Q4 2019 Buckhead A
Total Top Five 29,000
Total Sq. Ft. New Transactions Y-o-Y 29,000
Top 5 as a % of Total 100.0%
Operator Size (SF)Y-o-Y
Growth% of
Market# of
LocationsDominant
SubmarketWeWork 652,543 0.0% 25.2% 14 Midtown
Regus 610,313 -11.6% 23.6% 32 North Fulton
Spaces 328,187 9.7% 12.7% 8 Cumberland/Galleria
Industrious 198,635 0.0% 7.7% 7 Midtown
Peachtree Offices 165,265 0.0% 6.4% 6 Buckhead
Total Top Five 1,954,943 75.4% 67 Top 5 as a % of Total 75.4%
Most Dominant Submarket % of Flex Office Inventory % of Total Y-o-Y TransactionsMidtown 27.7% 0.0%
Low HighSingle Office/Suite Rates $390 $670
Atlanta Q2 2020 Y-o-Y GrowthFlexible Office Sq. Ft. 2,591,083 -2.4%
Downtown Flex Sq. Ft. 1,447,363 -0.1%
Suburban Flex Sq. Ft. 1,143,720 -5.2%
Overall Market Penetration (%) 1.9% -0.1%
Downtown Penetration (%) 2.8% 0.0%
Suburban Penetration (%) 1.3% -0.1%
# of Operators 23 -1
# of Locations 94 -5
Avg. Size of Location Sq. Ft. 27,565
Atlanta
52 North America Flexible Office Market in 2020

FLEXIBLE OFFICE HISTORICAL INVENTORY FLEXIBLE OFFICE INVENTORY – COMPOSITION OVER TIME
LARGEST FLEXIBLE OPERATOR TRANSACTIONS
TOP FLEXIBLE SPACE OPERATORS MARKET STATISTICS
H1 2019
H1 2019
H1 2015
H1 2015
H1 2012
H1 2012
H1 2018
H1 2018
H1 2014
H1 2014
H1 2011
H1 2011
H1 2017
H1 2017
H1 2013
H1 2013
H1 2010
H1 2010
H1 2020
H1 2020
H1 2016
H1 2016
Sq. Ft. (%)Dowtown (L) Suburban (L) Penetration % (R) Dowtown Suburban
100
80
90
60
70
40
50
20
30
10
0
(%)
APPENDIX HOME
Source: CBRE Research, Q2 2020.
Operator Size (SF) Quarter SubmarketBuilding
ClassCommon Desk 12,000 Q4 2019 East B
Novel Coworking 10,000 Q1 2020 North B
Common Desk 8,000 Q2 2020 North B
Common Desk 4,000 Q4 2019 North B
Total Top Five 34,000
Total Sq. Ft. New Transactions Y-o-Y 34,000
Top 5 as a % of Total 100.0%
Operator Size (SF)Y-o-Y
Growth% of
Market# of
LocationsDominant
SubmarketWeWork 433,659 0.0% 35.3% 7 CBD
Regus 267,077 0.0% 21.7% 16 Central
Capital Factory 58,647 0.0% 4.8% 1 CBD
Spaces 53,129 0.0% 4.3% 1 CBD
Industrious 52,714 0.0% 4.3% 3 CBD
Total Top Five 865,226 70.4% 28 Top 5 as a % of Total 70.4%
Most Dominant Submarket % of Flex Office Inventory % of Total Y-o-Y TransactionsCBD 48.9% 0.0%
Low HighSingle Office/Suite Rates $370 $510
Austin Q2 2020 Y-o-Y GrowthFlexible Office Sq. Ft. 1,229,774 -5.4%
Downtown Flex Sq. Ft. 601,832 -4.9%
Suburban Flex Sq. Ft. 627,942 -6.0%
Overall Market Penetration (%) 2.2% -0.3%
Downtown Penetration (%) 5.2% -0.3%
Suburban Penetration (%) 1.4% -0.2%
# of Operators 41 -6
# of Locations 72 -4
Avg. Size of Location (SF) 17,080
3.0
2.5
2.0
1.5
1.0
0.5
0.00
1,400,000
1,200,000
1,000,000
800,000
600,000
200,000
400,000
Austin
53© 2020 CBRE, Inc.
FLEXIBLE OFFICE HISTORICAL INVENTORY FLEXIBLE OFFICE INVENTORY – COMPOSITION OVER TIME
LARGEST FLEXIBLE OPERATOR TRANSACTIONS Q3 2019 – Q2 2020
TOP FLEXIBLE SPACE OPERATORS MARKET STATISTICS
H1 2019
H1 2019
H1 2015
H1 2015
H1 2012
H1 2012
H1 2018
H1 2018
H1 2014
H1 2014
H1 2011
H1 2011
H1 2017
H1 2017
H1 2013
H1 2013
H1 2010
H1 2010
H1 2020
H1 2020
H1 2016
H1 2016
Sq. Ft. (%)Downtown (L) Suburban (L) Penetration % (R) Downtown Suburban
100
80
90
60
70
40
50
20
30
10
0
(%)
APPENDIX HOME
Source: CBRE Research, Q2 2020.
450,000
400,000
350,000
300,000
250,000
200,000
150,000
100,000
50,000
0
0.7
0.6
0.5
0.4
0.3
0.2
0.1
0.0
Operator Size (SF)Y-o-Y
Growth% of
Market# of
LocationsDominant
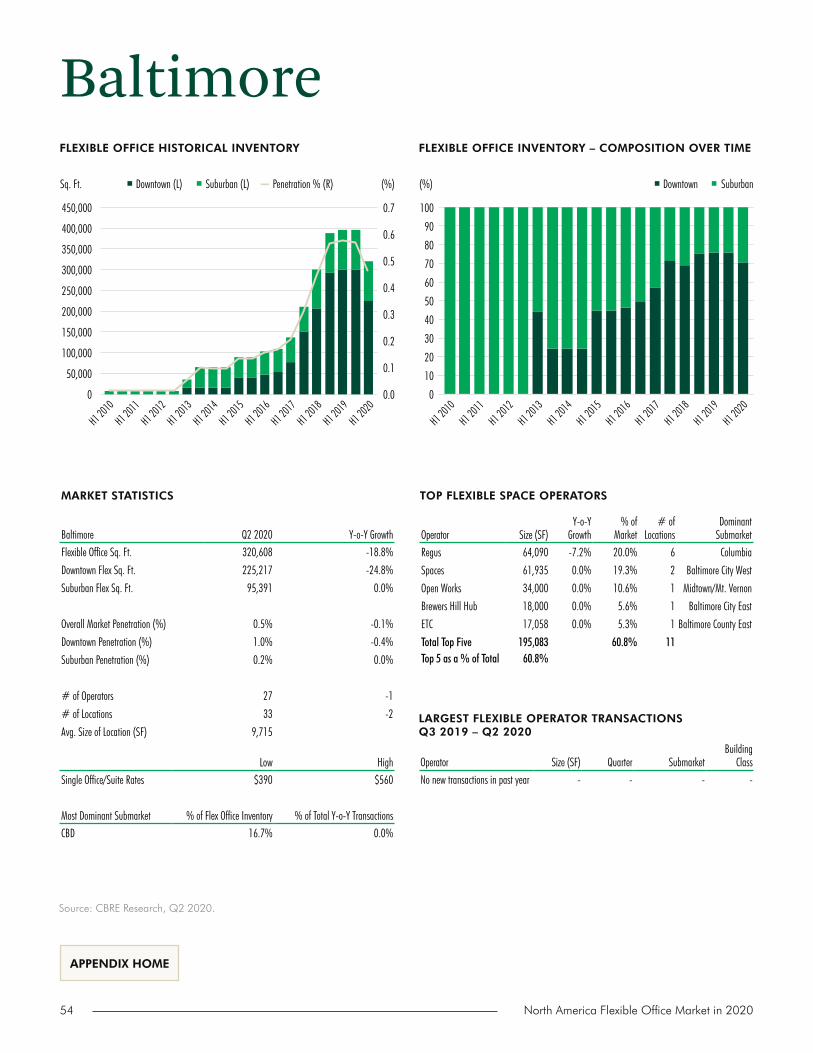
SubmarketRegus 64,090 -7.2% 20.0% 6 Columbia
Spaces 61,935 0.0% 19.3% 2 Baltimore City West
Open Works 34,000 0.0% 10.6% 1 Midtown/Mt. Vernon
Brewers Hill Hub 18,000 0.0% 5.6% 1 Baltimore City East
ETC 17,058 0.0% 5.3% 1 Baltimore County East
Total Top Five 195,083 60.8% 11 Top 5 as a % of Total 60.8%
Operator Size (SF) Quarter SubmarketBuilding
ClassNo new transactions in past year - - - -
Most Dominant Submarket % of Flex Office Inventory % of Total Y-o-Y TransactionsCBD 16.7% 0.0%
Low HighSingle Office/Suite Rates $390 $560
Baltimore Q2 2020 Y-o-Y GrowthFlexible Office Sq. Ft. 320,608 -18.8%
Downtown Flex Sq. Ft. 225,217 -24.8%
Suburban Flex Sq. Ft. 95,391 0.0%
Overall Market Penetration (%) 0.5% -0.1%
Downtown Penetration (%) 1.0% -0.4%
Suburban Penetration (%) 0.2% 0.0%
# of Operators 27 -1
# of Locations 33 -2
Avg. Size of Location (SF) 9,715
Baltimore
54 North America Flexible Office Market in 2020

FLEXIBLE OFFICE HISTORICAL INVENTORY FLEXIBLE OFFICE INVENTORY – COMPOSITION OVER TIME
LARGEST FLEXIBLE OPERATOR TRANSACTIONS
TOP FLEXIBLE SPACE OPERATORS MARKET STATISTICS
H1 2019
H1 2019
H1 2015
H1 2015
H1 2012
H1 2012
H1 2018
H1 2018
H1 2014
H1 2014
H1 2011
H1 2011
H1 2017
H1 2017
H1 2013
H1 2013
H1 2010
H1 2010
H1 2020
H1 2020
H1 2016
H1 2016
Sq. Ft. (%)Dowtown (L) Suburban (L) Penetration % (R) Dowtown Suburban(%)
APPENDIX HOME
Source: CBRE Research, Q2 2020.
Operator Size (SF)Y-o-Y
Growth% of
Market# of
LocationsDominant
SubmarketWeWork 1,649,094 9.2% 41.4% 23 CBD
CIC 348,243 0.0% 8.7% 4 East Cambridge
Regus 328,437 -9.7% 8.2% 15 CBD
Robert and Renee Belfer Office for Dana-Farber Innovations
252,255 0.0% 6.3% 1 Fenway/Kenmore Square
The Engine 224,000 0.0% 5.6% 2 East Cambridge
Total Top Five 2,802,029 70.3% 45 Top 5 as a % of Total 70.3%
Operator Size (SF) Quarter SubmarketBuilding
ClassLabCentral 101,000 Q3 2019 East Cambridge A
WeWork 100,000 Q3 2019 Back Bay B
Knotel 27,000 Q4 2019 North Station/Waterfront B
WeWork 25,000 Q4 2019 Seaport B
Knotel 14,000 Q4 2019 Back Bay B
Total Top Five 266,000
Total Sq. Ft. New Transactions Y-o-Y 286,000
Top 5 as a % of Total 93.0%
Most Dominant Submarket % of Flex Office Inventory % of Total Y-o-Y TransactionsCBD 32.1% 2.1%
Low HighSingle Office/Suite Rates $580 $795
Boston Q2 2020 Y-o-Y GrowthFlexible Office Sq. Ft. 3,984,326 2.7%
Downtown Flex Sq. Ft. 3,854,426 2.8%
Suburban Flex Sq. Ft. 129,900 0.0%
Overall Market Penetration (%) 1.8% 0.1%
Downtown Penetration (%) 4.0% 0.2%
Suburban Penetration (%) 0.1% 0.0%
# of Operators 46 -3
# of Locations 97 0
Avg. Size of Location (SF) 41,076
100
95
85
90
80
75
2.0
1.6
1.2
0.8
0.4
0.0
4,500,000
4,000,000
3,500,000
3,000,000
2,000,000
2,500,000
2,000,000
1,500,000
1,000,000
500,000
0
Boston
55© 2020 CBRE, Inc.

FLEXIBLE OFFICE HISTORICAL INVENTORY FLEXIBLE OFFICE INVENTORY – COMPOSITION OVER TIME
LARGEST FLEXIBLE OPERATOR TRANSACTIONS Q3 2019 – Q2 2020
TOP FLEXIBLE SPACE OPERATORS MARKET STATISTICS
H1 2019
H1 2019
H1 2015
H1 2015
H1 2012
H1 2012
H1 2018
H1 2018
H1 2014
H1 2014
H1 2011
H1 2011
H1 2017
H1 2017
H1 2013
H1 2013
H1 2010
H1 2010
H1 2020
H1 2020
H1 2016
H1 2016
Sq. Ft. (%)Downtown (L) Suburban (L) Penetration % (R) Downtown Suburban
100
80
90
60
70
40
50
20
30
10
0
(%)
APPENDIX HOME
Source: CBRE Research, Q2 2020.
Operator Size (SF) Quarter SubmarketBuilding
ClassiQ Office Suites 25,000 Q4 2019 Central Core Other*
OxWorx 7,000 Q1 2020 Central Core A
Culinary Coworking 4,000 Q3 2019 Southcentral Other*
Total Top Five 36,000
Total Sq. Ft. New Transactions Y-o-Y 36,000
Top 5 as a % of Total 100.0%
Most Dominant Submarket % of Flex Office Inventory % of Total Y-o-Y TransactionsCentral Core 34.9% 89.1%
Low HighSingle Office/Suite Rates (US$) $370 $560
Calgary Q2 2020 Y-o-Y GrowthFlexible Office Sq. Ft. 977,091 -1.4%
Downtown Flex Sq. Ft. 553,694 4.2%
Suburban Flex Sq. Ft. 423,397 -7.8%
Overall Market Penetration (%) 1.4% 0.0%
Downtown Penetration (%) 1.3% 0.0%
Suburban Penetration (%) 1.6% -0.1%
# of Operators 30 0
# of Locations 52 -1
Avg. Size of Location (SF) 18,790
Operator Size (SF)Y-o-Y
Growth% of
Market# of
LocationsDominant
SubmarketRegus 203,993 -7.2% 20.9% 12 Central Core
WeWork 175,000 0.0% 17.9% 2 East End
TradeSpace 75,000 0.0% 7.7% 1 Southcentral
WC Business Centres 72,000 0.0% 7.4% 2 Central Core
Stratus 61,000 -13.8% 6.2% 5 Beltline
Total Top Five 586,993 60.1% 22 Top 5 as a % of Total 60.1%
1.6
1.4
1.2
0.8
1.0
0.4
0.6
0.0
0.2
1,200,000
1,000,000
800,000
600,000
400,000
200,000
0
Calgary
*Not located in a traditional office space.
56 North America Flexible Office Market in 2020

FLEXIBLE OFFICE HISTORICAL INVENTORY FLEXIBLE OFFICE INVENTORY – COMPOSITION OVER TIME
LARGEST FLEXIBLE OPERATOR TRANSACTIONS
TOP FLEXIBLE SPACE OPERATORS MARKET STATISTICS
H1 2019
H1 2019
H1 2015
H1 2015
H1 2012
H1 2012
H1 2018
H1 2018
H1 2014
H1 2014
H1 2011
H1 2011
H1 2017
H1 2017
H1 2013
H1 2013
H1 2010
H1 2010
H1 2020
H1 2020
H1 2016
H1 2016
Sq. Ft. (%)Dowtown (L) Suburban (L) Penetration % (R) Dowtown Suburban
100
80
90
60
70
40
50
20
30
10
0
(%)
2.5
2.0
1.5
1.0
0.5
0.0
APPENDIX HOME
Source: CBRE Research, Q2 2020.
Operator Size (SF) Quarter SubmarketBuilding
ClassRegus 28,000 Q3 2019 SouthPark A
Venture X 23,000 Q1 2020 Midtown/Southend A
Serendipity Labs 23,000 Q3 2019 Midtown/Southend A
YourOffice 11,000 Q4 2019 SouthPark B
Total Top Five 85,000
Total Sq. Ft. New Transactions Y-o-Y 85,000
Top 5 as a % of Total 100.0%
Operator Size (SF)Y-o-Y
Growth% of
Market# of
LocationsDominant
SubmarketWeWork 289,865 0.0% 33.1% 3 CBD
Regus 207,048 15.9% 23.6% 10 CBD
Hygge 75,500 0.0% 8.6% 5 North
Spaces 58,928 0.0% 6.7% 2 CBD
Venture X 47,080 93.1% 5.4% 2 I-485/South
Total Top Five 678,421 77.4% 22 Top 5 as a % of Total 77.4%
Most Dominant Submarket % of Flex Office Inventory % of Total Y-o-Y TransactionsCBD 45.5% 0.0%
Low HighSingle Office/Suite Rates $460 $590
Charlotte Q2 2020 Y-o-Y GrowthFlexible Office Sq. Ft. 876,744 7.6%
Downtown Flex Sq. Ft. 398,615 0.0%
Suburban Flex Sq. Ft. 478,129 14.9%
Overall Market Penetration (%) 2.0% 0.1%
Downtown Penetration (%) 2.2% -0.2%
Suburban Penetration (%) 1.8% 0.2%
# of Operators 17 0
# of Locations 36 +3
Avg. Size of Location (SF) 23,696
1,000,000
800,000
900,000
600,000
700,000
400,000
500,000
200,000
300,000
0
100,000
Charlotte
57© 2020 CBRE, Inc.

FLEXIBLE OFFICE HISTORICAL INVENTORY FLEXIBLE OFFICE INVENTORY – COMPOSITION OVER TIME
LARGEST FLEXIBLE OPERATOR TRANSACTIONS Q3 2019 – Q2 2020
TOP FLEXIBLE SPACE OPERATORS MARKET STATISTICS
H1 2019
H1 2019
H1 2015
H1 2015
H1 2012
H1 2012
H1 2018
H1 2018
H1 2014
H1 2014
H1 2011
H1 2011
H1 2017
H1 2017
H1 2013
H1 2013
H1 2010
H1 2010
H1 2020
H1 2020
H1 2016
H1 2016
Sq. Ft. (%)Downtown (L) Suburban (L) Penetration % (R) Downtown Suburban
100
80
90
60
70
40
50
20
30
10
0
(%)
APPENDIX HOME
Source: CBRE Research, Q2 2020.
Chicago
Operator Size (SF) Quarter SubmarketBuilding
ClassWeWork 110,000 Q3 2019 West Loop A
Co-Optim 100,000 Q3 2019 Northwest Suburbs B
WeWork 93,000 Q3 2019 Fulton Market/ Far West Loop A
WeWork 63,000 Q1 2020 River North A
FBRK 45,000 Q3 2019 West Loop B
Total Top Five 411,000
Total Sq. Ft. New Transactions Y-o-Y 683,000
Top 5 as a % of Total 60.2%
Operator Size (SF)Y-o-Y
Growth% of
Market# of
LocationsDominant
Submarket
WeWork 1,177,836 15.3% 26.0% 15 Fulton Market/ Far West Loop
Regus 901,248 1.2% 19.9% 49 East-West Tollway
Convene 354,506 -17.4% 7.8% 5 West Loop
Industrious 286,126 0.0% 6.3% 8 Central Loop
Novel Coworking 271,177 0.0% 6.0% 5 West Loop
Total Top Five 2,990,893 66.1% 82 Top 5 as a % of Total 66.1%
Most Dominant Submarket % of Flex Office Inventory % of Total Y-o-Y TransactionsWest Loop 22.5% 27.0%
Low HighSingle Office/Suite Rates $490 $730
Chicago Q2 2020 Y-o-Y GrowthFlexible Office Sq. Ft. 4,526,869 6.4%
Downtown Flex Sq. Ft. 3,669,844 1.5%
Suburban Flex Sq. Ft. 857,025 34.4%
Overall Market Penetration (%) 1.9% 0.0%
Downtown Penetration (%) 2.7% -0.1%
Suburban Penetration (%) 0.8% 0.2%
# of Operators 45 0
# of Locations 159 +6
Avg. Size of Location (SF) 28,471
2.0
1.6
1.2
0.8
0.4
0.0
5,000,000
4,000,000
3,000,000
2,000,000
1,000,000
0
58 North America Flexible Office Market in 2020

FLEXIBLE OFFICE HISTORICAL INVENTORY FLEXIBLE OFFICE INVENTORY – COMPOSITION OVER TIME
LARGEST FLEXIBLE OPERATOR TRANSACTIONS
TOP FLEXIBLE SPACE OPERATORS MARKET STATISTICS
H1 2019
H1 2019
H1 2015
H1 2015
H1 2012
H1 2012
H1 2018
H1 2018
H1 2014
H1 2014
H1 2011
H1 2011
H1 2017
H1 2017
H1 2013
H1 2013
H1 2010
H1 2010
H1 2020
H1 2020
H1 2016
H1 2016
Sq. Ft. (%)Dowtown (L) Suburban (L) Penetration % (R) Dowtown Suburban
100
80
90
60
70
40
50
20
30
10
0
(%)
2.5
2.0
1.5
1.0
0.5
0.0
APPENDIX HOME
Source: CBRE Research, Q2 2020.
Operator Size (SF) Quarter SubmarketBuilding
ClassHaven Collective 6,000 Q3 2019 Downtown C
Total Top Five 6,000
Total Sq. Ft. New Transactions Y-o-Y 6,000
Top 5 as a % of Total 100.0%
Operator Size (SF)Y-o-Y
Growth% of
Market# of
LocationsDominant
SubmarketRegus 97,264 0.0% 12.0% 5 Easton
Rev1 Ventures 64,000 0.0% 7.9% 1 Upper Arlington
Columbus Idea Foundry 60,584 0.0% 7.5% 1 Downtown
The Point at Otterbein University 60,000 0.0% 7.4% 1 Westerville
Versa 47,000 0.0% 5.8% 2 Grandview
Total Top Five 328,848 40.5% 10 Top 5 as a % of Total 40.5%
Most Dominant Submarket % of Flex Office Inventory % of Total Y-o-Y TransactionsDowntown 44.0% 100.0%
Low HighSingle Office/Suite Rates $400 $650
Columbus Q2 2020 Y-o-Y GrowthFlexible Office Sq. Ft. 811,361 -1.7%
Downtown Flex Sq. Ft. 357,362 -3.8%
Suburban Flex Sq. Ft. 453,999 0.0%
Overall Market Penetration (%) 2.1% -0.1%
Downtown Penetration (%) 2.8% -0.1%
Suburban Penetration (%) 1.8% -0.1%
# of Operators 38 0
# of Locations 52 -1
Avg. Size of Location (SF) 15,603
900,000
800,000
700,000
500,000
600,000
300,000
400,000
100,000
200,000
0
Columbus
59© 2020 CBRE, Inc.

FLEXIBLE OFFICE HISTORICAL INVENTORY FLEXIBLE OFFICE INVENTORY – COMPOSITION OVER TIME
LARGEST FLEXIBLE OPERATOR TRANSACTIONS Q3 2019 – Q2 2020
TOP FLEXIBLE SPACE OPERATORS MARKET STATISTICS
H1 2019
H1 2019
H1 2015
H1 2015
H1 2012
H1 2012
H1 2018
H1 2018
H1 2014
H1 2014
H1 2011
H1 2011
H1 2017
H1 2017
H1 2013
H1 2013
H1 2010
H1 2010
H1 2020
H1 2020
H1 2016
H1 2016
Sq. Ft. (%)Downtown (L) Suburban (L) Penetration % (R) Downtown Suburban
100
80
90
60
70
40
50
20
30
10
0
(%)
2.5
2.0
1.5
1.0
0.5
0.0
APPENDIX HOME
Source: CBRE Research, Q2 2020.
Operator Size (SF) Quarter SubmarketBuilding
ClassVarispace 380,000 Q4 2019 Mid-Cities A
WeWork 72,000 Q3 2019 Preston Center A
Spaces 53,000 Q1 2020 Far North Dallas A
WeWork 53,000 Q3 2019 Far North Dallas A
WorkLodge 31,000 Q4 2019 Stemmons Freeway Flex
Total Top Five 589,000
Total Sq. Ft. New Transactions Y-o-Y 771,000
Top 5 as a % of Total 76.4%
Operator Size (SF)Y-o-Y
Growth% of
Market# of
LocationsDominant
SubmarketRegus 816,571 -2.2% 17.1% 46 Far North Dallas
Varispace 685,000 124.6% 14.3% 2 Mid-Cities
WeWork 667,969 22.9% 14.0% 12 Far North Dallas
Boxer Workstyle Executive Suites 355,938 0.0% 7.4% 10 Dallas CBD
WORKSUITES 345,913 17.9% 7.2% 17 Central Expressway
Total Top Five 2,871,391 60.1% 87 Top 5 as a % of Total 60.1%
Most Dominant Submarket % of Flex Office Inventory % of Total Y-o-Y TransactionsFar North Dallas 24.9% 13.8%
Low HighSingle Office/Suite Rates $370 $570
Dallas/Ft. Worth Q2 2020 Y-o-Y GrowthFlexible Office Sq. Ft. 4,778,962 17.3%
Downtown Flex Sq. Ft. 942,673 -1.1%
Suburban Flex Sq. Ft. 3,836,289 22.9%
Overall Market Penetration (%) 2.1% 0.3%
Downtown Penetration (%) 3.5% -0.1%
Suburban Penetration (%) 1.9% 0.3%
# of Operators 50 +2
# of Locations 178 +10
Avg. Size of Location (SF) 26,848
6,000,000
5,000,000
4,000,000
3,000,000
2,000,000
1,000,000
0
Dallas/Ft. Worth
60 North America Flexible Office Market in 2020

FLEXIBLE OFFICE HISTORICAL INVENTORY FLEXIBLE OFFICE INVENTORY – COMPOSITION OVER TIME
LARGEST FLEXIBLE OPERATOR TRANSACTIONS
TOP FLEXIBLE SPACE OPERATORS MARKET STATISTICS
H1 2019
H1 2019
H1 2015
H1 2015
H1 2012
H1 2012
H1 2018
H1 2018
H1 2014
H1 2014
H1 2011
H1 2011
H1 2017
H1 2017
H1 2013
H1 2013
H1 2010
H1 2010
H1 2020
H1 2020
H1 2016
H1 2016
Sq. Ft. (%)Dowtown (L) Suburban (L) Penetration % (R) Dowtown Suburban
100
80
90
60
70
40
50
20
30
10
0
(%)
APPENDIX HOME
Source: CBRE Research, Q2 2020.
Operator Size (SF) Quarter SubmarketBuilding
ClassShift Workspaces 32,000 Q3 2019 Southwest A
Industrious 25,000 Q4 2019 Cherry Creek A
Thrive Workplace 22,000 Q4 2019 Southeast B
Enterprise 20,000 Q1 2020 Southeast A
Park 8,000 Q1 2020 Colorado Blvd/Midtown B
Total Top Five 107,000
Total Sq. Ft. New Transactions Y-o-Y 120,000
Top 5 as a % of Total 89.2%
Operator Size (SF)Y-o-Y
Growth% of
Market# of
LocationsDominant
SubmarketWeWork 810,338 -9.6% 26.5% 12 Downtown
Regus 379,982 0.0% 12.4% 22 Southeast
Novel Coworking 343,519 0.0% 11.2% 3 Downtown
Industry 230,000 0.0% 7.5% 2 River North
Office Evolution 143,387 0.0% 4.7% 11 West Hampden/Alameda
Total Top Five 1,907,226 62.3% 50 Top 5 as a % of Total 62.3%
Most Dominant Submarket % of Flex Office Inventory % of Total Y-o-Y TransactionsDowntown 41.9% 0.0%
Low HighSingle Office/Suite Rates $390 $555
Denver Q2 2020 Y-o-Y GrowthFlexible Office Sq. Ft. 3,062,671 0.5%
Downtown Flex Sq. Ft. 1,283,134 0.0%
Suburban Flex Sq. Ft. 1,779,537 0.9%
Overall Market Penetration (%) 2.6% 0.0%
Downtown Penetration (%) 4.4% -0.1%
Suburban Penetration (%) 2.0% 0.0%
# of Operators 52 -1
# of Locations 121 +5
Avg. Size of Location (SF) 25,311
0 0.0
3,500,000
3,000,000
2,500,000
2,000,000
1,500,000
1,000,000
500,000
3.0
2.5
2.0
1.5
1.0
0.5
Denver
61© 2020 CBRE, Inc.

FLEXIBLE OFFICE HISTORICAL INVENTORY FLEXIBLE OFFICE INVENTORY – COMPOSITION OVER TIME
LARGEST FLEXIBLE OPERATOR TRANSACTIONS Q3 2019 – Q2 2020
TOP FLEXIBLE SPACE OPERATORS MARKET STATISTICS
H1 2019
H1 2019
H1 2015
H1 2015
H1 2012
H1 2012
H1 2018
H1 2018
H1 2014
H1 2014
H1 2011
H1 2011
H1 2017
H1 2017
H1 2013
H1 2013
H1 2010
H1 2010
H1 2020
H1 2020
H1 2016
H1 2016
Sq. Ft. (%)Downtown (L) Suburban (L) Penetration % (R) Downtown Suburban
100
80
90
60
70
40
50
20
30
10
0
(%)
APPENDIX HOME
Source: CBRE Research, Q2 2020.
Operator Size (SF) Quarter SubmarketBuilding
ClassWeWork 91,000 Q3 2019 Detroit Downtown A
Spaces 49,000 Q4 2019 Detroit Downtown A
Venture X 22,000 Q3 2019 Detroit Downtown A
Total Top Five 162,000
Total Sq. Ft. New Transactions Y-o-Y 162,000
Top 5 as a % of Total 100.0%
Operator Size (SF)Y-o-Y
Growth% of
Market# of
LocationsDominant
SubmarketWeWork 178,300 104.2% 27.7% 3 Detroit Downtown
Regus 147,192 0.0% 22.9% 8 Troy
Americenter 82,637 0.0% 12.9% 5 Farmington Hills/West Bloomfield
Spaces 49,056 0.0% 7.6% 1 Detroit Downtown
Venture X 21,767 0.0% 3.4% 1 Detroit Downtown
Total Top Five 478,952 74.5% 18 Top 5 as a % of Total 74.5%
Most Dominant Submarket % of Flex Office Inventory % of Total Y-o-Y TransactionsDetroit Downtown 58.4% 100.0%
Low HighSingle Office/Suite Rates $330 $440
Detroit Q2 2020 Y-o-Y GrowthFlexible Office Sq. Ft. 642,942 33.6%
Downtown Flex Sq. Ft. 375,567 75.7%
Suburban Flex Sq. Ft. 267,375 0.0%
Overall Market Penetration (%) 0.8% 0.2%
Downtown Penetration (%) 2.2% 1.0%
Suburban Penetration (%) 0.4% 0.0%
# of Operators 22 +2
# of Locations 35 +3
Avg. Size of Location (SF) 18,370
0.9
0.7
0.8
0.5
0.6
0.3
0.4
0.1
0.2
0.0
700,000
600,000
500,000
400,000
300,000
200,000
100,000
0
Detroit
62 North America Flexible Office Market in 2020

FLEXIBLE OFFICE HISTORICAL INVENTORY FLEXIBLE OFFICE INVENTORY – COMPOSITION OVER TIME
LARGEST FLEXIBLE OPERATOR TRANSACTIONS
TOP FLEXIBLE SPACE OPERATORS MARKET STATISTICS
H1 2019
H1 2019
H1 2015
H1 2015
H1 2012
H1 2012
H1 2018
H1 2018
H1 2014
H1 2014
H1 2011
H1 2011
H1 2017
H1 2017
H1 2013
H1 2013
H1 2010
H1 2010
H1 2020
H1 2020
H1 2016
H1 2016
Sq. Ft. (%)Dowtown (L) Suburban (L) Penetration % (R) Dowtown Suburban
100
80
90
60
70
40
50
20
30
10
0
(%)
APPENDIX HOME
Source: CBRE Research, Q2 2020.
Operator Size (SF) Quarter SubmarketBuilding
ClassThe Cannon 120,000 Q3 2019 Energy Corridor Unknown
Spaces 63,000 Q4 2019 CBD Unknown
WeWork 56,000 Q3 2019 CBD Unknown
Spaces 52,000 Q4 2019 West Loop/Galleria A
Fuse Workspace 29,000 Q1 2020 Katy Freeway Unknown
Total Top Five 321,000
Total Sq. Ft. New Transactions Y-o-Y 417,000
Top 5 as a % of Total 77.0%
Operator Size (SF)Y-o-Y
Growth% of
Market# of
LocationsDominant
SubmarketRegus 717,107 -4.7% 24.9% 41 West Loop/Galleria
Boxer Workstyle Executive Suites 683,902 0.1% 23.8% 23 Clear Lake
WeWork 253,288 28.4% 8.8% 4 CBD
Spaces 201,407 134.6% 7.0% 4 CBD
The Cannon 130,000 1200.0% 4.5% 2 Energy Corridor
Total Top Five 1,985,704 69.0% 74 Top 5 as a % of Total 69.0%
Most Dominant Submarket % of Flex Office Inventory % of Total Y-o-Y TransactionsCBD 17.2% 32.7%
Low HighSingle Office/Suite Rates $430 $570
Houston Q2 2020 Y-o-Y GrowthFlexible Office Sq. Ft. 2,878,418 14.6%
Downtown Flex Sq. Ft. 496,029 33.7%
Suburban Flex Sq. Ft. 2,382,389 11.3%
Overall Market Penetration (%) 1.4% 0.2%
Downtown Penetration (%) 1.2% 0.3%
Suburban Penetration (%) 1.4% 0.2%
# of Operators 36 +5
# of Locations 115 +8
Avg. Size of Location (SF) 25,030
1.6
1.2
1.4
0.8
1.0
0.4
0.6
0.2
0.0
3,500,000
3,000,000
2,500,000
2,000,000
1,500,000
1,000,000
500,000
0
Houston
63© 2020 CBRE, Inc.

FLEXIBLE OFFICE HISTORICAL INVENTORY FLEXIBLE OFFICE INVENTORY – COMPOSITION OVER TIME
LARGEST FLEXIBLE OPERATOR TRANSACTIONS Q3 2019 – Q2 2020
TOP FLEXIBLE SPACE OPERATORS MARKET STATISTICS
H1 2019
H1 2019
H1 2015
H1 2015
H1 2012
H1 2012
H1 2018
H1 2018
H1 2014
H1 2014
H1 2011
H1 2011
H1 2017
H1 2017
H1 2013
H1 2013
H1 2010
H1 2010
H1 2020
H1 2020
H1 2016
H1 2016
Sq. Ft. (%)Downtown (L) Suburban (L) Penetration % (R) Downtown Suburban
100
80
90
60
70
40
50
20
30
10
0
(%)
2.5
2.0
1.5
1.0
0.5
0.0
APPENDIX HOME
Source: CBRE Research, Q2 2020.
Operator Size (SF) Quarter SubmarketBuilding
ClassWyrk Space 12,000 Q3 2019 Speedway B
Cowork 1010 5,000 Q3 2019 College Park B
Total Top Five 17,000
Total Sq. Ft. New Transactions Y-o-Y 17,000
Top 5 as a % of Total 100.0%
Operator Size (SF)Y-o-Y
Growth% of
Market# of
LocationsDominant
SubmarketYeager Office Suites 179,081 0.0% 25.4% 7 Greenwood
Regus 134,744 0.0% 19.1% 7 Keystone Crossing
Cowork Indy 125,000 0.0% 17.7% 1 Downtown
Launch Fishers 51,747 0.0% 7.3% 1 Fishers/Geist
Refinery46 31,992 0.0% 4.5% 1 Midtown
Total Top Five 522,564 74.0% 17 Top 5 as a % of Total 74.0%
Most Dominant Submarket % of Flex Office Inventory % of Total Y-o-Y TransactionsDowntown 31.9% 0.0%
Low HighSingle Office/Suite Rates $420 $580
Indianapolis Q2 2020 Y-o-Y GrowthFlexible Office Sq. Ft. 706,115 -1.1%
Downtown Flex Sq. Ft. 234,162 -8.8%
Suburban Flex Sq. Ft. 471,953 3.3%
Overall Market Penetration (%) 1.9% -0.1%
Downtown Penetration (%) 2.0% -0.2%
Suburban Penetration (%) 1.8% 0.0%
# of Operators 24 0
# of Locations 38 -1
Avg. Size of Location (SF) 18,582
800,000
700,000
600,000
500,000
300,000
400,000
100,000
200,000
0
Indianapolis
64 North America Flexible Office Market in 2020

FLEXIBLE OFFICE HISTORICAL INVENTORY FLEXIBLE OFFICE INVENTORY – COMPOSITION OVER TIME
LARGEST FLEXIBLE OPERATOR TRANSACTIONS
TOP FLEXIBLE SPACE OPERATORS MARKET STATISTICS
H1 2019
H1 2019
H1 2015
H1 2015
H1 2012
H1 2012
H1 2018
H1 2018
H1 2014
H1 2014
H1 2011
H1 2011
H1 2017
H1 2017
H1 2013
H1 2013
H1 2010
H1 2010
H1 2020
H1 2020
H1 2016
H1 2016
Sq. Ft. (%)Dowtown (L) Suburban (L) Penetration % (R) Dowtown Suburban
100
80
90
60
70
40
50
20
30
10
0
(%)
APPENDIX HOME
Source: CBRE Research, Q2 2020.
Operator Size (SF) Quarter SubmarketBuilding
ClassWeWork 100,000 Q3 2019 Downtown A
Plexpod 39,000 Q2 2020 Downtown A
Industrious 37,000 Q3 2019 Plaza A
Serendipity Labs 26,000 Q4 2019 South Johnson County A
King's Cove Executive Suites 14,000 Q4 2019 North Johnson County B
Total Top Five 216,000
Total Sq. Ft. New Transactions Y-o-Y 223,000
Top 5 as a % of Total 96.9%
Operator Size (SF)Y-o-Y
Growth% of
Market# of
LocationsDominant
SubmarketPlexpod 253,926 18.1% 27.3% 5 Midtown
Regus 155,357 0.0% 16.7% 11 South Johnson County
WeWork 144,686 223.8% 15.5% 2 Downtown
iWerx 64,000 0.0% 6.9% 2 Kansas City North
Edison Spaces 43,692 0.0% 4.7% 2 South Johnson County
Total Top Five 661,661 71.0% 22 Top 5 as a % of Total 71.0%
Most Dominant Submarket % of Flex Office Inventory % of Total Y-o-Y TransactionsDowntown 34.8% 65.4%
Low HighSingle Office/Suite Rates $360 $600
Kansas City Q2 2020 Y-o-Y GrowthFlexible Office Sq. Ft. 931,831 30.0%
Downtown Flex Sq. Ft. 323,955 74.0%
Suburban Flex Sq. Ft. 607,876 14.6%
Overall Market Penetration (%) 1.8% 0.4%
Downtown Penetration (%) 2.6% 1.1%
Suburban Penetration (%) 1.5% 0.2%
# of Operators 19 +3
# of Locations 36 +5
Avg. Size of Location (SF) 25,884
2.0
1.6
1.2
0.8
0.4
0.0
1,000,000
800,000
600,000
400,000
200,000
0
Kansas City
65© 2020 CBRE, Inc.

FLEXIBLE OFFICE HISTORICAL INVENTORY FLEXIBLE OFFICE INVENTORY – COMPOSITION OVER TIME
LARGEST FLEXIBLE OPERATOR TRANSACTIONS Q3 2019 – Q2 2020
TOP FLEXIBLE SPACE OPERATORS MARKET STATISTICS
H1 2019
H1 2019
H1 2015
H1 2015
H1 2012
H1 2012
H1 2018
H1 2018
H1 2014
H1 2014
H1 2011
H1 2011
H1 2017
H1 2017
H1 2013
H1 2013
H1 2010
H1 2010
H1 2020
H1 2020
H1 2016
H1 2016
Sq. Ft. (%)Downtown (L) Suburban (L) Penetration % (R) Downtown Suburban
100
80
90
60
70
40
50
20
30
10
0
(%)
APPENDIX HOME
Source: CBRE Research, Q2 2020.
Operator Size (SF) Quarter SubmarketBuilding
ClassNo new transactions in past year - - - -
Operator Size (SF)Y-o-Y
Growth% of
Market# of
LocationsDominant
SubmarketRegus 246,878 0.0% 53.8% 15 West
WeWork 152,152 0.0% 33.2% 2 Airport
Premier Workspaces 36,533 0.0% 8.0% 2 Southwest
Co-Operate on Main 8,785 0.0% 1.9% 1 Downtown
Bottega Exchange 6,235 0.0% 1.4% 1 Southwest
Total Top Five 450,583 98.2% 21 Top 5 as a % of Total 98.2%
Most Dominant Submarket % of Flex Office Inventory % of Total Y-o-Y TransactionsWest 27.3% 0.0%
Low HighSingle Office/Suite Rates $420 $540
Las Vegas Q2 2020 Y-o-Y GrowthFlexible Office Sq. Ft. 458,734 0.0%
Downtown Flex Sq. Ft. 31,336 0.0%
Suburban Flex Sq. Ft. 427,398 0.0%
Overall Market Penetration (%) 1.3% 0.0%
Downtown Penetration (%) 1.5% 0.0%
Suburban Penetration (%) 1.2% 0.0%
# of Operators 9 0
# of Locations 25 0
Avg. Size of Location (SF) 18,349
1.4
1.2
1.0
0.6
0.8
0.2
0.4
0.0
500,000
400,000
300,000
200,000
100,000
0
Las Vegas
66 North America Flexible Office Market in 2020

FLEXIBLE OFFICE HISTORICAL INVENTORY FLEXIBLE OFFICE INVENTORY – COMPOSITION OVER TIME
LARGEST FLEXIBLE OPERATOR TRANSACTIONS
TOP FLEXIBLE SPACE OPERATORS MARKET STATISTICS
H1 2019
H1 2019
H1 2015
H1 2015
H1 2012
H1 2012
H1 2018
H1 2018
H1 2014
H1 2014
H1 2011
H1 2011
H1 2017
H1 2017
H1 2013
H1 2013
H1 2010
H1 2010
H1 2020
H1 2020
H1 2016
H1 2016
Sq. Ft. (%)Dowtown (L) Suburban (L) Penetration % (R) Dowtown Suburban
100
80
90
60
70
40
50
20
30
10
0
(%)
APPENDIX HOME
Source: CBRE Research, Q2 2020.
Operator Size (SF) Quarter SubmarketBuilding
ClassWeWork 135,000 Q3 2019 Hollywood/Wilshire Corridor A
Second Home Hollywood 90,000 Q3 2019 Hollywood/Wilshire Corridor A
WeWork 68,000 Q3 2019 West Los Angeles A
WeWork 60,000 Q3 2019 Tri-Cities/Glendale A
Industrious 40,000 Q4 2019 Tri-Cities/Glendale A
Total Top Five 392,000
Total Sq. Ft. New Transactions Y-o-Y 796,000
Top 5 as a % of Total 49.2%
Operator Size (SF)Y-o-Y
Growth% of
Market# of
LocationsDominant
SubmarketWeWork 2,251,126 19.9% 35.0% 34 West Los Angeles
Regus 914,235 0.0% 14.2% 49 West Los Angeles
Spaces 545,825 7.7% 8.5% 12 West Los Angeles
Premier Workspaces 510,991 2.8% 7.9% 34 West Los Angeles
Barrister Executive Suites 375,500 0.0% 5.8% 24 West Los Angeles
Total Top Five 4,597,677 71.4% 153 Top 5 as a % of Total 71.4%
Most Dominant Submarket % of Flex Office Inventory % of Total Y-o-Y TransactionsWest Los Angeles 40.7% 47.9%
Low HighSingle Office/Suite Rates $450 $610
Los Angeles Q2 2020 Y-o-Y GrowthFlexible Office Sq. Ft. 6,437,204 10.6%
Downtown Flex Sq. Ft. 959,551 -5.1%
Suburban Flex Sq. Ft. 5,477,653 14.0%
Overall Market Penetration (%) 2.8% 0.2%
Downtown Penetration (%) 2.9% -0.2%
Suburban Penetration (%) 2.8% 0.3%
# of Operators 72 -7
# of Locations 294 +10
Avg. Size of Location (SF) 21,895
3.5
3.0
2.5
2.0
1.5
1.0
0.5
0.0
7,000,000
5,000,000
6,000,000
4,000,000
3,000,000
2,000,000
1,000,000
0
Los Angeles
67© 2020 CBRE, Inc.

FLEXIBLE OFFICE HISTORICAL INVENTORY FLEXIBLE OFFICE INVENTORY – COMPOSITION OVER TIME
LARGEST FLEXIBLE OPERATOR TRANSACTIONS Q3 2019 – Q2 2020
TOP FLEXIBLE SPACE OPERATORS MARKET STATISTICS
H1 2019
H1 2019
H1 2015
H1 2015
H1 2012
H1 2012
H1 2018
H1 2018
H1 2014
H1 2014
H1 2011
H1 2011
H1 2017
H1 2017
H1 2013
H1 2013
H1 2010
H1 2010
H1 2020
H1 2020
H1 2016
H1 2016
Sq. Ft. (%)Downtown (L) Suburban (L) Penetration % (R) Downtown Suburban
100
80
90
60
70
40
50
20
30
10
0
(%)
APPENDIX HOME
Source: CBRE Research, Q2 2020.
Operator Size (SF) Quarter SubmarketBuilding
ClassMadison Commercial Real Estate 5,000 Q1 2020 Madison West B
AMPED Association Management 1,000 Q3 2019 Madison West B
Total Top Five 6,000
Total Sq. Ft. New Transactions Y-o-Y 6,000
Top 5 as a % of Total 100.0%
Operator Size (SF)Y-o-Y
Growth% of
Market# of
LocationsDominant
SubmarketNovel Coworking 95,000 0.0% 45.0% 1 Madison Central
Spaces 34,328 0.0% 16.3% 1 Madison Central
Serendipity Labs 23,172 0.0% 11.0% 1 Madison Central
Industrious 20,000 0.0% 9.5% 1 Madison Central
Regus 18,648 0.0% 8.8% 2 Madison West
Total Top Five 191,148 90.5% 6 Top 5 as a % of Total 90.5%
Most Dominant Submarket % of Flex Office Inventory % of Total Y-o-Y TransactionsMadison Central 86.8% 0.0%
Low HighSingle Office/Suite Rates $380 $510
Madison, WI Q2 2020 Y-o-Y GrowthFlexible Office Sq. Ft. 211,115 3.0%
Downtown Flex Sq. Ft. 183,278 0.0%
Suburban Flex Sq. Ft. 27,837 27.9%
Overall Market Penetration (%) 1.3% 0.0%
Downtown Penetration (%) 4.2% 0.0%
Suburban Penetration (%) 0.2% 0.1%
# of Operators 11 +2
# of Locations 12 +2
Avg. Size of Location (SF) 17,593
1.4
1.2
1.0
0.6
0.8
0.2
0.4
0.0
250,000
200,000
150,000
100,000
50,000
0
Madison, WI
68 North America Flexible Office Market in 2020

FLEXIBLE OFFICE HISTORICAL INVENTORY
LARGEST FLEXIBLE OPERATOR TRANSACTIONS
TOP FLEXIBLE SPACE OPERATORS MARKET STATISTICS
H1 2019
H1 2015
H1 2012
H1 2018
H1 2014
H1 2011
H1 2017
H1 2013
H1 2010
H1 2020
H1 2016
Sq. Ft. Dowtown (L) Suburban (L) Penetration % (R) (%)
APPENDIX HOME
Source: CBRE Research, Q2 2020.
Operator Size (SF) Quarter SubmarketBuilding
ClassWeWork 362,000 Q3 2019 Midtown Other*
WeWork 108,000 Q3 2019 Midtown South Other*
Industrious 103,000 Q1 2020 Midtown Other*
HANA 86,000 Q1 2020 Downtown Other*
Knotel 84,000 Q3 2019 Downtown Other*
Total Top Five 743,000
Total Sq. Ft. New Transactions Y-o-Y 1,459,000
Top 5 as a % of Total 50.9%
Operator Size (SF)Y-o-Y
Growth% of
Market# of
LocationsDominant
SubmarketWeWork 8,067,172 7.8% 47.7% 97 Midtown
Knotel 2,310,112 13.1% 13.7% 98 Midtown South
Regus 1,062,661 0.0% 6.3% 35 Midtown
Convene 809,939 9.5% 4.8% 14 Downtown
Spaces 608,028 0.0% 3.6% 8 Midtown
Total Top Five 12,857,912 76.0% 252 Top 5 as a % of Total 76.0%
Most Dominant Submarket % of Flex Office Inventory % of Total Y-o-Y TransactionsMidtown 48.4% 53.2%
Low HighSingle Office/Suite Rates $610 $900
Manhattan Q2 2020 Y-o-Y GrowthFlexible Office Sq. Ft. 16,910,367 8.4%
Downtown Flex Sq. Ft. 16,910,367 8.4%
Suburban Flex Sq. Ft. N/A N/A
Overall Market Penetration (%) 4.1% 0.3%
Downtown Penetration (%) 4.1% 0.3%
Suburban Penetration (%) N/A N/A
# of Operators 79 +1
# of Locations 454 +29
Avg. Size of Location (SF) 37,248
18,000,000
16,000,000
14,000,000
10,000,000
12,000,000
6,000,000
8,000,000
2,000,000
4,000,000
0
4.5
3.5
4.0
2.5
3.0
1.5
2.0
0.5
1.0
0.0
Manhattan
*Manhattan does not differentiate office product by class.
69© 2020 CBRE, Inc.

FLEXIBLE OFFICE HISTORICAL INVENTORY FLEXIBLE OFFICE INVENTORY – COMPOSITION OVER TIME
LARGEST FLEXIBLE OPERATOR TRANSACTIONS Q3 2019 – Q2 2020
TOP FLEXIBLE SPACE OPERATORS MARKET STATISTICS
H1 2019
H1 2019
H1 2015
H1 2015
H1 2012
H1 2012
H1 2018
H1 2018
H1 2014
H1 2014
H1 2011
H1 2011
H1 2017
H1 2017
H1 2013
H1 2013
H1 2010
H1 2010
H1 2020
H1 2020
H1 2016
H1 2016
Sq. Ft. (%)Downtown (L) Suburban (L) Penetration % (R) Downtown Suburban
100
80
90
60
70
40
50
20
30
10
0
(%)
APPENDIX HOME
Source: CBRE Research, Q2 2020.
Operator Size (SF) Quarter SubmarketBuilding
ClassNeueHouse Coworking 33,000 Q1 2020 Biscayne Blvd Corridor B
Industrious 30,000 Q4 2019 Aventura Other*
Industrious 25,000 Q3 2019 Coral Gables Other*
CoSuite 14,000 Q4 2019 Brickell B
Total Top Five 102,000
Total Sq. Ft. New Transactions Y-o-Y 102,000
Top 5 as a % of Total 100.0%
Operator Size (SF)Y-o-Y
Growth% of
Market# of
LocationsDominant
SubmarketWeWork 589,013 0.0% 30.1% 8 Brickell
Regus 343,304 0.0% 17.5% 21 Airport/Doral
Spaces 191,385 0.0% 9.8% 6 Miami Beach
Quest Workspaces 123,508 0.0% 6.3% 5 Brickell
CustomSpace Co. 85,344 0.0% 4.4% 1 Airport/Doral
Total Top Five 1,332,554 68.1% 41 Top 5 as a % of Total 68.1%
Most Dominant Submarket % of Flex Office Inventory % of Total Y-o-Y TransactionsBrickell 24.8% 13.9%
Low HighSingle Office/Suite Rates $380 $580
Miami Q2 2020 Y-o-Y GrowthFlexible Office Sq. Ft. 1,956,455 3.8%
Downtown Flex Sq. Ft. 793,332 1.2%
Suburban Flex Sq. Ft. 1,188,123 8.0%
Overall Market Penetration (%) 4.0% 0.2%
Downtown Penetration (%) 5.2% 0.1%
Suburban Penetration (%) 3.5% 0.2%
# of Operators 39 +1
# of Locations 90 +2
Avg. Size of Location (SF) 21,738
4.5
4.0
3.5
3.0
2.5
2.0
1.5
1.0
0.5
0.0
2,500,000
2,000,000
1,500,000
1,000,000
500,000
0
Miami
*Not located in a traditional office space.
70 North America Flexible Office Market in 2020

FLEXIBLE OFFICE HISTORICAL INVENTORY FLEXIBLE OFFICE INVENTORY – COMPOSITION OVER TIME
LARGEST FLEXIBLE OPERATOR TRANSACTIONS
TOP FLEXIBLE SPACE OPERATORS MARKET STATISTICS
H1 2019
H1 2019
H1 2015
H1 2015
H1 2012
H1 2012
H1 2018
H1 2018
H1 2014
H1 2014
H1 2011
H1 2011
H1 2017
H1 2017
H1 2013
H1 2013
H1 2010
H1 2010
H1 2020
H1 2020
H1 2016
H1 2016
Sq. Ft. (%)Dowtown (L) Suburban (L) Penetration % (R) Dowtown Suburban
100
80
90
60
70
40
50
20
30
10
0
(%)
APPENDIX HOME
Source: CBRE Research, Q2 2020.
Operator Size (SF) Quarter SubmarketBuilding
ClassRegus 19,000 Q4 2019 Downtown East A
Stanich & Stanich LLC 5,000 Q3 2019 South Suburban B
Syllabus Co-Work Space 3,000 Q4 2019 Third Ward/ Walker's Point B
Total Top Five 27,000
Total Sq. Ft. New Transactions Y-o-Y 27,000
Top 5 as a % of Total 100.0%
Operator Size (SF)Y-o-Y
Growth% of
Market# of
LocationsDominant
SubmarketRegus 84,520 6.2% 24.1% 5 Brookfield
Novel Coworking 69,523 0.0% 19.8% 1 Downtown East
Spaces 43,129 0.0% 12.3% 1 Downtown East
Serendipity Labs 34,815 0.0% 9.9% 1 Mayfair/Wauwatosa
Ward4 26,400 0.0% 7.5% 1 Third Ward/ Walker's Point
Total Top Five 258,387 73.6% 9 Top 5 as a % of Total 73.6%
Most Dominant Submarket % of Flex Office Inventory % of Total Y-o-Y TransactionsDowntown East 48.5% 70.6%
Low HighSingle Office/Suite Rates $350 $530
Milwaukee Q2 2020 Y-o-Y GrowthFlexible Office Sq. Ft. 351,280 0.6%
Downtown Flex Sq. Ft. 225,610 5.3%
Suburban Flex Sq. Ft. 125,670 -6.8%
Overall Market Penetration (%) 0.8% 0.0%
Downtown Penetration (%) 1.6% 0.1%
Suburban Penetration (%) 0.5% 0.0%
# of Operators 31 +3
# of Locations 37 +3
Avg. Size of Location (SF) 9,494
400,000
350,000
300,000
250,000
200,000
150,000
100,000
50,000
0
1.0
0.8
0.9
0.6
0.7
0.4
0.5
0.2
0.1
0.3
0.0
Milwaukee
71© 2020 CBRE, Inc.

FLEXIBLE OFFICE HISTORICAL INVENTORY FLEXIBLE OFFICE INVENTORY – COMPOSITION OVER TIME
LARGEST FLEXIBLE OPERATOR TRANSACTIONS Q3 2019 – Q2 2020
TOP FLEXIBLE SPACE OPERATORS MARKET STATISTICS
H1 2019
H1 2019
H1 2015
H1 2015
H1 2012
H1 2012
H1 2018
H1 2018
H1 2014
H1 2014
H1 2011
H1 2011
H1 2017
H1 2017
H1 2013
H1 2013
H1 2010
H1 2010
H1 2020
H1 2020
H1 2016
H1 2016
Sq. Ft. (%)Downtown (L) Suburban (L) Penetration % (R) Downtown Suburban
100
80
90
60
70
40
50
20
30
10
0
(%)
APPENDIX HOME
Source: CBRE Research, Q2 2020.
Operator Size (SF) Quarter SubmarketBuilding
ClassLife Time Work 53,000 Q1 2020 Minneapolis CBD A
Life Time Work 29,000 Q4 2019 494 Corridor A
Regus 13,000 Q4 2019 Burnsville, Eagan, Apple Valley A
The Coven 10,000 Q3 2019 Suburban St. Paul B
Total Top Five 105,000
Total Sq. Ft. New Transactions Y-o-Y 105,000
Top 5 as a % of Total 100.0%
Operator Size (SF)Y-o-Y
Growth% of
Market# of
LocationsDominant
SubmarketWeWork 238,940 0.0% 19.5% 4 394 Corridor
Regus 186,201 -0.2% 15.2% 12 494 Corridor
Novel Coworking 117,203 0.0% 9.6% 2 Minneapolis CBD
Life Time Work 110,000 292.9% 9.0% 3 Minneapolis CBD
OffiCenters 96,264 0.0% 7.9% 6 494 Corridor
Total Top Five 748,608 61.1% 27 Top 5 as a % of Total 61.1%
Most Dominant Submarket % of Flex Office Inventory % of Total Y-o-Y TransactionsMinneapolis CBD 31.7% 50.4%
Low HighSingle Office/Suite Rates $330 $540
Minneapolis/St. Paul Q2 2020 Y-o-Y GrowthFlexible Office Sq. Ft. 1,226,013 7.5%
Downtown Flex Sq. Ft. 632,724 6.7%
Suburban Flex Sq. Ft. 593,289 8.4%
Overall Market Penetration (%) 1.7% 0.0%
Downtown Penetration (%) 1.9% 0.1%
Suburban Penetration (%) 1.5% 0.0%
# of Operators 31 -1
# of Locations 64 +2
Avg. Size of Location (SF) 19,156
1.8
1.6
1.2
1.4
0.8
1.0
0.4
0.6
0.0
0.2
1,400,000
1,200,000
1,000,000
800,000
600,000
200,000
400,000
0
Minneapolis/St. Paul
72 North America Flexible Office Market in 2020

FLEXIBLE OFFICE HISTORICAL INVENTORY FLEXIBLE OFFICE INVENTORY – COMPOSITION OVER TIME
LARGEST FLEXIBLE OPERATOR TRANSACTIONS
TOP FLEXIBLE SPACE OPERATORS MARKET STATISTICS
H1 2019
H1 2019
H1 2015
H1 2015
H1 2012
H1 2012
H1 2018
H1 2018
H1 2014
H1 2014
H1 2011
H1 2011
H1 2017
H1 2017
H1 2013
H1 2013
H1 2010
H1 2010
H1 2020
H1 2020
H1 2016
H1 2016
Sq. Ft. (%)Dowtown (L) Suburban (L) Penetration % (R) Dowtown Suburban
100
80
90
60
70
40
50
20
30
10
0
(%)
APPENDIX HOME
Source: CBRE Research, Q2 2020.
Operator Size (SF) Quarter SubmarketBuilding
ClassWeWork 64,000 Q3 2019 Downtown East A
Au Bureau.co 8,000 Q3 2019 South Shore C
Le Tribe 8,000 Q4 2019 Midtown B
Main House Cowork 4,000 Q1 2020 Midtown C
Coworking Rive-Sud 3,000 Q4 2019 South Shore A
Total Top Five 87,000
Total Sq. Ft. New Transactions Y-o-Y 92,000
Top 5 as a % of Total 94.6%
Operator Size (SF)Y-o-Y
Growth% of
Market# of
LocationsDominant
SubmarketWeWork 348,167 22.6% 31.1% 5 Central Core
Regus 191,960 0.0% 17.2% 11 Central Core
Spaces 65,708 0.0% 5.9% 2 Downtown South
Îlot 84 62,972 -7.4% 5.6% 2 Midtown
Maison Notman 40,000 0.0% 3.6% 1 Downtown East
Total Top Five 708,807 63.4% 21 Top 5 as a % of Total 63.4%
Most Dominant Submarket % of Flex Office Inventory % of Total Y-o-Y TransactionsCentral Core 37.4% 0.0%
Low HighSingle Office/Suite Rates (US$) $450 $670
Montreal Q2 2020 Y-o-Y GrowthFlexible Office Sq. Ft. 1,117,980 7.2%
Downtown Flex Sq. Ft. 687,650 10.2%
Suburban Flex Sq. Ft. 430,330 2.6%
Overall Market Penetration (%) 1.5% 0.1%
Downtown Penetration (%) 1.5% 0.1%
Suburban Penetration (%) 1.4% 0.0%
# of Operators 63 0
# of Locations 109 -1
Avg. Size of Location (SF) 10,257
1.6
1.4
1.2
0.8
1.0
0.4
0.6
0.0
0.2
1,200,000
1,000,000
800,000
600,000
400,000
200,000
0
Montreal
73© 2020 CBRE, Inc.

FLEXIBLE OFFICE HISTORICAL INVENTORY FLEXIBLE OFFICE INVENTORY – COMPOSITION OVER TIME
LARGEST FLEXIBLE OPERATOR TRANSACTIONS Q3 2019 – Q2 2020
TOP FLEXIBLE SPACE OPERATORS MARKET STATISTICS
H1 2019
H1 2019
H1 2015
H1 2015
H1 2012
H1 2012
H1 2018
H1 2018
H1 2014
H1 2014
H1 2011
H1 2011
H1 2017
H1 2017
H1 2013
H1 2013
H1 2010
H1 2010
H1 2020
H1 2020
H1 2016
H1 2016
Sq. Ft. (%)Downtown (L) Suburban (L) Penetration % (R) Downtown Suburban
100
80
90
60
70
40
50
20
30
10
0
(%)
APPENDIX HOME
Source: CBRE Research, Q2 2020.
Operator Size (SF) Quarter SubmarketBuilding
ClassIndustrious 32,000 Q3 2019 Downtown A
WeWork 32,000 Q3 2019 Green Hills/21st Street/Music A
e|spaces 30,000 Q4 2019 Metrocenter A
Total Top Five 94,000
Total Sq. Ft. New Transactions Y-o-Y 94,000
Top 5 as a % of Total 100.0%
Operator Size (SF)Y-o-Y
Growth% of
Market# of
LocationsDominant
SubmarketRegus 155,666 0.0% 22.0% 8 West End/Belle Meade
WeWork 136,470 30.1% 19.3% 3 Downtown
Novel Coworking 87,333 0.0% 12.4% 1 Downtown
Industrious 82,690 63.5% 11.7% 3 Downtown
Spaces 69,450 0.0% 9.8% 2 Cool Springs
Total Top Five 531,609 75.2% 17 Top 5 as a % of Total 75.2%
Most Dominant Submarket % of Flex Office Inventory % of Total Y-o-Y TransactionsDowntown 52.3% 34.1%
Low HighSingle Office/Suite Rates $410 $570
Nashville Q2 2020 Y-o-Y GrowthFlexible Office Sq. Ft. 706,461 15.4%
Downtown Flex Sq. Ft. 369,634 9.5%
Suburban Flex Sq. Ft. 336,827 22.6%
Overall Market Penetration (%) 1.7% 0.2%
Downtown Penetration (%) 3.6% 0.2%
Suburban Penetration (%) 1.1% 0.2%
# of Operators 18 0
# of Locations 32 +3
Avg. Size of Location (SF) 22,077
800,000
700,000
600,000
500,000
400,000
300,000
200,000
100,000
0
2.0
1.6
1.2
0.8
0.4
0.0
Nashville
74 North America Flexible Office Market in 2020

FLEXIBLE OFFICE HISTORICAL INVENTORY
LARGEST FLEXIBLE OPERATOR TRANSACTIONS
TOP FLEXIBLE SPACE OPERATORS MARKET STATISTICS
H1 2019
H1 2015
H1 2012
H1 2018
H1 2014
H1 2011
H1 2017
H1 2013
H1 2010
H1 2020
H1 2016
Sq. Ft. Dowtown (L) Suburban (L) Penetration % (R) (%)
APPENDIX HOME
Source: CBRE Research, Q2 2020.
Operator Size (SF) Quarter SubmarketBuilding
ClassHANA 40,000 Q4 2019 Route 287/78 A
Lifetime 32,000 Q1 2020 Route 287/78 A
Total Top Five 72,000
Total Sq. Ft. New Transactions Y-o-Y 72,000
Top 5 as a % of Total 100.0%
Operator Size (SF)Y-o-Y
Growth% of
Market# of
LocationsDominant
SubmarketRegus 476,029 0.0% 43.6% 27 Princeton
HQ Global Workplaces 185,489 0.0% 17.0% 10 Waterfront
Symphony Suites 49,500 0.0% 4.5% 1 Morristown
HANA 40,000 N/A 3.5% 1 Route 287/78
Lifetime 32,000 N/A 2.8% 1 Route 287/78
Total Top Five 783,018 69.3% 40 Top 5 as a % of Total 69.3%
Most Dominant Submarket % of Flex Office Inventory % of Total Y-o-Y TransactionsWaterfront 14.2% 0.0%
Low HighSingle Office/Suite Rates $430 $670
New Jersey Q2 2020 Y-o-Y GrowthFlexible Office Sq. Ft. 1,130,560 6.8%
Downtown Flex Sq. Ft. N/A N/A
Suburban Flex Sq. Ft. 1,130,560 6.8%
Overall Market Penetration (%) 1.2% 0.5%
Downtown Penetration (%) N/A N/A
Suburban Penetration (%) 1.2% 0.5%
# of Operators 32 +2
# of Locations 77 +2
Avg. Size of Location (SF) 14,683
1.4
1.2
1.0
0.6
0.8
0.2
0.4
0.0
1,200,000
1,000,000
800,000
600,000
400,000
200,000
0
New Jersey
75© 2020 CBRE, Inc.

FLEXIBLE OFFICE HISTORICAL INVENTORY
LARGEST FLEXIBLE OPERATOR TRANSACTIONS Q3 2019 – Q2 2020
TOP FLEXIBLE SPACE OPERATORS MARKET STATISTICS
H1 2019
H1 2015
H1 2012
H1 2018
H1 2014
H1 2011
H1 2017
H1 2013
H1 2010
H1 2020
H1 2016
Sq. Ft. Downtown (L) Suburban (L) Penetration % (R) (%)
APPENDIX HOME
Source: CBRE Research, Q2 2020.
Operator Size (SF) Quarter SubmarketBuilding
ClassConvene 75,000 Q2 2020 Tysons Corner A
WeWork 62,000 Q3 2019 Tysons Corner A
HANA 33,000 Q4 2019 Crystal City B
WeWork 29,000 Q3 2019 Ballston A
Venture X 28,000 Q1 2020 Clarendon/Courthouse A
Total Top Five 227,000
Total Sq. Ft. New Transactions Y-o-Y 227,000
Top 5 as a % of Total 100.0%
Operator Size (SF)Y-o-Y
Growth% of
Market# of
LocationsDominant
SubmarketRegus 357,965 0.0% 23.1% 16 Herndon
WeWork 310,226 41.4% 20.1% 6 Ballston
Spaces 145,993 0.0% 9.4% 3 Tysons Corner
Metro Offices 121,052 0.0% 7.8% 6 Herndon
Carr Workplaces 112,444 0.0% 7.3% 7 Reston
Total Top Five 1,047,680 67.7% 38 Top 5 as a % of Total 67.7%
Low HighSingle Office/Suite Rates $520 $790
Most Dominant Submarket % of Flex Office Inventory % of Total Y-o-Y TransactionsTysons Corner 21.5% 60.1%
Northern Virginia Q2 2020 Y-o-Y GrowthFlexible Office Sq. Ft. 1,546,721 17.2%
Downtown Flex Sq. Ft. N/A N/A
Suburban Flex Sq. Ft. 1,546,721 17.2%
Overall Market Penetration (%) 0.9% 0.1%
Downtown Penetration (%) N/A N/A
Suburban Penetration (%) 0.9% 0.1%
# of Operators 17 +2
# of Locations 58 +5
Avg. Size of Location (SF) 26,557
1.0
0.8
0.9
0.6
0.7
0.4
0.5
0.2
0.3
0.0
0.1
1,800,000
1,600,000
1,400,000
1,200,000
1,000,000
800,000
600,000
400,000
200,000
0
Northern Virginia
76 North America Flexible Office Market in 2020

FLEXIBLE OFFICE HISTORICAL INVENTORY FLEXIBLE OFFICE INVENTORY – COMPOSITION OVER TIME
LARGEST FLEXIBLE OPERATOR TRANSACTIONS
TOP FLEXIBLE SPACE OPERATORS MARKET STATISTICS
H1 2019
H1 2019
H1 2015
H1 2015
H1 2012
H1 2012
H1 2018
H1 2018
H1 2014
H1 2014
H1 2011
H1 2011
H1 2017
H1 2017
H1 2013
H1 2013
H1 2010
H1 2010
H1 2020
H1 2020
H1 2016
H1 2016
Sq. Ft. (%)Dowtown (L) Suburban (L) Penetration % (R) Dowtown Suburban
100
80
90
60
70
40
50
20
30
10
0
(%)
APPENDIX HOME
Source: CBRE Research, Q2 2020.
Operator Size (SF) Quarter SubmarketBuilding
ClassNo new transactions in the past year - - - -
Operator Size (SF)Y-o-Y
Growth% of
Market# of
LocationsDominant
SubmarketWeWork 263,068 0.0% 56.0% 5 Oakland CBD
Spaces 99,072 0.0% 21.1% 5 Oakland JLS
The Port Workspaces 46,697 0.0% 9.9% 3 Oakland CBD
Pacific Workplaces 24,542 0.0% 5.2% 2 Oakland CBD
Impact Hub 20,425 0.0% 4.3% 1 Oakland CBD
Total Top Five 453,804 96.6% 16 Top 5 as a % of Total 96.6%
Most Dominant Submarket % of Flex Office Inventory % of Total Y-o-Y TransactionsOakland CBD 55.0% 0.0%
Low HighSingle Office/Suite Rates $440 $590
Oakland Q2 2020 Y-o-Y GrowthFlexible Office Sq. Ft. 469,875 0.0%
Downtown Flex Sq. Ft. 258,650 0.0%
Suburban Flex Sq. Ft. 211,225 0.0%
Overall Market Penetration (%) 1.5% 0.0%
Downtown Penetration (%) 2.1% -0.1%
Suburban Penetration (%) 1.1% 0.0%
# of Operators 9 0
# of Locations 20 0
Avg. Size of Location (SF) 23,494
1.8
1.6
1.2
1.4
0.8
1.0
0.4
0.6
0.0
0.2
500,000
400,000
450,000
300,000
350,000
200,000
250,000
100,000
150,000
0
50,000
Oakland
77© 2020 CBRE, Inc.

FLEXIBLE OFFICE HISTORICAL INVENTORY
LARGEST FLEXIBLE OPERATOR TRANSACTIONS Q3 2019 – Q2 2020
TOP FLEXIBLE SPACE OPERATORS MARKET STATISTICS
H1 2019
H1 2015
H1 2012
H1 2018
H1 2014
H1 2011
H1 2017
H1 2013
H1 2010
H1 2020
H1 2016
Sq. Ft. Downtown (L) Suburban (L) Penetration % (R) (%)
APPENDIX HOME
Source: CBRE Research, Q2 2020.
Operator Size (SF)Y-o-Y
Growth% of
Market# of
LocationsDominant
SubmarketWeWork 480,063 18.5% 27.5% 9 Greater Airport Area
Premier Workspaces 418,208 -2.1% 24.0% 22 Greater Airport Area
Regus 285,519 0.0% 16.4% 18 Greater Airport Area
Spaces 145,279 17.5% 8.3% 4 Greater Airport Area
TechSpace 75,948 0.0% 4.4% 2 South Orange County
Total Top Five 1,405,017 80.6% 55 Top 5 as a % of Total 80.6%
Operator Size (SF) Quarter SubmarketBuilding
ClassWeWork 116,000 Q3 2019 South Orange County A
WeWork 75,000 Q3 2019 Greater Airport Area A
Industrious 30,000 Q4 2019 Greater Airport Area A
Spaces 22,000 Q4 2019 Central Orange County A
Total Top Five 243,000
Total Sq. Ft. New Transactions Y-o-Y 243,000
Top 5 as a % of Total 100.0%
Most Dominant Submarket % of Flex Office Inventory % of Total Y-o-Y TransactionsGreater Airport Area 65.1% 43.2%
Low HighSingle Office/Suite Rates $420 $550
Orange County Q2 2020 Y-o-Y GrowthFlexible Office Sq. Ft. 1,742,923 4.8%
Downtown Flex Sq. Ft. N/A N/A
Suburban Flex Sq. Ft. 1,742,923 4.8%
Overall Market Penetration (%) 1.7% 0.1%
Downtown Penetration (%) N/A N/A
Suburban Penetration (%) 1.7% 0.1%
# of Operators 20 -3
# of Locations 74 -1
Avg. Size of Location (SF) 23,553
2.0
1.6
1.2
0.8
0.4
0.0
2,000,000
1,600,000
1,200,000
800,000
400,000
0
Orange County
78 North America Flexible Office Market in 2020
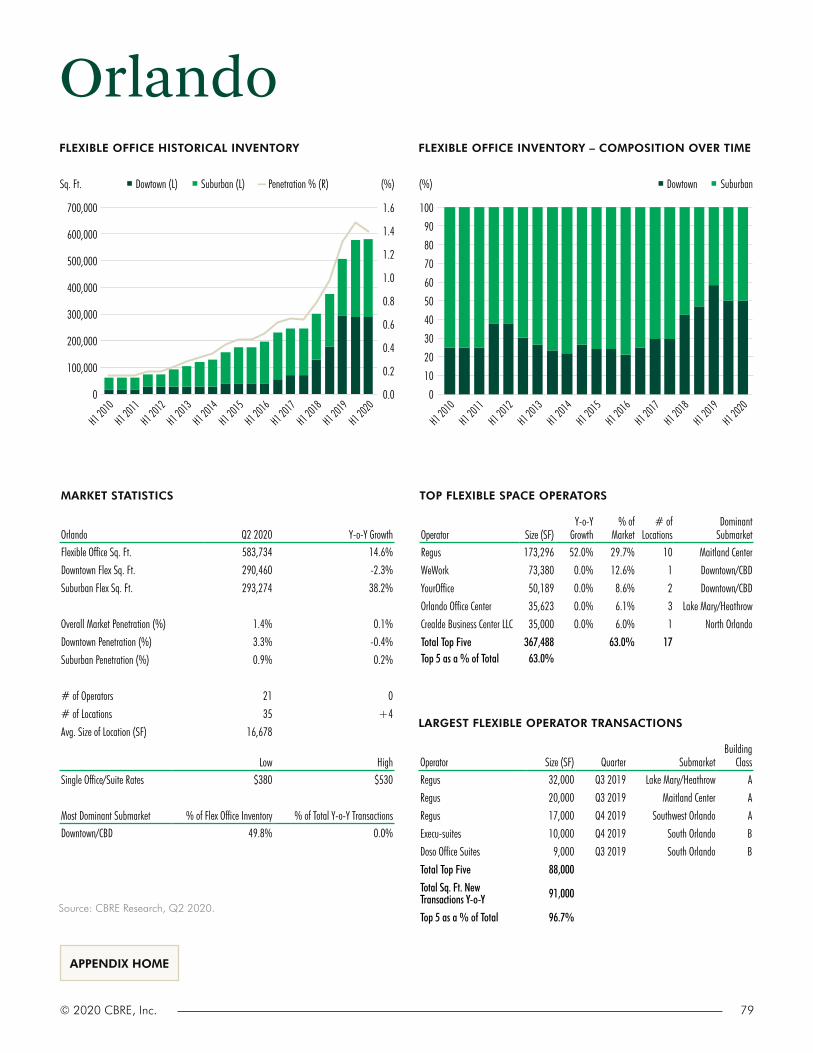
FLEXIBLE OFFICE HISTORICAL INVENTORY FLEXIBLE OFFICE INVENTORY – COMPOSITION OVER TIME
LARGEST FLEXIBLE OPERATOR TRANSACTIONS
TOP FLEXIBLE SPACE OPERATORS MARKET STATISTICS
H1 2019
H1 2019
H1 2015
H1 2015
H1 2012
H1 2012
H1 2018
H1 2018
H1 2014
H1 2014
H1 2011
H1 2011
H1 2017
H1 2017
H1 2013
H1 2013
H1 2010
H1 2010
H1 2020
H1 2020
H1 2016
H1 2016
Sq. Ft. (%)Dowtown (L) Suburban (L) Penetration % (R) Dowtown Suburban
100
80
90
60
70
40
50
20
30
10
0
(%)
APPENDIX HOME
Source: CBRE Research, Q2 2020.
Most Dominant Submarket % of Flex Office Inventory % of Total Y-o-Y TransactionsDowntown/CBD 49.8% 0.0%
Low HighSingle Office/Suite Rates $380 $530
Operator Size (SF) Quarter SubmarketBuilding
ClassRegus 32,000 Q3 2019 Lake Mary/Heathrow A
Regus 20,000 Q3 2019 Maitland Center A
Regus 17,000 Q4 2019 Southwest Orlando A
Execu-suites 10,000 Q4 2019 South Orlando B
Doso Office Suites 9,000 Q3 2019 South Orlando B
Total Top Five 88,000
Total Sq. Ft. New Transactions Y-o-Y 91,000
Top 5 as a % of Total 96.7%
Operator Size (SF)Y-o-Y
Growth% of
Market# of
LocationsDominant
SubmarketRegus 173,296 52.0% 29.7% 10 Maitland Center
WeWork 73,380 0.0% 12.6% 1 Downtown/CBD
YourOffice 50,189 0.0% 8.6% 2 Downtown/CBD
Orlando Office Center 35,623 0.0% 6.1% 3 Lake Mary/Heathrow
Crealde Business Center LLC 35,000 0.0% 6.0% 1 North Orlando
Total Top Five 367,488 63.0% 17 Top 5 as a % of Total 63.0%
Orlando Q2 2020 Y-o-Y GrowthFlexible Office Sq. Ft. 583,734 14.6%
Downtown Flex Sq. Ft. 290,460 -2.3%
Suburban Flex Sq. Ft. 293,274 38.2%
Overall Market Penetration (%) 1.4% 0.1%
Downtown Penetration (%) 3.3% -0.4%
Suburban Penetration (%) 0.9% 0.2%
# of Operators 21 0
# of Locations 35 +4
Avg. Size of Location (SF) 16,678
0.0
0.2
1.6
1.4
1.2
0.8
1.0
0.4
0.6
700,000
600,000
500,000
400,000
300,000
200,000
100,000
0
Orlando
79© 2020 CBRE, Inc.

FLEXIBLE OFFICE HISTORICAL INVENTORY FLEXIBLE OFFICE INVENTORY – COMPOSITION OVER TIME
LARGEST FLEXIBLE OPERATOR TRANSACTIONS Q3 2019 – Q2 2020
TOP FLEXIBLE SPACE OPERATORS MARKET STATISTICS
H1 2019
H1 2019
H1 2015
H1 2015
H1 2012
H1 2012
H1 2018
H1 2018
H1 2014
H1 2014
H1 2011
H1 2011
H1 2017
H1 2017
H1 2013
H1 2013
H1 2010
H1 2010
H1 2020
H1 2020
H1 2016
H1 2016
Sq. Ft. (%)Downtown (L) Suburban (L) Penetration % (R) Downtown Suburban
100
80
90
60
70
40
50
20
30
10
0
(%)
APPENDIX HOME
Source: CBRE Research, Q2 2020.
Operator Size (SF)Y-o-Y
Growth% of
Market# of
LocationsDominant
SubmarketWeWork 217,000 0.0% 16.4% 5 Market West
Cambridge Innovation Center 127,000 0.0% 9.6% 1 University City
Industrious 120,000 60.0% 9.1% 3 Market West
1776 118,500 0.0% 9.0% 6 University City
MakeOffices 114,316 0.0% 8.7% 3 Market West
Total Top Five 696,816 52.8% 18 Top 5 as a % of Total 52.8%
Operator Size (SF) Quarter SubmarketBuilding
ClassCommonGrounds Workplace 63,000 Q3 2019 Market West A
HANA 51,000 Q1 2020 Market West A
Industrious 45,000 Q3 2019 Market East A
Mindspace 41,000 Q1 2020 Market East A
Total Top Five 200,000
Total Sq. Ft. New Transactions Y-o-Y 200,000
Top 5 as a % of Total 100.0%
Most Dominant Submarket % of Flex Office Inventory % of Total Y-o-Y TransactionsMarket West 50.4% 56.9%
Low HighSingle Office/Suite Rates $410 $550
Philadelphia Q2 2020 Y-o-Y GrowthFlexible Office Sq. Ft. 1,319,835 13.0%
Downtown Flex Sq. Ft. 1,235,835 14.0%
Suburban Flex Sq. Ft. 84,000 0.0%
Overall Market Penetration (%) 1.2% 0.1%
Downtown Penetration (%) 2.7% 0.3%
Suburban Penetration (%) 0.1% 0.0%
# of Operators 25 0
# of Locations 47 +1
Avg. Size of Location (SF) 28,082
1.4
1.2
1.0
0.8
0.4
0.6
0.0
0.2
1,400,000
1,200,000
1,000,000
800,000
600,000
400,000
200,000
0
Philadelphia
80 North America Flexible Office Market in 2020

FLEXIBLE OFFICE HISTORICAL INVENTORY FLEXIBLE OFFICE INVENTORY – COMPOSITION OVER TIME
LARGEST FLEXIBLE OPERATOR TRANSACTIONS
TOP FLEXIBLE SPACE OPERATORS MARKET STATISTICS
H1 2019
H1 2019
H1 2015
H1 2015
H1 2012
H1 2012
H1 2018
H1 2018
H1 2014
H1 2014
H1 2011
H1 2011
H1 2017
H1 2017
H1 2013
H1 2013
H1 2010
H1 2010
H1 2020
H1 2020
H1 2016
H1 2016
Sq. Ft. (%)Dowtown (L) Suburban (L) Penetration % (R) Dowtown Suburban
100
80
90
60
70
40
50
20
30
10
0
(%)
APPENDIX HOME
Source: CBRE Research, Q2 2020.
Operator Size (SF)Y-o-Y
Growth% of
Market# of
LocationsDominant
Submarket
Regus 501,218 20.8% 39.3% 25 Camelback/ Piestewa Peak
WeWork 267,743 25.4% 21.0% 4 CBD
Industrious 83,919 0.0% 6.6% 3 Central/South Scottsdale
Novel Coworking 83,498 0.0% 6.5% 2 CBD
Spaces 71,567 0.0% 5.6% 2 CBD
Total Top Five 1,007,945 79.0% 36 Top 5 as a % of Total 79.0%
Operator Size (SF) Quarter SubmarketBuilding
ClassWeWork 54,000 Q3 2019 CBD B
Regus 46,000 Q4 2019 Scottsdale Airpark/Desert Ridge A
Regus 40,000 Q4 2019 Camelback/Piestewa Peak A
Co+Hoots 14,000 Q3 2019 Southeast Valley B
Total Top Five 154,000
Total Sq. Ft. New Transactions Y-o-Y 154,000
Top 5 as a % of Total 100.0%
Most Dominant Submarket % of Flex Office Inventory % of Total Y-o-Y TransactionsCBD 22.9% 35.3%
Low HighSingle Office/Suite Rates $390 $520
0 0.0
1,400,000
1,000,000
1,200,000
800,000
600,000
400,000
200,000
1.6
1.4
1.0
1.2
0.6
0.8
0.2
0.4
Phoenix Q2 2020 Y-o-Y GrowthFlexible Office Sq. Ft. 1,276,052 13.7%
Downtown Flex Sq. Ft. 292,116 22.8%
Suburban Flex Sq. Ft. 983,936 11.3%
Overall Market Penetration (%) 1.4% 0.1%
Downtown Penetration (%) 1.8% 0.3%
Suburban Penetration (%) 1.3% 0.1%
# of Operators 19 0
# of Locations 52 +4
Avg. Size of Location (SF) 24,539
Phoenix
81© 2020 CBRE, Inc.

FLEXIBLE OFFICE HISTORICAL INVENTORY FLEXIBLE OFFICE INVENTORY – COMPOSITION OVER TIME
LARGEST FLEXIBLE OPERATOR TRANSACTIONS Q3 2019 – Q2 2020
TOP FLEXIBLE SPACE OPERATORS MARKET STATISTICS
H1 2019
H1 2019
H1 2015
H1 2015
H1 2012
H1 2012
H1 2018
H1 2018
H1 2014
H1 2014
H1 2011
H1 2011
H1 2017
H1 2017
H1 2013
H1 2013
H1 2010
H1 2010
H1 2020
H1 2020
H1 2016
H1 2016
Sq. Ft. (%)Downtown (L) Suburban (L) Penetration % (R) Downtown Suburban
100
80
90
60
70
40
50
20
30
10
0
(%)
APPENDIX HOME
Source: CBRE Research, Q2 2020.
Operator Size (SF)Y-o-Y
Growth% of
Market# of
LocationsDominant
SubmarketRegus 117,524 0.0% 18.8% 7 CBD
Beauty Shoppe 111,500 0.0% 17.8% 7 Oakland/East End
Spaces 75,394 0.0% 12.0% 2 Oakland/East End
Industrious 61,596 0.0% 9.8% 2 CBD
Alloy26 50,000 0.0% 8.0% 1 Downtown Fringe
Total Top Five 416,014 66.4% 19 Top 5 as a % of Total 66.4%
Operator Size (SF) Quarter SubmarketBuilding
ClassNo new transactions in the past year - - - -
Most Dominant Submarket % of Flex Office Inventory % of Total Y-o-Y TransactionsCBD 36.4% 0.0%
Low HighSingle Office/Suite Rates $390 $570
0 0.0
0.3
700,000
600,000
500,000
400,000
300,000
200,000
100,000
0.9
0.8
0.6
0.4
0.7
0.2
0.1
0.5
Pittsburgh Q2 2020 Y-o-Y GrowthFlexible Office Sq. Ft. 626,297 0.0%
Downtown Flex Sq. Ft. 344,871 0.0%
Suburban Flex Sq. Ft. 281,426 0.0%
Overall Market Penetration (%) 0.8% 0.0%
Downtown Penetration (%) 0.8% 0.0%
Suburban Penetration (%) 0.8% 0.0%
# of Operators 17 0
# of Locations 35 0
Avg. Size of Location (SF) 17,894
Pittsburgh
82 North America Flexible Office Market in 2020

FLEXIBLE OFFICE HISTORICAL INVENTORY FLEXIBLE OFFICE INVENTORY – COMPOSITION OVER TIME
LARGEST FLEXIBLE OPERATOR TRANSACTIONS
TOP FLEXIBLE SPACE OPERATORS MARKET STATISTICS
H1 2019
H1 2019
H1 2015
H1 2015
H1 2012
H1 2012
H1 2018
H1 2018
H1 2014
H1 2014
H1 2011
H1 2011
H1 2017
H1 2017
H1 2013
H1 2013
H1 2010
H1 2010
H1 2020
H1 2020
H1 2016
H1 2016
Sq. Ft. (%)Dowtown (L) Suburban (L) Penetration % (R) Dowtown Suburban
100
80
90
60
70
40
50
20
30
10
0
(%)
APPENDIX HOME
Source: CBRE Research, Q2 2020.
Operator Size (SF)Y-o-Y
Growth% of
Market# of
LocationsDominant
SubmarketRegus 258,723 0.0% 33.6% 18 CBD
WeWork 224,144 0.0% 29.1% 4 CBD
Centrl Office 92,289 0.0% 12.0% 4 Lake Oswego
Spaces 76,486 0.0% 9.9% 2 Northwest
Industrious 28,323 0.0% 3.7% 1 CBD
Total Top Five 679,965 88.3% 29 Top 5 as a % of Total 88.3%
Operator Size (SF) Quarter SubmarketBuilding
ClassValera Suites 3,000 Q1 2020 Vancouver B
Total Top Five 3,000
Total Sq. Ft. New Transactions Y-o-Y 3,000
Top 5 as a % of Total 100.0%
Most Dominant Submarket % of Flex Office Inventory % of Total Y-o-Y TransactionsCBD 27.9% 0.0%
Low HighSingle Office/Suite Rates $460 $560
900,000
800,000
700,000
600,000
500,000
400,000
300,000
100,000
200,000
0
1.8
1.6
1.2
1.4
0.8
1.0
0.4
0.6
0.0
0.2
Portland Q2 2020 Y-o-Y GrowthFlexible Office Sq. Ft. 770,331 0.4%
Downtown Flex Sq. Ft. 527,217 0.0%
Suburban Flex Sq. Ft. 243,114 1.2%
Overall Market Penetration (%) 1.5% 0.0%
Downtown Penetration (%) 2.0% 0.0%
Suburban Penetration (%) 1.0% 0.0%
# of Operators 15 +1
# of Locations 42 +1
Avg. Size of Location (SF) 18,341
Portland
83© 2020 CBRE, Inc.

FLEXIBLE OFFICE HISTORICAL INVENTORY FLEXIBLE OFFICE INVENTORY – COMPOSITION OVER TIME
LARGEST FLEXIBLE OPERATOR TRANSACTIONS Q3 2019 – Q2 2020
TOP FLEXIBLE SPACE OPERATORS MARKET STATISTICS
H1 2019
H1 2019
H1 2015
H1 2015
H1 2012
H1 2012
H1 2018
H1 2018
H1 2014
H1 2014
H1 2011
H1 2011
H1 2017
H1 2017
H1 2013
H1 2013
H1 2010
H1 2010
H1 2020
H1 2020
H1 2016
H1 2016
Sq. Ft. (%)Downtown (L) Suburban (L) Penetration % (R) Downtown Suburban
100
80
90
60
70
40
50
20
30
10
0
(%)
2.5
2.0
1.5
1.0
0.5
0.0
APPENDIX HOME
Source: CBRE Research, Q2 2020.
Operator Size (SF)Y-o-Y
Growth% of
Market# of
LocationsDominant
SubmarketRegus 223,862 0.0% 19.9% 11 RTP/I-40 Corridor
WeWork 217,314 0.0% 19.3% 3 Central Durham
Spaces 180,703 0.0% 16.1% 5 Central Durham
American Underground 108,842 0.0% 9.7% 4 Central Durham
HQ Raleigh 103,542 0.0% 9.2% 5 Downtown Raleigh
Total Top Five 834,263 74.2% 28 Top 5 as a % of Total 74.2%
Operator Size (SF) Quarter SubmarketBuilding
ClassIndustrious 28,000 Q3 2019 Downtown Raleigh A
Total Top Five 28,000
Total Sq. Ft. New Transactions Y-o-Y 28,000
Top 5 as a % of Total 100.0%
Most Dominant Submarket % of Flex Office Inventory % of Total Y-o-Y TransactionsCentral Durham 26.5% 0.0%
Low HighSingle Office/Suite Rates $400 $610
1,200,000
1,000,000
800,000
600,000
400,000
200,000
0
Raleigh-Durham Q2 2020 Y-o-Y GrowthFlexible Office Sq. Ft. 1,124,243 2.5%
Downtown Flex Sq. Ft. 568,876 5.1%
Suburban Flex Sq. Ft. 555,367 0.0%
Overall Market Penetration (%) 1.9% 0.0%
Downtown Penetration (%) 5.7% 0.1%
Suburban Penetration (%) 1.2% 0.0%
# of Operators 18 0
# of Locations 43 +1
Avg. Size of Location (SF) 26,145
Raleigh-Durham
84 North America Flexible Office Market in 2020

FLEXIBLE OFFICE HISTORICAL INVENTORY FLEXIBLE OFFICE INVENTORY – COMPOSITION OVER TIME
LARGEST FLEXIBLE OPERATOR TRANSACTIONS
TOP FLEXIBLE SPACE OPERATORS MARKET STATISTICS
H1 2019
H1 2019
H1 2015
H1 2015
H1 2012
H1 2012
H1 2018
H1 2018
H1 2014
H1 2014
H1 2011
H1 2011
H1 2017
H1 2017
H1 2013
H1 2013
H1 2010
H1 2010
H1 2020
H1 2020
H1 2016
H1 2016
Sq. Ft. (%)Dowtown (L) Suburban (L) Penetration % (R) Dowtown Suburban
100
80
90
60
70
40
50
20
30
10
0
(%)
APPENDIX HOME
Source: CBRE Research, Q2 2020.
Operator Size (SF)Y-o-Y
Growth% of
Market# of
LocationsDominant
SubmarketRegus 93,942 0.0% 36.3% 5 West End
Gather 56,000 0.0% 21.7% 3 Monroe Ward
1717 Innovation Center 42,000 0.0% 16.2% 1 Shockoe Bottom
Business Suites International 25,393 0.0% 9.8% 1 Innsbrook
Novel Coworking 23,357 0.0% 9.0% 1 CBD
Total Top Five 240,692 93.1% 11 Top 5 as a % of Total 93.1%
Operator Size (SF) Quarter SubmarketBuilding
ClassNo new transactions in the past year - - - -
Most Dominant Submarket % of Flex Office Inventory % of Total Y-o-Y TransactionsInnsbrook 22.9% 0.0%
Low HighSingle Office/Suite Rates $390 $570
300,000
250,000
200,000
150,000
100,000
50,000
0
0.8
0.7
0.5
0.6
0.4
0.2
0.3
0.0
0.1
Richmond, VA Q2 2020 Y-o-Y GrowthFlexible Office Sq. Ft. 258,554 0.0%
Downtown Flex Sq. Ft. 35,909 0.0%
Suburban Flex Sq. Ft. 222,645 0.0%
Overall Market Penetration (%) 0.7% 0.0%
Downtown Penetration (%) 0.6% -0.1%
Suburban Penetration (%) 0.8% 0.0%
# of Operators 6 0
# of Locations 12 0
Avg. Size of Location (SF) 21,546
Richmond, VA
85© 2020 CBRE, Inc.

FLEXIBLE OFFICE HISTORICAL INVENTORY FLEXIBLE OFFICE INVENTORY – COMPOSITION OVER TIME
LARGEST FLEXIBLE OPERATOR TRANSACTIONS Q3 2019 – Q2 2020
TOP FLEXIBLE SPACE OPERATORS MARKET STATISTICS
H1 2019
H1 2019
H1 2015
H1 2015
H1 2012
H1 2012
H1 2018
H1 2018
H1 2014
H1 2014
H1 2011
H1 2011
H1 2017
H1 2017
H1 2013
H1 2013
H1 2010
H1 2010
H1 2020
H1 2020
H1 2016
H1 2016
Sq. Ft. (%)Downtown (L) Suburban (L) Penetration % (R) Downtown Suburban
100
80
90
60
70
40
50
20
30
10
0
(%)
APPENDIX HOME
Source: CBRE Research, Q2 2020.
Operator Size (SF)Y-o-Y
Growth% of
Market# of
LocationsDominant
SubmarketRegus 170,191 0.0% 40.2% 9 Downtown
WeWork 96,000 -33.0% 22.7% 1 Downtown
Pacific Workplaces 58,269 0.0% 13.7% 3 Highway 50 Corridor
Spaces 34,800 0.0% 8.2% 1 Midtown
The Urban Hive 25,426 0.0% 6.0% 2 East Sacramento
Total Top Five 384,686 90.8% 16 Top 5 as a % of Total 90.8%
Operator Size (SF) Quarter SubmarketBuilding
ClassCoworking Partners Inc dba The Studio Coworking 7,000 Q3 2019 Roseville/Rocklin A
Total Top Five 7,000
Total Sq. Ft. New Transactions Y-o-Y 7,000
Top 5 as a % of Total 100.0%
Most Dominant Submarket % of Flex Office Inventory % of Total Y-o-Y TransactionsDowntown 40.8% 0.0%
Low HighSingle Office/Suite Rates $410 $560
0 0.0
600,000
500,000
400,000
300,000
200,000
100,000
1.0
0.8
0.6
0.4
0.2
Sacramento Q2 2020 Y-o-Y GrowthFlexible Office Sq. Ft. 423,799 -12.3%
Downtown Flex Sq. Ft. 172,923 -21.5%
Suburban Flex Sq. Ft. 250,876 -4.7%
Overall Market Penetration (%) 0.8% -0.1%
Downtown Penetration (%) 1.7% -0.4%
Suburban Penetration (%) 0.6% 0.0%
# of Operators 9 0
# of Locations 20 -1
Avg. Size of Location (SF) 21,190
Sacramento
86 North America Flexible Office Market in 2020

FLEXIBLE OFFICE HISTORICAL INVENTORY FLEXIBLE OFFICE INVENTORY – COMPOSITION OVER TIME
LARGEST FLEXIBLE OPERATOR TRANSACTIONS
TOP FLEXIBLE SPACE OPERATORS MARKET STATISTICS
H1 2019
H1 2019
H1 2015
H1 2015
H1 2012
H1 2012
H1 2018
H1 2018
H1 2014
H1 2014
H1 2011
H1 2011
H1 2017
H1 2017
H1 2013
H1 2013
H1 2010
H1 2010
H1 2020
H1 2020
H1 2016
H1 2016
Sq. Ft. (%)Dowtown (L) Suburban (L) Penetration % (R) Dowtown Suburban
100
80
90
60
70
40
50
20
30
10
0
(%)
APPENDIX HOME
Source: CBRE Research, Q2 2020.
Operator Size (SF)Y-o-Y
Growth% of
Market# of
LocationsDominant
SubmarketWeWork 257,202 0.0% 31.9% 5 Lehi
Regus 126,353 0.0% 15.7% 9 Sandy South Towne
Vivo Office 90,002 0.0% 11.2% 4 Lehi
Kiln 57,367 0.0% 7.1% 2 Lehi
Spaces 47,058 0.0% 5.8% 1 Lehi
Total Top Five 577,982 71.6% 21 Top 5 as a % of Total 71.6%
Most Dominant Submarket % of Flex Office Inventory % of Total Y-o-Y TransactionsLehi 31.5% 0.0%
Low HighSingle Office/Suite Rates $400 $510
900,000
800,000
700,000
600,000
500,000
400,000
300,000
200,000
100,000
0
2.0
1.6
1.2
0.8
0.4
0.0
Salt Lake City Q2 2020 Y-o-Y GrowthFlexible Office Sq. Ft. 806,716 0.0%
Downtown Flex Sq. Ft. 341,986 0.0%
Suburban Flex Sq. Ft. 464,730 0.0%
Overall Market Penetration (%) 1.6% -0.1%
Downtown Penetration (%) 2.9% 0.0%
Suburban Penetration (%) 1.2% -0.1%
# of Operators 16 0
# of Locations 37 0
Avg. Size of Location (SF) 21,803
Salt Lake City
Operator Size (SF) Quarter SubmarketBuilding
ClassNo new transactions in the past year - - - -
87© 2020 CBRE, Inc.

FLEXIBLE OFFICE HISTORICAL INVENTORY FLEXIBLE OFFICE INVENTORY – COMPOSITION OVER TIME
LARGEST FLEXIBLE OPERATOR TRANSACTIONS Q3 2019 – Q2 2020
TOP FLEXIBLE SPACE OPERATORS MARKET STATISTICS
H1 2019
H1 2019
H1 2015
H1 2015
H1 2012
H1 2012
H1 2018
H1 2018
H1 2014
H1 2014
H1 2011
H1 2011
H1 2017
H1 2017
H1 2013
H1 2013
H1 2010
H1 2010
H1 2020
H1 2020
H1 2016
H1 2016
Sq. Ft. (%)Downtown (L) Suburban (L) Penetration % (R) Downtown Suburban
100
80
90
60
70
40
50
20
30
10
0
(%)
APPENDIX HOME
Source: CBRE Research, Q2 2020.
Operator Size (SF)Y-o-Y
Growth% of
Market# of
LocationsDominant
SubmarketRegus 123,237 0.0% 34.2% 9 Far North Central
WeWork 71,872 0.0% 19.9% 2 CBD
Geekdom 31,648 0.0% 8.8% 1 CBD
Legacy Office Centers 29,339 0.0% 8.1% 1 Northwest
Venture X 22,124 0.0% 6.1% 1 Far North Central
Total Top Five 278,220 77.1% 14 Top 5 as a % of Total 77.1%
Operator Size (SF) Quarter SubmarketBuilding
ClassSpace on the Fly 5,000 Q3 2019 North Central B
Venture Point 5,000 Q3 2019 Northeast B
Paradox 4,000 Q3 2019 North Central Other*
Total Top Five 14,000
Total Sq. Ft. New Transactions Y-o-Y 14,000
Top 5 as a % of Total 100.0%
Most Dominant Submarket % of Flex Office Inventory % of Total Y-o-Y TransactionsCBD 39.0% 0.0%
Low HighSingle Office/Suite Rates $400 $530
400,000
350,000
300,000
250,000
200,000
150,000
100,000
50,000
0
1.4
1.2
1.0
0.8
0.4
0.6
0.0
0.2
San Antonio Q2 2020 Y-o-Y GrowthFlexible Office Sq. Ft. 360,713 4.1%
Downtown Flex Sq. Ft. 140,648 0.0%
Suburban Flex Sq. Ft. 220,065 6.8%
Overall Market Penetration (%) 1.1% 0.0%
Downtown Penetration (%) 2.6% 0.0%
Suburban Penetration (%) 0.8% 0.0%
# of Operators 16 +2
# of Locations 28 +3
Avg. Size of Location (SF) 12,883
San Antonio
*Not located in a traditional office space.
88 North America Flexible Office Market in 2020

FLEXIBLE OFFICE HISTORICAL INVENTORY FLEXIBLE OFFICE INVENTORY – COMPOSITION OVER TIME
LARGEST FLEXIBLE OPERATOR TRANSACTIONS
TOP FLEXIBLE SPACE OPERATORS MARKET STATISTICS
H1 2019
H1 2019
H1 2015
H1 2015
H1 2012
H1 2012
H1 2018
H1 2018
H1 2014
H1 2014
H1 2011
H1 2011
H1 2017
H1 2017
H1 2013
H1 2013
H1 2010
H1 2010
H1 2020
H1 2020
H1 2016
H1 2016
Sq. Ft. (%)Dowtown (L) Suburban (L) Penetration % (R) Dowtown Suburban
100
80
90
60
70
40
50
20
30
10
0
(%)
APPENDIX HOME
Source: CBRE Research, Q2 2020.
Operator Size (SF)Y-o-Y
Growth% of
Market# of
LocationsDominant
SubmarketRegus 266,332 0.0% 18.9% 16 Central San Diego
Premier Workspaces 152,553 0.0% 10.8% 9 Central San Diego
WeWork 140,644 0.0% 10.0% 2 Downtown
Jlabs 122,000 0.0% 8.7% 1 Central San Diego
Spaces 98,053 0.0% 7.0% 3 Downtown
Total Top Five 779,582 55.3% 31 Top 5 as a % of Total 55.3%
Operator Size (SF) Quarter SubmarketBuilding
ClassIndustrious 29,000 Q3 2019 Central San Diego A
Maketory 26,000 Q2 2020 Central San Diego B
SmartSpace 18,000 Q1 2020 North County B
SmartSpace 15,000 Q1 2020 Central San Diego B
Tailored Space 5,000 Q2 2020 North County A
Total Top Five 93,000
Total Sq. Ft. New Transactions Y-o-Y 97,000
Top 5 as a % of Total 95.9%
Low HighSingle Office/Suite Rates $380 $520
Most Dominant Submarket % of Flex Office Inventory % of Total Y-o-Y TransactionsCentral San Diego 42.4% 72.6%
1,600,000
1,400,000
1,200,000
1,000,000
800,000
600,000
400,000
200,000
0
2.0
1.6
1.2
0.8
0.4
0.0
San Diego Q2 2020 Y-o-Y GrowthFlexible Office Sq. Ft. 1,408,640 5.1%
Downtown Flex Sq. Ft. 504,924 0.0%
Suburban Flex Sq. Ft. 903,716 8.2%
Overall Market Penetration (%) 1.8% 0.1%
Downtown Penetration (%) 4.2% -0.2%
Suburban Penetration (%) 1.4% 0.1%
# of Operators 41 +1
# of Locations 83 +2
Avg. Size of Location (SF) 16,972
San Diego
89© 2020 CBRE, Inc.

FLEXIBLE OFFICE HISTORICAL INVENTORY
LARGEST FLEXIBLE OPERATOR TRANSACTIONS Q3 2019 – Q2 2020
TOP FLEXIBLE SPACE OPERATORS MARKET STATISTICS
H1 2019
H1 2015
H1 2012
H1 2018
H1 2014
H1 2011
H1 2017
H1 2013
H1 2010
H1 2020
H1 2016
Sq. Ft. Downtown (L) Suburban (L) Penetration % (R) (%)
APPENDIX HOME
Source: CBRE Research, Q2 2020.
Low HighSingle Office/Suite Rates $520 $810
Most Dominant Submarket % of Flex Office Inventory % of Total Y-o-Y TransactionsFinancial District 45.2% 54.5%
Operator Size (SF) Quarter SubmarketBuilding
ClassWeWork 83,000 Q3 2019 Financial District A
Knotel 83,000 Q1 2020 South of Market A
Knotel 61,000 Q3 2019 South Financial District A
WeWork 46,000 Q4 2019 South Financial District A
WeWork 44,000 Q4 2019 Financial District A
Total Top Five 317,000
Total Sq. Ft. New Transactions Y-o-Y 501,000
Top 5 as a % of Total 63.3%
Operator Size (SF)Y-o-Y
Growth% of
Market# of
LocationsDominant
SubmarketWeWork 2,081,996 14.0% 52.8% 33 Financial District
Knotel 831,676 41.7% 21.1% 38 South of Market
Regus 442,413 0.0% 11.2% 15 Financial District
Galvanize 60,500 0.0% 1.5% 1 South Financial District
RocketSpace 56,268 -49.5% 1.4% 1 South Financial District
Total Top Five 3,472,853 88.0% 88 Top 5 as a % of Total 88.0%
4,500,000
4,000,000
3,500,000
3,000,000
2,500,000
2,000,000
1,500,000
1,000,000
500,000
0
6.0
5.0
4.0
3.0
2.0
1.0
0.0
San Francisco Q2 2020 Y-o-Y GrowthFlexible Office Sq. Ft. 3,946,288 10.9%
Downtown Flex Sq. Ft. 3,946,288 10.9%
Suburban Flex Sq. Ft. N/A N/A
Overall Market Penetration (%) 4.8% 0.4%
Downtown Penetration (%) 4.8% 0.4%
Suburban Penetration (%) N/A N/A
# of Operators 28 -5
# of Locations 114 +5
Avg. Size of Location (SF) 34,617
San Francisco
90 North America Flexible Office Market in 2020

FLEXIBLE OFFICE HISTORICAL INVENTORY
LARGEST FLEXIBLE OPERATOR TRANSACTIONS
TOP FLEXIBLE SPACE OPERATORS MARKET STATISTICS
H1 2019
H1 2015
H1 2012
H1 2018
H1 2014
H1 2011
H1 2017
H1 2013
H1 2010
H1 2020
H1 2016
Sq. Ft. Dowtown (L) Suburban (L) Penetration % (R) (%)
APPENDIX HOME
Source: CBRE Research, Q2 2020.
Operator Size (SF)Y-o-Y
Growth% of
Market# of
LocationsDominant
SubmarketWeWork 207,184 22.0% 39.4% 4 San Mateo
Spaces 87,370 0.0% 16.6% 3 Menlo Park
Regus 87,207 -22.1% 16.6% 6 Palo Alto/East Palo Alto
NestGSV 48,884 0.0% 9.3% 1 San Mateo
Hero City 20,000 0.0% 3.8% 1 San Mateo
Total Top Five 450,645 85.6% 15 Top 5 as a % of Total 85.6%
Operator Size (SF) Quarter SubmarketBuilding
ClassWeWork 37,000 Q3 2019 San Mateo A
Total Top Five 37,000
Total Sq. Ft. New Transactions Y-o-Y 37,000
Top 5 as a % of Total 100.0%
Most Dominant Submarket % of Flex Office Inventory % of Total Y-o-Y TransactionsSan Mateo 53.7% 100.0%
Low HighSingle Office/Suite Rates $520 $810
1.4
1.2
1.0
0.8
0.4
0.6
0.0
0.2
600,000
500,000
400,000
300,000
200,000
100,000
0
San Francisco Peninsula Q2 2020 Y-o-Y GrowthFlexible Office Sq. Ft. 526,451 1.5%
Downtown Flex Sq. Ft. N/A N/A
Suburban Flex Sq. Ft. 526,451 1.5%
Overall Market Penetration (%) 1.3% 0.0%
Downtown Penetration (%) N/A N/A
Suburban Penetration (%) 1.3% 0.0%
# of Operators 13 -1
# of Locations 24 -1
Avg. Size of Location (SF) 21,935
San Francisco Peninsula
91© 2020 CBRE, Inc.

FLEXIBLE OFFICE HISTORICAL INVENTORY FLEXIBLE OFFICE INVENTORY – COMPOSITION OVER TIME
LARGEST FLEXIBLE OPERATOR TRANSACTIONS Q3 2019 – Q2 2020
TOP FLEXIBLE SPACE OPERATORS MARKET STATISTICS
H1 2019
H1 2019
H1 2015
H1 2015
H1 2012
H1 2012
H1 2018
H1 2018
H1 2014
H1 2014
H1 2011
H1 2011
H1 2017
H1 2017
H1 2013
H1 2013
H1 2010
H1 2010
H1 2020
H1 2020
H1 2016
H1 2016
Sq. Ft. (%)Downtown (L) Suburban (L) Penetration % (R) Downtown Suburban
3,000,000 100
2,500,000 80
90
2,000,00060
70
1,500,000
40
50
1,000,000
20
30
500,00010
0 0
(%)
2.5
2.0
1.5
1.0
0.5
0.0
APPENDIX HOME
Source: CBRE Research, Q2 2020.
Operator Size (SF) Quarter SubmarketBuilding
ClassWeWork 63,000 Q3 2019 Eastside A
WeWork 15,000 Q3 2019 Downtown Seattle A
TractionSpace 13,000 Q4 2019 Tacoma/Fife C
Works Progress 3,000 Q4 2019 Seattle Close-In C
Total Top Five 94,000
Total Sq. Ft. New Transactions Y-o-Y 94,000
Top 5 as a % of Total 100.0%
Operator Size (SF)Y-o-Y
Growth% of
Market# of
LocationsDominant
SubmarketWeWork 1,607,277 5.1% 67.1% 26 Downtown Seattle
Regus 403,523 0.0% 16.9% 19 Eastside
Spaces 169,455 0.0% 7.1% 3 Downtown Seattle
Industrious 79,805 0.0% 3.3% 2 Downtown Seattle
Thinkspace 44,464 0.0% 1.9% 2 Eastside
Total Top Five 2,304,524 96.2% 52 Top 5 as a % of Total 96.2%
Low HighSingle Office/Suite Rates $540 $710
Most Dominant Submarket % of Flex Office Inventory % of Total Y-o-Y TransactionsDowntown Seattle 60.6% 15.9%
Seattle Q2 2020 Y-o-Y GrowthFlexible Office Sq. Ft. 2,394,637 2.2%
Downtown Flex Sq. Ft. 1,451,675 0.1%
Suburban Flex Sq. Ft. 942,962 5.5%
Overall Market Penetration (%) 2.2% 0.0%
Downtown Penetration (%) 2.8% -0.1%
Suburban Penetration (%) 1.6% 0.1%
# of Operators 12 0
# of Locations 62 0
Avg. Size of Location (SF) 38,623
Seattle
92 North America Flexible Office Market in 2020
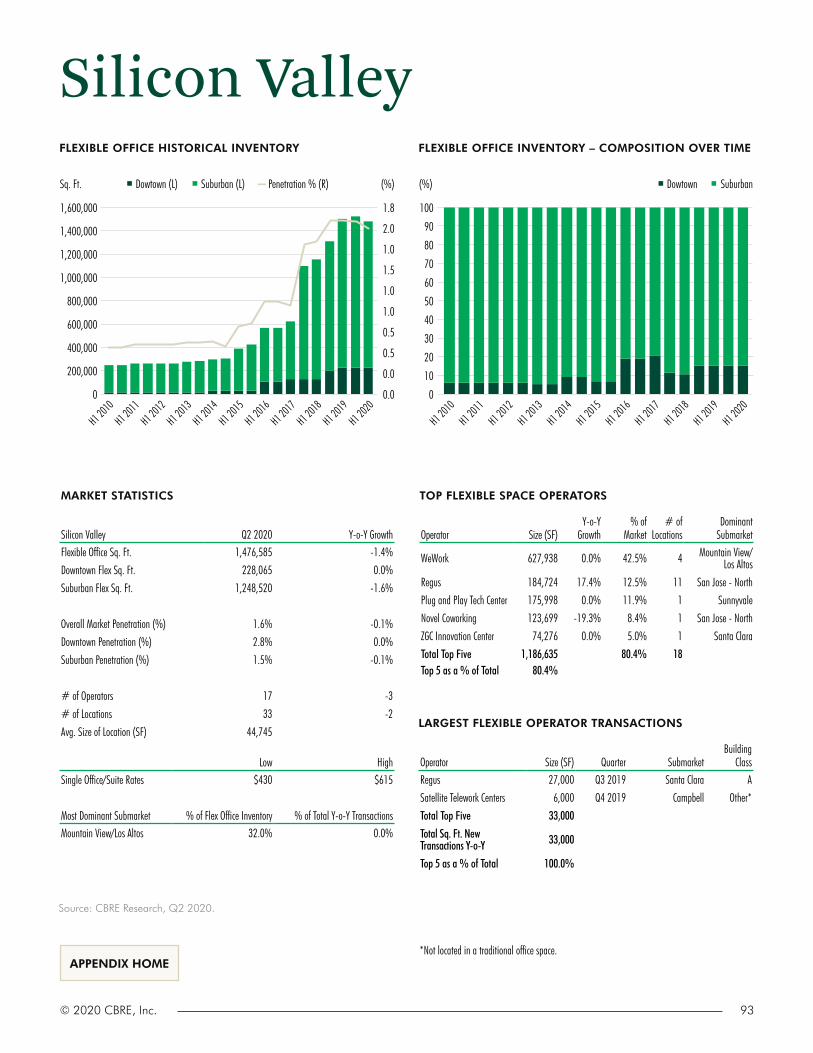
FLEXIBLE OFFICE HISTORICAL INVENTORY FLEXIBLE OFFICE INVENTORY – COMPOSITION OVER TIME
LARGEST FLEXIBLE OPERATOR TRANSACTIONS
TOP FLEXIBLE SPACE OPERATORS MARKET STATISTICS
H1 2019
H1 2019
H1 2015
H1 2015
H1 2012
H1 2012
H1 2018
H1 2018
H1 2014
H1 2014
H1 2011
H1 2011
H1 2017
H1 2017
H1 2013
H1 2013
H1 2010
H1 2010
H1 2020
H1 2020
H1 2016
H1 2016
Sq. Ft. (%)Dowtown (L) Suburban (L) Penetration % (R) Dowtown Suburban
100
80
90
60
70
40
50
20
30
10
0
(%)
APPENDIX HOME
Source: CBRE Research, Q2 2020.
Operator Size (SF) Quarter SubmarketBuilding
ClassRegus 27,000 Q3 2019 Santa Clara A
Satellite Telework Centers 6,000 Q4 2019 Campbell Other*
Total Top Five 33,000
Total Sq. Ft. New Transactions Y-o-Y 33,000
Top 5 as a % of Total 100.0%
Operator Size (SF)Y-o-Y
Growth% of
Market# of
LocationsDominant
Submarket
WeWork 627,938 0.0% 42.5% 4 Mountain View/Los Altos
Regus 184,724 17.4% 12.5% 11 San Jose - North
Plug and Play Tech Center 175,998 0.0% 11.9% 1 Sunnyvale
Novel Coworking 123,699 -19.3% 8.4% 1 San Jose - North
ZGC Innovation Center 74,276 0.0% 5.0% 1 Santa Clara
Total Top Five 1,186,635 80.4% 18 Top 5 as a % of Total 80.4%
Most Dominant Submarket % of Flex Office Inventory % of Total Y-o-Y TransactionsMountain View/Los Altos 32.0% 0.0%
Low HighSingle Office/Suite Rates $430 $615
0 0.0
0.0
1,600,000
1,400,000
1,200,000
1,000,000
800,000
600,000
400,000
200,000
1.8
2.0
1.5
1.0
1.0
1.0
0.5
0.5
Silicon Valley Q2 2020 Y-o-Y GrowthFlexible Office Sq. Ft. 1,476,585 -1.4%
Downtown Flex Sq. Ft. 228,065 0.0%
Suburban Flex Sq. Ft. 1,248,520 -1.6%
Overall Market Penetration (%) 1.6% -0.1%
Downtown Penetration (%) 2.8% 0.0%
Suburban Penetration (%) 1.5% -0.1%
# of Operators 17 -3
# of Locations 33 -2
Avg. Size of Location (SF) 44,745
Silicon Valley
*Not located in a traditional office space.
93© 2020 CBRE, Inc.

FLEXIBLE OFFICE HISTORICAL INVENTORY FLEXIBLE OFFICE INVENTORY – COMPOSITION OVER TIME
LARGEST FLEXIBLE OPERATOR TRANSACTIONS Q3 2019 – Q2 2020
TOP FLEXIBLE SPACE OPERATORS MARKET STATISTICS
H1 2019
H1 2019
H1 2015
H1 2015
H1 2012
H1 2012
H1 2018
H1 2018
H1 2014
H1 2014
H1 2011
H1 2011
H1 2017
H1 2017
H1 2013
H1 2013
H1 2010
H1 2010
H1 2020
H1 2020
H1 2016
H1 2016
Sq. Ft. (%)Downtown (L) Suburban (L) Penetration % (R) Downtown Suburban
100
80
90
60
70
40
50
20
30
10
0
(%)
APPENDIX HOME
Source: CBRE Research, Q2 2020.
Operator Size (SF)Y-o-Y
Growth% of
Market# of
LocationsDominant
SubmarketSTL VentureWorks 154,100 0.0% 14.6% 5 CBD
CIC 127,510 0.0% 12.1% 3 CBD
Regus 103,837 0.0% 9.9% 7 West County
Brick City Makes 88,944 0.0% 8.4% 1 CBD
T-REX 76,000 0.0% 7.2% 1 CBD
Total Top Five 550,391 52.3% 17 Top 5 as a % of Total 52.3%
Operator Size (SF) Quarter SubmarketBuilding
ClassWeWork 58,000 Q3 2019 CBD A
Serendipity Labs 17,000 Q3 2019 Mid-County/Clayton A
Capital Innovators 3,000 Q4 2019 CBD B
Total Top Five 78,000
Total Sq. Ft. New Transactions Y-o-Y 78,000
Top 5 as a % of Total 100.0%
Most Dominant Submarket % of Flex Office Inventory % of Total Y-o-Y TransactionsCBD 63.0% 78.5%
Low HighSingle Office/Suite Rates $360 $460
0 0.0
1,200,000
1,000,000
800,000
600,000
400,000
200,000
2.5
2.0
1.5
1.0
0.5
St. Louis Q2 2020 Y-o-Y GrowthFlexible Office Sq. Ft. 1,052,821 5.8%
Downtown Flex Sq. Ft. 663,519 6.6%
Suburban Flex Sq. Ft. 389,302 4.5%
Overall Market Penetration (%) 2.2% 0.1%
Downtown Penetration (%) 5.3% 0.2%
Suburban Penetration (%) 1.1% 0.0%
# of Operators 35 +2
# of Locations 51 +1
Avg. Size of Location (SF) 20,644
St. Louis
94 North America Flexible Office Market in 2020

FLEXIBLE OFFICE HISTORICAL INVENTORY
LARGEST FLEXIBLE OPERATOR TRANSACTIONS
TOP FLEXIBLE SPACE OPERATORS MARKET STATISTICS
H1 2019
H1 2015
H1 2012
H1 2018
H1 2014
H1 2011
H1 2017
H1 2013
H1 2010
H1 2020
H1 2016
Sq. Ft. Dowtown (L) Suburban (L) Penetration % (R) (%)
APPENDIX HOME
Source: CBRE Research, Q2 2020.
Operator Size (SF)Y-o-Y
Growth% of
Market# of
LocationsDominant
SubmarketRegus 157,033 0.0% 25.1% 10 North Bethesda
Launch Workplaces 125,529 0.0% 20.1% 7 Rockville
WeWork 80,067 0.0% 12.8% 2 Bethesda/Chevy Chase
Perfect Office Solutions 52,962 0.0% 8.5% 6 Lanham/Landover
Carr Workplaces 48,433 0.0% 7.8% 2 Bethesda/Chevy Chase
Total Top Five 464,024 74.3% 27 Top 5 as a % of Total 74.3%
Operator Size (SF) Quarter SubmarketBuilding
ClassIntelligent Office 13,000 Q4 2019 North Rockville A
Oasis Office Space 8,000 Q4 2019 Beltsville/Calverton A
Total Top Five 21,000
Total Sq. Ft. New Transactions Y-o-Y 21,000
Top 5 as a % of Total 100.0%
Most Dominant Submarket % of Flex Office Inventory % of Total Y-o-Y TransactionsBethesda/Chevy Chase 39.4% 0.0%
Low HighSingle Office/Suite Rates $390 $540
0 0.0
Suburban Maryland Q2 2020 Y-o-Y GrowthFlexible Office Sq. Ft. 624,928 3.5%
Downtown Flex Sq. Ft. N/A N/A
Suburban Flex Sq. Ft. 624,928 3.5%
Overall Market Penetration (%) 0.8% 0.0%
Downtown Penetration (%) N/A N/A
Suburban Penetration (%) 0.8% 0.0%
# of Operators 15 +2
# of Locations 37 +2
Avg. Size of Location (SF) 16,890
Suburban Maryland
0.2
0.1
0.9
0.8
0.7
0.5
0.6
0.3
0.4
700,000
600,000
500,000
400,000
300,000
200,000
100,000
95© 2020 CBRE, Inc.

FLEXIBLE OFFICE HISTORICAL INVENTORY FLEXIBLE OFFICE INVENTORY – COMPOSITION OVER TIME
LARGEST FLEXIBLE OPERATOR TRANSACTIONS Q3 2019 – Q2 2020
TOP FLEXIBLE SPACE OPERATORS MARKET STATISTICS
H1 2019
H1 2019
H1 2015
H1 2015
H1 2012
H1 2012
H1 2018
H1 2018
H1 2014
H1 2014
H1 2011
H1 2011
H1 2017
H1 2017
H1 2013
H1 2013
H1 2010
H1 2010
H1 2020
H1 2020
H1 2016
H1 2016
Sq. Ft. (%)Downtown (L) Suburban (L) Penetration % (R) Downtown Suburban
100
80
90
60
70
40
50
20
30
10
0
(%)
APPENDIX HOME
Source: CBRE Research, Q2 2020.
Low HighSingle Office/Suite Rates $410 $580
Most Dominant Submarket % of Flex Office Inventory % of Total Y-o-Y TransactionsTampa CBD 46.4% 49.4%
Operator Size (SF) Quarter SubmarketBuilding
ClassNovel Coworking 53,000 Q1 2020 St Pete CBD A
Industrious 44,000 Q3 2019 Tampa CBD A
Industrious 44,000 Q1 2020 Tampa CBD A
Industrious 37,000 Q2 2020 St Pete CBD A
Total Top Five 178,000
Total Sq. Ft. New Transactions Y-o-Y 178,000
Top 5 as a % of Total 100.0%
Operator Size (SF)Y-o-Y
Growth% of
Market# of
LocationsDominant
SubmarketRegus 190,456 0.0% 25.7% 13 Westshore
Industrious 164,705 311.2% 22.2% 4 Tampa CBD
WeWork 100,000 0.0% 13.5% 2 Tampa CBD
Novel Coworking 53,106 0.0% 7.2% 1 St Pete CBD
Station House 35,728 0.0% 4.8% 2 Tampa CBD
Total Top Five 543,995 73.3% 22 Top 5 as a % of Total 73.3%
800,000
700,000
400,000
400,000
300,000
300,000
200,000
100,000
0
Tampa Q2 2020 Y-o-Y GrowthFlexible Office Sq. Ft. 741,825 31.5%
Downtown Flex Sq. Ft. 344,503 34.2%
Suburban Flex Sq. Ft. 397,322 29.3%
Overall Market Penetration (%) 1.4% 0.2%
Downtown Penetration (%) 5.0% 1.3%
Suburban Penetration (%) 0.9% 0.1%
# of Operators 20 +1
# of Locations 39 +4
Avg. Size of Location (SF) 19,021
Tampa
1.6
1.4
1.2
1.0
0.8
0.4
0.6
0.0
0.2
96 North America Flexible Office Market in 2020

FLEXIBLE OFFICE HISTORICAL INVENTORY FLEXIBLE OFFICE INVENTORY – COMPOSITION OVER TIME
LARGEST FLEXIBLE OPERATOR TRANSACTIONS
TOP FLEXIBLE SPACE OPERATORS MARKET STATISTICS
H1 2019
H1 2019
H1 2015
H1 2015
H1 2012
H1 2012
H1 2018
H1 2018
H1 2014
H1 2014
H1 2011
H1 2011
H1 2017
H1 2017
H1 2013
H1 2013
H1 2010
H1 2010
H1 2020
H1 2020
H1 2016
H1 2016
Sq. Ft. (%)Dowtown (L) Suburban (L) Penetration % (R) Dowtown Suburban
100
80
90
60
70
40
50
20
30
10
0
(%)
2.5
2.0
1.5
1.0
0.5
0.0
APPENDIX HOME
Source: CBRE Research, Q2 2020.
Operator Size (SF)Y-o-Y
Growth% of
Market# of
LocationsDominant
SubmarketRegus 790,151 -0.6% 22.3% 46 Financial Core
WeWork 573,500 27.8% 16.2% 9 Financial Core
Spaces 533,000 3.5% 15.1% 10 Downtown West
iQ Office Suites 144,295 0.0% 4.1% 4 Financial Core
Workhaus 128,387 0.0% 3.6% 10 Financial Core
Total Top Five 2,169,333 61.3% 79 Top 5 as a % of Total 61.3%
Operator Size (SF) Quarter SubmarketBuilding
ClassWeWork 125,000 Q4 2019 Financial Core A
HQ by WeWork 29,000 Q3 2019 Greater Core B
Knotel 23,000 Q3 2019 Financial Core A
Spaces 18,000 Q4 2019 St. Clair / Yonge A
WorkplaceOne 18,000 Q4 2019 Greater Core B
Total Top Five 213,000
Total Sq. Ft. New Transactions Y-o-Y 355,000
Top 5 as a % of Total 60.0%
Most Dominant Submarket % of Flex Office Inventory % of Total Y-o-Y TransactionsFinancial Core 20.3% 41.7%
Low HighSingle Office/Suite Rates (US$) $400 $740
4,000,000
3,500,000
3,000,000
2,500,000
2,000,000
1,500,000
1,000,000
500,000
0
Toronto Q2 2020 Y-o-Y GrowthFlexible Office Sq. Ft. 3,539,655 7.3%
Downtown Flex Sq. Ft. 2,500,579 8.1%
Suburban Flex Sq. Ft. 1,039,076 5.5%
Overall Market Penetration (%) 2.1% 0.1%
Downtown Penetration (%) 2.9% 0.2%
Suburban Penetration (%) 1.3% 0.1%
# of Operators 91 -3
# of Locations 259 +12
Avg. Size of Location (SF) 13,667
Toronto
97© 2020 CBRE, Inc.

FLEXIBLE OFFICE HISTORICAL INVENTORY FLEXIBLE OFFICE INVENTORY – COMPOSITION OVER TIME
LARGEST FLEXIBLE OPERATOR TRANSACTIONS Q3 2019 – Q2 2020
TOP FLEXIBLE SPACE OPERATORS MARKET STATISTICS
H1 2019
H1 2019
H1 2015
H1 2015
H1 2012
H1 2012
H1 2018
H1 2018
H1 2014
H1 2014
H1 2011
H1 2011
H1 2017
H1 2017
H1 2013
H1 2013
H1 2010
H1 2010
H1 2020
H1 2020
H1 2016
H1 2016
Sq. Ft. (%)Downtown (L) Suburban (L) Penetration % (R) Downtown Suburban
100
80
90
60
70
40
50
20
30
10
0
(%)
APPENDIX HOME
Source: CBRE Research, Q2 2020.
2,000,000
1,800,000
1,600,000
1,400,000
1,200,000
1,000,000
800,000
600,000
400,000
200,000
0
4.0
2.5
3.5
2.0
3.0
1.0
1.5
0.5
0.0
Operator Size (SF)Y-o-Y
Growth% of
Market# of
LocationsDominant
SubmarketWeWork 681,491 0.0% 38.0% 9 Downtown
Regus 287,626 0.0% 16.0% 18 Downtown
Spaces 272,209 75.1% 15.2% 4 Downtown
NextGen Offices 50,522 0.0% 2.8% 2 Burnaby
The Profile Coworking Business Club 47,484 0.0% 2.6% 3 Downtown
Total Top Five 1,339,332 74.6% 36 Top 5 as a % of Total 74.6%
Operator Size (SF) Quarter SubmarketBuilding
ClassSpaces 78,000 Q3 2019 Downtown Other*
Spaces 39,000 Q3 2019 Broadway Corridor A
Pavilion Coworking 12,000 Q4 2019 Broadway Corridor A
Simply Office 10,000 Q4 2019 Downtown A
Envision Co-Working 10,000 Q4 2019 Broadway Corridor C
Total Top Five 148,000
Total Sq. Ft. New Transactions Y-o-Y 171,000
Top 5 as a % of Total 86.5%
Most Dominant Submarket % of Flex Office Inventory % of Total Y-o-Y TransactionsDowntown 59.4% 52.7%
Low HighSingle Office/Suite Rates (US$) $460 $580
Vancouver Q2 2020 Y-o-Y GrowthFlexible Office Sq. Ft. 1,794,232 9.0%
Downtown Flex Sq. Ft. 1,066,289 8.7%
Suburban Flex Sq. Ft. 727,943 9.3%
Overall Market Penetration (%) 3.7% 0.3%
Downtown Penetration (%) 4.4% 0.3%
Suburban Penetration (%) 3.0% 0.3%
# of Operators 49 +4
# of Locations 91 +8
Avg. Size of Location (SF) 19,717
Vancouver
*Not located in a traditional office space.
98 North America Flexible Office Market in 2020

FLEXIBLE OFFICE HISTORICAL INVENTORY
LARGEST FLEXIBLE OPERATOR TRANSACTIONS
TOP FLEXIBLE SPACE OPERATORS MARKET STATISTICS
H1 2019
H1 2015
H1 2012
H1 2018
H1 2014
H1 2011
H1 2017
H1 2013
H1 2010
H1 2020
H1 2016
Sq. Ft. Dowtown (L) Suburban (L) Penetration % (R) (%)
APPENDIX HOME
Source: CBRE Research, Q2 2020.
Operator Size (SF) Quarter SubmarketBuilding
ClassIndustrious 25,000 Q4 2019 Concord A
Total Top Five 25,000
Total Sq. Ft. New Transactions Y-o-Y 25,000
Top 5 as a % of Total 100.0%
Most Dominant Submarket % of Flex Office Inventory % of Total Y-o-Y TransactionsSan Ramon 35.0% 0.0%
Low HighSingle Office/Suite Rates $470 $580
Operator Size (SF)Y-o-Y
Growth% of
Market# of
LocationsDominant
SubmarketRegus 120,919 0.0% 34.6% 8 San Ramon
WeWork 85,759 0.0% 24.5% 1 San Ramon
Industrious 60,981 69.5% 17.4% 2 Walnut Creek Downtown
Pacific Workplaces 31,031 0.0% 8.9% 2 Walnut Creek Downtown
Victory Space 15,000 0.0% 4.3% 2 Walnut Creek Downtown
Total Top Five 313,690 89.8% 15 Top 5 as a % of Total 89.8%
Walnut Creek/I-680 Corridor Q2 2020 Y-o-Y GrowthFlexible Office Sq. Ft. 349,513 7.7%
Downtown Flex Sq. Ft. N/A N/A
Suburban Flex Sq. Ft. 349,513 7.7%
Overall Market Penetration (%) 0.8% 0.1%
Downtown Penetration (%) N/A N/A
Suburban Penetration (%) 0.8% 0.1%
# of Operators 9 0
# of Locations 19 +1
Avg. Size of Location (SF) 18,395
400,000
350,000
300,000
250,000
200,000
150,000
100,000
50,000
0
Walnut Creek/I-680 Corridor
0.0
0.2
0.1
0.9
0.8
0.7
0.5
0.6
0.3
0.4
99© 2020 CBRE, Inc.

FLEXIBLE OFFICE HISTORICAL INVENTORY
LARGEST FLEXIBLE OPERATOR TRANSACTIONS Q3 2019 – Q2 2020
TOP FLEXIBLE SPACE OPERATORS MARKET STATISTICS
H1 2019
H1 2015
H1 2012
H1 2018
H1 2014
H1 2011
H1 2017
H1 2013
H1 2010
H1 2020
H1 2016
Sq. Ft. Downtown (L) Suburban (L) Penetration % (R) (%)
2.5
2.0
1.5
1.0
0.5
0.0
APPENDIX HOME
Source: CBRE Research, Q2 2020.
Most Dominant Submarket % of Flex Office Inventory % of Total Y-o-Y TransactionsEast End 39.5% 92.2%
Low HighSingle Office/Suite Rates $500 $780
Operator Size (SF) Quarter SubmarketBuilding
ClassWeWork 134,000 Q3 2019 East End A
Industrious 36,000 Q4 2019 East End A
WeWork 17,000 Q3 2019 CBD A
Knotel 15,000 Q3 2019 East End A
Knotel 13,000 Q4 2019 East End C
Total Top Five 214,000
Total Sq. Ft. New Transactions Y-o-Y 214,000
Top 5 as a % of Total 100.0%
Operator Size (SF)Y-o-Y
Growth% of
Market# of
LocationsDominant
SubmarketWeWork 1,369,789 12.3% 46.6% 17 East End
MakeOffices 225,885 0.0% 7.7% 6 Uptown
Regus 183,323 -5.3% 6.2% 8 East End
Convene 152,219 0.0% 5.2% 2 East End
Carr Workplaces 146,649 0.0% 5.0% 7 East End
Total Top Five 2,077,865 70.8% 40 Top 5 as a % of Total 70.8%
3,500,000
3,000,000
2,500,000
2,000,000
1,500,000
1,000,000
500,000
0
Washington, D.C. Q2 2020 Y-o-Y GrowthFlexible Office Sq. Ft. 2,936,616 7.0%
Downtown Flex Sq. Ft. 2,936,616 7.0%
Suburban Flex Sq. Ft. N/A N/A
Overall Market Penetration (%) 2.3% 0.1%
Downtown Penetration (%) 2.3% 0.1%
Suburban Penetration (%) N/A N/A
# of Operators 28 +1
# of Locations 90 +2
Avg. Size of Location (SF) 32,629
Washington, D.C.
100 North America Flexible Office Market in 2020

101© 2020 CBRE, Inc.

Disclaimer: Information contained herein, including projections, has been obtained from sources believed to be reliable. While we do not doubt its accuracy, we have not verified it and make no guarantee, warranty or representation about it. It is your responsibility to confirm independently its accuracy and completeness. This information is presented exclusively for use by CBRE clients and professionals and all rights to the material are reserved and cannot be reproduced without prior written permission of CBRE.
Richard Barkham, Ph.D.Global Chief Economist & Head of Americas Research+1 617 912 [email protected] @RichardJBarkham
Spencer LevyChairman Americas Research & Senior Economic Advisor+1 617 912 [email protected]@SpencerGLevy
Julie Whelan Vice President Head of Global Occupier Thought Leadership +1 617 912 5229 [email protected] @juliewhelancbre
Travis Deese Associate Director, Occupier Research +1 404 441 4239 [email protected]
Christelle BronSenior Managing DirectorAmericas Agile Practice Leader+1 212 984 [email protected]
Manish KashyapRegional MD, Head of Advisory & Transaction Services, Asia Pacific Global Head of Advisory & Transaction Services – Agile +65 6224 [email protected]
Whitley CollinsGlobal President Advisory & Transaction Services | Occupier+1 310 363 [email protected]
Brandon FordeExecutive Managing Director Advisory & Transaction Services | Occupier+1 404 504 [email protected]
To learn more about CBRE Research or to download our reports, visit cbre.com/research.Additional U.S. research produced by CBRE Research can be found at www.cbre.us/research.
Contacts
CBRE’S AGILE REAL ESTATE KNOWLEDGE HUB
A one-stop shop to help you better understand what agility—from coworking to flexible space to shared workplaces to optimized portfolios—means for real estate strategies and the opportunities to leverage new models and ideas. Visit cbre.com/agile.