the effects of standards-based grading and … interaction was brief (and i suppose that’s a good...
TRANSCRIPT

The Effects of Standards-Based Grading and Differentiated Reassessment on the Metacognition,
Motivation, and End of Course Assessments of 9th Grade American History Students
Benjamin Jeffry Hartnell, Ed.D
Otterbein University
April 11, 2016
Submitted in partial fulfillment of the requirements for a Masters of Arts in Education degree
Dr. Paul Wendel _____________________________________ __________ Faculty Advisor Signature Date Dr. Dee Knoblaugh _____________________________________ __________ Second Reader Signature Date Dr. Shelley Payne _____________________________________ __________ Graduate Representative Signature Date

ii
Copyright By
Benjamin Jeffry Hartnell 2016

iii
DEDICATION
To Ray.
Weather.
Golf.
Tomatoes.
And Otterbein.
I miss our conversations.
iv
ACKNOWLEDGEMENTS
• To my wife. With this degree, I am done… until the next one.
• To my son. Thank you for always telling me to “Chase it!” before my afternoon and evening
classes. I strive each and every day to be as “awesome” as you think I am.
• To my mother and father. Thank you for making me continue my education despite my
proclamation after Day #1 of 1st Grade: “Don’t even think of signing me up for 2nd!”
• To Dr. Bev Good. Without that fateful phone call in 2012, none of this would have been
possible. I can’t thank you enough for welcoming me into COELEC and continuing to support
my TESOL endeavors. What started off as a TESOL Endorsement has turned into a TESOL
degree! (Oh, and your EDUC 6240 class – TESOL in School and Society – during “J-Term” still
has, to date, the world’s longest and most grueling final exam I’ve ever sat through!)
• To Dr. Paul Wendel, my Faculty Advisor. Never before in my academic career have I been
treated so warmly and so honestly. Never before have I been provided the opportunity to work so
closely with someone so incredibly knowledgeable and, yet, so down-to-earth. I will always look
back on our Friday afternoon work sessions and recall the collegial atmosphere you created.
Your enthusiasm for my project showed just how invested you are in your students – and how
valuable you saw my potential contributions to academia. In short, working with you was like
meeting an old friend for coffee. The anecdotes, the laughter, and the celebratory colas hardly
made this project seem like a “project” at all. A toast to our provider, Laerd… and to our
redeemer, the Hake Gains! Here’s to future educational adventures and to taking the “Paul &
Ben Show” on the road!

v
• To Dr. Dee Knoblauch. The professor with the golden laugh! It’s not often that a late
evening class during the summer garners enthusiasm – but you found a way to make EDUC 6100
(21st Century Curriculum and Technology) a course I genuinely looked forward to attending
every week. Your passion for the material and our class discussions of the 4Cs were nothing
short of riveting! As my Capstone Project’s Second Reader, I appreciate your insight into
reinterpreting facets of my findings and for providing new and exciting directions to go in
moving my research forward.
• To Dr. Shelley Payne. Thank you for assisting me in contacting Dr. Stockdale for
permission to use her PRO-SDLS survey and for providing me with the “key” to interpreting its
findings. As the Graduate Representative of my Capstone Project, thank you for your sincere
excitement for what my project uncovered and for seeing the potential that it has!
• To Dr. Robert Kraft, Director of Institutional Review Board (IRB) at Otterbein. Although
our interaction was brief (and I suppose that’s a good thing when dealing with IRB!), I found
your professionalism and straightforwardness to be crucial in helping me secure permission for
conducting what I consider to be the greatest research project of my educational career.
• To Dr. Sue Constable. During the TESOL Summer Academies, I thoroughly enjoyed our
conversations about ELLs in Westerville. To be able to discuss accommodations for ELLs from
both the university and public school vantage points further demonstrated the bond that has
developed between Otterbein and its host city.

vi
• To Dr. Brenda Custodio, the instructor for my introductory EDUC 6210 class (Linguistics
and Language Acquisition). As my de facto “Welcome back to college!” professor, your
confidence in my research and writing abilities restored a level of self-assurance that maybe –
just maybe – I did know what I was doing! Your comment that my Language Acquisition paper
was like a “mini-dissertation” became one of the driving forces in turning my TESOL
Endorsement into a second master’s degree.
• To Dr. Kristin Bourdage Reninger. Our paths crossed on numerous occasions during my
eventual four year “stint” at Otterbein. As the director of the TESOL Summer Academies in
2013 and 2014, you provided me with the most authentic professional development in my career.
The opportunities I received to work with ELL students during those summers were ones that
changed my teaching practices as a whole. You assembled an amazing group of teacher-leaders
who introduced us to a plethora of new approaches to education. While it was a gauntlet at times,
the trial-and-error nature of the Summer Academies put everyone in position to try new activities
and receive immediate feedback. It was this exceptional experience that made me wish to
continue my time at Otterbein after the Academies had ended. (Of course, the unlimited ice
cream certainly wasn’t a deterrent!) As the professor of my EDUC 6400 class (Foundations of
Educational Research), you gave me and the other students a safe work space in which to further
our Capstone ideas.
vii
• To Dr. Elizabeth McNally. As one of the guest professors brought in by Otterbein during
the 2013 Summer Academy, your EDUC 6720-02 class (Integrating Literacy and TESOL
Assessment) was crucial in developing the activities and assessments for us to “test-drive” with
our ELL students. Your idiosyncratic approach and unvarying upbeat attitude toward every
obstacle we faced always helped buoy our spirits!
• To Dr. Luis Macias. As one of the guest professors brought in by Otterbein during the 2014
Summer Academy, your EDUC 6720-03 (Culture in Teaching and Learning) was pure genius!
Every activity, every paper, every film clip, every song – everything – connected beautifully to
the real-life concerns of ELLs in America. This was the absolute ideal course to take at the end
of my TESOL Endorsement because it tied everything together and breathed life into the theories
and practices we had learned leading up to it. Thank you for one of the best courses I’ve ever
taken in my academic career. (Of course, it’s a wonder any of us kept our sanity with the
constant drilling and construction outside our classroom’s windows!)
• To Dr. Daniel Cho. The Dennis Miller of Otterbein teachers! Your dry wit and “tell-it-like-
it-is” take on everything is unparalleled! Your EDUC 6000 class (Democratic Education)
produced some of the best dialogue I’ve had in my graduate studies, and our large group
discussions were brilliant! The Walking Tour of our neighborhoods shed critical light on the
living conditions and surroundings of our students and furthered your argument of the
fundamental importance of developing social capital. Your advice during the EDUC 7001 class
(Capstone Seminar) was direct, spot-on, and exactly what we’ve all come to love about you!
(Although, your disdain for the manner in which DC comics translate to the silver screen is
mildly concerning…)
viii
• To Mrs. Amy Featherstone, my Graduate Education Advisor. Your patience and
understanding as I went back-and-forth between endorsements and degrees was Herculean! If
ever there is a living candidate for sainthood, it’d be you! But admit it – you know you want me
to send you my transcripts one more time… for old times’ sake.
• To my principal. Thank you for always supporting my continuing education. From
Marygrove to Walden to Otterbein, it’s been one heck of a ride! (And yes, I promise, no more
basketballs on the roof…)
• To my students. The guinea pigs! Thank you for making me who I am as a teacher, albeit it
a little grayer every year. Our partnership is certainly cyclical, and I am glad that my passion
fuels your fire, which in turn, allows me to feed off your energy! We’ve become a well-oiled
machine.
• To the Bette Marschall Memorial Education Fund. Your stipend helped offset the cost of
books and materials during my time at Otterbein. I was certainly grateful to put to use such a
generous gift in the memory of the educator Mrs. Bette Marschall.
• Lastly, to Otterbein University as a whole. This has been one of the most incredible
experiences I have ever had in education, be it at the undergraduate or graduate level. Being able
to walk the campus as an adult-learner helped breathe new life into my profession. I leave
Otterbein a better student – and teacher – than when I arrived. I understand fully why my former
neighbor Ray, to whom this Capstone Project is dedicated, loved your school through-and-
through.
ix
VITAE
Teaching Experience 2001-Present Westerville City School District Westerville, OH Education 2015-2016 Masters of Arts in Education (M.A.E.) Curriculum and Instruction, TESOL concentration Otterbein University Westerville, OH 2012-2014 TESOL Endorsement, K-12 Otterbein University Westerville, OH 2008-2011 Doctor of Education (Ed.D.) Teacher and Educational Leadership Walden University Minneapolis, MN 2004-2005 Masters of Arts in Teaching (M.A.T.) Curriculum, Instruction, and Assessment, K-12 Marygrove College Detroit, MI 1997-2001 Teacher Licensure Program Secondary Education, 7-12 Michigan State University East Lansing, MI 1996-2000 Bachelor of Arts (B.A.) History and Geography Michigan State University East Lansing, MI

x
TABLE OF CONTENTS
Abstract …………………………………………………………………………… xiii
Section One: Introduction …………………………………………………………… 01
The Purpose of the Study …………………………………………………… 03
The Research Questions …………………………………………………… 03
Section Two: Literature Review …………………………………………………… 05
Introduction …………………………………………………………………… 05
Mastery Learning and Mastery Teaching …………………………………… 05
Differentiation and Differentiated Reassessment …………………………… 09
Standards-Based Curricula …………………………………………………… 11
Standards-Based Grading …………………………………………………… 12
Metacognition …………………………………………………………… 14
Motivation …………………………………………………………… 18
Conclusion …………………………………………………………… 20
Section Three: Methodology ………………………………………………………….. 22
Setting and Participants …………………………………………………… 22
Protection of Participants and Role of the Researcher …………………… 22
Hypotheses …………………………………………………………………… 23
Treatment …………………………………………………………………… 25
Instrumentation and Materials …………………………………………… 27
Statistical Analyses …………………………………………………………… 30
Data Collection …………………………………………………………… 31
Section Four: Results …………………………………………………………………... 32
Introduction …………………………………………………………………… 32
Data Tracking …………………………………………………………………… 32
Principal Component Analysis: Do the Factor Structures of the SMQII and PRO-SDLS Conform to Expectations? …………………………… 33
xi
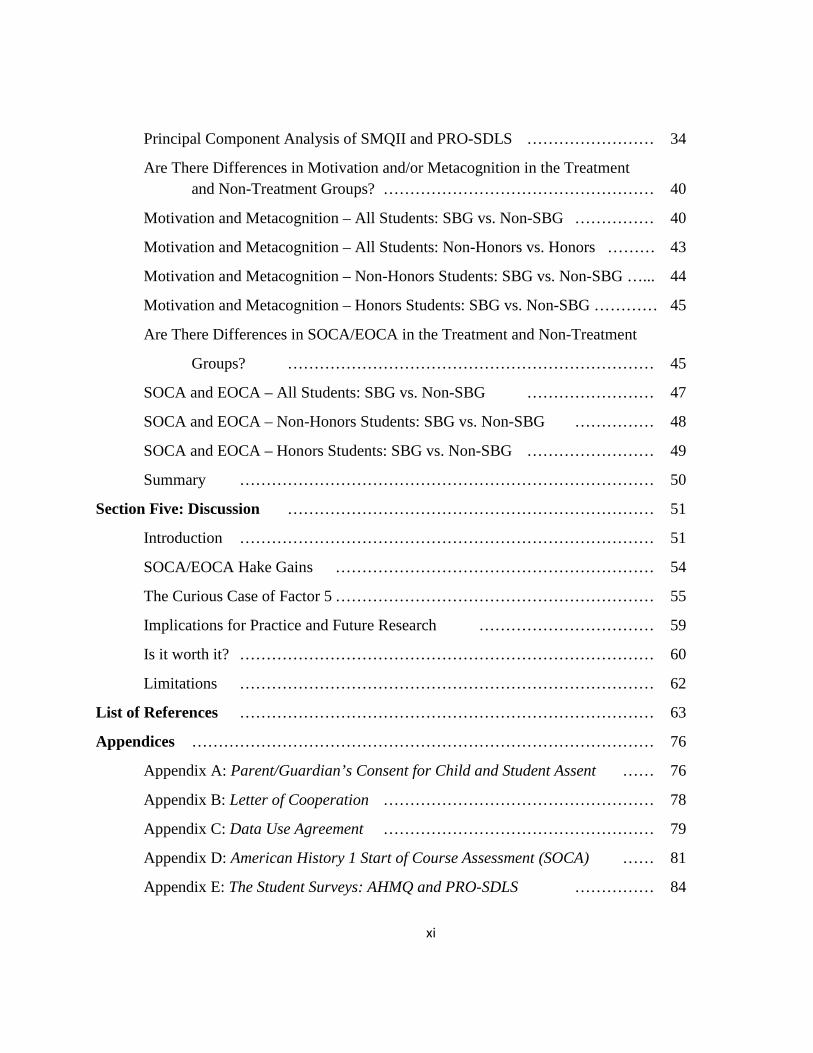
Principal Component Analysis of SMQII and PRO-SDLS …………………… 34
Are There Differences in Motivation and/or Metacognition in the Treatment and Non-Treatment Groups? …………………………………………… 40
Motivation and Metacognition – All Students: SBG vs. Non-SBG …………… 40
Motivation and Metacognition – All Students: Non-Honors vs. Honors ……… 43
Motivation and Metacognition – Non-Honors Students: SBG vs. Non-SBG …... 44
Motivation and Metacognition – Honors Students: SBG vs. Non-SBG ………… 45
Are There Differences in SOCA/EOCA in the Treatment and Non-Treatment
Groups? …………………………………………………………… 45
SOCA and EOCA – All Students: SBG vs. Non-SBG …………………… 47
SOCA and EOCA – Non-Honors Students: SBG vs. Non-SBG …………… 48
SOCA and EOCA – Honors Students: SBG vs. Non-SBG …………………… 49
Summary …………………………………………………………………… 50
Section Five: Discussion …………………………………………………………… 51
Introduction …………………………………………………………………… 51
SOCA/EOCA Hake Gains …………………………………………………… 54
The Curious Case of Factor 5 …………………………………………………… 55
Implications for Practice and Future Research …………………………… 59
Is it worth it? …………………………………………………………………… 60
Limitations …………………………………………………………………… 62
List of References …………………………………………………………………… 63
Appendices …………………………………………………………………………… 76
Appendix A: Parent/Guardian’s Consent for Child and Student Assent …… 76
Appendix B: Letter of Cooperation …………………………………………… 78
Appendix C: Data Use Agreement …………………………………………… 79
Appendix D: American History 1 Start of Course Assessment (SOCA) …… 81
Appendix E: The Student Surveys: AHMQ and PRO-SDLS …………… 84
xii
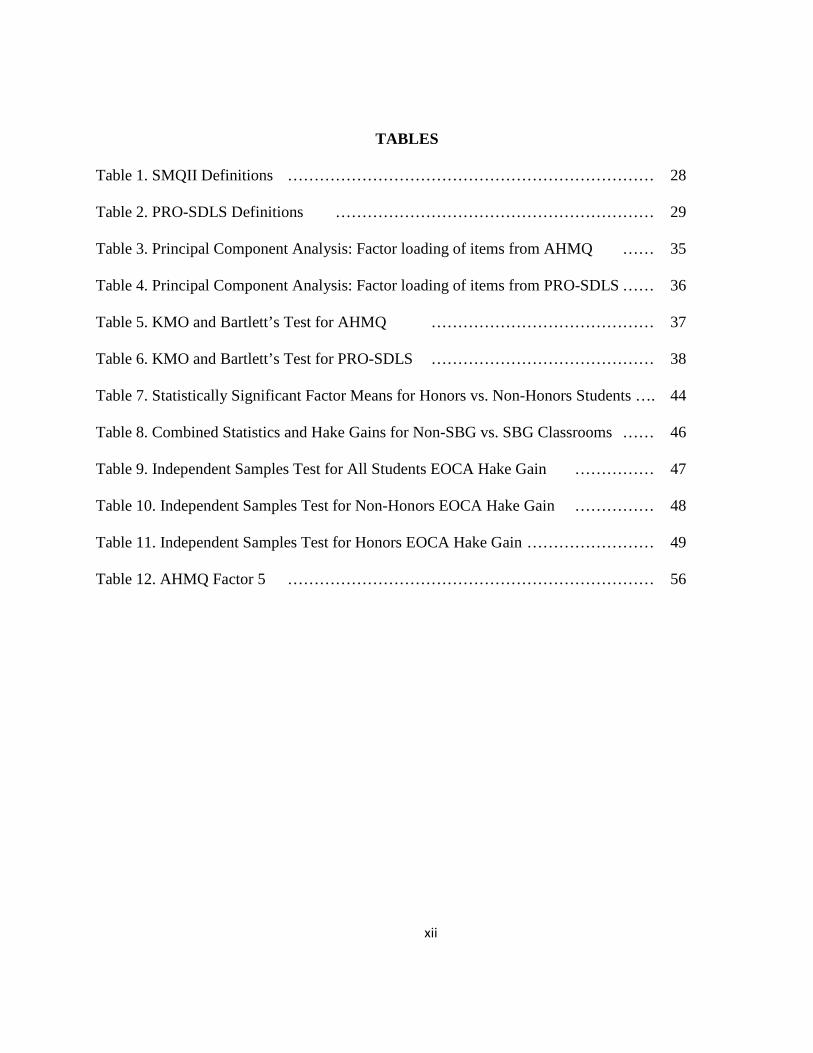
TABLES
Table 1. SMQII Definitions …………………………………………………………… 28
Table 2. PRO-SDLS Definitions …………………………………………………… 29
Table 3. Principal Component Analysis: Factor loading of items from AHMQ …… 35
Table 4. Principal Component Analysis: Factor loading of items from PRO-SDLS …… 36
Table 5. KMO and Bartlett’s Test for AHMQ …………………………………… 37
Table 6. KMO and Bartlett’s Test for PRO-SDLS …………………………………… 38
Table 7. Statistically Significant Factor Means for Honors vs. Non-Honors Students …. 44
Table 8. Combined Statistics and Hake Gains for Non-SBG vs. SBG Classrooms …… 46
Table 9. Independent Samples Test for All Students EOCA Hake Gain …………… 47
Table 10. Independent Samples Test for Non-Honors EOCA Hake Gain …………… 48
Table 11. Independent Samples Test for Honors EOCA Hake Gain …………………… 49
Table 12. AHMQ Factor 5 …………………………………………………………… 56

xiii
ABSTRACT
This study attempts to determine whether Mastery Learning (with differentiated reassessment)
and Mastery Teaching (within a standards-based curriculum) had a 1) metacognitive and/or
motivational effect on how students perceive their learning and 2) whether or not Mastery
Teaching had an impact on their mastery of the material when compared to students assessed in
more traditional classrooms that did not offer reassessment. Using a standard district American
History exam given pre- and post-semester and two student learning and motivation surveys
(SMQII and PRO-SDLS), the results showed that being taught in a social studies classroom that
utilizes differentiated reassessment and Standards-Based Grading (SBG) does not have a
statistically significant metacognitive effect but does have a motivational effect (in particular
grade motivation) on non-honors students (U = 1,318, p = .026). Additionally, it was found that
students in a SBG classroom produced higher gains on the American History assessment than
non-SBG students (t = 1.679, p = .121). Potential interpretations and implications are discussed.

1
SECTION ONE
Introduction
Motivating 14 and 15-year-olds to take an interest in the Magna Carta, the Cold War, and
the Election of 2016 – while getting them to learn state content material – is arguably one of the
most important things I do on a daily basis. In fact, it was something I set out to accomplish long
before I started reading about “why” teachers should. That being said, teaching the same students
how to reflect on their educational experiences and developing their ability to identify academic
strengths and weaknesses, however, proved to be a bit more challenging. As a result, there was a
natural gravitation toward developing metacognitive practices within my classroom when it
came to the informational feedback following class assessments. This was a key component of a
major grading transformation within my own classroom that resulted in the implementation of
Standards-Based Grading (SBG) in 2008. Combining both Mastery Learning and Mastery
Teaching practices created differentiated reassessments that now allow me to synthesize student
progress and create meaningful units tied to learning targets.
In education, grades are often extrinsic motivators, meaning their power to influence
student behavior originates from outside the student (O’Connor, 2007). Many teachers, parents,
and guardians, however, inadvertently use grades as extrinsic motivators when they say things
like, “If you do not get a B or better on your math quiz, then you are not allowed to go to the
football game.” Students often struggle to reach many of these imposed goals because they lack
intrinsic motivation, meaning their desire to achieve and improve needs to come from within. To
help students, teachers must motivate students toward goal acceptance (Wiggins, 2012). If the
end-product is content mastery, then that needs to become the student’s goal and not just the
teacher’s. In other words, NBA All-Star Shaquille O’Neal had to want to be a better free throw
2
shooter; Coach Phil Jackson could not want it for him (Knoblauch, 2015). The importance of
intrinsic motivation and the fact that students are more likely to complete a task they enjoy doing
corresponds beautifully with “creative” assignments. Of course, assignments tied to extrinsic
motivators undermine intrinsic motivation (Wiggins, 2012). Since schools, guardians, and
teachers constantly use grades as extrinsic motivators, it is no wonder students become
disengaged. Thus, as educators and administrators think about current and future grading
practices, it is important to look at what does and does not motivate students (O’Connor, 2007).
Metacognition, which is the ability to properly evaluate one’s own learning and thought
process (Weimer, 2013), is two-fold and includes mindfulness of one’s thinking and learning as
well as a critical awareness of oneself as a thinker and learner (Chick, Karris, & Kernahan, 2009;
Hatano & Inagaki, 1986). Through reflection, students that know their strengths and weaknesses
as writers, readers, test-takers, and overall learners are more likely to monitor their learning
(Bransford, Brown, & Cocking, 2000). By educating students about effective problem-solving
strategies and discussing the cognitive and motivational characteristics of thinking, teachers shift
accountability for monitoring learning to their students (Paris & Winograd, 1990).
As a teacher who uses a standards-based curriculum to create differentiated
reassessments, and as a firm believer in having students reflect on how they did after the initial
assessment, I was particularly interested in seeing if these practices truly had metacognitive and
motivating effects on how my students perceived their learning. Did this impact their mastery of
the material when compared to students assessed in more traditional classrooms that do not offer
reassessment or assessment reflection?

3
The Purpose of the Study
The primary purpose of this instructional inquiry project was to determine if my use of
Mastery Learning (that includes differentiated reassessment) and Mastery Teaching (that
operates with a standards-based curriculum) had a 1) metacognitive and/or motivational effect on
how my students perceive their learning and 2) whether or not Mastery Teaching had an impact
on their mastery of the material when compared to students assessed in more traditional
classrooms that did not offer reassessment.
Data for this research were collected using a motivational survey and a self-directed
learning survey given to all mainstreamed 9th grade American History classes. These surveys
asked about student perception, satisfaction, and motivation concerning learning with respect to
their American History classrooms. Additionally, data collected from district-created, district-
approved, and district-mandated Start of Course Assessments (SOCA) and End of Course
Assessments (EOCA) for the 9th grade American History classes were used. A thorough
examination of survey results and SOCA/EOCA data helped draw conclusions about the
effectiveness of differentiated reassessment.
The Research Questions
This study addressed three research questions. These questions were:
1. Does being taught in a social studies classroom that utilizes differentiated reassessment
within a standards-based curriculum have a metacognitive effect on how 9th grade students
perceive their learning?

4
2. Does being taught in a social studies classroom that utilizes differentiated reassessment
within a standards-based curriculum have a motivational effect on how 9th grade students
perceive their learning?
3. Does Mastery Teaching have an impact on the mastery of the material by 9th grade students
when compared to students assessed in more traditional classrooms that do not offer
reassessment?

5
SECTION TWO
Literature Review
Introduction
The primary purpose of this instructional inquiry project was to determine if my use of
Mastery Learning (that includes differentiated reassessment) and Mastery Teaching (that
operates with a standards-based curriculum) had a metacognitive and/or motivational effect on
how my students perceive their learning and whether or not Mastery Teaching had an impact on
their mastery of the material when compared to students assessed in more traditional classrooms
that did not offer reassessment. In Section One, there was an overview of the study with
information regarding the scope, purpose, and significance of the study. Section Two contains an
appraisal of the current literature and examines student-centered approaches to education
(including Mastery Learning, Mastery Teaching, differentiation, and Standards-Based Grading)
and metacognition and motivation as it pertains to student self-reflection and self-efficacy in
social studies classes.
Mastery Learning and Mastery Teaching
Two of the most important contributions to student-centered learning come in the form of
“Mastery Learning,” as proposed by Benjamin Bloom (1968), and in Madeline Hunter’s
“Mastery Teaching” (1982). The basic philosophical foundation of Bloom’s Mastery Learning
(originally known as “Learning for Mastery”) is that all students are fully capable of learning
(Guskey, 1988). The caveat to this quasi-guarantee that all students can learn, however, is that it
can only happen if these students are placed in the right circumstances and in an environment
that can foster such educational gains (Anderson & Block, 1977). Bloom (1968) argued that such
a setting can be achieved if students are required to attain “mastery” before moving forward in

6
their course material. A classroom that emphasizes learning over grades (and one that allows
students to mature academically at a sensible pace) helps students validate their education
(DeKeyrel, Dernovish, Epperly, & McKay, 2000). Guskey (1987) determined that Bloom’s
“mastery” piece is made up of two key components, both of which are absolutely fundamental
for Mastery Learning instructional programs. The first component comes in the form of a process
that involves some form of a corrective/feedback and enrichment process. Such a process
requires the systematic administration of a formative assessment, like a quiz or writing activity.
Should students fail to achieve mastery, the teacher provides detailed feedback coupled with
supplementary activities to correct misunderstandings and learning errors. Daniels, Stupnisky,
Pekrun, Haynes, Perry, and Newall (2009) found that students’ emotions impact the true mastery
of course material and individual achievement of performance-based goals. Students that are full
of optimism thanks to previous positive experiences will perform better than those students who
entered feeling uncertain and anxious. Sometimes the difference comes in the type of feedback
that students receive from their teachers. Since a student’s feelings are inherently involved in
grading, one of the more difficult decisions comes in the amount of feedback to give a student
(Brookhart, 2008). Brookhart concluded that students should be given enough feedback to
illustrate what targets they have hit and show them which ones need to be improved in order to
demonstrate mastery. Additionally, the impact of classroom assessments on mastery is heavily
influenced by the perception of students toward the importance of tests and quizzes and their
apparent value (Brookart, Walsh, & Zientarski, 2006). Partly for this reason, Willingham (2009)
argues that mastery is more than rote memorization. This is critical as it may be argued that rote
memorization can short-circuit student perception that the knowledge is valuable.
7
Post-assessment remastery comes in the form of additional readings, new instruction, or
guided learning, and it jump starts a cyclical process that continues until the learner
accomplishes mastery (Wormeli, 2006; O’Connor, 2007). Students that demonstrate mastery are
given enrichment activities that challenge them by augmenting their understanding of the topic
while those that are struggling complete their remastery. When mastery is achieved by every
student, the class moves on to new material (Block & Burns, 1976; Bloom, 1981). When
Mastery Learning is implemented properly and remains consistent across units, research shows
that the amount of time needed for remastery decreases over the course of the school year
(Anderson, 1994).
The second key component of Mastery Learning focuses on class consistency as it relates
to the entire instructional and remastery process (Guskey, 1987). In other words, for Mastery
Learning to work, teachers need to “stick to the script” and run remastery identically across
every one of their units. Doing such helps acclimate students to the routines involved in a
Mastery Learning environment. Granted, this means the teacher must spend a great deal of effort
making sure that learning targets (or objectives, or guidelines, or benchmarks), instructional
practices, feedback and remastery processes, and methods for assessing student mastery, are all
aligned with one another (Anderson, 1994). Still, by using such a “road map,” teachers can
create for their students a trail from current levels of understanding to mastery (Wiggins &
McTighe, 2005). Certainly, remastery (which is often referred to as “reassessment” throughout
this paper) takes discipline on behalf of the students to go back and improve their understanding.
In theory, if students do just that, they not only gain mastery of the concept, but their grades now
reflect what they truly know (Wormeli, 2006). Research by Block and Burns (1976), Willent,
Yamashita, and Anderson (1983), Guskey and Gates (1986), and Guskey and Pigott (1988)
8
verified that positive improvements in student learning result from the careful and systematic
implementation of Mastery Learning. Kulik, Kulik, and Bangert-Downs (1990) put Mastery
Learning to the test when they conducted a meta-analysis of studies including 108 classrooms
that implemented such programs in elementary school, high school, and college. The researchers
found that Mastery Learning had positive effects on not only the test scores of students but also
on student attitudes toward course content and instruction.
One of the biggest weaknesses with Mastery Learning, however, is that it provides no
direction regarding the initial delivery of the content material (Guskey, 1988; Slavin, 1989).
Mastery Learning is back-loaded in its organization since it focuses on what happens after
assessment. This is where Mastery Teaching thrives. According to Hunter (1982), Mastery
Teaching is front-ended and impacts the initial instruction by providing teachers with a
framework to outline the steps necessary for teaching an effective lesson. Despite an
overabundance of Mastery Teaching approaches, Brandt (1985) found similarities among all of
them that form the crux of its five key steps: (a) anticipatory set and statement of objectives; (b)
instruction and modeling; (c) checking for understanding; (d) guided practice; and (e)
independent practice. These five steps can work with any subject area, grade level, or student
ability, making it a positive tool in student-centered educational practices (Hunter, 1985). The
use of such a wide array of strategies by Mastery Teaching helps engage all students, including
those behind academically, those with behavioral and emotional problems, English Language
Learners (ELLs), and introverted students (Johnson, Uline, & Perez, 2014).
Whereas Mastery Learning produces considerable student assessment data, Mastery
Teaching does not always include the tools needed for teachers to gather evidence to justify any
positive effects on student learning, save from what could be deduced by casual observation
9
(Guskey, 1988) or through small-group conversations, electronic (or text-in) polling, white
boards, and Socratic Seminars (Fisher & Frey, 2007). For this reason, studies appraising the use
of Mastery Teaching have not produced more positive results (Slavin & Karweit, 1984; Stallings
& Krasavage, 1986).
Guskey (1988) found that both Mastery Learning and Mastery Teaching, if used together,
can actually be quite complementary. To a Mastery Learning program, Mastery Teaching adds
the instructional component that gives teachers guidance into how to initially present lessons.
Likewise, Mastery Learning can add to Mastery Teaching the organizational strategies that help
teachers synthesize student progress as well as create meaningful units tied to learning targets.
Guskey (1988), Walberg (1990), and Johnson, Uline, and Perez (2014) argue that the two
approaches together collectively strengthen education by making teachers better at content
delivery while simultaneously developing students as learners because of their environment and
reassessment opportunities.
Differentiation and Differentiated Reassessment
Mastery Learning is an approach to education that requires careful attention on the part of
the teacher to organize remastery. Students may not be able to independently reread to gain
additional understanding of the content. As such, additional approaches to support remastery are
vital. A near-universally accepted approach is differentiation, which has teachers craft their
lessons and assessments around their students’ needs and abilities rather than force students to
mold themselves to fit the curriculum (Armstrong, 2008; DuFour, DuFour, Eaker, & Karhanek,
2004, 2009; Farrington & Small, 2008; O’Connor, 2002, 2007; Tomlinson, 1999, 2000a, 2000b,
2003, 2008; Wormeli, 2006). Essentially, “who” they teach shapes “how” they teach

10
(Tomlinson, 2008). Tomlinson (2000a & 2008) showed how differentiation within a standards-
based classroom sees the teacher assign grades explicitly linked to each curriculum standard as
the class moves through the units. Tomlinson (2000b) contended that in differentiated
instruction, standards function as the ingredients for a dinner that are scattered all around the
kitchen – but they are not the meal itself. The meal, she explained, is made by the teachers that
know the ingredients and know the academic (dietary) needs of their students. Informed by the
students’ interests (tastes) and needs, the teachers then serve the meal in a manner that the
students eat both wisely and, fingers-crossed, enthusiastically.
Aside from content delivery, differentiation can also be used when it comes to remastery
and reassessment (Chapman & King, 2005). Following the first round of assessment and the
distribution of feedback, students have a litany of options in which to demonstrate their
refurbished understanding of the material. This can include completing an essay, holding an
informal discussion with the teacher (oral reassessment), a project, or other forms of
performance-based assessment (Tung, 2010). Differentiated reassessment, like Mastery
Learning, provides teachers with the ideal quantitative and qualitative reflection of what a
student has mastered (Cummins & Davesne, 2009).
Ahmed and Pollitt (2010) advocated the use of computers to assess and reassess students.
Using computers to complete various tasks allowed teachers to gather enormous amounts of
information about each student as well as measure how much assistance certain students
required. The authors argue that computer software offers a unique form of differentiation that
requires little extra preparation by the teacher and yields tremendous results. Some students were
able to move ahead in their lessons while others were given supplementary time. Through the use
of hints, prompts, clues, reassessment, and enrichment activities, all students achieved mastery.

11
Koong and Wu (2010) confirmed the positive impact that computer-aided testing can have in
evaluating what topics students have mastered. Underachieving students did better on interactive
multimedia tests than on standard paper-and-pencil examinations. Similarly, using performance-
based assessments like essays, experiments, group projects, demonstrations, and portfolios for
remastery activities allows students to take an active role in their education (Linn, Baker, &
Dunbar, 1991; Herman, Aschbacher, & Winters, 1992; and Wiggins, 1993).
Standards-Based Curricula
Until the 1990s, public schools in the United States lacked clear standards of what high
school graduates should know and be able to do (Hamilton, Stecher, & Yuan, 2008).
Expectations varied from school-to-school, from district-to-district, and from state-to-state. This
all changed when standards-based reform required all students to master challenging subject
material and provided for a way to measure progress. According to Budge (2010), because its
impact is felt in rural, suburban, and urban school districts alike, standards-based curricula
continue to be at the forefront of debates revolving around mastery and No Child Left Behind
(NCLB), the infamous legislative leviathan that was replaced in 2015.
Initially, in response to NCLB, all 50 states and Washington, D.C. established Academic
Content Standards containing information that all students (grades K-12) should master
(Ainsworth, 2003). In Ohio, Academic Content Standards are made up of benchmarks, which are
grouped by grade-level clusters or bands (K-2, 3-5, 6-8, 9-10, and 11-12). These benchmarks are
key checkpoints that monitor progress made toward standards and break the standard into what
students should know and be able to do at a specific time in their schooling (ODE, 2008). The
benchmarks are further divided into Grade Level Indicators (GLIs), which contain the
knowledge and skills that all students should be able to master at each grade level. They serve as
12
checkpoints to monitor progress toward the benchmarks. When grouped with benchmarks and
Academic Content Standards, GLIs form the backbone of the material taught in any given core
subject (ODE, 2008). After 2010, Ohio replaced GLIs with strands and themes as the essential
building blocks. Topics replaced benchmarks and represent the areas of learning within a strand
(which may span multiple grade levels). While the strands, themes, and topics are not the same
as the indicators and benchmarks, they still provide a road map through the curriculum.
Since these Ohio standards were punctiliously aligned with state accountability
assessments, they came equipped to provide consistent sets of expectations for students and
educators that are rigorous and inclusive (Beck, 2009; Kulm, Dager Wilson, & Kitchen, 2005;
Roach & Elliott, 2009). Consequently, curriculum alignment – or more specifically, vertical and
horizontal alignment – helps ensure that what is taught and assessed in classrooms is in step with
state standards. Vertical alignment puts material in a coherent progression from one grade level
or course to the next. Horizontal alignment establishes the connection between standards and
assessments in each subject at a particular grade level. Together, vertical and horizontal
alignment is designed to be implemented in all Ohio grades levels, from K-12 (Brown, 2010;
Case & Zucker, 2005; Kagan, Carroll, Comer, & Scott-Little, 2006; Martineau, Paek, Keene, &
Hirsch, 2007).
Standards-Based Grading
Standards-Based Grading (or SBG) directly utilizes standards, benchmarks, and GLIs
(which are now “strands” and “themes”) as a checklist for the material students need to master
before they leave the classroom. The teacher assigns grades specifically to each strand or theme
in every unit. For instance, a theme states that by the end of their freshmen year, all students

13
should be able to “Explain connections among Enlightenment ideas, the American Revolution,
the French Revolution, and Latin American wars for independence.” Therefore, when students
complete the 9th grade, they should be able to show how the ideas of Enlightenment thinkers
Thomas Hobbes, John Locke, Jean Jacques Rousseau, and Charles de Montesquieu impacted all
three revolutions. Since the manner in which this material is taught is moot (although supporters
of Mastery Teaching and differentiation will beg to differ), students are presented with the
information. They are then assessed in a way that allows them to demonstrate what they know,
be it by way of some performance-based assessment or in the form of a traditional multiple
choice test. The feedback component of a classroom that uses Standards-Based Grading is where
this system differs from the traditional “you failed the test” approach (and also why it falls in the
category as a Mastery Learning program). In a SBG classroom, rubrics often replace the
customary letter grade and provide students with scores on a four-point scale, including: Level 4
(“Mastery Achievement”), Level 3 (“Proficient Achievement”), Level 2 (“Basic Achievement”),
and Level 1 (“Insufficient Achievement”). Level 3 and Level 4 means the student has
demonstrated “mastery” for that particular standard/strand/theme, whereas Level 2 and Level 1
shows that the student did not. In such a program, students are given additional time to
demonstrate mastery following an assessment in which they do not earn Level 3 or Level 4 for
every unit standard covered. For example, a student that completes an in-class essay on the Age
of Enlightenment and earns a Level 2 will be given another opportunity to show mastery of that
particular standard.
Scriffiny (2008), who switched her routine high school math class’s grading system to
SBG, offered numerous reason why teachers should abandon the points-based system, including
(a) grades have more meaning with SBG; (b) SBG forces teachers to rethink the value they give
14
to homework; (c) such a grading system allows teachers to adjust their instruction based upon
what standards are being met and what ones are not; and (d) students better understand how to
gauge quality (pp. 70-74).
In my classroom, I use SBG with differentiated reassessment, which means the feedback
students receive following their initial assessment is tied directly to the state standards. A
student’s reassessment can come in the form of explaining the key points of the essay in a short-
answer response, completing a project, discussing the topic with me in a one-on-one conference,
or by way of any number of approved methods. When students demonstrate that they have
mastered the state standard – even at a later date than their peers – their score is changed to
reflect their new mastery. In preparing for their next round of assessment, students revisit their
previous tests and identify problematic questions. Time is provided for the class to discuss and
share studying strategies in the hope that this sort of reflection becomes second nature for the
students as they move forward. Helping them embark on this journey of self-reflection is a
crucial component of the classroom that employs differentiated reassessment. From my own
experience in using a standards-based curriculum and differentiated reassessment, the two
biggest outcomes have been metacognitive growth and improved motivation to continue strategic
reflection after assessments.
Metacognition
Mastery Learning and Mastery Teaching, coupled with differentiation and SBG, help
create an educational environment that is student-centered. However, does such a curriculum and
instructional approach impact students’ metacognitive ability to self-reflect on their own
learning? Metacognition, the ability to properly evaluate one’s own learning and thought process,

15
is usually not a strength for most high school students, especially when it comes to evaluating
how well they learned, or what they mastered, beyond the grade on their test paper (Weimer,
2013). Metacognition is two-fold and includes mindfulness of one’s thinking and learning as
well as a critical awareness of oneself as a thinker and learner (Chick, Karris, & Kernahan, 2009;
Hatano & Inagaki, 1986). Metacognitive practices help students identify and become cognizant
of their strengths and weaknesses in academic settings. Students that know their strengths and
weaknesses as writers, readers, test-takers and overall learners are more likely to “actively
monitor their learning strategies and resources and assess their readiness for particular tasks and
performances” (Bransford, Brown, & Cocking, 2000, p. 67). Theorists hope that as students learn
about effective problem-solving strategies and the cognitive and motivational characteristics of
thinking, accountability for monitoring learning shifts from the teachers to the students (Paris &
Winograd, 1990).
In promoting the “metacognitive learner,” teachers should note the difference between
“learning” and “performance,” especially since performance during training (or when students
are first introduced to new material) is not an effective measure for post-training performance
(Bjork, 1994). During any given new unit, the speed or accuracy in recalling the knowledge of
the unit is “performance.” What cannot be observed during this time, and what is typically not
seen until the end of the unit assessment, are the changes in understanding, comprehension, and
competence that support long-term retention – or “learning.” Since learning can occur even if
there appears to be no change in performance, and because changes in performance do not
necessarily translate to actual learning, understanding how students learn, and how they reflect
on their perceived learning, is critical to developing metacognition (Bjork, 1994; Dewey, 1933;
Tanner, 2012).

16
Pintrich (2002) and Tanner (2012) found that in order for students to develop their skills
in metacognition, they need to be taught the concept – but not in a reading or lecture-styled
activity. Students learn “how to learn” by being able to identify, evaluate, and link new skills
with old ones (Gall, Gall, Jacobsen, & Bullock, 1990; Zohar & David, 2009). The idea of the
“testing effect,” discussed at length by Roediger and Karpicke (2006), showed that when
students are repeatedly assessed, their long-term retention of the material improves due to the act
of retrieving information from memory during a testing situation. However, because students
lack metacognitive attentiveness to the “mnemonic” benefits of testing, they experience the
“illusions of competence” while studying, and these illusions directly impact which strategies
students perceive as effective when they monitor their own learning (Bjork, 1994; Karpicke,
Butler, & Roediger, 2009). Pintrich (2002) found that giving students opportunities after
assessments to discuss what worked for them concerning test preparation, allowing them time to
compare strategies, and providing additional opportunities to demonstrate their understanding of
the content material all help lift the veil to individual students as to why they sometimes “get it”
(and learn) while at other times they struggle (and do not learn).
Tanner (2012) discussed four popular strategies for student self-reflection, which
included the use of pre-assessments, identifying confusions, retrospective post-assessments, and
reflective journals. Understanding what their students already know about a topic before starting
a unit promotes metacognition among students. Asking, “What do I already know about this
topic that could guide my learning?” is a simple self-question that helps them begin planning
how they could approach learning a new idea (Coutinho, 2007; Ertmer, 1996; Schraw, 1998).
Angelo and Cross (1993) provide an example of helping students identify their confusions with
the “Muddiest Point,” a simple activity that takes only a few minutes at the end of class. Here,
17
students answer the self-question, “What was most confusing to me about the material being
explored in class today?” The use of such reflection indicates to students that confusion is part of
the learning process, and expressing this helps not only the teacher, but also the student. Similar
to Bjork’s findings about “learning” and “performance,” Posner, Strike, Hewson, and Gertzog
(1982) found that learning is a student-centered activity that sees them (ideally) change their
ideas about a concept, topic, or general question. This means learning cannot occur if students
fail to undergo a metacognitive “realization” about how they thought about the concept both
before and after learning took place (Tanner, 2012). This can come in the form of retrospective
post-assessments, which fosters students into experiencing an “Ah-ha!” moment.
Similar to pre-assessments and identifying confusions, post-assessments can be quick
conversations or writings that could include completing the phrase: “Before this course, I thought
evolution was… Now I think evolution is…” (Tanner, 2012). Lastly, reflective journals allow
students the opportunity to openly admit, confess, or address perceived shortcomings (or
successes) in the wake of a particular assignment or assessment. Teachers can extend this
activity by having students reread their own journal entries before the next assessment as a way
to either avoid making the same mistakes or to continue to employ a successful strategy that had
worked the last time. Having students share these entries with other students as a way to create a
community approach to learning also boosts metacognition by seeing that every student is a
“learner-in-training” (Tanner, 2012).
There is clear evidence of a positive impact of metacognition on learning. Tomlinson and
McTighe (2006) assert that the most successful students are metacognitive. This means they
realize how they learn, are able to set learning goals, self-assess their own abilities and where
they are at in a unit, and use creative strategies to better their understanding. A two-year

18
longitudinal study on metacognition by Van der Stel and Veenman (2010) had students complete
text-studying tasks in history and problem-solving questions in math. The study discovered
improvement in the metacognition of those that participated and demonstrated that such
metacognitive skills can aid student learning performance regardless of their academic ability.
Motivation
Bandura (1986), who developed the Social Cognitive Theory, defines motivation as “an
internal state that arouses, directs, and sustains goal-oriented behavior” (Glynn, Brickman,
Armstrong, Taasoobshirazi, 2011, p. 1160). As students transition from elementary school to
middle school and again from middle school to high school, they often suffer decreases in self-
esteem and intrinsic interest in academics (Eccles, Wigfield, Flanagan, Miller, Reuman, & Yee,
1989; Eccles, Simpkins, S, & Davis-Kean, P., 2006). Bandura (1997) and Pajares (1996) found
that this can lead to poor self-efficacy, meaning students no longer believe they can learn about a
specific topic, learn in a certain class, or learn altogether. This obviously damages motivation
and can result in them not paying attention in class, not preparing for tests, or not going to school
(Cleary & Zimmerman, 2004).
The structure of school may foster motivational decline. Eccles et al. (1989) reasoned that
motivational declines resulted from a “poor fit” between the students’ psychological needs and
their school environment. Pintrich and Schunk (2002) and Feldlaufer, Midgley, and Eccles
(1988) found that despite the fact that adolescents are more than capable of functioning
independently, they are often denied such autonomy in school. Ironically, they are expected by
their teachers to exhibit such characteristics outside the classroom, which proves to be very
difficult since they lack the practice or in-school opportunities to gain the metacognitive

19
strategies necessary to be successful (Zimmerman, 2002). Students that are unable to make
proper and correct decisions concerning their study, decision, and regulatory strategies are often
the ones that end up struggling in school (Dembo & Eaton, 2000; Weinstein, Husman, &
Dierking, 2000; Zimmerman, 2002).
Conversely, students trained in metacognitive reflection display high levels of motivation
and achievement (Schunk, 1996; Wood, Bandura, & Bailey, 1990). Clifford (1986) and
Zimmerman (2002) found that metacognitively-motivated students are able to evaluate their
performance on an assessment as it pertains to self-standards (e.g., past test scores), associate
poor scores with faulty strategies (e.g., their strategic plan), and will make the obligatory
adjustments before the next test (e.g., study over the course of a week rather than the night before
a test). Being metacognitively aware of a course of action such as this is important because it
allows students to maintain their motivation despite academic setbacks and during times of
frustration (Clifford, 1986).
Letting educators use their personal strengths and interests to tailor their classrooms and
approach to teaching helps makes the material more meaningful to students (Rabb, 2007). This,
in turn, generates more motivation for students to learn, which leads to students taking more
ownership of their education. Jarvela, Volet, and Jarvenoja (2010) and Vansteenkiste, Sierens,
Soenens, Luyckx, and Lens (2009) noted a unidirectional correlation between motivation and
social behavior. Students who are clustered according to the results of a “person-centered”
approach for identifying motivational profiles had higher scores than those in more generic
groups (Vansteenkiste, et al., 2009). Not surprisingly, Osterman (2000) found that teachers who
establish supportive and welcoming atmospheres in their classrooms are able to nurture a sense
of belonging, which increases student motivation and academic achievement. Walker and Greene

20
(2009) corroborated Osterman’s (2000) findings in their study that used 249 high school students
to examine perceptions of classroom achievement goals, self-efficacy, and a sense of belonging.
They found that when students feel they are an important and noteworthy member of the
“classroom community,” they are more likely to develop personal achievements goals (as they
pertain to mastery).
Conclusion
Helping students reflect on their learning is the foundation of self-efficacy and
metacognition. Mastery Learning and Mastery Teaching, when used with differentiation and
SBG, can create a student-centered environment capable of supporting metacognitive growth and
sustained motivation. This being said, I conducted a reassessment study through Walden
University in 2010 that compared the results on the American Government Start of Course
Assessment (SOCA) and End of Course Assessment (EOCA) of two American Government
classes. As the theoretical framework of the pilot study, differentiation (and its mode of
implementation: the standards-based classroom) failed to produce student scores on the
American Government EOCA that were significantly different from EOCA scores of similar
students taught in a traditional classroom environment (Hartnell, 2011). The results of my study
supported those of Slavin and Karweit (1984), who conducted a year-long study of the Mastery
Learning program in Philadelphia. The two found no differences between Mastery Learning and
a control group in mathematics. Rosales (2013) also compared SOCA and EOCA results for two
sets of Algebra 2 classes where the participating teachers used SBG for one class and traditional
grading practices for the other. In that study, no significant differences were found between the
SBG and non-SBG students on the EOCA. Still, both the 2013 Rosales study and my 2011
Walden study concluded that the real benefit of a SBG classroom might be the ability to develop

21
a better system of communication between the school and the classroom as well as positively
impact student accountability and their acuities of learning. Slavin (1989), however, collected
other studies on Mastery Learning, eventually declaring, “The uncontested finding that yearlong
studies show no greater effects for Mastery Learning than traditional methods on standardized
measures should be the end of the story” (p. 78).
In 2012, I completed a follow-up study to my original Walden research at Otterbein
University. Examining population subgroups and reassessment, I found that reassessment –
while effective in raising semester grades of both ELL and non-ELL students – did not improve
scores on the EOCA any more than they had in 2009 and did not impact the ELL subgroup any
more than it did the mainstream students. As such, as part of my Capstone Project at Otterbein, I
hoped to determine whether the use of differentiated reassessment had a metacognitive and
motivational effect on how students perceive their learning when compared to the metacognition
produced by more traditional classrooms.

22
SECTION THREE
Methodology
Setting and Participants
I conducted this quasi-experimental study with between-group comparative design at my
place of employment, a suburban high school in Central Ohio. The school is one of three high
schools, four middle schools, 14 elementary schools, and one Early Learning Center that inhabit
a district that sprawls across 50 square miles and encompasses over 14,800 students. My school
contains four grade levels (ninth, tenth, eleventh, and twelfth) and serves nearly 1,500 students.
The course American History is a requirement for all ninth graders and is broken into two
semesters that must be taken chronologically as American History 1 (Reconstruction through the
Great Depression) and American History 2 (World War II to the present). Additionally, the
course can be taken in an accelerated honors format (Honors American History 1 and Honors
American History 2). For the purpose of this study, which was conducted during the first
semester of the 2015-2016 school year, any student enrolled to take either American History 1 or
Honors American History 1 as a ninth grader was eligible to participate (N = 327). Through the
standard enrollment process, these students were divided among the three teachers that teach
American History, which includes Mr. E, Mr. O, and myself. Union contract stipulates that no
section (honors or otherwise) is permitted to have more than 30 students. Students that requested
to be in Honors American History 1 were scheduled in one of the three sections taught by Mr. E
or one of the two that I teach. Mr. O does not teach any sections of Honors American History 1.
Protection of Participants and Role of the Researcher
Risks to the student and teacher participants associated with my study were minimal and
no greater than those faced on a daily basis. A Parent/Guardian’s Consent for Child and Student

23
Assent form (Appendix A) and a Letter of Cooperation (Appendix B) from the school’s principal
approving the use of the school and its students for this study were collected. The Letter of
Cooperation with the principal was transitioned into a Data Use Agreement (Appendix C) in
order to provide me with access to a Limited Data Set (LDS) for use in this study in accordance
with HIPAA and FERPA regulations. Concerning the data, and per the Data Use Agreement, no
direct identifiers (such as names) were included in the LDS outside their initial role in pairing up
Start of Course Assessment (SOCA) and End of Course Assessment (EOCA) scores to ensure
that only the scores of the students that took both assessments were included in the study. The
data released to me for this study was no different than the data reported to the school’s
administration and the district’s curriculum coordinator. However, individual scores were not
permitted for release; only SOCA and EOCA data categorized by period, level (honors or non-
honors), and teacher were permissible for this study. In addition, I acknowledged and agreed not
to disclose or discuss, divulge, copy, release, sell, or make unauthorized transmittals of
confidential information. I acknowledged the legal implications of violating any and all terms.
All data will be maintained in a locked file cabinet in the school for a period of three years
following the completion of the study.
Hypotheses
Three null hypotheses and three alternative hypotheses were statistically analyzed. In the
context of an experiment, a null hypothesis (H01) predicts that the independent variable (the
treatment) has no effect on the dependent variable (the population). The alternative hypothesis
(Ha1) is the opposite of the null hypothesis and predicts that the treatment does have an effect on
the population (Gravetter & Wallnau, 2008, p. 192).

24
The research questions that I investigated in this study were:
1. Does being taught in a social studies classroom that utilizes differentiated reassessment
within a standards-based curriculum have a metacognitive effect on how 9th grade students
perceive their learning?
H01 = There is no statistically significant difference in the metacognitive effect of how 9th
grade students perceive their learning in a social studies classroom that utilizes differentiated
reassessment within a standards-based curriculum and students in traditional classrooms.
Ha1 = There is a statistically significant difference in the metacognitive effect of how 9th
grade students perceive their learning in a social studies classroom that utilizes differentiated
reassessment within a standards-based curriculum and students in traditional classrooms.
2. Does being taught in a social studies classroom that utilizes differentiated reassessment
within a standards-based curriculum have a motivational effect on how 9th grade students
perceive their learning?
H02 = There is no statistically significant difference in the motivational effect of how 9th
grade students perceive their learning in a social studies classroom that utilizes differentiated
reassessment within a standards-based curriculum and students in traditional classrooms.
Ha2 = There is a statistically significant difference in the motivational effect of how 9th
grade students perceive their learning in a social studies classroom that utilizes differentiated
reassessment within a standards-based curriculum and students in traditional classrooms.
25
3. Does Mastery Teaching have an impact on the mastery of the material by 9th grade
students when compared to students assessed in more traditional classrooms that do not offer
reassessment?
H03 = There is no statistically significant difference in the improvement between SOCA
and EOCA scores of students in a social studies classroom that utilizes differentiated
reassessment within a standards-based curriculum and students in traditional classrooms.
Ha3 = There is a statistically significant difference in the improvement between SOCA
and EOCA scores of students in a social studies classroom that utilizes differentiated
reassessment within a standards-based curriculum and students in traditional classrooms.
Treatment
The treatment came in the form of Mastery Learning (differentiated reassessment) and
Mastery Teaching (Standards-Based Grading, or SBG), both of which are used in my American
History 1 and Honors American History 1 courses. I adopted these approaches at the start of the
2008-2009 school year in the hopes of overhauling my grading practices and as a way to provide
grades that better reflect the mastery of content material. To do so, I used state Grade Level
Indicators (or GLIs) to assess mastery and provided struggling students with differentiated
reassessment opportunities. It was my goal that in switching to such a classroom, I could boost
motivation among students and get them to want to do better in history, to believe they could do
better, and to actually do better. In theory, if I could get my students to become more motivated
and metacognitively aware of their abilities, then their retention (and mastery) of state-mandated
material would be demonstrated by significant gains between the SOCA and EOCA. As
discussed in Section Two, differentiation refers to modifying instruction to meet the needs of all
26
learners (Northey, 2005; Tomlinson, 2008; Tomlinson & McTighe, 2006). This theory suggests
that highly effective teaching means doing what is fair for students, including making grading
practices conducive to maximizing the students’ learning while truly reflecting what a student
has (or has not) mastered. My SBG classroom serves as the vehicle for delivering this
differentiated reassessment. After the initial assessment, my students have an abundance of
options by which to correct their mistakes and demonstrate a new understanding of the material.
These include essays, informal discussions (oral reassessment), projects, or other forms of
performance-based assessment. Differentiated reassessment, like Mastery Learning, provides
teachers with the ideal quantitative and qualitative reflection of what a student has mastered
(Cummins & Davesne, 2009). As part of its functionality, a SBG classroom allows for
reassessment throughout the semester to bring up a student’s mastery and retention of course
material.
Therefore, the treatment in my study was the use of differentiated reassessment in my
five sections of American History 1. If Mastery Teaching (in the form of a SBG classroom) is
truly able to produce students who master the material better than their peers, then my students
should show greater growth between the SOCA and EOCA than the students in the non-SBG
classrooms. If Mastery Learning (in the form of differentiated reassessment) actually has a
metacognitive and motivational effect on how 9th graders perceive their own learning, then
students in my classroom should score higher on the nine factors (F1-F9, discussed later in this
section) created by the two questionnaires than their counterparts in classrooms that do not use
differentiated reassessment.

27
Instrumentation and Materials
Data came from district test scores and two anonymous questionnaires. The tests used
were the district-created, district-approved, and district-mandated SOCA and EOCA for the
American History 1 classes. The first survey, called The American History Motivation
Questionnaire, was adapted from Shawn M. Glynn’s (2006) The Science Motivation
Questionnaire II, or SMQII. The Personal Responsibility Orientation to Self-Direction in
Learning Scale (or PRO-SDLS), created by Susan Stockdale in 2003, was the second survey
administered. These surveys were given consecutively at the conclusion of the American History
1 EOCA, which occurred during the district’s Final Exam Week (December 16-18, 2015).
All American History 1 and Honors American History 1 students in Mr. O, Mr. E, and
my classes took a common American History 1 SOCA (Appendix D) during the second week of
school. This provided basic data to draw an average score to use in this research study. The test
was identical for both honors and non-honors classes and consisted of 35 multiple choice
questions each linked to a state standard. Similarly, both classes took a common American
History 1 EOCA at the end of the semester during the eighteenth week. This test consisted of the
same 35 multiple choice questions that appeared on the SOCA. As part of the EOCA, students
were given two short answer questions, which were excluded from analysis. Students’ individual
scores from both classes were recorded to show whether individual and class-wide improvement
was made between the SOCA and the EOCA.
The first of the two anonymous surveys, modified from The Science Motivation
Questionnaire by Glynn (2006), asked students about their perceptions of learning as well as the
role history may (or may not) play in their lives. Glynn’s original questionnaire was created to

28
help college professors identify students that lack motivation at the start of their science courses.
The survey was found to have good “content validity” and “criterion-related validity,” meaning
its questions accurately assess what the person is answering and is predictive of later behavior
(Glynn et al., 2011). The 25 questions evaluated five motivation components: intrinsic
motivation, self-determination, self-efficacy, career motivation, and grade motivation (Table 1).
Table 1
SMQII Definitions
Answers were measured along a five-point scale (“never,” “rarely,” “sometimes,”
“usually,” “always”) to questions like “The science I learn is relevant to my life.” Glynn’s five
motivation categories were used to code the data (F1-F5) gathered from my version of the
SMQII. In my survey, the word “science” was replaced by “history,” and the survey was
renamed The American History Motivation Questionnaire (Appendix E). This was permitted via
fair-use and contingent upon the proper citation of Glynn et al. (2011), per the University of
Georgia’s guidelines.
1. Intrinsic motivation – The inherent satisfaction in learning science for its own sake (Eccles, Simpkins, & Davis-Kean, 2006 – as cited by Glynn et al., 2011, p. 1161).
2. Self-determination – The control students believe they have over their learning of science (Black & Deci, 2000 – as cited by Glynn et al., 2011, p. 1161).
3. Self-efficacy – The students’ belief that they can achieve well in science (Lawson, Banks, & Logvin, 2007 – as cited by Glynn et al., 2011, p. 1161).
4. Career motivation – Important long-term goals that are the primary reason for pursuing a college degree (Humphreys & Davenport, 2005 – as cited by Glynn et al., 2011, p. 1162).
5. Grade motivation – Important short-term goals that measure college success and are part of the entry criteria for many careers (Lin, McKeachie, & Kim, 2003 – as cited by Glynn et al., 2011, p. 1162).
29
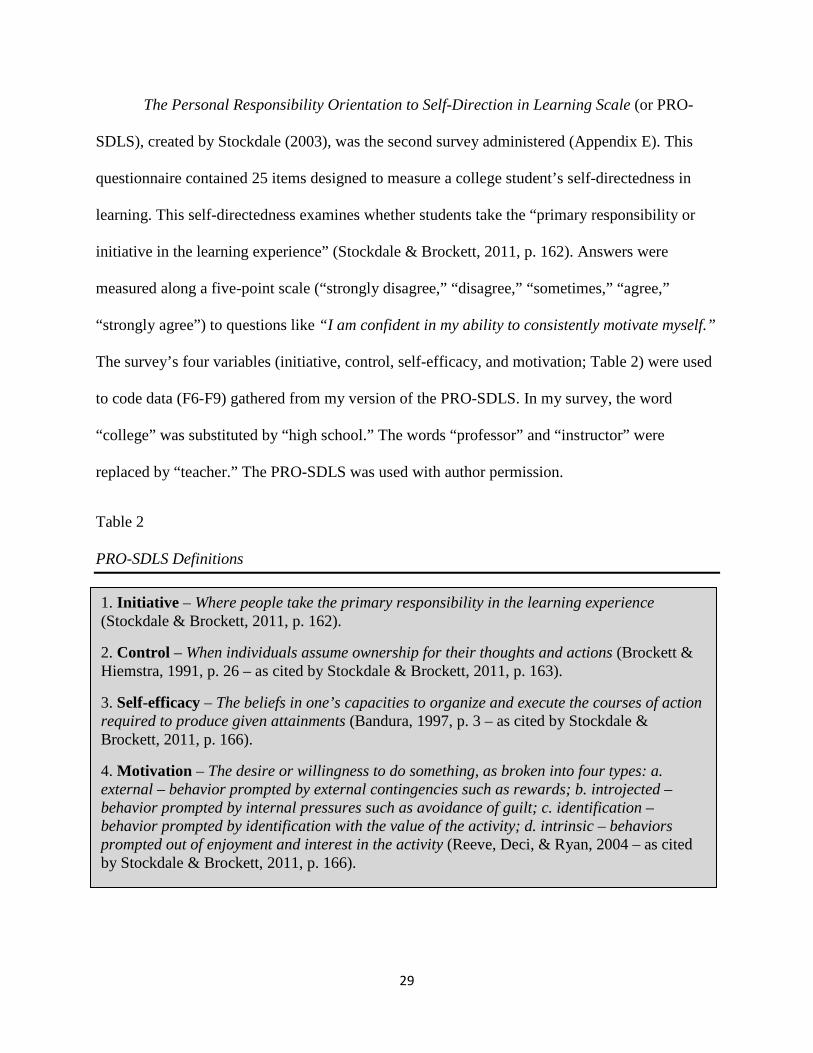
The Personal Responsibility Orientation to Self-Direction in Learning Scale (or PRO-
SDLS), created by Stockdale (2003), was the second survey administered (Appendix E). This
questionnaire contained 25 items designed to measure a college student’s self-directedness in
learning. This self-directedness examines whether students take the “primary responsibility or
initiative in the learning experience” (Stockdale & Brockett, 2011, p. 162). Answers were
measured along a five-point scale (“strongly disagree,” “disagree,” “sometimes,” “agree,”
“strongly agree”) to questions like “I am confident in my ability to consistently motivate myself.”
The survey’s four variables (initiative, control, self-efficacy, and motivation; Table 2) were used
to code data (F6-F9) gathered from my version of the PRO-SDLS. In my survey, the word
“college” was substituted by “high school.” The words “professor” and “instructor” were
replaced by “teacher.” The PRO-SDLS was used with author permission.
Table 2
PRO-SDLS Definitions
1. Initiative – Where people take the primary responsibility in the learning experience (Stockdale & Brockett, 2011, p. 162).
2. Control – When individuals assume ownership for their thoughts and actions (Brockett & Hiemstra, 1991, p. 26 – as cited by Stockdale & Brockett, 2011, p. 163).
3. Self-efficacy – The beliefs in one’s capacities to organize and execute the courses of action required to produce given attainments (Bandura, 1997, p. 3 – as cited by Stockdale & Brockett, 2011, p. 166).
4. Motivation – The desire or willingness to do something, as broken into four types: a. external – behavior prompted by external contingencies such as rewards; b. introjected – behavior prompted by internal pressures such as avoidance of guilt; c. identification –behavior prompted by identification with the value of the activity; d. intrinsic – behaviors prompted out of enjoyment and interest in the activity (Reeve, Deci, & Ryan, 2004 – as cited by Stockdale & Brockett, 2011, p. 166).

30
Statistical Analyses
My study looked to determine if there was a connection between my classroom and
higher metacognitive and motivational scores on the SMQII and PRO-SDLS surveys. I also
hoped to find that EOCA scores were better for my classes when compared to Mr. E and Mr. O’s
classes. Principal Component Analysis (PCA) sought to confirm that my students’ answers
corresponded to the factor structures described by Glynn et al. and Stockdale and Brockett
(discussed in detail in Section Four). Analyses run using the Statistical Program for the Social
Sciences, version 23.0 (or SPSS 23), included PCA, two nonparametric tests (the Mann-Whitney
U test and the Kruskal-Wallis H test), and two parametric tests (one-way ANOVA and
independent samples t tests).
PCA takes a large set of variables and condenses them down into a smaller set of
variables (the “principal components”) that are strong enough to account for the discrepancy (or
“variance”) in the original data set (Lund & Lund, 2016). The Mann-Whitney U test is a
nonparametric test used to find differences between two groups with a dependent variable along
a continuous scale, producing data that is mathematically similar to an independent samples t test
(Statistics Solutions, 2016). While the t test is preferred, my data turned out to be non-normally
distributed, which resulted in the need to use Mann-Whitney for some tests. This test was run to
see if improvement between the American History 1 SOCA and EOCA (measured using a
continuous scale) differed based upon classroom.
The one-way analysis of variance (or ANOVA) and its nonparametric equivalent, the
Kruskal-Wallis H test, are hypothesis-testing procedures used to compare two or more
populations. It offers a tremendous advantage over t tests, which can only be used for two
31
populations (Gravetter & Wallnau, 2008). I examined two populations when I compared
classrooms that use differentiated reassessment (my class) with classrooms that do not use
differentiated reassessment (Mr. E and Mr. O’s sections combined). I looked at three populations
when I separated Mr. E and Mr. O’s non-SBG classrooms and compared them individually
against one another and against my classrooms. The outcome in all of these analyses was to test
whether the treatments (Mastery Teaching and Mastery Learning) produced “statistically
significant” changes in the populations. When something is “statistically significant,” it means
there is no more than a 0.05 chance that the difference between groups results from sampling
error.
Data Collection
Data collection began after receiving permission by the Institutional Review Board (IRB)
at Otterbein University. A quasi-experimental, between-group comparative design was
implemented to allow for those in the SBG classroom and those in the traditional settings to be
studied and compared. Intervention during this experiment came in the form of Mastery
Teaching and Mastery Learning, with a heavy emphasis on differentiated reassessment.
In the end, 232 of 327 survey responses were gathered (71% participation rate), with 116
in my SBG classroom and 116 in non-SBG classrooms (80 from Mr. E; 36 from Mr. O). All 327
student SOCA and EOCA scores were reported to school’s administration and the district’s
curriculum coordinator. Of the 327 students, 124 were in my SBG classroom and 203 were in the
non-SBG classrooms (127 in Mr. E; 76 in Mr. O). Section Four provides a summary of the
findings as well as all data analysis undertaken.

32
SECTION FOUR
Results
Introduction
The purpose of this quasi-experimental study with between-group comparative design
was to see if there is a connection between my SBG classroom (which uses differentiated
reassessment) and higher metacognitive and motivational scores on the SMQII and PRO-SDLS
surveys and whether this translated into larger statistical gains between SOCA and EOCA scores.
Using the district’s American History 1 SOCA and EOCA, the SMQII survey, and the PRO-
SDLS survey, I ran statistical tests in the form of Principal Component Analysis (PCA), the
Mann-Whitney U test, the Kruskal-Wallis H test, one-way ANOVA, and independent samples t
tests in order to analyze the results and answer the three research questions. Data collection
consisted of gathering student responses to the two surveys and their SOCA/EOCA scores from
13 American History classes at a suburban high school in Central Ohio.
Data Tracking
To track the data and results of both the SOCA/EOCA and the SMQII/PRO-SDLS, as
well as to maintain confidentiality, I relied on the American History teachers in the other eight
classes (five for Mr. E; three for Mr. O). Following the administration of the American History 1
and Honors American History 1 SOCA and EOCA, the individual Scantron forms were collected
by the classroom teachers and scored, using the answer keys provided by the district. Since the
EOCA was acting as a Final Exam for their courses, both teachers recorded the scores of each
student into their online grade book. Only the SOCA and EOCA scores of students that had
taken both forms of the assessment were used in this study. Those students that transferred
classes or left the district and who did not take the EOCA had their SOCA scores removed.

33
Those students who arrived in the classroom after the SOCA had been given still took the EOCA
for the purposes of their Final Exam grade, but their scores were also removed.
Principal Component Analysis: Do the Factor Structures of the SMQII and PRO-SDLS
Conform to Expectations?
I used SPSS to run PCA independently for the SMQII and the PRO-SDLS. The hope in
running PCA is to take a larger set of variables and condense them down into a smaller set of
variables (the “principal components”) that are strong enough to account for the discrepancy (or
“variance”) in the original data set. This allows the user to “cluster” variables together and
reduce redundancy (Lund & Lund, 2016). Larger sample sizes are needed in order for PCA to
yield reliable results, with most statistical sources recommending no fewer than 150 cases. As
my study contained 232 survey participants and 327 test scores, sample size was not an issue.
Additionally, PCA was conducted to make sure the resulting factors from my data matched up
with Glynn’s five factors in SMQII and Stockdale’s four factors in PRO-SDLS.
Both the SMQII and the PRO-SDLS contain 25 questions, and both use a five-point
scale. Knowing this, I elected to use a scale of 1 through 5 to code student responses. The SMQII
used “never” (coded as 1), “rarely” (coded as 2), “sometimes” (coded as 3), “usually” (coded as
4), and “always” (coded as “5”). The PRO-SDLS used “strongly disagree” (coded as 1),
“disagree” (coded as 2), “sometimes” (coded as 3), “agree” (coded as 4), and “strongly agree”
(coded as 5). While this data is ordinal, Lovelace and Brickman (2013) caution against assuming
that such coded numbers accurately represent units that can be transformed into data to justify
the use of parametric statistical procedures. They caution that conclusions made in research that
measure students attitudes, while impactful in studying educational strategies, “are only as good

34
as the quality of the measures and the methods used to analyze the data collected” (p. 615). As a
result, I needed to make sure that I produced support for the validity of my findings. Lovelace
and Brickman further argue that individual questions must be treated as ordinal but become
meaningful if the theoretically supported individual questions are broken into factors (composite
scores for multiple questions). PCA would later show that my study’s factor structure was valid,
and because Glynn and Stockdale have theoretical support for their factors, I could justify the use
of parametric statistics to draw conclusions from my students’ responses.
Principal Component Analysis of SMQII and PRO-SDLS
Questionnaire data loaded into nine total factors. SMQII data loaded into five factors (F1-
F5), while PRO-SDLS data loaded into four factors (F6-F9). These factors were: 1. Intrinsic
motivation (F1); 2. Career motivation (F2); 3. Self-determination (F3); 4. Self-efficacy (F4); 5.
Grade motivation (F5); 6. Initiative (F6); 7. Control (F7); 8. Self-efficacy (F8); and 9. Motivation
(F9). Factors coded as F4 and F8 both included information pertaining to self-efficacy, but both
were tied to different surveys (F4 with the SMQII; F8 with the PRO-SDLS). In terms of
motivation, the SMQII divided this into three separate factors: intrinsic (F1), career (F2), and
grade (F5). The PRO-SDLS did not distinguish different kinds of motivation and kept it within
its own factor (F9).
The factor categories of the SMQII, along with the corresponding survey questions from
my version (American History Motivational Questionnaire or AHMQ), can be found in Table 3.

35
Table 3
Principal Component Analysis: Factor loading of items from AHMQ
Note. As cited in Glynn, Brickman, Armstrong, and Taaoobshirazi (2011, p. 1167).
Factor 1 (F1). Intrinsic motivation
Question 1. The history I learn is relevant to my life.
Question 3. Learning history is interesting.
Question 12. Learning history makes my life more meaningful.
Question 17. I am curious about discoveries in history.
Question 19. I enjoy learning history.
Factor 2 (F2). Career motivation
Question 7. Learning history will help me get a good job.
Question 10. Knowing history will give me a career advantage.
Question 13. Understanding history will benefit me in my career.
Question 23. My career will involve history.
Question 25. I will use history problem-solving skills in my career.
Factor 3 (F3). Self-determination
Question 5. I put enough effort into learning history.
Question 6. I use strategies to learn history well.
Question 11. I spend a lot of time learning history.
Question 16. I prepare well for history tests.
Question 22. I study hard to learn history.
Factor 4 (F4). Self-efficacy
Question 9. I am confident I will do well on history tests.
Question 14. I am confident I will do well on history assignments and projects.
Question 15. I believe I can master history knowledge and skills.
Question 18. I believe I can earn a grade of “A” in history.
Question 21. I am sure I can understand history.
Factor 5 (F5). Grade motivation
Question 2. I like to do better than other students on history tests.
Question 4. Getting a good history grade is important to me.
Question 8. It is important that I get an “A” in history.
Question 20. I think about the grade I will get in history.
Question 24. Scoring high on history tests matters to me.

36
The factor categories of the PRO-SDLS, along with the corresponding survey questions,
can be found in Table 4:
Table 4
Principal Component Analysis: Factor loading of items from PRO-SDLS
Note. As cited in Stockdale and Brockett (2011, p. 171).
Factor 6 (F6). Initiative
Question 2. I frequently do extra work in a course just because I am interested.
Question 9. I would rather take the initiative to learn new things in a course rather than wait for the instructor to foster new learning.
Question 10. I often use materials I’ve found on my own to help me in a course.
Question 15. Even after a course is over, I continue to spend time learning about the topic.
Question 17. I often collect additional information about interesting topics even after the course has ended.
Question 25. I always rely on the teacher to tell me what I need to do in the course to succeed.
Factor 7 (F7). Control
Question 4. If I am not doing as well as I would like in a course, I always independently make the changes necessary for improvement.
Question 5. I always effectively take responsibility for my own learning.
Question 6. I often have a problem motivating myself to learn.
Question 13. I usually struggle in classes if the teacher allows me to set my own timetable for work completion.
Question 19. I am very successful at prioritizing my learning goals.
Question 23. I always effectively organize my study time.
Factor 8 (F8). Self-efficacy**
Question 1. I am confident in my ability to consistently motivate myself.
Question 7. I am very confident in my ability to independently prioritize my learning goals.
Question 12. I am very convinced I have the ability to take personal control of my learning.
Question 21. I am really uncertain about my capacity to take primary responsibility for my learning.
Question 22. I am unsure about my ability to independently find needed outside materials for my courses.
Question 24. I don’t have much confidence in my ability to independently carry out my student plans.
** My survey data did not confirm Factor 8.
Factor 9 (F9). Motivation
Question 3. I don’t see any connection between the work I do for my courses and my personal goals and interests.
Question 8. I complete most of my high school activities because I WANT to, not because I HAVE to.
Question 11. For most of my classes, I really don’t know why I take personal control of my learning.
Question 14. Most of the work I do in my courses is personally enjoyable or seems relevant to my reasons for attending high school.
Question 16. The primary reason I complete course requirements is to obtain the grade that is expected of me.
Question 18. The main reason I do the course activities is to avoid feeling guilty or getting a bad grade.
Question 20. Most of the activities I complete for my high school classes are NOT really personally useful or interesting.
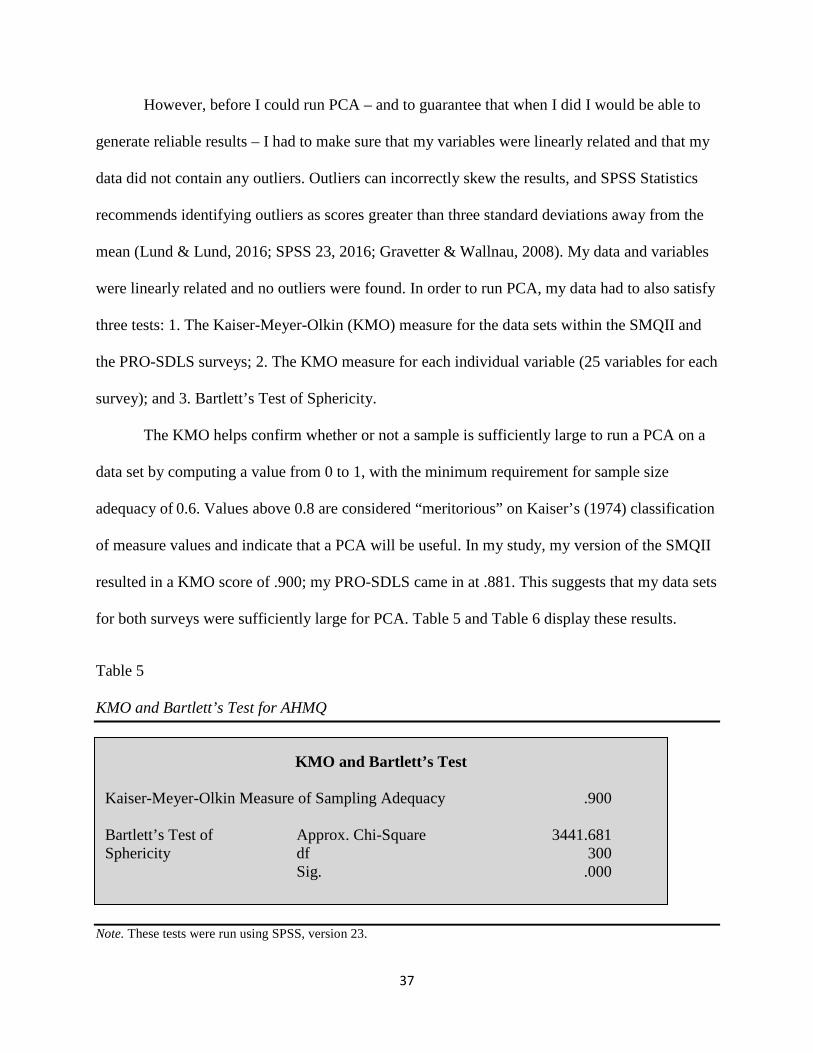
37
However, before I could run PCA – and to guarantee that when I did I would be able to
generate reliable results – I had to make sure that my variables were linearly related and that my
data did not contain any outliers. Outliers can incorrectly skew the results, and SPSS Statistics
recommends identifying outliers as scores greater than three standard deviations away from the
mean (Lund & Lund, 2016; SPSS 23, 2016; Gravetter & Wallnau, 2008). My data and variables
were linearly related and no outliers were found. In order to run PCA, my data had to also satisfy
three tests: 1. The Kaiser-Meyer-Olkin (KMO) measure for the data sets within the SMQII and
the PRO-SDLS surveys; 2. The KMO measure for each individual variable (25 variables for each
survey); and 3. Bartlett’s Test of Sphericity.
The KMO helps confirm whether or not a sample is sufficiently large to run a PCA on a
data set by computing a value from 0 to 1, with the minimum requirement for sample size
adequacy of 0.6. Values above 0.8 are considered “meritorious” on Kaiser’s (1974) classification
of measure values and indicate that a PCA will be useful. In my study, my version of the SMQII
resulted in a KMO score of .900; my PRO-SDLS came in at .881. This suggests that my data sets
for both surveys were sufficiently large for PCA. Table 5 and Table 6 display these results.
Table 5
KMO and Bartlett’s Test for AHMQ
Note. These tests were run using SPSS, version 23.
KMO and Bartlett’s Test
Kaiser-Meyer-Olkin Measure of Sampling Adequacy .900 Bartlett’s Test of Approx. Chi-Square 3441.681 Sphericity df 300 Sig. .000

38
Table 6
KMO and Bartlett’s Test for PRO-SDLS
Note. These tests were run using SPSS, version 23.
Having met the KMO for my data sets, I then needed to look at the KMO value of my
two surveys individual variables. With these scores, researchers would like for each of their
variables to be as close to 1 as possible, with a minimum of 0.5. If an individual variable has a
low KMO measure (KMO < 0.5), then it is recommended that researchers remove it from the
analysis (Lund & Lund, 2016). In my study, all KMO measures came in greater than 0.7,
meaning there was adequacy of sampling for the individual questions.
The final test to see if I was able to run PCA, called Bartlett’s Test of Sphericity, checks
to see if there are adequate correlations between variables. If there are adequate correlations
between variables, it would mean my variables are capable of being reduced to a smaller number
of components. (Lund & Lund, 2016). If Bartlett’s Test of Sphericity was statistically significant
(p < .05), then my data would be suitable for PCA. In referencing Table 5 on the previous page,
this significance value (i.e., p value) is located in the “Sig.” row. In both the SMQII and the
PRO-SDLS, the Sig. shows “.000,” which essentially means p < .0005. My data was found to be
suitable for PCA.
KMO and Bartlett’s Test
Kaiser-Meyer-Olkin Measure of Sampling Adequacy .881 Bartlett’s Test of Approx. Chi-Square 2082.164 Sphericity df 300 Sig. .000
39
The interpretability criterion for the Rotated Component Matrix shows how each
component loads on each variable with an objective of achieving “simple structure.” This means
that each survey items loads strongly on only one factor, and each factor includes at least three
survey items. In running these tests, my hope was that the 25 questions that I used from the
SMQII and the 25 questions from the PRO-SDLS all load into the same pre-determined factors
as loaded by Glynn (SMQII) and Stockdale (PRO-SDLS). Glynn’s SMQII loaded Questions 1, 3,
12, 17, 19 into Factor 1 (Intrinsic motivation); Questions 7, 10, 13, 23, and 25 into Factor 2
(Career motivation); Questions 5, 6, 11, 16, and 22 into Factor 3 (Self-determination); Questions
9, 14, 15, 18, 21 into Factor 4 (Self-efficacy); and Questions 2, 4, 8, 20, and 24 into Factor 5
(Grade motivation). Stockdale’s PRO-SDLS loaded Questions 2, 9, 10, 15, 17, and 25 into
Factor 6 (Initiative); Questions 4, 5, 6, 13, 19, and 23 into Factor 7 (Control); Questions 1, 7, 12,
21, 22, and 24 into Factor 8 (Self-efficacy); and Questions 3, 8, 11, 14, 16, 18, and 20 into Factor
9 (Motivation).
The Rotated Component Matrix for the SMQII saw all of my questions for Factor 1 load
in Factor 1, just like they did for Glynn. The same was true for Factors 2, 4, and 5. Question 11
(“I spend a lot of time learning history”) should have loaded for Factor 3 (Self-determination)
but instead loaded for Factor 1 (Intrinsic motivation). This was the only question that did not
match Glynn et al.’s results, so I used Glynn et al.’s structure. The Rotated Component Matrix
for the PRO-SDLS saw Factors 6, 7, and 9 correctly load their corresponding questions.
However, Factor 8 (Self-efficacy) had only three of its six questions land within the factor. Since
Factor 8 from the PRO-SDLS was the same as Factor 4 of the SMQII, I elected to cut Factor 8 in
favor of the results from Factor 4.
40
Are There Differences in Motivation and/or Metacognition in the Treatment
and Non-Treatment Groups?
Motivation and Metacognition – All Students: SBG vs. Non-SBG
Having confirmed the SMQII and PRO-SDL factor structures, I was able to compare the
coded student responses for Factors 1-5 (SMQII) and Factors 6-9 (PRO-SDLS) to see if there
was a statistically significant difference between students in my classes (which utilizes SBG and
differentiated reassessment) and those in Mr. E and Mr. O’s classes (which do not utilize SBG
and do not use differentiated reassessment). Since the independent samples t test is used when
comparing two groups, I was unable to use that particular statistical test to examine three
teachers. As such, I needed to use a one-way analysis of variance (ANOVA). However,
according to Lund and Lund (2016), a one-way ANOVA is unable to tell a researcher which
groups were statistically different – it can only show that at least two of them were different.
With three groups in my study, determining which group is different is important, and follow-up
post hoc tests were needed. Specifically, the Tukey post hoc provides statistical significance
level (i.e., p value) for each comparison (Lund & Lund, 2016).
Using the Shapiro-Wilk Test for Normality, which confirms that a sample came from a
normally distributed population (Lund & Lund, 2016), Factor 1 was found to be non-normal.
This was confirmed because the skewness to standard error ratio for the data in Mr. E’s class
(also called the z score) was > 2.58. As a result, I did not worry about the two outliers present
because this prompted me to use a nonparametric test. Factor 2 failed the Shapiro-Wilk Test, but
I treated it as normal because all z scores were between –2.58 and 2.58. With Factor 3, only my
students’ scores failed the Shapiro-Wilk Test but passed the z score, which meant I could treat it

41
as normal. The single outlier proved not to be an issue. Factors 4 and 5 were non-normal, but
because I used a nonparametric test, the outliers were not an issue. When Factor 6 came back as
normal, it had four outliers. The outliers were in nearly symmetric pairs in both my class and Mr.
E’s class, so I elected to keep the outliers. To make sure these four outliers did not impact the
results, I re-ran the analysis twice (with and without the outliers), which confirmed that they did
not. Factor 7 failed the Shapiro-Wilk Test but passed the z score tests for skewness and kurtosis,
so I treated it as normal and included the outlier. Factor 8 failed the Shapiro-Wilk Test but
passed the z score; however, Factor 8 was the factor I elected to cut because of the PCA and the
inability of the questions to properly load on the factor. (Factor 4 replaced this factor.) Lastly,
Factor 9 was normal but had two outliers. I ran the tests with and without the outliers to prove
that they did not affect my results. They did not.
For the non-normally distributed data, I switched to the nonparametric Mann-Whitney U
test for comparisons of two levels and the Kruskal-Wallis H test for comparison of three or more
levels. With the normality tests, the one-way ANOVA was only valid for Factors 2, 3, 6, 7, and
9. For the others, Factors 1, 4, and 5, I ran the Kruskal-Wallis H test. For Factors 2, 3, 6, 7, and
9, equality of variance was satisfied for all variables, so I used the ANOVA table rather than the
Robust Test for Equality of Means table. From the ANOVA table of my normally distributed
variables, only Factor 3 had p < .05. This allowed me to conclude that there were no significant
differences among classrooms for Factors 2, 6, 7, and 9. For Factor 3, however, there were some
differences between classrooms, but because ANOVA is not capable of determining what those
are, I turned to post-hoc tests, most notably the Tukey post hoc test. This test provides the
researcher a statistical significance level (p value) for each pairwise comparison (Lund & Lund,
2016). Here I found that Mr. O (mean F3 = 3.07) and Mr. E (mean F3 = 3.538) were

42
significantly different from one another (p = .133), and Mr. O (mean F3 = 3.071) and my class
(mean F3 = 3.555) were significantly different from one another (p = .070). However, my class
(mean F3 = 3.555) and Mr. E (mean F3 = 3.538) were not statistically different from one
another. This did not support my hypothesis that my treatment causes a change, because if that
were the case, then my class would have been significantly different from Mr. E’s class. My
class would also have been significantly different from Mr. O, while Mr. O and Mr. E would
have been the same as one another. Not until I broke the classes into sub-groups and examined
non-honors against non-honors and honors against honors did I find that Factor 5 (Grade
motivation) was statistically significantly higher for my non-honors students (M = 4.384) than
for the non-honors in Mr. E and Mr. O’s non-SBG classrooms (M = 4.096), U = 1,318, p = .026.
(This is discussed in greater detail in Section Five.)
As a result, I was unable to reject the first null hypothesis (H01), meaning there is no
statistically significant difference in the metacognitive effect of how 9th grade students (as a
whole) perceive their learning in a social studies classroom that utilizes differentiated
reassessment within a standards-based curriculum and students in traditional classrooms. I was
also unable to reject the second null hypothesis (H02), meaning there is no statistically significant
difference in the motivational effect of how 9th grade students (as a whole) perceive their
learning in a social studies classroom that utilizes differentiated reassessment within a standards-
based curriculum and students in traditional classrooms. However, there is a statistically
significant difference among non-honors students when it comes to grade motivation. Again, this
is discussed at length in the next section.

43
Motivation and Metacognition – All Students: Non-Honors vs. Honors
Using all students that completed the SMQII and PRO-SDLS surveys (N = 232; 118
enrolled in non-honors classes and 114 enrolled in honors classes), the Shapiro-Wilk Test for
Normality found Factors 3, 6, and 7 were normally distributed; Factors 1, 2, 4, 5, and 9 were not.
A parametric independent samples t test indicated a statistically significant difference for Factor
3 (Self-determination) between honors (M = 3.660) and non-honors students (M = 3.295), t =
-3.969, p = .0005. The test also found that for Factor 6 (Initiative), there were statistically
significant differences between honors (M = 3.007) and non-honors students (M = 2.791); t =
-2.918, p = .004). The tests found no statistically significant differences for Factor 7 (Control).
The nonparametric Mann-Whitney U test, used for Factors 1, 2, 4, 5, and 9 found statistically
significant differences between all honors and non-honors students for Factors 1, 4, and 5. Factor
1 (Intrinsic motivation) was statistically significantly higher for honors students (M = 3.546) than
for the non-honors students (M = 3.102), U = 8,635, p = .0005. Factor 4 (Self-efficacy) was also
statistically significantly higher for honors students (M = 4.067) than for the non-honors students
(M = 3.647), U = 9,106, p = .0005. Lastly, Factor 5 (Grade motivation) was statistically
significantly higher for honors students (M = 4.500) than for the non-honors students (M =
4.253), U = 8,653.50, p = .0005. The results can be seen in Table 7.

44
Table 7
Motivation and Metacognition – Non-Honors Students: SBG vs. Non-SBG
Concerning the non-honors students that completed the SMQII and PRO-SDLS surveys
(N = 118; 64 enrolled in my non-honors SBG classes and 54 in the non-honors non-SBG
classes), the Shapiro-Wilk Test for Normality found Factors 1, 2, 3, 6 and 9 were normally
distributed; Factors 4, 5, and 7 were not. My survey data did not confirm Factor 8 (Self-efficacy);
as such, it was removed from analysis. (However, Factor 4, which also covered self-efficacy,
was confirmed by my data, so it replaced Factor 8 in the analysis.) The parametric independent
samples t test for Factors 1, 2, 3, 6, and 9 found that my SBG classroom does not affect non-
honors students in a statistically significant way. The nonparametric Mann-Whitney U test, used
for Factors 4, 5, and 7 because they were not normally distributed, was run to determine if there
were differences in motivation and metacognition scores between non-honors students in SBG
Statistically Significant Factor Means for Honors vs. Non-Honors Students
Factor Honors Non-Honors p values
Factor 1 (Intrinsic motivation) M = 3.546 M = 3.102 p = .0005
Factor 3 (Self-determination) M = 3.660 M = 3.295 p = .0005
Factor 4 (Self-efficacy) M = 4.067 M = 3.647 p = .0005
Factor 5 (Grade motivation) M = 4.500 M = 4.253 p = .0005
Factor 6 (Initiative) M = 3.007 M = 2.791 p = .0040
Note 1. Factor 2 (Career motivation), Factor 7 (Control), and Factor 9 (Motivation) were not statistically significant. Factor 8 (Self-efficacy) was not used as my survey data did not confirm it.
Note 2. These tests were run using SPSS, version 23.

45
and non-SBG classrooms. Only Factor 5 (Grade motivation) was statistically significantly higher
for my non-honors students (M = 4.384) than for the non-honors in the non-SBG classrooms (M
= 4.096), U = 1,318, p = .026.
Motivation and Metacognition – Honors Students: SBG vs. Non-SBG
Concerning the honors students that completed the SMQII and PRO-SDLS surveys (N =
114; 53 enrolled in my honors SBG classes and 61 in the honors non-SBG classes), the Shapiro-
Wilk Test for Normality found Factors 1, 2, 3, 6, 7 and 9 were normally distributed; Factors 4
and 5 were not. The parametric independent samples t test for Factors 1, 2, 3, 6, 7 and 9 and the
nonparametric Mann-Whitney U test for Factors 4 and 5 both found that my SBG classroom
does not affect honors students in a statistically significant way.
Are There Differences in SOCA/EOCA in the Treatment and Non-Treatment Groups?
The data analysis for the third question examined the difference (comparison) between
two populations (those in my SBG classes; those in Mr. E and Mr. O’s non-SBG classes). Sub-
groups of students from each class were also analyzed, specifically how Mr. E’s honors students
performed when compared to my honors students and how Mr. O’s and Mr. E’s non-honors
students scored when paralleled to my non-honors students. Does Mastery Teaching have an
impact on the mastery of the material by 9th grade students?
As for the statistical tests, mean scores were computed and compared between the
intervention and control groups using Hake Gains and independent samples t tests. Hake Gains
look for “normalized gains” between pre- and post-test scores. Such a gain is the increase in each
student’s pre-test score divided by the average increase that would have resulted if each student
had a perfect score on a post-test (Hake, 1998). Hake (1998) argues that the normalized gain is a

46
meaningful measure of how well an intervention works when comparing populations having
different pre-test scores. In my study, this intervention is SBG and differentiated reassessment.
Such tests provided the right kind of statistical information to either reject or fail to reject the
third null hypothesis (H03).
The third research question for this study examined the difference in the EOCA scores of
non-honors, honors, and all students combined within the two classrooms (SBG and non-SBG).
Table 8 contains the SOCA and EOCA results by class, as well as the Hake Gains.
Table 8
Combined Group Statistics and Hake Gains for Non-SBG vs. SBG Classrooms
Group N SOCA* EOCA Hake t p
Non-SBG All Students 8 25.80 53.90 63.57% 1.679 .121
SBG All Students 5 28.68 58.22 71.49%
________________________________________________________________________
Non-SBG Non-Honors 5 24.83 51.08 58.11% 3.125 .020
SBG Non-Honors 3 28.47 57.67 70.31%
________________________________________________________________________
Non-SBG Honors 3 27.41 58.60 73.20% –.002 .999
SBG Honors 2 29.00 59.05 74.40%
* Both SOCA and EOCA scores were out of 70 possible points.
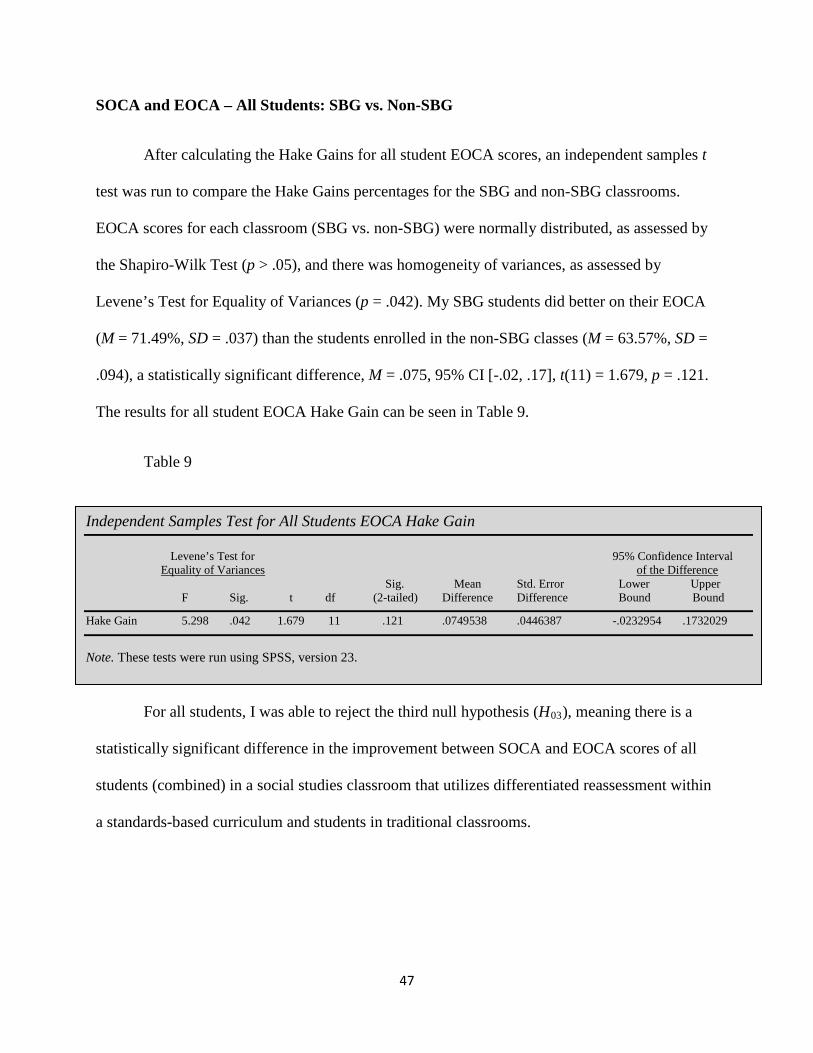
47
SOCA and EOCA – All Students: SBG vs. Non-SBG
After calculating the Hake Gains for all student EOCA scores, an independent samples t
test was run to compare the Hake Gains percentages for the SBG and non-SBG classrooms.
EOCA scores for each classroom (SBG vs. non-SBG) were normally distributed, as assessed by
the Shapiro-Wilk Test (p > .05), and there was homogeneity of variances, as assessed by
Levene’s Test for Equality of Variances (p = .042). My SBG students did better on their EOCA
(M = 71.49%, SD = .037) than the students enrolled in the non-SBG classes (M = 63.57%, SD =
.094), a statistically significant difference, M = .075, 95% CI [-.02, .17], t(11) = 1.679, p = .121.
The results for all student EOCA Hake Gain can be seen in Table 9.
Table 9
For all students, I was able to reject the third null hypothesis (H03), meaning there is a
statistically significant difference in the improvement between SOCA and EOCA scores of all
students (combined) in a social studies classroom that utilizes differentiated reassessment within
a standards-based curriculum and students in traditional classrooms.
Independent Samples Test for All Students EOCA Hake Gain
Levene’s Test for 95% Confidence Interval Equality of Variances of the Difference Sig. Mean Std. Error Lower Upper
F Sig. t df (2-tailed) Difference Difference Bound Bound
Hake Gain 5.298 .042 1.679 11 .121 .0749538 .0446387 -.0232954 .1732029
Note. These tests were run using SPSS, version 23.
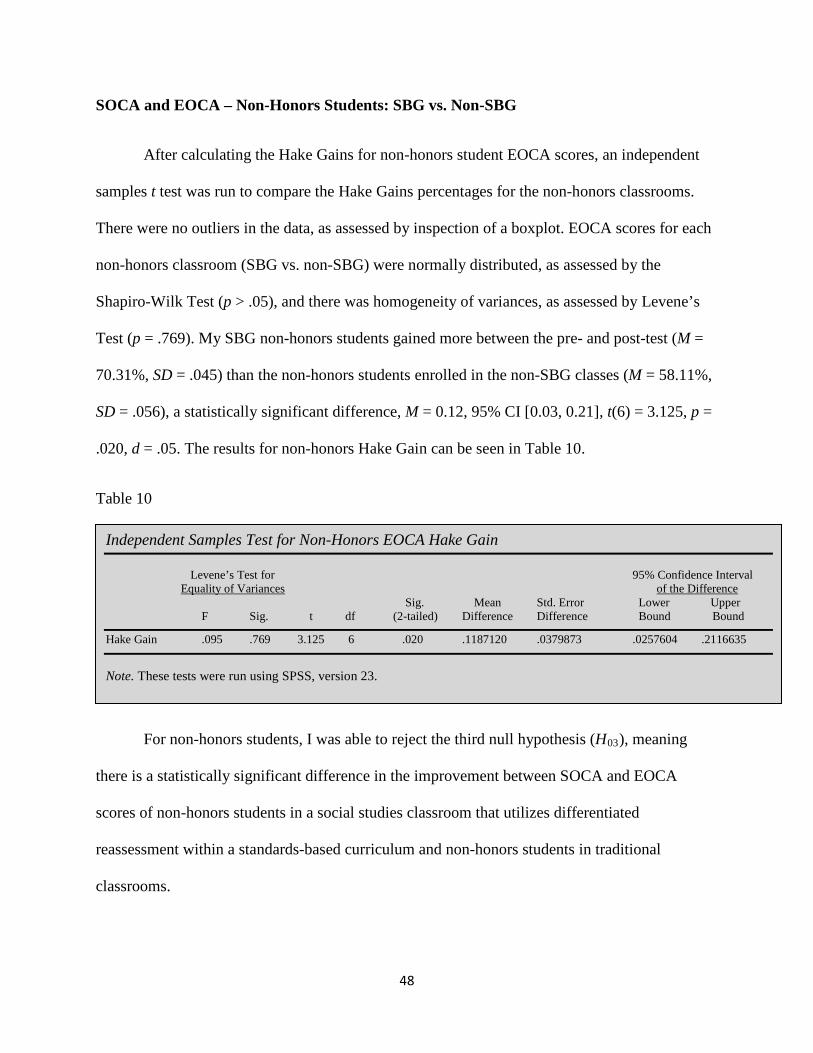
48
SOCA and EOCA – Non-Honors Students: SBG vs. Non-SBG
After calculating the Hake Gains for non-honors student EOCA scores, an independent
samples t test was run to compare the Hake Gains percentages for the non-honors classrooms.
There were no outliers in the data, as assessed by inspection of a boxplot. EOCA scores for each
non-honors classroom (SBG vs. non-SBG) were normally distributed, as assessed by the
Shapiro-Wilk Test (p > .05), and there was homogeneity of variances, as assessed by Levene’s
Test (p = .769). My SBG non-honors students gained more between the pre- and post-test (M =
70.31%, SD = .045) than the non-honors students enrolled in the non-SBG classes (M = 58.11%,
SD = .056), a statistically significant difference, M = 0.12, 95% CI [0.03, 0.21], t(6) = 3.125, p =
.020, d = .05. The results for non-honors Hake Gain can be seen in Table 10.
Table 10
For non-honors students, I was able to reject the third null hypothesis (H03), meaning
there is a statistically significant difference in the improvement between SOCA and EOCA
scores of non-honors students in a social studies classroom that utilizes differentiated
reassessment within a standards-based curriculum and non-honors students in traditional
classrooms.
Independent Samples Test for Non-Honors EOCA Hake Gain
Levene’s Test for 95% Confidence Interval Equality of Variances of the Difference Sig. Mean Std. Error Lower Upper
F Sig. t df (2-tailed) Difference Difference Bound Bound
Hake Gain .095 .769 3.125 6 .020 .1187120 .0379873 .0257604 .2116635
Note. These tests were run using SPSS, version 23.

49
SOCA and EOCA – Honors Students: SBG vs. Non-SBG
After calculating the Hake Gains for honors student EOCA scores, an independent
samples t test was run to compare the Hake Gains percentages for the honors classrooms. There
were no outliers in the data, as assessed by inspection of a boxplot. EOCA scores for each honors
classroom (SBG vs. non-SBG) were normally distributed, as assessed by the Shapiro-Wilk Test
(p > .05), and there was homogeneity of variances, as assessed by Levene’s Test (p = .114). My
SBG honors students did not do statistically significantly better on their EOCA (M = 74.4%, SD
= .015) than the honors students enrolled in the non-SBG classes (M = 73.2%, SD = .061), no
statistically significant difference, M = -.00008, 95% CI [-0.15, 0.15], t(3) = -.002, p = .999. The
results for honors EOCA Hake Gain can be seen in Table 11.
Table 11
For honors students, I was unable to reject the third null hypothesis (H03), meaning there
is not a statistically significant difference in the improvement between SOCA and EOCA scores
of honors students in a social studies classroom that utilizes differentiated reassessment within a
standards-based curriculum and honors students in traditional classrooms.
Independent Samples Test for Honors EOCA Hake Gain
Levene’s Test for 95% Confidence Interval Equality of Variances of the Difference Sig. Mean Std. Error Lower Upper
F Sig. t df (2-tailed) Difference Difference Bound Bound
Hake Gain 4.907 .114 -.002 3 .999 -.0000814 .0460023 -.1464812 .1463184
Note. These tests were run using SPSS, version 23.

50
Summary
I used 232 survey respondents to examine the first hypothesis (metacognition) and second
hypothesis (motivation). One hundred and sixteen students were in my SBG classes while 116
were in the non-SBG classrooms (80 from Mr. E; 36 from Mr. O). This whole group comparison
examined students in both honors and non-honors sections and cut across both SBG and non-
SBG classes. I was unable to reject the first null hypothesis (H01) and second null hypothesis
(H02), meaning there is no statistically significant difference in the metacognitive and
motivational effect of how 9th grade students (as whole) perceive their learning in a social studies
classroom that utilizes differentiated reassessment within a standards-based curriculum and
students in traditional classrooms. However, there is a statistically significant difference among
non-honors students when it comes to grade motivation.
All 327 student SOCA and EOCA scores were used to calculate averages for each
American History 1 class’s pre- and post-tests. Of the 327 students, 124 were in my SBG
classroom and 203 were in the non-SBG classrooms (127 in Mr. E; 76 in Mr. O). Overall, my
non-honors and honors students (combined) and my non-honors (individually) produced higher
Hake Gains on their EOCA than the students in the non-SBG classes. I was able to reject the
third null hypothesis (H03), meaning there is a statistically significant difference in the
improvement between SOCA and EOCA scores of students in a social studies classroom that
utilizes differentiated reassessment within a standards-based curriculum and students in
traditional classrooms.
Section Five advances the interpretation of my study’s findings in greater detail. In
addition, that section provides recommendations for action and presents my final reflection.

51
SECTION FIVE
Discussion
Introduction
“Points? Your perception of what makes up a student’s grade is disappointing.”
In an instant, eight years of perceived “awesomeness” was swatted away like a horse fly.
In 2008, I was in my eighth year as an educator – and pretty confident that I knew what I
was doing. I brought history to life through booming lectures and crazy uniforms. After all,
nothing gets the attention of a 14-year-old student with ADD quite like having their 6’3” teacher
wearing 75 pounds of chain mail mock fighting infidels across the desks during a lecture on the
Crusades. I did not use the course text and instead wrote my own material intermixed with
humor and “Did he say that?” flashes of wonder and amusement. I lived for the “Ah-ha!”
moment when I could see a student “get it.” My burly build, shaved head, shaggy beard, and
tattoos gave me a head-start on discipline, although my push-up policy helped put a pep in the
step of even the best hallway roamers. Indeed, at a quick glance, I was owning it.
Until that conference.
I consider the “What is in a grade?” question that I attempted to answer in front of 300
teachers during a conference on assessment and differentiation in downtown Columbus to be the
turning point in my young career. I left understanding that, up until that moment, grades in my
class simply showed that students were able to “play the school game.” They knew how to work
the points system. Grades in my class reflected whether or not students gathered enough points
and were not true reflections of their mastery. I used grades and threats like, “If you do not get a
‘C’ on your final, you will not be eligible in the fall!” as extrinsic motivators. The problem is,

52
students have to be intrinsically motivated, meaning their desire to achieve and improve has to
come from within themselves. Intrinsic motivation clearly conflicts with the use of grades as
extrinsic motivators (O’Connor, 2007). As a result, I had to change what grades “meant” in my
classroom, which ignited an overhaul of how students would be assessed.
For an entire summer, I wrestled with the question of “What does a grade truly reflect?”
Is it what a student knows at the exact moment when they take a test? Or is it a representation of
what they know from a variety of activities and assessments? Additionally, what role do grades
play in truly assessing what a student does or does not know? I found myself asking what I saw
as more important – that 70% of my 150 students know the material on November 7th, an
arbitrary date picked by me as the day in which every student must prove their mastery of the
American Revolution, or that 100% of my 150 students master the material at some point during
the school year?
Can my students recall information they have been taught?
Can they apply what they know to future problems?
Will they remember it when they leave the classroom?
Do they memorize the material for the test – then forget it all?
These questions became my marching orders, and I turned to Mastery Teaching and
Mastery Learning to direct my classroom’s reinvention. By adopting Standards-Based Grading
(Mastery Teaching) and the use of differentiated reassessment (Mastery Learning), I hoped I
could boost motivation among students and get them to want to do better in history, to believe
they could do better, and to actually do better. In theory, if I could get my students to become
more motivated and metacognitively aware of their abilities, then their retention (and mastery) of
53
state-mandated material would be demonstrated by significant gains between district tests given
at the start and end of each semester. This instructional inquiry project looked to determine just
that, and, after running statistical tests using SPSS, I was able to conclude that a SBG classroom
that uses differentiated reassessment does result in higher EOCA scores and more grade
motivation among non-honors students. My classroom overhaul in 2008 was not in vain.
Specifically, I used 232 survey respondents to examine my first hypothesis
(metacognition) and my second hypothesis (motivation). One hundred and sixteen students were
in my SBG classes while 116 were in the non-SBG classrooms (80 from Mr. E; 36 from Mr. O).
This whole group comparison examined students in both honors and non-honors sections and cut
across both SBG and non-SBG classes. I was unable to reject the first null hypothesis (H01),
meaning there is no statistically significant difference in the metacognitive effect of how 9th
grade students (as a whole) perceive their learning in a social studies classroom that utilizes
differentiated reassessment within a standards-based curriculum and students in traditional
classrooms. I was also unable to reject the second null hypothesis (H02), meaning there is no
statistically significant difference in the motivational effect of how 9th grade students (as a
whole) perceive their learning in a social studies classroom that utilizes differentiated
reassessment within a standards-based curriculum and students in traditional classrooms.
However, there is a statistically significant difference among non-honors students when it comes
to grade motivation (SMQII’s Factor 5).
All 327 student SOCA and EOCA scores were used to calculate averages for each
American History 1 class’s pre- and post-tests. Of the 327 students, 124 were in my SBG
classroom and 203 were in the non-SBG classrooms (127 in Mr. E; 76 in Mr. O). Overall, my
non-honors and honors students (combined) and my non-honors (individually) produced higher

54
Hake Gains on their EOCA than the students in the non-SBG classes. I was able to reject the
third null hypothesis (H03), meaning there is a statistically significant difference in the
improvement between SOCA and EOCA scores of students in a social studies classroom that
utilizes differentiated reassessment within a standards-based curriculum and students in
traditional classrooms.
SOCA/EOCA Hake Gains
The results of the Hake Gain calculations between SOCA and EOCA provided some
reassuring validation to my SBG classroom. When all students were taken into account and not
separated out into honors and non-honors, SBG students produced larger Hake Gains (71.49%)
than the non-SBG students (63.57%). When the tests were broken into sub-categories, the
difference between SBG honors students (74.4%) and non-SBG honors students (73.2%) was
statistically non-existent, while the difference between SBG non-honors students (70.31%) and
non-SBG non-honors students (58.11%) was quite staggering.
Research by Block and Burns (1976), Willent, Yamashita, and Anderson (1983), Guskey
and Gates (1986), and Guskey and Pigott (1988) verified that positive improvements in student
learning result from the careful and systematic implementation of Mastery Learning (like my
differentiated reassessment). Kulik, Kulik, and Bangert-Downs (1990) found that Mastery
Learning had positive effects on not only the test scores of students, but also on student attitudes
toward course content and instruction. The larger Hake Gains for the non-honors population
appears to corroborate Bloom’s (1968) argument that all students are fully capable of learning if
placed in an environment that requires them to attain “mastery” before moving forward in their
course material. A classroom that emphasizes learning over grades helps students validate their
55
education (DeKeyrel, Dernovish, Epperly, & McKay, 2000). Is it this validation – this idea that
school is more than “points” – that produced such Hake Gains for my non-honors students? Does
my SBG classroom and differentiated reassessment reveal to non-honors students the possibility
that they can, in fact, “do” school – a thought that may not manifest in a traditional classroom?
Does this newfound confidence give non-honors students the same perception that honors
students already have? If honors students do not need validation as to the importance of school –
and they enter the classroom knowing they can handle whatever expectations the teacher sets for
them – is this why my honors students did not have larger Hake Gains than the non-SBG honors
students? I suspect that my honors students did not need to be reminded of the importance of
reassessment like my non-honors students, which is why offering such extended opportunities of
mastery did not have as large of an impact on them. Since honors students are generally
predispositioned to be “point hounds,” did they see reassessment as a way to improve their grade
instead of as a way to master the material? In other words, is the entire concept of remastery and
reassessment lost on them entirely? I would argue this helps explains why SBG and
differentiated reassessment is more effective on non-honors students than on honors students.
The Curious Case of Factor 5
Of all the survey factors that came back statistically significant, it was Factor 5 (Grade
motivation) that remained the most curious. The 64 non-honors students in my SBG classroom
that completed the SMQII scored significantly higher in grade motivation than the other 54 non-
honors students in the non-SBG classrooms. In dissecting Factor 5, we find that grade motivation
is defined as “important short-term goals that measure [high school] success and are part of the
entry criteria for many careers” (Lin, McKeachie, & Kim, 2003 – as cited by Glynn et al., 2011,

56
p. 1162). The score for this came from Questions 2, 4, 8, 20, and 24 (see Table 12), all of which
successfully loaded when I ran PCA.
Table 12
AHMQ’s Factor 5
While it is fairly common knowledge that honors students are motivated by good grades
– despite efforts by teachers nationwide to stress “learning” over “points” – is it possible that my
SBG classroom turns non-honors students into the very thing we try to change our honors
students out of being? That is, are they missing the point of education by becoming overly
absorbed by points rather than mastery?
However, the feedback component of a classroom that uses SBG is where this system
differs from the traditional “you failed the test” approach (and also why it falls in the category of
Mastery Learning). In a SBG classroom, rubrics often replace the customary letter grade and
provide students with scores on a four-point scale, including: Level 4 (“Mastery Achievement”),
Level 3 (“Proficient Achievement”), Level 2 (“Basic Achievement”), and Level 1 (“Insufficient
Achievement”). Level 3 and Level 4 means the student has demonstrated “mastery” for that
particular standard/strand/theme, whereas Level 2 and Level 1 shows that the student did not. In
Grade motivation
Question 2. I like to do better than other students on history tests.
Question 4. Getting a good history grade is important to me.
Question 8. It is important that I get an “A” in history.
Question 20. I think about the grade I will get in history.
Question 24. Scoring high on history tests matters to me.
Note. As cited in Glynn, Brickman, Armstrong, and Taaoobshirazi (2011, p. 1167).
57
my SBG classes, students are given additional time (generally two weeks) to demonstrate
mastery following an assessment in which they do not earn Level 3 or Level 4 for every unit
standard covered. A student’s reassessment can come in the form of explaining the key points of
the essay in a short-answer response, completing a project, discussing the topic with me in a one-
on-one conference, or by way of any number of approved methods. When students demonstrate
that they have mastered the state standard – even at a later date than their peers – their score is
changed to reflect their new mastery.
These feedback and differentiated reassessment procedures in a SBG classroom offer a
less negative interpretation of SBG non-honors students’ higher grade motivation. I view this
increase in the grade motivation of my non-honors student as happening for one of five reasons,
detailed below.
1. Hope. Perhaps non-honors students have never been faced with such a detailed
breakdown of their performance on a unit test – and in providing them with areas of
weaknesses and strengths, non-honors students see that “all is not lost.” There is hope
that they can still demonstrate to me that they do, indeed, know the material.
2. Ownership. Perhaps non-honors students take ownership of their own grades now that
they have been handed the keys to reassessment. If they want a better grade, they must do
reassessment. By cutting out the ability for them to make excuses as to why they did not
master the material the first time through and showing them how to fix their grade, they
take ownership of their education.
3. Me against the world. Perhaps non-honors students no longer see me, their teacher, as the
“bad guy” who gave them the “bad grade.” By offering multiple opportunities to be

58
reassessed, I show my non-honors students that I truly am interested in seeing them do
well – otherwise I would just give them their “D” and move on. By tearing down the
traditional walls that often separate teachers and students, education can be viewed as a
partnership rather than “me against the world.”
4. I learn better this way. Perhaps non-honors students struggle with traditional standardized
tests. Unfortunately, until such tests disappear, students still need to know how to take
(and be successful on) these tests. However, such practice can be afforded them in my
classroom because poor performance does not necessarily mean they do not know the
material. In writing an essay, opting for verbal reassessment, or completing a piece of
poetry or a song, these students prove they know the material. Their low performance
came not in knowing the material – but in not knowing the test. After being exposed to
the content numerous times following assessment (often in a manner that played into
their specific learning style), something “clicked.” Quite realistically, the mnemonic
devices concocted to rhyme portions of the Bill of Rights or the Gettysburg Address for a
song written as part of reassessment helps “re-teach” that material in a way that this
student can recall when faced with a question on a standardized test about the first 10
Amendments or the significance of President Lincoln’s speech. Students take what they
missed the first time around and repackage it in such a way that now they are their own
teacher. Reassessment effectively gave them a way to learn and retain content
information that can be applied to future material and future assessments.
5. Fear of God. Perhaps knowing that their parents/guardians, administrators, counselors,
and coaches all know that they had two weeks to improve their unit grade… and they
chose not to complete any reassessment… puts the onus square on them.

59
Implications for Practice and Future Research
My SBG classroom that uses differentiated reassessment was found to produce
statistically significant gains on the EOCA for my students, with major gains calculated for non-
honors students. These students were also found to have more grade motivation than their peers
in the non-SBG classes. While reasons for this increase are speculative, statistical analysis did
point to my SBG classroom as potentially promoting this change in motivation among non-
honors students.
Moving forward, I would like to see future research done on whether male and female
students benefited differently (or not at all) by being in my SBG classroom. Data collected from
the NAEP from 2000-2007 found that girls in Grades 4 and 8 outscored boys in reading and
writing, whereas boys outscored girls in math (Louie & Ehrlich, 2009). Tomlinson and McTighe
(2006) interpreted gender gaps as further proof for the necessity of differentiation in every
classroom. Thus, future research into the benefit of standards-based curriculum and
differentiated reassessments would lend itself nicely to the gender gap discussion.
In addition to examining differences between the gender gap, future researchers could
look into the role such a system plays in improving the gap in scores between whites and
minority students. Students who receive free-and-reduced meals, students who come from lower
socioeconomic backgrounds, students on IEPs, and students who are not native English speakers
all provide key demographic test groups that need to be studied in-depth.
Further research should replicate the study with a different subject or with multiple
classrooms. Since not many subject areas have teachers that have adopted a SBG classroom (or
differentiated reassessment), the pool for such research would be limited. However, at the same
school where this study was conducted, the Health and Physical Education Department,
60
American Government, World History, sociology, psychology, and most of the lower-level math
courses have implemented grading policies that offer reassessment.
Is it worth it?
It has been eight years since that fateful conference on grades pointed out my
shortcomings as an assessor of student mastery to an auditorium full of my peers. While the
biting condemnation of my meager answer of “points” grows less and less painful as the years
distance me from such a poorly concocted, “on the spot,” knee-jerk response, there is not a
summer that goes by without asking myself, “Do I continue this next year?” Am I a better
teacher today than I was eight years ago? If I am, is it because of SBG and differentiated
reassessment? Since half of my career was spent not using it – and half has been spent serving as
SBG’s de facto cheerleader – where do I stand right now?
I wish I could return to the conference and pose the presenter with the question that I am
asked at the end of every conversation about adopting Mastery Teaching and Mastery Learning
and overhauling one’s entire approach to teaching and grading – is it worth it?
It depends. Are you in it for the “As” – or the “Ahhhs”?
When teachers take the plunge into the world of Mastery Teaching and Mastery
Learning, they are, in essence, rolling the dice. Such approaches to education always read easier
in books and articles – and come across as “manageable” during after-school in-service
meetings. In actuality, the initial set-up is like programming the clock on a VCR. While it seems
simple – just hold down the red button and press this other one, right? – the fact is, the second
you get it set, the power goes out, and eventually you accept the constant blinking reminder of
your ineptitude. Installing (and maintaining) a SBG classroom requires an amazing amount of
patience and a willingness to frequently explain (and defend) “how it works” to any number of
61
invested parties (like students, parents/guardians, other staff members, and administration).
Providing students with enough (but not too much) post-assessment feedback so they can begin
their differentiated reassessment turns every test into a multi-week undertaking. New classes and
curriculum changes put SBG teachers on edge when they hear murmurings that administration is
going to “shake up” teacher assignments.
And for what? Higher Hake Gains? Grade motivation?
I will admit that I was disappointed when my students did not return higher
metacognitive and motivation scores outside grade motivation for non-honors. It takes a lot of
work to run a SBG classroom – and the only metacognitive/motivational difference is I
successfully transformed my non-honors students into potential grade grubbers? I was
discouraged, that is, until I looked back over my students’ reassessment for my unit on the Great
Depression. As I poured through the poetry, song lyrics, essays, and even a “Hooverville” mini-
board game, I remembered why SBG works: it makes school not feel like school for both the
student and the teacher. I had one student write a short children’s book about the Great
Depression. He patterned it after Dr. Seuss’ Green Eggs and Ham and called his version Green
Eggs and SPAM. Utter brilliance. Another student responded to a blog article about the stock
market on a Wall Street website. Yet another had a rousing 15-minute after-school debate with
me about whether or not FDR’s “New Deal” should be considered a failure by today’s economic
standards. That is correct. A 14-year-old, non-honors student… talking about a topic most adults
do not fully understand… after school… with his teacher… just one week after he missed every
question about economics on the unit test.
Those are the moments that make SBG and differentiated reassessment worth the time
spent after school, late at night, on the weekends, during holiday breaks, and in the summer.

62
I am in it for the “Ahhhs.”
Despite facing a major uphill battle to get students, parents/guardians, colleagues, and
administration to “buy in,” I am happy to see the impact my approach to education has had on
my school. During inquisitive conversations and debates in the staff lounge concerning my new
“take” on grading, I often turn to a quote from The Kite Runner that hangs in my classroom:
“You can be good again.” Hopefully, the findings of this recent study will contribute to more
teachers realizing that every student is capable of mastering their course material, even if that
comes weeks after they have been formally assessed.
Limitations
Having access to the SOCA and EOCA of 327 students had the potential to generate a
massive amount of data. Unfortunately, my LDS prevented the use of individual SOCA and
EOCA scores. While using class averages still generated a significant difference in the Hake
Gains for my students and non-SBG students – especially among the non-honors students – it
produced a very low effect size (Cohen’s d). A larger d would have been preferred.
I was fortunate to have collected 232 of 327 possible survey responses (71% participation
rate). This gave my study a massive sample size, which gave more validity to the results. The
identical breakdown of respondents in my classes and the non-SBG classes (116 in each) also
contributed to my study’s legitimacy. Certainly, having all 327 students cooperate and answer
the two surveys would have been ideal, but when dealing with 14 and 15-year-olds, such an
expectation is highly unrealistic.

63
LIST OF REFERENCES
Ahmed, A., & Pollitt, A. (2010). The support model for interactive assessment. Assessment in
Education: Principles, Policy, & Practice, 17(2), 133-167. doi:
10.1080/09695941003694425
Ainsworth, L. (2003). Unwrapping the standards: A simple process to make standards
manageable. Englewood, CO: Lead + Learn Press.
Anderson, L. W., & Block, J. H. (1977). Mastery learning. In Treffinger, D., David, J., & Ripple,
R. (Eds). Handbook of teaching educational psychology. New York: Academic Press.
Anderson, S. (1994). Synthesis of Research on Mastery Learning. Information Analyses. Retried
from ERIC database. (ED382567)
Angelo, T., & Cross, K. (1993). Classroom assessment techniques: A handbook for college
teachers (2nd ed.). San Francisco, CA: Jossey-Bass.
Armstrong, S. (2008). Teaching smarter with the brain in focus: Practical ways to apply the
latest brain research to deepen comprehension, improve memory, and motivate students
to achieve. New York, NY: Scholastic.
Bandura, A. (1986). Social foundations of thought and action: A social cognitive theory.
Englewood Cliffs, NJ: Prentice Hall.
Bandura, A. (1997). Self-efficacy: The exercise of control. New York, NY: Worth Publishers.
Beck, S. (2009). Individual goals and academic literacy: Integrating authenticity and
explicitness. English Education, 41(3), 259-280.

64
Bjork, R. (1994). Memory and metamemory considerations in the training of human beings. In
Metcalfe, J. and Shimamura, A. (Eds), Metacognition: Knowing about knowing. (pp.185
205). Cambridge, MA: MIT Press.
Black, A., & Deci, E. (2000). The effects of instructors’ autonomy support and students’
autonomous motivation on learning organic chemistry: A self-determination theory
perspective. Science Education, 84, 740-756.
Block, J., & Burns, R. (1976). Mastery learning. Review of Research in Education, 4(1976),
3-49.
Bloom, B. (1968). Learning for mastery, instruction, and curriculum. Center for the Study of
Evaluation of Instructional Programs, 1(2), 2-12.
Bloom, B. (1981). All our children learning – A primer for parents, teachers, and other
educators. New York, NY: McGraw-Hill.
Bransford, J., Brown, A., & Cocking, R. (2000). How people learn: Brain, mind, experience, and
school. Washington, D.C.: National Academy Press.
Brandt, R. (1985). On teaching and supervision: A conversation with Madeline Hunter.
Educational Leadership, 42(5), 61-66.
Brockett, R., & Hiemstra, R. (1991). Self-direction in adult learning: Perspectives on theory,
research, and practice. London, England: Routledge.
Brookhart, S. (2008). Feedback that fits. Education Leadership, 65(4), 54-59.
Brookhart, S., Walsh, J., & Zientarski, W. (2006). The dynamics of motivation and effort for
classroom assessments in middle school science and social studies. Applied Measurement
in Education, 19(2), 151-184. doi: 10.1207/s15324818ame1902_5

65
Brown, C. (2010). Balancing the readiness equation in early childhood education reform.
Journal of Early Childhood Research, 8(2), 133-160. doi:10.1177/1476718X09345504
Budge, K. (2010). Why shouldn’t rural kids have it all? Place-conscious leadership in the era of
extralocal reform policy. Education Policy Analysis Archives, 18(1), 1-26. Retrieved
from ERIC database. (EJ872436)
Case, B., & Zucker, S. (2005). Horizontal and vertical alignment. San Antonio, TX:
Pearson Education.
Chapman, C., & King, R. (2005). Differentiated assessment strategies: One tool doesn’t fit all.
Thousand Oaks, CA: Corwin Press, Inc.
Chick, N., Karris, T., & Kernahan, C. (2009). Learning from their own learning: How
metacognition and meta-affective reflections enhance learning in race-related courses.
International Journal for the Scholarship of Teaching and Learning, 3(1), 1-28.
Cleary, T., & Zimmerman, B. J. (2004). Self-regulation empowerment program: A school-based
program to enhance self-regulated and self-motivated cycles of student learning.
Psychology in the Schools, 41(5), 537-550.
Clifford, M. (1986). Comparative effects of strategy and effort attributions. British Journal of
Educational Psychology, 56(1), 75-83.
Coutinho, S. (2007). The relationship between goals, metacognition, and academic success.
success. Educate, 7(1), 39-47.
Cummins, P., & Davesne, C. (2009). Using electronic portfolios for second language assessment.
Modern Language Journal, 93(1), 848-867. doi: 10.1111/j.1540-4781.2009.00977.x
66
Daniels, L., Stupnisky, R., Pekrun, R., Haynes, T., Perry, R., & Newall, N. (2009). A
longitudinal analysis of achievement goals: From affective antecedents to emotional
effects and achievement outcomes. Journal of Educational Psychology, 101(4), 948-963.
doi:10.1037/a0016096
DeKeyrel, A., Dernovish, J., Epperly, A., & McKay, V. (2000). Using motivational strategies to
improve academic achievement of middle school students. Retrieved from ERIC
database. (ED443550)
Dembo, M., & Eaton, M. (2000). Self-regulation of academic learning in middle level
schools. The Elementary School Journal, 100(5), 473-490.
Dewey, J. (1933). How we think: A restatement of the relation of reflective thinking to the
educative process. Boston, MA: Heath.
DuFour, R., DuFour R., Eaker, R., & Karhanek, G. (2004). Whatever it takes: How professional
learning communities respond when kids don’t learn. Bloomington, Indiana: Solution
Tree.
DuFour, R., DuFour R., Eaker, R., & Karhanek, G. (2009). Raising the bar and closing the gap:
Whatever it takes. Bloomington, Indiana: Solution Tree.
Eccles, J., Simpkins, S., & Davis-Kean, P. (2006). Math and science motivation: A
longitudinal examination of the links between choices and beliefs. Developmental
Psychology, 42, 70-83.
67
Eccles, J., Wigfield, C., Flanagan, C., Miller, C., Reuman, D., & Yee, D. (1989). Self-concepts,
domain values, and self-esteem: Relations and changes at early adolescence. Journal of
Personality, 57(2), 283-310.
Ertmer, P, & Newby, T. (1996). The expert learner: strategic, self-regulated, and reflective.
Instructional Science, 24(1), 1-24.
Farrington, C., & Small, M. (2008). A new model of student assessment for the 21st century.
Washington, D.C.: American Youth Policy Forum.
Feldlaufer, H., Midgley, C., & Eccles, J. (1988). Student, teacher, and observer perceptions of
the classroom environment before and after the transition to junior high school. Journal
of Early Adolescence, 8(2), 133–156.
Fisher, D., & Frey, N. (2007). Checking for understanding: Formative assessment techniques for
your classroom. Alexandria, VA: ASCD.
Gall, M., Gall, J., Jacobsen, D., Bullock, T. (1990). Tools for learning: A guide to teaching study
skills. Alexandria, VA: Association for Supervision and Curriculum Development.
Glynn, S., Brickman, P., Armstrong, N., & Taasoobshirazi, G. (2011). Science motivation
questionnaire II: Validation with science majors and nonscience majors. Journal of
Research in Science Teaching, 48(10), 1159-1176.
Gravetter, F., & Wallnau, L. (2008). Essentials of statistics for the behavioral sciences (6th ed.).
Belmont, CA: Wadsworth Cengage Learning.
Guskey, T. R. (1987). The essential elements of mastery learning. Journal of Classroom
Interaction, 22(2), 19-22.
68
Guskey, T. R. (1988). Bloom’s Mastery Learning and Hunter’s Mastery Teaching: Complement
or Conflict? Paper presented at American Educational Research Association in New
Orleans, LA. Retrieved from ERIC database. (ED292808)
Guskey, T. R., & Gates, S. L. (1986). Synthesis of research on the effects of mastery learning in
elementary and secondary classrooms. Educational Leadership, 43(8), 73-80.
Guskey, T. R. & Pigott, T. (1988). Research on group-based mastery learning programs: A meta-
analysis. Journal of Educational Research, 81(4), 197-216.
Hamilton, L., Stecher, B., & Yuan, K. (2008). Standards-based reform in the United States:
History, research, and future directions. Center on Education Policy. Retrieved from
ERIC database. (ED503897)
Hartnell, B. (2011). Standards-based curriculum, differentiated instruction, and end of course
assessments (Doctoral dissertation). Retried from Dissertations and Theses database.
(UMI No. 2297722471)
Hatano, G., & Inagaki, K. (1968). Two courses of expertise. In Harold, S., Azuma, H., and
Hakuta, K. (Eds). Child development and education in Japan. New York: W.H. Freeman
Herman, J., Aschbacher, P., & Winters, L. (1992). A practical guide to alternative assessment.
Alexandria, VA: Association for Supervision and Curriculum Development.
Humphreys, D., & Davenport, A. (2005). What really matters in college: How students view and
value liberal education. Liberal Education, 91(3), 36-43.
69
Hunter, M. (1982). Mastery Teaching. El Segundo, CA: TIP Publications.
Hunter, M. (1985). What’s wrong with Madeline Hunter? Educational Leadership, 42(5), 57-60.
Jarvela, S., Volet, S., & Jarvenoja, H. (2010). Research on motivation in collaborative
learning: Moving beyond the cognitive-situative divide and combining individual and
social processes. Educational Psychologist, 45(1), 15-27. doi:
10.1080/00461520903433539
Johnson J., Uline, C., & Perez, L. (2014). The quest for mastery. Educational Leadership, 72(2),
48-53.
Kagan, S., Carroll, J., Comer, J., & Scott-Little, C. (2006). Alignment: A missing link in early
childhood transitions? Young Children, 61(5), 26-32.
Kaiser, H. F. (1974). An index of factorial simplicity. Psychometrika, 39, 32-36.
Karpicke, J., Butler, A., & Roediger, H. (2009). Metacognitive strategies in student learning: Do
students practice retrieval when they study on their own? Memory, 17(4), 471-479.
Knoblauch, D. (2015, June 22). Effective Feedback. Lecture presented at Otterbein University,
Westerville, OH.
Koong, C., & Wu, C. (2010). An interactive item sharing website for creating and conducting
on-line testing. Computers & Education, 55(1), 131-144. doi:
10.1016/j.compedu.2009.12.010
Kulik, C., Kulik, J., & Bangert-Drowns, R. (1990). Effectiveness of mastery learning programs:
A meta-analysis. Review of Education Research, 60(2), 265-299.
70
Kulm, G., Dager Wilson, L. & Kitchen, R. (2005). Alignment of content and effectiveness of
mathematics assessment items. Educational Assessment, 10(4), 333-356. doi:
10.1207/s15326977ea1004_2
Lawson, A., Banks, D., & Logvin, M. (2007). Self-efficacy, reasoning ability, and achievement
in college biology. Journal of Research in Science Teaching, 44, 706-724.
Lin, Y., McKeachie, W., & Kim, Y. (2003). College student intrinsic and/or extrinsic
motivation and learning. Learning and Individual Differences, 13, 251-258.
Linn, R., Baker, E., & Dunbar, S. (1991). Complex, performance-based assessment:
Expectations and validation criteria. Educational Researcher, 20(8), 15-21.
Louie, J., & Ehrlich, S. (2008). Gender gaps in assessment outcomes in Vermont and the United
States. Retrieved from ERIC database. (ED502616)
Lovelace, M., & Brickman, P. (2013). Best practices for measuring students’ attitudes toward
learning science. Life Sciences Education, 12, 606-617.
Lund, A., & Lund, M. (2016). Laerd Statistics [Computer software]. The University of Bath,
United Kingdom: Lund Research Ltd.
O’Connor, K. (2002). How to grade for learning: Linking grades to standards (2nd ed.).
Thousand Oaks, CA: Corwin Press, Inc.
O’Connor, K. (2007). A repair kit for grading. Portland, OR: Education Testing Service.
Ohio Department of Education. (2008). Academic content standards source book: K-12 social
studies. Columbus, Ohio: Center for Curriculum and Assessment Publishers.
71
Osterman, K. F. (2000). Students’ need for belonging in the school community. Review of
Educational Research, 70(3), 323-367
Martineau, J., Paek, P., Keene, J., & Hirsch, T. (2007). Integrated, comprehensive alignment as a
foundation for measuring student progress. Educational Measurement: Issues and
Practice, 26(1), 28-35. doi: 10.1111/j.1745 3992.2007.00086.x
Pajares, F. (1996). Self-efficacy beliefs in academic settings. Review of Educational Research,
66(4), 543-578.
Paris, S., & Winograd, P. (1990). How metacognition can promote academic learning and
instruction. In Jones, B. & Idol, L. (Ed.), Dimensions of Thinking and Cognitive
Instruction (pp. 15-45). Florence, KY: Routledge Publishing.
Pintrich, P. (2002). The role of metacognitive knowledge in learning, teaching, and assessing.
Theory into Practice, 41(4), 219-225.
Pintrich, P., & Schunk, D. (2002). Motivation in education: Theory, research, and applications
(2nd ed.). Upper Saddle River, NJ: Prentice Hall.
Posner, G., Strike, K., Hewson, P., & Gertzog, W. (1982). Accommodation of a scientific
conception: towards a theory of conceptual change. Science Education, 66(2), 211-227.
Rabb, T. (2007). Assessments and standards: The case of history. Education Week, 36-37.
Reeve, J., Deci, E., & Ryan, R. (2004). Self-determination theory: A dialectical framework for
understanding sociocultural influences on student motivation. In D. M. Mclnerney & S.
Van Etten (Eds.), Big theories revisited (pp. 31-60). Greenwich, CT: Information Age.

72
Roach, A., & Elliott, S. (2009). Consultation to support inclusive accountability and standards
based reform: Facilitating access, equity, and empowerment. Journal of Educational &
Psychological Consultation, 19(1), 61-81. doi:10.1080/10474410802463320
Roediger, H., & Karpicke, J. (2006). Test-enhanced learning: Taking memory tests improves
long-term retention. Psychological Science, 17(3), 249-255.
Rosales, R. (2013). The Effects of Standards-Based Grading on Student Performance in Algebra
2 (Doctoral dissertation). Retried from Digital Commons of Western Kentucky
University.
Schraw, G. (1998). Promoting general metacognition awareness. Instructional Science, 26, 113
125.
Schunk, D. (1996). Goal and self-evaluative influences during children’s cognitive skill
learning. American Educational Research Journal, 33(2), 359-382.
Scriffiny, P. (2008). Seven reasons for standards-based grading. Educational Leadership, 66(2),
70-74.
Slavin, R. (1989). On mastery learning and mastery teaching. Educational Leadership, 46(7), 77-
79.
Slavin, R., & Karweit, N. (1984). Mastery learning and student teams: A factorial experiment in
urban general mathematics classes. American Educational Research Journal, 21(4), 725-
736. doi:10.3102/00028312021004725
SPSS. (2016). Statistical Package for the Social Sciences Career Starter Program (Version 23.0)
[Computer software]. Chicago, IL: SPSS Inc.
73
Stallings, J., & Krasavage, E. M. (1986). Program implementation and student achievement in a
four-year Madeline Hunter follow through. Elementary School Journal, 87, 117-138.
Statistics Solutions. (2016). Intellectus Statistics [Computer software]. California: California
State University.
Stockdale, S., & Brockett, R. (2011). Development of the PRO-SDLS: A measure of self-
direction in learning based on the personal responsibility orientation model. Adult
Education Quarterly, 61(2), 161-180.
Tanner, K. (2012). Promoting student metacognition. CBE – Life Sciences Education, 11, 113-
120.
Tomlinson, C. (1999). The differentiated classroom: Responding to the needs of all learners.
Alexandria, VA: Association for Supervision and Curriculum Development.
Tomlinson, C. (2000a). Reconcilable differences? Standards-based teaching and differentiation.
Educational Leadership, 58(1), 6-11.
Tomlinson, C. (2000b). How to differentiate instruction in mixed-ability classrooms (2nd ed.).
Alexandria, VA: Association for Supervision and Curriculum Development.
Tomlinson, C. (2003). Fulfilling the promise of the differentiated classroom: Strategies and tools
for responsive teaching. Alexandria, VA: Association for Supervision and Curriculum
Development.
Tomlinson, C. (2008). The differentiated school: Making revolutionary changes in teaching and
learning. Alexandria, VA: Association for Supervision and Curriculum Development.

74
Tomlinson, C., & McTighe, J. (2006). Integrating differentiated instruction and understanding
by design. Alexandria, VA: Association for Supervision and Curriculum Development.
Tung, R. (2010). Including performance assessments in accountability systems: A review of
scale-up efforts. Boston, MA: Center for Collaborative Education. Retrieved from ERIC
database. (ED509787)
Van der Stel, M., & Veenman, M. (2010). Development of metacognitive skillfulness: A
longitudinal study. Learning and Individual Differences, 20(3), 220-224.
doi:10.1016/j.lindif.2009.11.005
Vansteenkiste, M., Sierens, E., Soenens, B., Luyckx, K., & Lens, W. (2009). Motivational
profiles from a self-determination perspective: The quality of motivation matters. Journal
of Educational Psychology, 101(3), 671-688. doi:10.1037/a0015083
Walberg, H. (1990). Productive teaching and instruction: Assessing the knowledge base. The Phi
Delta Kappan, 71(6), 470-478.
Walker, C., & Greene, B. (2009). The relations between student motivational beliefs and
cognitive engagement in high school. Journal of Educational Research, 102(6), 463-472.
Weimer, M. (2013). Three ways to help students become more metacognitively aware. The
Teaching Professor, 26(9), 2.
Weinstein, C. , Husman, J., & Dierking, D. (2000). Self-regulation interventions with a focus on
learning strategies. In Boekaerts, M., Pintrich, P., & Seidner, M. (Eds), Self-regulation:
Theory, research, and applications (pp. 727–747). Orlando, FL: Academic Press.
75
Wiggins, G. (1993). Assessment: Authenticity, context, and validity. The Phi Delta Kappan,
8(75), 200-208.
Wiggins, G. (2012). 7 Keys to Teaching Content Outrageously. Educational Leadership, n.a.,
11-16.
Wiggins, G., & McTighe, J. (2005). Understanding by design (2nd ed.). Upper Saddle River,
NJ: Pearson Education.
Willent, J., Yamashita, J. & Anderson, R. (1983). A meta-analysis of instructional systems
applied in science teaching. Journal of Research in Science Teaching, 20(5), 405-417.
Willingham, D. (2009). Why don’t students like school? A cognitive scientist answers questions
about how the mind works and what it means for the classroom. San Francisco, CA: John
Wiley & Sons, Inc.
Wood, R., Bandura, A., & Bailey, T. (1990). Mechanisms governing organizational performance
in complex decision making environments. Organizational Behavior and Human
Decision Processes, 46(1), 181-201.
Wormeli, R. (2006). Fair isn’t always equal: Assessing and grading in the differentiated
classroom. Portland, ME: Stenhouse Publishers.
Zimmerman, B. J. (2002). Achieving self-regulation: The trial and triumph of adolescence. In F.
Pajares, F., & Urdan, T. (Eds), Academic motivation of adolescents (Vol. 2, pp. 1–27).
Greenwich, CT: Information Age.
Zohar, A., & David, A. (2009). Paving a clear path in a thick forest: A conceptual analysis of a
metacognitive component. Metacognition Learning, 4, 177-195.
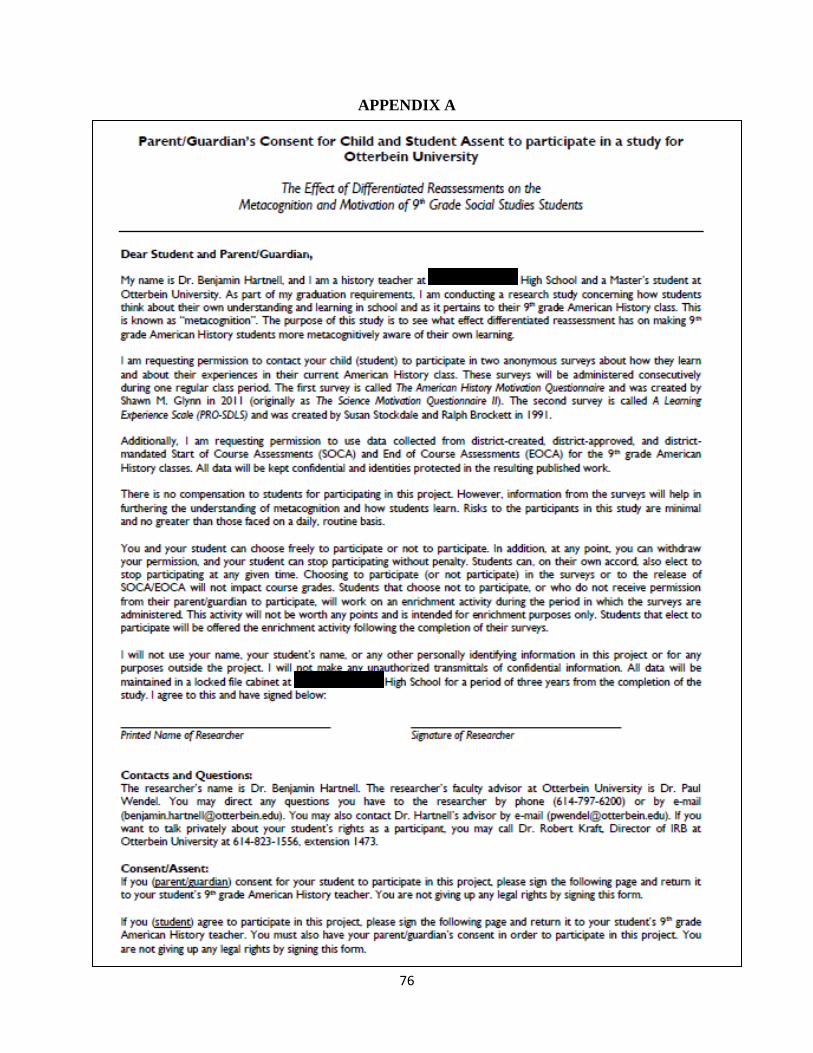
76
APPENDIX A

77

78
APPENDIX B

79
APPENDIX C

80
81
APPENDIX D
NOTE: As this is a SOCA that is still in use, only the cover, instructions, and first examination page have been provided.
82

83
84
APPENDIX E

85
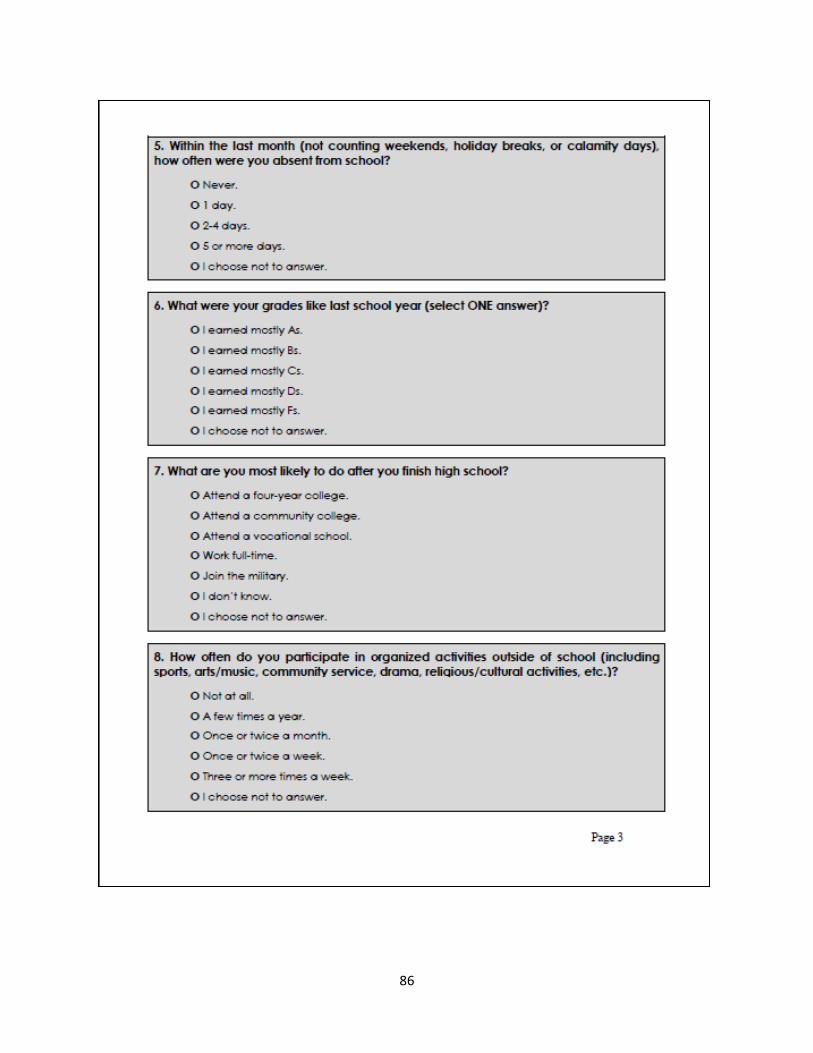
86
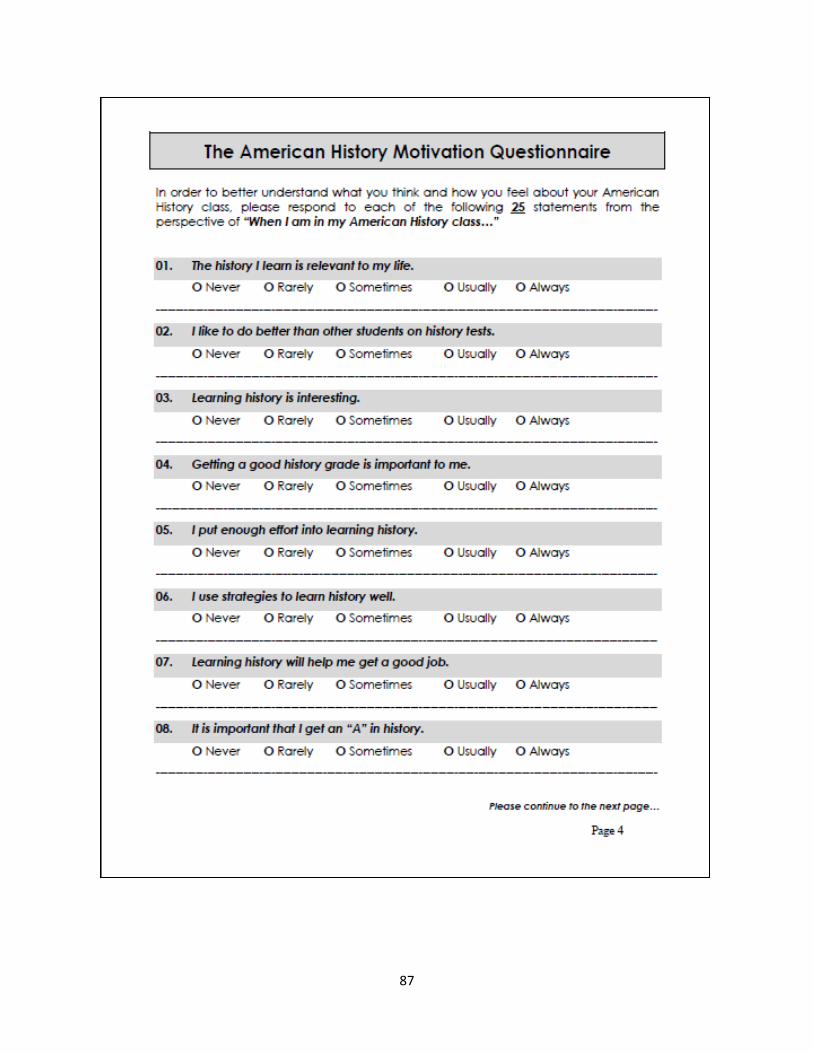
87

88
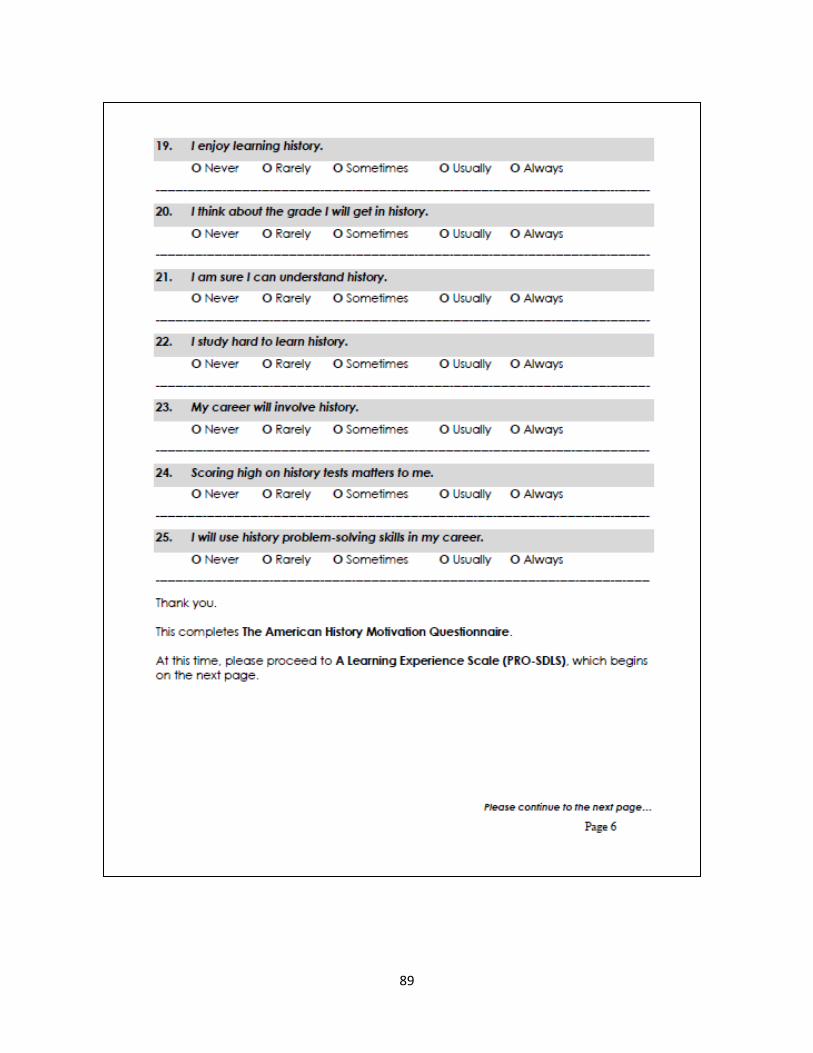
89

90

91

92