the effects of package downsizing on food...
TRANSCRIPT

The Effects of Package Downsizing on Food Consumption
Draft: Not for citation
Metin Cakir*
Department of Bioresource Policy Business and Economics University of Saskatchewan
Joseph V. Balagtas† Department of Agricultural Economics
Purdue University
Abigail M. Okrent‡ USDA,Economic Research Service
Food Economics Division, Food Markets Branch
Selected Paper prepared for presentation at the Agricultural & Applied Economics Association’s 2013 AAEA & CAES Joint Annual Meeting, Washington, DC, August 4-6, 2013.
Abstract
Package downsizing is common among the leading producers of packaged food products in the United States. In this study, we examine the effects of package downsizing on household food-at-home consumption and expenditure. We perform an exploratory data analysis of shelf stable tuna and peanut butter markets using Nielsen homescan data. The data comprise grocery store transactions made by a large panel of households over a period of 7 years, 2004-2010. We find that manufacturers use downsizing to implicitly increase prices. Consequently, the average annual household expenditures of both products are considerably higher than their levels before downsizing. The annual average volume consumption of peanut butter remains stable, whereas the volume consumption of shelf stable tuna is approximately 10 percent below its level before downsizing, in spite of an approximately 5 percent increase in the annual package consumption.
Copyright 2013 by Metin Cakir, Joseph V. Balagtas, and Abigail M. Okrent. All rights reserved. Readers may make verbatim copies of this document for non-commercial purposes by any means, provided that this copyright notice appears on all such copies. The findings and conclusions reported in this paper do not necessarily represent the views of the U.S. Department of Agriculture Economic Research Service.
* Contact: [email protected] † Contact: [email protected] ‡ Contact: [email protected]

Introduction
Package downsizing is the marketing practice of reducing the volume of product per
package in a way that the new size replaces the old one. In recent years, a large number
of leading producers in the U.S. packaged food market downsized their products. For
example, in 2007 General Mills downsized its Cheerios boxes from 10 oz., 15 oz., and 20
oz. to 8.9 oz., 14 oz., and 18 oz., respectively. Similarly, in 2008 leading ice cream
brands Breyers and Edy’s downsized their products from 16 oz. to 14 oz. and from 56 oz.
to 48 oz. However, we do not know how consumers respond to this common marketing
practice. In this study, we advance the literature by analyzing the effects of package
downsizing on household food-at-home consumption and expenditure.
There is a growing body of literature on the effects of food marketing on consumer food
consumption and diet. Researchers are increasingly interested in investigating the extent
to which food marketing contributes to the heightened prevalence of obesity in the United
States (see Chandon and Wansink, 2012; Glanz, Bader, and Iyer, 2012 for reviews).
Specifically, this literature focuses on how marketers’ pricing and promotion strategies or
choice of product design affect consumer food-purchasing behavior and consumption.
For example, Chan, Narasimhan, and Zhang (2008) and Wansink (1996) find that food
price reductions and quantity discounts can accelerate consumption and increase energy
intake. Goldberg (1990) and Dhar and Baylis (2011) emphasize the role of TV
advertising on children’s consumption of unhealthy food.
Our study contributes to research on the effects of packaging on consumer food-purchase
and consumption behavior (see Chandon, 2012 for a review). Rolls (2003) and Young
and Nestle (2002) document that food package and portion sizes in the United States have
increased, and posit that this trend has contributed to increased prevalence of obesity.
Also, experimental research tends to support the hypothesis that larger packages and
portions lead to increased consumption. For example, in an experimental study Rolls et
al. (2004) served potato chips to the participants in five different packages on five
separate days. They show that subjects consumed significantly more potato chips as the
package size increased. In another study Wansink (1996) provides participants with
spaghetti or oil and asks how much of the product they would use if they were to cook for
two adults. Participants were given the same amount of spaghetti or oil but in a small or
large package size. The study finds that participants use more spaghetti and oil when
products were in larger package sizes. In a recent study, Zlatevska, Dubelaar, and Holden
(2012) perform a meta-analysis of 67 studies to quantify the influence of unit size on
consumption and find that consumption increases by about 22% when serving size
doubles.
Our study differs from previous studies on the effects of package size in two aspects.
First, the extant literature on the effects of package size on consumption primarily uses
experimental methods, and is limited in several important ways. For example,
experiments are typically designed to measure consumption for a package or portion size
in a single, given meal, and thus ignore the effects on food consumption over time.
Another limitation is that the experiments ignore food purchase behavior, which precedes

consumption; thus, these experiments ignore the role of product price, price and attributes
of competing products, or other factors, such as promotion, that influence purchase
behavior. In this study, we overcome these limitations by using market data provided by
Nielsen Homescan.
Second, this study is among the first to focus on consumption response to package
downsizing of food products. Specifically, we advance the literature by asking the
following question: how does package size affect consumer food-at-home consumption
and expenditure? To answer this question, we analyze consumer response to downsizing
of several products to identify whether consumers decrease their consumption of a
product, or maintain or increase their consumption levels by increasing their purchase
frequency of a product, or display differential response to downsizing of different types
of products.
To achieve the objective we perform two complementary analyses. First, we perform an
exploratory analysis of consumption rates of shelf stable tuna and peanut butter before
and after package downsizing events. This analysis documents consumption and
expenditure trends and shows the extent to which the category volume consumption has
changed relative to its unit (i.e., package) consumption. In the subsequent analysis, we
will perform econometric investigations for both product categories to identify the effects
of downsizing on consumption.

2. Data
We employ a rich set of household scanner data from Nielsen Homescan. The data set
comprises information on price and quantity of products, product characteristics, and
timing of purchase for each grocery store transaction made by a large panel of U.S.
households over a period of 7 years, 2004–2010. Nielsen selects participating households
based on their demographic information to construct a nationally representative sample.
Each participating household is provided with a scanner to record their purchases. Our
sample includes households who record a purchase of any product in at least 10 out of 12
months of the year. We use the data on shelf stable tuna and peanut butter purchases for
the analysis.
3. Exploratory Data Analysis
In the following we provide an exploratory analysis of shelf stable tuna and peanut butter
markets. The analysis provides brief information on market structure, identifies package
downsizing events, and examines per household consumption and expenditure trends in
each market.
3.1 The Shelf Stable Tuna Market
The shelf stable tuna market in the United States is characterized by high concentration
and branding. Figure 3.1 presents the volume share of major manufacturers in the market.
The top three nationally branded shelf stable tuna manufacturers hold approximately 75
percent of the total volume of market. The total volume share of the top three store
brands have increased from 7.5 percent in 2004 to approximately 13 percent in 2010.
Each of the major manufacturers has a single leading brand such that the brand shares in
this market are approximately the same as the manufacturer shares. Each of the leading
brands offers its product in variety of forms (e.g., chunk or solid), styles (e.g., in water or
oil), multi packages, and package sizes.
Insert Figure 3.1 Here
3.1.1 Identifying Downsizing
In figure 3.2 we present the volume consumption of shelf stable tuna by its package size.
We observe that package downsizing of 6 oz. tuna is common. At the beginning of the
study period the total volume sales of 6 oz. tuna was approximately 80 percent of the
market. Starting from 2007 manufacturers downsized their tuna products from 6 ounces
to 5 ounces. By 2010, 5 oz. tuna products became the norm size, having approximately
75 percent of the market. We observe increasing volume shares of 4.5 oz. and 7 oz. tuna
products starting from 2008. The increase in volume share of 4.5 oz. tuna is mainly due
to introduction of a new group of products by a major brand. On the other hand, the
increase in the share of 7 oz. tuna is due to a brand introducing a new size to its product
line, along with its 5 oz. products.
Insert Figure 3.2 Here
In table 3.1 we compare average price per ounce and price per package of 6 oz. tuna
before and after the downsizing. The top three national brands downsized their products
in 2007, whereas the top two store brands downsized in 2008. There is strong evidence
that manufacturers used downsizing to effectively increase prices. For all brands the
percentage change in price per ounce of tuna is considerable higher than the percentage
change in price per package. For example, national brand 1’s average price per package
of 6 oz. tuna has increased by 8.6 percent during the period after downsizing. However,
its average price per ounce has increased by 17.5 percent.
Insert Table 3.1 Here
3.1.2 Consumption and Expenditure Trends
In table 3.2 we report annual average per-household tuna consumption in terms of
volume and number of packages, as well as expenditure for all sizes. The trends show
that household volume consumption of tuna has decreased considerably after downsizing
events, meanwhile household expenditure increased. At the beginning of the study period
the average household consumption was 82 oz., or approximately 13 packages. From
2004 to 2006 average household consumption fell by one package corresponding an
approximately 6-ounce decrease in volume consumption. Starting from 2007, which is
the period after downsizing, we observe a sharp decrease in the volume consumption. For
example, the volume consumption in 2010 is approximately 11 percent lower than its
level in 2007. On the other hand, package consumption and expenditure during the same
period have increased by 5.6 percent and 14 percent, respectively.
Households can switch to buy different size products due to downsizing. For example, 5-
ounce tuna might have become more preferable for the consumers of 3-ounce tuna.
Similarly, after downsizing some consumers might have preferred to switch to the larger
sizes instead of purchasing 5-ounce tuna. To examine whether consumers switch away
from the downsized products we report the consumption and expenditure trends for only
downsized products in table 3.3. We observe that consumption per package and
expenditure has increased in 2009 and 2010 in comparison to their levels when
downsizing events were underway in 2007 and 2008. The consumption and expenditure
trends of downsized products display almost the same pattern as the trends for the
category consumption. Thus, at this level of aggregation we do not observe a strong
evidence of household switching behavior.
Insert Table 3.2 Here
Insert Table 3.3. Here
3.2 The Peanut Butter Market In this section we repeat the exploratory data analysis for the peanut butter market in the
United States. Similar to the shelf stable tuna market, the peanut butter market is an
oligopolistic market with high concentration of few firms. In figure 3.3 we present the
volume share of major peanut butter manufacturers. The top three nationally branded
peanut butter manufacturers hold approximately 70 percent of the total volume. Store
brands have significant shares. In 2010 total market share of the top three store brands
was about 13 percent. There is some degree of brand proliferation in the market as
manufacturer 1 owns 5 brands of peanut butter. Each of the other manufacturers own
only one brand. Manufacturer 1’s leading brand has the highest brand share in the market,
followed by the brands of manufacturers 2 and 3.
Insert Figure 3.3 Here
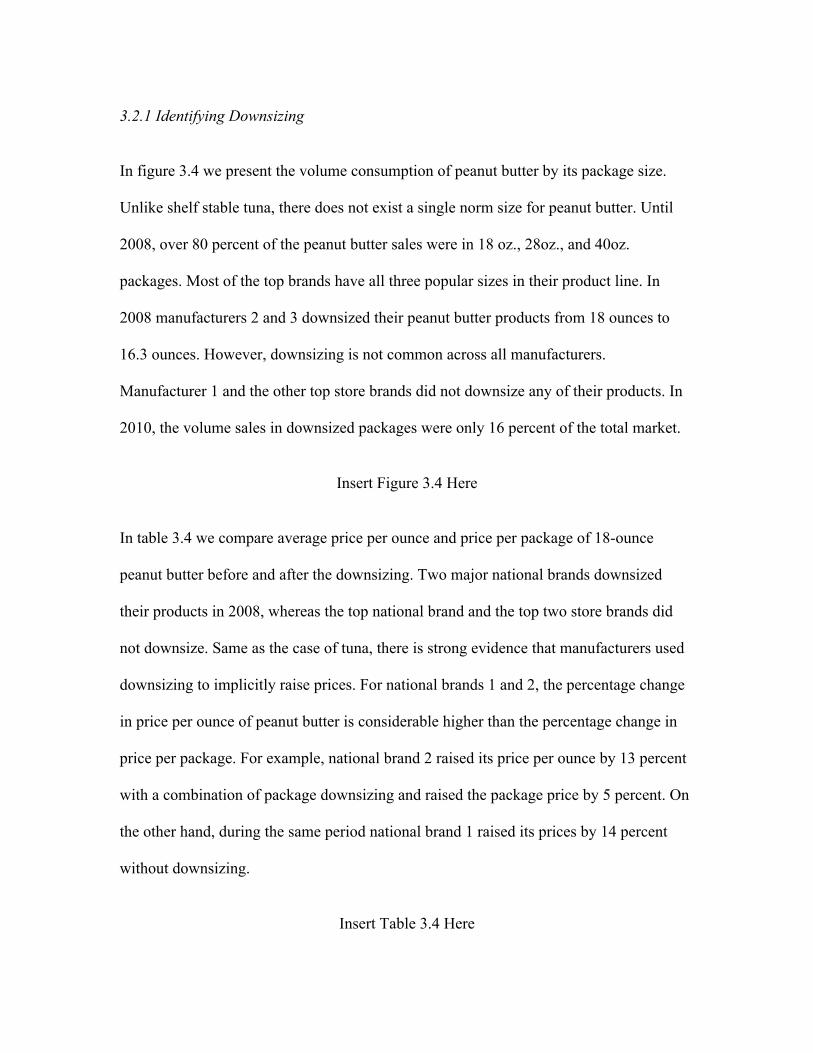
3.2.1 Identifying Downsizing In figure 3.4 we present the volume consumption of peanut butter by its package size.
Unlike shelf stable tuna, there does not exist a single norm size for peanut butter. Until
2008, over 80 percent of the peanut butter sales were in 18 oz., 28oz., and 40oz.
packages. Most of the top brands have all three popular sizes in their product line. In
2008 manufacturers 2 and 3 downsized their peanut butter products from 18 ounces to
16.3 ounces. However, downsizing is not common across all manufacturers.
Manufacturer 1 and the other top store brands did not downsize any of their products. In
2010, the volume sales in downsized packages were only 16 percent of the total market.
Insert Figure 3.4 Here
In table 3.4 we compare average price per ounce and price per package of 18-ounce
peanut butter before and after the downsizing. Two major national brands downsized
their products in 2008, whereas the top national brand and the top two store brands did
not downsize. Same as the case of tuna, there is strong evidence that manufacturers used
downsizing to implicitly raise prices. For national brands 1 and 2, the percentage change
in price per ounce of peanut butter is considerable higher than the percentage change in
price per package. For example, national brand 2 raised its price per ounce by 13 percent
with a combination of package downsizing and raised the package price by 5 percent. On
the other hand, during the same period national brand 1 raised its prices by 14 percent
without downsizing.
Insert Table 3.4 Here

3.2.2 Consumption and Expenditure Trends
In table 3.5 we report annual average per-household peanut butter consumption in terms
of volume and number of packages, and expenditure for all sizes. The trends show that
household volume consumption of peanut butter remained relatively stable throughout
the study period, meanwhile household expenditure increased due to increased prices.
However, there is a slight difference in consumption between the periods before and after
downsizing events. The average volume and package consumption are higher for the
period between 2008 and 2010, when downsized products were taking place in the
market. In other words, contrary to the response to downsizing of shelf stable tuna,
households might have increased their purchase frequency of peanut butter to maintain or
increase consumption. For a further examination, in table 3.6 we report consumption and
expenditure trends of the reduced size category only, i.e., including only 18 oz. and 16.3
oz. packages. The trends of reduced size category display a different pattern than the
trends of average consumption of all sizes. In the former case, the average volume
consumption is slightly lower for the period between 2008 and 2010, whereas the
package consumption remains relatively stable.
Insert Table 3.5 Here
Insert Table 3.6 Here

3.3 Summary
Package downsizing is common in the shelf stable tuna market. All the top manufacturers
downsized their tuna products from 6 ounces to 5 ounces during the period 2007-2008. In
2010, 5 oz. tuna sales comprised 75 percent of the market volume. After downsizing the
increase in price per ounce of all brands was proportionately higher than the increase in
price per package, that is manufacturers used downsizing as a hidden price increase. The
household volume consumption of shelf stable tuna decreased due to downsizing. The
average annual volume consumption is approximately 10 percent below its level before
downsizing, in spite of an approximately 5 percent increase in the annual package
consumption.
Package downsizing is less common in the peanut butter market. Only two of the top 5
manufacturers downsized their 18-ounce peanut butter products to 16.3 ounces in 2008.
In 2010, 16.3 oz. peanut butter sales comprised about 16 percent of the market volume.
As in the case of tuna there is evidence that manufacturers used downsizing as a hidden
price increase. However, there is no clear evidence that downsizing affected household
peanut butter consumption in a systematic way.

References Chan T., C. Narasimhan and Q. Zhang. 2008. “Decomposing Promotional Effects with a Dynamic Structural Model of Flexible Consumption.” J. Marketing Res. 45(4):487-498. Chandon P. 2012. “How Package Design and Packaged-based Marketing Claims Lead to Overeating.” Applied Economic Perspectives and Policy. Published online July 10, 2012 doi:10.1093/aepp/pps028. Chandon, P. and B. Wansink 2012. Does food marketing need to make us fat? A review and solutions. Nutrition reviews, 70(10), 571-593. Dhar T. and K. Baylis. 2011. “Fast-Food Consumption and the Ban on advertising Targeting Children: The Quebec Experience.” J. Marketing Res. 48(5):799-813. Glanz, K., M.D., Bader, M and S. Iyer. 2012. “Retail grocery store marketing strategies and obesity: an integrative review.” American Journal of Preventive Medicine, 42(5), 503-512. Goldberg M.E. 1990. “A Quasi-Experiment Assessing the Effectiveness of TV Advertising Directed to Children.” J. Marketing Res. 27(4):445-454. Rolls, B.J. 2003. “The supersizing of America: portion size and the obesity epidemic.” Nutrition Today 38:645-49 Rolls, B. J., L.S. Roe, T.V. Kral, J.S. Meengs and D.E. Wall. 2004. "Increasing the portion size of a packaged snack increases energy intake in men and women." Appetite 42.1: 63-69. Young, L. R. and M. Nestle, 2002. “The Contribution of Expanding Portion Sizes to the US Obesity Epidemic.” American Journal of Public Health 92, 246-249. Wansink, B. 1996. “Can package size accelerate usage volume?” Journal of Marketing 60, 1- 14. Zlatevska, N., C. Dubelaar and S. S. Holden. 2012. “How Much Serving Size Affects Consumption.” Catch-22. Personal Researcher Page of Stephen Holden. Available at: http://works.bepress.com/stephen_holden/15

Tables and Figures Table 3.1: Per Unit and Per Package Prices of the Norm Size (6 oz.) Before and After Downsizing
Average Price Per Ounce Average Price Per Package
Brand Year Before ($)
After ($)
Percent Change
Before ($)
After ($)
Percent Change
N. Brand 1 2007 0.154 0.181 17.5 0.888 0.964 8.60 N. Brand 2 2007 0.161 0.202 25.5 0.958 1.088 13.6 N. Brand 3 2007 0.125 0.165 32.0 0.750 0.896 19.5 S. Brand 1 2008 0.103 0.139 35.0 0.601 0.720 19.8 S. Brand 2 2008 0.107 0.135 26.2 0.643 0.724 12.6
Notes: 1: “Year” denotes the year when the package downsizing occurred, 2. Only single package sales are used to calculate the average prices, 3. “Before” includes the observations starting between 2004 and the year of the downsizing event, “After” includes the observations between the year of the downsizing event and 2010. Table 3.2: Annual Household Consumption and Expenditure of Shelf Stable Tuna
Year Number of Households
Consumption Expenditure (dollars) (Ounces) (Packages)
2004 26728 82.00 13.30 10.78 2005 25505 79.45 12.91 11.16 2006 24363 75.93 12.38 11.09 2007 40317 76.07 12.46 11.20 2008 37539 71.25 11.88 11.93 2009 37530 66.44 12.60 13.43 2010 37407 67.99 13.16 12.79
Notes: 1. Only single package purchases are used in calculations. Table 3.3: Annual Household Consumption and Expenditure of 6 oz. (5 oz.) Shelf Stable Tuna
Year Number of Households
Consumption Expenditure (dollars) (Ounces) (Packages)
2004 23592 72.76 12.15 8.86 2005 22769 72.69 12.15 9.27 2006 21601 69.76 11.68 9.26 2007 34896 69.56 11.65 9.26 2008 32040 63.88 10.97 9.80 2009 32648 61.34 12.10 11.31 2010 32629 63.81 12.71 10.85

Table 3.4: Per Unit and Per Package Prices of the 18 oz. Peanut Butter Before and After Downsizing
Average Price Per Ounce Average Price Per Package
Brand Year Before ($)
After ($)
Percent Change
Before ($)
After ($)
Percent Change
N. Brand 1 None 0.109 0.125 14.1 1.970 2.246 14.1 N. Brand 2 2008 0.105 0.118 13.0 1.847 1.939 5.0 N. Brand 3 2008 0.097 0.117 21.3 1.724 1.909 10.1 S. Brand 1 None 0.082 0.094 14.9 1.476 1.695 14.9 S. Brand 2 None 0.073 0.080 10.5 1.305 1.442 10.5
Notes: 1: “Year” denotes the year when the package downsizing occurred, 2. Only single package sales are used to calculate the average prices, 3. “Before” includes the observations starting between 2004 and the year of the downsizing event, “After” includes the observations between the year of the downsizing event and 2010. If a downsizing event has not occurred 2008 is used as the cutting point. Table 3.5: Annual Household Consumption and Expenditure of Peanut Butter
Year Number of Households
Consumption Expenditure (dollars) (Ounces) (Packages)
2004 28874 113.66 5.13 11.19 2005 28180 114.31 5.18 10.89 2006 27215 113.89 5.18 11.07 2007 45386 114.33 5.10 11.50 2008 43879 115.48 5.20 12.70 2009 43157 116.72 5.31 13.40 2010 42516 115.04 5.33 12.82
Table 3.6: Annual Household Consumption and Expenditure of 18 oz. (16.3 oz.) Peanut Butter
Year Number of Households
Consumption Expenditure (dollars) (Ounces) (Packages)
2004 21816 77.24 4.29 7.15 2005 21578 78.51 4.37 6.94 2006 20381 79.37 4.42 7.20 2007 33761 75.09 4.19 7.06 2008 31790 75.46 4.26 7.65 2009 31060 75.93 4.34 8.17 2010 30547 76.40 4.42 7.92

Figure 3.1: Manufacturer Shares of Shelf Stable Tuna Market
Figure 3.2: Annual Volume Consumption of Shelf Stable Tuna by Package Size
Manufacturer 1
Manufacturer 2
Manufacturer 3
Store Brand 1 Store Brand 2 Store Brand 3 All other SB All other NB
0%
10%
20%
30%
40%
50%
60%
70%
80%
90%
100%
2004 2005 2006 2007 2008 2009 2010
3 oz. 4.5 oz.
5 oz.
6 oz.
6.5 oz. 7 oz. 12 oz. All other
0% 10% 20% 30% 40% 50% 60% 70% 80% 90% 100%
2004 2005 2006 2007 2008 2009 2010

Figure 3.3: Manufacturer Shares of Peanut Butter Market
Figure 3.4: Annual Volume Consumption of Peanut Butter by Package Size
Manufacturer 1
Manufacturer 2
Manufacturer 3 Store Brand 1 Store Brand 2 Store Brand 3 All other SB All other NB
0%
10%
20%
30%
40%
50%
60%
70%
80%
90%
100%
2004 2005 2006 2007 2008 2009 2010
16 0z. 16.3 oz.
18 oz.
28 oz.
40 oz.
48 oz. 64 oz. All Other
0% 10% 20% 30% 40% 50% 60% 70% 80% 90% 100%
2004 2005 2006 2007 2008 2009 2010