the effects of overfeeding on body composition: the role
TRANSCRIPT
Review Article The Effects of Overfeeding on Body Composition: The Role of Macronutrient Composition – A Narrative Review
ALEX LEAF†1, and JOSE ANTONIO‡2 1Human Nutrition and Functional Medicine, University of Western States, Portland, OR, USA; 2Department of Health and Human Performance, Nova Southeastern University, Davie, FL, USA †Denotes graduate student author, ‡Denotes professional author
ABSTRACT International Journal of Exercise Science 10(8): 1275-1296, 2017. Compared to investigations on hypocaloric diets, the effects of chronic overfeeding have been less studied. It has been posited that consuming calories in excess of daily caloric requirements will result in a gain in body weight and in particular fat mass regardless of which macronutrient(s) are consumed. However, recent evidence suggests that there is a quantitative difference in protein versus carbohydrate and/or fat overfeeding as it relates to body composition. Protein overfeeding or the consumption of a high protein diet may not result in a gain in body weight or fat mass despite consuming calories that exceed one’s normal or habitual intake. Therefore, this review will provide an up-to-date narrative on the current scientific literature on various combinations of macronutrient overfeeding and its effects on body composition. KEY WORDS: Diet, protein, body composition, energy surplus, bulking, fat gain INTRODUCTION Intentional overfeeding or eating more calories than required to maintain bodyweight is a common practice among athletes, especially bodybuilders, looking to increase their skeletal muscle mass. When combined with resistance training aimed at promoting skeletal muscle hypertrophy, a controlled phase of overfeeding is often referred to as “bulking.” Usually, the goal of bulking is to maximize gains in skeletal muscle mass while minimizing gains in fat mass. Although it is well established that overfeeding causes weight gain, comparatively little research has been conducted that evaluates changes in body composition. To date, only 25 overfeeding studies have reported changes in fat mass (FM) and fat-free mass (FFM) separate from changes in body weight (table 1).

Int J Exerc Sci 10(8): 1275-1296, 2017
International Journal of Exercise Science http://www.intjexersci.com 1276
Table 1. Summary of overfeeding studies.
Author n - Men / Women Age
Body Fat %
Physical Activity
Dur-ation
Kcal Sur-plus
Protein (g/kg)
BW (kg)
FM (kg)
FFM (kg)
Fat gain (% wt gain)
Salans et al. 1971
5 / 0 26 19% "Reduced" 3 months + 16.2 + 10.4 + 5.8 64%
Norgan & Durnin 1980
6 / 0 22 15% Sedentary 9 weeks + 50% 2.2 + 6.0 + 3.7 + 2.3 62%
Webb & Annis 1983
4 / 5 46
15% (M) / 37% (W)
Sedentary 30 days + 1000 kcal
2.4 + 1.8 a + 1.1 a + 0.7 61% 1.7 + 2.7 b + 2.0 b + 0.7 74%
1.2 + 2.7 b + 2.1 b + 0.6 78%
Ravussin et al. 1985
5 / 0 24 15% 6000-7000
steps/d 9 days + 60% 2.1 + 3.2 + 1.8 + 1.4 56%
Poehlman et al. 1986
12 / 0 19 12% Sedentary 22 days + 1000
kcal 2.4 + 2.2 + 1.1 +1.1 50%
Bouchard et al.1990
24 / 0 21
11% < 30 min walk daily
100 days + 1000 kcal
+ 8.1 + 5.4 + 2.7 67%
Roberts et al. 1990
7 / 0 24 14% Sedentary 20 days + 1000
kcal 1.5 + 2.5 + 1.7 + 0.8 68%
Horton et al. 1995
16 / 0 33 28% Inactive 2 weeks + 50%
1.2 + 2.9 + 1.5 + 1.4 52% 1.2 + 2.6 + 1.5 + 1.1 58%
Lammert et al. 2000
20 / 0 22 15% Inactive 3 weeks + 1200
kcal 1.7 + 1.4 + 0.8 + 0.6 57% 1.7 + 1.6 + 1.1 + 0.5 69%
Siervo et al. 2008
6 / 0 43 21% Inactive
3 weeks + 20% 1.4 + 0.7 + 0.4 + 0.3 57% 3 weeks + 40% 1.5 + 2.9 + 1.5 + 1.4 52% 3 weeks + 60% 1.7 + 5.7 + 3.6 + 2.7 63%
Claesson et al. 2009
11 / 14 23 24% 7800 step
avg 14 days + 46% 2.0 + 0.3 + 0.0 + 0.3 0% 1.2 + 0.8 + 0.3 + 0.5 38%
Stanhope et al. 2009
16 / 16 54
29% (M) / 41% (W)
Sedentary 8 weeks + 8%
+ 1.6 + 0.9 + 0.7 56%
+ 1.3 + 0.7 + 0.6 54%
Ernersson et al. 2010
12 / 6 26
15% (M) / 31% (W)
< 5000 steps/d 4 weeks + 70% 2.4 + 6.4 + 3.7 + 1.8 58%
Samocha-Bonet et al. 2010
21 / 20 37 33% Inactive 4 weeks + 60% 1.5
+ 3.4 + 2.4 + 1.0 71%
+ 2.2 a + 1.7 + 0.5 77%
Tchoukalova et al. 2010
15 / 13 29
16% (M) / 30% (W)
Inactive 8 weeks + 4.6 + 3.8 + 0.8 83%
Bray et al. 2012
5 / 3 24%
Inactive 8 weeks + 40%
0.7 + 3.1 a + 3.7 - 0.7 a 119% 6 / 3 24% 1.8 + 6.0 b + 3.5 + 2.9 b 58% 5 / 3 24 26% 3.0 + 6.5 b + 3.4 + 3.2 b 52%
Cornford et al. 2013
7 / 2 24
26% < 1500 steps/d
2 weeks + 70% 1.9 + 2.1 + 1.4 + 0.7 67%
Antonio et al. 2014
11 / 9 24 17% Resistance
Training 8 weeks + 800 kcal 4.4 + 1.7 - 0.2 + 1.9 0%
Johannsen et al. 2014
29 / 0 27 19% Inactive 8 weeks + 40% 1.8 + 7.6 + 4.2 + 3.4 55%
Reitman et al. 2014
27 / 0 23 15% Inactive 4 weeks
+ 480 kcal 3.3 + 0.3 - 0.3 + 0.6 0%
Rosqvist et al. 2014
13 / 5 18% Sedentary 7 weeks + 750
kcal
1.4 + 1.6 + 0.8 a + 0.8 a 50% 13 / 6 27 14% 1.4 + 1.6
+ 1.3 b
+ 0.3 b 81%
Antonio et al. 2015
24 / 7 23 18% Resistance
Training 8 weeks + 380 kcal 3.4 - 0.1 - 1.6 + 1.5 0%
Antonio et al. 2016
12 / 0 26 14%
Resistance Training 8 weeks
+ 370 kcal 3.3 - 0.5 - 1.1 + 0.6 0%

Int J Exerc Sci 10(8): 1275-1296, 2017
International Journal of Exercise Science http://www.intjexersci.com 1277
Spillane et al. 2016
11 / 0 18% Resistance Training 8 weeks + 1250
kcal
2.4 + 3.8 a + 1.4 + 2.3 37% 10 / 0 20 22% 1.0 + 1.4 b + 1.5 + 0.2 107%
Campbell et al. 2016
0 / 17 21 23% Resistance
Training 8 weeks + 400 kcal 2.4 +1.2 -1.1 +2.1 a 0%
Bold indicates significant change from baseline. Different letters indicate significant between group differences when applicable. Grey shading indicates data not available. Legend: BF – body fat, bw – body weight, d – days, CHO – carbohydrate, FFM – fat free mass, FM – fat mass, kcal – kilocalorie, PRO – protein, PUFA – polyunsaturated fat, SFA – saturated fat, wk – week, yr – years. Thirteen of the 25 studies followed a similar study design: a single group of individuals had their energy requirements or habitual food intake determined at baseline and were then overfed a set amount of energy or an amount of energy proportional to their baseline intake. Body composition measurements were taken before and after the intervention. The remaining 12 studies compared two or more overfeeding treatments providing different macronutrient compositions, energy surpluses, and food sources. All but four studies were conducted in sedentary populations. The purpose of this narrative review is to examine the current overfeeding literature that reports changes in body composition and formulate recommendations for athletes looking to increase lean body mass. Knowledge gaps in the available evidence and future research priorities will also be identified. EFFECTS OF OVERFEEDING WITH A WESTERN DIET Ten studies have evaluated the effect on body composition of overfeeding with a diet moderately high in both carbohydrates and fats (35-50 % energy intake each) and low in protein (11-15 %). All studies involved a single group of sedentary adults and lasted between nine days and three months. Food intake was strictly controlled in every study except for Ernersson et al., which used food logs for dietary analysis (16). Three studies overfed participants by 1,000 kcal per day for the duration of the study regardless of energy requirements for weight maintenance, meaning that the degree of energy surplus was variable from person to person.(10, 28, 34) Poehlman et al.(27) recruited six sedentary pairs (12 participants) of male monozygotic twins and overfed them by 1,000 kcal for 22 days with a diet that was 15% protein (2.4 g/kg), 35% fat, and 50% carbohydrate. Participants were housed in a hospital and under 24-hour supervision for the duration of the study. All participants had their energy expenditure at rest and during common sedentary tasks (sitting, standing, and slow walking) measured via indirect calorimetry to determine total daily energy needs, of which an additional 1,000 kcal was added for the overfeeding phase of the study. Food was provided at three meals per day and based on the dietary preferences of the participants. The average body weight gain was 2.2 kg, of which 50% was FM. However, there was considerable variability in the response to overfeeding. It is notable that some individuals lost FM and reduced their body fat percentage despite eating an additional 1,000 kcal per day. Moreover, there was a significant genotype-

Int J Exerc Sci 10(8): 1275-1296, 2017
International Journal of Exercise Science http://www.intjexersci.com 1278
overfeeding interaction for changes in body weight, FM, and FFM, suggesting that genetics do play a role in determining body composition changes in response to overfeeding. Table 2. Summary of overfeeding studies using a Western diet.
Author n - Men / Women Age
Body Fat %
Physical Activity
Dur-ation
Kcal Sur-plus
Protein (g/kg)
BW (kg)
FM (kg)
FFM (kg)
Fat gain (% wt gain)
Salans et al. 1971
5 / 0 26 19% "Reduced" 3 months + 16.2 + 10.4 + 5.8 64%
Norgan & Durnin 1980
6 / 0 22 15% Sedentary 9 weeks + 50% 2.2 + 6.0 + 3.7 + 2.3 62%
Ravussin et al. 1985
5 / 0 24 15% 6000-7000
steps/d 9 days + 60% 2.1 + 3.2 + 1.8 + 1.4 56%
Poehlman et al. 1986
12 / 0 19 12% Sedentary 22 days + 1000
kcal 2.4 + 2.2 + 1.1 +1.1 50%
Bouchard et al.1990
24 / 0 21 11% < 30 min
walk daily 100 days + 1000 kcal + 8.1 + 5.4 + 2.7 67%
Roberts et al. 1990
7 / 0 24 14% Sedentary 20 days + 1000
kcal 1.5 + 2.5 + 1.7 + 0.8 68%
Ernersson et al. 2010
12 / 6 26
15% (M) / 31% (W)
< 5000 steps/d 4 weeks + 70% 2.4 + 6.4 + 3.7 + 1.8 58%
Tchoukalova et al. 2010
15 / 13 29
16% (M) / 30% (W)
Inactive 8 weeks + 4.6 + 3.8 + 0.8 83%
Cornford et al. 2013
7 / 2 24 26% < 1500
steps/d 2 weeks + 70% 1.9 + 2.1 + 1.4 + 0.7 67%
Johannsen et al. 2014
29 / 0 27 19% Inactive 8 weeks + 40% 1.8 + 7.6 + 4.2 + 3.4 55%
Bold indicates significant change from baseline. Different letters indicate significant between group differences when applicable. Grey shading indicates data not available. Legend: BF – body fat, bw – body weight, d – days, CHO – carbohydrate, FFM – fat free mass, FM – fat mass, kcal – kilocalorie, PRO – protein, PUFA – polyunsaturated fat, SFA – saturated fat, wk – week, yr - years In a follow-up study by the same lab, Bouchard et al.(10) repeated the experiment with 12 sedentary pairs (24 participants) of male monozygotic twins and a longer treatment duration (100 days). Participants were overfed by 1,000 kcal per day (15% protein, 35% fat, and 50% carbohydrate) provided at three meals and one evening snack. Energy requirements for each participant were determined over a 14-day period prior to overfeeding in which dietary intake under conditions of stable body weight was recorded and analyzed. Body weight increased significantly by an average of 8.1 kg, of which 67% was FM. Considerable variation in response to overfeeding was again noted, but this variation was not distributed randomly among the 24 participants. Rather, significant genotype-overfeeding interactions showed that within-pair correlations were moderate to strong for changes in body weight (r=0.55), FM (r=0.50), subcutaneous fat (r=0.47), total visceral fat (r=0.72), and percent gain in visceral fat (r=0.90). The within-pair correlation for FFM was not significant (r=0.40). These findings further strengthen the argument that genetics play a role in body composition changes during overfeeding, especially as it relates to fat gain and where the fat is stored. Visceral fat gain appears to have an especially strong genetic component.

Int J Exerc Sci 10(8): 1275-1296, 2017
International Journal of Exercise Science http://www.intjexersci.com 1279
Roberts et al.(35) recruited seven sedentary males and overfed them by 1,000 kcal for 20 days on a diet that was 11% protein (1.5 g/kg), 43% fat, and 46% carbohydrate. Although the participants were free-living, the research lab provided all foods with at least one meal per day being consumed under researcher supervision. Participants ate three meals and one evening snack per day with 25% of energy requirements being consumed at breakfast and the remainder partitioned between the other two meals and snack. Energy requirements for each participant were determined over a 10-day period prior to overfeeding in which dietary intake under conditions of stable body weight were recorded and analyzed. During overfeeding, the additional 1,000 kcal was provided from sherbet, fruit juices, margarine, corn oil, and cookies, with 25% consumed at breakfast and the remainder split between the other eating occasions. The average gain in body weight was 2.5 kg, of which 68% was FM. However, some participants gained as little as 0.25 kg while others gained 2.8 kg. The differences in weight gain between individuals were linearly related to body fat changes (r=0.92; p<0.01), suggesting that increased FM is primarily responsible for body weight gain with overfeeding. Whereas the abovementioned studies fed all participants a flat surplus of energy regardless of energy requirements, the remaining seven studies established a baseline habitual energy intake or energy requirement to maintain weight and then overfed by 40-70 % of this baseline. Johannsen et al.(20) used the smallest surplus among these studies. Twenty-nine healthy males were overfed by 40% of their energy requirements for 8 weeks on a diet that was 15% protein (1.8 g/kg), 44% fat, and 41% carbohydrate. The participants were free-living but consumed all meals (three per day) under researcher supervision. Energy requirements were determined during a two-week period prior to overfeeding with the use of doubly-labeled water. Average weight gain was 7.6 kg, of which 55% was FM. Norgan and Durnin (24) recruited six healthy males and overfed them by 50% of their energy requirements for nine weeks on a diet that was 12% protein (2.2 g/kg body weight), 43% fat, 38% carbohydrate, and 7% alcohol. Notably, this is the only study in which alcohol was included as part of the overfeeding diet. No information on the distribution of food intake throughout the day is provided, but the participants consumed all meals under researcher supervision. Body weight increased by an average of 6 kg, of which 62% was FM. The researchers also observed a 1.8 kg increase in body water content, which represented 30% of the increase in body weight and suggests that the majority of gains in FFM are likely due to an increase in water content rather than actual skeletal muscle tissue. Ravussin et al. (32) overfed five healthy men by 60% of their energy requirements for nine days on a diet that was 15% protein (2.1 g/kg), 40% fat, and 45% carbohydrate. Energy requirements were determined over a two-week baseline phase during which dietary intakes under conditions of stable body weight were recorded. The participants ate three meals per day under researcher supervision. Body weight increased by 3.2 kg, of which 56% was FM. Cornford et al.(15) overfed seven men and two women by 70% of their energy requirements for two weeks on a diet that was 15% protein (1.9 g/kg), 35% fat, and 50% carbohydrate. The participants were confined to a hospital for the duration of the study and had energy requirements determined during a one-week baseline period. Unlike previous research that

Int J Exerc Sci 10(8): 1275-1296, 2017
International Journal of Exercise Science http://www.intjexersci.com 1280
provided food among 3-4 meals per day, this study distributed food among three meals and four snacks between 8:00 am and 10:00 pm, thus requiring that participants eat every 2-3 hours. Body weight significantly increased by 2.1 kg, of which 67% was FM. Salans et al.(38) recruited five healthy male inmates of the Vermont State Prison and overfed them an unspecified energy surplus with unknown macronutrient composition for three to four months. Energy requirements were determined during a six-week baseline period in which food intake was manipulated until body weight remained stable. The average increase in body weight was 16.2 kg or 1.0 to 1.3 kg per week, suggesting that the energy surplus was quite substantial, and FM represented 64% of the gain in body weight. Tchoukalova et al.(45) overfed 15 men and 13 women for eight weeks on a controlled weight maintenance diet (15% protein, 35% fat, and 50% carbohydrate) supplemented with additional energy from ice cream, chocolate nougat candy bars, and nutritional shakes. However, no information on the magnitude of the energy surplus or the macronutrient composition of the overfeeding diet was provided. The participants were “instructed to increase their overall food intake by eating until they were more full than usual.” Body weight significantly increased by 4.6 kg, of which 83% was FM. Sex did not affect the response to overfeeding. This is the most unfavorable change in body composition yet. Although no overfeeding macronutrient data is provided, it is likely that protein intake was especially low considering that baseline intake was only 15% of energy intake and overfeeding was on foods low in protein content. Additionally, the current study utilized what many would consider “junk food” during overfeeding (high in fats and sugars); therefore, this may have influenced the changes in body composition. Finally, work by Ernersson et al.(16) was the only study to not control food intake and instead measured dietary intake via three-day food logs. Twelve male and six female participants were “prescribed to double their energy intake during the intervention, by eating at least two fast food based meals per day” for four weeks. This led to an average energy surplus of 70% compared to habitual intake, with a macronutrient composition of 12% protein (2.4 g/kg), 43% fat, and 45% carbohydrate. Notably, 20% of total energy intake was from sugar and 17% was from saturated fat. Body weight increased significantly by 6.4 kg, of which 58% was FM. Additionally, there was a significant increase in liver fat from 1.1 to 2.8 % (non-alcoholic fatty liver disease is observed with 5-10% liver fat) and this increase was significantly associated with increases in body weight (r=0.44) and especially body fat percentage (r=0.81).(22) In summary, overfeeding healthy, sedentary adults with a diet moderately high in both carbohydrates and fats (35-50 % energy intake each) and low in protein (11-15 %) primarily results in a gain in FM. Although there is variation among studies, likely owed to differences among the study populations and the foods used for overfeeding, FM commonly represents 60-70 % of the increase in body weight. Additionally, the increases in FFM may be due to increases in body water content rather than skeletal muscle tissue, as suggested by Norgan and Durnin.(24) Considering that skeletal muscle requires mechanical tension, muscle damage, and metabolic stress for hypertrophy, it is not unlikely that changes in body water

Int J Exerc Sci 10(8): 1275-1296, 2017
International Journal of Exercise Science http://www.intjexersci.com 1281
accounted for most changes in FFM among the sedentary adults in these studies.(39) Similarly, changes in organ mass or non-muscle lean tissue could explain an increase in FFM. It is interesting to note that the participants of Poehlman et al. gained less FM than those of Roberts et al. (50 vs. 68 % of the gain in bodyweight) despite a similar energy surplus (1,000 kcal/d), study duration (22 and 20 days), and body weight gain (2.2 and 2.5 kg).(28, 34) A major difference between these two studies is the protein intake of the participants, which was 2.4 g/kg/d in Poehlman et al. and 1.5 g/kg/d in Roberts et al. It is well established that higher protein diets increase thermogenesis and promote the accretion of FFM, both of which could explain the lower gain in FM in Poehlman et al.(11, 26, 28) A favorable effect on body composition of a higher protein intake is further supported by the finding that participants from Ernersson et al. gained 58% of their body weight gain as FM while eating 2.4 g/kg/d of protein, compared to the participants of Cornford et al. who gained 67% of their body weight gain as FM while eating 1.9 g/kg/d of protein, despite both studies overfeeding by 70% of energy requirements.(15, 16) The discussed studies have several other notable findings as well. Poehlman et al. and Bouchard et al. found that changes in body composition with overfeeding are partially dependent on genetic factors, which would partly explain the notable variability in body composition changes observed in every overfeeding study discussed.(10, 28) Roberts et al. found that greater increases in body weight are strongly correlated with greater increases in FM, which suggests that the majority of body weight gain in a sedentary population is attributable to increases in FM rather than FFM and that it may not matter how much or how quickly weight is gained, as most will be fat mass regardless.(34) Ernersson et al. demonstrated that increases in liver fat concentrations were strongly correlated with increases in body fat percentage, which raises questions about whether increased liver fat would lead to unfavorable changes in body composition or vice-versa.(16) This latter finding by Ernersson et al. is especially important to follow-up on considering that certain dietary practices may preferentially increase liver fat concentrations, such as overfeeding on sugars and saturated fat.(50) Despite these observations, none of the abovementioned studies were designed to investigate how different dietary components or participant characteristics affected changes in body composition with overfeeding. Additionally, all the studies used sedentary populations and unrealistic caloric surpluses (baseline energy intake plus 1000 kcal or 40-70% of baseline), making it difficult if not impossible to extrapolate their findings to an athletic population looking to bulk. EFFECTS OF OVERFEEDING ON CARBOHYDRATES VERSUS FATS Three studies have compared changes in body composition between two groups overfeeding on diets with different amounts of fat and carbohydrate. All three studies involved a sedentary population, used unrealistically large energy surpluses, and lasted two to three weeks.

Int J Exerc Sci 10(8): 1275-1296, 2017
International Journal of Exercise Science http://www.intjexersci.com 1282
Table 3. Summary of overfeeding studies comparing carbohydrate to fat.
Author n - Men / Women Age
Body Fat %
Physical Activity
Dur-ation
Kcal Sur-plus
Protein (g/kg)
BW (kg)
FM (kg)
FFM (kg)
Fat gain (% wt gain)
Horton et al. 1995
16 / 0 33 28% Inactive 2 weeks + 50% 1.2 + 2.9 + 1.5 + 1.4 52%
1.2 + 2.6 + 1.5 + 1.1 58% Lammert et al. 2000
20 / 0 22 15% Inactive 3 weeks + 1200
kcal 1.7 + 1.4 + 0.8 + 0.6 57% 1.7 + 1.6 + 1.1 + 0.5 69%
Claesson et al. 2009
11 / 14 23 24% 7800 step
avg 14 days + 46% 2.0 + 0.3 + 0.0 + 0.3 0% 1.2 + 0.8 + 0.3 + 0.5 38%
Bold indicates significant change from baseline. Different letters indicate significant between group differences when applicable. Grey shading indicates data not available. Legend: BF – body fat, bw – body weight, d – days, CHO – carbohydrate, FFM – fat free mass, FM – fat mass, kcal – kilocalorie, PRO – protein, PUFA – polyunsaturated fat, SFA – saturated fat, wk – week, yr - years Horton et al. (17) recruited nine normal weight and seven obese men to eat a diet supplying 150% of energy requirements for two weeks in which the 50% surplus of energy came entirely from carbohydrates or fats in a randomized crossover design. No information on the macronutrient composition of the overfeeding or baseline diets was provided other than a baseline fat intake of 35% of energy requirements. However, a sample menu of the overfeeding diets was provided, including the amount of food eaten, which allowed for dietary analysis. Using the Food Processor Nutrition Analysis Software (ESHA), the high-carbohydrate diet was 11% protein (1.2 g/kg), 25% fat, and 64% carbohydrate while the high-fat diet was 11% protein (1.2 g/kg), 58% fat, and 31% carbohydrate. Each overfeeding period was preceded by one week of consuming a baseline maintenance diet and a four-week washout period separated the overfeeding periods. All food was provided to the participants by the researchers and at least one meal per day was to be consumed at the research facility under supervision while the remainder was packaged to be eaten elsewhere. Body weight, FM, and FFM increased significantly on both overfeeding diets without significant difference between them. Overall, FM represented 52% of the gain in body weight in the high-carbohydrate group and 58% in the high-fat group. There were also no significant differences between lean and obese participants. Lammert et al.(23) recruited 20 normal-weight males and overfed them by 1200 kcal for three weeks on a diet that was either high in carbohydrates (11% protein (1.7 g/kg), 11% fat, and 78% carbohydrate) or high in fats (11% protein (1.7 g/kg), 58% fat, and 31% carbohydrate) using a parallel-group design. The intervention was preceded by a two-week period where participants recorded habitual food intake under free-living conditions to establish a baseline energy intake. The overfeeding intervention itself was performed within a research facility where the participants were under 24-hour supervision and food intake was controlled. Both groups significantly increased their body weight and FM with no between-group differences. The high-carbohydrate group significantly increased FFM, although this was not significantly different from the high-fat group. Overall, the proportion of body weight gain that was FM was 57% in the high-carbohydrate group and 69% in the high-fat group. Finally, Claesson et al. (14) randomized 25 normal-weight men and women to eat 20 kcal/kg/day of candy or roasted and salted peanuts in addition to their regular diet for two weeks using a parallel-group design. This led to an average daily energy intake 46% greater

Int J Exerc Sci 10(8): 1275-1296, 2017
International Journal of Exercise Science http://www.intjexersci.com 1283
than habitual intake on diets providing 17% protein (2.0 g/kg), 48% fat, and 35% carbohydrate (40 g fiber) with peanuts or 10% protein (1.2 g/kg), 21% fat, and 69% carbohydrate (20 g fiber) with candy. The participants were free-living throughout the intervention and supplied with 14 individually adjusted bags of their respective snack for consumption daily (one bag/d). A three-day weighed food log quantified food intake at baseline and during the overfeeding period. No instruction on when to consume the snacks was provided. Only the candy group experienced a significant increase in body weight of 0.8 kg, of which 38% was FM. The peanut groups experienced a non-significant increase in body weight of 0.3 kg, all of which was attributable to an increase in FFM (FM remained unchanged). The studies by Horton et al. and Lammert et al. provide the strongest evidence for drawing conclusions, as they both controlled food intake and matched the amount of protein between diets.(18, 23) Both studies showed no difference in body composition with overfeeding on a diet high in carbohydrates or high in fat. However, the participants of Horton et al. consumed 35% of their energy intake as sugar during the high-carbohydrate phase, primarily from fruit juices, and consumed 33% of their energy intake as saturated fat, primarily from heavy whipping cream, in the high-fat phase.(18) Similarly, the high-carbohydrate group from Lammert et al. consumed 29% of their energy intake from purified sucrose.(23) As will be discussed later, overfeeding on saturated fat causes more FM gain than unsaturated fat (Rosqvist et al.).(37) Additionally, it remains unknown whether overfeeding on whole-food carbohydrate sources such as fruits, starchy vegetables, whole grains, and legumes would result in a different change in body composition than overfeeding on refined sugars. The study by Claesson et al. also suggests that there is no difference between overfeeding on a high-fat or high-carbohydrate diet.(14) However, the lack of control over the diet and physical activity levels of the participants precludes drawing firm conclusions, especially considering that the peanut group did not significantly change their body weight despite a reported energy surplus of 46% per day. Previous research has shown that adding peanuts into the diet result in a lower intake of other foods and increase in energy expenditure, both of which could explain the marginal change in body weight.(3) Additionally, studies of walnuts, almonds, and pistachios have demonstrated that these nuts provide less metabolizable energy to the body than what is predicted based on Atwater factors.(8, 9, 25) It is possible that part of the energy provided by the peanuts was simply not available for use by the body, therefore resulting in a lower energy surplus than planned. Finally, the peanut group consumed significantly more protein and fiber than the candy group, which makes isolating the effect of overfeeding on fat difficult. EFFECTS OF THE TYPE OF CARBOHYDRATE OR FAT Two studies have compared changes in body composition between two groups overfeeding on macronutrient-identical diets differing only their source of carbohydrate or fat. Both studies involved a sedentary, free-living population and had participants add food to their habitual diet. Table 4. Summary of overfeeding studies comparing food sources of macros.

Int J Exerc Sci 10(8): 1275-1296, 2017
International Journal of Exercise Science http://www.intjexersci.com 1284
Author n - Men / Women Age
Body Fat %
Physical Activity
Dur-ation
Kcal Sur-plus
Protein (g/kg)
BW (kg)
FM (kg)
FFM (kg)
Fat gain (% wt gain)
Stanhope et al. 2009
16 / 16 54
29% (M) / 41% (W)
Sedentary 8 weeks + 8%
+ 1.6 + 0.9 + 0.7 56%
+ 1.3 + 0.7 + 0.6 54%
Rosqvist et al. 2014
13 / 5 18% Sedentary 7 weeks + 750
kcal
1.4 + 1.6 + 0.8 a + 0.8 a 50% 13 / 6 27 14% 1.4 + 1.6
+ 1.3 b
+ 0.3 b 81%
Bold indicates significant change from baseline. Different letters indicate significant between group differences when applicable. Grey shading indicates data not available. Legend: BF – body fat, bw – body weight, d – days, CHO – carbohydrate, FFM – fat free mass, FM – fat mass, kcal – kilocalorie, PRO – protein, PUFA – polyunsaturated fat, SFA – saturated fat, wk – week, yr - years Stanhope et al.(43) conducted a double-blind, parallel-group study in which 32 overweight, sedentary adults were instructed to consume a sugar-sweetened beverage in addition to their habitual diet for eight weeks. The beverage provided 25% of energy requirements in the form of pure glucose or pure fructose. A two-week inpatient period preceding the overfeeding invention was used to establish maintenance energy requirements. The participants obtained their beverage supply twice weekly from the research lab and were instructed to drink one-third of the beverage three times per day with their main meals. Dietary intake was determined from the average of six 24-hour food recalls performed over the telephone. Adding the sugar-sweetened beverages into the diet of the participants resulted in an energy surplus of 8% compared to requirements determined at baseline, with a dietary macronutrient composition of 14% protein, 29% fat, and 57% carbohydrate. Both groups experienced significant increases in body weight (1.3-1.6 kg) and FM (54-56% of the gain in body weight); however, there were no between group differences. There were also no significant differences between groups in total or subcutaneous abdominal fat. However, the fructose group did tend (p=0.059) to show a greater increase in visceral fat than the glucose group (+ 14 vs. 3.2 %, respectively). While it would be intriguing to see if a longer treatment period or larger sample size would show that consuming fructose (versus glucose) significantly increases visceral fat, the real-world applicability of these findings is questionable. The amount of sugar consumed by the subjects in this study, 25% of energy requirements, is considerably higher than the current estimate for the average intake of added sugars by Americans, which range from 16.3% in young adults to 11.8% in elderly adults.(48) Although no data is available on added sugar consumption in athletes, we would speculate that athletes would typically consume less sugar than the general population. Nevertheless, this investigation does show that glucose and fructose have differential effects on fat distribution, which may impact health and body composition over the long term. Following the overfeeding phase of Stanhope et al., the participants were subjected to a two-week inpatient period in which dietary intake and physical activity were strictly controlled.(43) During this period, the participants consumed a maintenance diet composed of 15% protein, 30% fat, and 55% carbohydrate. Fructose- or glucose-sweetened beverages supplied 25% of the carbohydrate; the remaining 30% came from starch. It was shown that de novo lipogenesis within the liver was significantly increased by 83% compared to baseline in the fructose group but was unaltered in the glucose group, which the

Int J Exerc Sci 10(8): 1275-1296, 2017
International Journal of Exercise Science http://www.intjexersci.com 1285
authors propose as an explanation for the increased visceral fat from overfeeding on fructose as compared to glucose. Additionally, consuming fructose but not glucose significantly reduced insulin sensitivity by 17% and promoted dyslipidemia. Further research is needed to determine if the results of Stanhope et al. are supported with a lower intake of fructose, especially from whole fruit rather than sugar-sweetened beverages. At least one study has shown that adding 7 kcal/kg body weight per day of fruit (average intake of 423 kcal) to the diet for two months has no significant effect on visceral fat or blood lipids.(2) However, energy intake and body weight were also unaffected, suggesting that the addition of fruit to the diet resulted in dietary compensation that prevented hypercaloric conditions. It therefore remains unknown what effect fructose from fruit consumption has on body composition and fat distribution when overfeeding. Rosqvist et al. (36) conducted the second study: a seven-week, double-blind, randomized controlled trial with parallel-group design involving 37 sedentary, free-living adults. The participants were instructed to consume muffins baked using sunflower oil high in the polyunsaturated omega-6 fatty acid: linoleic acid or using palm oil high in the saturated fatty acid: palmitic acid. Muffins were added to the habitual diet and the amount was individually adjusted to achieve a 3% weight gain over the seven-week intervention. Dietary intake was assessed by four-day weighed food records at baseline and week seven. On average, both groups consumed three muffins per day providing 750 kcal. Food records showed no significant difference between groups for energy or macronutrient intake. Both groups similarly increased their energy intake by 20-25% and consumed a diet providing 12% protein (1.4 g/kg), 37-40% fat, and 43-48% carbohydrate. However, as per study design, the sunflower oil group consumed significantly more polyunsaturated fatty acids (13 vs. 4.5 % of energy) and significantly less saturated fat (11.5 vs. 16.5 %) than the palm oil group. Both groups significantly increased their body weight, FM, and FFM compared to baseline. The increase in body weight was not significantly different between groups. However, the sunflower oil group had significantly lower increases in FM and higher increases in FFM than the palm oil group. Fat mass represented 50% and 81% of the body weight gain in the sunflower and palm oil groups, respectively. Additionally, the palm oil group had significantly greater increases in liver and visceral fat than the sunflower oil group. Changes in liver and visceral fat as well as total FM were directly associated with changes in plasma palmitic acid, whereas liver fat and FM were inversely associated with changes in plasma linoleic acid. Despite comparable weight gain after overfeeding, this study showed that overfeeding on a diet rich in linoleic acid had a more favorable effect on body composition and ectopic fat deposition than overfeeding on a diet rich in palmitic acid. The mechanisms behind the differential effects on liver and total fat deposition are unknown, but may involve differences in hepatic lipogenesis and/or fatty acid oxidation and storage.(21) The authors note that the muffins contained significant amounts of fructose (although no data on sugar intake is provided), and previous overfeeding research has shown that fructose and saturated fat act synergistically to promote liver fat accumulation.(41) Accordingly, future work should attempt to replicate Rosqvist et al.’s findings using low-sugar diets.(37)
Int J Exerc Sci 10(8): 1275-1296, 2017
International Journal of Exercise Science http://www.intjexersci.com 1286
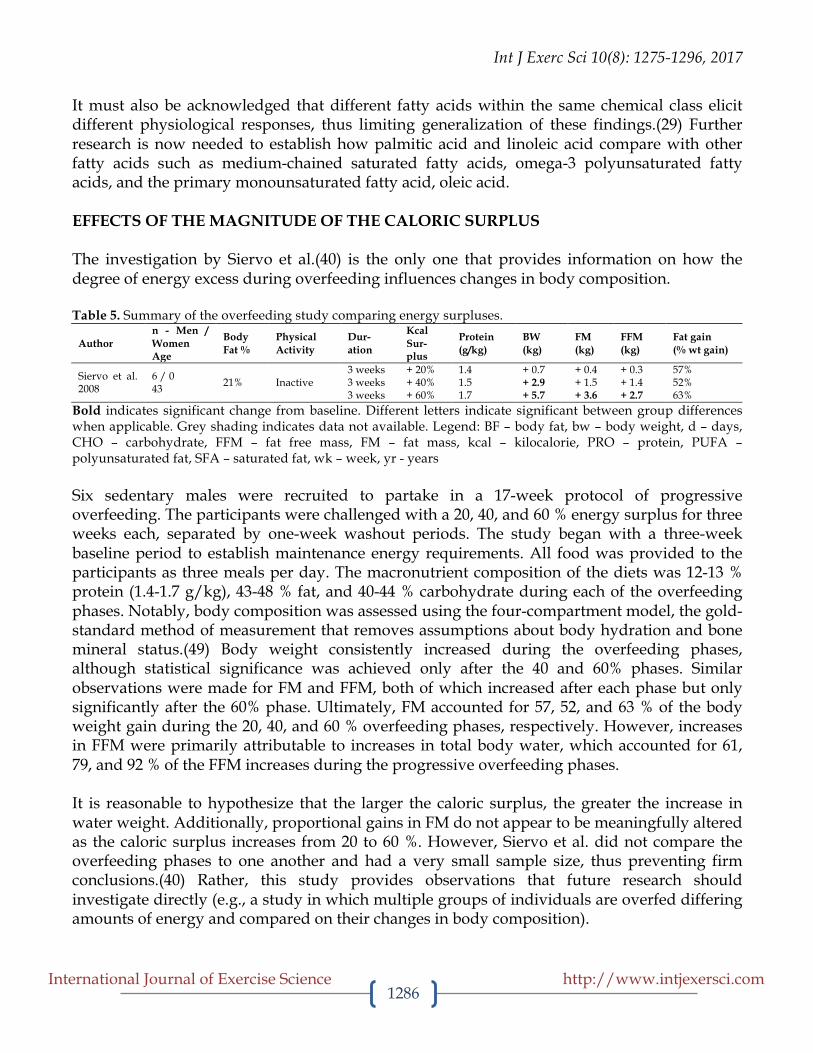
It must also be acknowledged that different fatty acids within the same chemical class elicit different physiological responses, thus limiting generalization of these findings.(29) Further research is now needed to establish how palmitic acid and linoleic acid compare with other fatty acids such as medium-chained saturated fatty acids, omega-3 polyunsaturated fatty acids, and the primary monounsaturated fatty acid, oleic acid. EFFECTS OF THE MAGNITUDE OF THE CALORIC SURPLUS The investigation by Siervo et al.(40) is the only one that provides information on how the degree of energy excess during overfeeding influences changes in body composition. Table 5. Summary of the overfeeding study comparing energy surpluses.
Author n - Men / Women Age
Body Fat %
Physical Activity
Dur-ation
Kcal Sur-plus
Protein (g/kg)
BW (kg)
FM (kg)
FFM (kg)
Fat gain (% wt gain)
Siervo et al. 2008
6 / 0 43 21% Inactive
3 weeks + 20% 1.4 + 0.7 + 0.4 + 0.3 57% 3 weeks + 40% 1.5 + 2.9 + 1.5 + 1.4 52% 3 weeks + 60% 1.7 + 5.7 + 3.6 + 2.7 63%
Bold indicates significant change from baseline. Different letters indicate significant between group differences when applicable. Grey shading indicates data not available. Legend: BF – body fat, bw – body weight, d – days, CHO – carbohydrate, FFM – fat free mass, FM – fat mass, kcal – kilocalorie, PRO – protein, PUFA – polyunsaturated fat, SFA – saturated fat, wk – week, yr - years Six sedentary males were recruited to partake in a 17-week protocol of progressive overfeeding. The participants were challenged with a 20, 40, and 60 % energy surplus for three weeks each, separated by one-week washout periods. The study began with a three-week baseline period to establish maintenance energy requirements. All food was provided to the participants as three meals per day. The macronutrient composition of the diets was 12-13 % protein (1.4-1.7 g/kg), 43-48 % fat, and 40-44 % carbohydrate during each of the overfeeding phases. Notably, body composition was assessed using the four-compartment model, the gold-standard method of measurement that removes assumptions about body hydration and bone mineral status.(49) Body weight consistently increased during the overfeeding phases, although statistical significance was achieved only after the 40 and 60% phases. Similar observations were made for FM and FFM, both of which increased after each phase but only significantly after the 60% phase. Ultimately, FM accounted for 57, 52, and 63 % of the body weight gain during the 20, 40, and 60 % overfeeding phases, respectively. However, increases in FFM were primarily attributable to increases in total body water, which accounted for 61, 79, and 92 % of the FFM increases during the progressive overfeeding phases. It is reasonable to hypothesize that the larger the caloric surplus, the greater the increase in water weight. Additionally, proportional gains in FM do not appear to be meaningfully altered as the caloric surplus increases from 20 to 60 %. However, Siervo et al. did not compare the overfeeding phases to one another and had a very small sample size, thus preventing firm conclusions.(40) Rather, this study provides observations that future research should investigate directly (e.g., a study in which multiple groups of individuals are overfed differing amounts of energy and compared on their changes in body composition).

Int J Exerc Sci 10(8): 1275-1296, 2017
International Journal of Exercise Science http://www.intjexersci.com 1287
EFFECTS OF OVERFEEDING WITH A HIGH-PROTEIN DIET Seven studies have investigated the effects of protein overfeeding on body composition. Two of these studies were conducted in sedentary individuals while the remainder involved an athletic population that underwent a concurrent resistance training program. Table 6. Summary of overfeeding studies.
Author n - Men / Women Age
Body Fat %
Physical Activity
Dur-ation
Kcal Sur-plus
Protein (g/kg)
BW (kg)
FM (kg)
FFM (kg)
Fat gain (% wt gain)
Webb & Annis 1983
4 / 5 46
15% (M) / 37% (W)
Sedentary 30 days + 1000 kcal
2.4 + 1.8 a + 1.1 a + 0.7 61% 1.7 + 2.7 b + 2.0 b + 0.7 74%
1.2 + 2.7 b + 2.1 b + 0.6 78%
Bray et al. 2012
5 / 3 24%
Inactive 8 weeks + 40%
0.7 + 3.1 a + 3.7 - 0.7 a 119% 6 / 3 24% 1.8 + 6.0 b + 3.5 + 2.9 b 58% 5 / 3 24 26% 3.0 + 6.5 b + 3.4 + 3.2 b 52%
Antonio et al. 2014
11 / 9 24 17% Resistance
Training 8 weeks + 800 kcal 4.4 + 1.7 - 0.2 + 1.9 0%
Antonio et al. 2015
24 / 7 23 18%
Resistance Training 8 weeks
+ 380 kcal 3.4 - 0.1 - 1.6 + 1.5 0%
Antonio et al. 2016
12 / 0 26 14% Resistance
Training 8 weeks + 370 kcal 3.3 - 0.5 - 1.1 + 0.6 0%
Spillane et al. 2016
11 / 0 18% Resistance Training
8 weeks + 1250 kcal
2.4 + 3.8 a + 1.4 + 2.3 37% 10 / 0 20 22% 1.0 + 1.4 b + 1.5 + 0.2 107%
Campbell et al. 2016
0 / 17 21 23% Resistance
Training 8 weeks + 400 kcal 2.4 +1.2 -1.1 +2.1 a 0%
Bold indicates significant change from baseline. Different letters indicate significant between group differences when applicable. Grey shading indicates data not available. Legend: BF – body fat, bw – body weight, d – days, CHO – carbohydrate, FFM – fat free mass, FM – fat mass, kcal – kilocalorie, PRO – protein, PUFA – polyunsaturated fat, SFA – saturated fat, wk – week, yr - years Webb and Annis recruited nine sedentary adults to overfeed by 1000 kcal/d for 30 days on a high-protein diet [20% protein (2.4 g/kg), 50% fat, and 30% carbohydrate], average diet [14% protein (1.7 g/kg), 41% fat, and 45% carbohydrate], or high-carbohydrate diet [10% protein (1.2 g/kg), 30% fat, and 60% carbohydrate].(47) Each of the three groups included four participants, with three of the nine participants consuming two of the diets and the remainder only being in a single diet group. The participants lived at home but ate all meals under researcher supervision. Food intake was strictly controlled. A 30-day baseline period prior to overfeeding was used to establish maintenance energy requirements. The average and high-carbohydrate diets showed similar increases in body weight, FM, and FFM, with FM being 74 and 78 % of the gain in body weight of these diets, respectively. However, the high-protein diet gained significantly less body weight (1.8 vs. 2.7 kg in both other groups) and FM (1.1 vs. 2.0 kg in both other groups) but similar FFM, leading to a FM gain that was 61% of the gain in body weight. The second sedentary population study was conducted by Bray et al.(12) Using a double-blind, randomized, parallel-group design, 25 sedentary adults were overfed by 40% of energy requirements for eight weeks on diets supplying 5% protein (0.7 g/kg), 15% protein (1.8 g/kg), or 25% protein (3.0 g/kg). Carbohydrate intake was equal across groups (41-42 % energy) and

Int J Exerc Sci 10(8): 1275-1296, 2017
International Journal of Exercise Science http://www.intjexersci.com 1288
fat was reduced to accommodate the increasing protein intake. Throughout the study, participants were confined to a metabolic unit and under 24-hour supervision. Food intake and physical activity were controlled, with food provided as three meals and one snack. A 13- to 25-day baseline period was used to establish maintenance energy requirements. All groups gained a significant amount of body weight during overfeeding, but the low-protein group gained significantly less than the other two groups (3.1 kg vs. 6.0 and 6.5 kg in the normal and high-protein groups, respectively). However, all three groups significantly increased FM to a similar extent (3.4 to 3.7 kg) while only the normal-protein and high-protein groups significantly increased FFM. The failure to increase FFM in the low protein group accounted for its smaller weight gain. In fact, the low-protein group lost a non-significant amount of FFM to the extent that the increase in FM represented 119% of the gain in body weight. By contrast, the normal- and high-protein groups had a FM gain of 58 and 52 % the gain in body weight, respectively. Based on the regression line of protein intake and change in FFM, Bray et al. showed that the protein intake required to prevent loss of FFM averaged ~78 g/d (1.05 g/kg), which was 30 g/d (0.35 g/kg) higher than the protein intake of the low protein group (47.0 g/d; 0.7 g/kg).(12) Both the above studies suggest that a higher protein diet leads to a more beneficial change in body composition with overfeeding. Webb and Annis showed that FFM gain was similar across protein intakes of 1.2, 1.7, and 2.4 g/kg.(47) Bray et al. showed that the gain in FFM was similar with a protein intake of 1.8 and 3.0 g/kg. Thus, the data suggest that FFM requires about 1.05 g/kg to be at least maintained. It appears that eating more than 1.2 g/kg/d of protein has no further beneficial impact on FFM among a sedentary population under hypercaloric conditions.(12) In contrast to the agreement on FFM, the above studies show disparate findings regarding FM. Webb and Annis show that progressing from 1.7 to 2.4 g/kg reduces gains in FM while 1.2 and 1.7 g/kg have similar effects on FM gain.(47) Yet, there was no difference in FM gain among the 1.8 and 3.0 g/kg groups from Bray et al.(12) The 40% energy surplus from Bray et al. corresponded to about 900 to 980 kcal/d, which is not meaningfully different from the 1000 kcal/d surplus of Webb and Annis. The study duration of Bray et al. was approximately twice the length of Webb and Annis (56 vs. 30 days), but changes in body composition showed a relatively linear increase in both studies, suggesting that altering the duration would not explain the discrepancy in FM gain. Considering that only Bray et al. strictly controlled physical activity, it is possible that eating more protein leads to increases in spontaneous physical activity or non-exercise activity thermogenesis (NEAT) that would be apparent in Webb and Annis, possibly through an effect of protein on neuropeptide concentrations.(46) Alternatively, there may be an interaction between protein intake and fat and/or carbohydrate intake, as both “medium” protein groups from Bray et al. and Webb and Annis had a similar macronutrient composition, whereas the “high” protein group in Bray et al. consumed 41 and 33 % of energy intake as carbohydrate and fat compared to 30 and 50 %, respectively, in Webb and Annis. Regardless, Bray et al. utilized a much stronger study design and larger sample size of both men and women than Webb and Annis, thus putting more confidence in their finding that the amount of dietary protein does not meaningfully influence gains in FM among an overfeeding sedentary population.

Int J Exerc Sci 10(8): 1275-1296, 2017
International Journal of Exercise Science http://www.intjexersci.com 1289
The remaining five “high-protein” studies involved an athletic population that underwent a resistance training program while overfeeding. None of the studies controlled food intake or physical activity and relied on food logs to determine the dietary intake of the participants. In a double-blind, randomized, parallel-group design, Spillane et al. recruited 21 healthy, resistance-trained males to overfeed on 1250 kcal of carbohydrates alone (312 g/d maltodextrin) or a combination of carbohydrates and protein (94 g, 196 g, and 22 g of protein, maltodextrin, and fat, respectively) while simultaneously performing a standardized resistance training routine over eight weeks.(42) The participants consumed the carbohydrate or carbohydrate plus protein supplements in addition to their regular diet: half consumed within 30 minutes before and 30 minutes after each resistance training session, or the entire supplement dose upon waking on non-training days. Food logs completed by the participants showed that neither group significantly changed their habitual diet during the intervention. When the supplement was included in the diet, the high-protein group consumed 22% protein (2.4 g/kg), 29% fat, and 49% carbohydrate, while the carbohydrate only group consumed 10% protein (1.0 g/kg), 25% fat, and 65% carbohydrate. There were no significant differences between groups for increases in body weight, FM, or FFM, but total body water content increased significantly more in the high-protein group. However, while both groups gained a similar amount of FM (~1.4 kg), only the high-protein group gained a significant amount of FFM (2.3 vs. 0.2 kg). Ultimately, the gain in FM was ~100% the body weight gains in the carbohydrate only group compared to 37% in the high-protein group. Still, the gain in FFM could potentially be explained by the increase in body water and whether the increase was owed to water or skeletal muscle protein is unclear. Recent evidence shows that progressive resistance training increases total body water through a rise in cellular hydration; however, it is unclear why total body water increased only in the high-protein group.(33) Nonetheless, a confounding variable of this investigation is that both groups actually overfed primarily on carbohydrate. Thus, it is somewhat misleading to describe a group that is ‘high’ in protein when in fact it was approximately twice as high in carbohydrate content. Extrapolating the findings of Spillane et al. to an athletic population looking to bulk is difficult because of the massive energy surplus employed, the amount of carbohydrate consumed (i.e., this was more of a high carbohydrate overfeed) and the lack of distribution through the day.(42) This limitation is largely overcome by a series of studies conducted by Antonio et al. that used energy surpluses and energy distribution patterns more typical among athletes attempting to gain lean body mass. Antonio et al.(7) examined 30 healthy men and women with an average of nine years of resistance training experience. Subjects were randomized into one of two groups: consume 4.4 g/kg of protein daily or to maintain current dietary habits for eight weeks. Both groups were also instructed to maintain their current exercise habits. Compared to the control group, the high-protein group consumed significantly more calories (+ 800 kcal) and protein (4.4 vs. 1.8 g/kg) derived primarily from whey protein shakes, leading to a diet that was 45% protein, 27% fat, and 30% carbohydrate. There were no statistically significant changes between groups or within groups for any of the body composition variables. However, it is notable that the

Int J Exerc Sci 10(8): 1275-1296, 2017
International Journal of Exercise Science http://www.intjexersci.com 1290
high-protein group increased FFM (+1.9 vs. 1.3 kg) and reduced FM (-0.2 vs. +0.3 kg) compared to the control group despite eating an additional 800 kcal/d. In a follow-up investigation, Antonio et al. randomized 48 healthy, resistance-trained men and women to consume a minimum of 3 g/kg of protein daily or to maintain current dietary habits for eight weeks while undergoing a standardized resistance training program designed to increase lean body mass.(4) Compared to the control group, the high-protein group consumed significantly more calories (+ 490 kcal) and protein (3.4 vs. 2.3 g/kg) from primarily whey protein shakes, leading to a diet that was 39% protein, 27% fat, and 34% carbohydrate. Both groups significantly increased FFM and significantly reduced FM compared to baseline, but the reduction in FM was significantly greater in the high-protein group compared to the control group (-1.6 vs. -0.3 kg). Accordingly, body weight gain was also significantly less in the high-protein group compared to the control group. Moreover, Antonio et al.(5) conducted a randomized, crossover trial in which 12 resistance-trained men consumed a high-protein diet or their habitual diet for eight weeks each. Throughout the 16-week intervention, the participants followed their own strength and conditioning program. Compared to the control treatment, the high-protein treatment consumed significantly more calories (+ 370 kcal) and protein (3.3 vs. 2.6 g/kg) from primarily whey protein shakes, leading to a diet that was 42% protein, 28% fat, and 30% carbohydrate. There were no significant differences between the control and high-protein treatments for any body composition variable. However, nine of the 12 participants showed a reduction in FM during the high-protein diet phase. Campbell et al.(1) examined 17 resistance-trained female subjects that were matched for total fat mass and randomized to a high-protein (2.4 g/kg/d) or control group (1.2 g/kg/d) for eight weeks in conjunction with a resistance-training program. The high-protein group consumed significantly more calories (+400 kcal) and protein than the control group, but there were otherwise no restrictions or guidelines placed on their diet. The higher protein diet was shown to be superior to a lower protein diet for increasing FFM, but both diets similarly reduced FM. The studies by Antonio et al. collectively suggest that a high-protein diet may reduce FM if there is an alteration in the training regimen; however, changes in FFM are not different between a 2.6 and 3.3 g/kg/d protein intake suggesting there may be an upper limit to protein intake vis a vis gains in FFM. Although statistical significance was not achieved in each study, possibly due to large individual responses to overfeeding on protein and relatively small sample sizes that may have limited statistical power, there was a consistent observation that consuming above 3 g/kg protein led to reductions in FM compared to eating 2.6 g/kg or less. Importantly, the comparator diet in these studies would be considered high-protein by most standards, so the work of Antonio et al. is comparing a high-protein diet to a higher protein diet. Unfortunately, Antonio et al. did not control food intake in any of his studies, raising the possibility that the increase in protein consumption led to a reduction in other foods and a lower energy surplus than reported. However, the participants of Antonio et al.’s studies were

Int J Exerc Sci 10(8): 1275-1296, 2017
International Journal of Exercise Science http://www.intjexersci.com 1291
all athletes who regularly tracked food intake in their normal lives and used the MyFitnessPal® smartphone app to log their foods. It therefore seems unlikely that misreporting would occur. Nonetheless, misreporting error would be expected to be randomly distributed among the groups, thus minimizing its confounding on the study outcomes if it did occur. The work of Spillane et al. and Campbell et al. appear to contrast the findings of Antonio et al. by showing that a high-protein diet has a beneficial effect on FFM compared to a low-protein diet but no effect on FM. However, these studies compared a true high-protein diet (2.4 g/kg) to true low-protein diet (1.0-1.2 g/kg), which contrasts with Antonio et al. who compared a high-protein diet (1.8-2.6 g/kg) to a higher protein diet (>3.3 g/kg). As such, the studies are not in contradiction with one another. It appears that consuming 1.0-1.2 g/kg of protein is not adequate for an athlete to maximize muscle growth. It remains unknown how consuming an intermediate amount of protein (1.6-2.0 g/kg) would fair against the low- and high-protein diets. Although both Spillane et al. and Campbell et al. found no effect of a high-protein diet on FM compared to a low-protein diet, Spillane et al. reported a significant increase compared to baseline while Campbell et al. reported a non-significant reduction. This discrepancy is possibly explained by the distribution of the energy surplus being more even throughout the day in Campbell et al.’s study, as opposed to a 600-1200 kcal bolus consumed around training or in the morning in the study by Spillane et al. Additionally, the daily energy surplus itself was lower, being a mere 400 kcal in Campbell et al. An explanation for the reduction in FM when overfeeding on a high-protein diet is unclear. It is possible that increases in non-exercise activity thermogenesis or diet-induced thermogenesis with increased protein consumption played a role in reducing FM. Furthermore, recent animal data suggest that a high-protein diet might reduce fat mass by inhibiting lipogenesis in the liver.(13) The inhibition of lipogenesis is logical considering the high energy cost of the metabolic pathways associated with protein, including gluconeogenesis, the urea cycle and excretion of ammonia, and protein synthesis. CONCLUSION AND PRACTICAL APPLICATION The majority of overfeeding research to date has been conducted in sedentary individuals and used an energy surplus far exceeding what could be considered reasonable. This evidence collectively shows that overfeeding increases body weight primarily through FM, and that gains in FFM are likely due to changes in total body water rather than lean body mass.(24, 40) Consuming less than 1.2 g/kg/d is rather insufficient in terms of gaining lean body mass.(12) This is supported by recent evidence showing that the current RDA is not sufficient to meet the protein requirements of various sedentary populations, including elderly women or men aged over 65 years, of women aged over 80 years, or of young men in their twenties.(19, 30, 31, 44) Per these studies, the RDA for both young and elderly men and women should be 1.2-1.3 g/kg. Consuming a high-protein diet also appears to have an inconclusive effect on FM, with one study showing no effect on FM and another study showing a reduction in FM gains.(12, 47) There appears to be no meaningful difference between overfeeding on a high-carbohydrate or high-fat diet, although there may be an advantage to changes in body composition and fat distribution with consuming glucose rather than fructose and linoleic acid rather than palmitic

Int J Exerc Sci 10(8): 1275-1296, 2017
International Journal of Exercise Science http://www.intjexersci.com 1292
acid.(37, 43) Nonetheless, the applicability of these findings to athletes is questionable because of how exercise alters fuel partitioning (e.g., increased glucose uptake into muscle; enhanced muscle protein synthesis). On the other hand, research that involves resistance-trained individuals includes a reasonable energy surplus and is confined to the effects of manipulating protein intake. This evidence suggests that there may be an upper limit in which additional protein intake does not result in a concomitant gain in FFM. Considering that high protein diets have not been shown to adversely affect kidney, bone, or metabolic health in athletes,(6) the bulking athlete (i.e., his/her primary goal is an increase in body weight and/or lean body mass) appears to be best served by consuming more than 2.2 g/k/d and perhaps as high as 3.4 g/kg/d. Whether consuming more than this provides additional benefit requires investigation. There is a need to assess how overfeeding on primarily carbohydrates or fats, as well as the type of carbohydrate (starch vs. sugars) and fat (medium- and long-chained saturated fats, monounsaturated fats, and omega-6 and omega-3 polyunsaturated fats), affects body composition in athletes. However, care should be taken to examine these differences using whole-foods rather than isolated nutrients when possible. Athletes tend to be a health-conscious population and the applicability of findings using refined or heavily processed diets is questionable. For example, when comparing a high-carbohydrate diet to a high-fat diet, the former should include greater amounts of whole grains, starchy tubers, fruits, and legumes while the latter includes more nuts, whole-fat dairy, and fattier cuts of meat. If protein is matched between diets, the inherent differences in nutrient and fiber content of the diets represent real-world differences with direct application to the athletic population. There is also a need to assess how meal timing and distribution affect body composition during overfeeding. It has been proposed that the ideal dose of protein is approximately 0.25 g/kg per meal for young adults and 0.4 g/kg per meal for older adults to maximize muscle protein synthesis. How would consuming the same amount of protein spread across 2-3 meals compare to a spread across 5-6 meals? Would eating three meals affect body composition differently if those meals were consumed within an 8-hour window compared to a longer feeding window? How would fat gain be affected by more frequent or less frequent eating occasions? In conclusion, it is evident that overfeeding on carbohydrate and/or fat results in body composition alterations that are different than overfeeding on protein. It is commonly believed that 3,500 kcal is equivalent to 0.45 kg (1 pound) of fat and that changing energy balance in accordance with this will produce predictable changes in body weight. However, the overfeeding literature to date does not support this assertion. Dietary protein appears to have a protective effect against fat gain during times of energy surplus, especially when combined with resistance training. Therefore, the evidence suggests that dietary protein may be the key macronutrient in terms of promoting positive changes in body composition.

Int J Exerc Sci 10(8): 1275-1296, 2017
International Journal of Exercise Science http://www.intjexersci.com 1293
ACKNOWLEDGEMENTS No funding to declare. All authors have read and approved the final version of the manuscript. The first author declares that he has no competing interests. The 2nd author is the Chief Executive Officer of the ISSN, an academic non-profit scientific society. REFERENCES
1. Campbell BI, Aguilar D, Vargas A. Effects of a high (2.4 g/kg) vs. low/moderate (1.2 g/kg) protein intake on body composition in aspiring female physique athletes engaging in an 8-week resistance training program. J Int Soc Sports Nutr 13(Suppl 1):P20, 2016. 2. Agebratt C, Strom E, Romu T, Dahlqvist-Leinhard O, Borga M, Leandersson P, Nystrom FH. A Randomized Study of the Effects of Additional Fruit and Nuts Consumption on Hepatic Fat Content, Cardiovascular Risk Factors and Basal Metabolic Rate. PLoS One 11(1):e0147149, 2016. 3. Alper CM, Mattes RD. Effects of chronic peanut consumption on energy balance and hedonics. Int J Obes Relat Metab Disord 26(8):1129-1137, 2002. 4. Antonio J, Ellerbroek A, Silver T, Orris S, Scheiner M, Gonzalez A, Peacock CA. A high protein diet (3.4 g/kg/d) combined with a heavy resistance training program improves body composition in healthy trained men and women--a follow-up investigation. J Int Soc Sports Nutr 12:39, 2015. 5. Antonio J, Ellerbroek A, Silver T, Vargas L, Peacock C. The effects of a high protein diet on indices of health and body composition – a crossover trial in resistance-trained men. J Int Soc Sports Nutr 13(3):2016. 6. Antonio J, Ellerbroek A, Silver T, Vargas L, Tamayo A, Buehn R, Peacock CA. A High Protein Diet Has No Harmful Effects: A One-Year Crossover Study in Resistance-Trained Males. J Nutr Metab 2016:9104792, 2016. 7. Antonio J, Peacock CA, Ellerbroek A, Fromhoff B, Silver T. The effects of consuming a high protein diet (4.4 g/kg/d) on body composition in resistance-trained individuals. J Int Soc Sports Nutr 11(19): 2014. 8. Baer DJ, Gebauer SK, Novotny JA. Measured energy value of pistachios in the human diet. Br J Nutr 107(1):120-125, 2012. 9. Baer DJ, Gebauer SK, Novotny JA. Walnuts Consumed by Healthy Adults Provide Less Available Energy than Predicted by the Atwater Factors. J Nutr 146(1):9-13, 2016. 10. Bouchard C, Tremblay A, Despres JP, Nadeau A, Lupien PJ, Theriault G, Dussault J, Moorjani S, Pinault S, Fournier G. The response to long-term overfeeding in identical twins. N Engl J Med 322(21):1477-1482, 1990. 11. Bray GA, Redman LM, de Jonge L, Covington J, Rood J, Brock C, Mancuso S, Martin CK, Smith SR. Effect of protein overfeeding on energy expenditure measured in a metabolic chamber. Am J Clin Nutr 101(3):496-505, 2015. 12. Bray GA, Smith SR, de Jonge L, Xie H, Rood J, Martin CK, Most M, Brock C, Mancuso S, Redman LM. Effect of dietary protein content on weight gain, energy expenditure, and body composition during overeating: a randomized controlled trial. JAMA 307(1):47-55, 2012. 13. Chaumontet C, Even PC, Schwarz J, Simonin-Foucault A, Piedcoq J, Fromentin G, Azzout-Marniche D, Tome D. High dietary protein decreases fat deposition induced by high-fat and high-sucrose diet in rats. Br J Nutr 114(8):1132-1142, 2015.
Int J Exerc Sci 10(8): 1275-1296, 2017
International Journal of Exercise Science http://www.intjexersci.com 1294
14. Claesson AL, Holm G, Ernersson A, Lindstrom T, Nystrom FH. Two weeks of overfeeding with candy, but not peanuts, increases insulin levels and body weight. Scand J Clin Lab Invest 69(5):598-605, 2009. 15. Cornford AS, Hinko A, Nelson RK, Barkan AL, Horowitz JF. Rapid development of systemic insulin resistance with overeating is not accompanied by robust changes in skeletal muscle glucose and lipid metabolism. Appl Physiol Nutr Metab 38(5):512-519, 2013. 16. Ernersson A, Nystrom FH, Lindstrom T. Long-term increase of fat mass after a four week intervention with fast food based hyper-alimentation and limitation of physical activity. Nutr Metab (Lond) 7:68, 2010. 17. Horton TJ, Drougas H, Brachey A, Reed GW, Peters JC, Hill JO. Fat and carbohydrate overfeeding in humans: different effects on energy storage. American Journal of Clinical Nutrition 62(1):19-29, 1995. 18. Horton TJ, Drougas H, Brachey A, Reed GW, Peters JC, Hill JO. Fat and carbohydrate overfeeding in humans: different effects on energy storage. Am J Clin Nutr 62(1):19-29, 1995. 19. Humayun MA, Elango R, Ball RO, Pencharz PB. Reevaluation of the protein requirement in young men with the indicator amino acid oxidation technique. Am J Clin Nutr 86(4):995-1002, 2007. 20. Johannsen DL, Tchoukalova Y, Tam CS, Covington JD, Xie W, Schwarz JM, Baipeyi S, Ravussin E. Effect of 8 weeks of overfeeding on ectopic fat deposition and insulin sensitivity: testing the adipose tissue expandability hypothesis. Diabetes Care 37(10):2789-2797, 2014. 21. Jump DB, Tripathy S, Depner CM. Fatty acid-regulated transcription factors in the liver. Annu Rev Nutr 33:249-269, 2013. 22. Kechagias S, Ernersson A, Dahlqvist O, Lundberg P, Lindstrom T, Nystrom FH, Fast Food Study G. Fast-food-based hyper-alimentation can induce rapid and profound elevation of serum alanine aminotransferase in healthy subjects. Gut 57(5):649-654, 2008. 23. Lammert O, Grunnet N, Faber P, Bjornsbo KS, Dich J, Larsen LO, Neese RA, Hellerstein MK, Quistorff B. Effects of isoenergetic overfeeding of either carbohydrate or fat in young men. Br J Nutr 84(2):233-245, 2000. 24. Norgan NG, Durnin JV. The effect of 6 weeks of overfeeding on the body weight, body composition, and energy metabolism of young men. Am J Clin Nutr 33(5):978-988, 1980. 25. Novotny JA, Gebauer SK, Baer DJ. Discrepancy between the Atwater factor predicted and empirically measured energy values of almonds in human diets. Am J Clin Nutr 96(2):296-301, 2012. 26. Paddon-Jones D, Westman E, Mattes RD, Wolfe RR, Astrup A, Westerterp-Plantenga M. Protein, weight management, and satiety. Am J Clin Nutr 87(5):1558S-1561S, 2008. 27. Poehlman E, Tremblay A, Després J, Fontaine E, Pérusse L, Thériault G, Bouchard C. Genotype-controlled changes in body composition and fat morphology following overfeeding in twin. American Journal of Clinical Nutrition 43(5):723-731, 1986. 28. Poehlman ET, Tremblay A, Despres JP, Fontaine E, Perusse L, Theriault G, Bouchard C. Genotype-controlled changes in body composition and fat morphology following overfeeding in twins. Am J Clin Nutr 43(5):723-731, 1986. 29. Poudyal H, Brown L. Should the pharmacological actions of dietary fatty acids in cardiometabolic disorders be classified based on biological or chemical function? Prog Lipid Res 59:172-200, 2015.

Int J Exerc Sci 10(8): 1275-1296, 2017
International Journal of Exercise Science http://www.intjexersci.com 1295
30. Rafii M, Chapman K, Elango R, Campbell WW, Ball RO, Pencharz PB, Courtney-Martin G. Dietary Protein Requirement of Men >65 Years Old Determined by the Indicator Amino Acid Oxidation Technique Is Higher than the Current Estimated Average Requirement. J Nutr 2016. 31. Rafii M, Chapman K, Owens J, Elango R, Campbell WW, Ball RO, Pencharz PB, Courtney-Martin G. Dietary protein requirement of female adults >65 years determined by the indicator amino acid oxidation technique is higher than current recommendations. J Nutr 145(1):18-24, 2015. 32. Ravussin E, Schutz Y, Acheson KJ, Dusmet M, Bourquin L, Jequier E. Short-term, mixed-diet overfeeding in man: no evidence for "luxuskonsumption". Am J Physiol 249(5):E470-477, 1985. 33. Ribeiro AS, Avelar A, Dos Santos L, Silva AM, Gobbo LA, Schoenfeld BJ, Sardinha LB, Cyrino ES. Hypertrophy-type Resistance Training Improves Phase Angle in Young Adult Men and Women. Int J Sports Med 38(1): 35-40, 2017. 34. Roberts SB, Young VR, Fuss P, Fiatarone MA, Richard B, Rasmussen H, Wagner D, Joseph L, Holehouse E, Evans WJ. Energy expenditure and subsequent nutrient intakes in overfed young men. Am J Physiol 259(3 Pt 2):R461-469, 1990. 35. Roberts SB, Young VR, Fuss P, Fiatarone MA, Richard B, Rasmussen H, Wagner D, Joseph L, Holehouse E, Evans WJ. Energy expenditure and subsequent nutrient intakes in overfed young men. Am J Physiol 259(3 Pt 2):R461-469, 1990. 36. Rosqvist F, Iggman D, Kullberg J, Cedernaes J, Johansson H, Larsson A, Johansson L, Ahlstrom H, Arner P, Dahlman I, Riserus U. Overfeeding polyunsaturated and saturated fat causes distinct effects on liver and visceral fat accumulation in humans. Diabetes 63(7):2356-2368, 2014. 37. Rosqvist F, Iggman D, Kullberg J, Cedernaes J, Johansson HE, Larsson A, Johansson L, Ahlstrom H, Arner P, Dahlman I, Riserus U. Overfeeding polyunsaturated and saturated fat causes distinct effects on liver and visceral fat accumulation in humans. Diabetes 63(7):2356-2368, 2014. 38. Salans LB, Horton ES, Sims EAH. Experimental Obesity in Man: Cellular Character of the Adipose Tissue. J Clin Invest 50(5):1005-1011, 1971. 39. Schoenfeld BJ. The mechanisms of muscle hypertrophy and their application to resistance training. J Strength Cond Res 24(10):2857-2872, 2010. 40. Siervo M, Fruhbeck G, Dixon A, Goldberg GR, Coward WA, Murgatroyd PR, Prentice AM, Jebb SA. Efficiency of autoregulatory homeostatic responses to imposed caloric excess in lean men. Am J Physiol 294(2):E416-424, 2008. 41. Sobrecases H, Le KA, Bortolotti M, Schneiter P, Ith M, Kreis R, Boesch C, Tappy L. Effects of short-term overfeeding with fructose, fat and fructose plus fat on plasma and hepatic lipids in healthy men. Diabetes Metab 36(3):244-246, 2010. 42. Spillane M, Willoughby DS. Daily Overfeeding from Protein and/or Carbohydrate Supplementation for Eight Weeks in Conjunction with Resistance Training Does not Improve Body Composition and Muscle Strength or Increase Markers Indicative of Muscle Protein Synthesis and Myogenesis in Resistance-Trained Males. J Sports Sci Med 15(1):17-25, 2016. 43. Stanhope KL, Schwarz JM, Keim NL, Griffen SC, Bremer AA, Graham JL, Hatcher B, Cox CL, Dyachenko A, Zhang W, McGahan JP, Seibert A, Krauss RM, Chiu S, Schaefer EJ, Ai M, Otokozawa S, Nakajima K, Nakano T,

Int J Exerc Sci 10(8): 1275-1296, 2017
International Journal of Exercise Science http://www.intjexersci.com 1296
Beysen C, Hellerstein MK, Berglund L, Havel PJ. Consuming fructose-sweetened, not glucose-sweetened, beverages increases visceral adiposity and lipids and decreases insulin sensitivity in overweight/obese humans. J Clin Invest 119(5):1322-1334, 2009. 44. Tang M, McCabe GP, Elango R, Pencharz PB, Ball RO, Campbell WW. Assessment of protein requirement in octogenarian women with use of the indicator amino acid oxidation technique. Am J Clin Nutr 99(4):891-898, 2014. 45. Tchoukalova YD, Votruba SB, Tchkonia T, Giorgadze N, Kirkland JL, Jensen MD. Regional differences in cellular mechanisms of adipose tissue gain with overfeeding. Proc Natl Acad Sci USA 107(42):18226-18231, 2010. 46. Teske JA, Billington CJ, Kotz CM. Neuropeptidergic mediators of spontaneous physical activity and non-exercise activity thermogenesis. Neuroendocrinol87(2):71-90, 2008. 47. Webb P, Annis JF. Adaptation to overeating in lean and overweight men and women. Hum Nutr Clin Nutr 37(2):117-131, 1983. 48. Welsh JA, Sharma AJ, Grellinger L, Vos MB. Consumption of added sugars is decreasing in the United States. Am J Clin Nutr 94(3):726-734, 2011. 49. Withers RT, LaForgia J, Pillans RK, Shipp NJ, Chatterton BE, Schultz CG, Leaney F. Comparisons of two-, three-, and four-compartment models of body composition analysis in men and women. J Appl Physiol (1985) 85(1):238-245, 1998. 50. Yki-Jarvinen H. Nutritional Modulation of Non-Alcoholic Fatty Liver Disease and Insulin Resistance. Nutrients 7(11):9127-9138, 2015.

Int J Exerc Sci 10(8): 1275-1296, 2017
International Journal of Exercise Science http://www.intjexersci.com 1297