the effects of china s local government investment on...
TRANSCRIPT

The Effects of China’s Local Government Investment on
Economic Growth and Excessive Investment Issue
By
Zhang Jinxuan
51212617
September 2013
Report Presented to the Higher Degree Committee
ofRitsumeikan Asia Pacific University
in Partial Fulfillment of the Requirements for the Degree of
Master in Development Economic, International Cooperation Policy

2
Declaration
I hereby declare that the report The Effects of China’s Local Government
Investment on Economic Growth and Excessive Investment Issue: Exploring
Adaptation Measures is the result of my original research effort and is
conducted under the guidance of my academic supervisor. And I have tried my
best to cite all quoted theory and contents with proper referencing procedure.

3
Table of Contents
1 Introduction .......................................................................................................... 4
1.1 Objectives ...................................................................................................................... 4
1.2 Background of China’s Economy and Government-oriented Investment ........... 4
1.3 Main Policies of China’s Government Investment and the competition between
central government and local government ...................................................................... 5
2 Key Concepts and Literature Review .................................................................. 7
2.1 Concepts of Government Investment ....................................................................... 7
2.1.1 The Factors of Investment ................................................................................... 7
2.1.2 The Function of Government Investment .......................................................... 7
2.2 The definition of China’s fixed asset investment ..................................................... 8
2.3 China’s fiscal decentralized system reform ............................................................ 10
2.4 Local government debt .............................................................................................. 12
2.5 Literature Review ....................................................................................................... 12
3 Methodologies .................................................................................................... 14
4 Analyses and Design ......................................................................................... 15
4.1 The analysis of the Scale of China’s government-oriented investment ............. 15
4.2. The analysis of the portfolio of China’s government-oriented investment ....... 20
4.21 Analysis of Regional Portfolio ............................................................................ 20
4.22 Analysis of Industrial Portfolio ............................................................................ 20
4.23 Analysis of purpose Portfolio .............................................................................. 21
4.3 The econometric model and variable explanation of effects of government
investment on economic growth ..................................................................................... 22
4.31 The econometric model of the effects of local government investment on
economic growth after considering the tax-sharing system established in 1997 23
4.32 Econometric model of the effects of local government investment on
economic growth after considering that the establishment of finance policy in
2000 made the local governments to have more incentive to invest in
infrastructure construction ........................................................................................... 24
4.33 Variable explanation ............................................................................................ 25
4.4 Data and Empirical Results ...................................................................................... 26

4
4.41 Data ........................................................................................................................ 26
4.42 Empirical Results ................................................................................................. 28
4.43 The analysis of Empirical Results ..................................................................... 30
5 Finding and Discussion ..................................................................................... 30
5.1 The roles of local government after fiscal decentralization reform ..................... 30
5.11 The intrinsic mechanism of local government investment ............................. 31
5.12 The characteristics of China’s local government investment ........................ 33
5.2. The effects of government excessive investment ................................................ 35
5.21 Promote the urbanization.................................................................................... 35
5.22 Real Estate Bubble .............................................................................................. 36
5.23 Local government debt issue ............................................................................. 37
5.24 Inflation .................................................................................................................. 39
6. Conclusions and Recommendations ............................................................... 42
Reference: ............................................................................................................. 45

1
Acknowledgements
I wish to acknowledge my dear supervisor, Professor Yamamoto Susumu, my
classmate Nigina and my colleagues in my Department and Ministry of
Commerce, and Professor from Nang Chang University, Wang Jun, for all of
their patience, suggestions, and guidance during this process.
Secondly, I want to deliver my sincere acknowledgement to the Chinese and
Japanese government, JICA, JICE and APU. As a Japanese Grant Aid for
Human Resources Development Scholarship Program fellow, I may not have
this study chance and may not finish the report without the approval of Chinese
government, the financial support from Japanese government and JICA, the
assist and help of JICE and the academic support from APU.
Further acknowledgement goes to my family and my close friends for all their
words of encouragement and support over the past months.

1
List of Tables
Table 1 The annual GDP growth(1997-2011)........................................................... 15
Table 2 The comparative between government investment rate and residential
consumption rate ...................................................................................................... 16
Table 3 Local government investment share the proportion of total government
investment and total investment ............................................................................... 18
Table 4 Regional portfolio in 2011 ............................................................................ 20
Table 5 The Proportion of Portfolio .......................................................................... 21
Table 6 Y: GDP ........................................................................................................ 26
Table 7 G: investment expenditure of local governments ......................................... 26
Table 8 Population ................................................................................................... 27
Table 9 K: capital stock ............................................................................................ 27
Table 10 H: human capital stock .............................................................................. 28
Table 11 Empirical Results 1 ................................................................................... 29
Table 12 Empirical Results 2 ................................................................................... 29
Table 13 The estimation data of China’s local government debt .............................. 38
Table 14 Investment Growth Rate Compare with Inflation Rate from 1979-2011 ..... 41

2
List of Figures
Figure 1 China’s government investment (1997-2011) ............................................ 17
Figure 2 China’s government investment growth ..................................................... 18
Figure 3 The Proportion of Industry Portfolio (%) ..................................................... 20
Figure 4 Local government investment/GDP ........................................................... 23
Figure 5 The internal system of local government investment ................................. 31
Figure 6 Real constant quality residential land price index for Beijing, 2003-2010 ... 36
Figure 7 Investment Growth Rate Compare with Inflation Rate from 1979-2011 ...... 40

3
Abstract: Based on the panel data of 3 different development-level provinces
in the year of 1995-2011, this paper examines the effects of the local
government investment on economic growth. The empirical result shows that
the local government investment plays a significant positive role in economic
growth and employment. However, while the proportion of local government
investment to GDP had a remarkable rise after 2000, the elasticity of local
government investment on economic growth declined, which shows that there
is a big room for raising the efficiency of local government investment.
This paper also argues that the role of local governments as investors must be
weakened, and local governments of different levels should lessen direct
economic intervention and concentrate on public regulation.
Key Words: Government Investment, Investment Efficiency, Excessive
Investment Issue
4
1 Introduction
1.1 Objectives
This research will be based on the previous research achievements and
especially appreciate research of Qin D and Song HY on the China’s efficiency
of government investment[1]. Many researchers have been scientifically
analyzed the links among the macroeconomic factors and how they impact
each other in China’s economic circumstance. Some Macroeconomic theories
can explain the framework of the general government investment behaviors.
The databases of IMF and China’s governmental economic sectors provide
the most reliable data and information about the Consumption expenditures
and Gross investment.
This research is going to describe the status quo of Chinese
government-oriented investment, analyzing the scale and the portfolio of
government investment. Base on the calculated data, the major affereffects of
over-investment will be identified in this article, in the meantime, based on the
panel data of 3 different development-level provinces in the year of 1995-2011,
this paper examines and analyses the effects of the local government
investment on economic growth by Cobb-Douglas production function. Several
technical matters which concerned with local government fixed asset
investment will be analyzed. In order to find out the further prospect trend, the
possible trends of China’s government-oriented will be predicted and base on
that, this article will provide several suggestions concerned with how to create
a long-term, healthy and stable development trajectory.
1.2 Background of China’s Economy and Government-oriented
Investment
Between 1978 and 2011, China growth has been remarkable, at nearly 10
percent per year. Especially after the financial crisis at 2008, China’s economy
still growth rapidly, becoming the powerhouse of world economy. According the
annual report of IMF, the total output 5978.63 billion of China surpassed Japan
to be the second largest economy in 2010. As we all know, China’s economy
relied heavily on investment, consumption and export. Because of the financial
crisis and appreciation of RMB, the proportion of consumption and export was
declining. In order to keep rapid growth, Chinese government made a “4000
billion investment plan” to stimulate the economy, leading the investment
accounted 70.1% of contribution rate of GDP. In fact, China’s investment
account for more than 57 percent of its GDP compared with 21 percent for
Japan. By contrast, domestic demand as a proportion of GDP remains low by
international standards. The main reason driving this extremely high
5
investment is excessive government-oriented investment.
In 2011, government investment accounted for 76.1 percent of total investment,
and 57 percent of GDP, surpasses the share of total investment in GDP of
most other countries. This data has resurrected a debate as to whether the
economy, particularly investment, is “overheating”, and whether the investment
ratio is “too high”.
Behind high investment is the pursuit for GDP growth by the government.
There are some difference conceptions concerned with government-oriented
investment. Government-oriented investment, consisting of various fixed
assets, is a fiscal approach by which fiscal funds are invested in industry
cultivation and economic development to lay foundation for various industries,
boost economy and facilitate the implementation of nation-wide industry
policies. Government plays a main role in government-oriented investment
activities and it’s a very important part of total investment. To summarize the
definition of government investment, two main conceptions can be list here.
First, investments are divided by the different source of capital,
government-oriented investment involves all of the fixed asset investment,
special construction fund, national debt which expend from the financial
budget. Second, according the main actor of investment, all of the fixed
asserts which constructed and purchased by government or state-own
enterprises belong to government-oriented investment. According to the
definition of fixed assets investment by China’s National Statistic Bureau, it
included 8 categories: state own investment, collective investment, private
investment, pooling investment, joint-stock investment and foreign investment,
and all the data concerned government investment is derived from the statistic
of state own investment.
1.3 Main Policies of China’s Government Investment and the competition
between central government and local government
In 1979, < The Report of capital construction appropriation>, which was
designed for use the Compensation funds to manage government financial
investment, was approved by China’s State Council. In 1988, < The Reform
Plan for the Investment Management System> was approved by State Council,
the main point of this plan concerned in the field of financial source, the bound
of government investment and the operation of government investment,
leading the development of government investment fluctuated widely. Follow
the requirement of South tour speech by China’s leader Deng Xiaoping, the
state council decided to promote the proceed of government investment
reform, In 1992, < Regulations on ownership transformation of State-run
Enterprises> was decreed to reduce the numbers of State-run Enterprises. In
this period, more and more foreign and private capitals enter investment
market; the increase rate of government investment was declined. From 1998,

6
China started the proactive fiscal policy to stimulate domestic demand
because of the influence of Asia Financial Crisis. In July 2004, < Several
Decisions about the Investment System Reform> was approved, and the
influence of this important document was lasted until now.
The transiting process of China from traditional planned economy to market
economy is also a process for governments to change their roles. In this
transition process, China takes a path of gradual reformation, and the central
government gradually loses its direct control on economy and lessens its
administrative power on state-owned economy. However, the Central
Government did not give enterprises the complete administrative power;
instead, it passed the administrative power to local governments. Thus, the
local governments gained more power in economic decision, in examining
large investment projects, and in issuing license and in controlling land
resources. This made the local governments have great power on intervening
local economic development.
On the other hand, the establishment of fiscal decentralization system in a
great degree intensified the economic interest of local governments, which
urged the local governments to have more incentive to develop local economy.
Under the fiscal decentralization system, the revenue of local governments
highly depends on the local economic development. Only when the local
economy has a good performance, could the tax base be expanded, and
revenue will be increased, so that the local governments have great incentive
to develop the local economy. In addition, the growth rate of GDP and the
employment situation are very important indexes for examining officials'
achievements; this further strengthens the incentives of local officials to
develop local economy. Thus, local governments of different levels usually play
a role of entrepreneurs in promoting local economic development. The most
direct, effective measure for local governments to develop local economy is to
raise local investment level through various ways.
In this way, the proportion of the investment projects of local governments to
national fixed investment grows continuously; the investment expenditure from
local governments themselves keeps a high level. With the establishment of
fiscal decentralization, the capability of local governments in controlling the
revenues within budget increases remarkably, in addition, local governments
have a large portion of rights in disposing the revenues both outside the
budget and outside the system; this makes local governments have finance
resources to invest in infrastructure construction.
In fact, in the total governmental investment, the proportion of investment
within budget decreases increasingly, and that outside the budget increases
increasingly, and the most of investment outside the budget is raised and used

7
by local governments. Moreover, in order to attract more investment from
outside so as to promote the local economic development, while the revenues
both within and outside the budget are insufficient for the demand of
investment expenditures, some local governments take a path of raising a loan
from outside to speed up the urban development. In the past years, many local
governments were engaged in the so called “city management”, speeded up
the city development, renewed the infrastructure in cities in large scale, and
established economic developing areas. These investments take a large
portion in national total investment. From above analysis we can see that local
governments have been one of the main investors in China's economic life. At
present, China's fixed investment has changed from that the central
government plays a dominant role to that local government play a dominant
role. Local governments of different levels have become an important
participant in China's economic life. We must consider the effects of local
government investment on economic growth.
2 Key Concepts and Literature Review
2.1 Concepts of Government Investment
In any society, the total investment is constituted by two parts the government
investment and non-governmental investment. Government investment is a
kind of government behavior which transfers capital to real assets in order to
perform its function and satisfy the public demand. Government investment
can fulfill the goals of development both society and economy.
2.1.1 The Factors of Investment
In an economy, what is the reasonable proportion between government and
non-government? And it depends on following factors:
a. Economic system. In general, a planned economy always relies on
government investment relatively to non-government investment. Market
economy usually emphasize on non-government investment.
b. Stage of economic development. In development countries,
non-government investment account a higher proportion than government
investment, and in less-development countries and mid-income countries,
the situation goes opposite.
2.1.2 The Function of Government Investment
Government investment plays an important macro-oriented role in the society
resource distribution as an essential measure for macroeconomic regulation
which can make up somewhat market failure, promoting the economy

8
development and optimizing economy structure. Its repercussion often most
manifest in the following aspects:
a. To balance societal investment. Under the market economic condition, the
government investment cannot occupy a dominate position, but it still can
balance the equilibrium of totally societal investment. When the societal
investment trend to expand and lead to inflation, government can decrease the
amount of investment to adjust the situation of investment expansion. During a
depression circumstance, the government can increase amount investment to
extend societal demand.
b. To adjust the investment structure and guide the direction of societal
investment. The government formulates different industrial policies which
ensure the order to develop different industry due to different step of national
economic development. In this case, the government can pay more attention
to invest some industries which have huge societal benefits but less profit.
These behaviors are beneficial to optimize investment structure and balance
the proportion among different industries. In a market economy, government is
not the unique investment object, even though the key projects also need
non-government investment to entry these projects, but the government still
plays a good demonstration and guide role. Besides the directly investment,
government also can utilize several indirection measures (subsidy, tax credit
and so on) to support the key industries, leading non-government investment
entry these industries.
c. To create a good investment environment. To a great extent, the level of
investment environment relies on the conditions of infrastructure facilities.
Public facilities and societal infrastructure are not highly commercialization that
means the virtuous circle of the investment input and output cannot be realized
in these fields. As a result, it’s a obligation for government to invest public
facilities and societal infrastructure.
d. To support the national key project. Government can provide guarantee to
support key project, such as financial support, labor support. The government
can focus on public-benefit project, concentrating the effort on investing
infrastructure projects and pillar industries, formulating policies to promote
assets reorganization.
2.2 The definition of China’s fixed asset investment
The amount of fixed investments is the workload, expressed with currency, of
activities carried out for building and buying fixed assets. It a comprehensive
indicator reflecting scale, speed, proportional relationship and using direction
of fixed investments. Based on economic types, fixed investments of the whole
society can be divided into state-owned investment, collective investment,
individual investment, joint management investment and joint-stock system

9
investment, foreign businessmen investment as well as Hong Kong, Macao
and Taiwan businessmen investment and other fixed investments. Based on
management channels, fixed investments of the whole society can be divided
into four parts, namely, capital construction, transformation and renovation,
real estate development investment and other fixed investments.
Capital construction
Capital construction refers to those newly-built and expanded projects as well
as related work that is launched by enterprises, public institutions and
administrative units mainly in order to enlarge production capacity or
engineering benefit. In terms of comprehensive range, it includes those capital
construction projects with a total investment of over RMB 500,000 Yuan
(including 500,000 Yuan, similarly hereinafter).
Specifically including:
a. those construction projects included in the central and local plan for capital
construction of this year as well as those projects without having been included
in the plan but to go on with construction this year in the manner of carry-over
investment within the previous plan for capital construction (including making
use of inventory equipment materials of capital construction) ;
b. those new projects arranged by the investment combination within the plan
for capital construction and the plan for transformation and renovation of this
year, those expanded projects whose new production capacity (or project
efficiency) has achieved the standard of large and medium-sized projects as
well as those whole factory removal projects that are aimed at changing the
layout of productivity;
c. those newly-built, expanded and restored projects included neither in the
plan for capital construction nor in the plan for transformation and renovation
by state-owned units but whose total investment is over RMB 500,000 and
those whole factory removal projects that are aimed at changing the layout of
productivity as well as those projects that are launched by administrative units
and public institutions to increase business buildings and by administrative
units to build more welfare facilities.
Transformation and Renovation
Transformation and renovation refers to the updating for fixed assets and
transformation for existing technologies by enterprises and public institutions
as well as the corresponding engineering and related work (excluding major
repairs and maintenance engineering). In terms of comprehensive range, it
includes those projects with a total investment of over RMB 500,000 Yuan.
Specifically including:
10
a. those transformation and renovation investors (projects) included in the
central and local plan for transformation and renovation of this year as well as
those projects without having been included in the plan but to go on with
construction this year in the manner of carry-over investment within the
previous plan for transformation and renovation;
b. those projects jointly arranged by the investment combination within the plan
for transformation and renovation and the plan for capital construction of this
year and aimed at transforming and upgrading the original facilities
technologically and those projects that are aimed at building more major
production workshops, factory branches, etc., but whose new production
capacity (or project efficiency) hasn’t achieved the standard of large and
medium-sized projects as well as those removal projects for meeting the need
of urban environmental protection and safety production;
c. those rebuilt, transformed and innovated projects included neither in the
plan for capital construction nor in the plan for transformation and renovation
by state-owned units but whose total investment is over RMB 500,000 and
those removal projects for meeting the need of urban environmental protection
and safety production.
Investment in Real Estate Development
It refers to the investment in buildings and supporting service facilities that are
uniformly developed by real estate development companies, commercial
housing construction companies and other real estate development company
legal person units as well as other units that are attached to other legal person
units and actually engaged in real estate development or business activities,
including agent and return for demolition dwelling houses, factories,
warehouses, restaurants, hotels, resorts, office buildings, and the investment
in and development projects (such as roads, water supply, water drainage,
power supply, heating, communications, land grading and other infrastructure
engineering) . Pure land trading activities are not included in such investment.
Other Fixed Investments
It refers to those activities for building and buying fixed assets, which are not
included in capital construction, transformation and renovation and real estate
development investment.
2.3 China’s fiscal decentralized system reform
In 1997, the Central Government started the complement reformation of
finance and tax, introduced tax-sharing system national widely, and
established separated finance system based on tax sharing system, this
became a milestone turning from “administrative decentralization” to
“economic decentralization”. Under the new system, tax is divided into three

11
kinds: central tax, local tax and sharing tax. Central government and local
government divided the responsibilities; each uses different taxes; and at the
same time, many clearly and professionally divided sharing taxes are
preserved. Each government could make its own budget according to its
revenue and expenditure. The essence is to determine the corresponding
financial power of the central government and local governments according to
their power of affairs and then form a revenue system between the central
government and local governments by means of dividing tax categories. It is a
fiscal management system model universally implemented by market
economy countries.
The first one is the division of affair power and expenditure between the central
government and local governments. According to the current division of affair
power, the central finance mainly undertakes the expenditure necessary for
national security, diplomatic affairs and central state organ operation, the
expenditure for adjusting the national economic structure, coordinating
regional development and implementing macroeconomic regulation and the
expenditure necessary for the development of social undertakings directly
controlled by the central authorities. Local finance mainly bears the
expenditure necessary for the operation of the local government bodies and
the expenditure necessary for the development of the local economy and
social undertakings.
The second one is the division of revenue between the central government
and local governments. Based on the principle of combining affair power and
financial power, the central revenue and local revenue are divided according to
tax categories. Those categories necessary for maintaining national rights and
implementing macroeconomic are classified into central tax; those major
categories directly related to economic development into shared tax of the
central government and local governments; and those suitable for local
collection into local tax which can enrich local tax types and increasing the
revenue of local tax. Two sets of tax agencies, central and local, are
established. The central tax office collects central tax and shared tax while
local tax agencies collect local tax.
The third one is the intergovernmental fiscal transfer payment system. On the
basis of re-dividing central revenue and local revenue, the system of tax
distribution has adjusted the intergovernmental fiscal transfer payment
quantity and form. In addition to retaining fixed subsidies by the central
government for local finance under the original system, special subsidies and
local tax delivery, more attention has been paid to establishing the tax return
system of the central government to local governments according to the new
situation of broadened revenue scope and more quantities. Specifically, when
central tax has been turned over, the central government returns a part of

12
revenue to local government for use through central financial expenditure.
The last one is budgeting and scheduling. After the system of tax distribution
has been implemented, both the central government and local governments
are required to prepare their budget in accordance with the new requirements.
At the same time, the amount of the central tax returns shall be deducted from
the original local delivery and then a “capital scheduling proportion” shall be
verified based on the proportion that the net amount after deduction accounts
for the estimated consumption tax and VAT of that year. Based on the
proportion, the national treasury will appropriate consumption tax and the
central government will share VAT with local governments.
2.4 Local government debt
Local government debt is the public debt which issued by local government
which pledged by governmental credit. It’s a kind of fiscal measure to raise
funds for local government to plan, manage, and arrange, and these funds are
listed in local fiscal budget. In nowadays China, there are 4 main kinds of local
government debt as following:
a. International debt
It means local government applies loan to invest to some infrastructure
projects from foreign governments and fiscal organizations through local
international trust and investment companies, and it is guaranteed by local
fiscal income.
b. Fiscal debt
When the fiscal budget of local government is unbalanced, and still has to
increase expenditure, China’s local government always applies loan from
higher level government to fulfill the demand, and settling the debt by next few
years’ fiscal income.
c. Business debt
In order to fulfill the demand of local infrastructure and public utility
construction, the local government or the fiscal investment organizations which
belong to the local government borrow funds directly from domestic policy
banks and commercial banks.
d. Raising-funds debt
This kind of debt means the local state-own fiscal investment firms use the
government credit as guarantee to attract the social idle capital, forming local
government debt.
2.5 Literature Review

13
A World Bank report[2] points out that though China has a single governmental
system, China's system has a strong character of federalism because China's
finance system is highly decentralized on so many different levels as Central
Government, 31 provinces, 331 cities, 2,109 counties and 44,741 towns,
therefore. Qian Yingyi and Weingast[3] regard this federalism of China, which
formed from fiscal decentralization, as market preserving federalism with
Chinese character. Qian Yingyi and Roland[4] point out that the incentive of
government to subside inefficient projects is determined by the tradeoff
between political interests and economic costs, and the economic costs
depend upon the degree of governmental decentralization. They insist that,
with the free movement of nonstate-owned capitals, fiscal decentralization has
the effect of hardening the budget restriction of the state-owned enterprises
controlled by local governments. This is because that the competition of
attracting investment of local governments may generate externalities. This
makes the opportunity cost of subsiding the inefficient state-owned enterprises
to be high, therefore weakens the incentive of local government to save losing
enterprises. They also believe that such government organizational
reformation as fiscal decentralization is an important aspect for the transition
from planning economy to marketing economy. Lin Yifu and Liu Zhiqiang[5],
employing provincial data, assessed the effects of China's fiscal
decentralization started from 1990s on the economic growth. They found that,
after controlling the effects of other reformations occurred at the same time,
fiscal decentralization raises the provincial GDP growth rate in per capita
aspect, this shows that fiscal decentralization promotes economic growth
through raising the efficiency of resource distribution. They believe that the
positive effects of fiscal decentralization on economic development are due to
that, relative to central government, the provincial governments have
information advantage in satisfying local demand; thus, they could provide
better public goods and services which have large effects on local economic
environment. Zhang Weiying and Su Shuhe[6] argue that the decentralization
happening in the early of 1980s led to regional competition which led to
privatization. The establishment of decentralized system accelerates the
incentive of local governments to pursue profit, which causes the high
competition between local governments, which facilitates the market oriented
movement of the whole economy. Due to the intense regional competition in
the product market, each region has to make efforts to decrease its production
cost so as to occupy a space in the market competition. In order to effectively
cut the cost, local governments make such choice as giving the whole or part
of share to managers to give them incentives, which accelerates the growth of
investment and economic development.
There are also some writers who have noted the negative effects of local
government investing behavior. As to the aspect of reducing the efficiency of
social resources distribution, Lu Ming, Chen Zhao and Yan Ji [7]who take the

14
angle of the isolation of regional economy, Xu Ying [8] who take the angle of
conflict of regional economy, Hu Rongtao, Zhang Xuying and Su Mingbing [9]
who take the angle of the similarization of industrial structure, with game theory,
have respectively analyzed the strategic behavior of local governments
pursuing self-profit which led to the loss of social resources distribution
efficiency. The Research Group of “The Competition of Chinese Local
Governments” analyzed the negative performance of local government in
competition, and indirectly showed the negative effects of local governments
investing behavior on economic growth and employment with the insight that
local protectionism blocked the basic regulation effect of market mechanism
on the resources distribution and use, that the local governments only pursued
economic interests but ignored the social interests and resulted the
environment is worsen, and that the land sell price was so low, even free, that
land resource was over and inefficiently used.
3 Methodologies
As a descriptive research, this article introduces the concepts of government
investment, China’s fixed asset investment, fiscal decentralization system
reform, local government debt and Saving-Investment curve, describes the
status quo of China’s government investment. The research also focuses on
find out the reasons lead to this phenomenon and utilizes some relevant
concepts and theories of macroeconomic to indentify the negative impacts and
challenges on China’s economy. At last, it tries to raise some suggestions to
resolve this issue.
Information, knowledge and data used in this report are collected in the
following methods. The knowledge and concepts which used in literature
review chapter and those related with China’s government investment are
derived from recent books, articles and government websites, it need to
mentioned that some information used are translated from the original papers
that written by Chinese. Almost of data and information used related with
government investment and fixed asset investment are derived from the
annual books of China’s Financial Ministry, China’s Development and Reform
Commission and China’s National Statistic Bureau. All introduction and
analysis regard to excessive investment issues are based on the investigation
and research of China’s economy run. Field works were carried out in ways of
archives checking, interviews with related departments in the database online
searching etc.

15
4 Analyses and Design
4.1 The analysis of the Scale of China’s government-oriented investment
Table 1. The annual GDP growth (1997-2011)
Year Annual % GDP Growth
1997 9.3
1998 7.8
1999 7.6
2000 8.4
2001 8.3
2002 9.1
2003 10.0
2004 11.1
2005 10.2
2006 11.6
2007 11.9
2008 9.0
2009 9.1
2010 10.3
2011 9.2
China’s economy growth declined after Southeast Asian financial crisis in 1997
and Subprime mortgage crisis in 2008. But in general, between 1997 and 2011,
the average GDP growth is 9.5%. This is attributable to several reasons. First,
the recovery of the world economy, and China’s accession to the WTO in 2001
provided a favorable external environment for the recovery of the export
growth. Second, increases in the number of private enterprises became a new
driving force for the growth of the Chinese economy. In addition, in many
heavy industrial sectors, including steel and chemical products, private capital
witness rapid expansion.

16
Before 1997, the purpose of the low interest rate policy was mainly to protect
the state run enterprises. However, from 1997, maintaining low interest rates
became an important policy means to stimulate GDP growth. During
1997-2003, the interest rate was kept at a positive because the economy was
experiencing deflation. After that, from 2003 to now, although prices increased
at a fast pace, interest rates were still kept at a low level and became negative
as a result. In the housing market, combined with high growth and a high
saving rate, low interest rates further encouraged the expansion of bubble. As
for investment, the low interest rates reduced capital costs, and exaggerated
investment returns, contributing to government investment.
Usually two types of indicators were reflected the scale of the investment, one
is total investment in fixed assert of the whole society. Another is investment
rate which reflects the ratio of total fixed asset investment share of GDP over
the same period in the whole society.
Table 2. The comparative between government investment rate and residential
consumption rate
Year Total government investment rate Residential
consumption/GDP
1997 34.1 45.3
1998 36.9 45.3
1999 37.1 46.1
2000 37.3 46.4
2001 38.9 45.2
2002 41.9 43.7
2003 47.6 41.7
2004 37.7 39.8
2005 48.6 38.0
2006 52.5 34.2
2007 53.6 30.7
2008 54.1 34.1
2009 70.1 35.9

17
2010 47.8 34.1
2011 47.0 36.8
Accompanying this new round of high growth was rapid growth in fixed asset
investment. The proportion of fixed asserts investment in GDP reached a
record high level during these years. As table 2 shows, during 1997 -2011, the
average annual growth rate of the investment rate exceed 25 percent, with the
investment rate increasing from 34.1 percent in 1997 to 47 percent in 2011.
While the investment rate rose continuously, there was a persistent decline of
residential consumption as a share of GDP, decreasing from 45.3 percent to
36.8 percent from 1997 to 2011, that means residential consumption as a
portion of GDP was 8.5 percentage points lower than the fixed arrests
investment rate in 2011.
Figure 1. China’s government investment (1997-2011)
0
1000
2000
3000
4000
5000
6000
7000
1997 1998 1999 2000 2001 2002 2003 2004 2005 2006 2007 2008 2009 2010 2011
China's government investment
(Billion RMB)
China's government investment

18
Figure 2. China’s government investment growth
Source: China’s National Statistic Bureau Annual Book
Notes: The figures in table 1 is real terms, fugue 2, 3, 4 are nominal terms.
Table 3. Local government investment share the proportion of total
government investment and total investment
Year
Local government
investment/Total
government
investment %
Local government
investment/Total
investment %
1997 51.2 19.8
1998 55.6 25.3
1999 60.7 29.9
2000 60.4 30
2001 60.4 32.8
2002 51.1 39.6
2003 62.7 34.7
2004 63.5 35.7
2005 71.1 39.3
2006 78.9 46.3
0
5
10
15
20
25
30
35
1997 1998 1999 2000 2001 2002 2003 2004 2005 2006 2007 2008 2009 2010 2011
China's government investment growth (%)
China's Government Investment Growth (%)

19
2007 79.9 47.8
2008 81.6 59.2
2009 94.1 72.9
2010 86.3 66.4
2011 84.2 65.2
Source: China’s National Statistic Bureau Annual Book
From Table 4 and Table 5 we can see that, after the establishment of
tax-sharing system, the proportion of local government investment to GDP
tends to rise. This shows that after the establishment of tax sharing system,
the local government investment is strengthened for the following reasons:
after the establishment of tax-sharing system, while the revenue of central
government increases remarkably, the local government's power to finance
has not been expanded correspondingly, and has been even shrunken, but at
the same time, the responsibility of local governments is expanded; this
problem is worse at county and town level. For local governments, the only
way to gain more finance and to satisfy the demand of fiscal expenditure is to
develop the local economy and to enlarge the total economy, so this makes the
local governments have great incentive to develop the local economy, and the
one of important measures of doing so is to attract more and more investment
from outside. However, attracting investment needs a good investment
environment. This is why local governments increased investment in
infrastructure construction and established a great deal of economic and
technological developing areas. A direct result of this practice is that the
proportion of local government investment to GDP rises increasingly after the
establishment of tax-sharing system.
The proportion of local government investment to GDP speeded up its
increase after 1998. We ascribe this to that after 1998, China had a positive
fiscal policy and increased the investment in infrastructure constructions,
which greatly aroused the enthusiasm of local governments to be engaged in
city infrastructure constructions with the simulation of central government loan.
Many projects supported by the central government loan required local
government to provide some auxiliary capital too, so the local governments
who have won government loan project had to get its auxiliary capital through
bank loan and other ways. It evidently stimulated investment expenditure of
local governments; in addition, for some local governments who is qualified,
the providence of auxiliary capital means great possibility of winning the
support of central government loan, which in great degree stimulated these
local governments to strive for this kind of loan, because for local governments,
the central government loan is free, and what they need to do is to raise the

20
auxiliary capital. This stimulated the investment expenditure of local
governments. This is attributed to the following factor: (a) expansive fiscal
policy enacted by central government; (b) the growth strategy of local
government stressing domestic demand; (c) rapid expansion in local
government fiscal revenue.
4.2. The analysis of the portfolio of China’s government-oriented
investment
Investment portfolio refers to the proportion of various assets in total
investment in a particular period of time. Government investment portfolio
refers to the proportion of various assets in total government investment in a
particular period of time. To investigate this issue from different angles and at
different levels, the investment portfolio can be divided by regional type,
industrial type and purpose type. This article will analyze government
investment in these three types of structure.
4.21 Analysis of Regional Portfolio
Table 4. Regional portfolio in 2011 (Unit: Billion RMB)
Eastern Economy Region Per Capita Government Investment 6682.7
The Proportion of Total Investment 38.83%
Middle Economy Region Per Capita Government Investment 5798.4
The Proportion of Total Investment 33.52%
Western Economy Region Per Capita Government Investment 3997.3
The Proportion of Total Investment 23.71%
Source: China’s National Statistic Bureau Annual Book
According to Table 5, eastern economy region is higher than middle and
western region in both indexes. That demonstrates the gross government
investment and the growth rate in eastern economy region far exceed middle
and western region because the policy give priority to the development of the
southeast coastal areas from the Opening up Reform in 1979.
4.22 Analysis of Industrial Portfolio
Investment industrial structure refers to the proportion of investment in
different industries and sections. Since the founding of PRC, the government
investment highly tilts to second industry, especially heavy industry,
compressing the primary industry. This situation leads to the heavy industry
developed rapidly and suppresses agriculture and tertiary industry.
Figure 3. The Proportion of Industry Portfolio (%)

21
Source: China’s National Statistic Bureau Annual Book
According the diagram, the investment percentage of the tertiary industry has
dropped markedly, and secondary industry growth rapidly in 1997 and 1998,
but the proportion of agriculture still at a low level fewer than 10 percent.
4.23 Analysis of purpose Portfolio
Government investment can be divided into investment in infrastructure
investment, renovation investment and real estate investment by different
purposes.
Table 5. The Proportion of Portfolio (%)
Year Infrastructure
Investment (%)
Renovation
Investment (%)
Real Estate
Investment (%)
1997 55.24 19.11 25.65
1998 55.25 19.09 25.66
1999 58.38 18.59 23.03
2000 56.28 20.11 23.61
2001 57.53 19.70 22.77
2002 58.40 17.21 24.39
2003 60.56 15.64 23.80
2004 61.66 17.01 21.33
2005 62.01 16.89 21.11
0
10
20
30
40
50
60
70
80
1997 1998 1999 2000 2001 2002 2003 2004 2005 2006 2007 2008 2009 2010 2011
The proportion of Industry Portfolio
Primary Industry Secondary Industry Tertiary Industry

22
2006 63.11 19.11 17.78
2007 59.09 20.67 20.24
2008 59.15 20.88 19.97
2009 60.88 19.34 19.78
2010 63.57 19.01 17.42
2011 62.14 18.99 18.87
Source: China’s National Statistic Bureau Annual Book
As a developing country, it’s essential for China’s government to incline toward
infrastructure facilities to fulfill the demand of rapid economy growth. According
Table 7, the infrastructure accounts 50-60 percent of totally investment.
When an economy evolves to a certain degree, its development pattern needs
to transfer into intensive economic development that focuses on efficiency
improvement. As of this point, the TFP (Total Factor Productivity) will be all the
more important to economic growth and the needs for technological
advancement and innovation will be more imperative. Thus, investments in
fixed assets must give way to the renewal and Renovation investments and
the scale and proportion of the latter must be amplified in order to adapt to the
requirement of economic growth.
The main driving forces pushing this high growth in fixed asset investment
came from investment in manufacturing industries, infrastructure and real
estate. In 2011, the proportions of investment in these areas in total investment
and GDP reached 72 and 38 percent. Especially, infrastructure and real estate
investment account for more than half of the total investment and over 25
percent of GDP (National Statistic Bureau).
4.3 The econometric model and variable explanation of effects of
government investment on economic growth
The economic growth model uses Cobb-Douglas production function, and
introduces variables of human capital and government investment on the base
of the production function of labor and capital according Song HY and Qin D’s
research on the efficiency of government investment [1], it is shown as below:
Y = AKαLβHγG∅
Where Y is GDP, K is material capital stock, L is labor, H is human capital stock,
and G is the investment expenditure of local government. By standardizing the
above equation by logarithm, we get:
𝐈𝐧𝐘 = 𝐈𝐧𝐀 + 𝛂𝐈𝐧𝐊 + 𝛃𝐈𝐧𝐋 + 𝛄𝐈𝐧𝐇 + ∅𝐈𝐧𝐆

23
With the above equation, we get the following econometric analysis model
based on standard panel data:
𝐈𝐧𝐘𝐢,𝐭 = 𝛃𝟎 + 𝛃𝟏𝐈𝐧𝐊𝐢,𝐭 + 𝛃𝟐𝐈𝐧𝐋𝐢,𝐭 + 𝛃𝟑𝐈𝐧𝐇𝐢,𝐭 + 𝛃𝟒𝐈𝐧𝐆𝐢,𝐭 + 𝛂𝐢
Where i is province i, t is year, 𝛂𝐢 is unobserved variable related with
particular unit. For panel data, as 𝛂𝐢 is unobserved variable, and it may be
related with explanatory variable, so normal OLS regression will cause
estimation deviation and error of the explanatory variable coefficient. When
variable𝛂𝐢, related with particular province, does not change with time, the
normal estimation method is to estimate after deducting mean for all the
variables, thus we get fixed effect model. If 𝛂𝐢 is not related with explanatory
variable, we can use random effect model which is more effective than fixed
effect model. If the estimation result of the two models is evidently different, if
shows that αi is correlated with explanatory variable, then both of the two
models can get the same estimation result, but random effect model is more
effective, so the fixed effect model should be rejected.
4.31 The econometric model of the effects of local government
investment on economic growth after considering the tax-sharing
system established in 1997
In 1997, the Central Government started the complement reformation of
finance and tax, introduced tax-sharing system national widely, and
established separated finance system based on tax-sharing system. The
following figure reflects the proportion of provincial government investment to
GDP in the years of 1995-2011. From this figure we can see that, after the
establishment of tax-sharing system, the proportion of local government
investment to GDP tends to rise.
Figure 4. Local government investment/GDP
0
10
20
30
40
50
19
95
19
96
19
97
19
98
19
99
20
00
20
01
20
02
20
03
20
04
20
05
20
06
20
07
20
08
20
09
20
10
20
11
Local government investment/GDP
Local governmentinvestment/GDP

24
Source: China’s National Statistic Bureau Annual Book
This shows that after the establishment of tax-sharing system, the local
government investment is strengthened for the following reasons: after the
establishment of tax-sharing system, while the revenue of central government
increases remarkably, the local government's power to finance has not been
expanded correspondingly, and has been even shrunken, but at the same time,
the responsibility of local governments is expanded; this problem is worse at
county and town level.
For local governments, the only way to gain more finance and to satisfy the
demand of fiscal expenditure is to develop the local economy and to enlarge
the total economy, so this makes the local governments have great incentive to
develop the local economy, and the one of important measures of doing so is
to attract more and more investment from outside. However, attracting
investment needs a good investment environment. This is why local
governments increased investment in infrastructure construction and
established a great deal of economic and technological developing areas. A
direct result of this practice is that the proportion of local government
investment to GDP rises increasingly after the establishment of tax-sharing
system. With the above consideration, we add a new variable dummyt97* lnG
into the econometric model, among which dummyt97 is dummy variable of
time; the corresponding dummyt97 value for the periods of 1995-1996 and
1997-2011 are 0 and 1 respectively. Variable dummyt97* lnG examines what
new effects on economic growth have been produced by local government
investment after the establishment of tax-sharing system. The econometric
model we need to test turns into the following:
𝐈𝐧𝐘𝐢,𝐭 = 𝛃𝟎 + 𝛃𝟏𝐈𝐧𝐊𝐢,𝐭 + 𝛃𝟐𝐈𝐧𝐋𝐢,𝐭 + 𝛃𝟑𝐈𝐧𝐇𝐢,𝐭 + 𝛃𝟒𝐈𝐧𝐆𝐢,𝐭 + 𝛃𝟓𝐝𝐮𝐦𝐦𝐲𝐭𝟗𝟕 ∗
𝐈𝐧𝐆𝐢,𝐭 + 𝛂𝐢
4.32 Econometric model of the effects of local government investment on
economic growth after considering that the establishment of finance
policy in 2000 made the local governments to have more incentive to
invest in infrastructure construction
From Table 8, we can see that the proportion of local government investment
to GDP speeded up its increase after 2000. We ascribe this to that after 2000,
China had a positive fiscal policy and increased the investment in
infrastructure constructions and entry WTO, which greatly aroused the
enthusiasm of local governments to be engaged in city infrastructure
constructions with the simulation of central government loan. Many projects
supported by the central government loan required local government to
provide some auxiliary capital too, so the local governments who have won
government loan project had to get its auxiliary capital through bank loan and
other ways.
(1)

25
It evidently stimulated investment expenditure of local governments; in addition,
for some local governments who is qualified, the providence of auxiliary capital
means great possibility of winning the support of central government loan,
which in great degree stimulated these local governments to strive for this kind
of loan, because for local governments, the central government loan is free,
and what they need to do is to raise the auxiliary capital. This stimulated the
investment expenditure of local governments. Under the above consideration,
we add a new variable dummyt00* lnG in the basic econometric model, among
which dummyt00 is dummy variable of time, the dummyt98 value for the period
of 1995-1999 and 2000-2011 is 0 and 1 respectively. What the variable
dummyt98* lnG examines is that, after the new positive fiscal policy practiced
in 1998, local governments had more incentive to be engaged in infrastructure
construction. It made the proportion of local government investment to GDP
increase more quickly. What are the new effects of local government
investment on economic growth in this circumstance? Our econometric model
to be tested becomes as follows:
𝐈𝐧𝐘𝐢,𝐭 = 𝛃𝟎 + 𝛃𝟏𝐈𝐧𝐊𝐢,𝐭 + 𝛃𝟐𝐈𝐧𝐋𝐢,𝐭 + 𝛃𝟑𝐈𝐧𝐇𝐢,𝐭 + 𝛃𝟒𝐈𝐧𝐆𝐢,𝐭 + 𝛃𝟓𝐝𝐮𝐦𝐦𝐲𝐭𝟎𝟎 ∗
𝐈𝐧𝐆𝐢,𝐭 + 𝛂𝐢
4.33 Variable explanation
a.Y is explanatory variable. It indicates GDP of different provinces. The data
here comes from China Statistical Yearbook of relevant years.
b.G is the investment expenditure of local governments. It indicates the local
government investment within the budget, which is the fiscal expenditure after
deducting the administrative expenditure used in science, education, culture
and health care. Because there is not a index to show government investment,
and all the government expenditures after deducting the administrative
expenditure used in science, education, culture and health care are basically
government investment, so we regard the part of government fiscal
expenditures within budget after deducting the administrative expenditure
used in science, education, culture and health care to be a representation
variable of local government investment and used in the econometric model.
c.K is the capital stock of provinces. It is converted through book inventory
system d. The capital stock data of different provinces in 1995-2011 used in
this paper are directly from the study of Zhang Jun, Wu Guiying and Zhang
Jipeng [11]. The capital stock data of different provinces in 2011 are calculated
by the authors using the above method.
d.H is the human capital stock of different provinces. The human capital stock
data of different provinces are not available in any China Statistical Yearbook.
However, some studies attempted to calculate this kind of data based on the
(2)

26
existing statistical data, so as to provide help for econometric studies, among
which is Jin Yu, Lu Ming and Chen Zhao [12]. The human capital stock data
used in this paper are directly from their studies.
We used the data of average education years in different provinces which were
calculated by them, and based on which we calculated the total education
years, thus we got the human capital stock of different province, then
introduced them into the econometric model through logarithmic calculation.
4.4 Data and Empirical Results
4.41 Data
Due to consider of development level, the data used in this paper is relevant
economic indexes in the year of 1995-2011 of Guangdong province, Jiangxi
Province and Ningxia Hui Autonomous Region and these data are calculated
by current price. These three province-level region represent developed region,
intermediate level and underdeveloped region. Except dummy variables, all
other variables are converted to be standard value with corresponding price
index. We process these data with Excel, Eviews6.
Table 6 Y: GDP (100 Million RMB)
Years Guangdong Jiangxi Ningxia
1995 5933.05 1169.73 269.75
1996 6834.97 1605.74 293.62
1997 7774.53 1605.77 310.92
1998 8530.88 1719.87 327.46
1999 9250.68 1853.6 341.49
2000 10741.25 2023.07 365.57
2001 12039.25 2191.4 398.38
2002 13502.42 2468.68 429.28
2003 15844.64 2844.8 485.34
2004 18864.62 3495.9 537.11
2005 22557.37 4056.76 612.61
2006 26587.76 4670.53 725.90
2007 31777.01 5500.25 919.11
2008 36796.71 6480.33 1203.92
2009 39482.56 7655.18 1353.31
2010 46013.06 9451.26 1689.65
2011 53210.28 11583.8 2102.21
Table 7 G: investment expenditure of local governments (100 Million yuan)
Years Guangdong Jiangxi Ningxia
1995 2327.22 282.54 62.17

27
1996 2327.64 317.32 72.1
1997 2298.14 329.45 85.84
1998 2668.13 400.6 106.75
1999 3027.56 454.44 128.1
2000 3233.70 516.08 157.52
2001 3536.41 631.84 191.08
2002 3970.69 889.04 226.98
2003 5030.57 1303.22 317.99
2004 6025.53 1713.2 376.2
2005 7164.11 2176.6 443.3
2006 8132.37 2683.6 498.7
2007 9596.95 3301.9 599.8
2008 11165.06 4738.6 828.7
2009 13353.15 5643.14 1353.31
2010 16113.19 6772.27 1464.7
2011 16843.83 7583.8 1654.15
Table 8 Population (10 thousands)
Years Guangdong Jiangxi Ningxia
1995 6788.74 4062.54 512.38
1996 6896.77 4105.46 519.23
1997 7013.73 4150.33 522.94
1998 7115.65 4191.21 533.78
1999 7298.88 4231.17 543.29
2000 7498.54 4148.54 554.32
2001 7565.33 4185.77 563.22
2002 7649.29 4222.43 566.78
2003 7723.42 4254.23 570.19
2004 7804.75 4283.57 578.12
2005 7899.64 4311.24 583.33
2006 8048.71 4339.13 598.72
2007 8156.05 4368.41 591.98
2008 8267.09 4401.56 612.98
2009 8365.98 4441.88 620.11
2010 8521.55 4456.75 630.14
2011 8637.19 4439.21 647.19
Table 6-Table 8 Sources: China’s National Statistic Bureau Annual Book
Table 9 K: capital stock (100 million RMB)
Years Guangdong Jiangxi Ningxia
1995 7881 1637 251. 45
1996 9410 1709 363. 58
1997 13919 1797 477. 42

28
1998 14485 1889 595. 34
1999 15062 1987 618. 07
2000 16084 11090 845. 57
2001 16342 11214 1379. 52
2002 17148 11395 1319. 75
2003 18158 11640 1377. 37
2004 19284 11935 1442. 10
2005 20704 12279 1515. 81
2006 22305 12673 1599. 49
2007 24135 13105 1697. 57
2008 26005 13558 1825. 53
2009 31355 14211 2224.11
2010 38571 20981 3410.14
2011 39647 21943 3647.19
Table 10 H: human capital stock (here are part of data, more data can
download from www .essrc.org/luming)
The proportion of higher
educated population (%)
The proportion of high
educated population (%)
Porvince 1995 2001 2006 2011 1995 2001 2006 2011
GuangDong 1.93 7.5 21.61 37.66 40.49 50.44 61.77 69.76
JinagXi 1.33 5.63 18.76 35.75 35.75 44.3 53.11 64.41
NingXia 2.43 7.63 17.98 33.95 36.48 39.48 49.98 56.73
The average educated
level (Years)
Porvince 1995 2001 2006 2011
GuangDong 6.93 8.23 9.11 10.71
JinagXi 6.48 7.75 8.76 10.11
NingXia 6.13 7.21 7.98 9.34
Table 9-10 Sources: Zhang J, Wu GY, Zhang JP. The estimation of China's
provincial capital stock: 1952-2011. Economic Research Journal, 2011, (10):
35-44 (in Chinese)
4.42 Empirical Results
Thus the original assumption that there is a random effect is declined;
therefore, we need to use fixed effects model when testing the econometric
equation empirically. The empirical test result is as the following table. This
shows that the local government investments have remarkable effects on
economic growth, and that the elasticity of local government investment to
economic growth is about 0.34. We can also see that the regression coefficient
of the variable dummyt97* lnG is 0.0389, that the statistical value of t is 8.89,
and that the corresponding value is very little. This shows that, after the
establishment of tax-sharing system in 1997, the efficiency of local

29
government investment was rising, and its elasticity to economic growth was
about 0.04. Moreover, we can also see that the total employment level, capital
and human capital have remarkable positive effects on economic growth, and
that the production elasticity of employment, capital and human capital is about
0.95, 0.52, and 1.08 respectively (Table 11).
Table 11
Table 12
The fixed effect estimation result to econometric Equation (2) is as Table 12.
From Table 2 we can see that the regression coefficient of the variable
dummyt00* lnG is -0.0327.Its statistical value is -8.6853, and its corresponding
probability value is very little. It shows that the elasticity of local government
investment to economic growth after 2000 declined about 0.033 compared
with that of 2000, which means that with 1% of local government investment,
the growth of GDP was only about 0.466%. It shows that, after China practiced
a new positive fiscal policy, though local governments had great incentive to

30
invest in city infrastructure construction with the impetus of central government
loan, which made the investment expenditure of local government and its
proportion to GDP are increasing, the efficiency of these investment declined.
It can be shown with the 0.033% declination of its elasticity to economic
growth.
4.43 The analysis of Empirical Results
The empirical result of this paper shows that the local government investment
has a very evident positive effect on economic growth. The empirical result
also proves that after the establishment of the tax-sharing system in 1997, the
elasticity of local government investment to economic growth went up. But this
elasticity went down when local government investment increased greatly after
2000. The empirical test result also shows that the elasticity of local
government investment to employment decreased when the tax-sharing
system reform was put into practice after 1997. It shows that though the local
government investment increased rapidly in the past years and played an
important role in economic development, its positive effect on employment was
limited. This explains why the elasticity of GDP to employment tends to
decrease and the employment pressure keeps high while China's economy
keeps rapid growth.
5 Finding and Discussion
5.1 The roles of local government after fiscal decentralization reform
One of the most important future of China’s economy transformation is the
local government plays a key role in the promotion of economy development.
The process of economy transformation can be ascribed as central
government planned economy transit to local government oriented economy
as mentioned before. In nowadays China, enhancing autonomous
development ability promote local government to be the economic main body
because the local government has relatively independence economic interests.
Under this situation, the local authorities take measures to extend the local
investment which contains two forms: as a part of local demand to promote
GDP growth and invest infrastructure facilities due to create a better
circumstance to attract private investment. In the foreseeable future, the trend
that local government increase fixed asset investment to promote economy
growth will be more and more obvious.
At the beginning of opening up reform, the investment from central government
is relatively more than local government. In that time, local government just
maintains the normal running, focus on resolving the problem of food and

31
clothing, lacking capacity and motility to invest infrastructure facilities and other
fixed asset. Fiscal decentralization reform has motivated the local government
to great extend and brought about speedy growth of fixed asset investment. At
the same time, central government just gets permission to use some parts of
national funds to invest infrastructure facilities and most focus on a number of
key infrastructure projects of nationwide significant. Because the investment
from central government has this kind of strong external characteristics, the
demand of infrastructure cannot fulfill without local government.
In such situation, there are three reasons to promote local government
strength infrastructure facilities. Firstly, it’s essential to invest infrastructure
facilities both for economy growth and improvement in people living standard.
The past experience shows that better infrastructure facilities will attract more
FDI or domestic private investment to promote local development. Secondly,
China’s central government always counts on increasing investment to
stimulate economy in an economy recession. The local government can catch
this opportunity to extend fixed asset investment. Last one, to investment
education, medical care, social security is not able to take effect in a short term.
Consequently, to invest infrastructure facilities is a rational choice for local
government than other options. But in usual, the expenditure of investment for
people’s lives is rigid demand, local government always lack of funds to invest
infrastructure facilities. In order to achieve the goal of economy growth, the
financing of many infrastructure projects often disregard law and regulation
when central government limited the investment scope or local government
lack of normal financing channel.
5.11 The intrinsic mechanism of local government investment
Why the local governments intent on infrastructure? In order to understand
such behavior, we have to analyze how the local government to generate
investment and describe the internal system of local government investment.
In nowadays China, the local government's interest is intertwined with interests
of the central government and local people, as the illustration showed.
Figure 5. The internal system of local government investment
People demand Assessment index
People Local government Central government
Competition Social welfare
Local government

32
This illustration contains following parts. (a) The interest relationship between
local government and central government. (b) The interest relationship
between local government and the people in this area. (c) The interest
relationship between different local governments. As for analyzing the
behavior of local governments, the comprehensive surveys of the three are an
indivisible whole which is indispensable.
The entrust-agent relationship between central government and local
government are based on the framework of political centralization and fiscal
decentralization. In this system, superior administration organization set
targets and allot tasks to lower administration organization which are required
in a particularly time.
In order to fulfill the assessment index from central government, the local
government has to mobilize and organize various sources. In political
centralized China, the local government officials are filled by appointment from
higher-level government rather than popular election and the political
incentives and rule mode under this system not lead to “responsible to the
electorates” but “responsible to the political leaders”. That means the local
government gets the benefits of fiscal decentralization, and in the meanwhile,
they must obey the authority of the central government and maintain the unity
of purpose with central government. There is a very popular word to
summarize the value orientation of China’s government officials called
“Political achievement view” that reflects the solidified interests between the
assessment from the central government and promotion of local economy. To
boost the fixed asset investment is a perfect choice to achieve the both goals
of central government and local government. From economy development
angle, local government fixed asset investment can promote the growth of
local GDP to increase the local fiscal revenue, extending the margin financial
domination authority of local government officials. Besides that, this issue also
can be considered on the local government official personal angle, they can
get more advance opportunities through the central government’s assessment.
In this sense, the local government is quite agreeable to extend fixed assets
investment to boost the economy.
Usually, the economic competition among different local governments is
around the officials’ political advance. To a certain degree, the growth of
China’s GDP is the product of this mechanism. So far as local government is
concerned, one important strategy to win this kind of competition for them to
boost local economy growth is attracting investments, especially foreign direct
investment, and this behavior requires local government officials focus on
improving local infrastructure facilities to enhance the competitiveness to
attract more and more investment. Hereby, investments, whatever foreign
direct investment or domestic private investment, are the important motive

33
force in government fixed asset investment.
5.12 The characteristics of China’s local government investment
a. The lower entry cost of government-oriented investments has brought
a much larger scale to those projects invested in such manner and made
repeated construction more common.
Compared with private investments on the market, this kind of investments
often has a lower entry cost because of its innate social features of
government-oriented investments, the multi-dimensional nature of the power
held by government officials and the actual situation of the current financial
system in China. It may be caused by the following specific reasons.
First of all, government investment mainly includes two capital sources, namely,
financial allocations and bank loans. Most of project fund financially allocated
is the one-way fund introduction of the government for national economic
system. Actually, such capital input often doesn’t have to pay back directly, not
to mention interest. For another type of fund sources, bank loans, banks and
local governments are nothing but such two departments of the state
section-level system financing under the specific conditions of state monopoly
in the financial field, and in most cases there are countless interpersonal
networks among them and even they may be subordinate relations, direct or
indirect, within their specific administrative system. Therefore, on the one hand,
those government officials in office can take advantage of their power and
interpersonal connections to reduce the cost of bank loans significantly; on the
other hand, under the background of China in which banks and finance are
closely related to each other in essence, bank loans tend to be used as a part
of financial project funding and thus banks are negligible in borrowing costs.
Secondly, since government regulation (mainly refers to approval limit in
investment entry) exists in some departments and industries, these
investments driven by government officials are easier to be approved, and the
entry cost of such investment are relatively low, which has been resulted from
the multi-dimensional nature of the power held by government officials and the
interpersonal connections accumulated in this manner play a role in cost
deduction. Finally, the multi-dimensional nature of the power held by
government officials is also expressed in their control over related elements.
Government officials in office make the entry cost of government-oriented
investments further reduced through bringing other element resources (such
as land, local credit, etc.) into play.
The law of demand in economics tells us that under the situation in which other
conditions remain unchanged the decline of cost (price) is bound to stimulate
the rise in investment quantity (demand). Therefore, it is safe to determine that
the investment propensity of government officials is stronger than that of

34
private investors even when they are in the same condition, in real life, which
has been confirmed at least in two indicators such as investment scale and
investment entry degree.
Specifically, for one thing, owing to the relatively low investment cost, the
government bears less pressure from cost constraints while making decisions
in the same project investment. Thus the project scale determined ultimately is
divorced from market standards and tends to be blindly large and strong. For
another thing, when the investment object has been identified as a particular
industry (field) , the lower cost can also make the the entry space of
government capital much larger than the market standard, resulting in
excessive entry of government-oriented investments into some economic
areas (departments) , investment overheating and repetitive construction. It
should be noted that excessive investment, overheating investment and
repeated construction of the problem are not proprietary to
government-oriented investments because such problems can be also
triggered when private investors on the market have errors in decision making.
The difference is that it is more obvious in the former. The crux of the matter
lies in the departure of private investors can be automatically corrected by the
market within its elastic range. For government-oriented investments, however,
such market correcting activities will be greatly weakened because of its lower
entry cost and higher withdrawal cost, and even ultimately it is embodied in the
rigidity and failure of the market.
b. Government-oriented investments have higher withdrawal barriers,
which has led to serious related problems such as soft budget constraint
and local protectionism.
Compared with private investments on the market, government-oriented
investments have lower entry barriers, but withdrawal barriers are often higher.
At present, the main factors that have been affecting and resulted in this
situation can be simply summarized as follows: Firstly, as it has been pointed
out in the discussion on the chain structure determined by the interest of
government officials in section-level system, there is a multi-layered entrusting
link between the individual income of government officials and their capital’s
using results, which has made their proprietary corresponding degree tend to
be weakened. In the actual social life, those officials in office pay more
attention to the achievements that their capital will create rather than the
results after their capital is used.
If the corresponding relationship between investment efficiency (profits) and
achievements has been distorted or reduced for some reason (such as
information asymmetry), the withdrawal barriers (cost) of such investments
must go off market standard. The fundamental standards for measuring

35
government officials in office who drive capital flow into or out of a field lies in
their political gain and loss. Taking actions to withdraw the investment at least
mean that their former investment entry decision has some mistakes (even
amounts to admitting their policy failure). This self denial behavior will bring
about a disastrous result to their official career. In most cases, their political
cost is far much higher than the corresponding economic losses. The huge
difference between political cost and economic cost in the process of capital
withdrawal is the main reason that makes government-oriented investments
have a higher withdrawal standard compared with market standard. The
multi-dimensional nature of the power held by government officials enables
them to mobilize other resources in their hand to launch supporting and saving
activities for the existing investment projects at low cost (for officers).
Such unique advantage born within the sector-level system actually has
increased the opportunity cost of their withdrawal decision and further
strengthened withdrawal barriers of government-oriented investments. In the
specific social and economic life, the difference withdrawal barriers between
private investors and government officials in office means that when the
market has made a judgment that this investment had failed the optimal
strategy for private investors is to withdraw from the market rapidly in order to
minimize capital losses. But withdrawal constraints that drive government
officials in office will be higher. In this case, government officials make use of
their power and resources controlled to save and help the existing projects,
and the sustainability of such activities will be reinforced with the reduction of
additional cost. In fact, such rescue activities represented by soft budget
constraint and local protectionism not only is the inevitable result that the
withdrawal standard of government-oriented investments is higher than that of
the market but also, in turn, will stimulate such withdrawal barriers to be
tougher. Due to this inner inherent influence of self-reinforcing mechanism,
these two kinds of phenomena mentioned above have been reformed but with
no any change and cast off but with no end for decades in the economic life in
China. The so-called part that government's leading investment withdrawal
barriers of government-oriented investments are higher than that of the market
mainly depends on the cost calculation that government officials in office take
their political cost into consideration and then launch saving activities.
5.2. The effects of government excessive investment
The phenomenon of China’s government investment exceeding 50% in 5
consecutive years (2006-2011) is unprecedented, impacts the stability run of
China’s economy, and also influences the resource allocation efficiency and
income distribution.
5.21 Promote the urbanization
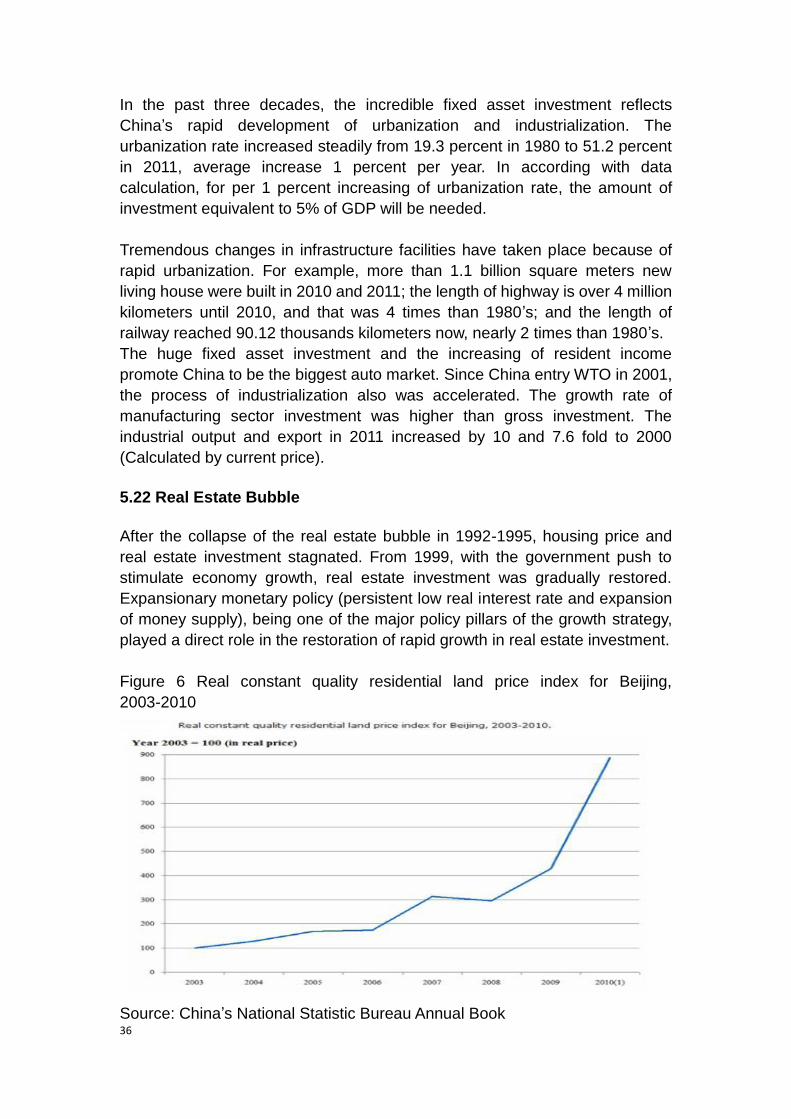
36
In the past three decades, the incredible fixed asset investment reflects
China’s rapid development of urbanization and industrialization. The
urbanization rate increased steadily from 19.3 percent in 1980 to 51.2 percent
in 2011, average increase 1 percent per year. In according with data
calculation, for per 1 percent increasing of urbanization rate, the amount of
investment equivalent to 5% of GDP will be needed.
Tremendous changes in infrastructure facilities have taken place because of
rapid urbanization. For example, more than 1.1 billion square meters new
living house were built in 2010 and 2011; the length of highway is over 4 million
kilometers until 2010, and that was 4 times than 1980’s; and the length of
railway reached 90.12 thousands kilometers now, nearly 2 times than 1980’s.
The huge fixed asset investment and the increasing of resident income
promote China to be the biggest auto market. Since China entry WTO in 2001,
the process of industrialization also was accelerated. The growth rate of
manufacturing sector investment was higher than gross investment. The
industrial output and export in 2011 increased by 10 and 7.6 fold to 2000
(Calculated by current price).
5.22 Real Estate Bubble
After the collapse of the real estate bubble in 1992-1995, housing price and
real estate investment stagnated. From 1999, with the government push to
stimulate economy growth, real estate investment was gradually restored.
Expansionary monetary policy (persistent low real interest rate and expansion
of money supply), being one of the major policy pillars of the growth strategy,
played a direct role in the restoration of rapid growth in real estate investment.
Figure 6 Real constant quality residential land price index for Beijing,
2003-2010
Source: China’s National Statistic Bureau Annual Book

37
The restoration of rapid economy growth after China entry WTO further
stimulated the growth in the demand for housing, which in turn promoted rapid
housing price increases. When price increases significantly exceeded low
interest rates, the mild response of the government further encouraged price
increase expectation, leading to large-scale speculative and investment
demand, which in turn further pushed increases in prices. Housing price
increases, both current and expected, directly push up land prices. A new real
estate bubble has emerged, which will further promote excessive investment in
real estate. Furthermore, once the excessive investment reaches a certain
scale, a vested interest will have been formed among banks, local
governments and real estate developers to maintain real estate bubbles to
secure investment returns in the future.
5.23 Local government debt issue
Due to the excessive investment, local government debt shows characteristics
of diverse forms, strong concealment, low transparency, complex causes,
vacancies of debt risk warning and control mechanisms, et. At the present,
China’s local governments have been burdened with very large debt which has
a substantial and rapid rising trend, and the risk has been highlighted in the
local areas. The potential risks are bigger and cause a serious impact on the
local economic development and the normal functioning of the local
governments, even threatening China’s economic security and social stability.
Effective countermeasures have to be taken to control and resolve the debt
risk of the local governments, such as improving relevant laws and regulations,
normalizing governments’ borrowing behaviors, establishing local government
debt management accountability mechanisms, cont rolling strictly the size of
the local government’s debt and preventing new unreasonable debt,
establishing debt risk warning and control mechanisms, etc.
Guarantee
Guarantee
Guarantee
Financing
Local government
Higher level Government or
International Organization
State-run investment Companies
Infrastructure
Construction
Projects
Other Firms
Banks, funds, etc
Private Firms
State-run Firms
Social Institutions and
Organizations Belong to
Government
Financing
Financing Guarantee
Invest
Finan
cing

38
a. The scale of China’s local government debt
In 2010, the national fiscal revenue reached 8308 billion Yuan, increasing 21.3%
than last year. But in the meantime, according the 2010 annual audit of central
budget implementation report in national people’s congress by general auditor
Liu Jiayi in June 2011, sum total of government debt of the provincial
government, municipal government and county-level government reached
10717.49 Billion Yuan, concluding 8560 Billion bank loan, even higher than
national fiscal revenue. From 1996, the local government debt was increasing
rapidly, especially in 2009, the new increasing debt reached 3410 Billion Yuan,
increasing 61.9% than last year, and the total local government debt
accounted for 26.5% of China’s total output. And the municipal government
debt and county-level government debt covered 43.51% and 26.53% of total
debt, respectively.
Table 13. The estimation data of China’s local government debt (Billion RMB)
Year GDP Direct Debt Related Debt Total
Dimensions
2000 9921.46 1240.20 1885.10 3125.30
2001 10965.52 1370.70 2083.40 3454.10
2002 12033.27 1504.20 2286.30 3790.50
2003 13582.28 1697.80 2580.60 4278.40
2004 15987.83 1998.50 3037.70 5036.20
2005 18308.48 2288.60 3478.60 5767.20
2006 21087.10 2635.89 4006.50 6642.39
2007 26581.03 3098.56 3378.89 6477.45
2008 31404.54 3434.78 2866.56 6301.34
2009 34050.6.9 6077.19 3633.93 9711.12
2010 39798.30 6710.95 4006.54 10717.49
Source: Zhang Bin’s research on The Empirical Analysis for Risks
Management of Local Government Debt [23]
b. Shadow banking——The risk of local government debt
As it is revealed in the results of No. 35 audit results in 2011 issued by the
National Audit Office, the local governmental debt balance had totaled RMB
10,717.491 billion by the end of 2010, and there were 78 municipal
governments and 99 county-level governments whose debt ratio in liabilities
for repayment had been above 100%. Due to their poor debt paying ability,
some local governments had no choice but to raise new loans while repaying
old debts. There were 22 municipal governments and 20 county-level
governments whose ratio of raising new loans while repaying had exceeded
20%. What’s more, there were overdue debts in some cities and counties.

39
There were 4 municipal governments and 23 county-level governments whose
ratio of overdue debts had exceeded 10%. Local debts were gradually entering
a peak period of repayment. However, local finance couldn't afford such heavy
debts and thus local debt liquidation has been faced with many difficulties. On
the one hand, it shall be fully aware that with a weak debt paying ability in
some areas and industries, there are hidden risks indeed. For example,
individual local governments have heavier liabilities for repayment; some cities
and counties heavily depend on land transfer income in repayment; and
highways, ordinary universities and hospitals in some areas have large-scale
debt and thus they bear higher pressure from repayment. On the other hand,
the debt liquidation of local governments will reduce their credit ratings, and
stricter commercial bank loan approval, higher loan interest rate and higher
urban debt interest will exert restrictions on the financing amount of local
governments and then reduce their investment in fixed assets. The capital
from investment in fixed assets will also decline, which will immediately
influence the absolute value of GDP. The fall after rise of economic growth rate
will directly lead to the slowing growth of people's material standard of living.
5.24 Inflation
As we know, the basic indicator of investment growth is investment growth rate
and the basic indicator of inflation is the inflation rate. Investment growth rates
are the annual growth rate at constant prices. Inflation rates can be determined
by two indicators: consumer price index (CPI) and GDP deflator. The first
indicator reflects the price movement of goods and services for household
consumption in a given period; the second indicator reflects the price
movement of all final products within a given period. Final products include
goods and services for household consumption, goods and services for
government expenditure, goods and services for investment, and goods and
services for export and import. Obviously, the first indicator involves a narrow
range of goods and services, whereas the second indicator involves a broad
range of goods and services. While each has a different focus, both indicators
are regarded as important to reflect the level of inflation.
In just 30 years since 1978, there have been six times of inflation, the
frequency thereof reached once per year, far exceeding the level of western
developed countries.
The first inflation since the reform and opening-up occurred around 1980. At
that time, the central governments in brought forward a plan to develop and
continue around 120 large-scale projects and build 14 large-scale heavy
industry bases in the period between 1978 and 1985.The aim of the campaign
was to increase industrial yields by 10% per annum during the 8 years. Thanks
to the policy, the scale economy entered a fast track and so did the price index.
The second inflation took place around the period between 1984 and 1985.

40
At the Twelfth CPC National Congress in September, 1982, the party formally
announced its strategic economic objectives, namely to quadruple the
agricultural and industrial yield of China by the end of 20th century. Motivated
by this strategic objective and the encourage from the central leaders, the
government's enthusiasm for investment was high flatted, especially that of
local government. From early 1984, local governments entered a race to
expand the scale of investment required in order to achieve the objective of
quardruple in advance. The scale of fixed assets significantly increased,
aggregating the total demands, making wage income outgrow labor
productivity and product costs increased rapidly, and in the end, driving the
price index to go up. The third time was in the period from 1987 to 1989. The
central austerity policy from 1984-1985 had not been effective, yet in 1986 the
country's economic policy turned to easing again, causing the investment
scale and demand to expand in fast rate. In 1985 the CPI reached a record
high. The fourth inflation occurred in 1993 when the fixed-asset investment
grew excessively and the financial system went into chaos. In early 1992,
Deng Xiaoping made his famous "Southern Speech", calling for the
acceleration of the reform and development. The fifth inflation occurred in the
period between 2003 and 2005, mainly represented by excessive because the
local governments' efforts in promoting infrastructure construction and the
central government's overall stimulus policy in order to counteract the impact
of the economic crisis.
Throughout these six times of inflation, we found that each inflation was
strongly relevant to "investment expansion", namely that large-scale
investment drove the product price to increase. Over the past 30 years, the
proportion of China's fixed asset investment in GDP has continued to rise and
in 2010 alone, the proportion of investment in fixed assets in GDP reached a
record high of 69%.
Figure 7 Investment Growth Rate Compare with Inflation Rate from 1979-2011
-5
5
15
25
35
45
55
1979 1981 1983 1985 1987 1989 1991 1993 1995 1997 1999 2001 2003 2005 2007 2009 2011
Investment Growth Rate Compare with Inflation Rate from 1979-2011
Investment Growth Rate Inflation Rate

41
Source: China’s National Statistic Bureau Annual Book
Table 14 Investment Growth Rate Compare with Inflation Rate from 1979-2011
Year
Investment
Growth
Rate
Inflation
Rate Year
Investment
Growth
Rate
Inflation
Rate
1979 17.3 1.9 1996 8.4 8.3
1980 20.9 7.5 1997 8.5 2.8
1981 9.1 2.5 1998 7.8 -0.8
1982 9.8 2 1999 7.6 -1.4
1983 8.1 2 2000 9.1 0.6
1984 13.7 2.7 2001 11.8 1.4
1985 18.9 9.3 2002 13.1 3
1986 13.1 6.5 2003 14.2 3.8
1987 7.6 7.3 2004 16.1 4.5
1988 6.2 11.8 2005 11.3 1.8
1989 3.8 12.1 2006 12.7 1.5
1990 3.7 -0.3 2007 14.2 4.7
1991 6.4 -0.6 2008 43.1 5.8
1992 21.3 6.4 2009 21.1 6.9
1993 14.1 14.7 2010 4.1 11.1
1994 11.9 24.1 2011 7.1 6.7
1995 9.1 17.1
Source: China’s National Statistic Bureau Annual Book
The relationship between investment growth cycle and inflation cycle:
By comparing inflation and investment growth, we have identified the following
characteristics: a) the inflation peak value lags behind the economic growth
peak value. In the second cycle, the investment growth rate peaked in 985 but
the inflation rate peaked in 1986. So the latter lagged 1 year behind the former.
In the third cycle, the investment growth rate peaked in 1992 but the inflation
rate peaked in 1994. So the latter lagged 2 years behind the former. In the last
cycle, the investment growth rate peaked in 2009 but the inflation rate peaked
in 2010. So the latter lagged on year behind the former. b) the inflation rate and
economic growth rate simultaneously slide into the through. In the second
cycle, the investment growth rate slid into 3.7 percent, and the inflation rate fell
into -0.3 percent in the same year. In the forth cycle, the investment growth
rate and the inflation rate both fell into a through in the same year in 1998.
The above characteristics indicate that an increase in the investment growth
rate is often accompanied by an increase in the inflation rate; a decrease in the
investment growth rate often accompanied by a decrease in the inflation rate.
When the economic growth rate reaches its peak value, however, the inflation
rate often lags a period of time before reaching its peak value. When the

42
investment growth rate slides into a through, the inflation rate often falls into a
through at the same time. This implies that the investment growth rate has a
greater impact on the inflation rate when the investment growth rate falls than
when it rises. The above characteristics reveal an inherent link between
inflation and economic growth.
In the second cycle, the average annual investment growth rate was 16.7
percent; the average annual inflation rate was 9.6 percent,. In the third cycle,
the average annual investment growth rate was 15.6 percent; the average
annual inflation rate was 17.2 percent. In the last cycle, the average annual
investment growth rate has to date been 26.1 percent; the average annual
inflation rate has been 7.7 percent. The common characteristics of the three
cycles how that the average annual economic growth rate is higher than the
average annual inflation rate; the investment growth rate has a smaller
Magnitude of fluctuation than the inflation rate.
6. Conclusions and Recommendations
Between 1990s and 2000s, China is in the process of transition, achieved
remarkable growth, and in the meantime, the government investment also
reached a record high level. Central government gradually decentralized most
of the control power and passed it to local governments. The local
governments, as an independent economic actor, participated in the economic
life actively, expanded the investment with great efforts so as to develop the
local economy. This is an important step in China's gradual reformation, which
promoted the economic development and the growth of employment. But on
the other hand, local governments are not real entrepreneurs, and they will not
bear the risks of investment failure like real entrepreneurs.
Their investment criteria are also different from entrepreneurs', and they would
not make the investment decision according to the profit of investment. In fact,
the investment and constructions sponsored by local governments usually
have such character as soft budget restriction and loose restriction, which
cause the local governments to have strong incentive to invest. The
investment without strict budget restriction is generally inefficient. As a result,
the investment sponsored by local government is not Pareto efficient and the
resources are somewhat wasted which hindered the optimal distribution of
resources. As a result, abundant local government investment could hardly
draw more private investment, and the multiplier effect of investment is low.
Moreover, the investment sponsored by local governments, such as
investment in city infrastructure, in high-tech garden etc., is mostly capital
intensive. Though this kind of investment is huge and has a remarkable
positive effect on short term economic growth.

43
The local governments become the main actor of investment and impetus of
economic growth, which is only one step in the process of China's gradual
reformation, rather than the whole. In the future, with the further development
and perfection of China's marketing economy, the role of local governments in
investment should be weakened. The local governments of different levels
must lessen their direct intervention in economy, and give the controlling and
decision power to enterprises. Thus, enterprises become the real actor of
social investment, and the local governments of different levels concentrate
themselves on public administration.
Under this kind of condition, to thoroughly solve the excessive investment
issue, China’s government should consider to adjust its growth strategy.
According to the report of Former President Hu Jingtao in the 18th China’s
Communist Party, the most important target in next 10 years for China's
government is going to rebalance its economy, to deduce investment rate,
increasing the domestic demand. In the 12th five-year plan, China proposes
setting a concrete investment target rate within the range of 30-35 percent in
the further. Except some sensitive political reform advise, to achieve these
policy objectives, some concrete policies should be adopted.
First, policy should be implemented to realize interest rate marketization.
Raising interest rates and speeding up the process of interest rate
marketization are necessary preconditions for combating excessive
investment. Increasing interest rates can directly increase investment costs
and lead to a decline of demand for investment. Furthermore, an increase in
interest rates can help to depress real estate market bubbles. Actually, interest
rate marketization was under discussion for a long time. To effectively control
excessive investment, Communist Party of China should set a a clear-cut
timetable to achieve the marketization of interest rate.
Second, a clear limited principle for investment should be set by central
government to let the local government understand where the boundary is.
The rapid increase in local government investment expenditure has played a
key role in promoting excessive investment in infrastructure. Therefore, in
order to effectively limit excessive investment in infrastructure, apart from
increasing interest rates, the further reform of the fiscal system should be
necessary, and to establish the strict legal procedure for government
expenditure, and making investment projects fully transparent.
Finally, the real estate bubble needs to be controlled. When per capita income
reached a certain level, pushed by joint forces of high growth, high saving and
low interest rates, a real estate bubble becomes almost inevitable. In the
absence of effective control, a vicious circle between the real estate bubble

44
and excessive investment in real estate will be formed: a real estate bubble
stimulates excessive investment in real estate; conversely, excessive
investment will encourage the vested interest group to maintain the real estate
bubble. Given high growth and high saving, simply increasing interest rates is
not sufficient action to control the real estate bubble, and further measures are
needed, including: a) restricting bank loans to real estate; b) increasing the
flexibility of land supply.

45
Reference:
[1] Qin D, Song HY. Excess investment and efficiency loss during reforms: the
case of provincial-level fixed-asset investment in China. China Economic
Quarterly, 2012, 2(4): 807-832 (in Chinese)
[2] Jin H, Qian Y, Weingast B. Regional decentralization and fiscal incentives:
federalism, Chinese style. Journal of Public Economics, 2005, 89: 1719-1742.
[3] Qian YY, Weingast B. China's transition to markets: market preserving
federalism, Chinese style. Journal of Policy Reform, 1997, 1(2): 149-185.
[4] Qian YY, Roland G. Federalism and the soft budget constraint. American
Economic Review, 1998, 88(5): 1143-1162.
[5] Lin YF, Liu ZQ. China's fiscal decentralization and economic growth.
Journal of Peking University (Humanities and Social Sciences), 2010, 37(4):
5-17 (in Chinese)
[6] Zhang WY, Su SH. Regional competition and privatization of state-owned
enterprises. Economic Research Journal, 1998, (12): 13-22 (in Chinese)
[7] Lu M, Chen Z, Yan J. Increasing return, development strategy and regional
economic segmentation. Economic Research Journal, 2010, (1): 54-63 (in
Chinese)
[8] Xu Y. The short-sighted action of local governments and conflict of regional
economy. Theoretical Research, 2009, (3): 6-9 (in Chinese)
[9] Hu RT, Zhang XY, Su MW. Regional benefits and game behavior in
industrial structure adjustment. Economic Review, 2012, (4): 99-102 (in
Chinese)
[10] Zhang J, Zhang Y. Recalculating the capital of China and a review of Li
and Tang's article. Economic Research Journal, 2007, (7): 35-43 (in Chinese)
[11] Zhang J, Wu GY, Zhang JP. The estimation of China's provincial capital
stock: 1952-2011. Economic Research Journal, 2011, (10): 35-44 (in Chinese)
[12] Jin Y, Lu M, Chen Z. Regional differences of human capitals and
education development in China: an estimation of the panel data. World
Economy, 2011, (12)
46
[13]Bloom, D. and David Canning and Jaypee Sevilla. 2001. Economic growth
and demographic transition. Working Paper 8685. www.nber. Org
[14] Bloom, D. and Jeffrey G. Williamson. 1997. Demographic transitions and
economic miracles in emerging Asia. Working Paper 6268. www. nber. Org
[15] IMF, World Economic Out look, Sep., 2012.
[16] Hong Yuan & Li Lid A Synthetic Analyzing Framework for Local
Government Sustainable Liabilities in China, Finance & Economics, No.
4(2006) , pp. 96- 103.
[17] Zhu Yuming & Zhou Chunyu, On Resolving the Liabilities Problems of
Local Government,d Financial Research , No. 4 ( 2006) , pp. 46- 50.
[18] Zhu Jinping , Cao Yuming & Zhao Aiqun, On the Current Circumstances
and Solution to the Local Government Liabilities, Journal of Hunan Economic
Management College, No. 1 ( 2006) , pp. 56- 60.
[19] Baxter, M1 and Crucini.M. Explaining Savings) Investment Correlations
[ J]1 The American Economic Review, 2003. 416- 4361
[20] Basu Susanto,Weil,David N. Appropriate Technology and Growth
[J]. The Quarterly Journal of Economics, 2008, 113( 4) : 1025-1054.
[21] Barth, James R,Gerard Caprio. Jr. Ross Levine[J]. Bank Regulation
and Supervision: What Works Best? [M]. working paper,World bank.
[22] D murger, Sylvie. “Infrastructure Development and Economic Growth: An
Explanation for Regional Disparities in China?”Journal of Comparative
Economics 29, 2011, pp . 95 - 117.
[23] Zhang Bin. The Empirical Analysis for Risks Management of Local
Government Debt, Journal of Nang Chang University, 2010( 10) : 82-87.