the effects of agricultural contaminants on amphibian...
TRANSCRIPT

The Effects of Agricultural Contaminants on Amphibian Endocrine and Immune Function
By
Paul Gerald Falso
A dissertation submitted in partial satisfaction of the
requirements for the degree of
Doctor of Philosophy
in
Molecular Toxicology
in the
Graduate Division
of the
University of California, Berkeley
Committee in charge:
Professor Tyrone B. Hayes, Chair Professor George E. Bentley
Professor Chris Vulpe
Fall 2011

Copyright © Paul Gerald Falso 2011

! 1
Abstract
The Effects of Agricultural Contaminants on Amphibian Endocrine and Immune Function
by
Paul Gerald Falso
Doctor of Philosophy in Molecular Toxicology
University of California, Berkeley
Professor Tyrone B. Hayes, Chair
Amphibian populations are dramatically reduced from historical numbers on a global scale. Amphibians in agricultural regions experience a diverse set of environmental stressors that may disrupt immune function and increase susceptibility to infection. The draining of wetlands for water and land usage leads to desiccation, crowding, and ultimately temperature extremes. Fertilizers and pesticides further degrade the quality of the available water. American bullfrogs (Lithobates catesbeiana) were collected throughout a gradient of agricultural land use in the Sacramento, San Joaquin, and Salinas River watersheds of California, USA. Animals collected downstream of intense agricultural land use had increased stress hormone (corticosterone) concentrations and altered white blood cell (WBC) differentials and activity relative to those in upstream locations. An individual stressor of global importance, an agrichemical mix, as well as the amphibian immune response to chronic stress were furthered examined in the laboratory. Exposure to a mixture of pesticides and nutrients commonly applied in California did not affect plasma corticosterone or immune function of adult L. catesbeiana, suggesting that additional factors or exposure scenarios influence amphibians in the wild. The effects of chronic stress on blood cell differentials and function were characterized in lab-bred African clawed frogs (Xenopus laevis) and wild-caught L. catesbeiana. In both species, increased plasma corticosterone was associated with increased whole blood oxidative burst activity and blood neutrophil concentrations, while blood lymphocyte and eosinophil concentrations were decreased. Taken together, our results suggest that wild amphibians experience stressful conditions in agricultural habitats and that stressors may alter immunity and result in disease. !

! i!
This document is dedicated to my family, who taught me respect for all life, understood
my fascination with nature, and gave me the education that will enable a lifetime of explorations.

! ii!
Table of Contents Acknowledgements page iii Chapter 1 Background page 1 Chapter 2 Agricultural Land Use Stresses Amphibians page 16
and Alters Immune Function Chapter 3 An Amphibian Model of the Effects of an page 77
Environmentally Relevant Contaminant Mixture on Stress and Immunity
Chapter 4 The Effect of Chronic Stress on Blood Cell page 115
Differentials and Function in Laboratory and Wild-caught Amphibian Models
Chapter 5 Conclusion page 176

! iii!
Acknowledgements This work is as much the accomplishment of those who supported me as it is my own. Thank you To my best friend and wife Miranda, who supported me from both near and a distance through the good and hard times. Your love is a constant source of inspiration for me. No more waiting in the car in Berkeley while I change frog tanks (hopefully), but probably more coolers full of frogs in the future. Thank you for understanding me, and for your willingness to chase dreams. To my family, who raised an energetic kid that brought home a lot of animals, started more projects than he could finish, and thought he was a paleontologist/geologist/entomologist/naturalist/explorer/farmer/zookeeper before science schooling even started. I cannot even pretend that I would have accomplished this project without your support and the education you gave me. All the books, school, summer camps, projects, and the hard work you put in so I could get a college education are not unnoticed. I promise to pass on the work ethic and value of education. To my advisor Tyrone. I’ve learned more than I ever thought possible about science, and probably more about life, in my time working with you. Thanks for giving me a chance and allowing me the freedom to learn. It has been a pleasure to work with such an intelligent and capable scientist. The experimental approach that I learned from you will guide me in all my future science endeavors. I hope to pass on the energy and communicate the importance of the work we do. Just a few of the important things I learned from you and will remember: “depends on your question”, “Don’t screw up”, “you know what you are doing out there at 2am, what are they doing there?”, “four wheel drive is to get out! not for getting in”, “vehicle maintenance is overrated”, “Santa Clause doesn’t feed the animals on Christmas”, “you know what you know! you have no idea what you don’t know”, if it’s too cold to go out there in shorts there won’t be any frogs”, “we collected frogs there in the past”, “you have zero chance of getting the fellowships and grants you don’t apply for”, “there will always be one bad review! you can’t let it get to you too much”, “try it”, “results don’t mean anything if they weren’t collected reliably”, “these, those, and this don’t actually mean anything! just say it”, and “you want your work to stand up”. To all my teachers and mentors. This accomplishment would not have been possible without your hard work along the path of my education. To my colleague and Hawaiian sister Sherrie Gallipeau. Thanks for having my back against that prehistoric cat-beast at Santa Margarita! and other less life-threatening issues. Waking up in the car on the drives home to the image of you ruling the carpool lane and pretending to be Beyonce will stick with me forever. You’ve got great taste in gas station food!. 5 thumbs up.

! iv!
To the undergraduate students of Hayes Lab, especially Jesus Diaz, Christopher Noble, Laura Meehan August, and Mai Nguyen. Thanks for your help, great ideas, and fun times. To George and Chris. Your advice in committee meetings was crucial. To my friends and life coaches, Max Ruby and Travis Brown. I probably would not have finished this degree without your friendship. You can take pride in this one... it does mean something. To the friendly policeman I met while driving rapidly back from Santa Margarita on I-880, the gentleman at the Grasslands WA who had intentions of eating my experiment frogs, all the good people who had (non-frog related) business at Del Puerto Canyon at 3am, the warm landlord who evicted me in the middle of my field season, several other landlords in Berkeley, the Piper Lady, all the well-meaning protesters who pulled fire alarms during the most time critical point in experiments, and all the other characters in the California experience. I admit to not being thankful at the time, but you all certainly made things interesting and some good stories later. You have enriched my life. To everyone who offered advise on this project including: Don Weston, Len Bjeldanes, Mary Stice, Theresa Stueve, Mike Wang, Nick Arpaia, Robert Beatty, Beth Johnstone, Kelly Jensen, Jody Melton Witt, Rebekah Gibble, Steve Friet, The OLAC crew To everyone who offered resources to make this project possible including: Jauques Robert, Len Bjeldanes, Holly Hantz, Marta Soden, Lydia Smith, Mark Hentellef
To everyone who helped with access to land for field collections including: Steve Quick – Pleasanton Ridge EBRP, Ed Leong – Sibley Volcanic Regional Preserve – EBRP, Jamie Bettaso – USFWS, Steve Starcher, The Fresno San Joaquin Crew, Eric Hopson – USFWS, San Joaquin NWR, Mike Wolder – USFWS, Sacramento NWR, Steve Miyamoto – CADFG, North Grasslands WA, James Chakarun – CADFG, Battle Creek WA, Beatrix Treiterer – USFWS, Stone Lakes NWR To everyone who assisted me on this project in the lab and field including: Laura Meehan August, Julian August, Mariam Nazir, Elton Chan, Allen Rodriguez, Cindy Bick, Mai Nguyen, Vicky Khoury, Jesus Diaz, Mandy Proudman, Michelle Thomas, Suzuki Rodriguez, Roya Vahdatinia, Susan Luong, Win Mai, Chantelle Khambholja, Phillip Williams, Christopher Noble, Brian Tian To the agencies who provided funding for my graduate work; the University of California Toxic Substance Research and Teaching Program and the National Science Foundation

! 1!
Chapter 1 Background Amphibian decline
Amphibian populations worldwide are experiencing dramatic declines. The first indications of decline were observed in recent decades and reported in the early 1990s (Blaustein and Wake 1990, Wake 1991). At this time it was unclear whether these mostly anecdotal accounts of population disappearances were due to natural episodic fluctuations in population numbers or a general trend among amphibian species (Blaustein and Wake 1990, Blaustein et al. 1994). Biologists now agree that many amphibian populations are rapidly and in some cases irreversibly declining (Alford and Richards 1999, Houlahan et al. 2000, Stuart et al. 2004). Despite resilience to previous global change, current conditions appear increasingly unfavorable for amphibian survival, and many feel this phenomenon represents the symptoms of a global biodiversity crisis (Wake and Vredenburg 2008).
As of the year 2010, approximately 20 years following the first reports of amphibian decline, nearly one third of the 6,638 described amphibian species were threatened or extinct (Stuart et al. 2004, IUCN 2010). The international Union for the Conservation of Nature (IUCN) reports that between 1996 and the present amphibians have remained the most highly threatened class of vertebrates (IUCN 2010). Estimates indicate that 159 amphibian species have already been lost to extinction. Approximately 42% of amphibian species are declining and less than 1% are increasing in numbers. Further complicating our understanding of these trends is the often cryptic and episodic nature of amphibian populations. An estimated 25% of populations cannot be determined for threatened status because insufficient data exists for analysis (Stuart et al. 2004, IUCN 2010).
The proposed causes for declines include habitat loss, climate change, disease, overexploitation, increased exposure to UV radiation, introduction of invasive species, and exposure to environmental contamination (included below and extensively reviewed by our laboratory in (Hayes et al. 2010)). In the case of species that historically inhabited industrial, agricultural, or highly developed lowland habitat, the causes of decline may be attributed to catastrophic habitat loss and degradation (IUCN 2010). More concerning are those species for which the declines are “enigmatic” because there is limited evidence for their cause and no current proposals for their conservation (Stuart et al. 2004). Many of these enigmatic declines have occurred in protected geographic regions or regions where habitat destruction and anthropogenic influence are not obvious, suggesting that their causes are general, and of global scope (Carey 1993, Lips 1999, Lips et al. 2004, Lips et al. 2006). As part of the Global Amphibian Assessment in 2008, putative causes of population decline were assigned based on expert knowledge for each scenario. The most commonly assigned cause of decline was habitat destruction (IUCN 2010). Pollution, fire, disease, and invasive species followed as additional major threats. Current research has expanded from individual causes of amphibian decline, and now focuses on multiple stressors and the interactions between them ((Kiesecker and Blaustein 1995, Lawler et al. 1999, Taylor et al. 1999, Allran and Karasov 2000, Davidson et al. 2001, Davidson et al. 2002, Kiesecker 2002, Blaustein et al. 2003, Sullivan and Spence 2003, Relyea 2004, Orton et al. 2006, Roe et al. 2006, Boone et al. 2007, Davidson et al. 2007, Davidson and

! 2!
Knapp 2007, Johnson et al. 2007, Relyea and Diecks 2008, Rohr et al. 2008a, Rohr et al. 2008c, Mackey and Boone 2009, Marcogliese et al. 2009)and reviewed in (Hayes et al. 2010)). A better understanding of the factors that contribute to amphibian declines will allow direction of conservation and restoration efforts not only to sensitive amphibian populations, but global biodiversity as a whole.
Disease as a Driver of Amphibian Decline
Consistent with the reports of the Global Amphibian Assessment, one of the most widely reported causes for the rapid decline of amphibian species is disease (Cunningham et al. 1996, Daszak et al. 1999, Green et al. 2002, Daszak et al. 2003, Stuart et al. 2004, IUCN 2010). Prior to the 1990s, little information was available about the etiology of amphibian die offs. Most mortality and morbidity events were attributed to Aeromonas hydrophila manifested as “Red leg syndrome” so called because of the symptoms of erythema and hemorrhage in the hind limb skin (Wright and Whitacker 2001, Green et al. 2002, Densmore and Green 2007). However, no extensive histological or virological studies were initiated until public concern was expressed to government agencies over widespread die offs and deformities in Minnesota USA and mortality events in Britain (Cunningham et al. 1996, Converse et al. 2000, Green et al. 2002). Today, the greatest volume of evidence that specific pathogens may lead to amphibian deformity, disease, or death exists for two species of fungus (Batrachochytrium dendrobatidis and Saprolegnia ferax), an iridovirus (ranavirus), and trematode macroparasites of the genus Ribeiroia and Echinostoma (Kiesecker and Blaustein 1995, Cunningham et al. 1996, Jancovich et al. 1997, Berger et al. 1998, Daszak et al. 1999, Johnson et al. 1999, Kiesecker et al. 2001, Green et al. 2002, Daszak et al. 2003, Skerratt et al. 2007, Rohr et al. 2008c, Johnson and McKenzie 2009). However, an explanation for the current increase in disease occurrence is debated. Two hypotheses have been presented and extensively reviewed for the fungus, Batrachochytrium dendrobatidis (often abbreviated as chytrid) in (Rachowicz et al. 2005). The first hypothesis is that pathogens (most notably chytrid) have been recently introduced to naïve populations such as those in relatively undisturbed montane regions of the western United States, Central America, and Australia (Lips 1999, Lips et al. 2004). A second hypothesis suggests that the pathogens themselves have increased in virulence due to recent changes in environmental conditions (Kiesecker et al. 2001, Pounds et al. 2006, Johnson et al. 2007, Rohr et al. 2008c)
These studies support the virulence of pathogens among amphibian populations in the wild and in controlled laboratory experiments. However, both of the above hypotheses may also be supported by a general decrease in the quality of habitat, and subsequent impacts on host pathogen ecology. Alteration of habitat through chemical contamination, and subsequent effects on amphibian physiology, are the focus of this dissertation and will be reviewed in further sections.
The first hypothesis involves altered ecology of the pathogens themselves. Pathogens may be environmentally limited in range or reproduction. Changing environmental conditions may release these limitations and increase virulence. The fragmentation of habitat may crowd hosts or force migration into suboptimal areas. Consistent with a theory of presentation of novel pathogens to naïve populations, climate change may allow pathogens to survive regions where adaptation of host

! 3!
resistance has not previously occurred (Lips et al. 2008). Many macroparasites have complex life cycles requiring multiple host species to complete their life cycle (Johnson and McKenzie 2009). Aquatic eutrophication and pollution can alter potentially limited secondary host populations or resources through indirect mechanisms (Johnson et al. 2007, Relyea and Diecks 2008). Pathogen pollution through anthropogenic activity or mobile wildlife species may spread pathogens where geological barriers prevented previous dispersal, such as anecdotal accounts of the spread of chytrid through Kings Canyon National Park in California USA, resulting in declines of these populations by human park visitors and mobile sympatric species (Vredenburg et al.). There is additional evidence that the introduction of invasive species may also play a role in pathogen introduction and spread. For example, the American bullfrog (Rana catesbeiana) and the African clawed frog (Xenopus laevis) are well known invasive species that play an ecological role in amphibian declines (Kupferberg 1997). These species also have been found to carry the fungus chytrid as they invade new habitats, but are not susceptible to mortality by the fungus except under conditions of extreme stress (Hanselmann et al. 2004, Weldon et al. 2004).
In support of the second hypothesis, many studies have shown that environmental factors have a profound influence on both disease ecology as well as the immune function of the host. Changing climatic conditions may lead to both increased virulence of pathogens as well as decreased ability for the host to initiate appropriate immune defense (Maniero and Carey 1997, Pounds et al. 2006, Raffel et al. 2006). Ozone depletion may increase exposure of amphibians (particularly egg and larval stages) to damaging ultraviolet radiation. Studies by Kiesecker and colleagues support a link between increased UV exposure and infection by the fungal pathogen Saprolegnia ferax in declining amphibian populations of the Pacific Northwest USA (Kiesecker et al. 2001). Many studies show the effects of chemical contamination with respect to both disease ecology (Johnson et al. 2007, Relyea and Diecks 2008) and altered immune response to bacterial, fungal, viral, and macroparasite infections (Kiesecker 2002, Gendron et al. 2003, Forson and Storfer 2006, Hayes et al. 2006, Davidson et al. 2007, Budischak et al. 2008, Rohr et al. 2008c). Changes in the physical habitat may also have impacts for both developing and adult amphibians. Increased temperatures (Brodkin et al. 1992), crowding to simulate dessication (Glennemeier and Denver 2002), and reduced water quality through lack of renewal have been shown to stress amphibians (Wright and Whitacker 2001) and lead to disease and mortality. This stress from compromised conditions may have implications in either the immediate (Hubbard 1981, Brodkin et al. 1992, Taylor et al. 1999) or long term (Gervasi and Foufopoulos 2008). Any disruption to the homeostasis of the host by physical or chemical mechanisms, resource availability, and competition or predators may culminate as perceived stressful conditions and lead to immunosuppression. Based on field observations of agricultural regions in California, previous studies in our laboratory, and the results of this dissertation work it is the opinion of our laboratory that in most cases both of these hypotheses are at least partially correct (Hayes et al. 2010). The balance of both the pathogen and host ecology leads to conditions of increased host disease. The following sections will outline the evidence supporting this view, with emphasis on the agricultural setting.

! 4!
Endocrine Disruption in a Disrupted Landscape The study sites for this project are located in California, the world’s fifth largest
producer of food and agricultural commodities (CDFA 2010). In an agricultural landscape, alterations to habitat are often the consequence of maintaining profitable production. For example, approximately 14 trillion gallons of surface and groundwater are diverted from the state’s freshwater supplies, 80% of which is used for agricultural irrigation (CDWR 2008). Fertilizers increase crop yield, yet extensive application leads to concern for public health due to groundwater contamination and ecological changes resulting from eutrophication (Johnson et al. 2007, CDWR 2008, Rohr et al. 2008c). In addition, 155 million pounds of pesticide active ingredients are applied annually to crops (CDPR 2011). This scenario implies that the majority of water in agricultural watersheds is managed under unnatural flow conditions and is contaminated with nutrients and pesticides.
Previously, our laboratory showed that sub-chronic treatment of African Clawed frogs (Xenopus laevis), with a pesticide mixture including atrazine, S-metolachlor, alachlor, nicosulfuron, cyfluthrin, !-cyhalothrin, tebupirimphos, metalaxyl, and propiconizole increased plasma stress hormone (corticosterone) levels (Hayes et al. 2006). Other researchers have reported increased corticosterone levels of adult toads (Bufo terrestris) and altered hypothalamic-pituitary-interenal axis responses of Bufo terrestris and mudpuppies (Necturus maculosus) in field experiments from regions contaminated with coal ash and polychlorinated biphenyls (PCB) (Gendron et al. 1997, Hopkins et al. 1997, 1999). In addition, laboratory exposure of larval Cuban treefrogs (Osteopilus septentrionalis) to the fungicide chlorothalonil, Southern Leopard frogs (Rana sphenocephala) to coal combustion residues, and Northern Leopard frogs (Rana pipiens) to the PCB congener TC-77 altered corticosterone levels in (Glennemeier and Denver 2001, Peterson et al. 2009, McMahon et al. 2011). Thus, chemical contaminants found in amphibian habitats at ecologically relevant concentrations alter the activity of hypothalamic-pituitary-interenal function in amphibians.
Chemical Contamination Alters Amphibian Immune Function and Decreases Disease Resistance
Numerous studies have documented the effects of chemical contamination on the amphibian immune system, and are summarized in the following sections. Many of these studies suggest that amphibians are particularly sensitive to contaminants in field observations, experimental field manipulations, and laboratory tests. Experimental treatment of amphibians with common aquatic contaminants results in alterations in immune cell counts, cell and tissue morphologies, immune cell activities, skin peptide response, gene expression, and infection intensities as described below. Altered immune cell counts
Exposure to the herbicide atrazine alone (Rohr et al. 2008c) and in combination with esfenvalerate and malathion (Kiesecker 2002) has been correlated with decreased eosinophilic cells (Rohr et al. 2008c), decreased melanomacrophage centers (Rohr et al. 2008c), and decreased peripheral leukocyte levels (Forson and Storfer 2006). In a field setting, animals collected from agricultural sites contaminated with atrazine and metolachlor had fewer eosinophils and higher heterophil to lymphocyte ratios than animals collected from nonagricultural sites (Shutler and Marcogliese 2011). In

! 5!
contrast, an increase in leukocytes, specifically eosinophils and lymphocytes, was observed following treatment with malathion alone (Kundu and Roychoudhury 2009). The fungicide chlorothalonil decreased liver cell density and altered liver leukocyte profiles (McMahon et al. 2011). Altered immune gene regulation
Chronic exposure of Xenopus laevis to atrazine resulted in modulation of genes involved in growth and metabolism, proteolysis, fibrinogen complex formation and immune regulation. Seven genes associated with the immune system were significantly down-regulated. Of particular interest were genes associated with skin peptides, and subsequent defense against the fungal pathogen chytrid (magainin II, levitide A, preprocarulein, skin granule protein) (Langerveld et al. 2009). The pesticides cypermethrin, fluoxetine, and thiabendazole altered expression of the genes Interleukin-
1! and Heat Shock Protein 70 (Martini et al. 2010). Altered immune cell activity
Contaminant exposure altered both innate and adaptive immune activity in assays of functional integrity in amphibian immune cell responses. The oxidative potential of immune cells was decreased by atrazine, metribuzine, endosulfan, lindane, aldicarb and dieldrin (Gilbertson et al. 2003), and increased by fenthion and omethoate (Celik et al. 2010). Phagocytic activity against model pathogens was decreased by lead (Rosenberg et al. 2003) and atrazine (Brodkin et al. 2007). Atrazine reduced thioglycollate-stimulated recruitment of white blood cells (Brodkin et al. 2007). Delayed-type-hypersensitivity response was altered by atrazine, metribuzine, endosulfan, lindane, aldicarb and dieldrin (Gilbertson et al. 2003) and DDT (Albert et al. 2007). Antibody production was decreased by atrazine alone (Houck and Sessions 2006), atrazine, metribuzine, endosulfan, lindane, aldicarb and dieldrin (Gilbertson et al. 2003) and DDT (Albert et al. 2007), but was increased by lead (Rosenberg et al. 2002). The proliferation response of mitogen-stimulated lymphocytes was decreased by exposure to atrazine, metribuzine, endosulfan, lindane, aldicarb and dieldrin (Christin et al. 2003, Christin et al. 2004). In a developmental assay, diazinon treatment of amphibian embryos decreased hematopoietic capability in later larval stages (Rollins-Smith et al. 2004). Altered morphology and damage to immune tissues
Developmental exposure to a mixture of atrazine, S-metolachlor, alachlor, nicosulfuron, cyfluthrin, !-cyhalothrin, tebupirimphos, metalaxyl, and propiconizole resulted in thymic damage in later metamorphic stages (Hayes et al. 2006). Spleen cellularity was altered in animals living in regions heavily contaminated with organochlorine pesticides (Linzey et al. 2003). Cell density and leukocyte profiles were altered by the fungicide chlorothalonil in liver (McMahon et al. 2011) and by organochlorines (Linzey et al. 2003) and a mix of atrazine, metribuzine, endosulfan, lindane, aldicarb and dieldrin (Christin et al. 2004) in the spleen. Liver melanomacrophage aggregates in wild-caught animals have been observed to increase in regions contaminated with organochlorines (Linzey et al. 2003) and decrease in association with atrazine (Rohr et al. 2008c). Peripheral blood cell morphology was altered in several studies of wild caught animals from rice growing regions potentially contaminated with endosulfan, cypermethrin, and methamidophos (Barni et al. 2007, Attademo et al. 2011).

! 6!
Increased pathogen infection in laboratory models Laboratory exposures to numerous contaminants have been observed to
increase infection burdens in host parasite model systems. This trend has been observed across parasite taxa and includes several studies on helminth macroparasites as well as bacterial and viral pathogens. The greatest number of experimental studies on chemical induced modulation of host parasite interactions exists for helminth worms. Trematode worms of two genus associated with amphibian declines, Ribeiroia and Echinostoma, were shown to increase infection rates when amphibian hosts were exposed to atrazine, esfenvalerate, and malathion (Kiesecker 2002), synthetic nitrogen and phosphorus (Johnson et al. 2007), malathion (Budischak et al. 2008), atrazine, glyphosate, carbaryl, and malathion (Rohr et al. 2008b), and atrazine (Rohr et al. 2008c). A third genus of trematode, Telorchis, also increased infection with atrazine, esfenvalerate, and malathion (Kiesecker 2002). Parasitic nematode lungworms (Rhabdias ranae) were more successful in infecting amphibian hosts following exposure to atrazine, metribuzin, aldicarb, endosulfan, lindane and dieldrin (Christin et al. 2003, Gendron et al. 2003).
In addition to increased infection by macroparasites, the dynamics of host pathogen ecology are influenced by chemical contamination. Budischak and colleagues showed that amphibian embryoes exposed to the insecticide malathion suffered not only increased Echinostoma infections in later metamorphic life stages (no longer in the presence of malathion) but suffered from greater malformation rates as well (Budischak et al. 2008). Finally, and perhaps most important for amphibian conservation, Koprivnikar and colleagues, observed increased lethality of Echinostoma infection in the presence of both atrazine and predator cues (Koprivnikar 2010). Though less evidence exists, chemical contaminants similarly appear to increase viral and bacterial infection rates. Malathion treatment increased infection and mortality in toads challenged with the bacterium Aeromonas hydrophila (Taylor et al. 1999), and a mixture of atrazine, S-metolachlor, alachlor, nicosulfuron, cyfluthrin, !-cyhalothrin, tebupirimphos, metalaxyl, and propiconizole resulted in an unintentional infection with an opportunistic Flavobacterium in a developmental laboratory experiment (Hayes et al. 2006). Atrazine alone (Forson and Storfer 2006) and in combination with chlorpyrifos (Kerby and Storfer 2009) has been implicated in increased susceptibility and mortality to Ambystoma tigrinum virus (ATV). Altered skin peptide response
Several chemical contaminants reportedly alter skin peptide response, a key defense in amphibian hosts against the fungal pathogen chytrid. The insecticide carbaryl decreased secreted skin peptide amounts following artificial stimulation (Davidson et al. 2007). In a similar experimental system, Gibble and Baer found that exposure to agricultural runoff water and treated wastewater effluent decreased bioactivity of skin peptides against the chytrid fungus in vitro in Xenopus laevis larvae (Gibble and Baer 2011). Field evidence of immune alterations in contaminated environments
Following the evidence of chemical effects on immune function and pathogen resistance within laboratory experiments, fertilizers and pesticides are correlated with altered immune function, increased parasite infection, and altered ecology in field observations. Atrazine and malathion, (Kiesecker 2002) atrazine and phosphate (Rohr

! 7!
et al. 2008c, Schotthoefer et al. 2011), and atrazine (Marcogliese et al. 2009, King et al. 2010) were associated with increased trematode spp. infections in wild-caught animals. Blood collected from animals in rice growing regions with heavy endosulfan, cypermethrin, and methamidophos usage was more heavily infected with species of Trypanosom (Attademo et al. 2011). Amphibians collected from regions dominated by agricultural land use are often more heavily parasitized and macroparasite communities are altered compared to those from non-agricultural regions. However, in some cases of increased infection at agricultural sites, specific contaminants were not measured nor found in trend with infections. For example, trematode infections were increased in agricultural habitats as compared to those in non-agricultural regions, yet no significant correlation was seen between infections and specific measurements of atrazine and metolachlor (Koprivnikar et al. 2006, King et al. 2007). This may suggest that the sole chemical contaminant cause was not identified, or that parasite infections are not driven by chemical contamination alone.
Ecological investigations suggest that both landscape and land use play important roles in shaping parasite communities and infection dynamics (King et al. 2007, King et al. 2010, Schotthoefer et al. 2011). Overall parasite diversity and species richness in frogs were lower in regions of close proximity to agriculture and land development (King et al. 2007, Marcogliese et al. 2009, King et al. 2010). Loss of total diversity in disrupted habitats may interfere with the ecology of host species supporting complex life cycles of parasites. However, several studies suggest that parasites with generalist life histories and host promiscuity, such as direct life cycle nematodes and Echinostoma trematodes, were more robust to land use change (King et al. 2007, Marcogliese et al. 2009, King et al. 2010). Despite habitat alteration, the generalist parasites remained common, or became more common parasites of anuran hosts in comparison to other parasite species.
In addition to parasite community shifts to species of greater amphibian pathogenicity, host animals may also be immunocompromised in agricultural regions. Field evidence of this effect is evidenced by altered peripheral leukocyte ratios and decreased eosinophilic leukocytes in ponds contaminated with atrazine and metolachlor (Shutler and Marcogliese 2011). Butyrylcholinesterase levels were lower at agricultural sites contaminated with endosulfan, cypermethrin, and methamidophos and blood cells showed morphological malformations (Attademo et al. 2011).
Further supporting a case for chemical contaminant harm to amphibian health, limb deformities and mortality have been associated with imcreased parasites burdens as a result of chemical exposure. In a parasite exclusion experiment, Kiesecker manipulated field exposure of developing frog larvae to parasite cercaeria (Kiesecker 2002). Frogs developing in enclosures of contaminated ponds had higher parasite burdens and malformations when access to parasites was allowed. Manipulation of nutrient levels in mesocosm studies altered parasite ecology and increased first host (snail) growth growth, parasite reproduction, parasite infectivity, and resulted in negative effects on amphibian survival (Johnson et al. 2007).
Taken together, existing scientific evidence supports that chemical contamination is both a widespread and immediate factor influencing amphibian health. Specifically, the sublethal effects on amphibians outlined above will be further explored by the work in this dissertation. Chapter 2 will provide further field evidence from California, USA of

! 8!
agricultural contaminant effects on amphibian endocrine and immune function. Chapter 3 will provide an examination of the effects that environmental stressors, as modeled by exogenous corticosterone treatment, have on amphibian immune function. Finally, Chapter 4 will outline the effects of a specific environmental stressor, an agrichemical mix, relevant to declining amphibian populations in California, USA. References: Albert, A., K. Drouillard, G. D. Haffner, and B. Dixon. 2007. Dietary exposure to low
pesticide doses causes long-term immunosuppression in the leopard frog (Rana pipiens). Environmental Toxicology and Chemistry 26:1179-1185.
Alford, R. A. and S. J. Richards. 1999. Global amphibian declines: A problem in applied ecology. Annual Review of Ecology and Systematics 30:133-165.
Allran, J. W. and W. H. Karasov. 2000. Effects of atrazine and nitrate on northern leopard frog (Rana pipiens) larvae exposed in the laboratory from posthatch through metamorphosis. Environmental Toxicology and Chemistry 19:2850-2855.
Attademo, A. M. A. A. M., M. Cabagna-Zenklusen, R. C. Lajmanovich, P. M. Peltzer, C. Junges, and A. Basso. 2011. B-esterase activities and blood cell morphology in the frog Leptodactylus chaquensis (Amphibia: Leptodactylidae) on rice agroecosystems from Santa Fe Province (Argentina). Ecotoxicology 20:274-282.
Barni, S., E. Boncompagni, A. Grosso, V. Bertone, I. Freitas, M. Fasola, and C. Fenoglio. 2007. Evaluation of Rana snk esculenta blood cell response to chemical stressors in the environment during the larval and adult phases. Aquatic Toxicology 81:45-54.
Berger, L., R. Speare, P. Daszak, D. E. Green, A. A. Cunningham, C. L. Goggin, R. Slocombe, M. A. Ragan, A. D. Hyatt, K. R. McDonald, H. B. Hines, K. R. Lips, G. Marantelli, and H. Parkes. 1998. Chytridiomycosis causes amphibian mortality associated with population declines in the rain forests of Australia and Central America. Proceedings of the National Academy of Sciences of the United States of America 95:9031-9036.
Blaustein, A. R., J. M. Romansic, J. M. Kiesecker, and A. C. Hatch. 2003. Ultraviolet radiation, toxic chemicals and amphibian population declines. Diversity and Distributions 9 :123-140.
Blaustein, A. R. and D. B. Wake. 1990. Declining amphibian populations - a global phenomenon Trends in Ecology & Evolution 5 :203-204.
Blaustein, A. R., D. B. Wake, and W. P. Sousa. 1994. Amphibian declines - Judging stability, persistence, and susceptibility of populations to local and global extinctions. Conservation Biology 8 :60-71.
Boone, M. D., R. D. Semlitsch, E. E. Little, and M. C. Doyle. 2007. Multiple stressors in amphibian communities: Effects of chemical contamination, bullfrogs, and fish. Ecological Applications 17:291-301.
Brodkin, M. A., H. Madhoun, M. Rameswaran, and I. Vatnick. 2007. Atrazine is an immune disruptor in adult northern leopard frogs (Rana pipiens). Environmental Toxicology and Chemistry 26:80-84.

! 9!
Brodkin, M. A., M. P. Simon, A. M. Desantis, and K. J. Boyer. 1992. Response of Rana pipiens to graded doses of the bacterium Pseudomonas aeruginosa. Journal of Herpetology 26:490-495.
Budischak, S. A., L. K. Belden, and W. A. Hopkins. 2008. Effects of malathion on embryonic development and latent susceptibility to trematode parasites in ranid tadpoles Environmental Toxicology and Chemistry 27:2496-2500.
Carey, C. 1993. Hypothesis concerning the causes of the disappearance of Boreal toads from the mountains of Colorado Conservation Biology 7 :355-362.
CDFA. 2010. California Agricultural Resources Directory 2010-2011. California Department of Food and Agriculture, Sacramento, CA.
CDPR. 2011. California Pesticide Use Reporting (PUR). California Department of Pesticide Regulation.
CDWR. 2008. California Agricultural Water Use Program. California Department of Water Resources, Office of Water Use Efficiency and Transfers.
Celik, I., I. Isik, N. Ozok, and M. S. Kaya. 2010. Neurotoxic and immunotoxic effects of fenthion and omethoate on frogs at acute exposure. Toxicology and Industrial Health 27:357-362.
Christin, M. S., A. D. Gendron, P. Brousseau, L. Menard, D. J. Marcogliese, D. Cyr, S. Ruby, and M. Fournier. 2003. Effects of agricultural pesticides on the immune system of Rana pipiens and on its resistance to parasitic infection. Environmental Toxicology and Chemistry 22:1127-1133.
Christin, M. S., L. Menard, A. D. Gendron, S. Ruby, D. Cyr, D. J. Marcogliese, L. Rollins-Smith, and M. Fournier. 2004. Effects of agricultural pesticides on the immune system of Xenopus laevis and Rana pipiens. Aquatic Toxicology 67:33-43.
Converse, K. A., J. Mattsson, and L. Eaton-Poole. 2000. Field surveys of Midwestern and Northeastern fish and wildlife service lands for the presence of abnormal frogs and toads. Journal of the Iowa Academy of Science 107:160-167.
Cunningham, A. A., T. E. S. Langton, P. M. Bennett, J. F. Lewin, S. E. N. Drury, R. E. Gough, and S. K. MacGregor. 1996. Pathological and microbiological findings from incidents of unusual mortality of the common frog (Rana temporaria). Philosophical Transactions of the Royal Society of London Series B-Biological Sciences 351:1539-1557.
Daszak, P., L. Berger, A. A. Cunningham, A. D. Hyatt, D. E. Green, and R. Speare. 1999. Emerging infectious diseases and amphibian population declines. Emerging Infectious Diseases 5 :735-748.
Daszak, P., A. A. Cunningham, and A. D. Hyatt. 2003. Infectious disease and amphibian population declines. Diversity and Distributions 9 :141-150.
Davidson, C., M. F. Benard, H. B. Shaffer, J. M. Parker, C. O'Leary, J. M. Conlon, and L. A. Rollins-Smith. 2007. Effects of chytrid and carbaryl exposure on survival, growth and skin peptide defenses in foothill yellow-legged frogs. Environmental Science and Technology 41:1771-1776.
Davidson, C. and R. A. Knapp. 2007. Multiple stressors and amphibian declines: dual impacts of pesticides and fish on yellow-legged frogs. Ecological Applications 17:587-597.

! 10!
Davidson, C., H. B. Shaffer, and M. R. Jennings. 2001. Declines of the California red-legged frog: Climate, UV-B, habitat, and pesticides hypotheses. Ecological Applications 11:464-479.
Davidson, C., H. B. Shaffer, and M. R. Jennings. 2002. Spatial tests of the pesticide drift, habitat destruction, UV-B, and climate-change hypotheses for California amphibian declines. Conservation Biology 16:1588-1601.
Densmore, C. L. and D. E. Green. 2007. Diseases of amphibians. Ilar Journal 48:235-254.
Forson, D. D. and A. Storfer. 2006. Atrazine increases ranavirus susceptibility in the tiger salamander, Ambystoma tigrinum. Ecological Applications 16:2325-2332.
Gendron, A. D., C. A. Bishop, R. Fortin, and A. Hontela. 1997. In vivo testing of the functional integrity of the corticosterone-producing axis in mudpuppy (amphibia) exposed to chlorinated hydrocarbons in the wild. Environmental Toxicology and Chemistry 16:1694-1706.
Gendron, A. D., D. J. Marcogliese, S. Barbeau, M. S. Christin, P. Brousseau, S. Ruby, D. Cyr, and M. Fournier. 2003. Exposure of leopard frogs to a pesticide mixture affects life history characteristics of the lungworm Rhabdias ranae. Oecologia 135:469-476.
Gervasi, S. S. and J. Foufopoulos. 2008. Costs of plasticity: responses to desiccation decrease post-metamorphic immune function in a pond-breeding amphibian. Functional Ecology 22:100-108.
Gibble, R. E. and K. N. Baer. 2011. Effects of atrazine, agricultural runoff, and selected effluents on antimicrobial activity of skin peptides in Xenopus laevis. Ecotoxicology and Environmental Safety 74:593-599.
Gilbertson, M. K., G. D. Haffner, K. G. Drouillard, A. Albert, and B. Dixon. 2003. Immunosuppression in the northern leopard frog (Rana pipiens) induced by pesticide exposure. Environmental Toxicology and Chemistry 22:101-110.
Glennemeier, K. A. and R. J. Denver. 2001. Sublethal effects of chronic exposure to an organochlorine compound on northern leopard frog (Rana pipiens) tadpoles. Environmental Toxicology 16:287-297.
Glennemeier, K. A. and R. J. Denver. 2002. Role for corticoids in mediating the response of Rana pipiens tadpoles to intraspecific competition. Journal of Experimental Zoology 292:32-40.
Green, D. E., K. A. Converse, and A. K. Schrader. 2002. Epizootiology of sixty-four amphibian morbidity and mortality events in the USA, 1996-2001. Pages 323-339 Domestic Animal/Wildlife Interface: Issue for Disease Control, Conservation, Sustainable Food Production, and Emerging Diseases. New York Acad Sciences, New York.
Hanselmann, R., A. Rodriguez, M. Lampo, L. Fajardo-Ramos, A. A. Aguirre, A. M. Kilpatrick, J. P. Rodriguez, and P. Daszak. 2004. Presence of an emerging pathogen of amphibians in introduced bullfrogs Rana catesbeiana in Venezuela. Biological Conservation 120:115-119.
Hayes, T. B., P. Case, S. Chui, D. Chung, C. Haeffele, K. Haston, M. Lee, V. P. Mai, Y. Marjuoa, J. Parker, and M. Tsui. 2006. Pesticide mixtures, endocrine disruption, and amphibian declines: are we underestimating the impact? Environmental Health Perspectives 114 Suppl 1:40-50.

! 11!
Hayes, T. B., P. Falso, S. Gallipeau, and M. Stice. 2010. The cause of global amphibian declines: a developmental endocrinologist's perspective. Journal of Experimental Biology 213:921-933.
Hopkins, W. A., M. T. Mendonca, and J. D. Congdon. 1997. Increased circulating levels of testosterone and corticosterone in southern toads, Bufo terrestris, exposed to coal combustion waste. General and Comparative Endocrinology 108:237-246.
Hopkins, W. A., M. T. Mendonca, and J. D. Congdon. 1999. Responsiveness of the hypothalamo-pituitary-interrenal axis in an amphibian (Bufo terrestris) exposed to coal combustion wastes. Comparative Biochemistry and Physiology C-Toxicology & Pharmacology 122:191-196.
Houck, A. and S. K. Sessions. 2006. Could atrazine affect the immune system of the frog, Rana pipiens? Bios 77:107-112.
Houlahan, J. E., C. S. Findlay, B. R. Schmidt, A. H. Meyer, and S. L. Kuzmin. 2000. Quantitative evidence for global amphibian population declines. Nature (London) 404:752-755.
Hubbard, G. B. 1981. Aeromonas hydrophila infection in Xenopus laevis. Laboratory Animal Science 31:297-300.
IUCN. 2010. IUCN Red List of threatened species. Jancovich, J. K., E. W. Davidson, J. F. Morado, B. L. Jacobs, and J. P. Collins. 1997.
Isolation of a lethal virus from the endangered tiger salamander Ambystoma tigrinum stebbinsi. Diseases of Aquatic Organisms 31:161-167.
Johnson, P. T. J., J. M. Chase, K. L. Dosch, R. B. Hartson, J. A. Gross, D. J. Larson, D. R. Sutherland, and S. R. Carpenter. 2007. Aquatic eutrophication promotes pathogenic infection in amphibians. Proceedings of the National Academy of Sciences of the United States of America 104:15781-15786.
Johnson, P. T. J., K. B. Lunde, E. G. Ritchie, and A. E. Launer. 1999. The effect of trematode infection on amphibian limb development and survivorship. Science 284:802-804.
Johnson, P. T. J. and V. J. McKenzie. 2009. Effects of environmental change on helminth infections in amphibians: exploring the emergence of ribeiroia and echinostoma infections in North America. Pages 249-280 Biology of Echinostomes: From the Molecule to the Community. Springer.
Kerby, J. L. and A. Storfer. 2009. Combined effects of atrazine and chlorpyrifos on susceptibility of the tiger salamander to Ambystoma tigrinum virus. Ecohealth 6 :91-98.
Kiesecker, J. M. 2002. Synergism between trematode infection and pesticide exposure: a link to amphibian limb deformities in nature? Proceedings of the National Academy of Sciences of the United States of America 99:9900-9904.
Kiesecker, J. M. and A. R. Blaustein. 1995. Synergism between Uv-B radiation and a pathogen magnifies amphibian embryo mortality in nature. Proceedings of the National Academy of Sciences of the United States of America 92:11049-11052.
Kiesecker, J. M., A. R. Blaustein, and L. K. Belden. 2001. Complex causes of amphibian population declines. Nature 410:681-684.
King, K. C., J. D. McLaughlin, M. Boily, and D. J. Marcogliese. 2010. Effects of agricultural landscape and pesticides on parasitism in native bullfrogs. Biological Conservation 143:302-310.

! 12!
King, K. C., J. D. McLaughlin, A. D. Gendron, B. D. Pauli, I. Giroux, B. Rondeau, M. Boily, P. Juneau, and D. J. Marcogliese. 2007. Impacts of agriculture on the parasite communities of northern leopard frogs (Rana pipiens) in southern Quebec, Canada. Parasitology 134:2063-2080.
Koprivnikar, J. 2010. Interactions of environmental stressors impact survival and development of parasitized larval amphibians. Ecological Applications 20:2263-2272.
Koprivnikar, J., R. L. Baker, and M. R. Forbes. 2006. Environmental factors influencing trematode prevalence in grey tree frog (Hyla versicolor) tadpoles in southern Ontario. Journal of Parasitology 92:997-1001.
Kundu, C. R. and S. Roychoudhury. 2009. Malathion-induced sublethal toxicity on the hematology of cricket frog (Fejervarya limnocharis). Journal of Environmental Science and Health Part B-Pesticides Food Contaminants and Agricultural Wastes 44:673-680.
Kupferberg, S. J. 1997. Bullfrog (Rana catesbeiana) invasion of a California River: The role of larval competition. Ecology 78:1736-1751.
Langerveld, A. J., R. Celestine, R. Zaya, D. Mihalko, and C. F. Ide. 2009. Chronic exposure to high levels of atrazine alters expression of genes that regulate immune and growth-related functions in developing Xenopus laevis tadpoles. Environmental Research 109:379-389.
Lawler, S. P., D. Dritz, T. Strange, and M. Holyoak. 1999. Effects of introduced mosquitofish and bullfrogs on the threatened California red-legged frog. Conservation Biology 13:613-622.
Linzey, D., J. Burroughs, L. Hudson, M. Marini, J. Robertson, J. Bacon, M. Nagarkatti, and P. Nagarkatti. 2003. Role of environmental pollutants on immune functions, parasitic infections and limb malformations in marine toads and whistling frogs from Bermuda. Int J Environ Health Res 13:125-148.
Lips, K. R. 1999. Mass mortality and population declines of anurans at an upland site in western Panama. Conservation Biology 13:117-125.
Lips, K. R., F. Brem, R. Brenes, J. D. Reeve, R. A. Alford, J. Voyles, C. Carey, L. Livo, A. P. Pessier, and J. P. Collins. 2006. Emerging infectious disease and the loss of biodiversity in a Neotropical amphibian community. Proceedings of the National Academy of Sciences of the United States of America 103:3165-3170.
Lips, K. R., J. Diffendorfer, J. R. Mendelson, and M. W. Sears. 2008. Riding the wave: Reconciling the roles of disease and climate change in amphibian declines. Plos Biology 6 :441-454.
Lips, K. R., J. R. Mendelson, A. Munoz-Alonso, L. Canseco-Marquez, and D. G. Mulcahy. 2004. Amphibian population declines in montane southern Mexico: resurveys of historical localities. Biological Conservation 119:555-564.
Mackey, M. J. and M. D. Boone. 2009. Single and interactive effects of malathion, overwintered Green frog tadpoles, and cyanobacteria on Gray treefrog tadpoles. Environmental Toxicology and Chemistry 28:637-643.
Maniero, G. D. and C. Carey. 1997. Changes in selected aspects of immune function in the leopard frog, Rana pipiens, associated with exposure to cold. J Comp Physiol [B] 167:256-263.

! 13!
Marcogliese, D. J., K. C. King, H. M. Salo, M. Fournier, P. Brousseau, P. Spear, L. Champoux, J. D. McLaughlin, and M. Boily. 2009. Combined effects of agricultural activity and parasites on biomarkers in the bullfrog, Rana catasbeiana. Aquatic Toxicology 91:126-134.
Martini, F., C. Fernandez, L. S. Segundo, J. V. Tarazona, and M. V. Pablos. 2010. Assessment of potential immunotoxic effects caused by cypermethrin, fluoxetine, and thiabendazole using heat shock protein 70 and interleukin-1 beta mRNA expression in the anuran Xenopus laevis Environmental Toxicology and Chemistry 29:2536-2543.
McMahon, T. A., N. T. Halstead, S. Johnson, T. R. Raffel, J. M. Romansic, P. W. Crumrine, R. K. Boughton, L. B. Martin, and J. R. Rohr. 2011. The fungicide chlorothalonil is nonlinearly associated with corticosterone levels, immunity, and mortality in amphibians. Environmental Health Perspectives 119:1098-1103.
Orton, F., J. A. Carr, and R. D. Handy. 2006. Effects of nitrate and atrazine on larval development and sexual differentiation in the northern leopard frog Rana pipiens. Environmental Toxicology and Chemistry 25:65-71.
Peterson, J. D., V. A. Peterson, and M. T. Mendonca. 2009. Exposure to coal combustion residues during metamorphosis elevates corticosterone content and adversely affects oral morphology, growth, and development in Rana sphenocephala. Comparative Biochemistry and Physiology Part C Toxicology & Pharmacology 149:36-39.
Pounds, J. A., M. R. Bustamante, L. A. Coloma, J. A. Consuegra, M. P. L. Fogden, P. N. Foster, E. La Marca, K. L. Masters, A. Merino-Viteri, R. Puschendorf, S. R. Ron, G. A. Sanchez-Azofeifa, C. J. Still, and B. E. Young. 2006. Widespread amphibian extinctions from epidemic disease driven by global warming. Nature 439:161-167.
Rachowicz, L. J., J. M. Hero, R. A. Alford, J. W. Taylor, J. A. T. Morgan, V. T. Vredenburg, J. P. Collins, and C. J. Briggs. 2005. The novel and endemic pathogen hypotheses: Competing explanations for the origin of emerging infectious diseases of wildlife. Conservation Biology 19:1441-1448.
Raffel, T. R., J. R. Rohr, J. M. Kiesecker, and P. J. Hudson. 2006. Negative effects of changing temperature on amphibian immunity under field conditions. Functional Ecology 20:819-828.
Relyea, R. A. 2004. Synergistic impacts of malathion and predatory stress on six species of North American tadpoles. Environmental Toxicology and Chemistry 23:1080-1084.
Relyea, R. A. and N. Diecks. 2008. An unforeseen chain of events: Lethal effects of pesticides on frogs at sublethal concentrations. Ecological Applications 18:1728-1742.
Roe, J. H., W. A. Hopkins, S. E. DuRant, and J. A. Unrine. 2006. Effects of competition and coal-combustion wastes on recruitment and life history characteristics of salamanders in temporary wetlands. Aquatic Toxicology 79:176-184.
Rohr, J. R., T. R. Raffel, J. M. Romansic, H. McCallum, and P. J. Hudson. 2008a. Evaluating the links between climate, disease spread, and amphibian declines. Proceedings of the National Academy of Sciences of the United States of America 105:17436-17441.

! 14!
Rohr, J. R., T. R. Raffel, S. K. Sessions, and P. J. Hudson. 2008b. Understanding the net effects of pesticides on amphibian trematode infections. Ecological Applications 18:1743-1753.
Rohr, J. R., A. M. Schotthoefer, T. R. Raffel, H. J. Carrick, N. Halstead, J. T. Hoverman, C. M. Johnson, L. B. Johnson, C. Lieske, M. D. Piwoni, P. K. Schoff, and V. R. Beasley. 2008c. Agrochemicals increase trematode infections in a declining amphibian species. Nature 455:1235-U1250.
Rollins-Smith, L. A., B. D. Hopkins, and L. K. Reinert. 2004. An amphibian model to test the effects of xenobiotic chemicals on development of the hematopoietic system. Environmental Toxicology and Chemistry 23:2863-2867.
Rosenberg, C. E., N. E. Fink, M. A. Arrieta, and A. Salibian. 2003. Effect of lead acetate on the in vitro engulfment and killing capability of toad (Bufo arenarum) neutrophils. Comparative Biochemistry and Physiology C-Toxicology & Pharmacology 136:225-233.
Rosenberg, C. E., A. Salibian, and N. E. Fink. 2002. An enzyme-linked immunosorbent assay for measuring anti-sheep red blood cells antibodies in lead-exposed toads. Journal of Pharmacological and Toxicological Methods 47:121-128.
Schotthoefer, A. M., J. R. Rohr, R. A. Cole, A. V. Koehler, C. M. Johnson, L. B. Johnson, and V. R. Beasley. 2011. Effects of wetland vs. landscape variables on parasite communities of Rana pipiens: links to anthropogenic factors. Ecological Applications 21:1257-1271.
Shutler, D. and D. J. Marcogliese. 2011. Leukocyte profiles of Northern leopard frogs, Lithobates pipiens, exposed to pesticides and hematozoa in agricultural wetlands. Copeia:301-307.
Skerratt, L. F., L. Berger, R. Speare, S. Cashins, K. R. McDonald, A. D. Phillott, H. B. Hines, and N. Kenyon. 2007. Spread of chytridiomycosis has caused the rapid global decline and extinction of frogs. Ecohealth 4 :125-134.
Stuart, S. N., J. S. Chanson, N. A. Cox, B. E. Young, A. S. L. Rodrigues, D. L. Fischman, and R. W. Waller. 2004. Status and trends of amphibian declines and extinctions worldwide. Science 306:1783-1786.
Sullivan, K. B. and K. M. Spence. 2003. Effects of sublethal concentrations of atrazine and nitrate on metamorphosis of the African clawed frog. Environmental Toxicology and Chemistry 22:627-635.
Taylor, S. K., E. S. Williams, and K. W. Mills. 1999. Effects of malathion on disease susceptibility in Woodhouse's toads. Journal of Wildlife Diseases 35:536-541.
Vredenburg, V. T., R. A. Knapp, T. S. Tunstall, and C. J. Briggs. Dynamics of an emerging disease drive large-scale amphibian population extinctions. Proceedings of the National Academy of Sciences of the United States of America 107:9689-9694.
Wake, D. B. 1991. Declining amphibian populations. Science 253:860-860. Wake, D. B. and et al. 1991. Declining amphibian populations a global phenomenon?
Findings and recommendations Alytes (Paris) 9 :33-42. Wake, D. B. and V. T. Vredenburg. 2008. Are we in the midst of the sixth mass
extinction? A view from the world of amphibians. Proceedings of the National Academy of Sciences of the United States of America 105:11466-11473.

! 15!
Weldon, C., L. H. du Preez, A. D. Hyatt, R. Muller, and R. Speare. 2004. Origin of the amphibian chytrid fungus. Emerging Infectious Diseases 10:2100-2105.
Wright, K. M. and B. R. Whitacker. 2001. Amphibian Medicine and Captive Husbandry. Krieger Publishing Company, Malabar, Florida.
!
!
!
!
!
!
!
!
!
!
!
!
!
!
!
!
!
!
!
!
!
!
!
!
!
!
!
!
!
!
!
!
!
!
!
!
!
!
!
!

! 16!
Chapter 2 Agricultural Land Use Stresses Amphibians and Alters Immune Function Abstract
Changing environmental conditions have dramatically decreased global amphibian populations. Increases in susceptibility to pathogens may result from stressful habitat conditions and subsequent disruption of immune response. Amphibian populations in agricultural regions are subject to diverse environmental stressors resulting from human habitat manipulation. In the current study we examined the connection between land use, physiology, and disease ecology of amphibian populations in three agricultural watersheds in California, USA. The invasive American bullfrog (Lithobates catesbeiana) was used as a surrogate model to examine possible effects of agricultural contaminants and habitat disruption on sensitive native amphibian populations in the Salinas, San Joaquin, and Sacramento River systems. We analyzed the endocrine and immune function of bullfrogs collected at sites along a gradient of agricultural land use within the three rivers systems. Elevated plasma stress hormone levels (corticosterone) and altered white blood cells (differentials and activity) were observed in bullfrogs collected from agricultural sites compared to sites upstream of agriculture. Our study indicates that altered environmental conditions in agricultural regions may lead to endocrine and immune disruption of amphibians, and result in increased disease and further population declines. Introduction
Modern environmental change is driven by human activities and has critically impacted global biodiversity (Vitousek et al. 1997, IUCN 2010). Land use practices for providing food, fiber, and water for an expanding global population have dramatically increased in recent decades. However, evidence indicates that current practices may be unsustainable for continued ecosystem function (Foley et al. 2005). Of particular importance to global environmental change is human agricultural production of food. In the United States alone, cropland agriculture accounts for approximately 20% of total land use (Lubowski et al. 2006). To maintain efficient agricultural production, continued chemical intensive pest control and nutrient addition are forecasted (Tilman et al. 2001). Evidence suggests that these inputs may exacerbate ecosystem change (Tilman et al. 2001).
Amphibian populations are particularly vulnerable to changing conditions and populations have declined globally in recent decades (Houlahan et al. 2000, Stuart et al. 2004, Wake and Vredenburg 2008, IUCN 2010). As many as 42% of all described amphibian species are in decline or extinct, and represent the most threatened vertebrate class (Stuart et al. 2004, IUCN 2010). Proposed causes for declines include habitat loss, climate change, disease, overexploitation, increased exposure to UV radiation, introduction of invasive species, and exposure to environmental contamination (Hayes et al. 2010, IUCN 2010). The specific cause of decline for each population is likely unique to influences of geographic location and ecology.
Amphibian populations in California, USA are equally threatened. As of the year 1994, 60% of amphibians and reptiles in the state of California warranted protective listing from state or federal governments (Jennings and Hayes 1994). The authors of

! 17!
the report on statewide populations considered those species inhabiting aquatic habitats to be of greatest risk. Sampling locations for the current experiment represented eight sites in three of the major agricultural river watersheds (Sacramento, Salinas, San Joaquin) in California. California is the nations largest agricultural producer, accounting for 11.2% of the entire US production (CDFA 2010). In 2009, farming and ranching was the primary land use on 25.4 million acres across the state (CDFA 2010). Evidence exists for several drivers of amphibian decline in California including disease, invasive species introductions, pesticide application, and habitat development (Davidson et al. 2002, Vredenburg 2004, Rachowicz et al. 2006). The magnitude of agricultural land use in California suggests that many populations may be affected by the resulting changes to habitat.
Amphibians respond to environmental cues for development, reproduction, and defense against disease (Licht et al. 1983, Mendonca et al. 1985, Denver et al. 1998, Raffel et al. 2006). Environmental influences direct endocrine processes that alter physiology and have enabled amphibians the ability to thrive in diverse and dynamic habitats (Denver 1998). However, the plasticity afforded by endocrine response to environmental change may leave amphibians exceptionally vulnerable to anthropogenic changes to habitat. Previous studies have observed endocrine disruption in amphibians in severely altered habitats (Gendron et al. 1997, Hopkins et al. 1997, 1999, Hayes et al. 2002, Ward and Mendonca 2006, McCoy et al. 2008, McDaniel et al. 2008, Orton and Routledge 2011). Similarly, studies in altered habitats have indicated that disruption of immune function renders amphibians more susceptible to pathogenic infection (Kiesecker 2002, Koprivnikar et al. 2006, King et al. 2007, Rohr et al. 2008b, King et al. 2010, Attademo et al. 2011, Schotthoefer et al. 2011, Shutler and Marcogliese 2011). In the current study we examined the impact of agricultural land use on amphibian health and implications for sensitive populations in California, USA. Methods Collection locations
Collection sites were chosen based on proximity to agricultural land use, reports of historical native amphibian populations, collection access and permits, and availability of collectible American bullfrog (Lithobates catesbeiana) populations. Eight collection sites representing three agricultural watersheds in California, USA were chosen for this experiment including two sites in the Salinas River Watershed (Salinas: 36 38'49.27" N 121 42'07.29"W, Santa Margarita: 35 20'55.53" N 120 30'46.77"W); three sites in the Sacramento River Watershed (Battle Creek Wildlife Area: 40 23'54.12" N 122 09'20.82"W, Colusa National Wildlife Refuge: 39 08'41.87" N 121 02'27.53"W, Sutter National Wildlife Refuge: 39 06'06.82" N 121 45'41.93"W) and three sites in the San Joaquin River Watershed (Del Puerto Canyon: 37 28'28.88" N 121 14'18.59"W, North Grasslands Wildlife Area: 37 18'35.93" N 120 55'50.01"W, San Joaquin National Wildlife Refuge: 37 37'48.40" N 121 12'20.23"W). To investigate the effects of handling time on bullfrog plasma corticosterone, bullfrogs were collected from a regional park with no current or recent agricultural activity; Pleasanton Ridge East Bay Regional Park 37 38’43.56”N 121 55’06.01”W.

! 18!
American bullfrog collections For the land use experiment, bullfrog collections took place from June 28, 2009
through July 25, 2009. All animals were collected at night by hand between the hours of maximally 22:00 – 04:00. Efforts were made to collect ten adult male and ten adult female bullfrogs from each site. The largest available animals were collected at all sites. Because adult female bullfrogs cannot be positively identified prior to dissection, we collected the largest animals that did not display obvious signs of male sexual maturity and secondary sex characteristics (yellow throat coloration, enlarged tympanum:eye ratio, enlarged thumb breeding glands). Blood samples were collected immediately following capture by cardiac puncture. During all collections, the time between catch and conclusion of blood collection was recorded for each animal, with efforts to maintain a five minute maximum handling time when possible. To examine the effect of handling time on plasma corticosterone, animals from a distant non-agricultural site were captured as above and blood was repeatedly collected from the same individual approximately every minute for 12 minutes. All blood samples were immediately placed
on ice in the field and kept on ice or at 4°C through transportation and processing. Blood smears were completed, whole blood oxidative burst was analyzed, packed cell volume was analyzed, and plasma was collected for hormone analysis within maximally 24 hours of collection. Whole blood was used to create blood smears and analyzed for oxidative burst activity as described below. Plasma was collected by aspiration following
centrifuge and stored frozen at -20°C until corticosterone analysis by Radioimmunoassay (RIA). Land use analysis
All animal collection sites were analyzed for land use patterns using Google Earth Pro (Google, Mountain View, CA) by four methods (Table 1). (1) Distance to nearest upstream agricultural land use plot within the measured radii (meters). (2) Percent row crop agricultural land use area within a 100 m radius of collection site (meters squared). A 100 m measurement theoretically would represent direct chemical application at the site, chemical runoff from nearby fields, and local habitat management. (3) Percent row crop agricultural land use area within a 1,000 m radius of collection site (kilometers squared). A 1,000 m measurement would represent runoff from nearby chemical usage, drift from spray operations, pumping of contaminated water from more distant sites, and local to landscape habitat management. (4) Percent row crop agricultural land use area within a 10,000 m radius of collection site (kilometers squared). A 10,000 m measurement was chosen to represent drift from spray operations, runoff from more distant chemical usage, possible deposition through precipitation, groundwater contamination, pumping of contaminated water from more distant sites, and landscape to regional habitat management.
The percent of land use devoted to row crop agricultural fields was measured for all collection sites for the areas listed above. Land areas of row crop agriculture were outlined using the distance-measuring tool included in the Google Earth Pro program. The time tool was set to June 5, 2009 as this was the most representative image of the collection date. Land areas used for range or pastures were not included in measurements of row crop agricultural land use. To control for measurement bias among sites in the 1,000 and 10,000 meter measurements, all secondary roads and
! 19!
waterways were included in agricultural measurements if bordered on both sides by agriculture. Developments and residences with a total land area less than 0.02 km2 that were surrounded on three sides by agriculture were also included in agricultural area measurements. For the purposes of the current analysis, sites designated “agricultural” fit both of the following criteria: location within 1,500 m or closer in the downstream direction of an agricultural land use plot, and 33% or greater total area of land at any of the three measured radii devoted to row crop monoculture. Sites that did not fit one or both of the criteria were designateded “non-agricultural”. Collection site water pesticide analysis
Water samples from one agricultural site and one non-agricultural site on each river system were analyzed for commonly applied agricultural pesticides. Water was collected August 4-5, 2009. In the Salinas River watershed, water was collected from Santa Margarita and Salinas. In the Sacramento River watershed, water was collected from Battle Creek Wildlife Area and Sutter National Wildlife Refuge. In the San Joaquin River watershed, water was collected from Del Puerto Canyon and North Grasslands Wildlife Area. Water samples were analyzed for glyphosate and breakdown product (aminomethylphosphonic acid), glufosinate, chlorpyrifos, phenylureas (diuron, fluometuron, linuron) and the phenylurea breakdown product (demethylfluometuron), triazines (atrazine, bromacil, cyanazine, prometon, propazine, simazine) and triazine degredation products (cyanazine amide, cyanazine acid, deethylatrazine, deethylcyanazine, deethylcyanazine acid, deethylcyanazine amide, deethylhydroxyatrazine, deisopropylatrazine, deisopropylhydroxyatrazine, didealkylatrazine, hydroxyatrazine, hydroxysimazine). Water was collected in replicate in methanol rinsed amber glass, kept on ice during transportation, and shipped for analysis within 48 hr of collection to the United States Geological Survey (USGS). Samples were labeled by code of site name so pesticide analysis could be conducted blindly. Water samples were filtered and analyzed by liquid chromatography/mass spectrometry by USGS using the protocols 0-2138-02 – OFR 02-436, O-2141-09, and chlorpyrifos (Kansas Water Science Center, Lawrence, Kansas). Collection site water quality analysis
Water quality analysis was performed during August, 2010. Water samples were tested at collection sites using a portable surface water test kit (Hach, Loveland, Colorado) for nitrate, nitrite, chlorine, total phosphorus, orthophosphate, ammonia, dissolved oxygen. Plasma corticosterone concentration
Corticosterone levels in bullfrog plasma were measured by radioimmunoassay (RIA). Plasma samples were extracted in diethyl ether, dried under nitrogen gas, and reconstituted in PBS with gelatin (PBS-g). Samples were assayed using antisera from MP Biomedicals (Solon, Ohio) according to the manufacturer’s protocol. The authors validated antisera for use with L. catesbeiana plasma. Samples from all sites were measured in each assay. The interassay variation was 12.7 % and intraassay variation was 6.4%.

! 20!
Whole blood oxidative burst activity The in vitro innate immune activity of live cells in whole blood against a model
antigen was measured for each specimen following the protocol of Gilbertson et al. (Marnila et al. 1995, Gilbertson et al. 2003). Briefly, whole blood in frog ringer solution was combined with 1mM luminol (3-Aminophthalhydrazide, 5-Amino-2,3-dihydro-1,4-
phthalazinedione) and a yeast cell wall preparation of 500 µg (Zymosan A) in a 96 well plate. Each sample was analyzed in triplicate. The reaction of the blood to this simulated infection is monitored as the light produced by innate immune cells using reactive oxygen species to destroy the yeast antigen. Readings of all samples were taken every 3 minutes for 30 cycles. The blank (ringer only) subtracted peak chemiluminescence was recorded for each sample. The group average peak chemiluminescence is reported.
Blood cell differentials
Blood was applied to glass microscope slides using a heparin treated microhematocrit tube and spread using the edge of another glass slide. The remaining blood in hematocrit tubes was centrifuged and used to determine packed cell volume. Packed cell volume is reported as percent cells to total volume. For blood smears, slides were fixed with methanol and stained with Wright’s giemsa stain. Smears were counted according to Davis and Maerz (Davis and Maerz 2008). Briefly, the number of red blood cells in each of five fields of view at (1000x) was quantified within the feathered edge of each smear. In addition, a total of 100 white blood cells were counted in the feathered edge. Identification of cell type followed Wright and Whitaker (Wright and Whitacker 2001). The number of fields of view to reach 100 white blood cells was recorded. Each sample was analyzed in duplicate. These values were used to generate the reported value of estimated white blood cells per 1,000 red blood cells. All analysis was conducted blindly. Statistics
Statistical analyses were performed using JMP 9.0 (SAS Institute Inc.). Plasma corticosterone, blood neutrophil counts, blood eosinophil counts, and blood basophil counts were log transformed to meet the parametric assumptions of normality and homoscedasticity and analyzed by nested analysis of variance (ANOVA). Blood neutrophil to lymphocyte ratios were square root transformed. For nested ANOVA, agricultural status was the primary level of variation, with nested watershed and sex of animal. In the handling time experiment, plasma corticosterone was analyzed by minute groups in a repeated measures model by Restricted Maximum Likelihood (REML) (JMP 9.0). In this model minutes post capture was classified as a fixed effect with specimen nested within minutes in a repeated measures design. Oxidative burst, blood lymphocyte counts, blood monocyte counts, and packed cell volume of blood were analyzed by a nonparametric Wilcoxon test due to the inequality of variance and lack of normality. For the purposes of further discussion, plasma corticosterone was also analyzed and presented by site in each watershed separately. For the individual watershed analysis, plasma corticosterone was log transformed and analyzed by nested ANOVA with site as the primary level of variation with nested sex. In levels where significance was detected by ANOVA (p < 0.05) and Wilcoxon test (p < 0.05), Tukey’s

! 21!
honestly significant different (HSD) test was used to determine significantly different groupings. Linear regression analysis was used to compare response mean and sample corticosterone levels by ANOVA with water temperature, body weight, snout-vent length, handling time, time of day at collection and packed cell volume of blood. Results Land use analysis
At least one site from each watershed was assigned to either the agricultural or non-agricultural category (Table 1). In the Salinas River watershed, Santa Margarita was designated non-agricultural while Salinas was determined agricultural (example in Figure 1). In the Sacramento River watershed, Battle Creek Wildlife area was designated non-agricultural while both Colusa National Wildlife Refuge and Sutter National Wildlife Refuge were designated agricultural. In the San Joaquin River watershed, Del Puerto Canyon was designated non-agricultural while both San Joaquin River National Wildlife Refuge and the North Grasslands Wildlife Area were categorized as agricultural. Agriculture is the dominant use of developed land in these regions of California. Collection site water pesticide and water quality analysis The herbicide glyphosate was detected in all representative downstream agricultural sites in each of the three watersheds examined (Table 2). Glyphosate was not detected in any of the representative upstream non-agricultural sites. The glyphosate metabolite, aminomethylphosphonic acid (AMPA), was detected in all of the representative downstream agricultural sites in all watersheds and also in one representative upstream site (Table 2). The triazine degradation products cyanazine acid, deethylcyanazine acid, and didealkylatrazine were measured in one downstream agricultural site North Grasslands Wildlife Area (data not shown). The insecticide chlorpyrifos, and the herbicides glufosinate, all parent triazines, and all parent phenylureas were not detected at any sites. Nitrate and phosphate were generally higher at agricultural sites than nonagricultural except for an absence of nitrate at the North Grasslands Wildlife Area. However, water quality measurements did not show a clear trend with agricultural land use at this single collection time point (Table 3a-3b). Plasma corticosterone concentrations
American bullfrogs collected downstream of agriculture and in areas of 33% or greater agricultural land use had elevated plasma corticosterone when compared to those collected in non-agricultural regions (Figure 2). Significant differences (F = 5.6197, df =1, p = 0.0193) were observed at the primary level of nested analysis and represented all samples of either sex collected across three watersheds (Table 4). Plasma corticosterone did not differ significantly between watersheds (F = 0.2762, df = 4, p = 0.8929) or between male and female animals (F = 1.0548, df = 6, p = 0.3934) based on agricultural status. Several factors hypothesized to affect basal and induced plasma hormone levels were analyzed to validate the strength of collection location effects on plasma corticosterone. To examine the effect of handling time on plasma corticosterone levels, animals from a nonagricultural site were repeatedly sampled at ten time intervals for 12 minutes. During this time period no significant increases (F =

! 22!
0.5330, df = 9, p = 0.8466) in plasma corticosterone were observed (Figure 3, Table 5). Further, plasma corticosterone did not correlate with water temperature (F = 0.0941, df = 1, p = 0.7596), body weight (F = 1.2465, df = 1, p = 0.2666), snout-vent length (F = 2.0173, df = 1, p = 0.1583), handling time (F = 0.0595, df = 1, p = 0.8076), collection time (F = 0.3157, df = 1, p = 0.5751), or blood packed cell volume (F = 1.1305, df = 1, p = 0.2896) throughout all field collections (Figures 4-9, Tables 6-11). Whole blood oxidative burst activity and blood cell differentials Both blood cell counts and blood cell activity were altered in frogs collected downstream of agriculture as compared to frogs collected upstream. The activity of whole blood samples against a model pathogen in vitro was decreased among animals at agricultural sites (Chi = 11.8340, df = 1, p = 0.0006) (Figure 10, Table 12). Lymphocytes (Chi = 18.1296, df = 1, p < 0.0001), neutrophils (F = 13.1367, df = 1, p = 0.0004), eosinophils (F = 48.3758, df = 1, p < 0.0001), and monocytes (Chi = 11.7343, df = 1, p <0.0006) decreased in animals collected downstream of agriculture (Figures 11-14, Tables 13-16). Basophil concentrations in blood did not significantly change with collection location (F = 1.6888, df = 1, p = 0.1961) (Figure 15, Table 17). The ratio of neutrophils to lymphocytes was not altered by collection location (F = 1.3599, df = 1, p = 0.2458) (Figure 16, Table 18). In addition to decreased white cell concentrations and activity, both white and red blood cells were decreased overall as measured by packed cell volume (Chi = 9.2138, df = 1, p = 0.0024) (Figure 17, Table 19). Discussion
Studies of amphibians in severely altered habitats indicate that chemical contaminants are associated with endocrine disruption (Gendron et al. 1997, Hopkins et al. 1997, 1999, Hayes et al. 2002, Ward and Mendonca 2006, McCoy et al. 2008, McDaniel et al. 2008, Orton and Routledge 2011). Populations in altered landscapes may also be more susceptible to pathogenic infections (Kiesecker 2002, Koprivnikar et al. 2006, King et al. 2007, Rohr et al. 2008b, King et al. 2010, Attademo et al. 2011, Schotthoefer et al. 2011, Shutler and Marcogliese 2011). However, only three studies have examined the correlation between endocrine disruption and immunity in amphibians, and only one study of amphibians in the wild has been conducted (Hayes et al. 2006, Hopkins and DuRant 2011, McMahon et al. 2011). Further, less than ten publications exist on contaminant-induced disruption of amphibian interrenal function, and no studies have examined stress in wild amphibians in agricultural habitats (Gendron et al. 1997, Hopkins et al. 1997, 1999, Glennemeier and Denver 2001, Hayes et al. 2006, Ward and Mendonca 2006, Peterson et al. 2009, McMahon et al. 2011). The current study provides insight into the effects of agricultural habitat alteration on the health of amphibian populations in California USA. We believe that the stress steroid response to environmental change may be an important, yet often overlooked, influence on disease resistance in declining amphibian populations. By measuring both endocrine and immune endpoints we provide insight into the effects of agricultural land use on co-regulated physiological processes that have implications at both the individual and population level. Given the importance of immunity in population maintenance, and the role of disease in amphibian decline (IUCN 2010), the results of the current study

! 23!
suggest that agricultural land use may significantly contribute to the decline of some amphibian populations in California and globally.
Upon analysis of land use within the regions of our collections it was clear that agriculture was the dominant development of land. In California, agricultural land use is centered in fertile low elevation river valleys, often co-located with amphibian habitat. Subsequently, we chose to isolate and study the effects of agricultural land use alone on amphibian health. In an agricultural landscape, alterations to habitat are often the consequence of maintaining profitable production. For example, approximately 14 trillion gallons of surface and groundwater are diverted from the California freshwater supplies, 80% of which is used for agricultural irrigation (CDWR 2008). Fertilizers increase crop yield, yet extensive application leads to concern for public health due to groundwater contamination and ecological changes resulting from eutrophication (Rouse et al. 1999, Johnson et al. 2007, CDWR 2008, Rohr et al. 2008b). In addition, 155 million pounds of pesticide active ingredients are applied annually to crops (CDPR 2011). In the described scenario, the majority of water in agricultural watersheds is managed under unnatural flow conditions and is contaminated with nutrients and pesticides.
In the current report we examined both the surrounding land use and water at collection sites of varying agricultural intensity by three metrics; intensity of row crop monoculture within varying radii from collection site, distance to upstream agricultural plots, and the presence of commonly used pesticides in water samples. We acknowledge the limitations of generalizing agricultural developed land use into a single category with respect to chemical and water use, as well as rangeland management for grazing. For example, drastically different crops and stock, agricultural methods, chemical and water usage, and seasonal influences are present in different regions of California (CDFA 2010). However, the use of large quantities of agrichemicals and significant alterations to local water supplies is well established for row crop monoculture regardless of the above factors (CDWR 2008, CDPR 2011). Therefore, sites were chosen in three of the most intensely cultivated regions of the state, the Sacramento, San Joaquin, and Salinas river watersheds.
These watersheds hold collectible numbers of wild invasive American bullfrogs (Lithobates catesbieana). Bullfrogs share similar life history and frequently overlap in range with declining native frogs, particularly the California red-legged frog (Rana draytonii) and Foothill yellow-legged frog (Rana boylii). Similarities in range and life history make the bullfrog an ideal model to study the effects of environmental stressors on native amphibians. Historical populations of native amphibians existed in collection regions but extant populations have declined at many locations (Jennings and Hayes 1994). Our observations of bullfrog populations suggest that they may be more robust to habitat disruption and thrive in altered localities unsuitable for native amphibians. Consequently, environmental stressors affecting bullfrog populations likely have an equal or more significant effect on less robust native amphibians. In addition, their removal for scientific study may benefit local populations, as invasive populations are often detrimental to sympatric species (Kupferberg 1997).
Several studies have used Google Earth as a tool for analyzing land use (McCoy et al. 2008, Orton and Routledge 2011). Agricultural land use for row crop monoculture is easily identifiable from aerial photographs during the growing season by its uniformity and contrast with the surrounding natural landscape. Because rangeland both overlaps

! 24!
and could easily be confused with less altered habitats it was not included in agricultural measurements for the current study. The authors acknowledge the limitation of inclusion of organic or chemical free agricultural land use, presumably using decreased or no chemical methods, in our method of land use analysis. However, the method has been previously employed by others to represent land use type and theoretical chemical use for multiple types of agricultural contaminants (including both fertilizers and pesticides) (McCoy et al. 2008, Orton and Routledge 2011). Row crop monoculture land use within 10,000 meter radii from agricultural collection sites ranged from 33-79% of total land area. Agricultural sites were also closer than 1,500 m from the nearest upstream agricultural plot of land. Our agricultural sites were representative of many localities in California’s Central and Salinas Valleys, and similar to collection sites representing agricultural land in other studies (McCoy et al. 2008, Orton and Routledge 2011). Sites categorized as non-agricultural had agricultural land use ranging from 2-26%. Non-agricultural sites were farther than 2,000m from the nearest upstream agricultural land.
In addition to large areas of surrounding land devoted to row crop monoculture, water analysis revealed pesticide contamination at agricultural sites. A total of 155,869,703 pounds of pesticide active ingredients were applied in California in 2009 (CDPR 2011). To determined chemical impact on amphibian populations, the herbicides glyphosate, triazines, and phenylureas, and the insecticide chlorpyrifos were analyzed at one agricultural site and one nonagricultural site on each of the studied watersheds. Glyphosate and chlorpyrifos were chosen for analysis because they are the most commonly applied herbicide and insecticide in California (CDPR 2011). Approximately 5,590,877 pounds of glyphostate and 1,235,481 pounds of chlorpyrifos were applied in California in the year 2009, when collections took place (CDPR 2011). Due to practical limitations on testing, glyphosate and chlorpyrifos were used as surrogates for overall agricultural pesticide use in the proximity of collections. The most commonly detected contaminants were the herbicide glyphosate and its degradation product aminomethylphosphonic acid (AMPA). Glyphosate was detected at agricultural sites on each of the three watersheds tested. The half-life of glyphosate ranges from several hours to several day in water, indicating that this herbicide was recently used in the area or nearby upstream from the site of collection (Newton et al. 1984, Goldsborough and Beck 1989). Interestingly, chlorpyrifos was not detected at any site despite widespread use in California and detection in other studies of U.S. waterways (Kolpin et al. 2002). The half-life of chlorpyrifos ranges from several days to several weeks in water (Freed et al. 1979). Chlorpyrifos may not have been applied in the agricultural areas surrounding collection sites, or use may have occurred earlier in the season. The hypothalamic-pituitary-interrenal axis (HPI) in amphibians has been observed to fluctuate in response to environmental cues. For example, metamorphosis in amphibians is controlled through corticotropin releasing factor (CRF) in response to pond drying (Denver 1997) and glucocorticoids (GC) themselves fluctuate with season, time of day, and during times of year coinciding with breeding (Dupont et al. 1979, Licht et al. 1983, Pancak and Taylor 1983, Mendonca et al. 1985, Wright et al. 2003). In addition to natural stressors, levels of GC have been induced or altered by conditions of captivity, crowding, and handling (Licht et al. 1983, Zerani et al. 1991, Cooperman et al. 2004). Habitats contaminated with coal fly ash and polycyclic aromatic hydrocarbons have been correlated with HPI dysfunction (Gendron et al. 1997, Hopkins et al. 1997,

! 25!
1999). Hopkins et al. found that toads in a habitat contaminated with coal fly ash had higher basal GC levels(Hopkins et al. 1997). Studies by both Hopkins et al. and Gendron et al. observed HPI dysfunction in animals collectioned in contaminated environments (Gendron et al. 1997, Hopkins et al. 1999). Our agricultural experiment indicates similar responses exist in amphibians inhabiting regions of intense agriculture, which represents approximately 20% of all US land use (Lubowski et al. 2006).
Combined animals from all downstream agricultural sites had significantly increased plasma corticosterone in comparison to upstream non-agricultural sites. Because of the hypothesized influence of both environmental and experimental factors on amphibian hormones we chose to control for several variables. The increase in corticosterone did not correlate with water temperature, animal body size or weight, handling time, time of day at collection, or packed blood cell volume. No significant difference existed between males and females (p = 0.39) or river systems (p = 0.89). Within each watershed, plasma corticosterone was generally elevated at agricultural sites (Figures 18-20, Tables 20-22). However, because of variation among individuals, the effect was not significant at this level of analysis in the Sacramento and Salinas River watersheds. In the San Joaquin watershed, animals at the San Joaquin River National Wildlife Refuge had significantly elevated plasma corticosterone in comparison to another agricultural site, North Grasslands Wildlife Area, and the non-agricultural site Del Puerto Canyon (Figure 20, Table 22). The magnitude of GC difference in our combined analysis is similar to an induced GC response of amphibians collected from polluted habitats in Gendron et al. (Gendron et al. 1997). Gendron et al. also found a difference in liver glycogen, where replenishment is partly mediated by corticosterone. Similarities also exist in the magnitude of GC change found by Hopkins et al. when toads were transplanted from reference to coal ash polluted sites, although free ranging toads at contaminated sites had greater average basal GC levels (Hopkins et al. 1997).
Two possible hypotheses may explain the observed increase in plasma GC. Agricultural land use could lead to increased stress to amphibian populations through a direct effect of chemical contaminants on the animal’s physiology, or indirect effects on ecology and environmental conditions. Chemical contaminants can increase stress hormones and alter HPI function (Gendron et al. 1997, Hopkins et al. 1997, 1999, Glennemeier and Denver 2001, Hayes et al. 2006, Peterson et al. 2009, McMahon et al. 2011). Chemical contaminants could potentially interfere with any part of hormone production, function, and degradation to result in altered HPI measurements. Several hypotheses have been presented based on previous studies. Pesticides can disrupt adrenal steroidogenesis, and damage the liver, a major site of steroid metabolism and clearance (Walsh et al. 2000, McMahon et al. 2011). Nitrate, another common contaminant of agricultural systems has also been implicated in the disruption of steroidogenesis, although the mechanisms are not yet extensively studied (Guillette and Edwards 2005). Direct tissue damage may induce inflammation and cytokine production, resulting in signals for GC production(Sapolsky et al. 1987). Specific pesticides, namely organophosphate compounds, can activate the same area of the brain as CRF (Singh 2002). Additionally, estrogen can disrupt negative feedback resulting in increased plasma GC levels (Weiser and Handa 2009). Given the occurrence of estrogenic compounds in surface waters a possible interaction with estrogens or estrogenic agents may be present (Kolpin et al. 2002). Though glyphosate

! 26!
was detected at all agricultural sites, we do not believe this compound is the sole cause of effects seen at agricultural sites. Rather, the presence of glyphosate suggests that agricultural contamination is indeed present at collection sites and may influence biological activity of local wildlife. Glyphosate product toxicity to amphibians is well documented although much of the toxicity is attributed to its commercial formulations, which contain the compound polyethoxylated tallowamine (POEA) (Relyea and Jones 2009). The sublethal endocrine effects of glyphosate include disruption of steroidogenesis in vitro and increased the stress hormone cortisol in vivo in the fish Rhamdi quelen (Walsh et al. 2000, Soso et al. 2007). However, the concentration of glyphosate in previous studies was at least one order of magnitude higher than detected at our agricultural collection sites.
Altered physical habitat itself may create additional challenges to physiology or ecology. For example, bullfrogs depend on at least semi permanent sources of water because of their relatively lengthy time to metamorphosis and susceptibility to desiccation as adults(Duellman and Trueb 1986). Water in California is balanced between the needs of municipal use, recreation, agriculture, and wildlife (CDWR 2008). The state diverts a large portion of surface water away from natural habitat and may create stressful conditions for wildlife such as desiccation, crowding, increased predation, disease. Habitat simplification may also alter ecology of other species, which in turn impact amphibian ecology and physiology. Studies suggest that both predators and pathogens may be affected by loss of habitat diversity (Johnson et al. 2007, King et al. 2007, King et al. 2010).
The effects of increased GC on immune function are well documented among laboratory studies but have not been well established in free-ranging populations (Sapolsky et al. 2000). Knowledge of the impacts of increased GC on immunity is particularly scarce in wildlife inhabiting altered landscapes. Effects are likely dependent on duration, stage of development, and magnitude of GC (reviewed by Martin, 2009) (Martin 2009). Previous studies of amphibians have observed negative impacts of induced environmental stress from both rapid pond drying and pesticides on immune response (Glennemeier and Denver 2002a, Hayes et al. 2006, Gervasi and Foufopoulos 2008, Peterson et al. 2009, McMahon et al. 2011). GC-treatment inhibited reproduction, altered growth and metamorphosis, altered immune response, and increased parasitic infections (Bennett et al. 1972, Moore and Miller 1984, Glennemeier and Denver 2002b, Belden and Kiesecker 2005). The current study showed a co-occurrence of increased plasma corticosterone with decreased blood neutrophils, lymphocytes, eosinophils, and monocytes. Additionally, the activity of innate immune cells against a model antigen in vitro was depressed in animals from agricultural sites. The effects on immune cell differentials and function are likely the result of GC-directed cell trafficking and degradation (Dhabhar et al. 1995, Sapolsky et al. 2000). Interestingly, our results did not show a correlation of increased stress hormones with an altered neutrophil:lymphocyte ratio. Several studies have observed that stressed vertebrates have increased peripheral neutrophils (neutrophilia) and decreased peripheral lymphocytes (lymphocytopenia) (Dhabhar 2002, Davis and Maerz 2008). The difference between our finding and previous studies may indicate an interaction between direct effects of chemical contaminants and GC control of immune response.

! 27!
Overall, any immune effects may present large consequences in light of significant role of disease in amphibian population declines (IUCN 2010).
Direct and indirect influences may also alter immune function in the agricultural habitat. Agrichemicals can directly damage liver and thymus, major sites of hematopoiesis, immune cell production, and maturation (Hayes et al. 2006, McMahon et al. 2011). Immune cell differentials and activity in amphibians were altered by pesticide exposure in several experiments (Kiesecker 2002, Gilbertson et al. 2003, Albert et al. 2007, Brodkin et al. 2007, Rohr et al. 2008b, Kundu and Roychoudhury 2009, Celik et al. 2010, McMahon et al. 2011). Chemical-induced alterations in immune activity have been associated with increased infection by pathogens in both the laboratory (Taylor et al. 1999, Gendron et al. 2003, Forson and Storfer 2006, Rohr et al. 2008b) and field settings (Kiesecker 2002, Rohr et al. 2008b).
Indirect effects of agricultural land-use may also alter immune function through ecological considerations. Agrichemical may be toxic or a benefit to pathogens, as in the case of some fertilizers (Johnson et al. 2007, Rohr et al. 2008a). Pathogen presence may influence immune response and priming of the host, as well as the ecology of organisms surviving at collection locations When considered together with alterations of physical landscape, these indirect factors may have a great influence on host pathogen interactions (King et al. 2010, Schotthoefer et al. 2011).
The current study shows that agricultural land use is associated with altered endocrine and immune function of amphibians. Agricultural land use dominates the developed American landscape and contributes significant pollution to, as well as water withdrawals from, our waterways. Sensitive populations within agricultural regions are already at high risk for population declines resulting from disease. Mitigating the effects of environmental stressors on amphibian health will be crucial to prevent further declines. References Albert, A., K. Drouillard, G. D. Haffner, and B. Dixon. 2007. Dietary exposure to low
pesticide doses causes long-term immunosuppression in the leopard frog (Rana pipiens). Environmental Toxicology and Chemistry 26:1179-1185.
Attademo, A. M. A. A. M., M. Cabagna-Zenklusen, R. C. Lajmanovich, P. M. Peltzer, C. Junges, and A. Basso. 2011. B-esterase activities and blood cell morphology in the frog Leptodactylus chaquensis (Amphibia: Leptodactylidae) on rice agroecosystems from Santa Fe Province (Argentina). Ecotoxicology 20:274-282.
Belden, L. K. and J. M. Kiesecker. 2005. Glucocorticosteroid hormone treatment of larval treefrogs increases infection by Alaria sp. trematode cercariae. The Journal of Parasitology 91:686-688.
Bennett, M. F., C. A. Gaudio, A. O. Johnson, and J. H. Spisso. 1972. Effects of hydrocortisone on the distribution of leukocytes in newts Notophthalmus-viridescens. American Zoologist 12:667-668.
Brodkin, M. A., H. Madhoun, M. Rameswaran, and I. Vatnick. 2007. Atrazine is an immune disruptor in adult northern leopard frogs (Rana pipiens). Environmental Toxicology and Chemistry 26:80-84.
CDFA. 2010. California Agricultural Resources Directory 2010-2011. California Department of Food and Agriculture, Sacramento, CA.

! 28!
CDPR. 2011. California Pesticide Use Reporting (PUR). California Department of Pesticide Regulation.
CDWR. 2008. California Agricultural Water Use Program. California Department of Water Resources, Office of Water Use Efficiency and Transfers.
Celik, I., I. Isik, N. Ozok, and M. S. Kaya. 2010. Neurotoxic and immunotoxic effects of fenthion and omethoate on frogs at acute exposure. Toxicology and Industrial Health 27:357-362.
Cooperman, M. D., J. M. Reed, and L. M. Romero. 2004. The effects of terrestrial and breeding densities on corticosterone and testosterone levels in spotted salamanders, Ambystoma maculatum. Canadian Journal of Zoology-Revue Canadienne De Zoologie 82:1795-1803.
Davidson, C., H. B. Shaffer, and M. R. Jennings. 2002. Spatial tests of the pesticide drift, habitat destruction, UV-B, and climate-change hypotheses for California amphibian declines. Conservation Biology 16:1588-1601.
Davis, A. K. and J. C. Maerz. 2008. Comparison of hematological stress indicators in recently captured and captive paedomorphic Mole salamanders, Ambystoma talpoideum. Copeia:613-617.
Denver, R. J. 1997. Environmental stress as a developmental cue: corticotropin-releasing hormone is a proximate mediator of adaptive phenotypic plasticity in amphibian metamorphosis. Hormones and Behavior 31:169-179.
Denver, R. J. 1998. Hormonal correlates of environmentally induced metamorphosis in the Western spadefoot toad, Scaphiopus hammondii. General and Comparative Endocrinology 110:326-336.
Denver, R. J., N. Mirhadi, and M. Phillips. 1998. Adaptive plasticity in amphibian metamorphosis: Response of Scaphiopus hammondii tadpoles to habitat desiccation. Ecology 79:1859-1872.
Dhabhar, F. S. 2002. Stress-induced augmentation of immune function - The role of stress hormones, leukocyte trafficking, and cytokines. Brain Behavior and Immunity 16:785-798.
Dhabhar, F. S., A. H. Miller, B. S. McEwen, and R. L. Spencer. 1995. Effects of stress on immune cell distribution - Dynamics and hormonal mechanisms. Journal of Immunology 154:5511-5527.
Duellman, W. E. and L. Trueb. 1986. Biology of Amphibians. The Johns Hopkins University Press, Baltimore, Maryland.
Dupont, W., P. Bourgeois, A. Reinberg, and R. Vaillant. 1979. Circannual and circadian rhythms in the concentration of corticosterone in the plasma of the Edible frog (Rana esculenta). Journal of Endocrinology 80:117-125.
Foley, J. A., R. DeFries, G. P. Asner, C. Barford, G. Bonan, S. R. Carpenter, F. S. Chapin, M. T. Coe, G. C. Daily, H. K. Gibbs, J. H. Helkowski, T. Holloway, E. A. Howard, C. J. Kucharik, C. Monfreda, J. A. Patz, I. C. Prentice, N. Ramankutty, and P. K. Snyder. 2005. Global consequences of land use. Science 309:570-574.
Forson, D. D. and A. Storfer. 2006. Atrazine increases ranavirus susceptibility in the tiger salamander, Ambystoma tigrinum. Ecological Applications 16:2325-2332.

! 29!
Freed, V. H., C. T. Chiou, and D. W. Schmedding. 1979. Degradation of selected organophosphate pesticides in water and soil Journal of Agricultural and Food Chemistry 27:706-708.
Gendron, A. D., C. A. Bishop, R. Fortin, and A. Hontela. 1997. In vivo testing of the functional integrity of the corticosterone-producing axis in mudpuppy (amphibia) exposed to chlorinated hydrocarbons in the wild. Environmental Toxicology and Chemistry 16:1694-1706.
Gendron, A. D., D. J. Marcogliese, S. Barbeau, M. S. Christin, P. Brousseau, S. Ruby, D. Cyr, and M. Fournier. 2003. Exposure of leopard frogs to a pesticide mixture affects life history characteristics of the lungworm Rhabdias ranae. Oecologia 135:469-476.
Gervasi, S. S. and J. Foufopoulos. 2008. Costs of plasticity: responses to desiccation decrease post-metamorphic immune function in a pond-breeding amphibian. Functional Ecology 22:100-108.
Gilbertson, M. K., G. D. Haffner, K. G. Drouillard, A. Albert, and B. Dixon. 2003. Immunosuppression in the northern leopard frog (Rana pipiens) induced by pesticide exposure. Environmental Toxicology and Chemistry 22:101-110.
Glennemeier, K. A. and R. J. Denver. 2001. Sublethal effects of chronic exposure to an organochlorine compound on northern leopard frog (Rana pipiens) tadpoles. Environmental Toxicology 16:287-297.
Glennemeier, K. A. and R. J. Denver. 2002a. Role for corticoids in mediating the response of Rana pipiens tadpoles to intraspecific competition. Journal of Experimental Zoology 292:32-40.
Glennemeier, K. A. and R. J. Denver. 2002b. Small changes in whole-body corticosterone content affect larval Rana pipiens fitness components. General and Comparative Endocrinology 127:16-25.
Goldsborough, L. G. and A. E. Beck. 1989. Rapid dissipation of glyphosate in small forest ponds. Archives of Environmental Contamination and Toxicology 18:537-544.
Guillette, L. J. and T. M. Edwards. 2005. Is nitrate an ecologically relevant endocrine disruptor in vertebrates? Integrative and Comparative Biology 45:19-27.
Hayes, T., K. Haston, M. Tsui, A. Hoang, C. Haeffele, and A. Vonk. 2002. Herbicides: feminization of male frogs in the wild. Nature 419:895-896.
Hayes, T. B., P. Case, S. Chui, D. Chung, C. Haeffele, K. Haston, M. Lee, V. P. Mai, Y. Marjuoa, J. Parker, and M. Tsui. 2006. Pesticide mixtures, endocrine disruption, and amphibian declines: are we underestimating the impact? Environmental Health Perspectives 114 Suppl 1:40-50.
Hayes, T. B., P. Falso, S. Gallipeau, and M. Stice. 2010. The cause of global amphibian declines: a developmental endocrinologist's perspective. Journal of Experimental Biology 213:921-933.
Hopkins, W. A. and S. E. DuRant. 2011. Innate immunity and stress physiology of eastern hellbenders (Cryptobranchus alleganiensis) from two stream reaches with differing habitat quality. General and Comparative Endocrinology 174:107-115.
! 30!
Hopkins, W. A., M. T. Mendonca, and J. D. Congdon. 1997. Increased circulating levels of testosterone and corticosterone in southern toads, Bufo terrestris, exposed to coal combustion waste. General and Comparative Endocrinology 108:237-246.
Hopkins, W. A., M. T. Mendonca, and J. D. Congdon. 1999. Responsiveness of the hypothalamo-pituitary-interrenal axis in an amphibian (Bufo terrestris) exposed to coal combustion wastes. Comparative Biochemistry and Physiology C-Toxicology & Pharmacology 122:191-196.
Houlahan, J. E., C. S. Findlay, B. R. Schmidt, A. H. Meyer, and S. L. Kuzmin. 2000. Quantitative evidence for global amphibian population declines. Nature (London) 404:752-755.
IUCN. 2010. IUCN Red List of threatened species. Jennings, M. R. and M. P. Hayes. 1994. Amphibian and reptile species of special
concern in California. Rancho Cordova, CA. Johnson, P. T. J., J. M. Chase, K. L. Dosch, R. B. Hartson, J. A. Gross, D. J. Larson, D.
R. Sutherland, and S. R. Carpenter. 2007. Aquatic eutrophication promotes pathogenic infection in amphibians. Proceedings of the National Academy of Sciences of the United States of America 104:15781-15786.
Kiesecker, J. M. 2002. Synergism between trematode infection and pesticide exposure: a link to amphibian limb deformities in nature? Proceedings of the National Academy of Sciences of the United States of America 99:9900-9904.
King, K. C., J. D. McLaughlin, M. Boily, and D. J. Marcogliese. 2010. Effects of agricultural landscape and pesticides on parasitism in native bullfrogs. Biological Conservation 143:302-310.
King, K. C., J. D. McLaughlin, A. D. Gendron, B. D. Pauli, I. Giroux, B. Rondeau, M. Boily, P. Juneau, and D. J. Marcogliese. 2007. Impacts of agriculture on the parasite communities of northern leopard frogs (Rana pipiens) in southern Quebec, Canada. Parasitology 134:2063-2080.
Kolpin, D. W., E. T. Furlong, M. T. Meyer, E. M. Thurman, S. D. Zaugg, L. B. Barber, and H. T. Buxton. 2002. Pharmaceuticals, hormones, and other organic wastewater contaminants in US streams, 1999-2000: A national reconnaissance. Environmental Science & Technology 36:1202-1211.
Koprivnikar, J., R. L. Baker, and M. R. Forbes. 2006. Environmental factors influencing trematode prevalence in grey tree frog (Hyla versicolor) tadpoles in southern Ontario. Journal of Parasitology 92:997-1001.
Kundu, C. R. and S. Roychoudhury. 2009. Malathion-induced sublethal toxicity on the hematology of cricket frog (Fejervarya limnocharis). Journal of Environmental Science and Health Part B-Pesticides Food Contaminants and Agricultural Wastes 44:673-680.
Kupferberg, S. J. 1997. Bullfrog (Rana catesbeiana) invasion of a California River: The role of larval competition. Ecology 78:1736-1751.
Licht, P., B. R. McCreery, R. Barnes, and R. Pang. 1983. Seasonal and stress related changes in plasma gonadotropins, sex steroids, and corticosterone in the bullfrog, Rana catesbeiana. General and Comparitive Endocrinology 50:124-145.
Lubowski, R. N., M. Vesterby, S. Bucholtz, A. Baez, and M. J. Roberts. 2006. Major uses of land in the United States, 2002. EIB-14.

! 31!
Marnila, P., A. Tiiska, K. Lagerspetz, and E. M. Lilius. 1995. Phagocyte activity in the frog Rana temporaria: whole blood chemiluminescence method and the effects of temperature and thermal acclimation. Comparative Biochemistry and Physiology Part A: Physiology 111:609-614.
Martin, L. B. 2009. Stress and immunity in wild vertebrates: Timing is everything. General and Comparative Endocrinology 163:70-76.
McCoy, K. A., L. J. Bortnick, C. M. Campbell, H. J. Hamlin, L. J. Guillette, Jr., and C. M. St. Mary. 2008. Agriculture alters gonadal form and function in the toad Bufo marinus. Environmental Health Perspectives 116:1526-1532.
McDaniel, T. V., P. A. Martin, J. Struger, J. Sherry, C. H. Marvin, M. E. McMaster, S. Clarence, and G. Tetreault. 2008. Potential endocrine disruption of sexual development in free ranging male northern leopard frogs (Rana pipiens) and green frogs (Rana clamitans) from areas of intensive row crop agriculture. Aquatic Toxicology 88:230-242.
McMahon, T. A., N. T. Halstead, S. Johnson, T. R. Raffel, J. M. Romansic, P. W. Crumrine, R. K. Boughton, L. B. Martin, and J. R. Rohr. 2011. The fungicide chlorothalonil is nonlinearly associated with corticosterone levels, immunity, and mortality in amphibians. Environmental Health Perspectives 119:1098-1103.
Mendonca, M. T., P. Licht, M. J. Ryan, and R. Barnes. 1985. Changes in hormone levels in relation to breeding behavior in male bullfrogs (Rana catesbeiana) at the individual and population levels. General and Comparative Endocrinology 58:270-279.
Moore, F. L. and L. J. Miller. 1984. Stress-induced inhibition of sexual behavior - Corticosterone inhibits courtship behaviors of a male amphibian (Taricha granulosa) Hormones and Behavior 18:400-410.
Newton, M., K. M. Howard, B. R. Kelpsas, R. Danhaus, C. M. Lottman, and S. Dubelman. 1984. Fate of glyphosate in an Oregon forest ecosystem. Journal of Agricultural and Food Chemistry 32:1144-1151.
Orton, F. and E. Routledge. 2011. Agricultural intensity in ovo affects growth, metamorphic development and sexual differentiation in the Common toad (Bufo bufo). Ecotoxicology 20:901-911.
Pancak, M. K. and D. H. Taylor. 1983. Seasonal and daily plasma corticosterone rhythms in American toads, Bufo americanus. General and Comparative Endocrinology 50:490-497.
Peterson, J. D., V. A. Peterson, and M. T. Mendonca. 2009. Exposure to coal combustion residues during metamorphosis elevates corticosterone content and adversely affects oral morphology, growth, and development in Rana sphenocephala. Comparative Biochemistry and Physiology Part C Toxicology & Pharmacology 149:36-39.
Rachowicz, L. J., R. A. Knapp, J. A. T. Morgan, M. J. Stice, V. T. Vredenburg, J. M. Parker, and C. J. Briggs. 2006. Emerging infectious disease as a proximate cause of amphibian mass mortality. Ecology 87:1671-1683.
Raffel, T. R., J. R. Rohr, J. M. Kiesecker, and P. J. Hudson. 2006. Negative effects of changing temperature on amphibian immunity under field conditions. Functional Ecology 20:819-828.

! 32!
Relyea, R. A. and D. K. Jones. 2009. The toxicity of Roundup Original Max (R) to 13 species of larval amphibians Environmental Toxicology and Chemistry 28:2004-2008.
Rohr, J. R., T. R. Raffel, S. K. Sessions, and P. J. Hudson. 2008a. Understanding the net effects of pesticides on amphibian trematode infections. Ecological Applications 18:1743-1753.
Rohr, J. R., A. M. Schotthoefer, T. R. Raffel, H. J. Carrick, N. Halstead, J. T. Hoverman, C. M. Johnson, L. B. Johnson, C. Lieske, M. D. Piwoni, P. K. Schoff, and V. R. Beasley. 2008b. Agrochemicals increase trematode infections in a declining amphibian species. Nature 455:1235-U1250.
Rouse, J. D., C. A. Bishop, and J. Struger. 1999. Nitrogen pollution: An assessment of its threat to amphibian survival. Environmental Health Perspectives 107:799-803.
Sapolsky, R., C. Rivier, G. Yamamoto, P. Plotsky, and W. Vale. 1987. Interleukin-1 stimulates the secretion of hypothalamic corticotropin-releasing factor Science 238:522-524.
Sapolsky, R. M., L. M. Romero, and A. U. Munck. 2000. How do glucocorticoids influence stress responses? Integrating permissive, suppressive, stimulatory, and preparative actions. Endocrine Reviews 21:55-89.
Schotthoefer, A. M., J. R. Rohr, R. A. Cole, A. V. Koehler, C. M. Johnson, L. B. Johnson, and V. R. Beasley. 2011. Effects of wetland vs. landscape variables on parasite communities of Rana pipiens: links to anthropogenic factors. Ecological Applications 21:1257-1271.
Shutler, D. and D. J. Marcogliese. 2011. Leukocyte profiles of Northern leopard frogs, Lithobates pipiens, exposed to pesticides and hematozoa in agricultural wetlands. Copeia:301-307.
Singh, A. K. 2002. Acute effects of acephate and methamidophos and interleukin-1 on corticotropin-releasing factor (CRF) synthesis in and release from the hypothalamus in vitro. Comparative Biochemistry and Physiology C-Toxicology & Pharmacology 132:9-24.
Soso, A. B., L. J. G. Barcellos, M. J. Ranzani-Paiva, L. C. Kreutz, R. M. Quevedo, D. Anziliero, M. Lima, L. B. da Silva, F. Ritter, A. C. Bedin, and J. A. Finco. 2007. Chronic exposure to sub-lethal concentration of a glyphosate-based herbicide alters hormone profiles and affects reproduction of female Jundia (Rhamdia quelen). Environmental Toxicology and Pharmacology 23:308-313.
Stuart, S. N., J. S. Chanson, N. A. Cox, B. E. Young, A. S. L. Rodrigues, D. L. Fischman, and R. W. Waller. 2004. Status and trends of amphibian declines and extinctions worldwide. Science 306:1783-1786.
Taylor, S. K., E. S. Williams, and K. W. Mills. 1999. Effects of malathion on disease susceptibility in Woodhouse's toads. Journal of Wildlife Diseases 35:536-541.
Tilman, D., J. Fargione, B. Wolff, C. D'Antonio, A. Dobson, R. Howarth, D. Schindler, W. H. Schlesinger, D. Simberloff, and D. Swackhamer. 2001. Forecasting agriculturally driven global environmental change. Science 292:281-284.
Vitousek, P. M., H. A. Mooney, J. Lubchenco, and J. M. Melillo. 1997. Human domination of Earth's ecosystems. Science 277:494-499.

! 33!
Vredenburg, V. T. 2004. Reversing introduced species effects: Experimental removal of introduced fish leads to rapid recovery of a declining frog. Proceedings of the National Academy of Sciences of the United States of America 101:7646-7650.
Wake, D. B. and V. T. Vredenburg. 2008. Are we in the midst of the sixth mass extinction? A view from the world of amphibians. Proceedings of the National Academy of Sciences of the United States of America 105:11466-11473.
Walsh, L. P., C. McCormick, C. Martin, and D. M. Stocco. 2000. Roundup inhibits steroidogenesis by disrupting steroidogenic acute regulatory (StAR) protein expression. Environmental Health Perspectives 108:769-776.
Ward, C. K. and M. T. Mendonca. 2006. Chronic exposure to coal fly ash causes minimal changes in corticosterone and testosterone concentrations in male southern toads Bufo terrestris. Archives of Environmental Contamination and Toxicology 51:263-269.
Weiser, M. J. and R. J. Handa. 2009. Estrogen impairs glucocorticoid dependent negative feedback on the hypothalamic-pituitary-adrenal axis via estrogen receptor alpha within the hypothalamus. Neuroscience 159:883-895.
Wright, K. M. and B. R. Whitacker. 2001. Amphibian Medicine and Captive Husbandry. Krieger Publishing Company, Malabar, Florida.
Wright, M. L., C. J. Guertin, J. L. Duffy, M. C. Szatkowski, R. F. Visconti, and C. D. Alves. 2003. Developmental and diel profiles of plasma corticosteroids in the bullfrog, Rana catesbeiana. Comparative Biochemistry and Physiology Part A 135:585-595.
Zerani, M., F. Amabili, G. Mosconi, and A. Gobbetti. 1991. Effects of captivity stress on plasma steroid levels in the Green frog, Rana esculenta, during the annual reproductive cycle Comparative Biochemistry and Physiology Part A 98:491-496.
!
!
!
!
!
!
!

! 34!
Figure 1. Land use analysis. Land used for row crop monoculture and the distance from upstream agricultural plots were determined for an area extending in radii from 100, 1,000, and 10,000 m. An example of an upstream non-agricultural site Santa Margarita (A) zoomed in (B) and a downstream agricultural site Salinas (C) zoomed in (D) are shown for the Salinas River watershed. Lines represent agricultural plot measurements and radii. Images courtesy Google Earth Pro (Google, 2010)
!
!
!
!
!
!
!
!
!
!
!
!

! 35!
Table 1. Analysis of land use surrounding animal collection sites.
Animal collection sites were analyzed for agricultural land use in the Google Earth Pro program (Google, 2009). Sites with greater than 33% of land use area devoted to row crop monoculture and located within 1,500 m of upstream agricultural plots were classified as “agricultural” and are noted in bold type. Where land use data fits agricultural category criteria are noted with *. !
!
!
!
!
!
!
!
!
!
!
!
!
!
!
!
!
!
!
!
!
!
!
!
!
Collection site
Distance to
upstream
agriculture (m)
Percent agricultural land use within area of radii
100 m 1000 m 10,000 m
Santa Margarita 2,107 0 0 2 Salinas 71* 7 72* 33* Battle Creek Wildlife Area > 10,000 0 0 7 Colusa National Wildlife Refuge 1,349* 0 2 79* Sutter National Wildlife Refuge 470* 0 26 76* Del Puerto Canyon 8,244 0 0 26 San Joaquin River National Wildlife
Refuge 1,283* 0 2 77*
North Grasslands Wildlife Area 664* 0 2 47*

! 36!
Table 2. Collection site water pesticide analysis.
Water samples from representative agricultural and non-agricultural collection sites were analyzed for commonly used herbicides and an insecticide. Glyphosate and its degradation product aminomethylphophonic acid (AMPA) were the most commonly detected agricultural contaminants. Sites categorized as agricultural by land use analysis are shown in bold type.
!
!
!
!
!
!
!
!
!
!
!
!
!
!
!
!
!
!
!
!
!
!
!
!
!
!
!
!
!
!
Collection site
Contaminant concentration (µg / L)
glyphosate AMPA
Santa Margarita 0 0 Salinas 2.63 0.64
Battle Creek Wildlife Area 0 0.03
Sutter National Wildlife Refuge 0.04 0.2
Del Puerto Canyon 0 0 North Grasslands Wildlife Area 0.53 2.15

! 37!
!
Table 3a. Collection site water quality analysis.
Water samples from collection sites were analyzed for pH, nitrate, free chlorine, total chlorine, ammonia, phosphate, and dissolved oxygen. Sites categorized as agricultural by land use analysis are shown in bold type.
Collection site pH nitrate
(mg / L) free chlorine
(mg / L)
Santa Margarita 7.6 0 0 Salinas 8.5 15.4 0.15 Battle Creek Wildlife Area 7.7 0 0 Colusa National Wildlife Refuge 7.5 2.2 0.15 Sutter National Wildlife Refuge 7.7 2.2 0.1 Del Puerto Canyon 8.0 0 0.1 San Joaquin River National Wildlife
Refuge 7.5 15.4 0
North Grasslands Wildlife Area 7.8 0 0.1

! 38!
Table 3b. Collection site water quality analysis.
Water samples from collection sites were analyzed for pH, nitrate, free chlorine, total chlorine, ammonia, phosphate, and dissolved oxygen. Sites categorized as agricultural by land use analysis are shown in bold type.
Collection site total
chlorine
(mg / L)
ammonia
(mg / L)
phosphate
(mg / L)
dissolved oxygen
(mg / L)
Santa Margarita 0.15 0.002 0.26 9.0 Salinas 0.15 0.016 0.38 10.0 Battle Creek Wildlife Area 0 0 0.08 8.0 Colusa National Wildlife
Refuge 0.15 0 6.0 3.5
Sutter National Wildlife Refuge
0.15 0.004 0.26 7.0
Del Puerto Canyon 0.1 0 0.07 9.0 San Joaquin River National
Wildlife Refuge 0.1 0.002 0.64 6.0
North Grasslands Wildlife
Area 0.1 0.004 0.64 9.0

! 39!
Figure 2. Collection location determines plasma corticosterone in bullfrogs. American bullfrogs collected downstream of agriculture and in areas of 33% or greater agricultural land use had elevated plasma corticosterone when compared to those collected in nonagricultural regions. n = 55 upstream, n = 83 downstream. * notes significance at p < 0.05 (ANOVA).

! 40!
Table 4. Analysis of variance (ANOVA) on the effects of collection location agricultural status, watershed, and sex on plasma corticosterone concentrations in American bullfrogs Sample size = 138. A nested ANOVA with agricultural status as the primary determinant of variation, and nested watershed and sex. df., degrees of freedom. F., Fisher exact test ratio. p., significance statistic for the F ratio.!
!
!
!
!
!
!
!
!
!
!
!
!
!
!
!
!
!
!
!
!
!
!
!
!
!
!
!
!
!
!
!
!
!
!
Source of Variation df F p
Agricultural status 1 5.6197 0.0193
Watershed (agricultural status) 4 0.2762 0.8929
Sex (agricultural status, watershed) 6 1.0548 0.3934

! 41!
!
!
!
!
!
Figure 3. The effect of handling time on bullfrog plasma corticosterone. Plasma corticosterone was determined approximately by minute after capture of American bullfrogs from a nonagricultural site. Corticosterone levels did not significantly change for at least 12 minutes. n = 14, observations = 100. No significant differences were determined by Restricted Maximum Likelihood test (p > 0.05).
!
!
!
!
!
!
!
!
!
!
!
!
!
!
!
!
!
!
!
!
!
!
!
!

! 42!
!
Table 5. Restricted Maximum Likelihood (REML) test on the effects of handling time after capture on plasma corticosterone concentrations in American bullfrogs Sample size = 14, observations = 100. Restricted maximum likelihood test of minutes post capture classified as a fixed effect with specimen nested in minutes in a repeated measures design. df., degrees of freedom. F., Fisher exact test ratio. p., significance statistic for the F ratio.!!
!
!
!
!
!
!
!
!
!
!
!
!
!
!
!
!
!
!
!
!
!
!
!
!
!
!
!
!
!
!
!
!
!
Source of Variation df F p
Minutes after capture 9 0.5330 0.8466

! 43!
!
!
!
!
!
!
Figure 4. The effect of water temperature on bullfrog plasma corticosterone. Water temperature was measured immediately following bullfrog collection at the animal’s exact location. Linear regression analysis of corticosterone levels with water temperature did not indicate significant difference from the response mean (p > 0.05).
!
!
!
!
!
!
!
!
!
!
!
!
!
!
!
!
!
!
!
!
!
!
!
!

! 44!
Table 6. Analysis of variance (ANOVA) on the effects of water temperature on plasma corticosterone concentrations in American bullfrogs Sample size = 122. ANOVA testing the linear fit y = 1.3273596-0.0020165x with the response mean line. df., degrees of freedom. F., Fisher exact test ratio. p., significance statistic for the F ratio.!
!
!
!
!
!
!
!
!
!
!
!
!
!
!
!
!
!
!
!
!
!
!
!
!
!
!
!
!
!
!
!
!
!
!
Source of Variation R squared df F p
Water temperature 0.0007 1 0.0941 0.7596

! 45!
!
!
!
!
!
!
!
!
Figure 5. The effect of body weight on bullfrog plasma corticosterone. Linear regression analysis of corticosterone levels with animal body weight did not indicate significant difference from the response mean (p > 0.05). !
!
!
!
!
!
!
!
!
!
!
!
!
!
!
!
!
!
!
!
!
!
!

! 46!
!
!
!
Table 7. Analysis of variance (ANOVA) on the effects of animal body weight on plasma corticosterone concentrations in American bullfrogs Sample size = 115. ANOVA testing the linear fit y = 1.2039853-0.0002787x with the response mean line. df., degrees of freedom. F., Fisher exact test ratio. p., significance statistic for the F ratio.!!
!
!
!
!
!
!
!
!
!
!
!
!
!
!
!
!
!
!
!
!
!
!
!
!
!
!
!
!
!
!
!
!
!
Source of Variation R squared df F p
Body weight 0.010911 1 1.2465 0.2666

! 47!
!
!
!
!
!
!
!
!
Figure 6. The effect of body length on bullfrog plasma corticosterone. Body length of bullfrogs was measured as snout-vent length. Linear regression analysis of corticosterone levels with animal body length did not indicate significant difference from the response mean (p > 0.05). !
!
!
!
!
!
!
!
!
!
!
!
!
!
!
!
!
!
!
!
!
!
!

! 48!
!
!
!
Table 8. Analysis of variance (ANOVA) on the effects of animal body length on plasma corticosterone concentrations in American bullfrogs Sample size = 115. ANOVA testing the linear fit y = 1.0369293-0.0171769x with the response mean line. df., degrees of freedom. F., Fisher exact test ratio. p., significance statistic for the F ratio.!!
!
!
!
!
!
!
!
!
!
!
!
!
!
!
!
!
!
!
!
!
!
!
!
!
!
!
!
!
!
!
!
!
!
Source of Variation R squared df F p
Snout-vent length 0.017539 1 2.0173 0.1583

! 49!
!
!
!
!
!
!
!
!
Figure 7. The effect of handling time on bullfrog plasma corticosterone. The length of time that each animal was handled before completion of blood sampling was determined during all collections. Linear regression analysis of corticosterone levels with handling time did not indicate significant difference from the response mean (p > 0.05).
!
!
!
!
!
!
!
!
!
!
!
!
!
!
!
!
!
!
!
!
!
!

! 50!
!
!
!
Table 9. Analysis of variance (ANOVA) on the effects of handling time on plasma corticosterone concentrations in American bullfrogs Sample size = 137. ANOVA testing the linear fit y = 1.2828553-0.000047328x with the response mean line. df., degrees of freedom. F., Fisher exact test ratio. p., significance statistic for the F ratio.!!
!
!
!
!
!
!
!
!
!
!
!
!
!
!
!
!
!
!
!
!
!
!
!
!
!
!
!
!
!
!
!
!
!
Source of Variation R squared df F p
Handling time 0.000441 1 0.0595 0.8076

! 51!
!
!
!
!
!
!
!
!
Figure 8. The effect of time of day at collection on bullfrog plasma corticosterone. The time of day was recorded immediately following collection of each animal. Linear regression analysis of corticosterone levels with time of day did not indicate significant difference from the response mean (p > 0.05). X-axis is plotted on a 48hr notation scale in hour:minute:seconds .
!
!
!
!
!
!
!
!
!
!
!
!
!
!
!
!
!
!
!
!
!
!

! 52!
!
!
Table 10. Analysis of variance (ANOVA) on the effects of collection time on plasma corticosterone concentrations in American bullfrogs Sample size = 136. ANOVA testing the linear fit y = 1.5213831-0.0000027118x with the response mean line. df., degrees of freedom. F., Fisher exact test ratio. p., significance statistic for the F ratio.!
!
!
!
!
!
!
!
!
!
!
!
!
!
!
!
!
!
!
!
!
!
!
!
!
!
!
!
!
!
!
!
!
!
!
!
Source of Variation R squared df F p
Time of day at collection 0.002351 1 0.3157 0.5751

! 53!
!
!
!
!
!
!
!
Figure 9. The effect of blood packed cell volume on bullfrog plasma corticosterone. Blood packed cell volume of bullfrogs was measured as hematocrit. Linear regression analysis of corticosterone levels with blood packed cell volume did not indicate significant difference from the response mean (p > 0.05).
!
!
!
!
!
!
!
!
!
!
!
!
!
!
!
!
!
!
!
!
!
!
!
!

! 54!
Table 11. Analysis of variance (ANOVA) of the effects of blood packed cell volume on plasma corticosterone concentrations in American bullfrogs Sample size = 138. ANOVA testing the linear fit y = 1.1797669+0.0037254x with the response mean line. df., degrees of freedom. F., Fisher exact test ratio. p., significance statistic for the F ratio.!
!
!
!
!
!
!
!
!
!
!
!
!
!
!
!
!
!
!
!
!
!
!
!
!
!
!
!
!
!
!
!
!
!
!
!
!
Source of Variation R squared df F p
Packed cell volume 0.008244 1 1.1305 0.2896

! 55!
!
!
!
Figure 10. Collection location determines whole blood oxidative burst in bullfrogs. American bullfrogs collected downstream of agriculture and in areas of 33% or greater agricultural land use had decreased innate immune defense by whole blood oxidative burst as measured against the antigen, Zymosan A in vitro. n = 54 upstream, n = 83 downstream. * notes significance at p < 0.05 (Wilcoxon test).

! 56!
Table 12. Wilcoxon test on the effects of collection location agricultural status on whole blood oxidative burst in American bullfrogs Sample size = 137. df., degrees of freedom. p., significance statistic for the Chi Square value.!
!
!
!
!
!
!
!
!
!
!
!
!
!
!
!
!
!
!
!
!
!
!
!
!
!
!
!
!
!
!
!
!
!
!
!
!
!
!
Source of Variation df ChiSquare p
Agricultural status 1 11.8340 0.0006

! 57!
!
!
Figure 11. Collection location determines blood neutrophil concentrations in bullfrogs. American bullfrogs collected downstream of agriculture and in areas of 33% or greater agricultural land use had decreased neutrophil concentrations in blood as measured by blood smear. n = 56 upstream, n = 82 downstream. * notes significance at p < 0.05 (ANOVA). !
!
!
!
!
!
!
!
!
!
!
!
!
!
!
!
!
!
!
!
!
!
!

! 58!
Table 13. Analysis of variance (ANOVA) on the effects of collection location agricultural status, watershed, and sex on blood neutrophil concentrations in American bullfrogs Sample size = 138. A nested ANOVA with agricultural status as the primary determinant of variation, and nested watershed and sex. df., degrees of freedom. F., Fisher exact test ratio. p., significance statistic for the F ratio.!
!
!
!
!
!
!
!
!
!
!
!
!
!
!
!
!
!
!
!
!
!
!
!
!
!
!
!
!
!
!
!
!
!
!
Source of Variation df F p
Agricultural status 1 13.1367 0.0004
Watershed (agricultural status) 4 2.3330 0.0593
Sex (agricultural status, watershed) 6 0.3375 0.9159

! 59!
!
!
Figure 12. Collection location determines blood lymphocyte concentrations in bullfrogs. American bullfrogs collected downstream of agriculture and in areas of 33% or greater agricultural land use had decreased lymphocyte concentrations in blood as measured by blood smear. n = 56 upstream, n = 82 downstream. * notes significance at p < 0.05 (Wilcoxon test).
!
!
!
!
!
!
!
!
!
!
!
!
!
!
!
!
!
!
!
!
!
!
!
!
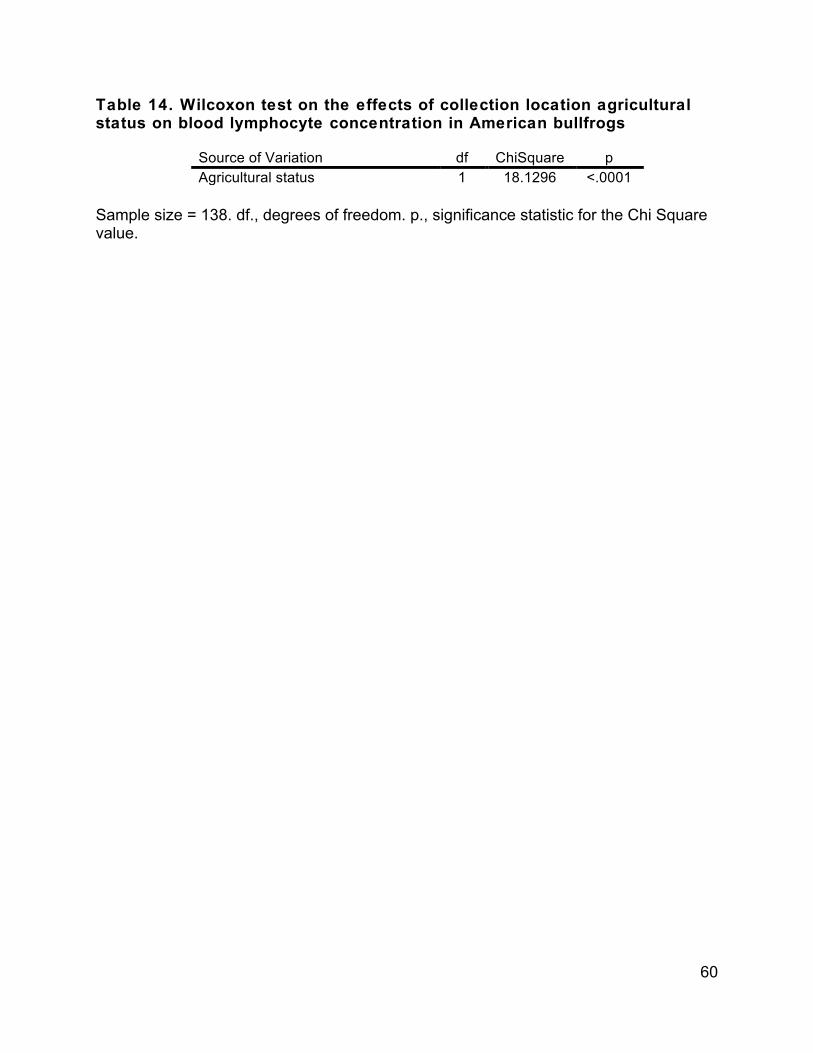
! 60!
Table 14. Wilcoxon test on the effects of collection location agricultural status on blood lymphocyte concentration in American bullfrogs Sample size = 138. df., degrees of freedom. p., significance statistic for the Chi Square value.!
!
!
!
!
!
!
!
!
!
!
!
!
!
!
!
!
!
!
!
!
!
!
!
!
!
!
!
!
!
!
!
!
!
!
!
!
!
!
Source of Variation df ChiSquare p
Agricultural status 1 18.1296 <.0001

! 61!
!
Figure 13. Collection location determines blood eosinophil concentrations in bullfrogs. American bullfrogs collected downstream of agriculture and in areas of 33% or greater agricultural land use had decreased eosinophil concentrations in blood as measured by blood smear. n = 56 upstream, n = 82 downstream. * notes significance at p < 0.05 (ANOVA).
!
!
!
!
!
!
!
!
!
!
!
!
!
!
!
!
!
!
!
!
!
!
!
!

! 62!
Table 15. Analysis of variance (ANOVA) on the effects of collection location agricultural status, watershed, and sex on blood eosinophil concentrations in American bullfrogs Sample size = 138. A nested ANOVA with agricultural status as the primary determinant of variation, and nested watershed and sex. df., degrees of freedom. F., Fisher exact test ratio. p., significance statistic for the F ratio.!
!
!
!
!
!
!
!
!
!
!
!
!
!
!
!
!
!
!
!
!
!
!
!
!
!
!
!
!
!
!
!
!
!
!
Source of Variation df F p
Agricultural status 1 48.3758 <.0001
Watershed (agricultural status) 4 1.8433 0.1246
Sex (agricultural status, watershed) 6 0.6936 0.6552

! 63!
!
!
Figure 14. Collection location determines blood monocyte concentrations in bullfrogs. American bullfrogs collected downstream of agriculture and in areas of 33% or greater agricultural land use had decreased monocyte concentrations in blood as measured by blood smear. n = 56 upstream, n = 82 downstream. * notes significance at p < 0.05 (Wilcoxon test).
!
!
!
!
!
!
!
!
!
!
!
!
!
!
!
!
!
!
!
!
!
!
!
!
!

! 64!
Table 16. Wilcoxon test on the effects of collection location agricultural status on blood monocyte concentration in American bullfrogs Sample size = 138. df., degrees of freedom. p., significance statistic for the Chi Square value.!
!
!
!
!
!
!
!
!
!
!
!
!
!
!
!
!
!
!
!
!
!
!
!
!
!
!
!
!
!
!
!
!
!
!
!
!
!
!
Source of Variation df ChiSquare p
Agricultural status 1 11.7343 <.0006

! 65!
!
!
Figure 15. Collection location does not determine blood basophil concentrations in bullfrogs. No significant difference was observed in blood basophil concentrations in American bullfrogs collected downstream of agriculture and in areas of 33% or greater agricultural land use as measured by blood smear. n = 56 upstream, n = 82 downstream. (ANOVA, p > 0.05)
!
!
!
!
!
!
!
!
!
!
!
!
!
!
!
!
!
!
!
!
!
!
!
!
!

! 66!
Table 17. Analysis of variance (ANOVA) on the effects of collection location agricultural status, watershed, and sex on blood basophil concentrations in American bullfrogs Sample size = 138. A nested ANOVA with agricultural status as the primary determinant of variation, and nested watershed and sex. df., degrees of freedom. F., Fisher exact test ratio. p., significance statistic for the F ratio.!
!
!
!
!
!
!
!
!
!
!
!
!
!
!
!
!
!
!
!
!
!
!
!
!
!
!
!
!
!
!
!
!
!
!
Source of Variation df F p
Agricultural status 1 1.6888 0.1961
Watershed (agricultural status) 4 6.8114 <.0001
Sex (agricultural status, watershed) 6 1.1150 0.3573

! 67!
!
!
Figure 16. Collection location does not determine blood neutrophil to lymphocyte ratios in bullfrogs. No significant difference was observed in neutrophil to lymphocyte ratios in the blood of American bullfrogs collected downstream of agriculture and in areas of 33% or greater agricultural land use as measured by blood smear. n = 56 upstream, n = 82 downstream. (p > 0.05).
!
!
!
!
!
!
!
!
!
!
!
!
!
!
!
!
!
!
!
!
!
!
!
!
!

! 68!
Table 18. Analysis of variance (ANOVA) on the effects of collection location agricultural status, watershed, and sex on blood neutrophil:lymphocyte ratios in American bullfrogs Sample size = 138. A nested ANOVA with agricultural status as the primary determinant of variation, and nested watershed and sex. df., degrees of freedom. F., Fisher exact test ratio. p., significance statistic for the F ratio.!
!
!
!
!
!
!
!
!
!
!
!
!
!
!
!
!
!
!
!
!
!
!
!
!
!
!
!
!
!
!
!
!
!
!
Source of Variation df F p
Agricultural status 1 1.3599 0.2458
Watershed (agricultural status) 4 2.6702 0.0352
Sex (agricultural status, watershed) 6 1.6360 0.1425

! 69!
!
!
Figure 17. Collection location determines blood packed cell volume in bullfrogs. American bullfrogs collected downstream of agriculture and in areas of 33% or greater agricultural land use had decreased packed cell volume in blood as measured by hematocrit. n = 55 upstream, n = 83 downstream. * notes significance at p < 0.05 (Wilcoxon test).
!
!
!
!
!
!
!
!
!
!
!
!
!
!
!
!
!
!
!
!
!
!
!
!
!

! 70!
Table 19. Wilcoxon test on the effects of collection location agricultural status on packed cell volume in the blood of American bullfrogs Sample size = 138. df., degrees of freedom. p., significance statistic for the Chi Square value.!
!
!
!
!
!
!
!
!
!
!
!
!
!
!
!
!
!
!
!
!
!
!
!
!
!
!
!
!
!
!
!
!
!
!
!
!
!
Source of Variation df ChiSquare p
Agricultural status 1 9.2138 .0024

! 71!
Figure 18. Plasma corticosterone concentration of bullfrogs collected at sites in the Sacramento River watershed. Blood was collected from bullfrogs at field sites and analyzed for plasma corticosterone. Grey bars indicate non-agricultural sites, black bars indicate agricultural sites. WA = Wildlife Area, NWR = National Wildlife Refuge. n = 16 Battle Creek WA, n = 7 Colusa NWR, n = 19 Sutter NWR. No significant difference was observed (ANOVA p > 0.05). !
!
!
!
!
!
!
!
!
!
!
!
!
!
!
!
!
!
!
!

! 72!
Table 20. Analysis of variance (ANOVA) on the effects of collection location and sex on plasma corticosterone concentrations in American bullfrogs in the Sacramento River watershed. Sample size = 42. A nested ANOVA with collection site as the primary determinant of variation, and nested sex. df., degrees of freedom. F., Fisher exact test ratio. p., significance statistic for the F ratio.!!
!
!
!
!
!
!
!
!
!
!
!
!
!
!
!
!
!
!
!
!
!
!
!
!
!
!
!
!
!
!
!
!
!
!
Source of Variation df F p
Site 2 1.1220 0.3368
Sex (site) 3 1.5782 0.2115

! 73!
!
Figure 19. Plasma corticosterone concentration of bullfrogs collected at sites in the Salinas River watershed. Blood was collected from bullfrogs at field sites and analyzed for plasma corticosterone. Grey bars indicate non-agricultural sites, black bars indicate agricultural sites. n = 23 Santa Margarita, n = 25 Salinas. No significant difference was observed (ANOVA p < 0.05). !
!
!
!
!
!
!
!
!
!
!
!
!
!
!
!
!
!
!
!
!
!

! 74!
Table 21. Analysis of variance (ANOVA) on the effects of collection location and sex on plasma corticosterone concentrations in American bullfrogs in the Salinas River watershed. Sample size = 48. A nested ANOVA with collection site as the primary determinant of variation, and nested sex. df., degrees of freedom. F., Fisher exact test ratio. p., significance statistic for the F ratio.!!
!
!
!
!
!
!
!
!
!
!
!
!
!
!
!
!
!
!
!
!
!
!
!
!
!
!
!
!
!
!
!
!
!
!
Source of Variation df F p
Site 1 0.7639 0.3869
Sex (site) 2 0.3027 0.7403

! 75!
!
Figure 20. Plasma corticosterone concentration of bullfrogs collected at sites in the San Joaquin River watershed. Blood was collected from bullfrogs at field sites and analyzed for plasma corticosterone. Grey bars indicate non-agricultural sites, black bars indicate agricultural sites. WA = Wildlife Area, NWR = National Wildlife Refuge. n = 16 Del Puerto Canyon, n = 19 North Grasslands WA, n = 14 San Joaquin River NWR. * notes significance (ANOVA p < 0.05).
!
!
!
!
!
!
!
!
!
!
!
!
!
!
!
!
!
!
!
!
!

! 76!
Table 22. Analysis of variance (ANOVA) on the effects of collection location and sex on plasma corticosterone concentrations in American bullfrogs in the San Joaquin River watershed. Sample size = 48. A nested ANOVA with collection site as the primary determinant of variation, and nested sex. df., degrees of freedom. F., Fisher exact test ratio. p., significance statistic for the F ratio.!!
!
!
!
!
!
!
!
!
!
!
!
!
!
!
!
!
!
!
!
!
!
!
!
!
!
!
!
!
!
!
!
!
!
!
Source of Variation df F p
Site 2 5.8284 0.0058
Sex (site) 3 0.1510 0.9284
! 77!
Chapter 3. An Amphibian Model of the Effects of an Environmentally Relevant Contaminant Mixture on Stress and Immunity Abstract
The current study represents a unique model system for studying the effects of current use pesticides on an anuran model. Endocrine and immune endpoints were examined in an invasive model amphibian, the American bullfrog (Lithobates catesbeiana), to represent effects in sensitive native amphibians. Adult bullfrogs were exposed to a mixture of aquatic contaminants representing commonly applied pesticides and fertilizers in California, USA for 12 days. Our contaminant mixture included glyphosate isopropylamine salt, oxyfluorfen, chlorpyrifos, pendimethalin, paraquat dichloride, glufosinate-ammonium, maneb, propanil, trifluralin, 2,4-D dimethylamine salt, nitrates, and phosphates. Our highest treatment contained 10 ppb of each pesticide, 20 ppm nitrate, and 1ppm phosphate. Also tested were 10x and 100x dilutions of this mixture. Plasma glucocorticoid (corticosterone) concentration was not significantly altered following exposure. No change in blood oxidative burst activity or neutrophil, lymphocyte, neutrophil to lymphocyte ratios, monocytes, eosinophil, or basophil concentrations were observed. Treatment did not affect susceptibility to infection with the bacterium Aeromonas hydrophila. Given the importance of aquatic pollution and disease in global amphibian declines this study may assist in identifying and prioritizing significant threats to amphibian survival. Introduction
Amphibian populations have been dramatically reduced by human activities (Stuart et al. 2004, IUCN 2010). Recent evidence suggests that pollution and disease may be key drivers in these declines, and particularly important in altered habitat (IUCN 2010). Amphibian populations in agricultural regions experience particularly challenging stressors unique to this habitat type (Hayes et al. 2010). In addition to degradation of physical habitat, agrichemicals and pathogens may represent overwhelming challenges to amphibian survival (Johnson et al. 2007, King et al. 2007, Rohr et al. 2008b). In the current study, we examined the effects of a relevant agrichemical mixture on endocrinology and resistance to disease in an amphibian. We use an invasive species in California, the American bullfrog (Lithobates catesbeiana), as a surrogate for the effects of current use contaminants on declining native amphibian populations.
Disruption of interrenal function has been observed in both adult and larval amphibians exposed to agrichemicals in two previous studies. In the first study, an environmentally relevant pesticide mixture increased plasma glucocorticoid
(corticosterone) in adult Xenopus laevis (Hayes et al. 2006). Increased whole body
corticosterone was also observed in Osteopilus septentrionalis larvae in response to the
fungicide chlorothalonil (McMahon et al. 2011). Both studies demonstrated a corresponding alteration of immune function. The connection of increased stress hormone levels with changes in immune function has been well established (Sapolsky et al. 2000). However, our knowledge of the influence of specific contaminants on this interaction in amphibians is lacking.
Studies of surface water in agricultural regions indicate that agrichemical contaminants are rarely detected in isolation due to current pest control practices

! 78!
(Kolpin et al. 2002, Gilliom et al. 2006). Often, water samples contained mixtures of commonly applied chemicals and their breakdown products. Mixtures may represent a more realistic exposure scenario for many free ranging amphibians. In the current study a mixture of ten pesticides, nitrate, and phosphate were used to represent hypothetical contamination of aquatic ecosystems in California, USA. After exposure, I examined effects on the stress hormone, corticosterone, and subsequent effects on immune parameters and function. Materials and Methods Chemicals
Technical grade chemicals with noted purity included: glyphosate isopropylamine salt (>95%), oxyfluorfen (98.1%), chlorpyrifos (99.5%), pendimethalin (99.4%), paraquat
dichloride solution (1770 µg/mL in de-ionized water), glufosinate-ammonium (99%), maneb (>95), propanil (99.5%), trifluralin (99.5%), and 2,4-D dimethylamine salt (99.5%). All pesticides were purchased through Chemservice Inc. (West Chester, PA). Sodium nitrate (>99%) and Sodium phosphate (>98%) were purchased through Sigma-Aldrich (St. Louis, MO).
Pesticide and nutrient exposure choice Pesticide exposure choice for this experiment was made using information publicly available from the California Department of Pesticide Regulation
(http://www.cdpr.ca.gov/docs/pur/purmain.htm) (CDPR 2011). Pesticide application information for the year 2009 was obtained from the California Pesticide Usage Reporting Program(CDPR 2011). The top pesticides of use were determined for both quantity applied and number of acres applied. The ten pesticides that occurred highest on both lists were used for this experiment. Agrichemicals in our mixture included: glyphosate isopropylamine salt, oxyfluorfen, chlorpyrifos, pendimethalin, paraquat dichloride, glufosinate-ammonium, maneb, propanil, trifluralin, 2,4-D dimethylamine salt, nitrate, and phosphate. These compounds were chosen to represent a mixture of aquatic contaminants likely encountered by amphibians in California, USA. Animal collection and experimental conditions
Post-metamorphic American bullfrogs (Lithobates catesbeiana) were collected from a regional park with no current or recent agricultural activity; Pleasanton Ridge East Bay Regional Park 37 38’43.56”N 121 55’06.01”W. The sex of bullfrogs at this stage cannot be determined without dissection. Because of known hormone fluctuations in adult male bullfrogs and previous difficulties in captive care we limited experimental animals to those that did not display obvious signs of male sexual maturity and secondary sex characteristics (yellow throat coloration, enlarged tympanum:eye ratio, enlarged thumb breeding glands) (Licht et al. 1983, Mendonca et al. 1985). For this reason our experiment included both immature male and female animals. Animals were group housed in the laboratory for several months prior to the start of experiments under experimental conditions and fed calcium carbonate dusted 5-week old crickets ad libitum every three days. Prior to the start of experiment, no animals displayed outward symptoms of disease.

! 79!
Sex could not be identified prior to experiment and animals were apportioned to treatment groups equally by body size. For the duration of all experimental exposures, animals were housed individually in clear polyethylene 259 mm W x 476mm L x 209mm H rat cages from Allentown Inc. (Allentown, N.J.). Tanks were elevated approximately 5 cm on one end and filled with 1 liter of 0.1x Holtfreter’s solution (6.03 mM NaCl, 0.068 mM KCl,0.09 mM, CaCl2,and 0.24 mM NaCO3) and 5 unbleached paper towels to simulate a semi-terrestrial habitat (Holtfreter 1931). White foam dividers were placed between all tanks to ensure that animals in adjacent tanks could not view each other
and disrupt experimental conditions. The experiment was conducted at 22°C and lights were operated on a 12 hr light/12 hr dark cycle, lights on at 07:00. Animals were acclimated in uncontaminated Holtfreter’s solution for two water changes prior to beginning of treatment. Treatment water was removed, tanks were cleaned, and treatment renewed every third day. Animals were fed eight 5-week old crickets dusted with calcium carbonate on the day before each treatment renewal. Tanks were systematically rotated on the day of treatment renewal to avoid positional effects throughout the experiment. Dosing and subsequent analysis were conducted blindly using color codes for each treatment. Experimental exposure
Stocks of glyphosate isopropylamine salt, glufosinate ammonium, paraquat dichloride, sodium nitrate, and sodium phosphate were dissolved in ultrapure water. All other pesticides were dissolved in 100% ethanol. The concentration of sodium phosphate and sodium nitrate were adjusted to the final ion concentrations listed below. From these initial stocks two concentrate solutions of experimental mix were made, a pesticide mix in ethanol and a fertilizer mix in ultrapure water. Dilutions of stock concentrates were made for each experimental treatment dose. An equal volume aliquot of each of these concentrate solutions (one pesticide and one nutrient) was added to the final experimental medium, Holtfreter’s solution. Final concentration of ethanol vehicle in experimental solution was 0.0036% (Hayes et al. 2006). Controls received an equal aliquot of ethanol only and ultrapure water only. Three experimental concentrations were included in this experiment and will be referred to by nominal labels: 1) “high” 10 parts per billion (ppb) each pesticide, 20 parts per million (ppm) nitrate ion, 1 ppm phosphate ion, 2) “moderate” 1 ppb each pesticide, 2 ppm nitrate ion, 0.1 ppm phosphate ion, 3) “low” 0.1 ppb each pesticide, 0.2 ppm nitrate ion, 0.01 ppm phosphate ion. Each treatment was replicated ten times. Confirmation of experimental treatment concentration Treatment water was analyzed for concentration of glyphosate and 2,4-D. Two collections took place on days that the solutions were mixed following dilution from the concentrated stock. One collection was taken from the experimental tanks on the third day before treatment water was renewed. Water was collected in methanol-rinsed
amber glass bottles and frozen at -20°C until time of analysis. On the day of analysis,
water was filtered through 0.7 µM glass fiber syringe filters to remove any debris from tanks. Treatment tank water was analyzed for glyphosate and 2,4-D as surrogates for measurement, dilution, and dosing of all pesticides in treatment mix. These compounds were specifically chosen because commercially available kits are available for analysis.

! 80!
Pesticide concentrations were measured by enzyme immunoassay kits purchased from Abraxis (Warminster, PA) according to the manufacturer’s instructions. Reported values represent analysis of 30.0 mL of treatment water from the dilution carboy at time point one and 10.0 mL of pooled treatment from of each of three experimental tanks for time point two. Sample collection
Blood samples were collected on day 12 of exposure by cardiac puncture from animals (without anesthesia) between the hours of 18:00 – 19:30. Before treatments, a blood collection was made to determine if a diurnal cycle of plasma corticosterone would confound experimental results. Blood was collected by cardiac puncture from ten different animals at each of four time points in a 24 hr cycle: 06:00, 12:00, 18:00, 24:00. During all collections, the time between catch and conclusion of blood collection was recorded for each animal, with efforts to maintain a five minute maximum handling time when possible. This time has been previously validated as prior to the increase in plasma corticosterone in handled bullfrogs by the authors (data not shown). Plasma
was collected by aspiration following centrifuge and stored frozen at -20°C until corticosterone analysis. All experiments were conducted in April and May 2011. Plasma corticosterone concentration
Corticosterone levels in bullfrog plasma were measured by radioimmunoassay (RIA). Plasma samples were extracted in diethyl ether, dried under nitrogen, and reconstituted in PBS with gelatin (PBS-g). Samples were assayed using antisera from MP Biomedicals (Solon, Ohio) according to the manufacturer’s protocol. The authors validated antisera for use with bullfrog plasma. Samples from all treatment groups were measured in each assay. The interassay variation was 8.03 % and intraassay variation was 6.4%. Whole blood oxidative burst
The in vitro innate immune activity of live cells in whole blood against a model antigen was measured for each specimen following the protocol of Gilbertson et al. (Marnila et al. 1995, Gilbertson et al. 2003). Briefly, whole blood in frog ringer solution was combined with 1mM luminol (3-Aminophthalhydrazide, 5-Amino-2,3-dihydro-1,4-
phthalazinedione) and a yeast cell wall preparation of 500 µg (Zymosan A) in a 96 well plate. Each sample was analyzed in duplicate. The reaction of the blood to this simulated infection is monitored as the light produced by innate immune cells using reactive oxygen species to destroy the yeast antigen. Readings of all samples were taken every 3 minutes for 30 cycles. The blank (ringer only) subtracted peak chemiluminescence was recorded for each sample. The treatment group average peak chemiluminescence is reported. Blood cell differentials
Blood was applied to glass microscope slides using a heparin treated microhematocrit tube and spread using the edge of another glass slide. The remaining blood in hematocrit tubes was centrifuged and used to determine packed cell volume. Packed cell volume is reported as percent cells to total volume. Blood smears were

! 81!
fixed with methanol and stained with Wright’s giemsa stain. Smears were counted according to Davis and Maerz (Davis and Maerz 2008). Briefly, the number of red blood cells in each of five fields of view at (1000x) was quantified within the feathered edge of each smear. In addition, a total of 100 white blood cells were counted in the feathered edge. Identification of cell type followed Wright and Whitaker (Wright and Whitacker 2001). The number of fields of view to reach 100 white blood cells was recorded. Two blood slides were created for each animal. Reported here are the results of two slides for each animal. These values were used to generate the reported value of estimated white blood cells per 1,000 red blood cells. All analysis was conducted blindly. Aeromonas hydrophila Inoculation Following a twelve-day exposure to contaminants, all animals were inoculated with the bacterium, Aeromonas hydrophila. A. hydrophila (ATCC 7966) was provided as
a dehydrated Lyfodisk" from Microbiologics (St. Cloud, MN). Dehydrated disks were
rehydrated in sterile PBS and streaked onto nutrient agar plates at 30°C. Several colonies were transferred from agar to nutrient broth. After 24 hr, 0.5 mL of culture was transferred to fresh nutrient broth for inoculum. Animals were intraperitonially injected with 1.0 mL inoculum (4.7x10⁸ colony forming units / mL) per 95 grams animal body weight (average weight of animals at time of inoculation). We chose 1.0 mL of a concentrated, rapidly growing culture because this is the maximum allowable injection volume without inducing osmotic stress given the average animal weight in this study (UC Berkeley laboratory animal use protocol). Prior to inoculation, evidence of infection
was assessed in the blood of all animals. An aliquot of blood was incubated at 30°C on Glutamate Starch Phenol red (GSP) agar purchased through Fluka Biochemikia/Sigma Aldrich (St. Louis, MO) with penicillin (60 mg/L). This agar is specific to grow Aeromonas and Psuedomonas species. Aeromonas are easily identified by characteristic yellow colored colonies. Determination of Aeromonas hydrophila Infection
At day 5 and 6 after inoculation, infection with A. hydrophila was assessed in blood and liver tissue respectively. Blood bacterial load was assessed as above. The entire liver was aseptically dissected from animals following euthanasia by decapitation. Liver weights were recorded and equal weight portions of the major liver lobes on each animal were retained for analysis. Liver tissue was homogenized in nutrient broth with 0.05 % Tween 80 as described by Cosma et al. (Cosma et al. 2006). Homogenate was plated on GSP penicillin agar and incubated at 30oC. Remaining homogenate was
stored at 4°C for further analysis. It was determined that dilutions of homogenate in nutrient broth were necessary for several samples. To ensure similar analysis, all samples of both dilute and concentrate were plated a second time within 96 hr of collection. Results are reported as colony forming units (cfu) per milligram liver tissue. Statistics
Statistical analyses were performed using JMP 9.0 (SAS Institute Inc.). Plasma corticosterone diurnal cycle and treatment group data, total white blood cell counts, liver weight, and liver bacteria cfu after inoculation were log transformed to meet the parametric assumptions of normality and homoscedasticity and analyzed by nested

! 82!
analysis of variance (ANOVA). Blood eosinophils were square root transformed and analyzed by nested ANOVA. Blood basophils and oxidative burst were not transformed and analyzed by nested ANOVA. For nested ANOVA, treatment group or time of collection was the primary level of variation, with nested sex of animal. Blood lymphocytes, neutrophils, monocytes, hematocrit, blood bacteria cfu after inoculation, were analyzed by a nonparametric Wilcoxon test due to the inequality of variance and lack of normality following transformation. In levels where significance was detected by ANOVA (p < 0.05) and Wilcoxon test (p < 0.05), Tukey’s honestly significant different (HSD) test was used to determine significantly different groupings. Results Animal collection and experimental conditions
Following terminal dissections, we identified the sex ratio for the study at 27 male and 13 female adult American bullfrogs (Lithobates catesbieana). Animal weight (F = 0.2366, df = 3, p = 0.8703) and length (F = 0.2940, df = 3, p = 0.8295) did not differ between treatment groups. Control group included one female and nine males. Low treatment group included five females and five males. Moderate treatment group included three females and seven males. High treatment group included four females and six males. One animal died following blood collection for diurnal corticosterone cycle, prior to the start of treatment. The average weight of animals in this study was
(91.5 ± 5.73) grams and the average snout-vent length was (8.67 ± 0.15) centimeters. Confirmation of experimental treatment concentration The concentration of glyphosate and 2,4-D was analyzed at two time points on the first day of treatment dilution and one time point on the day treatment was renewed (Table 2-3). The two pesticides were used as surrogates for the measurement, dilution,
and dosing of all chemicals in mix. The limit of detection was 0.05 µg/L for glyphosate
and 2.0 µg/L for 2,4-D.
Nominal high (10.0 µg/L) treatment concentration of glyphosate was measured at
6.6 µg/L and 4.3 µg/L on the day of dilution for time points one and two respectively. On the day of renewal for time point one, high treatment glyphosate concentration was 6.3
µg/L. Control treatments had undetectable concentrations of glyphosate at time points one and two on the day of dilution. On the day of treatment renewal for time point one,
glyphosate concentration was 0.08 µg/L in control tanks. However the measured
concentration approaches the detection limit (0.05 µg/L) for our kit and was suspected to be a false reading.
Nominal high (10.0 µg/L) treatment concentration of 2,4-D was 11.6 µg/L on the day of dilution at both time points one and two. On the day of renewal for time point one
2,4-D was 8.2 µg/L. Control groups had undetectable (< 2.0 µg/L) levels of 2,4-D. Plasma corticosterone concentration Prior to experimental treatment, plasma corticosterone was measured to determine if a diurnal cycle was present in study animals. Blood was collected from groups of animals at 06:00, 12:00, 18:00, and 24:00. No evidence of a significant diurnal cycle was present in experimental animals (F = 0.7556, df = 3, p = 0.5285) (Figure 1, Table 4).

! 83!
Blood was collected from all animals after 12 days of exposure to determine if agrichemical treatment affected plasma corticosterone (Figure 2, Table 5). No significant difference was observed between treatment groups (F = 0.5031, df = 3, p = 0.6830). Blood cell differentials and whole blood oxidative burst Blood cell differentials, innate immune cell activity, and packed cell volume were measured following 12 days of treatment with pesticides and nutrients. No significant difference was observed in the total number of white blood cells (F = 0.4663, df = 3, p = 0.7079), or counts of lymphocytes (Chi = 1.5855, df = 3, p = 0.6627), neutrophils (Chi = 1.9800, df = 3, p = 0.5766), monocytes (Chi = 2.8523, df = 3, p = 0.4150), eosinophils (F = 1.1145, df = 3, p = 0.3582), and basophils (F = 0.4208, df = 3, p = 0.7394) when analyzed for combined male and female frogs (Tables 6-11). Blood eosinophils were significantly decreased in females of the low treatment compared to males of the control treatment (F = 2.7807, df = 4, p = 0.0440) (Table 10). No significant difference was observed in innate immune cell function as measured by whole blood oxidative burst (F = 0.1097, df = 3, p = 0.9536) (Figure 3, Table 12). In addition, treatment for 12 days did not affect packed cell volume as measured by hematocrit (Chi = 1.8973, df = 3, p = 0.5940) (Figure 4, Table 13). Aeromonas hydrophila inoculation
A. hydrophila was found in the blood of only one animal prior to inoculation. The animal had 50 colony forming units (cfu) / mL blood (lack of infection for all other animals not shown). Determination of Aeromonas hydrophila Infection Aeromonas hydrophila concentrations were determined in the blood and liver of all animals following 5 and 6 days respectively after inoculation. All animals received an equal inoculation after 12 days of exposure to contaminants. At dissection, no significant symptoms of enlarged liver tissue (hepatomegaly) were evident between treatment groups (F = 1.4369, df = 3, p = 0.2509) (Figure 5, Table 14). Recovery of A.hydrophila from all treatment groups confirmed the effectiveness of inoculation. However, no significant differences in infection intensity were observed between treatment groups for either blood (Chi = 5.8398, df = 3, p = 0.1197) or liver (F = 0.2831, df = 3, p = 0.8372) (Figures 6-7, Tables 15-16). Discussion
Nearly 60% of California’s amphibian and reptile populations are threatened or already declining in numbers (Jennings and Hayes 1994). The authors of a survey on the status of amphibians statewide concluded that species in aquatic habitats were particularly at risk and that water quality and pollution were major factors (Jennings and Hayes 1994). As described below, information on the effects of exposure to current use agrichemicals in amphibians is lacking. Information is particularly absent for chemical mixtures and for sublethal effects such as endocrine and immune disruption. In the current study, we propose the use of an invasive species model as a surrogate for the effects of aquatic contaminants on declining native amphibians with similar life histories

! 84!
and range overlap. Our model provides valuable information on the endocrine and immune disruption potential of a relevant agrichemical mixture. Experimental models such as the ones described here may provide crucial information to prioritize contaminants of concern for conservation and management efforts.
To test our model, the invasive American bullfrog (Lithobates catesbeiana) was used as a surrogate for declining California native amphibians such as the California Red-legged frog (Rana draytonii), Foothill Yellow-legged Frog (Rana boylii), the Western Spadefoot toad (Spea hammondii), and the California toad (Anaxyrus boreas halophilus). Many declining species are not available in sufficient numbers to be used for initial investigations of pollutants. Lethal methods of study may be restricted in sensitive populations, yet are at times justified in order to obtain information for conservation. Therefore, it is important to establish model systems in which results can be used to direct more specific experiments in sensitive populations. Bullfrogs are easily collected from many localities in the United States and share similar life history to many North American anurans from temperature regions. Therefore studies of the influence of environmental conditions or laboratory treatments on bullfrogs may provide valuable information for conservation of declining species. Additionally, in the western US invasive bullfrogs represent a significant stress to native sympatric populations, and removal for studies may be beneficial (Kupferberg 1997, Lawler et al. 1999).
California has a comprehensive pesticide usage reporting system (CDPR 2011). Since 1990, all pesticides applied in California by registered applicators must be reported to the Department of Pesticide Regulation, and records are publically available. California has 1,009 registered pesticide active ingredients representing 13,221 products used for pest control (CDPR 2011). Annually the state applies approximately 150 million pounds of pesticide active ingredients as well as large quantities of synthetic fertilizer (CDPR 2011). The pesticide mixture used in the current study represent pesticides and nutrients that many amphibians likely encounter in aquatic conditions throughout the California. The mixture was determined both on a basis of amount of chemical used and acres to which the chemical is applied. A previous study by Hunt et al. determined that records of pesticide application in California are a reliable predictor of both surface water contamination and toxicity to invertebrates (Hunt et al. 2006). Therefore these contaminants are likely present, at least temporarily, in the surface waters of regions of intensive agricultural land use. In addition to intense use of chemical pest control, nutrients in the form of synthetic fertilizer are often applied to agricultural land to increase crop yield (Rouse et al. 1999). We added nitrate and phosphate to our mixture experiment to simulate these eutrophic aquatic conditions.
Despite the widespread use of the compounds in our mixture across large geographic areas, information on effects in amphibians is lacking. Data is particularly scarce for sublethal endpoints such as endocrine and immune disruption. To our knowledge, no previous studies exist on the effects of pendimethalin and oxyfluorfen exposure in amphibians. For the compounds trifluralin, propanil, and glufosinate, lethality determinations are available but information on sublethal endpoints are lacking (Moore et al. 1998, Jayawardena et al. 2010, Sayim 2010). Maneb is associated with altered development and limb regeneration in amphibians (Bancroft and Prahlad 1973, Arias and Zavanella 1979). Paraquat alters development and disrupts steroidogenesis, likely through generation of reactive oxygen species (Quassinti et al. 2009, Mussi and

! 85!
Calcaterra 2010). 2,4-D is also associated with abnormal development in amphibians (Aronzon et al. 2010).
Relative to other chemicals in our mixture, a greater body of knowledge exists for the effects of exposure to the herbicide glyphosate and the insecticide chlorpyrifos in amphibians. Chlorpyrifos and its metabolites are particularly toxic to amphibians (Sparling and Fellers 2007). In mixture with atrazine, chlorpyrifos increased susceptibility to ranavirus in Tiger salamanders (Ambystoma tigrinum) (Kerby and Storfer 2009). Chlorpyrifos is also a suspected endocrine disrupter and caused oocyte development in the testes of male Agile frogs (Rana dalmatina) (Bernabo et al. 2011). Taken together with patterns of land use and application in California, organophosphate insecticides are highly associated with declining populations (Davidson 2004). The toxicity of products containing glyphosate is well documented in amphibians (Howe et al. 2004, Relyea and Jones 2009). However, much of this toxicity is attributed to commercial formulations containing polyethoxylated tallowamine (POEA) (Howe et al. 2004, Relyea and Jones 2009). At environmentally relevant concentrations, Rana clamitans tadpoles exposed to glyphosate became more infected in a challenge experiment with the trematode parasite Echinostoma trivolvis (Rohr et al. 2008a).
The addition of nitrate and phosphate to our pesticide mixture further modeled agricultural environments. Eutrophication is a widespread problem in US rivers (Carpenter et al. 1998, Rouse et al. 1999). The input of excess nutrients to aquatic systems leads to algal blooms, loss of oxygen, fish kills, loss of biodiversity, and may represent a significant problem to human environmental health when present in drinking water (Carpenter et al. 1998, Rouse et al. 1999). Nitrate and phosphate are toxic to amphibians and alter development(Marco et al. 1999, Earl and Whiteman 2009, 2010). In addition, when combined with pesticide exposure, interactions were determined on sublethal measurements of development and sex ratio (Sullivan and Spence 2003, Orton et al. 2006, Krishnamurthy and Smith 2010). Nitrate has also been implicated in the disruption of steroidogenesis, although this mechanism has not yet been extensively studied(Guillette and Edwards 2005).
Our results indicated that bullfrog corticosterone levels did not fluctuate on a diurnal cycle. Previous studies have observed plasma corticosterone in wild bullfrogs and other amphibians in the laboratory to naturally fluctuate with time of day, time of year, and breeding activity (Dupont et al. 1979, Licht et al. 1983, Pancak and Taylor 1983, Mendonca et al. 1985, Thurmond et al. 1986). However, to our knowledge no other studies have examined corticosterone cycles in adult bullfrogs brought into the laboratory. The corticosterone concentrations we observed in the study were not significantly higher than those observed in other laboratory studies or in wild-caught bullfrogs (data not shown). Therefore, we do not believe that a cycle was masked by experiment conditions.
In the current study, exposure to this pesticide mixture did not affect plasma corticosterone levels in bullfrogs. Two previous studies of agricultural contaminants have noted an increase in corticosterone in amphibians exposed to agrichemicals (Hayes et al. 2006, McMahon et al. 2011). A mixture of pesticides not typically applied in California increased plasma corticosterone in adult Xenopus laevis (Hayes et al. 2006). Whole body corticosterone was increased in developing Cuban treefrogs (Osteopilus septentrionalis) following exposure to the fungicide chlorothalonil (McMahon

! 86!
et al. 2011). Little information is available on the endocrine disrupting effects of the chemicals in our mixture. Glyphosate disrupts steroidogenesis in vitro by inhibiting the StAR protein (Walsh et al. 2000). Similarly, paraquat inhibits steroidogenesis in vitro through reactive oxygen production (Quassinti et al. 2009). In vivo glyphosate exposures have increased the stress hormone cortisol in fish, although at concentrations at least one order of magnitude higher than studied here (Soso et al. 2007). Exposure to chlorpyrifos decreased cortisol levels in fish at environmentally relevant concentrations (Oruc 2010). Oral exposure to chlorpyrifos increased cortisol levels in ewes (Rawlings et al. 1998). The current results suggest that the levels tested here for the pesticide mixture examined do not pose serious potential for disruption of interrenal function in a short-term exposure in adult bullfrogs. We hypothesize that greater concentrations of contaminants or longer time periods may alter hormone levels, given the body of literature on similar contaminants.
Amphibian mortalities attributed to “red leg” have historically been associated with the bacterial pathogen Aeromonas hydrophila (Rigney et al. 1978, Wright and Whitacker 2001). Red leg syndrome manifests as hyperemia and hemorrhage of the hind limb skin and is fatal in cases of high infection burden (Rigney et al. 1978). Bacterium of the genus Aeromonas are gram-negative rods and may be present in both freshwater and estuarine habitats (Cahill 1990). The pathogenicity of Aeromonads is attributed to production of endotoxins, extracellular enterotoxins, haemolysins, cytotoxins and pro- teases(Cahill 1990). One study attributed Boreal toad (Bufo boreas boreas) population decimation in the mountains of Colorado to be caused by Aeromonas hydrophila (Carey 1993). However, many now consider this bacterium to be an opportunistic pathogen usually capable of mortality in only co-infected or immune compromised individuals (Wright and Whitacker 2001). For example, mortality to challenge with Aeromonas was increased following treatment of Woodhouse’s toads (Bufo woodhousi) with the organophosphate pesticide malathion (Taylor et al. 1999). Therefore, the Aeromonas hydrophila challenge assay used here is an excellent model to determine the effects of external stressors on amphibian immune function. No changes were observed in immune function parameters or susceptibility to infection with Aeromonas hydrophila following exposure. Blood cell differentials and activity were not changed by contaminants exposure. Changes in blood cells have previously been shown as sensitive measures of both stress and immuntoxicity (Kiesecker 2002, Gilbertson et al. 2003, Davis et al. 2008). Our A. hydrophila challenge assay was validated using a pre-inoculation screen of each animal’s blood. No A. hydrophila was recovered from the blood of all animals except one, indicating our population was not previously infected. A. hydrophila was found in the blood of only one animal prior to inoculation 50 colony forming units (cfu) / mL blood. The infection level in the Aeromonas-positive animal was minimal relative to levels measured following inoculation, and infection was not found in blood or liver following inoculation. We suspect experimental error or contamination occurred for one animal. Following inoculation we recovered A. hydrophila from the blood and liver of animals in all treatment groups. Our finding suggested that the dose of A. hydrophila was relevant and had challenged the experimental animals’ immune system. Though highly variable levels of A. hydrophila were recovered from the blood a significant difference was not observed. Several studies have observed alterations to immune function and

! 87!
susceptibility to disease following agrichemical exposure with other contaminant mixtures, particularly in larval amphibians (Kiesecker 2002, Gilbertson et al. 2003, Hayes et al. 2006, Rohr et al. 2008a, Kerby and Storfer 2009). In a similar model to the current experiment, Taylor and colleagues observed an increase in susceptibility of adult toads to A. hydrophila infection following exposure to a single organophosphate insecticide, malathion (Taylor et al. 1999). Glyphosate exposure in developing larvae increased susceptibility to Echinostoma trivolvis encystment (Rohr et al. 2008a). In mixture with atrazine, chlorpyrifos increased susceptibility to ranavirus in Tiger salamanders (Ambystoma tigrinum) (Kerby and Storfer 2009). Again we suspect that greater concentrations of contaminants may alter immune function when considering the results of studies with similar compounds. Also, infection may persist longer in treated animals compared to control. A longer duration of infection challenge may be necessary to observe differences in response of animals between treatment groups.
Overall, several hypotheses may explain the lack of significant effects on interrenal and immune function by the agrichemical mixture tested here. We exposed animals in semi-terrestrial inclined tanks that allowed for behavioral avoidance of the applied exposure. Behavior was not recorded, however animals were frequently observed in the terrestrial portion of exposure tanks. Though more environmentally relevant than injection or applied exposures, an immersion system may introduce variation among individuals of treatment groups. Second, the interaction of the specific agrichemicals in our mixture has not been previously studied. There is potential that compounds may antagonize the activity of others at both the chemical exposure and within-organism level. Further information on chemical interactions will be crucial in understanding complex environmental mixture exposures. Third, differences in response may depend on magnitude, duration, and life stage that were not taken into account with our experimental design. Higher levels of contaminants or longer periods of exposure may be required for biological activity. Given that wild amphibians most likely encounter both increased levels of agrichemicals in water and alterations to local pathogen ecology, efforts to identify specific contaminants of concern are greatly needed.
The current study highlights a model system for testing the effects of contaminants or mixtures of contaminants. The experiment provides valuable information to direct future studies for prioritizing contaminants or exposure levels. It is clear from the available literature that more studies of both specific current use contaminants and mixtures are needed to direct conservation and management efforts. Given the extent and pace of amphibian population declines, all information regarding the biological activity or lack of activity of any contaminants may prove invaluable. References Arias, E. and T. Zavanella. 1979. Teratogenic effects of manganese
ethylenebisdithiocarbamate (maneb) on forelimb regeneration in the adult newt, Triturus cristatus carnifex. Bulletin of Environmental Contamination and Toxicology 22:297-304.
Aronzon, C. M., M. T. Sandoval, J. Herkovits, and C. S. Perez-Coll. 2010. Stage-Dependent Toxicity of 2,4-Dichlorophenoxyacetic on the Embryonic Development
! 88!
of a South American Toad, Rhinella arenarum. Environmental Toxicology 26:373-381.
Bancroft, R. and K. V. Prahlad. 1973. Effect of ethylenebis[dithiocarbamic acid] disodium salt (nabam) and ethylenebis[dithiocarbamato] manganese (maneb) on Xenopus laevis development. Teratology 7 :143-150.
Bernabo, I., L. Gallo, E. Sperone, S. Tripepi, and E. Brunelli. 2011. Survival, development, and gonadal differentiation in Rana dalmatina chronically exposed to chlorpyrifos. Journal of Experimental Zoology Part a-Ecological Genetics and Physiology 315A:314-327.
Cahill, M. M. 1990. Virulence Factors in Motile Aeromonas Species. Journal of Applied Bacteriology 69:1-16.
Carey, C. 1993. Hypothesis concerning the causes of the disappearance of Boreal toads from the mountains of Colorado Conservation Biology 7 :355-362.
Carpenter, S. R., N. F. Caraco, D. L. Correll, R. W. Howarth, A. N. Sharpley, and V. H. Smith. 1998. Nonpoint pollution of surface waters with phosphorus and nitrogen. Ecological Applications 8 :559-568.
CDPR. 2011. California Pesticide Use Reporting (PUR). California Department of Pesticide Regulation.
Cosma, C. L., J. M. Davis, L. E. Swaim, H. Volman, and L. Ramakrishnan. 2006. Zebrafish and Frog Models of Mycobacterium marinum Infection. Current Protocols in Microbiology 10B.2.1-10B.2.33.
Davidson, C. 2004. Declining downwind: Amphibian population declines in california and historical pesticide use. Ecological Applications 14:1892-1902.
Davis, A. K. and J. C. Maerz. 2008. Comparison of hematological stress indicators in recently captured and captive paedomorphic Mole salamanders, Ambystoma talpoideum. Copeia:613-617.
Davis, A. K., D. L. Maney, and J. C. Maerz. 2008. The use of leukocyte profiles to measure stress in vertebrates: a review for ecologists. Functional Ecology 22:760-772.
Dupont, W., P. Bourgeois, A. Reinberg, and R. Vaillant. 1979. Circannual and circadian rhythms in the concentration of corticosterone in the plasma of the Edible frog (Rana esculenta). Journal of Endocrinology 80:117-125.
Earl, J. E. and H. H. Whiteman. 2009. Effects of pulsed nitrate exposure on amphibian development Environmental Toxicology and Chemistry 28:1331-1337.
Earl, J. E. and H. H. Whiteman. 2010. Evaluation of phosphate toxicity in Cope's gray treefrog (Hyla chrysoscelis) tadpoles. Journal of Herpetology 44:201-208.
Gilbertson, M. K., G. D. Haffner, K. G. Drouillard, A. Albert, and B. Dixon. 2003. Immunosuppression in the northern leopard frog (Rana pipiens) induced by pesticide exposure. Environmental Toxicology and Chemistry 22:101-110.
Gilliom, R. J., J. E. Barbash, C. G. Crawford, P. A. Hamilton, J. D. Martin, N. Nakagaki, L. H. Nowell, J. C. Scott, P. E. Stackelberg, G. P. Thelin, and D. M. Wolock. 2006. The Quality of Our Nation's Waters - Pesticides in the Nation's Streams and Ground Water 1992-2001. U.S. Geological Survey Circular 1291:172.
Guillette, L. J. and T. M. Edwards. 2005. Is nitrate an ecologically relevant endocrine disruptor in vertebrates? Integrative and Comparative Biology 45:19-27.
! 89!
Hayes, T. B., P. Case, S. Chui, D. Chung, C. Haeffele, K. Haston, M. Lee, V. P. Mai, Y. Marjuoa, J. Parker, and M. Tsui. 2006. Pesticide mixtures, endocrine disruption, and amphibian declines: are we underestimating the impact? Environmental Health Perspectives 114 Suppl 1:40-50.
Hayes, T. B., P. Falso, S. Gallipeau, and M. Stice. 2010. The cause of global amphibian declines: a developmental endocrinologist's perspective. Journal of Experimental Biology 213:921-933.
Holtfreter, J. 1931. Uber die Aufzucht isolierter Teile des Amphibienkeimes. II. Zucht-ung von Keimen und Keimteilen in Salzlosung. Zeitschr Wiss Biol Abt D Roux Arch Entwicklungsmech Organ 124:404-466.
Howe, C. M., M. Berrill, B. D. Pauli, C. C. Helbing, K. Werry, and N. Veldhoen. 2004. Toxicity of glyphosate-based pesticides to four North American frog species. Environmental Toxicology and Chemistry 23:1928-1938.
Hunt, J. W., B. S. Anderson, B. M. Phillips, R. S. Tjeerdema, N. Richard, V. Connor, K. Worcester, M. Angelo, A. Bern, B. Fulfrost, and D. Mulvaney. 2006. Spatial relationships between water quality and pesticide application rates in agricultural watersheds. Environmental Monitoring and Assessment 121:245-262.
IUCN. 2010. IUCN Red List of threatened species. Jayawardena, U. A., R. S. Rajakaruna, A. N. Navaratne, and P. H. Amerasinghe. 2010.
Toxicity of agrochemicals to common hourglass Tree frog (Polypedates cruciger) in acute and chronic exposure. International Journal of Agriculture and Biology 12:641-648.
Jennings, M. R. and M. P. Hayes. 1994. Amphibian and reptile species of special concern in California. Rancho Cordova, CA.
Johnson, P. T. J., J. M. Chase, K. L. Dosch, R. B. Hartson, J. A. Gross, D. J. Larson, D. R. Sutherland, and S. R. Carpenter. 2007. Aquatic eutrophication promotes pathogenic infection in amphibians. Proceedings of the National Academy of Sciences of the United States of America 104:15781-15786.
Kerby, J. L. and A. Storfer. 2009. Combined effects of atrazine and chlorpyrifos on susceptibility of the tiger salamander to Ambystoma tigrinum virus. Ecohealth 6 :91-98.
Kiesecker, J. M. 2002. Synergism between trematode infection and pesticide exposure: a link to amphibian limb deformities in nature? Proceedings of the National Academy of Sciences of the United States of America 99:9900-9904.
King, K. C., J. D. McLaughlin, A. D. Gendron, B. D. Pauli, I. Giroux, B. Rondeau, M. Boily, P. Juneau, and D. J. Marcogliese. 2007. Impacts of agriculture on the parasite communities of northern leopard frogs (Rana pipiens) in southern Quebec, Canada. Parasitology 134:2063-2080.
Kolpin, D. W., E. T. Furlong, M. T. Meyer, E. M. Thurman, S. D. Zaugg, L. B. Barber, and H. T. Buxton. 2002. Pharmaceuticals, hormones, and other organic wastewater contaminants in US streams, 1999-2000: A national reconnaissance. Environmental Science & Technology 36:1202-1211.
Krishnamurthy, S. V. and G. R. Smith. 2010. Growth, abnormalities, and mortality of tadpoles of American toad exposed to combinations of malathion and nitrate Environmental Toxicology and Chemistry 29:2777-2782.

! 90!
Kupferberg, S. J. 1997. Bullfrog (Rana catesbeiana) invasion of a California River: The role of larval competition. Ecology 78:1736-1751.
Lawler, S. P., D. Dritz, T. Strange, and M. Holyoak. 1999. Effects of introduced mosquitofish and bullfrogs on the threatened California red-legged frog. Conservation Biology 13:613-622.
Licht, P., B. R. McCreery, R. Barnes, and R. Pang. 1983. Seasonal and stress related changes in plasma gonadotropins, sex steroids, and corticosterone in the bullfrog, Rana catesbeiana. General and Comparitive Endocrinology 50:124-145.
Marco, A., C. Quilchano, and A. R. Blaustein. 1999. Sensitivity to nitrate and nitrite in pond-breeding amphibians from the Pacific northwest, USA. Environmental Toxicology and Chemistry 18:2836-2839.
Marnila, P., A. Tiiska, K. Lagerspetz, and E. M. Lilius. 1995. Phagocyte activity in the frog Rana temporaria: whole blood chemiluminescence method and the effects of temperature and thermal acclimation. Comparative Biochemistry and Physiology Part A: Physiology 111:609-614.
McMahon, T. A., N. T. Halstead, S. Johnson, T. R. Raffel, J. M. Romansic, P. W. Crumrine, R. K. Boughton, L. B. Martin, and J. R. Rohr. 2011. The fungicide chlorothalonil is nonlinearly associated with corticosterone levels, immunity, and mortality in amphibians. Environmental Health Perspectives 119:1098-1103.
Mendonca, M. T., P. Licht, M. J. Ryan, and R. Barnes. 1985. Changes in hormone levels in relation to breeding behavior in male bullfrogs (Rana catesbeiana) at the individual and population levels. General and Comparative Endocrinology 58:270-279.
Moore, M. T., J. R. Pierce, C. D. Milam, J. L. Farris, and E. L. Winchester. 1998. Responses of non-target aquatic organisms to aqueous propanil exposure. Bulletin of Environmental Contamination and Toxicology 61:169-174.
Mussi, M. A. and N. B. Calcaterra. 2010. Paraquat-induced oxidative stress response during amphibian early embryonic development. Comparative Biochemistry and Physiology C-Toxicology & Pharmacology 151:240-247.
Orton, F., J. A. Carr, and R. D. Handy. 2006. Effects of nitrate and atrazine on larval development and sexual differentiation in the northern leopard frog Rana pipiens. Environmental Toxicology and Chemistry 25:65-71.
Oruc, E. O. 2010. Oxidative stress, steroid hormone concentrations and acetylcholinesterase activity in Oreochromis niloticus exposed to chlorpyrifos. Pesticide Biochemistry and Physiology 96:160-166.
Pancak, M. K. and D. H. Taylor. 1983. Seasonal and daily plasma corticosterone rhythms in American toads, Bufo americanus. General and Comparative Endocrinology 50:490-497.
Quassinti, L., E. Maccari, O. Murri, and M. Bramucci. 2009. Effects of paraquat and glyphosate on steroidogenesis in gonads of the frog Rana esculenta in vitro. Pesticide Biochemistry and Physiology 93:91-95.
Rawlings, N. C., S. J. Cook, and D. Waldbillig. 1998. Effects of the pesticides carbofuran, chlorpyrifos, dimethoate, lindane, triallate, trifluralin, 2,4-D, and pentachlorophenol on the metabolic endocrine and reproductive endocrine

! 91!
system in ewes. Journal of Toxicology and Environmental Health-Part A 54:21-36.
Relyea, R. A. and D. K. Jones. 2009. The toxicity of Roundup Original Max (R) to 13 species of larval amphibians Environmental Toxicology and Chemistry 28:2004-2008.
Rigney, M. M., J. W. Zilinsky, and M. A. Rouf. 1978. Pathogenicity of Aeromonas-Hydrophila in Red Leg Disease in Frogs. Current Microbiology 1 :175-179.
Rohr, J. R., T. R. Raffel, S. K. Sessions, and P. J. Hudson. 2008a. Understanding the net effects of pesticides on amphibian trematode infections. Ecological Applications 18:1743-1753.
Rohr, J. R., A. M. Schotthoefer, T. R. Raffel, H. J. Carrick, N. Halstead, J. T. Hoverman, C. M. Johnson, L. B. Johnson, C. Lieske, M. D. Piwoni, P. K. Schoff, and V. R. Beasley. 2008b. Agrochemicals increase trematode infections in a declining amphibian species. Nature 455:1235-U1250.
Rouse, J. D., C. A. Bishop, and J. Struger. 1999. Nitrogen pollution: An assessment of its threat to amphibian survival. Environmental Health Perspectives 107:799-803.
Sapolsky, R. M., L. M. Romero, and A. U. Munck. 2000. How do glucocorticoids influence stress responses? Integrating permissive, suppressive, stimulatory, and preparative actions. Endocrine Reviews 21:55-89.
Sayim, F. 2010. Toxicity of trifluralin on the embryos and larvae of the red-bellied toad, Bombina bombina. Turkish Journal of Zoology 34:479-486.
Soso, A. B., L. J. G. Barcellos, M. J. Ranzani-Paiva, L. C. Kreutz, R. M. Quevedo, D. Anziliero, M. Lima, L. B. da Silva, F. Ritter, A. C. Bedin, and J. A. Finco. 2007. Chronic exposure to sub-lethal concentration of a glyphosate-based herbicide alters hormone profiles and affects reproduction of female Jundia (Rhamdia quelen). Environmental Toxicology and Pharmacology 23:308-313.
Sparling, D. W. and G. Fellers. 2007. Comparative toxicity of chlorpyrifos, diazinon, malathion and their oxon derivatives to larval Rana boylii. Environmental Pollution 147:535-539.
Stuart, S. N., J. S. Chanson, N. A. Cox, B. E. Young, A. S. L. Rodrigues, D. L. Fischman, and R. W. Waller. 2004. Status and trends of amphibian declines and extinctions worldwide. Science 306:1783-1786.
Sullivan, K. B. and K. M. Spence. 2003. Effects of sublethal concentrations of atrazine and nitrate on metamorphosis of the African clawed frog. Environmental Toxicology and Chemistry 22:627-635.
Taylor, S. K., E. S. Williams, and K. W. Mills. 1999. Effects of malathion on disease susceptibility in Woodhouse's toads. Journal of Wildlife Diseases 35:536-541.
Thurmond, W., W. Kloas, and W. Hanke. 1986. Circadian rhythm of interrenal activity in Xenopus laevis. General and Comparative Endocrinology 61:260-271.
Walsh, L. P., C. McCormick, C. Martin, and D. M. Stocco. 2000. Roundup inhibits steroidogenesis by disrupting steroidogenic acute regulatory (StAR) protein expression. Environmental Health Perspectives 108:769-776.
Wright, K. M. and B. R. Whitacker. 2001. Amphibian Medicine and Captive Husbandry. Krieger Publishing Company, Malabar, Florida.

! 92!
Table 1. Application amount and area applied of California agrichemicals tested in the current experiment (2009)
Values based on California Department of Pesticide Regulation, Pesticide Usage Reporting (CALPUR) for the year 2009.
!
!
!
!
!
!
!
!
!
!
!
!
!
!
!
!
!
!
!
!
!
!
!
!
!
!
!
Pesticide California Pesticide Usage Report
(2009) Amount applied (lbs.) Area applied (acres)
glyphosate isopropylamine salt 5,590,877 3,286,725 oxyfluorfen 952,131 1,711,754 chlorpyrifos 1,235,481 919,402 pendimethalin 1,796,366 905,398 paraquat dichloride 870,705 1,078,078 glufosinate-ammonium 461,577 727,792 maneb 692,329 492,946 propanil 1,904,607 366,500 trifluralin 530,491 489,126 2,4-D dimethylamine salt 440,736 515,216

! 93!
Table 2. Confirmation of experimental treatment glyphosate concentrations.
Water samples were analyzed by enzyme immunoassay for glyphosate concentrations.
Limit of kit assay detection was 0.05 µg/L. Moderate and Low treatment groups were
10x and 100x respective dilutions of a nominal 10.0 µg/L High treatment. Control treatment group represents an equal concentration of ethanol vehicle only. !
!
!
!
!
!
!
!
!
!
!
!
!
!
!
!
!
!
!
!
!
!
!
!
!
!
!
!
!
!
!
!
Collection time point Treatment group glyphosate (µg/L)
Control Low Moderate High
Time point 1 - day of treatment dilution < 0.05 0.08 0.79 6.6 Time point 1 - day of treatment renewal 0.08 0.14 0.79 6.3 Time point 2 - day of treatment dilution < 0.05 0.08 0.63 4.8

! 94!
Table 3. Confirmation of experimental treatment 2,4-D concentrations.
Water samples were analyzed by enzyme immunoassay for 2,4-D concentrations. Limit
of kit assay detection was 2.0 µg/L. Moderate and Low treatment groups were 10x and
100x respective dilutions of a nominal 10.0 µg/L High treatment. Control treatment group represents an equal concentration of ethanol vehicle only.
!
!
!
!
!
!
!
!
!
!
!
!
!
!
!
!
!
!
!
!
!
!
!
!
!
!
!
!
!
!
!
Collection time point Treatment group 2,4-D (µg/L)
Control Low Moderate High
Time point 1 - day of treatment dilution <2.0 <2.0 <2.0 11.6 Time point 1 - day of treatment renewal <2.0 <2.0 <2.0 8.2 Time point 2 - day of treatment dilution <2.0 <2.0 <2.0 11.6

! 95!
!
!
!
!
!
Figure 1. Bullfrogs did not display diurnal cycle in plasma corticosterone. Plasma was collected from groups of ten different American bullfrogs at four time points in a 24 hr period to determine the diurnal cycle in corticosterone concentration. No significant difference was observed (ANOVA p > 0.05). !
!
!
!
!
!
!
!
!
!
!
!
!
!
!
!
!
!
!
!
!
!
!
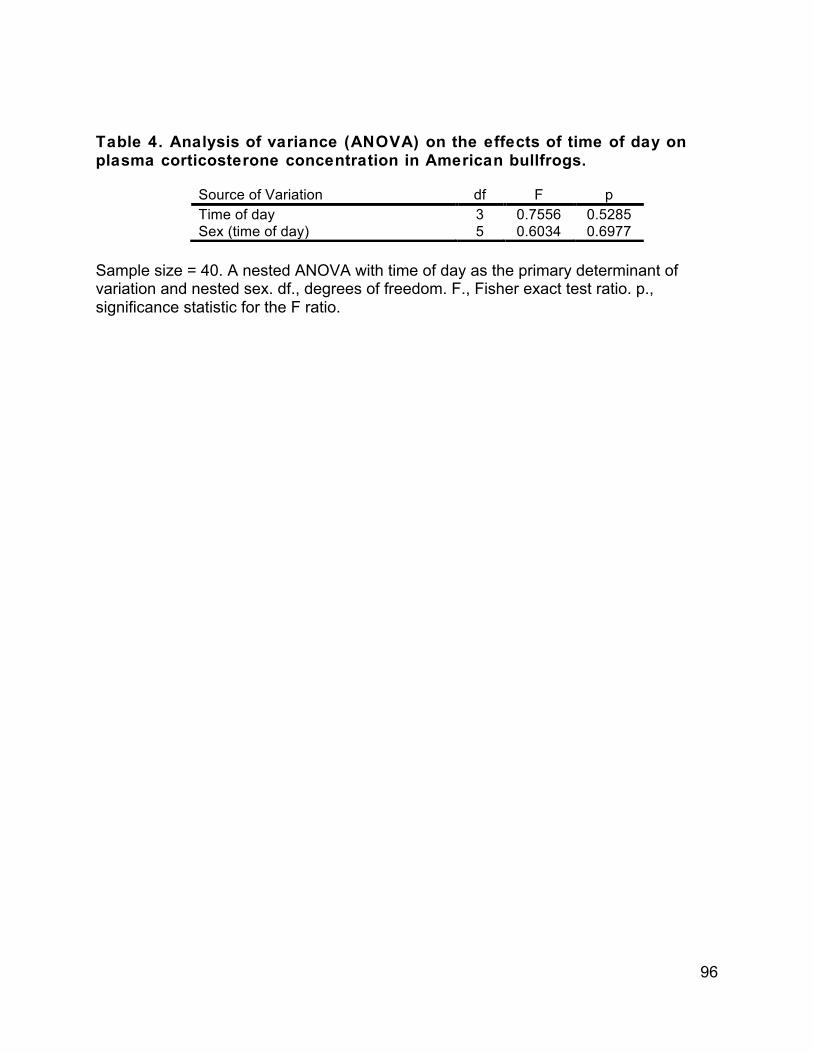
! 96!
!
Table 4. Analysis of variance (ANOVA) on the effects of time of day on plasma corticosterone concentration in American bullfrogs. Sample size = 40. A nested ANOVA with time of day as the primary determinant of variation and nested sex. df., degrees of freedom. F., Fisher exact test ratio. p., significance statistic for the F ratio.!!
!
!
!
!
!
!
!
!
!
!
!
!
!
!
!
!
!
!
!
!
!
!
!
!
!
!
!
!
!
!
!
!
!
Source of Variation df F p
Time of day 3 0.7556 0.5285
Sex (time of day) 5 0.6034 0.6977

! 97!
!
!
!
!
Figure 2. Treatment with a mixture of commonly applied pesticides and nutrients did not alter plasma corticosterone in adult bullfrogs after 12 days. Plasma was collected from adult American bullfrogs following 12 days of exposure to a pesticide and nutrient mixture by immersion. Control animals were exposed to an equal volume of ethanol vehicle only. High treatment group was exposed
to a nominal mixture of 10.0 µg/L each compound of ten pesticides, 20 mg/L of nitrate, and 1 mg/L of phosphate. Moderate and Low treatment groups represent 10x and 100x dilutions of High dose respectively. n = 9 control. n = 10 high, moderate, low. No significant difference was observed (ANOVA p > 0.05).
!
!
!
!
!
!
!
!
!
!
!
!
!
!
!
!
!
!
!
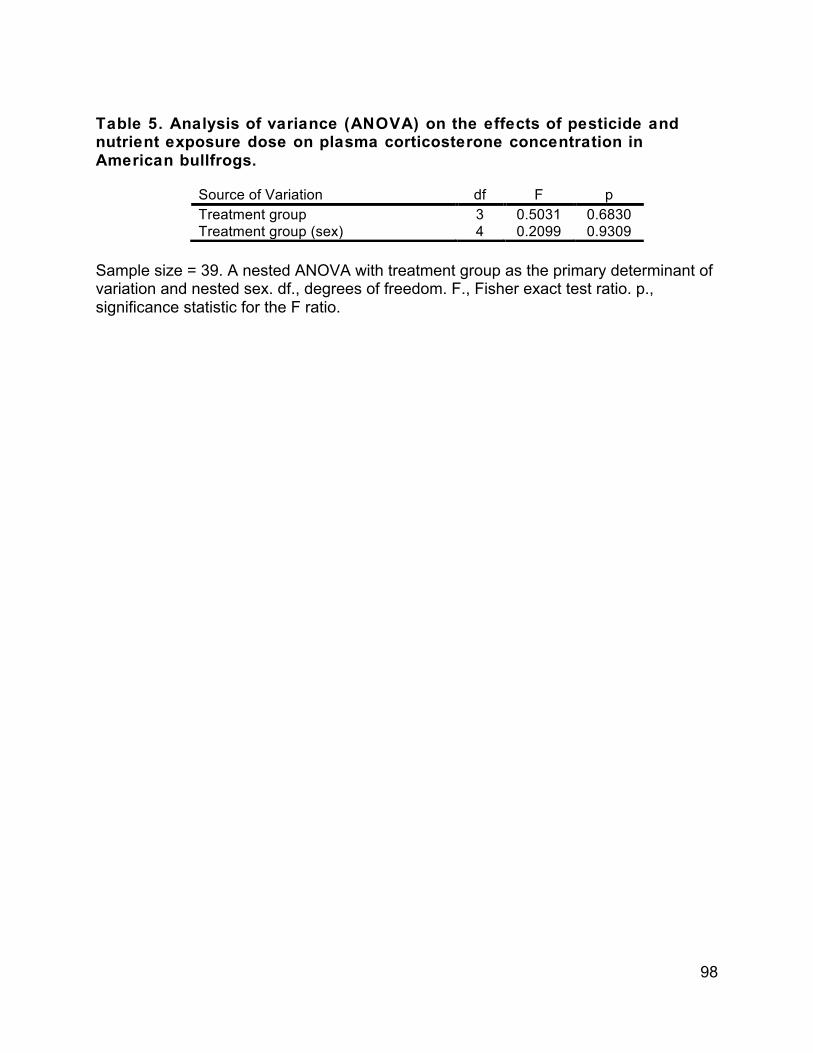
! 98!
!
Table 5. Analysis of variance (ANOVA) on the effects of pesticide and nutrient exposure dose on plasma corticosterone concentration in American bullfrogs. Sample size = 39. A nested ANOVA with treatment group as the primary determinant of variation and nested sex. df., degrees of freedom. F., Fisher exact test ratio. p., significance statistic for the F ratio.!!
!
!
!
!
!
!
!
!
!
!
!
!
!
!
!
!
!
!
!
!
!
!
!
!
!
!
!
!
!
!
!
!
!
Source of Variation df F p
Treatment group 3 0.5031 0.6830
Treatment group (sex) 4 0.2099 0.9309

! 99!
Table 6. Analysis of variance (ANOVA) on the effects of pesticide and nutrient exposure dose on total white blood cell concentration in blood of American bullfrogs. Sample size = 39. A nested ANOVA with treatment group as the primary determinant of variation and nested sex. df., degrees of freedom. F., Fisher exact test ratio. p., significance statistic for the F ratio.!!
!
!
!
!
!
!
!
!
!
!
!
!
!
!
!
!
!
!
!
!
!
!
!
!
!
!
!
!
!
!
!
!
!
Source of Variation df F p
Treatment group 3 0.4663 0.7079
Treatment group (sex) 4 0.7967 0.5365

! 100!
Table 7. Wilcoxon test on the effects of pesticide and nutrient exposure on blood lymphocyte concentration in American bullfrogs Sample size = 39. df., degrees of freedom. p., significance statistic for the Chi Square value.!
!
!
!
!
!
!
!
!
!
!
!
!
!
!
!
!
!
!
!
!
!
!
!
!
!
!
!
!
!
!
!
!
!
!
!
!
!
Source of Variation df ChiSquare p
Treatment group 3 1.5855 0.6627

! 101!
Table 8. Wilcoxon test on the effects of pesticide and nutrient exposure on blood neutrophil concentration in American bullfrogs Sample size = 39. df., degrees of freedom. p., significance statistic for the Chi Square value.!
!
!
!
!
!
!
!
!
!
!
!
!
!
!
!
!
!
!
!
!
!
!
!
!
!
!
!
!
!
!
!
!
!
!
!
!
!
Source of Variation df ChiSquare p
Treatment group 3 1.9800 0.5766

! 102!
Table 9. Wilcoxon test on the effects of pesticide and nutrient exposure on blood monocyte concentration in American bullfrogs Sample size = 39. df., degrees of freedom. p., significance statistic for the Chi Square value.!
!
!
!
!
!
!
!
!
!
!
!
!
!
!
!
!
!
!
!
!
!
!
!
!
!
!
!
!
!
!
!
!
!
!
!
!
!
Source of Variation df ChiSquare p
Treatment group 3 2.8523 0.4150

! 103!
Table 10. Analysis of variance (ANOVA) on the effects of pesticide and nutrient exposure dose on blood eosinophil concentration in American bullfrogs. Sample size = 39. A nested ANOVA with treatment group as the primary determinant of variation and nested sex. df., degrees of freedom. F., Fisher exact test ratio. p., significance statistic for the F ratio.!!
!
!
!
!
!
!
!
!
!
!
!
!
!
!
!
!
!
!
!
!
!
!
!
!
!
!
!
!
!
!
!
!
!
Source of Variation df F p
Treatment group 3 1.1145 0.3582
Treatment group (sex) 4 2.7807 0.0440

! 104!
Table 11. Analysis of variance (ANOVA) on the effects of pesticide and nutrient exposure dose on blood basophil concentration in American bullfrogs. Sample size = 39. A nested ANOVA with treatment group as the primary determinant of variation and nested sex. df., degrees of freedom. F., Fisher exact test ratio. p., significance statistic for the F ratio.!!
!
!
!
!
!
!
!
!
!
!
!
!
!
!
!
!
!
!
!
!
!
!
!
!
!
!
!
!
!
!
!
!
!
!
Source of Variation df F p
Treatment group 3 0.4208 0.7394
Treatment group (sex) 4 0.1286 0.9709

! 105!
!
!
!
!
Figure 3. Treatment with a mixture of commonly applied pesticides and nutrients did not alter innate immune cell function in adult bullfrogs after 12 days. Blood was collected from adult American bullfrogs following 12 days of exposure to a pesticide and nutrient mixture by immersion. Innate immune cell function was measured in vitro as whole blood oxidative burst activity. Control animals were exposed to an equal volume of ethanol vehicle only. High treatment group was exposed
to a nominal mixture of 10.0 µg/L each compound of ten pesticides, 20 mg/L of nitrate, and 1 mg/L of phosphate. Moderate and Low treatment groups represent 10x and 100x dilutions of High dose respectively. n = 9 control. n = 10 high, moderate, low. No significant difference was observed (ANOVA p > 0.05). !
!
!
!
!
!
!
!
!
!
!
!
!
!
!
!

! 106!
Table 12. Analysis of variance (ANOVA) on the effects of pesticide and nutrient exposure dose on blood oxidative burst activity in American bullfrogs. Sample size = 33. A nested ANOVA with treatment group as the primary determinant of variation and nested sex. df., degrees of freedom. F., Fisher exact test ratio. p., significance statistic for the F ratio.
Source of Variation df F p
Treatment group 3 0.1097 0.9536
Treatment group (sex) 4 0.8143 0.5280
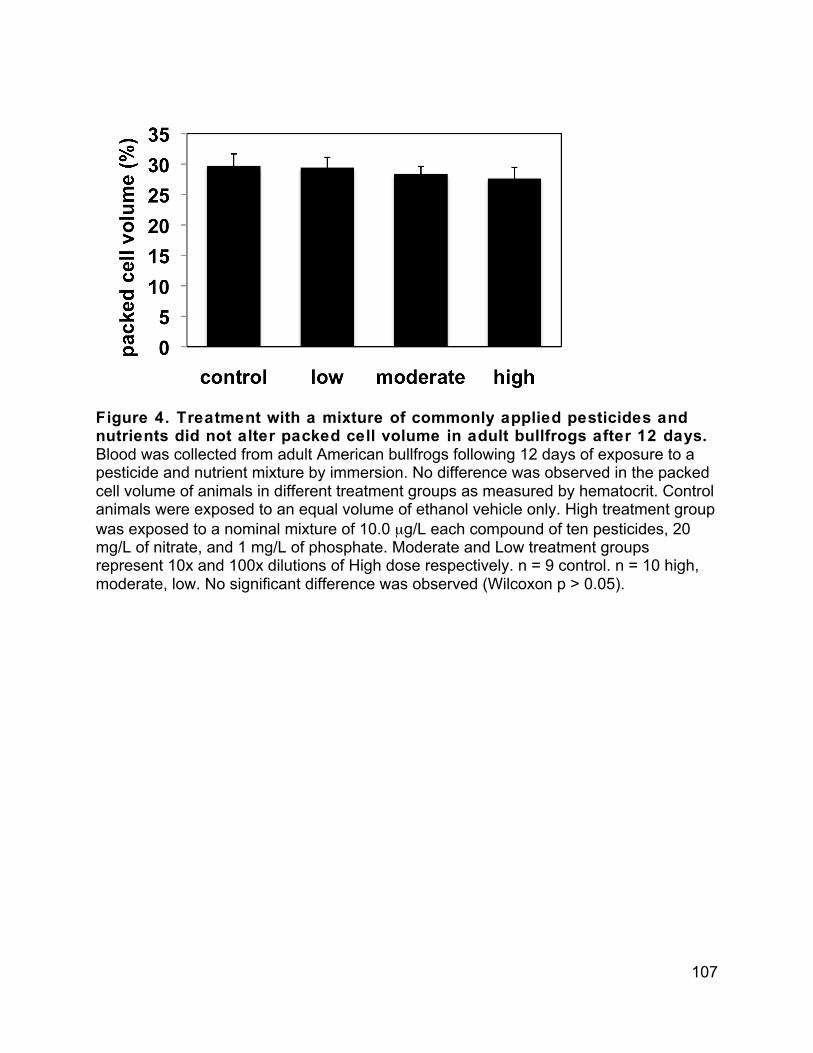
! 107!
!
!
Figure 4. Treatment with a mixture of commonly applied pesticides and nutrients did not alter packed cell volume in adult bullfrogs after 12 days. Blood was collected from adult American bullfrogs following 12 days of exposure to a pesticide and nutrient mixture by immersion. No difference was observed in the packed cell volume of animals in different treatment groups as measured by hematocrit. Control animals were exposed to an equal volume of ethanol vehicle only. High treatment group
was exposed to a nominal mixture of 10.0 µg/L each compound of ten pesticides, 20 mg/L of nitrate, and 1 mg/L of phosphate. Moderate and Low treatment groups represent 10x and 100x dilutions of High dose respectively. n = 9 control. n = 10 high, moderate, low. No significant difference was observed (Wilcoxon p > 0.05). !
!
!
!
!
!
!
!
!
!
!
!
!
!
!
!
!

! 108!
Table 13. Wilcoxon test on the effects of pesticide and nutrient exposure on blood packed cell volume in American bullfrogs Sample size = 39. df., degrees of freedom. p., significance statistic for the Chi Square value.!
!
!
!
!
!
!
!
!
!
!
!
!
!
!
!
!
!
!
!
!
!
!
!
!
!
!
!
!
!
!
!
!
!
!
!
!
!
!
Source of Variation df ChiSquare p
Treatment group 3 1.8973 0.5940

! 109!
!
!
Figure 5. Treatment with a mixture of commonly applied pesticides and nutrients did not alter liver weight in adult bullfrogs after inoculation with the bacterium, Aeromonas hydrophila. Whole liver weight was determined by dissection following inoculation. All animals received an inoculation of 1.0 mL (4.7x10⁸
cfu/mL) per 95 gram of animal. Inoculation took place after 13 days of pesticide and nutrient exposure. Control animals were exposed to an equal volume of ethanol vehicle
only. High treatment group was exposed to a nominal mixture of 10.0 µg/L each compound of ten pesticides, 20 mg/L of nitrate, and 1 mg/L of phosphate. Moderate and Low treatment groups represent 10x and 100x dilutions of High dose respectively. n = 9 control. n = 10 high, moderate, low. No significant difference was observed (ANOVA p > 0.05). !
!
!
!
!
!
!
!
!
!
!
!
!
!
!
!
!
!

! 110!
Table 14. Analysis of variance (ANOVA) on the effects of pesticide and nutrient exposure dose on liver weight in American bullfrogs following inoculation with the bacterium, Aeromonas hydrophila. Sample size = 39. A nested ANOVA with treatment group as the primary determinant of variation and nested sex. df., degrees of freedom. F., Fisher exact test ratio. p., significance statistic for the F ratio.!!
!
!
!
!
!
!
!
!
!
!
!
!
!
!
!
!
!
!
!
!
!
!
!
!
!
!
!
!
!
!
!
!
!
!
Source of Variation df F p
Treatment group 3 1.4369 0.2509
Treatment group (sex) 4 1.4463 0.2423

! 111!
!
!
Figure 6. Treatment with a mixture of commonly applied pesticides and nutrients did not alter concentration of Aeromonas hydrophila in the blood of adult bullfrogs after inoculation. Blood was collected 5 days after inoculation with A. hydrophila and examined for infection. All animals received an inoculation of 1.0 mL (4.7x10⁸ cfu/mL) per 95 gram of animal. Inoculation took place after 13 days of pesticide and nutrient exposure. Control animals were exposed to an equal volume of ethanol vehicle only. High treatment group was exposed to a nominal mixture of 10.0
µg/L each compound of ten pesticides, 20 mg/L of nitrate, and 1 mg/L of phosphate. Moderate and Low treatment groups represent 10x and 100x dilutions of High dose respectively. n = 9 control. n = 10 high, moderate, low. No significant difference was observed (Wilcoxon p > 0.05). !
!
!
!
!
!
!
!
!
!
!
!
!
!
!
!
!
!

! 112!
Table 15. Wilcoxon test on the effects of pesticide and nutrient exposure on the concentration of Aeromonas hydrophila in the blood of adult bullfrogs after inoculation. Sample size = 39. df., degrees of freedom. p., significance statistic for the Chi Square value. !
!
!
!
!
!
!
!
!
!
!
!
!
!
!
!
!
!
!
!
!
!
!
!
!
!
!
!
!
!
!
!
!
!
!
!
!
Source of Variation df ChiSquare p
Treatment group 3 5.8398 0.1197

! 113!
!
!
Figure 7. Treatment with a mixture of commonly applied pesticides and nutrients did not alter concentration of Aeromonas hydrophila in the liver of adult bullfrogs after inoculation. Liver tissue was collected 5 days after inoculation with A. hydrophila and examined for infection. All animals received an inoculation of 1.0 mL (4.7x10⁸ cfu/mL) per 95 gram of animal. Inoculation took place after 13 days of pesticide and nutrient exposure. Control animals were exposed to an equal volume of ethanol vehicle only. High treatment group was exposed to a nominal mixture of 10.0
µg/L each compound of ten pesticides, 20 mg/L of nitrate, and 1 mg/L of phosphate. Moderate and Low treatment groups represent 10x and 100x dilutions of High dose respectively. n = 9 control. n = 10 high, moderate, low. No significant difference was observed (ANOVA p > 0.05). !
!
!
!
!
!
!
!
!
!
!
!
!
!
!
!
!
!
!

! 114!
Table 14. Analysis of variance (ANOVA) on the effects of pesticide and nutrient exposure dose on the concentration of Aeromonas hydrophila in the liver of adult bullfrogs after inoculation. Sample size = 39. A nested ANOVA with treatment group as the primary determinant of variation and nested sex. df., degrees of freedom. F., Fisher exact test ratio. p., significance statistic for the F ratio.!!
!
!
!
!
!
!
!
!
!
!
!
!
!
!
!
!
!
!
!
!
!
!
!
!
!
!
!
!
!
!
!
!
!
!
Source of Variation df F p
Treatment group 3 0.2831 0.8372
Treatment group (sex) 4 0.4265 0.7883

! 115!
Chapter 4. The Effect of Chronic Stress on Blood Cell Differentials and Function in Laboratory and Wild-caught Amphibian Models Abstract
Amphibians may experience stressful habitat conditions as a result of human habitat alteration. Interrenal dysfunction and increased plasma glucocorticoids (corticosterone) have been observed in amphibians in altered habitats. However the effects of long-term stress on amphibian immunity is not well understood. We modeled a long-term endocrine stress scenario by elevating plasma corticosterone in two species of adult amphibians and subsequently examined white blood cell differentials and innate immune activity. Plasma corticosterone was elevated by immersion in adult African clawed frogs (Xenopus laevis) and by surgically implanting corticosterone capsules in adult American bullfrogs (Lithobates catesbeiana). Increased plasma corticosterone was associated with increased whole blood oxidative burst activity and blood neutrophil concentrations, while blood lymphocyte and eosinophil concentrations were decreased. These results suggest that long-term stress alters amphibian immune parameters for extended periods of time and may play a crucial role in disease. Introduction
Human dominated environmental change has severely altered wildlife habitat (Vitousek et al. 1997). Several reports suggest that amphibians in altered habitat conditions have increased plasma glucocorticoids (corticosterone) and interrenal dysfunction (Gendron et al. 1997, Hopkins et al. 1997, 1999). Increased plasma corticosterone was also observed in laboratory studies of agrichemical exposure (Hayes et al. 2006, McMahon et al. 2011). In the current study we modeled the effects of increased plasma stress hormone (corticosterone) on two common measures of amphibian immunity, blood cell differentials and whole blood oxidative burst activity in American bullfrogs (Lithobates catesbieana) and African clawed frogs (Xenopus laevis).
Corticosterone is the primary glucocorticoid hormone secreted by the interrenals in amphibians (Jungreis et al. 1970). The role of glucocorticoid hormones in immune regulation in vertebrates is well established (Sapolsky et al. 2000). Short–term studies of increased glucocorticoids in amphibians have provided valuable information on endocrine influence of immunity (Bennett et al. 1972a, Tournefier 1982, Garrido et al. 1987). However, stressful habitat conditions likely influence interrenal function for extended periods of time. To better understand the role of environmental stress in disease of wild populations, information on the effects of long-term elevations of glucocorticoids, magnitude of plasma hormones, and life stage of organisms are necessary (Martin 2009). The current study examined the role of magnitude and duration of stress on immunity in adult stages in two amphibian species. Methods Treatment chemicals Corticosterone (purity > 98.5%) was purchased from Sigma Aldrich (St. Louis, MO).

! 116!
Experiment 1 – The effect of corticosterone implants on American bullfrog (Lithobates catesbeiana) blood cell differentials and blood cell activity Lithobates catesbeiana
American bullfrogs (Lithobates catesbeiana) were collected from a regional park with no current or recent agricultural activity; Pleasanton Ridge East Bay Regional Park 37 38’43.56”N 121 55’06.01”W. At the stage collected the sex of L. catesbeiana cannot be determined without dissection. Because of known hormone fluctuations in adult male L. catesbeiana and previous difficulties in captive care we limited experimental animals to those that did not display obvious signs of male sexual maturity and secondary sex characteristics (yellow throat coloration, enlarged tympanum:eye ratio, enlarged thumb breeding glands) (Licht et al. 1983, Mendonca et al. 1985). For this reason our experiment included both immature male and female animals. Animals were group housed in the laboratory for several months prior to the start of experiments under experimental conditions and fed calcium carbonate dusted 5-week old crickets ad libitum every three days. Prior to the start of experiment, no animals displayed symptoms of poor health.
Experimental Conditions Sex could not be identified prior to experiment and animals were apportioned to treatment groups equally by body size. For the duration of all experimental exposures, animals were housed individually in clear polyethylene rat cages from Allentown Inc. (Allentown, N.J.). Tanks were elevated approximately 5 cm on one end and filled with 1 liter of 0.1x Holtfreter’s solution (6.03 mM NaCl, 0.068 mM KCl, 0.09 mM CaCl2,and 0.24 mM NaCO3) and 5 unbleached paper towels to simulate a semi-terrestrial habitat (Holtfreter 1931). White foam dividers were placed between all tanks to ensure that animals in adjacent tanks could not view each other and disrupt experimental conditions. The experiment was conducted at 22ºC and lights were operated on a 12 hr light:12 hr dark cycle, lights on at 07:00. Animals were acclimated for two water changes prior to beginning of treatment. Water was removed, tanks were cleaned, and uncontaminated water was added every third day. Animals were fed eight 5-week old crickets dusted with calcium carbonate on the day before each water renewal. Tanks were systematically rotated on the day of water renewal to avoid positional effects throughout the experiment. Implants and subsequent analysis were conducted blindly using codes for each treatment. Corticosterone implants
Plasma corticosterone was elevated in L. catesbeiana by surgically implanting
Silastic" tubing that contained corticosterone into the intraperitoneal cavity of
experimental animals. Silastic" tubing was purchased from Dow Corning Corp. (Midland, MI) and measured 1.47 mm inside diameter, 1.96 mm outside diameter. Implant size (1cm/80g frog) was normalized to individual animal body weight using the average weight of animals in a pilot study of implant methods. All surgeries were completed on the same day. Due to the small size of incision for inserting implants, no stitches or tissue adhesive were necessary following surgery. Five treatment groups were included in this experiment and will be referred to hereafter as nominal 1) “no

! 117!
implant surgery control” animals did not receive any implants or surgical manipulation, 2) “3" empty control” = animals with with 3 empty implants, 3) “1" CORT” = animals with 1 implant that contained corticosterone, 4) “2" CORT” = animals with 2 implants that contained corticosterone, and 5) “3" CORT” = animals with 3 implants that contained corticosterone. 3" empty, 1" CORT, 2" CORT, and 3" CORT treatments were replicated in five animals. “No implant surgery control” was replicated in four animals. Sampling
Blood was collected from all animals as described below at 8 days, 14 days, and 28 days after surgeries. At the time of this report, results include collections at days 14 and 28. Blood samples were collected between the hours of 07:30 – 11:00 in March and April 2009. Methods for plasma corticosterone analysis, blood cell differential, and blood cell activity are described below. Experiment 2 – The effect of immersion in corticosterone treated water on African clawed frog (Xenopus laevis) blood cell differentials and blood cell activity Xenopus laevis
Adult female African clawed frogs (Xenopus laevis) were approximately 2 years old. All animals were lab bred from a population originating from a cross between Nasco (Fort Atkinson, WI) and feral (San Diego, CA) parents. Prior to the start of experiment, no animals displayed symptoms of poor health. Experimental conditions
Animals were apportioned to treatment groups equally by body size. For the duration of all experimental exposures, animals were housed individually in opaque polyethylene mouse boxes from Allentown Inc. (Allentown, NJ). Tanks were filled with 4 liter of 0.1x Holtfreter’s solution (see composition in Experiment 1) of the respective treatments described below. The experiment was conducted at 22ºC and lights were operated on a 12 hr light:12 hr dark cycle, lights on at 07:00. Animals were acclimated for two water changes prior to beginning of treatment. Water was removed, tanks were cleaned, and treatment water was added every third day. Animals were fed 6-8 pellets of trout chow purchased from Purina Mills (Gray Summit, MO) on the day before each water renewal. Tanks were systematically rotated on the day of water renewal to avoid positional effects throughout the experiment. Dosing and subsequent analysis were conducted blindly using codes for each treatment. Corticosterone treatment by immersion
Stocks of corticosterone were dissolved in ultrapure ethanol. Dilutions of stock concentrates were made for each experimental treatment dose. An equal volume aliquot of each of these solutions was added to the final experimental medium, Holtfreter’s solution. Final concentration of ethanol vehicle in experimental solution was 0.0072%. Controls received an equal aliquot of ethanol only and ultrapure water only as described below. Five experimental treatments were included in this experiment and will be referred to by nominal labels: 1) “high” 800 ng/mL corticosterone 2) “moderate” 80

! 118!
ng/mL corticosterone 3) “low” 8 ng/mL 4) “ethanol” ethanol vehicle only 5) “vehicle control” water addition only . High, moderate, low, and ethanol treatments were replicated in nine animals. Vehicle control treatment was replicated in six animals.
Confirmation of experimental treatment concentration Treatment water was analyzed for concentration of corticosterone. One collection was taken on day that the treatment solution was mixed, following dilution from concentrated stock. Water was sampled from three tanks of each treatment. Water was collected in microcentrifuge tubes and frozen at -20ºC until time of analysis. The concentration of corticosterone was analyzed by radioimmunoassay as described below. Sampling
Blood was collected from all animals as described below on days 6, 12, and 24 of treatment. At the time of this report, results include collections at days 12 and 24. Blood samples were collected between the hours of 12:00 – 13:30 in November and December 2010. Methods for plasma corticosterone analysis, blood cell differential, and blood cell activity are described below. Procedures common to Experiments 1 and 2 Sample collections
Blood samples were collected by cardiac puncture in animals without anesthesia at the hours stated above for respective experiments. Before treatments, a blood collection was made to determine if a diurnal cycle of plasma corticosterone would confound experimental results. Blood was collected from groups of different animals by cardiac puncture at each of four time points in a 24 hr cycle: 06:00, 12:00, 18:00, 24:00 (n = 6 experiment 1, n = 10 experiment 2). During all collections, the time between catch and conclusion of blood collection was recorded for each animal, with efforts to maintain a five minute maximum handling time when possible. This time has been previously validated as prior to the increase in plasma corticosterone in handled L. catesbeiana by the authors (data not shown). Plasma was collected by aspiration following centrifuge and stored frozen at -20ºC until corticosterone analysis. Plasma corticosterone concentration
Corticosterone levels in plasma were measured by radioimmunoassay (RIA). Plasma samples were extracted in diethyl ether, dried under nitrogen gas, and reconstituted in PBS with gelatin (PBS-g). Samples were assayed using antisera from MP Biomedicals (Solon, Ohio) according to the manufacturer’s protocol. The authors validated antisera for use with both L. catesbeiana and X. laevis plasma. Samples from all treatment groups were measured in each assay. In experiment one L. catesbeiana interassay variation was 5.4 % and intraassay variation was 6.4 %. In the second experiment, X. laevis interassay variation was 16.5 % and intraassay variation was 6.3%.

! 119!
Blood cell function The in vitro innate immune activity of live cells in whole blood against a model
antigen was measured for each specimen following the protocol of Gilbertson et al.(Marnila et al. 1995, Gilbertson et al. 2003). Briefly, whole blood in frog ringer solution was combined with 1mM luminol (3-Aminophthalhydrazide, 5-Amino-2,3-dihydro-1,4-
phthalazinedione) and a yeast cell wall preparation of 500 µg (Zymosan A) in a 96 well plate. In experiment one, L. catesbeiana samples were analyzed in triplicate. Due to small blood sample volume, X. laevis samples were analyzed in duplicate in experiment two. The reaction of the blood to this simulated infection is monitored as the light produced by innate immune cells using reactive oxygen species to destroy the yeast antigen. Readings of all samples were taken every 3 minutes for 30 cycles. The blank (ringer only) subtracted peak chemiluminescence was recorded for each sample. The treatment group average peak chemiluminescence is reported.
The microbicidal activity of whole blood samples were analyzed against two bacteria, Escherichia coli and Staphylococcus aureus, and the fungus Candida albicans according to the method of Millet et al. (Millet et al. 2007). Equipment error during this assay prevented consistent results and will not be reported here. Blood cell differentials
Blood was applied to glass microscope slides using a heparin treated microhematocrit tube and spread using the edge of another glass slide. Blood smears were fixed with methanol and stained with Wright’s giemsa stain. Smears were counted according to Davis and Maerz (Davis and Maerz 2008). Briefly, the number of red blood cells in each of five fields of view at (1000x) was quantified within the feathered edge of each smear. In addition, a total of 100 white blood cells were counted in the feathered edge. Identification of cell type followed Wright and Whitaker for L. catesbeiana and Hadji-Azimi et al. for X. laevis (Hadji-Azimi et al. 1987, Wright and Whitacker 2001). The number of fields of view to reach 100 white blood cells was recorded. Two individual slides were made for each animal at all time points. At the time of this report, results include one slide for each animal in both experiments one and two. These values were used to generate the reported value of estimated white blood cells per 1,000 red blood cells. All analysis was conducted blindly. Statistics
Statistical analyses were performed using JMP 9.0 (SAS Institute Inc.). In experiment one, the bullfrog diurnal corticosterone cycle was analyzed by one-way analysis of variance (ANOVA). Bullfrog plasma corticosterone, whole blood oxidative burst activity, and all white blood cell counts were analyzed by two-way ANOVA with interaction of treatment and duration of treatment (Sokal and Rohlf 1981). Bullfrog diurnal corticosterone, treatment plasma corticosterone, blood oxidative burst activity, total white blood cell concentration, blood neutrophil concentration, and neutrophil to lymphocyte ratio were log transformed to meet the parametric assumptions of normality and homoscedasticity. Blood eosinophil concentrations were square root transformed prior to analysis. In the second experiment, X. laevis diurnal corticosterone measurements were analyzed by one-way ANOVA. X. laevis treatment plasma corticosterone, whole blood oxidative burst activity, and all blood cell counts were

! 120!
analyzed by two-way ANOVA with interaction as in experiment one. X. laevis treatment corticosterone, whole blood oxidative burst activity, total white blood cell concentration, blood neutrophil concentration, and blood neutrophil to lymphocyte ratios were log transformed prior to statistical analysis. Blood lymphocyte and basophil concentrations were square root transformed. In levels where significance was detected by ANOVA (p < 0.05) and Wilcoxon test (p < 0.05), Tukey’s honestly significant different (HSD) test was used to determine significantly different groupings. Results Experiment 1 – The effect of corticosterone implants on American bullfrog (Lithobates catesbieana) blood cell differentials and blood cell activity Lithobates catesbeiana
The average weight of animals in this study was (134.1 ± 5.7) grams and the
average snout-vent length was (11.4 ± 0.2) centimeters. Animal weight and length did not differ between treatment groups (P > 0.05, ANOVA, data not shown). One animal died after 4 weeks of treatment in the 3" empty surgery control group and is not included in calculations or conclusions. The animal appeared pale and bloated for several days before death. No other animals showed outward symptoms of poor health throughout the experiment. Seven female and 16 male frogs were used for analysis. In the no implant surgery control group there were three males and one female. In the 3" empty implant control group there were two males and two females. In the 1" CORT group there were three males and two females. In the 2" CORT group there were four males and one female. In the 3" CORT group there were four males and one female. Plasma corticosterone concentration
L. catesbeiana plasma corticosterone concentrations were not significantly different at the four time points of collection prior to treatment (F = 0.4665, df = 3, p =
0.7089). A nonsignificant trend was observed of lowest concentration at 06:00 (1.24 ±
0.3 ng/mL) and highest at 12:00 (2.36 ± 1.0 ng/mL) (Figure 1, Table1). Following surgical implantation, plasma corticosterone in treated groups was significantly great than both controls when tested for treatment (F = 93.8892, df = 4, p <0.0001) and duration of treatment (F = 6.3359, df = 1, p = 0.0162) but not for the interaction between treatment and duration (F = 0.7342, df = 4, p = 0.5744) (Figure 2, Table 2,3).
Average plasma corticosterone concentrations at 14 days were: no implant
control (2.54 ± 0.7 ng/mL), 3" empty implant control (1.54 ± 0.3 ng/mL), 1" CORT
(53.42 ± 12.7 ng/mL), 2" CORT (80.12 ± 16.7 ng/mL), and 3" CORT (176.35 ± 43.9 ng/mL). Average plasma corticosterone concentrations at 28 days were: no implant
control (1.21 ± 0.2 ng/mL), 3" empty implant control (1.52 ± 0.4 ng/mL), 1" CORT
(58.88 ± 27.0 ng/mL), 2" CORT (34.80 ± 10.4 ng/mL), and 3" CORT (120.34 ± 41.5 ng/mL). Blood cell function
Whole blood oxidative burst activity in L. catesbeiana was increased by treatment with corticosterone (F = 13.4755, df = 4, p <0.0001). Elevation was significant in the 3"

! 121!
CORT group at both time points (Figure 3, Tables 4,5). Activity change was not significant for duration of treatment (F = 0.0887, df = 1, p = 0.7676) or the interaction between treatment and duration (F = 0.6304, df = 4, p = 0.6440). Blood cell differentials
Following surgical implants, blood cell differentials were analyzed by blood smears. Alterations to cell differentials are discussed in detail below. Significant differences were observed by treatment in total white blood cell concentration (F= 5.4525, df = 4, p = 0.0016), lymphocyte concentration (F = 8.5250, df = 4, p <0.0001), neutrophil concentration (F = 14.3184, df = 4, p <0.0001), neutrophil to lymphocyte ratios (F = 23.5774, df = 4, p <0.0001), and eosinophil concentrations (F = 7.6123, df = 4, p = 0.0002) (Figures 4-8, Tables 6-15). Eosinophil concentrations were also significantly altered by interaction of treatment and duration (F= 2.8487, df = 4, p = 0.0382) but not duration of treatment alone (F = 1.4911, df = 1, p 0.2302). Basophil concentrations were not altered by corticosterone treatment (F= 1.9606, df = 4, p = 0.1222) (Table 16). Monocytes were very rare in the blood of all animals (< 0.1 monocyte / 1,000 red cells) (data not shown). Experiment 2 – The effect of immersion in corticosterone treated water on African clawed frog (Xenopus laevis) blood cell differentials and blood cell activity Xenopus laevis
The average weight of animals in this study was (118.9 ± 2.0) grams and the
average snout-vent length was (9.3 ± 0.1) centimeters. Animal weight and length did not differ between treatment groups (P > 0.05, ANOVA, data not shown). One animal in the vehicle control group died following sample collection after 12 days. No mortality due to treatment was observed in any groups. Confirmation of experimental treatment concentration Treatment water was analyzed for concentration of corticosterone by radioimmunoassay. Vehicle control tanks were below the limit of detection (<0.07) (n=3). Ethanol tanks were below the limit of detection (n=2). Low treatment group tanks
measured 5.0 ± 1.6 ng/mL (n = 3). Moderate treatment group tanks measured 62.1 ±
11.5 ng/mL (n = 2). High treatment group tanks measured 646.5 ±103.217 ng/mL (n =3). Plasma corticosterone concentration
The plasma corticosterone concentration of adult female X. laevis fluctuated in a diurnal cycle prior to treatment (F = 4.0395, df = 3, p = 0.0144). Corticosterone in the
plasma of these animals was lowest at 12:00 (3.1 ± 0.4 ng/mL) and highest at 24:00
(5.7 ± 0.6 ng/mL) (Figure 9, Table 17). Animals in the high corticosterone treatment group had significantly increased plasma corticosterone by treatment (F= 60.7994, df = 4, p < 0.0001) and the interaction between treatment and duration of treatment (F =2.8715, df = 4, p = 0.0289) but not duration of treatment alone (F = 1.8087, df = 1, p = 0.1829). Animals in the moderate and low treatment groups did not have significantly elevated plasma corticosterone (Figure 10, Tables 18-19).

! 122!
Average plasma corticosterone concentrations at 12 days were: vehicle control
(3.42 ± 1.1 ng/mL), ethanol (3.16 ± 0.6 ng/mL), low corticosterone (4.16 ± 1.5 ng/mL),
moderate corticosterone (2.84 ± 0.3 ng/mL), and high corticosterone (41.50 ± 10.6 ng/mL). Average plasma corticosterone concentrations at 24 days were: vehicle control
(2.57 ± 0.8 ng/mL), ethanol (2.0 ± 0.2 ng/mL), low corticosterone (1.57 ± 0.3 ng/mL),
moderate corticosterone (2.06 ± 0.2 ng/mL), and high corticosterone (55.53 ± 7.5 ng/mL). Blood cell function
X. laevis whole blood oxidative burst activity was significantly increased by corticosterone treatment (F = 2.9480, df = 4, p = 0.0275) and duration of treatment (F = 11.9380, df = 1, p = 0.0010). Significantly increased blood oxidative burst was observed in moderate and high corticosterone treatments at day 12 in comparison to ethanol treatment at day 24 (Figure 11, Tables 20-21). No significant interaction was observed between treatment and duration of treatment (F = 0.3184, df = 4, p = 0.8646). Blood cell differentials Blood cell differentials as measured by blood smear were altered by corticosterone treatment. Alterations to cell differentials are discussed in detail below. Significant differences were observed by treatment in total white blood cell concentration (F = 3.4498, df = 4, p = 0.0128), lymphocyte concentration (F = 7.0347, df = 4, p <0.0001), neutrophil concentration (F = 3.7169, df = 4, p = 0.0087), and neutrophil to lymhocyte ratios (F = 4.4741, df = 4, p = 0.0029) (Figures 12-15, Tables 22-29). The duration of treatment had a significant effect on lymphocyte concentrations (F = 4.1575, df = 1, p = 0.0455), neutrophil concentrations (F = 19.9718, df = 1, p < 0.0001), and neutrophil to lymphocyte ratios (F = 26.1757, df = 1, p <0.0001). Basophil concentration (F = 1.3959, df = 4, p = 0.2451) and monocye concentration (F = 1.2904, df = 4, p = 0.2828) were not affected by corticosterone treatment (Tables 30-31). Blood eosinophils were extremely rare in the blood of X. laevis (<0.1 eosinophil / 1,000 red cell) (data not shown). Discussion
Levels of the glucocorticoid hormone corticosterone fluctuate in amphibians with season, breeding activity and environmental conditions (Dupont et al. 1979, Licht et al. 1983, Pancak and Taylor 1983, Mendonca et al. 1985, Thurmond et al. 1986). Environmental regulation of endocrine response allows amphibians to thrive in dynamic aquatic ecosystems. However, plasticity may leave amphibians particularly vulnerable to endocrine disruption in altered habitats. Reports of interrenal dysfunction and increased corticosterone levels in altered habitats suggest that these amphibians are challenged by stressful conditions for extended periods of time (Gendron et al. 1997, Hopkins et al. 1997, 1999). Glucocorticoid regulation of vertebrate immune function is complex and dependant on many variables (Sapolsky et al. 2000). Our knowledge of the results of long-term stress on immunity is lacking, particularly in amphibians. Increased knowledge of the relationship of environmental stress to amphibian disease is crucial for conservation efforts. In an ecoimmunological context, the effects of stress may have different implications depending on magnitude of stress response, duration,

! 123!
and life stage affected (Martin 2009). The current report provides information on the role of magnitude and duration of stress on immunity in amphibians. Further, we describe our results from the studies of two amphibian species commonly used in scientific studies, the American bullfrog (Lithobates catesbieana) and the African clawed frog (Xenopus laevis).
It is likely that stressful conditions in altered habitat persist for extended periods of time. Previous studies of the short-term effects of glucocorticoids on amphibian immune function have provided valuable information. Several short-term studies suggest that glucocorticoid treatment results in increased blood neutrophils and decreased blood lymphocytes (Bennett et al. 1972b, Garrido et al. 1987). Blood cell differential changes are the characteristic responses of many vertebrates to stress, and likely controlled by redistribution of leukocytes between the blood and immune tissues (Dhabhar et al. 1995, Davis et al. 2008). In addition to changes in the blood, involution and decreased cellularity of the thymus were also evident (Tournefier 1982, Garrido et al. 1987). However, short-term studies may not model the prolonged effects of environmental stress due to habitat alteration.
Our experimental design successfully modeled long-term endocrine stress, characterized by increased corticosterone concentrations in the plasma. Following surgical implant of corticosterone tubules to L. catesbeiana in experiment one, plasma corticosterone was significantly elevated in all treated groups. Plasma levels of corticosterone generally decreased at day 28 in comparison to day 14. However, all treated groups remained significantly increased in comparison to controls for the duration of the experiment. The level of plasma corticosterone in L. catesbeiana was in the extremely high physiological or pharmacological range for the 1" CORT group and the pharmacological range for the 2" CORT and 3" CORT treatment groups (Licht et al. 1983, Mendonca et al. 1985, Wright et al. 2003). We have observed amphibians handled prior to blood collection to have corticosterone in the 15.0 – 20.0 ng/mL range (unpublished).
In experiment two, plasma corticosterone in X. laevis was significantly increased in the high treatment (41.5 - 55.53 ng/mL), representing a pharmacological or extremely high physiological level. Low and moderate treatment X. laevis groups did not have significantly increased plasma corticosterone. In-tank corticosterone concentrations were measured by radioimmunoassay of tank water. Concentrations of corticosterone in treatment water were in the range of 75% of nominal for 800, 80, and 8 ng/mL. One sample from moderate treatment group and one sample from ethanol control are not reported because of experimental error in analysis. An in-tank corticosterone
concentration of 646.5 ±103.217 ng/mL was required to significantly increase plasma corticosterone in the high dose experimental animals. Higher levels of treatment could not be tested because our high dose approaches the limit of corticosterone solubility in ethanol (our vehicle). We hypothesize that in-tank corticosterone concentrations in the low and moderate treatment groups were not high enough for significant dermal absorption or that animals were able to metabolize the level of steroid absorbed from the tank water. Our ethanol vehicle did not alter corticosterone levels, validating its use at this level in future corticosterone assays. We are limited in our interpretation of results due to the lack of increase in plasma corticosterone in low and moderate

! 124!
treatment groups. In future studies corticosterone treatments that produced both higher and lower plasma corticosterone concentrations would be desirable.
Prior to experiments we determined if a diurnal cycle was present in X. laevis and L. catesbeiana. Diurnal and seasonal fluctuations in hormone concentrations have been observed in previous amphibian studies (Licht et al. 1983, Thurmond et al. 1986). Knowledge of endogenous hormone levels are necessary for the interpretation of treatment effects and to determine interactions, negative feedback mechanisms, and for comparisons with other studies. In the current study we collected samples at the daily low of plasma corticosterone concentration to show the greatest magnitude of corticosterone change and also for comparison purposes. We also report the season of collection for comparison purposes. No significant difference was observed in L. catesbeiana plasma corticosterone levels throughout the 24 hr period examined. A trend was evident in L. catesbeiana of lower corticosterone in early morning hours and highest levels occurring during daylight hours. To our knowledge, no other studies have observed a strong diurnal cycle of corticosterone in L. catesbeiana in a laboratory setting. The plasma corticosterone concentrations in X. laevis showed a diurnal cycle with the peak in concentration at 24:00 and the low at 12:00. Our results are similar to a previous study by Lange and Hanke that observed the corticosterone peak at 09:00 and low at 18:00 in January and April (Lange and Hanke 1988). Interestingly our results are different from Thurmond et al. that observed a corticosterone peak at 12:00 and low at 18:00 with the lowest values occurring during the dark portion of the light cycle in November, January, and March (Thurmond et al. 1986). The described previous studies took place during a similar season to our collections, suggesting that other factors may influence diurnal corticosterone cycles in captivity.
After establishing increases of plasma corticosterone, two common measures of amphibian immunity were analyzed, blood cell differentials and innate immune cell activity. Blood cell differentials provide a view of the animal’s current immune state and blood response to conditions (Wright and Whitacker 2001, Davis et al. 2008). The role of amphibian white blood cell types are primarily inferred from mammalian studies due to lack of specific techniques (Wright and Whitacker 2001). However, in vivo amphibian experiments justify these comparisons as a useful diagnostic tool (Kiesecker 2002, Belden and Kiesecker 2005, Forson and Storfer 2006). The whole blood oxidative burst assay is an in vitro functional assay of the innate immune response at the time of collection (Marnila et al. 1995). Though an in vitro assay may lack the direct relevance of an integrated in vivo pathogen challenge, it provides the advantage of a consistent comparison across time points and species. Both of the assays used for the current report also have the advantage of nonlethal collection, which enables repeated sampling over the course of studies and translation to use in declining populations. We collected and characterized blood at three time points of approximately 1, 2, and 4 weeks.
The results of whole blood oxidative burst activity from experiments one and two suggested that corticosterone treatment increases activity. Increased activity was particularly evident at higher doses in experiment one. The effect was only significant among collection time points in experiment two. Whole blood oxidative burst is likely initiated by neutrophilic granulocytes (Marnila et al. 1995). Our assay is controlled for blood volume inputs and may be influenced by both number of neutrophils present

! 125!
(trafficking to peripheral blood) and activity of those cells present. As discussed below, neutrophils were generally greater in concentration following corticosterone treatment, suggesting that corticosterone influenced activity by peripheral blood cell concentrations. Interestingly, in the case of the moderate treatment group in experiment two, activity increased (although only significantly different from controls at day 24) in the absence of significant elevations of plasma corticosterone. Our result would suggest a great sensitivity to glucocorticoid treatment or an unidentified interaction.
In experiment one, concentrations of total white blood cells, lymphocytes, and
eosinophils were generally increased in L. catesbeiana after implant of empty Silastic" tubules. The increase may have represented an immune surveillance response by the animal to the implant itself. We hypothesize that the implant is representative of a macroparasite such as a helminth worm. Interestingly, corticosterone treatment generally attenuated this response, particularly in higher treatment groups. Corticosterone may interfere with recognition or response to large wormlike intrusions in the animal. Our hypothesis would have detrimental implications for disease in populations of animals in macroparasite rich environemnts (King et al. 2007, King et al. 2010). Blood neutrophil concentrations and corresponding neutrophil to lymphocyte ratios were increased in corticosterone treatment groups and did not appear to be influenced by implants. Basophils were not significantly altered by tubules or corticosterone treatment. Few monocytes (< 0.1 monocyte / 1,000 red cells) were counted in any treatment and were not considered a representative sample to compare corticosterone effects for this study. Monocytes in peripheral blood are relatively rare in amphibians and this result suggests that corticosterone does not affect these cells in L. catesbeiana (Wright and Whitacker 2001).
In experiment two, X. laevis total white blood cell concentration, blood lymphocyte concentration, and aspects of blood neutrophil concentrations were altered by corticosterone treatment. As in the case of oxidative burst, unexpected observations occurred between corticosterone treatments. As stated above, low and moderate corticosterone treatments did not significantly increase plasma corticosterone levels. However, significant differences in total white blood cell concentration were observed between moderate and high doses (but not controls) at day 12. The different response is likely due to different cell types in response to different magnitudes of treatment. A similar trend was observed at day 12 among lymphocyte concentrations, possibly explaining the influence on total white blood cell concentrations. Differences also existed between concentrations of lymphocytes at different time points. Neutrophil concentrations and corresponding neutrophil to lymphocyte ratios were only significantly altered between high treatment groups at day 12 and control groups and low treatment at day 24. Basophils are the predominant granulocyte in the blood of X laevis, while neutrophils are much more common than basophils in L. catesbeiana (Hadji-Azimi et al. 1987). In experiment 2, corticosterone treatment did not alter basophil concentrations at either time point. Given the difference in species cell differentials, our result suggests that the more common cell type in X. leavis (basophils) are less responsive to plasma corticosterone when compared to the neutrophil response to corticosterone in salamanders and L. catesbeiana (Bennett et al. 1972a). Eosinophils were extremely rare (<0.1 eosinophil / 1,000 red cell) in the blood of animals across all treatments. Monocytes were not altered by treatment at either time point of analysis.

! 126!
We provide a comparative model of the effects of long-term increased plasma corticosterone on changes in blood cell differentials and activity in two species of amphibian. Experiments in sensitive populations are often limited by sample size or nonlethal methods. Therefore, it is important to establish model systems in which results can be used to direct more specific experiments in sensitive populations. African clawed frogs (Xenopus laevis) are readily available from commercial supply houses and are relatively easy to maintain in captivity (Wright and Whitacker 2001). X. laevis are frequently used as model organisms in many experiments on amphibians. However, differences in physiology exist between X. laevis and other anurans (Duellman and Trueb 1986). It is crucial to understand these differences in order to best model experiments intended to provide information for free ranging amphibians. We provided a comparison to X. Laevis using the American bullfrog (Lithobates catesbeiana). L. catesbieana are easily collected from many localities in the United States and share similar life history to many North American anurans from temperature regions. Therefore studies of the influence of environmental conditions or laboratory treatments on L. catesbeiana may provide valuable information for conservation of declining species. The lack of increased plasma corticosterone in low and moderate X. laevis treatments limits our ability to address species sensitivity. Generally, the observed immune response was consistent between 1" CORT in our L. catesbeiana experiment and high corticosterone in our X. laevis experiment. In the stated treatment groups, plasma corticosterone concentrations were comparable, suggesting high physiological plasma corticosterone concentrations influence similar hematological parameters between two species.
Overall the results of the current study suggest that with increasing plasma corticosterone, changes in peripheral blood cell concentrations and activity generally increase. Duration of exposure does not necessarily increase effects. However, following 28 days of exposure in L. catesbeiana, many endpoints such as the attenuation of lymphocyte response to surgical implants, increase in blood neutrophils, and neutrophil to lymphocyte ratios remained significantly different. In the case of an artificial stressor (as modeled here) the ability for animals to compensate immune hematological parameters is limited when plasma corticosterone remains elevated. Interestingly, physiological levels of plasma corticosterone did not always produce significantly elevated neutrophil to lymphocyte ratios as suggested by previous experiments (Davis and Maerz 2008). The lack of cellular response may suggest that attenuation of the immune cell trafficking response occurs in long-term stress scenarios such as this experiment. We encourage future studies representing long-term exposure or stress scenarios modeling environmental conditions. Future studies addressing physiological concentrations of plasma corticosterone and life stage sensitivity will continue to contribute to our knowledge of environmental stress on immunity of wildlife. Resources Belden, L. K. and J. M. Kiesecker. 2005. Glucocorticosteroid hormone treatment of
larval treefrogs increases infection by Alaria sp. trematode cercariae. The Journal of Parasitology 91:686-688.

! 127!
Bennett, M. F., C. A. Gaudio, A. O. Johnson, and J. H. Spisso. 1972a. Changes in the blood of newts Notophthalmus-Viridescens following the administration of hydrocortisone. Journal of Comparative Physiology 80:233-237.
Bennett, M. F., C. A. Gaudio, A. O. Johnson, and J. H. Spisso. 1972b. Effects of hydrocortisone on the distribution of leukocytes in newts Notophthalmus-viridescens. American Zoologist 12:667-668.
Davis, A. K. and J. C. Maerz. 2008. Comparison of hematological stress indicators in recently captured and captive paedomorphic Mole salamanders, Ambystoma talpoideum. Copeia:613-617.
Davis, A. K., D. L. Maney, and J. C. Maerz. 2008. The use of leukocyte profiles to measure stress in vertebrates: a review for ecologists. Functional Ecology 22:760-772.
Dhabhar, F. S., A. H. Miller, B. S. McEwen, and R. L. Spencer. 1995. Effects of stress on immune cell distribution - Dynamics and hormonal mechanisms. Journal of Immunology 154:5511-5527.
Duellman, W. E. and L. Trueb. 1986. Biology of Amphibians. The Johns Hopkins University Press, Baltimore, Maryland.
Dupont, W., P. Bourgeois, A. Reinberg, and R. Vaillant. 1979. Circannual and circadian rhythms in the concentration of corticosterone in the plasma of the Edible frog (Rana esculenta). Journal of Endocrinology 80:117-125.
Forson, D. D. and A. Storfer. 2006. Atrazine increases ranavirus susceptibility in the tiger salamander, Ambystoma tigrinum. Ecological Applications 16:2325-2332.
Garrido, E., R. P. Gomariz, J. Leceta, and A. Zapata. 1987. Effects of dexamethasone on the lymphoid organs of Rana perezi. Developmental and Comparative Immunology 11:375-384.
Gendron, A. D., C. A. Bishop, R. Fortin, and A. Hontela. 1997. In vivo testing of the functional integrity of the corticosterone-producing axis in mudpuppy (amphibia) exposed to chlorinated hydrocarbons in the wild. Environmental Toxicology and Chemistry 16:1694-1706.
Gilbertson, M. K., G. D. Haffner, K. G. Drouillard, A. Albert, and B. Dixon. 2003. Immunosuppression in the northern leopard frog (Rana pipiens) induced by pesticide exposure. Environmental Toxicology and Chemistry 22:101-110.
Hadji-Azimi, I., V. Coosemans, and C. Canicatti. 1987. Atlas of adult Xenopus laevis laevis hematology. Developmental and Comparative Immunology 11:807-874.
Hayes, T. B., P. Case, S. Chui, D. Chung, C. Haeffele, K. Haston, M. Lee, V. P. Mai, Y. Marjuoa, J. Parker, and M. Tsui. 2006. Pesticide mixtures, endocrine disruption, and amphibian declines: are we underestimating the impact? Environmental Health Perspectives 114 Suppl 1:40-50.
Holtfreter, J. 1931. Uber die Aufzucht isolierter Teile des Amphibienkeimes. II. Zucht-ung von Keimen und Keimteilen in Salzlosung. Zeitschr Wiss Biol Abt D Roux Arch Entwicklungsmech Organ 124:404-466.
Hopkins, W. A., M. T. Mendonca, and J. D. Congdon. 1997. Increased circulating levels of testosterone and corticosterone in southern toads, Bufo terrestris, exposed to coal combustion waste. General and Comparative Endocrinology 108:237-246.
Hopkins, W. A., M. T. Mendonca, and J. D. Congdon. 1999. Responsiveness of the hypothalamo-pituitary-interrenal axis in an amphibian (Bufo terrestris) exposed to

! 128!
coal combustion wastes. Comparative Biochemistry and Physiology C-Toxicology & Pharmacology 122:191-196.
Jungreis, A. M., Huibregt.Wh, and F. Ungar. 1970. Corticosteroid identification and corticsterone concentration in serum of Rana pipiens during dehydration in winter and summer. Comparative Biochemistry and Physiology 34:683-&.
Kiesecker, J. M. 2002. Synergism between trematode infection and pesticide exposure: a link to amphibian limb deformities in nature? Proceedings of the National Academy of Sciences of the United States of America 99:9900-9904.
King, K. C., J. D. McLaughlin, M. Boily, and D. J. Marcogliese. 2010. Effects of agricultural landscape and pesticides on parasitism in native bullfrogs. Biological Conservation 143:302-310.
King, K. C., J. D. McLaughlin, A. D. Gendron, B. D. Pauli, I. Giroux, B. Rondeau, M. Boily, P. Juneau, and D. J. Marcogliese. 2007. Impacts of agriculture on the parasite communities of northern leopard frogs (Rana pipiens) in southern Quebec, Canada. Parasitology 134:2063-2080.
Lange, C. B. and W. Hanke. 1988. Corticosteroid receptors in liver cytosol of the clawed toad, Xenopus laevis - daily and seasonal variations. General and Comparative Endocrinology 71:141-152.
Licht, P., B. R. McCreery, R. Barnes, and R. Pang. 1983. Seasonal and stress related changes in plasma gonadotropins, sex steroids, and corticosterone in the bullfrog, Rana catesbeiana. General and Comparitive Endocrinology 50:124-145.
Marnila, P., A. Tiiska, K. Lagerspetz, and E. M. Lilius. 1995. Phagocyte activity in the frog Rana temporaria: whole blood chemiluminescence method and the effects of temperature and thermal acclimation. Comparative Biochemistry and Physiology Part A: Physiology 111:609-614.
Martin, L. B. 2009. Stress and immunity in wild vertebrates: Timing is everything. General and Comparative Endocrinology 163:70-76.
McMahon, T. A., N. T. Halstead, S. Johnson, T. R. Raffel, J. M. Romansic, P. W. Crumrine, R. K. Boughton, L. B. Martin, and J. R. Rohr. 2011. The fungicide chlorothalonil is nonlinearly associated with corticosterone levels, immunity, and mortality in amphibians. Environmental Health Perspectives 119:1098-1103.
Mendonca, M. T., P. Licht, M. J. Ryan, and R. Barnes. 1985. Changes in hormone levels in relation to breeding behavior in male bullfrogs (Rana catesbeiana) at the individual and population levels. General and Comparative Endocrinology 58:270-279.
Millet, S., J. Bennett, K. A. Lee, M. Hau, and K. C. Klasing. 2007. Quantifying and comparing constitutive immunity across avian species. Developmental and Comparative Immunology 31:188-201.
Pancak, M. K. and D. H. Taylor. 1983. Seasonal and daily plasma corticosterone rhythms in American toads, Bufo americanus. General and Comparative Endocrinology 50:490-497.
Sapolsky, R. M., L. M. Romero, and A. U. Munck. 2000. How do glucocorticoids influence stress responses? Integrating permissive, suppressive, stimulatory, and preparative actions. Endocrine Reviews 21:55-89.

! 129!
Sokal, R. R. and F. J. Rohlf. 1981. Biometry. Second edition. W. H. Freeman and Company, New York.
Thurmond, W., W. Kloas, and W. Hanke. 1986. Circadian rhythm of interrenal activity in Xenopus laevis. General and Comparative Endocrinology 61:260-271.
Tournefier, A. 1982. Corticosteroid action on lymphocyte subpopulations and humoral immune response of axolotl (urodele amphibian). Immunology 46:155-162.
Vitousek, P. M., H. A. Mooney, J. Lubchenco, and J. M. Melillo. 1997. Human domination of Earth's ecosystems. Science 277:494-499.
Wright, K. M. and B. R. Whitacker. 2001. Amphibian Medicine and Captive Husbandry. Krieger Publishing Company, Malabar, Florida.
Wright, M. L., C. J. Guertin, J. L. Duffy, M. C. Szatkowski, R. F. Visconti, and C. D. Alves. 2003. Developmental and diel profiles of plasma corticosteroids in the bullfrog, Rana catesbeiana. Comparative Biochemistry and Physiology Part A 135:585-595.
!
!
!
!
!
!
!
!
!
!
!
!
!
!
!
!
!
!
!
!
!
!
!
!
!
!
!
!
!
!

! 130!
!
!
Figure 1. Lithobates catesbeiana plasma corticosterone did not significantly fluctuate in a diurnal cycle. Blood was collected from different groups of six L. catesbieana at four time points in a 24 hr period to determine the diurnal cycle in corticosterone concentration. No significant difference was observed (ANOVA p> 0.05). !
!
!
!
!
!
!
!
!
!
!
!
!
!
!
!
!
!
!
!
!
!
!
!

! 131!
Table 1. Analysis of variance (ANOVA) on the effects of time of day on plasma corticosterone concentration in Lithobates catesbeiana. Sample size = 24. df., degrees of freedom. F., Fisher exact test ratio. p., significance statistic for the F ratio.!
!
!
!
!
!
!
!
!
!
!
!
!
!
!
!
!
!
!
!
!
!
!
!
!
!
!
!
!
!
!
!
!
!
!
!
!
!
!
Source of Variation df F p
Time of day 3 0.4665 0.7089

! 132!
!
Figure 2. Corticosterone containing implants increase plasma corticosterone in Lithobates catesbeiana. Blood was collected from adult L. catesbeiana following 14 and 28 days of treatment by corticosterone implants. Control animals received no implant (surgery control) or 3" empty implants (implant control).
Treated animals received 1, 2, or 3 Silastic" tubing implants that contained corticosterone. n = 5 in 3" empty, 1" CORT, 2" CORT, and 3" CORT. n = 4 in no implant control.
!
!
!
!
!
!
!
!
!
!
!
!
!
!
!
!
!
!
!
!
!

! 133!
Table 2. Two-way analysis of variance (ANOVA) with interaction on the effects of corticosterone treatment on plasma corticosterone concentration in Lithobates catesbeiana. Observations = 48. A two-way ANOVA with interaction was used to analyze treatment and duration of treatment. df., degrees of freedom. F., Fisher exact test ratio. p., significance statistic for the F ratio.!!
!
!
!
!
!
!
!
!
!
!
!
!
!
!
!
!
!
!
!
!
!
!
!
!
!
!
!
!
!
!
!
!
!
Source of Variation df F p
Treatment group 4 93.8892 <0.0001
Duration of treatment 1 6.3359 0.0162
Treatment group * duration of treatment 4 0.7342 0.5744

! 134!
Table 3. Tukey’s honestly significant difference (HSD) test on the effects of corticosterone treatment on plasma corticosterone concentration in Lithobates catesbeiana. Sample size = 48. A two-way ANOVA with interaction was used to analyze treatment and duration of treatment. Above are the results of Tukey’s honestly significant difference (HSD) test. Levels not connected by the same letter are significantly different (p < 0.05). !
!
!
!
!
!
!
!
!
!
!
!
!
!
!
!
!
!
!
!
!
!
!
!
!
!
!
!
!
!
!
Treatment duration
Treatment group Day 14 Day 28
No implant - control C C
3x empty - control C C
1x CORT AB AB 2x CORT AB B
3x CORT A AB

! 135!
!
!
Figure 3. Corticosterone containing implants increase innate immune cell cell activity activity in Lithobates catesbeiana. Blood was collected from adult L. catesbieana following 14 and 28 days of treatment by corticosterone implants. Innate immune cell function was measured in vitro as whole blood oxidative burst activity. Control animals received no implant (surgery control) or 3" empty implants (implant
control). Treated animals received 1, 2, or 3 pieces of Silastic" tubing that contained corticosterone. n = 5 in 1" CORT, 2" CORT, and 3" CORT. n = 4 in no implant control and 3" empty. !
!
!
!
!
!
!
!
!
!
!
!
!
!
!
!
!
!
!
!
!

! 136!
Table 4. Two-way analysis of variance (ANOVA) with interaction on the effects of corticosterone treatment on whole blood oxidative burst activity in Lithobates catesbeiana. Observations = 46. A two-way ANOVA with interaction was used to analyze treatment and duration of treatment. df., degrees of freedom. F., Fisher exact test ratio. p., significance statistic for the F ratio.!!
!
!
!
!
!
!
!
!
!
!
!
!
!
!
!
!
!
!
!
!
!
!
!
!
!
!
!
!
!
!
!
!
!
Source of Variation df F p
Treatment group 4 13.4755 <0.0001
Duration of treatment 1 0.0887 0.7676
Treatment group * duration of treatment 4 0.6304 0.6440

! 137!
Table 5. Tukey’s honestly significant difference (HSD) test on the effects of corticosterone treatment on whole blood oxidative burst in Lithobates
catesbeiana. Observations = 46. A two-way ANOVA with interaction was used to analyze treatment and duration of treatment. Above are the results of Tukey’s honestly significant difference (HSD) test. Levels not connected by the same letter are significantly different (p < 0.05). !
!
!
!
!
!
!
!
!
!
!
!
!
!
!
!
!
!
!
!
!
!
!
!
!
!
!
!
!
!
!
Treatment duration
Treatment group Day 14 Day 28
No implant - control C BC
3x empty - control ABC BC
1x CORT ABC ABC 2x CORT AB AB
3x CORT A A

! 138!
!
!
!
Figure 4. Surgical implants alter white blood cell concentration in Lithobates catesbeiana. Blood was collected from adult L. catesbieana following 14 and 28 days of treatment by corticosterone implants. Blood cell differentials were measured by leukocyte counts of blood smears. Control animals received no implant (surgery control) or 3" empty implants (implant control). Treated animals received 1, 2,
or 3 pieces of Silastic" tubing that contained corticosterone. n = 5 in 1" CORT, 2" CORT, and 3" CORT. n = 4 in no implant control and 3" empty. !
!
!
!
!
!
!
!
!
!
!
!
!
!
!
!
!
!
!
!

! 139!
Table 6. Two-way analysis of variance (ANOVA) with interaction on the effects of corticosterone treatment on white blood cell concentration in Lithobates catesbeiana. Observations = 45. A two-way ANOVA with interaction was used to analyze treatment and duration of treatment. df., degrees of freedom. F., Fisher exact test ratio. p., significance statistic for the F ratio.!!
!
!
!
!
!
!
!
!
!
!
!
!
!
!
!
!
!
!
!
!
!
!
!
!
!
!
!
!
!
!
!
!
Source of Variation df F p
Treatment group 4 5.4525 0.0016
Duration of treatment 1 0.5196 0.4758
Treatment group * duration of treatment 4 1.5658 0.2051

! 140!
Table 7. Tukey’s honestly significant difference (HSD) test on the effects of corticosterone treatment on white blood cell concentration in Lithobates
catesbeiana. Observations = 45. A two-way ANOVA with interaction was used to analyze treatment and duration of treatment. Above are the results of Tukey’s honestly significant difference (HSD) test. Levels not connected by the same letter are significantly different (p < 0.05). !
!
!
!
!
!
!
!
!
!
!
!
!
!
!
!
!
!
!
!
!
!
!
!
!
!
!
!
!
!
!
Treatment duration
Treatment group Day 14 Day 28
No implant - control B AB
3x empty - control A A
1x CORT AB AB 2x CORT AB AB
3x CORT A AB

! 141!
!
!
Figure 5. Surgical implants altered blood lymphocyte concentration in Lithobates catesbeiana. Blood was collected from adult L. catesbieana following 14 and 28 days of treatment by corticosterone implants. Blood cell differentials were measured by leukocyte counts of blood smears. Control animals received no implant (surgery control) or 3" empty implants (implant control). Treated animals received 1, 2,
or 3 pieces of Silastic" tubing that contained corticosterone. n = 5 in 1" CORT, 2" CORT, and 3" CORT. n = 4 in no implant control and 3" empty.
!
!
!
!
!
!
!
!
!
!
!
!
!
!
!
!
!
!
!
!
!

! 142!
Table 8. Two-way analysis of variance (ANOVA) with interaction on the effects of corticosterone treatment on blood lymphocyte concentration in Lithobates catesbeiana. Observations = 45. A two-way ANOVA with interaction was used to analyze treatment and duration of treatment. df., degrees of freedom. F., Fisher exact test ratio. p., significance statistic for the F ratio.!!
!
!
!
!
!
!
!
!
!
!
!
!
!
!
!
!
!
!
!
!
!
!
!
!
!
!
!
!
!
!
!
!
Source of Variation df F p
Treatment group 4 8.5250 <0.0001
Duration of treatment 1 1.2130 0.2782
Treatment group * duration of treatment 4 2.3309 0.0751

! 143!
Table 9. Tukey’s honestly significant difference (HSD) test on the effects of corticosterone treatment on blood lymphocyte concentration in Lithobates catesbeiana. Observations = 45. A two-way ANOVA with interaction was used to analyze treatment and duration of treatment. Above are the results of Tukey’s honestly significant difference (HSD) test. Levels not connected by the same letter are significantly different (p < 0.05). !
!
!
!
!
!
!
!
!
!
!
!
!
!
!
!
!
!
!
!
!
!
!
!
!
!
!
!
!
!
!
Treatment duration
Treatment group Day 14 Day 28
No implant - control C ABC
3x empty - control A AB
1x CORT ABC BC 2x CORT BC C
3x CORT ABC C

! 144!
Figure 6. Corticosterone containing implants increased blood neutrophil concentration in Lithobates catesbeiana. Blood was collected from adult L. catesbieana following 14 and 28 days of treatment by corticosterone implants. Blood cell differentials were measured by leukocyte counts of blood smears. Control animals received no implant (surgery control) or 3" empty implants (implant control). Treated
animals received 1, 2, or 3 pieces of Silastic" tubing that contained corticosterone. n = 5 in 1" CORT, 2" CORT, and 3" CORT. n = 4 in no implant control and 3" empty.!
!
!
!
!
!
!
!
!
!
!
!
!
!
!
!
!
!
!

! 145!
Table 10. Two-way analysis of variance (ANOVA) with interaction on the effects of corticosterone treatment on blood neutrophil concentration in Lithobates catesbeiana. Observations = 45. A two-way ANOVA with interaction was used to analyze treatment and duration of treatment. df., degrees of freedom. F., Fisher exact test ratio. p., significance statistic for the F ratio.!!
!
!
!
!
!
!
!
!
!
!
!
!
!
!
!
!
!
!
!
!
!
!
!
!
!
!
!
!
!
!
!
!
!
Source of Variation df F p
Treatment group 4 14.3184 <0.0001
Duration of treatment 1 0.5091 0.4803
Treatment group * duration of treatment 4 0.5586 0.6942

! 146!
Table 11. Tukey’s honestly significant difference (HSD) test on the effects of corticosterone treatment on blood neutrophil concentration in Lithobates
catesbeiana. Observations = 45. A two-way ANOVA with interaction was used to analyze treatment and duration of treatment. Above are the results of Tukey’s honestly significant difference (HSD) test. Levels not connected by the same letter are significantly different (p < 0.05). !
!
!
!
!
!
!
!
!
!
!
!
!
!
!
!
!
!
!
!
!
!
!
!
!
!
!
!
!
!
!
Treatment duration
Treatment group Day 14 Day 28
No implant - control C BC
3x empty - control ABC ABC
1x CORT AB ABC 2x CORT A ABC
3x CORT A A

! 147!
!
!
!
!
!
!
!
!
!
!
!
!
!
!
!
!
Figure 7. Corticosterone containing implants increased blood neutrophil to lymphocyte ratios in Lithobates catesbeiana. Blood was collected from adult L. catesbieana following 14 and 28 days of treatment by corticosterone implants. Blood cell differentials were measured by leukocyte counts of blood smears. Control animals received no implant (surgery control) or 3" empty implants (implant control). Treated
animals received 1, 2, or 3 pieces of Silastic" tubing that contained corticosterone. n = 5 in 1" CORT, 2" CORT, and 3" CORT. n = 4 in no implant control and 3" empty.
!
!
!
!
!
!
!
!
!
!
!
!
!
!
!
!
!
!
!
!
!

! 148!
Table 12. Two-way analysis of variance (ANOVA) with interaction on the effects of corticosterone treatment on blood neutrophil to lymphocyte ratio in Lithobates catesbeiana. Observations = 45. A two-way ANOVA with interaction was used to analyze treatment and duration of treatment. df., degrees of freedom. F., Fisher exact test ratio. p., significance statistic for the F ratio.!!
!
!
!
!
!
!
!
!
!
!
!
!
!
!
!
!
!
!
!
!
!
!
!
!
!
!
!
!
!
!
!
!
!
Source of Variation df F p
Treatment group 4 23.5774 <0.0001
Duration of treatment 1 0.0800 0.7790
Treatment group * duration of treatment 4 0.8816 0.4849

! 149!
Table 13. Tukey’s honestly significant difference (HSD) test on the effects of corticosterone treatment on blood neutrophil to lymphocyte ratio in Lithobates catesbeiana. Observations = 45. A two-way ANOVA with interaction was used to analyze treatment and duration of treatment. Above are the results of Tukey’s honestly significant difference (HSD) test. Levels not connected by the same letter are significantly different (p < 0.05). !
!
!
!
!
!
!
!
!
!
!
!
!
!
!
!
!
!
!
!
!
!
!
!
!
!
!
!
!
!
!
Treatment duration
Treatment group Day 14 Day 28
No implant - control CD D
3x empty - control CD CD
1x CORT ABC BC 2x CORT AB BC
3x CORT AB A

! 150!
!
!
!
!
!
!
!
!
!
!
!
!
!
!
!
!
Figure 8. Surgical implants altered blood eosinophil concentration in Lithobates catesbeiana. Blood was collected from adult L. catesbieana following 14 and 28 days of treatment by corticosterone implants. Blood cell differentials were measured by leukocyte counts of blood smears. Control animals received no implant (surgery control) or 3" empty implants (implant control). Treated animals received 1, 2,
or 3 pieces of Silastic" tubing that contained corticosterone. n = 5 in 1" CORT, 2" CORT, and 3" CORT. n = 4 in no implant control and 3" empty.
!
!
!
!
!
!
!
!
!
!
!
!
!
!
!
!
!
!
!
!
!

! 151!
Table 14. Two-way analysis of variance (ANOVA) with interaction on the effects of corticosterone treatment on blood eosinophil concentration in Lithobates catesbeiana. Observations = 45. A two-way ANOVA with interaction was used to analyze treatment and duration of treatment. df., degrees of freedom. F., Fisher exact test ratio. p., significance statistic for the F ratio.!!
!
!
!
!
!
!
!
!
!
!
!
!
!
!
!
!
!
!
!
!
!
!
!
!
!
!
!
!
!
!
!
!
!
Source of Variation df F p
Treatment group 4 7.6123 0.0002
Duration of treatment 1 1.4911 0.2302
Treatment group * duration of treatment 4 2.8487 0.0382

! 152!
Table 15. Tukey’s honestly significant difference (HSD) test on the effects of corticosterone treatment on blood eosinophil concentration in Lithobates
catesbeiana. Observations = 45. A two-way ANOVA with interaction was used to analyze treatment and duration of treatment. Above are the results of Tukey’s honestly significant difference (HSD) test. Levels not connected by the same letter are significantly different (p < 0.05). !
!
!
!
!
!
!
!
!
!
!
!
!
!
!
!
!
!
!
!
!
!
!
!
!
!
!
!
!
!
Treatment duration
Treatment group Day 14 Day 28
No implant - control B AB
3x empty - control A AB
1x CORT B B 2x CORT B B
3x CORT B B

! 153!
Table 16. Two-way analysis of variance (ANOVA) with interaction on the effects of corticosterone treatment on blood basophil concentration in Lithobates catesbeiana. Observations = 45. A two-way ANOVA with interaction was used to analyze treatment and duration of treatment. df., degrees of freedom. F., Fisher exact test ratio. p., significance statistic for the F ratio.!!
!
!
!
!
!
!
!
!
!
!
!
!
!
!
!
!
!
!
!
!
!
!
!
!
!
!
!
!
!
!
!
!
!
!
Source of Variation df F p
Treatment group 4 1.9606 0.1222
Duration of treatment 1 1.7549 0.1938
Treatment group * duration of treatment 4 0.9847 0.4286

! 154!
!
!
Figure 9. Xenopus laevis diurnal cycle of plasma corticosterone. Blood was collected from different groups of ten Xenopus laevis at four time points in a 24 hr period to determine the diurnal cycle in corticosterone concentration. Levels not connected by the same letter are significantly different (ANOVA p < 0.05) !
!
!
!
!
!
!
!
!
!
!
!
!
!
!
!
!
!
!
!
!
!
!
!
!

! 155!
Table 1. Analysis of variance (ANOVA) on the effects of time of day on plasma corticosterone concentration in Xenopus laevis. Observations = 39. df., degrees of freedom. F., Fisher exact test ratio. p., significance statistic for the F ratio.!!
!
!
!
!
!
!
!
!
!
!
!
!
!
!
!
!
!
!
!
!
!
!
!
!
!
!
!
!
!
!
!
!
!
!
!
!
Source of Variation df F p
Time of day 3 4.0395 0.0144

! 156!
!
!
Figure 10. Corticosterone treatment by immersion increases plasma corticosterone in Xenopus laevis. Blood was collected from adult Xenopus laevis following 12 and 24 days of treatment by immersion in corticosterone dosed water. High treatment group received a nominal corticosterone concentration of 800 ng/mL. Moderate treatment group received a nominal corticosterone concentration of 80 ng/mL. Low treatment group received a nominal corticosterone concentration of 8 ng/mL. Ethanol and vehicle control groups received an equal aliquot of ethanol (vehicle for corticosterone) or water respectively. n = 9 in ethanol, low CORT, moderate CORT, and high CORT. n = 6 in vehicle control. !
!
!
!
!
!
!
!
!
!
!
!
!
!
!
!
!
!
!

! 157!
Table 18. Two-way analysis of variance (ANOVA) with interaction on the effects of corticosterone treatment on plasma corticosterone concentration in Xenopus laevis. Observations = 82. A two-way ANOVA with interaction was used to analyze treatment and duration of treatment. df., degrees of freedom. F., Fisher exact test ratio. p., significance statistic for the F ratio.!!
!
!
!
!
!
!
!
!
!
!
!
!
!
!
!
!
!
!
!
!
!
!
!
!
!
!
!
!
!
!
!
!
!
Source of Variation df F p
Treatment group 4 60.7994 <0.0001
Duration of treatment 1 1.8087 0.1829
Treatment group * duration of treatment 4 2.8715 0.0289

! 158!
Table 19. Tukey’s honestly significant difference (HSD) test on the effects of corticosterone treatment on plasma corticosterone concentration in Xenopus laevis. Observations = 82. A two-way ANOVA with interaction was used to analyze treatment and duration of treatment. Above are the results of Tukey’s honestly significant difference (HSD) test. Levels not connected by the same letter are significantly different (p < 0.05). !
!
!
!
!
!
!
!
!
!
!
!
!
!
!
!
!
!
!
!
!
!
!
!
!
!
!
!
!
!
!
Treatment duration
Treatment group Day 12 Day 24
Vehicle control B B
Ethanol B B
Low CORT B B Moderate CORT B B
High CORT A A

! 159!
!
!
Figure 11. Corticosterone treatment by immersion increases innate immune cell activity in Xenopus laevis. Blood was collected from adult Xenopus laevis following 12 and 24 days of treatment by immersion in corticosterone dosed water. Innate immune cell activity was measured as whole blood oxidative burst activity. High treatment group received a nominal corticosterone concentration of 800 ng/mL. Moderate treatment group received a nominal corticosterone concentration of 80 ng/mL. Low treatment group received a nominal corticosterone concentration of 8 ng/mL. Ethanol and vehicle control groups received an equal aliquot of ethanol (vehicle for corticosterone) or water respectively. n = 9 in ethanol, low CORT, moderate CORT, and high CORT. n = 6 in vehicle control.
!
!
!
!
!
!
!
!
!
!
!
!
!
!
!
!
!
!

! 160!
Table 20. Two-way analysis of variance (ANOVA) with interaction on the effects of corticosterone treatment on whole blood oxidative burst activity in Xenopus laevis. Observations = 68. A two-way ANOVA with interaction was used to analyze treatment and duration of treatment. df., degrees of freedom. F., Fisher exact test ratio. p., significance statistic for the F ratio.!!
!
!
!
!
!
!
!
!
!
!
!
!
!
!
!
!
!
!
!
!
!
!
!
!
!
!
!
!
!
!
!
!
!
Source of Variation df F p
Treatment group 4 2.9480 0.0275
Duration of treatment 1 11.9380 0.0010
Treatment group * duration of treatment 4 0.3184 0.8646

! 161!
Table 21. Tukey’s honestly significant difference (HSD) test on the effects of corticosterone treatment on whole blood oxidative burst activity in Xenopus laevis. Observations = 68. A two-way ANOVA with interaction was used to analyze treatment and duration of treatment. Above are the results of Tukey’s honestly significant difference (HSD) test. Levels not connected by the same letter are significantly different (p < 0.05). !
!
!
!
!
!
!
!
!
!
!
!
!
!
!
!
!
!
!
!
!
!
!
!
!
!
!
!
!
!
!
Treatment duration
Treatment group Day 12 Day 24
Vehicle control AB AB
Ethanol AB B
Low CORT AB AB Moderate CORT A AB
High CORT A AB

! 162!
!
!
Figure 12. Corticosterone treatment by immersion alters total white blood cell concentration in Xenopus laevis. Blood was collected from adult Xenopus laevis following 12 and 24 days of treatment by immersion in corticosterone dosed water. Blood cell differentials were measured as leukocyte counts of blood smears. High treatment group received a nominal corticosterone concentration of 800 ng/mL. Moderate treatment group received a nominal corticosterone concentration of 80 ng/mL. Low treatment group received a nominal corticosterone concentration of 8 ng/mL. Ethanol and vehicle control groups received an equal aliquot of ethanol (vehicle for corticosterone) or water respectively. n = 9 in ethanol, low CORT, moderate CORT, and high CORT. n = 6 in vehicle control.
!
!
!
!
!
!
!
!
!
!
!
!
!
!
!
!
!
!

! 163!
Table 22. Two-way analysis of variance (ANOVA) with interaction on the effects of corticosterone treatment on total white blood cell concentration in Xenopus laevis. Observations = 76. A two-way ANOVA with interaction was used to analyze treatment and duration of treatment. df., degrees of freedom. F., Fisher exact test ratio. p., significance statistic for the F ratio.!!
!
!
!
!
!
!
!
!
!
!
!
!
!
!
!
!
!
!
!
!
!
!
!
!
!
!
!
!
!
!
!
!
!
Source of Variation df F p
Treatment group 4 3.4498 0.0128
Duration of treatment 1 1.2763 0.2627
Treatment group * duration of treatment 4 0.8842 0.4784

! 164!
Table 23. Tukey’s honestly significant difference (HSD) test on the effects of corticosterone treatment on total white blood cell concentration in Xenopus laevis. Observations = 76. A two-way ANOVA with interaction was used to analyze treatment and duration of treatment. Above are the results of Tukey’s honestly significant difference (HSD) test. Levels not connected by the same letter are significantly different (p < 0.05). !
!
!
!
!
!
!
!
!
!
!
!
!
!
!
!
!
!
!
!
!
!
!
!
!
!
!
!
!
!
!
Treatment duration
Treatment group Day 12 Day 24
Vehicle control AB AB
Ethanol AB AB
Low CORT AB AB Moderate CORT A AB
High CORT B AB

! 165!
!
!
Figure 13. Corticosterone treatment by immersion decreases blood lymphocyte concentration in Xenopus laevis. Blood was collected from adult Xenopus laevis following 12 and 24 days of treatment by immersion in corticosterone dosed water. Blood cell differentials were measured as leukocyte counts of blood smears. High treatment group received a nominal corticosterone concentration of 800 ng/mL. Moderate treatment group received a nominal corticosterone concentration of 80 ng/mL. Low treatment group received a nominal corticosterone concentration of 8 ng/mL. Ethanol and vehicle control groups received an equal aliquot of ethanol (vehicle for corticosterone) or water respectively. n = 9 in ethanol, low CORT, moderate CORT, and high CORT. n = 6 in vehicle control. !
!
!
!
!
!
!
!
!
!
!
!
!
!
!
!
!
!

! 166!
Table 24. Two-way analysis of variance (ANOVA) with interaction on the effects of corticosterone treatment on blood lymphocyte concentration in Xenopus laevis. Observations = 76. A two-way ANOVA with interaction was used to analyze treatment and duration of treatment. df., degrees of freedom. F., Fisher exact test ratio. p., significance statistic for the F ratio.!!
!
!
!
!
!
!
!
!
!
!
!
!
!
!
!
!
!
!
!
!
!
!
!
!
!
!
!
!
!
!
!
!
!
Source of Variation df F p
Treatment group 4 7.0347 <0.0001
Duration of treatment 1 4.1575 0.0455
Treatment group * duration of treatment 4 1.9258 0.1165

! 167!
Table 25. Tukey’s honestly significant difference (HSD) test on the effects of corticosterone treatment on blood lymphocyte concentration in Xenopus
laevis. Observations = 76. A two-way ANOVA with interaction was used to analyze treatment and duration of treatment. Above are the results of Tukey’s honestly significant difference (HSD) test. Levels not connected by the same letter are significantly different (p < 0.05). !
!
!
!
!
!
!
!
!
!
!
!
!
!
!
!
!
!
!
!
!
!
!
!
!
!
!
!
!
!
!
Treatment duration
Treatment group Day 12 Day 24
Vehicle control AB A
Ethanol A A
Low CORT AB A Moderate CORT A AB
High CORT B AB

! 168!
!
!
Figure 14. Corticosterone treatment by immersion increases blood neutrophil concentration in Xenopus laevis. Blood was collected from adult Xenopus laevis following 12 and 24 days of treatment by immersion in corticosterone dosed water. Blood cell differentials were measured as leukocyte counts of blood smears. High treatment group received a nominal corticosterone concentration of 800 ng/mL. Moderate treatment group received a nominal corticosterone concentration of 80 ng/mL. Low treatment group received a nominal corticosterone concentration of 8 ng/mL. Ethanol and vehicle control groups received an equal aliquot of ethanol (vehicle for corticosterone) or water respectively. n = 9 in ethanol, low CORT, moderate CORT, and high CORT. n = 6 in vehicle control.
!
!
!
!
!
!
!
!
!
!
!
!
!
!
!
!
!
!

! 169!
Table 26. Two-way analysis of variance (ANOVA) with interaction on the effects of corticosterone treatment on blood neutrophil concentration in Xenopus laevis. Observations = 76. A two-way ANOVA with interaction was used to analyze treatment and duration of treatment. df., degrees of freedom. F., Fisher exact test ratio. p., significance statistic for the F ratio.!!
!
!
!
!
!
!
!
!
!
!
!
!
!
!
!
!
!
!
!
!
!
!
!
!
!
!
!
!
!
!
!
!
!
Source of Variation df F p
Treatment group 4 3.7169 0.0087
Duration of treatment 1 19.9718 <0.0001
Treatment group * duration of treatment 4 0.7841 0.5396
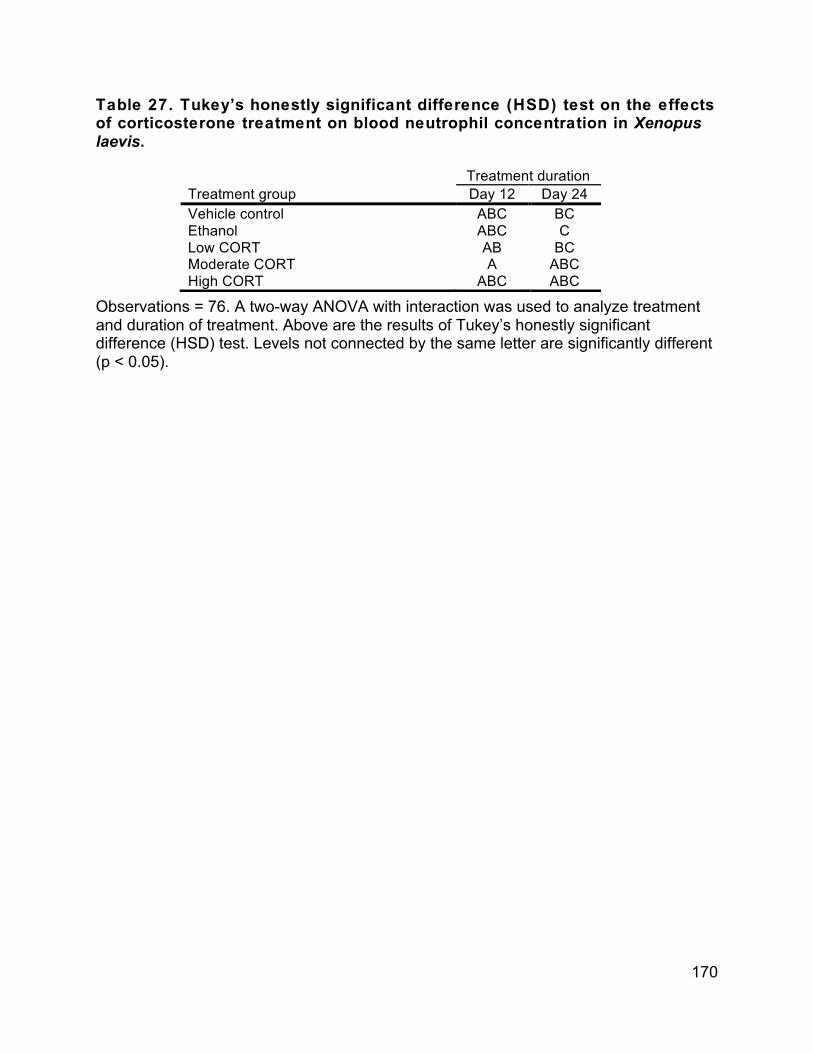
! 170!
Table 27. Tukey’s honestly significant difference (HSD) test on the effects of corticosterone treatment on blood neutrophil concentration in Xenopus
laevis. Observations = 76. A two-way ANOVA with interaction was used to analyze treatment and duration of treatment. Above are the results of Tukey’s honestly significant difference (HSD) test. Levels not connected by the same letter are significantly different (p < 0.05). !!
!
!
!
!
!
!
!
!
!
!
!
!
!
!
!
!
!
!
!
!
!
!
!
!
!
!
!
!
!
!
Treatment duration
Treatment group Day 12 Day 24
Vehicle control ABC BC
Ethanol ABC C
Low CORT AB BC Moderate CORT A ABC
High CORT ABC ABC

! 171!
!
Figure 15. Corticosterone treatment by immersion alters blood neutrophil to lymphocyte ratios in Xenopus laevis. Blood was collected from adult Xenopus laevis following 12 and 24 days of treatment by immersion in corticosterone dosed water. Blood cell differentials were measured as leukocyte counts of blood smears. High treatment group received a nominal corticosterone concentration of 800 ng/mL. Moderate treatment group received a nominal corticosterone concentration of 80 ng/mL. Low treatment group received a nominal corticosterone concentration of 8 ng/mL. Ethanol and vehicle control groups received an equal aliquot of ethanol (vehicle for corticosterone) or water respectively. n = 9 in ethanol, low CORT, moderate CORT, and high CORT. n = 6 in vehicle control. !
!
!
!
!
!
!
!
!
!
!
!
!
!
!
!
!
!

! 172!
Table 28. Two-way analysis of variance (ANOVA) with interaction on the effects of corticosterone treatment on blood neutrophil to lymphocyte ratio in Xenopus laevis. Observations = 76. A two-way ANOVA with interaction was used to analyze treatment and duration of treatment. df., degrees of freedom. F., Fisher exact test ratio. p., significance statistic for the F ratio.!!
!
!
!
!
!
!
!
!
!
!
!
!
!
!
!
!
!
!
!
!
!
!
!
!
!
!
!
!
!
!
!
!
!
Source of Variation df F p
Treatment group 4 4.4741 0.0029
Duration of treatment 1 26.1757 <0.0001
Treatment group * duration of treatment 4 0.9483 0.4418
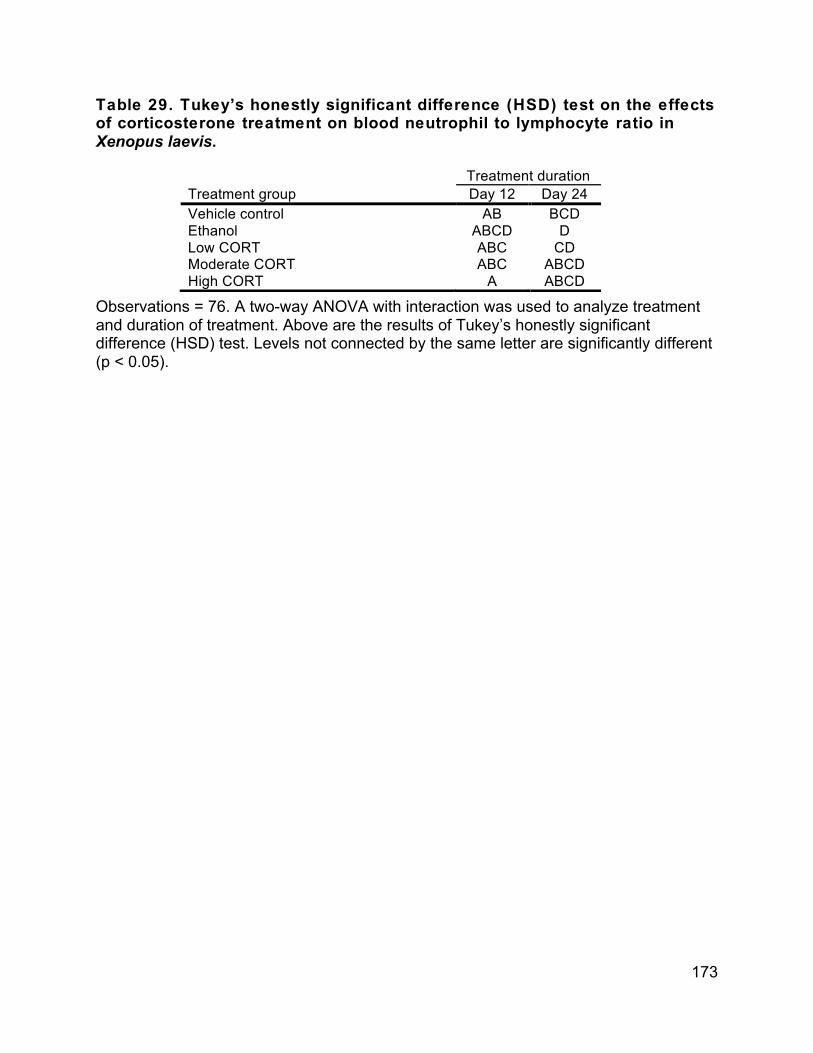
! 173!
Table 29. Tukey’s honestly significant difference (HSD) test on the effects of corticosterone treatment on blood neutrophil to lymphocyte ratio in Xenopus laevis. Observations = 76. A two-way ANOVA with interaction was used to analyze treatment and duration of treatment. Above are the results of Tukey’s honestly significant difference (HSD) test. Levels not connected by the same letter are significantly different (p < 0.05). !!
!
!
!
!
!
!
!
!
!
!
!
!
!
!
!
!
!
!
!
!
!
!
!
!
!
!
!
!
Treatment duration
Treatment group Day 12 Day 24
Vehicle control AB BCD
Ethanol ABCD D
Low CORT ABC CD Moderate CORT ABC ABCD
High CORT A ABCD
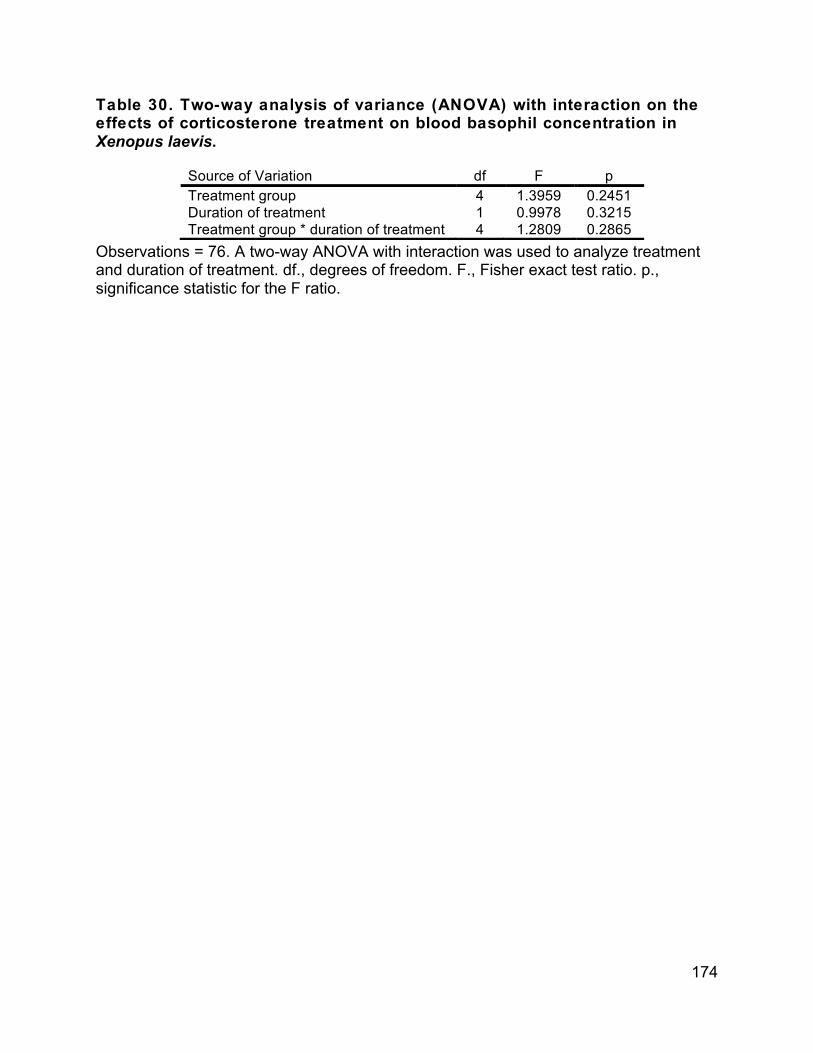
! 174!
Table 30. Two-way analysis of variance (ANOVA) with interaction on the effects of corticosterone treatment on blood basophil concentration in Xenopus laevis. Observations = 76. A two-way ANOVA with interaction was used to analyze treatment and duration of treatment. df., degrees of freedom. F., Fisher exact test ratio. p., significance statistic for the F ratio.!!
!
!
!
!
!
!
!
!
!
!
!
!
!
!
!
!
!
!
!
!
!
!
!
!
!
!
!
!
!
!
!
!
!
Source of Variation df F p
Treatment group 4 1.3959 0.2451
Duration of treatment 1 0.9978 0.3215
Treatment group * duration of treatment 4 1.2809 0.2865

! 175!
Table 31. Two-way analysis of variance (ANOVA) with interaction on the effects of corticosterone treatment on blood monocyte concentration in Xenopus laevis. Observations = 76. A two-way ANOVA with interaction was used to analyze treatment and duration of treatment. df., degrees of freedom. F., Fisher exact test ratio. p., significance statistic for the F ratio.!!
!
!
!
!
!
!
!
!
!
!
!
!
!
!
!
!
!
!
!
!
!
!
!
!
!
!
!
!
!
!
!
!
!
!
Source of Variation df F p
Treatment group 4 1.2904 0.2828
Duration of treatment 1 1.5982 0.2106
Treatment group * duration of treatment 4 2.4798 0.0523

! 176!
!
Chapter 5. Conclusion
Amphibian populations are dramatically reduced from historical numbers on a global scale (Stuart et al. 2004, IUCN 2010). Numerous causes for declines have been proposed and many are supported by experimental evidence (Hayes et al. 2010). Existing studies indicate that habitat destruction, pollution, and disease are among primary factors influencing declining amphibian populations (IUCN 2010). Few studies have been conducted on the correlation of endocrine disruption and disease in wild amphibians. The current dissertation examined the connections between land use and contamination on the endocrine and immune function of amphibians.
Adult American bullfrogs (Lithobates catesbeiana) collected downstream of intense agricultural activity in California, USA had increased plasma stress hormone (corticosterone) concentrations. Animals collected at agricultural sites also had decreased white blood cell (WBC) concentrations and activity, indicative of immune dysfunction. Our study adds to a body of literature suggesting that altered environments stress wild amphibian populations and is the first to identify this phenomenon in the agricultural landscape (Gendron et al. 1997, Hopkins et al. 1997).
To model the effects of long-term environmental stressors on immune function we increased plasma corticosterone for one month in both L. catesbeiana and African clawed frogs (Xenopus laevis) in the laboratory. Following long-term corticosterone treatment, blood cell activity was increased and WBC ratios were altered in a similar manner to previous short-term stress studies (increased blood neutrophil concentrations, decreased lymphocyte and eosinophil concentrations) (Bennett et al. 1972, Davis et al. 2008). However, in our field studies blood cell activity and all cell concentrations were decreased in animals with increased stress hormone levels at all agricultural sites. In addition, the concentration of plasma corticosterone required to significantly affect blood cell differentials and activity in the laboratory study was higher than we have previously observed in wild-caught and laboratory-raised amphibians. The disparities between observations of immunity in the field and laboratory suggest that immune alterations in field animals are not caused by endocrine stress at the time of collection alone.
Our field observations did not indentify a specific causative stressor. The California agricultural landscape is highly managed for production and coexisting wildlife populations may be subject to challenging environmental conditions. Agricultural land use may alter predator abundance, increase competition and alter resource abundance through crowding from habitat loss, and alter pathogen ecology. Abiotic landscape changes may include water temperature changes, water quality degradation, pesticide contamination, habitat simplification/loss, and water quantity alteration. Each factor in isolation can influence amphibian physiology, and in combination may be more detrimental to amphibian population health.
Based on previous studies we hypothesized that pesticide contamination, water quality changes, temperature changes, and pathogens were most likely to affect endocrine and immune function in a similar manner to our field observations (Rouse et al. 1999, Kiesecker 2002, Hayes et al. 2006, Raffel et al. 2006, Johnson et al. 2007, Rohr et al. 2008b). In our field study, the presence of a commonly applied herbicide,

! 177!
glyphosate, confirmed chemical contamination of water at all agricultural sites. Nitrate and phosphate levels were generally increased at agricultural sites, although significant differences could not be established with our sampling. In the laboratory, we exposed adult L. catesbeiana to a mixture of commonly applied pesticide and fertilizer active ingredients. Following laboratory exposure, plasma corticosterone concentration was not significantly altered and no changes in WBC differentials, WBC activity or susceptibility to infection with the bacterium Aeromonas hydrophila were observed. Water temperature was not correlated with plasma corticosterone concentrations at the time of collections in our field experiment, but we do not have evidence for the effects of temperature on developmental alterations. Further work in this study shows that L. catesbeiana collected downstream of agriculture in the Salinas River watershed have higher burdens of trematode parasites in kidney tissue (data not shown). However, a direct pathogen challenge could not be completed in field studies because of logistic factors and should be included in future experiments.
The results of both our endocrine stress and pesticide exposure studies together highlight the necessity for more studies in prioritization and identification of key stressors to wildlife health. A rigorous analysis of land use and local environmental factors is required to identify causal stressors in California agricultural habitats. Models for this analysis may follow previous studies correlating common environmental factors with locations where biological effects and declines are observed (Davidson et al. 2002, Rohr et al. 2008b). Following identification, putative causal factors would be tested in controlled laboratory and directed field experiments, as outlined below.
In addition to specific stressor identity, others have highlighted the influence of magnitude, duration, and life stage on the ultimate effects of stress (Martin 2009). Previous studies of larval exposure to contaminants and pathogens in the laboratory were associated with mortality, developmental abnormalities, and immune dysfunction (Hayes et al. 2006, Sparling and Fellers 2007, Rohr et al. 2008a, Kerby and Storfer 2009). We hypothesize that life stage may be a critical factor in sensitivity to both pesticide exposure and susceptibility to infection and should be included in future studies. Studies that apply a life stage sensitivity concept to field scenarios are lacking. As mentioned above, direct pathogen challenge experiments in our field study design would clarify the connection between environmental stress, immune dysfunction, and susceptibility to infection in wild populations of animals. In addition, field surveys of both population structure and pathogen burden in multiple life stages would enhance our understanding of the impact of altered immunity at the population level.
The current study used L. catesbeiana as a surrogate for the effects of environmental conditions on declining native sympatrics with similar life histories such as the California Red-legged frog (Rana draytonii) and Foothill Yellow-legged frog (Rana boylii). Corticosterone treatment resulted in similar responses of WBC differentials and activity in both L. catesbeiana and X. laevis. The assumption may be made that general effect trends will be similar between L. catesbeiana and other species. Future experiments using nonlethal endpoints in native amphibians would validate species comparisons and enable decreased usage of declining species for further studies.
The broader purpose of the current study was to add to the body of knowledge for amphibian conservation. Suggestions for management of declining amphibian

! 178!
populations are as follows in order of priority: 1) focus conservation efforts on protecting existing intact habitat and native amphibian populations, 2) identify environmental stressors using evidence from all biological indicators (including invasive species), 3) manage environmental stressors, particularly synthetic chemicals and excessive trace elements, to eliminate amphibian exposure, 4) remove invasive species from habitat lacking causal stressors and manage natural repopulation with native species, 5) restore altered habitat to conditions suitable for native amphibians.
In the current study, we provide further evidence of the impact of environmental change on amphibian health. Amphibians collected in agricultural areas were stressed and immune suppressed when compared to those collected in undisturbed habitats. In the laboratory, chronic stress altered immune function. Disease has greatly reduced some amphibian populations and immune suppression would have great implications for continued survival. Future studies that prioritize stressors within complex exposure scenarios are required. Identification of life stage sensitivity to specific stressors may also guide practical efforts for management. To attenuate further loss of amphibian biodiversity, conservation and management efforts must be directed at minimizing habitat loss and alteration. References Bennett, M. F., C. A. Gaudio, A. O. Johnson, and J. H. Spisso. 1972. Changes in the
blood of newts Notophthalmus-Viridescens following the administration of hydrocortisone. Journal of Comparative Physiology 80:233-237.
Davidson, C., H. B. Shaffer, and M. R. Jennings. 2002. Spatial tests of the pesticide drift, habitat destruction, UV-B, and climate-change hypotheses for California amphibian declines. Conservation Biology 16:1588-1601.
Davis, A. K., D. L. Maney, and J. C. Maerz. 2008. The use of leukocyte profiles to measure stress in vertebrates: a review for ecologists. Functional Ecology 22:760-772.
Gendron, A. D., C. A. Bishop, R. Fortin, and A. Hontela. 1997. In vivo testing of the functional integrity of the corticosterone-producing axis in mudpuppy (amphibia) exposed to chlorinated hydrocarbons in the wild. Environmental Toxicology and Chemistry 16:1694-1706.
Hayes, T. B., P. Case, S. Chui, D. Chung, C. Haeffele, K. Haston, M. Lee, V. P. Mai, Y. Marjuoa, J. Parker, and M. Tsui. 2006. Pesticide mixtures, endocrine disruption, and amphibian declines: are we underestimating the impact? Environmental Health Perspectives 114 Suppl 1:40-50.
Hayes, T. B., P. Falso, S. Gallipeau, and M. Stice. 2010. The cause of global amphibian declines: a developmental endocrinologist's perspective. Journal of Experimental Biology 213:921-933.
Hopkins, W. A., M. T. Mendonca, and J. D. Congdon. 1997. Increased circulating levels of testosterone and corticosterone in southern toads, Bufo terrestris, exposed to coal combustion waste. General and Comparative Endocrinology 108:237-246.
IUCN. 2010. IUCN Red List of threatened species. Johnson, P. T. J., J. M. Chase, K. L. Dosch, R. B. Hartson, J. A. Gross, D. J. Larson, D.
R. Sutherland, and S. R. Carpenter. 2007. Aquatic eutrophication promotes

! 179!
pathogenic infection in amphibians. Proceedings of the National Academy of Sciences of the United States of America 104:15781-15786.
Kerby, J. L. and A. Storfer. 2009. Combined effects of atrazine and chlorpyrifos on susceptibility of the tiger salamander to Ambystoma tigrinum virus. Ecohealth 6 :91-98.
Kiesecker, J. M. 2002. Synergism between trematode infection and pesticide exposure: a link to amphibian limb deformities in nature? Proceedings of the National Academy of Sciences of the United States of America 99:9900-9904.
Martin, L. B. 2009. Stress and immunity in wild vertebrates: Timing is everything. General and Comparative Endocrinology 163:70-76.
Raffel, T. R., J. R. Rohr, J. M. Kiesecker, and P. J. Hudson. 2006. Negative effects of changing temperature on amphibian immunity under field conditions. Functional Ecology 20:819-828.
Rohr, J. R., T. R. Raffel, S. K. Sessions, and P. J. Hudson. 2008a. Understanding the net effects of pesticides on amphibian trematode infections. Ecological Applications 18:1743-1753.
Rohr, J. R., A. M. Schotthoefer, T. R. Raffel, H. J. Carrick, N. Halstead, J. T. Hoverman, C. M. Johnson, L. B. Johnson, C. Lieske, M. D. Piwoni, P. K. Schoff, and V. R. Beasley. 2008b. Agrochemicals increase trematode infections in a declining amphibian species. Nature 455:1235-U1250.
Rouse, J. D., C. A. Bishop, and J. Struger. 1999. Nitrogen pollution: An assessment of its threat to amphibian survival. Environmental Health Perspectives 107:799-803.
Sparling, D. W. and G. Fellers. 2007. Comparative toxicity of chlorpyrifos, diazinon, malathion and their oxon derivatives to larval Rana boylii. Environmental Pollution 147:535-539.
Stuart, S. N., J. S. Chanson, N. A. Cox, B. E. Young, A. S. L. Rodrigues, D. L. Fischman, and R. W. Waller. 2004. Status and trends of amphibian declines and extinctions worldwide. Science 306:1783-1786.
!
!
!
!
!
!
!