the effect of oleic and palmitic acid on induction of ... · the effect of oleic and palmitic acid...
TRANSCRIPT

The effect of oleic and palmitic acid on induction of steatosis and cytotoxicity on rat
hepatocytes in primary culture
ALENA MORAVCOVÁ1 , ZUZANA ČERVINKOVÁ1, OTTO KUČERA1, VOJTĚCH
MEZERA1, DAVID RYCHTRMOC1, HALKA LOTKOVÁ 1
1Department of Physiology, Charles University in Prague, Faculty of Medicine in Hradec
Králové, Hradec Králové, Czech Republic
Corresponding author:
Halka Lotková
Charles University in Prague
Faculty of Medicine in Hradec Králové, Department of Physiology
Šimkova 870
500 38 Hradec Králové
Czech Republic
Short title: Steatosis and lipotoxicity in rat hepatocytes

Summary:
In vitro models serve as a tool for studies of steatosis. Palmitic and oleic acids can
induce steatosis in cultured hepatocytes. The aim of our study was to verify steatogenic and
cytotoxic effects of palmitic acid (PA), oleic acid (OA) and their combinations as well as their
impact on functional capacity of rat primary hepatocytes. Hepatocytes were exposed to OA or
PA (0.125 - 2 mmol/l) or their combination at ratios of 3:1, 2:1 or 1:1 at the final
concentrations of 0.5 - 1 mmol/l. Both OA and PA caused a dose-dependent increase in
triacylglycerol content in hepatocytes. PA was more steatogenic at 0.25 and 0.5 mmol/l while
OA at 0.75 and 1 mmol/l. PA exhibited a dose-dependent cytotoxic effect associated with
ROS production, present markers of apoptosis and necrosis and a decrease in albumin
production. OA induced a damage of the cytoplasmic membrane from 1 mM concentration.
Mixture of OA and PA induced lower cytotoxicity with less weakened functional capacity
than did PA alone. Extent of steatosis was comparable to that after exposure to OA alone. In
conclusion, OA or combination of OA with PA is more suitable for simulation of simple
steatosis than PA alone.
Key words: steatosis, palmitic acid, oleic acid, cytotoxicity, apoptosis
Introduction:
Non-alcoholic fatty liver disease (NAFLD) is the most common chronic liver disease
in the western countries (Tolman and Dalpiaz 2007). Histopathological picture of this disease
ranges from a simple steatosis to inflammatory and fibrotic changes in the liver resulting in
steatohepatitis (non alcoholic steatohepatitis - NASH) which is a risk factor for the
development of cirrhosis and hepatocellular carcinoma. Although the simple steatosis seems
to be a relatively benign and reversible disease it is accompanied by enhanced oxidative stress

(Gambino et al. 2011, Videla et al. 2004), higher production of proinflammatory cytokines
(Braunersreuther et al. 2012) and mitochondrial dysfunction (Berthiaume et al. 2009, Garnol
et al. 2014, Kučera et al. 2011; Vendemiale et al. 2001). This can result in a higher
susceptibility of steatotic hepatocytes to toxic damage (Kon et al. 2010, Kučera et al. 2011,
Kučera et al. 2012, Kučera et al. 2014) as compared with lean hepatocytes. Mechanisms of
increased sensitivity of steatotic hepatocytes to various noxious stimuli should be understood
so we could preserve these cells from injury.
There is rising evidence supporting the use of in vitro models as a suitable tool for
studies of hepatocellular consequences of steatosis. Primary culture of hepatocytes may
initially maintain the properties of the original tissue. The use of isolated human hepatocytes
is still limited by legislative and ethical factors. Animal models in rats are widely used as
experimental models of NAFLD. Therefore, the induction of steatosis in rat primary
hepatocytes could represent a useful model for screening studies based on the sensitivity of
steatotic hepatocytes. The most abundant fatty acids in the diet and in the steatotic liver are
saturated palmitic acid (C16: 0) and monounsaturated oleic acid (C18: 1) (Araya et al. 2004).
Literature data confirmed the induction of steatosis in mice (Malhi et al. 2006, Tang et al.
2011, Niklas et al. 2012), goose (Pan et al. 2011) and in human (Joshi-Barve et al. 2007)
hepatocytes exposed to palmitic and/or oleic acids in primary cultures as well as in
immortalized hepatocyte cell lines (Gómez-Lechón et al. 2007, Mantzaris et al. 2011, Ricchi
et al. 2009, Rogue et al. 2014, Swagell et al. 2005). The intracellular accumulation of
triacylglycerols (TAG) was proportional to the final concentration of fatty acids in the culture
medium (Ricchi et al. 2009). It is not clear whether steatogenesis is more pronounced after
exposure of the cells to palmitic or oleic acid. Variability of the fat content in the hepatocytes
can at least partly result from the fact that unequal concentrations of fatty acids were used.
Moreover, different hepatocytes in culture models were examined in the mentioned
experiments. Nevertheless, there is rising evidence that palmitic acid is more cytotoxic and
proapoptotic than oleic acid (Gómez-Lechón et al. 2011, Malhi et al. 2006, Ricchi et al.
2009).
The way how palmitic and oleic acids contribute to the development of steatosis and
cytotoxicity in primary culture of rat hepatocytes as well as an impact on their functional
capacity is not described sufficiently. Thus the aim of our study was to verify steatogenic and
cytotoxic effects of different concentrations of palmitic acid, oleic acid and their
combinations, and the influence on functional capacity of primary culture of rat hepatocytes.
Methods:
Chemicals: William's E medium without phenol red, fetal bovine serum, penicillin,
streptomycin and glutamine were supplied by BioChrom GmbH (Germany). Kit for lactate
dehydrogenase (DiaSys, Germany), collagenase (Collagenase NB 4 Standard Grade from
Clostridium histolyticum, Serva, Germany), insulin (Actrapid, Hoechst, Germany), glucagon
(Novo Nordisk, Denmark), prednisolone (Merck, Germany), Cell Proliferation Reagent WST-
1 (Roche, Germany), Rat Albumin ELISA Quantification Kit (Bethyl Lab. Inc., USA),
Triglyceride Colorimetric Assay Kit (Cayman, USA) and Steatosis Colorimetric Assay Kit
(Cayman, USA) were obtained from suppliers mentioned in the brackets. JC-1 and CM-
H2DCFDA were supplied by Molecular Probes (Oregon, USA). Ac-DEVD-AMC (Caspase 3
substrate) and Ac-DEVD-CHO (Caspase 3 specific inhibitor) were delivered from Enzo Life
Sciences Inc. (USA). Collagen type I, trypan blue, sodium palmitate, sodium oleate, bovine
serum albumin and other chemicals were purchased from Sigma-Aldrich (USA).
Animals: Male Wistar albino rats (180 - 220 g, Velaz, Czech Republic) were housed at
23 ± 1 °C with a relative humidity of 55 ± 10%, 12 to 14 air exchanges per hour and 12 h

light-dark cycle periods (6:00 h to 18:00 h). The animals fed ad libitum standard pelleted diet
(ST-1, Velas, Czech Republic; 10% of energy from fat, 30% of energy from proteins and 60%
of energy derived from carbohydrates) and had free access to tap water. All work with
animals followed the European Guidelines on Laboratory Animal Care and was approved by
the Animal-Welfare Body of the Faculty of Medicine in Hradec Králové, Charles University
in Prague, Czech Republic.
Fatty acid preparation: Palmitic and oleic acids were dissolved overnight in 10% fatty
acids-free bovine serum albumin (BSA) in William's E medium with supplements (without
serum). 8 mM stock solutions of PA and OA (molar ratio FA and BSA 5.33:1) were further
diluted with supplemented William's E medium without fetal bovine serum to final
concentrations of OA, PA or their combinations as described below.
Hepatocyte Isolation, Cultivation and Treatment. Hepatocytes were isolated by two-
step collagenase perfusion from rat liver (Berry et al. 1991) with viability higher than 90%
(confirmed by Trypan blue exclusion test). Isolated hepatocytes were suspended in William‘s
E medium with supplements - fetal bovine serum (6%), glutamine (2 mM), penicillin (190
IU/ml), streptomycin (190 µg/ml), insulin (0.08 IU/ml), prednisolone (0.05 mg/ml), glucagon
(0.008 mg/ml) and plated on collagen-coated 6-well (1 × 10⁶ cells/well), 24-well (2 × 10⁵
cells/well) and 96-well (3 × 10⁴ cells/well) plates. Hepatocytes were allowed to attach to
collagen and establish a monolayer in a humidified atmosphere containing 95% air and 5%
CO2 at 37 °C for 2h. Then the medium was replaced with a fresh supplemented medium
without fetal bovine serum with the addition of 1) oleic acid (OA) at a concentration of 0.125,
0.25, 0.5, 0.75, 1 and 2 mmol/l, 2) palmitic acid (PA) at the same concentrations and 3)
combination of OA and PA at a ratio - 3:1, 2:1 and 1:1 and total concentrations of 0.5, 0.75
and 1 mmol/l. After 24 h incubation, the medium was collected and cells were harvested for
the required assays. A fatty acids-free vehicle served as a control.

Cytotoxicity Assays: The effect of fatty acids on the viability of hepatocytes was
evaluated by the activity of cellular dehydrogenases using Cell Proliferation Reagent WST-1
(Lotková et al. 2009). Cell membrane integrity was determined by the leakage of lactate
dehydrogenase (LDH) from the cells using a commercial kit from DiaSys. LDH leakage is a
ratio of LDH activity in the culture medium to the total LDH activity.
Evaluation of steatosis: To determine the extent of steatosis, the content of
triacylglycerols (TAG) in hepatocytes was measured using the Triglyceride Colorimetric
Assay Kit according to manufacturer´s instructions. Results are normalized to protein
concentration (Bradford 1976) and expressed as a percentage of control. The Steatosis
Colorimetric Assay Kit was used to confirm the lipid droplets by Oil red O staining.
ROS production: The production of ROS was assessed using fluorescent probe 5- and
6-chloromethyl-2',7'-dichlorodihydrofluorescein diacetate (CM-H2DCFDA) (Kučera et al.
2014). Results were standardized to protein concentration (Bradford 1976) and expressed as a
percentage of control.
Caspase 3 activity: To detect apoptosis induced by fatty acids, the activity of caspase
3 was measured using a kinetic fluorimetric method based on the hydrolysis of the specific
peptide substrate Ac-DEVD-AMC (Kaiserová et al. 2006, Kučera et al. 2011). Activity of
caspase 3 was normalized to protein concentration and expressed as a percentage of control.
Visualization of mitochondrial membrane potential (MMP): MMP was depicted using
cationic carbocyanine dye JC-1. At low mitochondrial membrane potential, JC-1 exerts a
green fluorescence (λem 525nm) while at higher potentials, JC-1 forms red-fluorescent “J-
aggregates” (λem 590nm) (Kučera et al. 2014). MMP was visualized using fluorescence
microscope Olympus IX51 (Olympus, Japan) equipped with the digital camera Olympus
E600 (Olympus, Japan). Results are expressed as a percentage of cells containing
mitochondria with high membrane potential of all cells.

Production of albumin: Albumin was measured by using a commercial ELISA kit
obtained from Bethyl Lab. according to manufacturer’s instructions. Result were standardized
to protein concentration (Bradford 1976) and expressed as % of controls.
Statistical Analysis: Experiments were performed at least three times using different
isolations of hepatocytes. The results are expressed as means ± SD. After testing the
normality, statistical analysis was performed by one-way ANOVA (GraphPad Prism 6.01,
GraphPad Software, Inc., La Jolla, CA). When significance was detected, Tukey-Kramer’s
post hoc test was used for comparisons between the different groups. 𝑃 < 0.05 was considered
statistically significant.
Results:
Cell viability and functional capacity: Cell viability was evaluated by LDH leakage
and cellular dehydrogenase activity (WST-1). Functional capacity of hepatocytes was
assessed by albumin production. Figure 1A shows that PA enhanced LDH leakage from a
concentration of 0.25 mmol/l (p<0.001) while OA did not cause any damage of cell
membrane integrity until the concentration of 1 mmol/l (p<0.001). Similarly, production of
albumin was attenuated at all tested concentrations of PA while OA lowered the production of
albumin from concentration of 1 mmol/l (Figure 1C). Cellular dehydrogenase activity
declined with increasing concentrations of both fatty acids but palmitic acid caused
significantly steeper decrease than oleic acid (Fig. 1B). Exposure of hepatocytes to the
combinations of OA and PA caused increase in LDH leakage (Fig. 1A), decrease in both
WST-1 (Fig. 1B) and albumin production (Fig 1C) with rising total concentration of fatty
acids and growing proportion of PA. These effects on cell viability and albumin production
were significantly lower in comparison with PA alone (p<0.001) at concentration
corresponding to the final concentration of mixture (Fig. 1A, 1B and 1C). OA and PA in the

mixture at ratio 1:1 and final concentration of the mixture 0.5 mmol/l as well as 1 mmol/l
induced significantly lower LDH leakage than separate PA at the same concentration that is in
the mixture (p< 0.05 for 0.25 mM PA, p< 0.001 for 0.5 mM PA; Fig. 1A). Similarly,
equimolar mixture of FA at the final concentration of 0.5 mmol/l (i.e. 0.25 mM OA and 0.25
mM PA) preserved the production of albumin nearly to the control level (Fig 1C).
Lipid accumulation: Figure 2A documents steatosis and morphology of hepatocytes
after the exposure to raising concentrations of OA or PA. Lipid accumulation was confirmed
by oil red staining (not shown). TAG content was evaluated after exposure to fatty acids at the
concentrations up to 1 mmol/l that were previously identified as cytotoxic for both OA and
PA. Figure 2B indicates that TAG content in the hepatocytes raised dose-dependently, this
increase was significant from 0.25 mM PA (p<0.01) and 0.5 mM OA (p<0.001). At 0.5 mM
concentration, palmitic acid caused higher TAG accumulation in the liver cells than oleic acid
(p <0.05). In contrary, oleic acid was more steatogenic than PA at 0.75 and 1 mM
concentrations (p<0.001). As various combinations of OA and PA were tested, TAG
accumulation did not differ with decreasing proportion of OA. Combinations of OA and PA at
ratios 1:1, 2:1 and 3:1 at the final concentration of 0.5 mmol/l exhibited similar TAG content
as OA alone or PA alone at concentration of 0.5 mmol/l. These combinations at final
concentrations of 0.75 and 1 mmol/l induced TAG accumulation comparable only to separate
OA while TAG formation after exposure to PA at appropriate concentrations was lower
(p<0.001 for all comparisons). Increasing of the concentration of individual or combined fatty
acids in the medium from 0.75 to 1 mmol/l did not significantly enhance the TAG content in
the cells (Fig. 2B).
Apoptosis and ROS production: Apoptosis was evaluated by activity of caspase 3.
Palmitic acid enhanced the activity of executive caspase 3 from the concentration of 0.5
mmo/l (p<0.001) while oleic acid had no effect (Fig. 3A). Similar results were obtained for

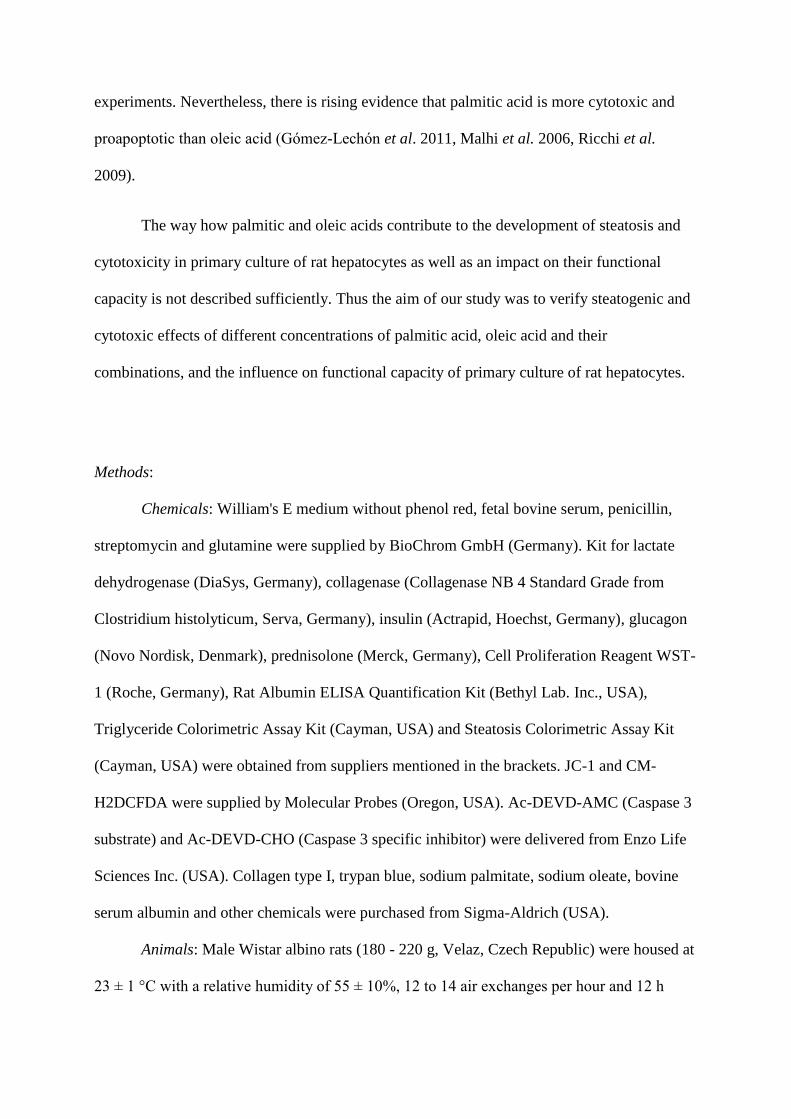
the production of ROS: the exposure to PA in concentrations of 0.5 mmol/l and higher was
accompanied by an increase in ROS production when compared to controls (p<0.001) (Fig.
3B). As various combinations of fatty acids were tested, only palmitic acid alone caused an
increase in the production of ROS and in the activity of caspase 3 (p<0.001), whereas the
combinations including oleic acid did not (Fig. 3A and 3B). Furthermore, mixture of fatty
acids 1:1 at final concentration of 1 mmol/l (i.e. 0.5 mM OA and 0.5 mM PA) prevented the
cells against formation of ROS and the activation of caspase 3 that we observed after
exposure to only 0.5 mM PA alone.
Mitochondrial membrane potential: We also evaluated the mitochondrial membrane
potential using the fluorescent dye JC-1. Oleic acid did not change the mitochondrial
membrane potential while the exposure of cells to palmitic acid in the concentration of 0.75
mmol/l and higher led to its significant decrease (p<0.001). Again, any combination of fatty
acids containing OA did not attenuate the mitochondrial membrane potential (Fig. 4A and
4B).
Discussion:
Non-alcoholic fatty liver disease (NAFLD) is characterized by the accumulation of
triacylglycerols (TAG) in the liver. In vitro models of steatosis are based on fat-overloading
of cells. OA or PA can induce steatosis separately as well as in a mixture in hepatocyte
primary cultures or in hepatoma cell lines (Joshi-Barve et al. 2007, Berthiaume et al. 2009,
Gómez-Lechón et al. 2007, Mei et al. 2011, Ricchi et al. 2009). However, the effect of PA
and OA on the development of steatosis, impact on functional capacity and cytotoxicity in rat
hepatocytes in primary culture with regard to the dose of fatty acids was not described
sufficiently.

In our study, the addition of PA or OA to primary culture of rat hepatocytes for 24
hours led to a dose-dependent increase in TAG content in hepatocytes. At low concentrations,
(0.25 and 0.5 mmol/l) PA acts as a greater steatogenic agent than OA and at high
concentrations (0.75 and 1 mmol/l), the steatogenic effect is more pronounced in OA. This is
in agreement with results of others documented on HepG2 and WRL-68 cells (Malhi et al.
2006, Ricchi et al. 2009). Rising concentrations of saturated PA can attenuate the synthesis of
TAG in goose hepatocytes (Pan et al. 2011) by an effect on diglyceride acyltransferase from
the group of enzymes involved in synthesis of TAG. The fact that PA is not able to induce
TAG synthesis as effectively as OA was documented also in HepG2 cells (Ricchi et al. 2009)
and in rat hepatoma cells H4IIEC3 (Leamy et al. 2014). The interruption of TAG synthesis
has been also reported after the exposure to another saturated fatty acid, namely to stearic acid
(Mantzaris et al. 2011). Accumulation of TAG induced by OA could be at least partly
explained by the increase in sterol regulatory element-binding protein - 1 and peroxisome
proliferator-activated receptor gamma expression that act as lipogenic transcription factors
(Ricchi et al. 2009). TAG content in hepatocytes exposed to the mixture of OA and PA
depended on its final concentration in our study. It was comparable with values achieved after
the incubation with OA alone. Moreover, increasing portion of OA did not affect the degree
of steatosis.
Our results confirmed PA as a considerable cytotoxic agent in agreement with
literature data on hepatoma cell lines and on human hepatocyte primary cultures (Mei et al.
2011, Malhi et al. 2006). PA decreased WST-1 in rat hepatocytes more rapidly than OA. LDH
leakage rose after the exposure to PA at 0.25 mmol/l and higher dose-dependently. OA
induced LDH leakage from a concentration of 1 mmol/l. After the treatment with fatty acids
(especially with PA) higher LDH leakage was accompanied by attenuated functional capacity
of rat hepatocytes when compared to controls. There is rising evidence that incorporation of

fatty acids into TAG could act as a protective mechanism against free fatty acids-induced
cytotoxicity (Trauner et al. 2010, Ricchi et al. 2009, Yamaguchi et al. 2007). In our study,
hepatocytes exposed to PA at concentrations of 0.25 and 0.5 mmol/l exhibited higher content
of TAG together with more pronounced cytotoxicity than hepatocytes treated with OA at the
same concentrations. Thus, the synthesis of TAG from free fatty acids does not necessarily
guarantee protection of hepatocytes against free fatty acids-induced toxicity.
LDH is released as a result of cytoplasmic membrane disruption and is a feature of
necrosis (Gores et al. 1990). Moreover, cytotoxicity of saturated fatty acids is accompanied
by apoptosis (Gómez-Lechón et al. 2007, Malhi et al. 2006, Ricchi et al. 2009). Our data
confirmed a significant rise of executive caspase 3 activity after the exposure of rat
hepatocytes to PA. On the contrary, OA did not induce caspase 3 activity. Other authors
agreed that OA does not induce apoptosis or only at a low degree (Kong et al. 2002, Ricchi et
al. 2009, Sparagna et al. 2001). The mechanisms of the pro-apoptotic action of PA are not
completely understood but mitochondria play an important role. Saturated fatty acids are
potent inducers of endoplasmic reticulum stress in hepatic cells leading to an efflux of
calcium (Zhang et al. 2012, Leamy et al. 2014). It was documented that PA in a complex with
calcium induces opening of permeability transition pore that lead to a fall in mitochondrial
membrane potential and a release of cytochrome c from the mitochondria (Belosludtsev et al.
2006, Belosludtsev et al. 2014). Our results showed a dose-dependent decrease in the
mitochondrial membrane potential after exposure of rat hepatocytes to PA. We noted a nearly
complete loss of this potential from 1 mM PA. In the case of OA, the mitochondrial
membrane potential was preserved.
Oxidative stress seems to be a powerful stimulus able to trigger the apoptotic cascade
in cells. The exposure to PA led to ROS formation (Listenberger et al. 2001). We document
here that PA-induced production of ROS corresponds with the increased caspase 3 activity.

On the contrary, the incubation of rat hepatocytes with OA in concentrations from 0.125 to 1
mmol/l did not either induce the ROS production or caspase 3 activity.
In our study, the mixture of OA and PA at the final concentrations of 0.5, 0.75 and 1
mmol/l exhibited lower cytotoxicity than is induced by PA alone in equal concentrations.
Interestingly, even if OA was in the mixture with PA at equimolar ratio, the cytotoxicity was
significantly lower than after PA alone, even though the total fatty acid concentration was
twice as high; this suggests a protective effect of OA in these conditions. The mixture of OA
and PA actually prevented the cells from ROS production and caspase 3 activation. The
attenuation of cytotoxicity was accompanied by a preservation of albumin production in rat
hepatocytes. PA-induced decline in mitochondrial membrane potential, apoptotic caspase
activation and cell death are closely associated with the changes of cellular phospholipid
composition (Leamy et al. 2014). The addition of OA to PA in the study of Leamy et al.
(2014) resulted in a reduction in PA incorporation into cellular phospholipids and in an
increase in TAG esterification. Thus the prevention of PA-induced incorporation of saturated
phospholipids into the cellular membranes by OA could play a role in the attenuation of ROS
production and of the caspase activity. Moreover, prevention of the palmitate-induced
mitochondrial dysfunction and preservation of ATP production were described in mouse
neuroblastoma cells preconditioned with OA (Kwon et al. 2014). As it was mentioned,
relatively higher TAG content induced by OA can also play a role.
Based on our study the exposure of rat hepatocytes to oleic and/or palmitic acid
induces the development of steatosis in primary culture dose-dependently. Palmitic acid
exhibits a dose-dependent cytotoxic effect associated with ROS production, present markers
of both apoptosis and necrosis together with a decreased albumin production. OA and PA in
the mixture allow to develop steatosis associated with lower toxicity and better preserved
functional capacity of hepatocytes. Therefore, simple steatosis can be induced by OA or OA

in combination with PA. This in vitro model could allow studying to what extent and by
which mechanisms even simple steatosis predisposes hepatocytes to higher susceptibility to
toxic damage. Such knowledge is a prerequisite for better preservation of steatotic
hepatocytes.
Acknowledgement: PRVOUK P37/02
References:
ARAYA J, RODRIGO R, VIDELA LA, THIELEMANN L, ORELLANA M, PETTINELLI
P, PONIACHIK J: Increase in long-chain polyunsaturated fatty acid n - 6/n - 3 ratio in
relation to hepatic steatosis in patients with non-alcoholic fatty liver disease. Clin Sci (Lond)
106: 635-643, 2004.
BELOSLUDTSEV K, SARIS NE, ANDERSSON LC, BELOSLUDTSEVA N, AGAFONOV
A, SHARMA A, MOSHKOV DA, MIRONOVA GD: On the mechanism of palmitic acid-
induced apoptosis: the role of a pore induced by palmitic acid and Ca2+ in mitochondria. J
Bioenerg Biomembr 38: 113-120, 2006.
BELOSLUDTSEV KN, BELOSLUDTSEVA NV, AGAFONOV AV, ASTASHEV ME,
KAZAKOV AS, SARIS NE, MIRONOVA GD: Ca(2+)-dependent permeabilization of
mitochondria and liposomes by palmitic and oleic acids: a comparative study. Biochim
Biophys Acta 1838: 2600-2606, 2014.
BERRY MN, EDWARDS AM, BARRITT GJ: High-yield preparation of isolated hepatocytes
from rat liver. In: Isolated Hepatocytes Preparation, Properties and Applications. BURDON
RH, VAN KNIPPENBERG PH (eds), Elsevier, New York, 1991, pp 15-81.
BERTHIAUME F, BARBE L, MOKUNO Y, MACDONALD AD, JINDAL R, YARMUSH
ML: Steatosis reversibly increases hepatocyte sensitivity to hypoxia-reoxygenation injury. J
Surg Res 152: 54 - 60, 2009.
BRADFORD MM: A rapid and sensitive method for the quantitation of microgram quantities
of protein utilizing the principle of protein-dye binding. Anal Biochem 72: 248-254, 1976.
BRAUNERSREUTHER V, VIVIANI GL, MACH F, MONTECUCCO F: Role of cytokines
and chemokines in non-alcoholic fatty liver disease. World J Gastroenterol 18: 727-735,
2012.
GAMBINO R, MUSSO G, CASSADER M: Redox balance in the pathogenesis of
nonalcoholic fatty liver disease: mechanisms and therapeutic opportunities. Antioxid Redox
Signal 15: 1325-1365, 2011.
GARNOL T, ENDLICHER R, KUČERA O, DRAHOTA Z, ČERVINKOVÁ Z: Impairment
of mitochondrial function of rat hepatocytes by high fat diet and oxidative stress. Physiol Res
63: 271-274, 2014.
GÓMEZ-LECHÓN MJ, DONATO MT, MARTINEZ-ROMERO A, JIMÉNEZ N, CASTELL
JV, O'CONNOR JE: A human hepatocellular in vitro model to investigate steatosis. Chem
Biol Interact 165: 106-116, 2007.
GORES GJ, HERMAN B, LEMASTERS JJ: Plasma membrane bleb formation and rupture: a
common feature of hepatocellular injury. Hepatology 11: 690-698, 1990.
JOSHI-BARVE S, BARVE SS, AMANCHERLA K, GOBEJISHVILI L, HILL D, CAVE M,
HOTE P, MCCLAIN CJ: Palmitic acid induces production of proinflammatory cytokine
interleukin-8 from hepatocytes. Hepatology 46: 823-830, 2007.

KAISEROVÁ H, DEN HARTOG GJ, ŠIMUNEK T, SCHROTEROVÁ L, KVASNIČKOVÁ
E, BAST A: Iron is not involved in oxidative stress-mediated cytotoxicity of doxorubicin and
bleomycin. Br J Pharmacol 149: 920-930, 2006
KON K, IKEJIMA K, OKUMURA K, ARAI K, AOYAMA T, WATANABE S: Diabetic
KK-A(y) mice are highly susceptible to oxidative hepatocellular damage induced by
acetaminophen. Am J Physiol Gastrointest Liver Physiol 299: 329-337, 2010.
KONG JY, RABKIN SW: Lovastatin does not accentuate but is rather additive to palmitate-
induced apoptosis in cardiomyocytes. Prostaglandins Leukot Essent Fatty Acids 67: 293-302,
2002.
KUČERA O, AL-DURY S, LOTKOVÁ H, ROUŠAR T, RYCHTRMOC D, ČERVINKOVÁ
Z: Steatotic rat hepatocytes in primary culture are more susceptible to the acute toxic effect of
acetaminophen. Physiol Res 61 (Suppl 2): 93-101, 2012.
KUČERA O, ENDLICHER R, ROUŠAR T, LOTKOVÁ H, GARNOL T, DRAHOTA Z,
ČERVINKOVÁ Z: The effect of tert-butyl hydroperoxide-induced oxidative stress on lean
and steatotic rat hepatocytes in vitro. Oxid Med Cell Longev doi: 10.1155/2014/752506, 2014.
KUČERA O, LOTKOVÁ H, STAŇKOVÁ P, PODHOLA M, ROUŠAR T, MEZERA V,
ČERVINKOVÁ Z: Is rat liver affected by non-alcoholic steatosis more susceptible to the
acute toxic effect of thioacetamide? Int J Exp Pathol 92: 281-289, 2011.
KWON B, LEE HK, QUERFURTH HW: Oleate prevents palmitate-induced mitochondrial
dysfunction, insulin resistance and inflammatory signaling in neuronal cells. Biochim Biophys
Acta 1843: 1402-1413, 2014.
LEAMY AK, EGNATCHIK RA, SHIOTA M, IVANOVA PT, MYERS DS, BROWN HA,
YOUNG JD: Enhanced synthesis of saturated phospholipids is associated with ER stress and
lipotoxicity in palmitate treated hepatic cells. J Lipid Res 55: 1478-1488, 2014.
LISTENBERGER LL, ORY DS, SCHAFFER JE: Palmitate-induced apoptosis can occur
through a ceramide-independent pathway. J Biol Chem 276: 14890-14895, 2001.
LOTKOVÁ H, KUČERA O, ROUŠAR T, ENDLICHER R, KŘIVÁKOVÁ P, GARNOL T,
ČERVINKOVÁ Z: Effect of S-adenosylmethionine on Acetaminophen-induced Toxic Injury
of Rat Hepatocytes in vitro. Acta Vet Brno 78: 603-613, 2009
MALHI H, BRONK SF, WERNEBURG NW, GORES GJ: Free fatty acids induce JNK-
dependent hepatocyte lipoapoptosis. J Biol Chem 281: 12093-12101, 2006.
MANTZARIS MD, TSIANOS EV, GALARIS D: Interruption of triacylglycerol synthesis in
the endoplasmic reticulum is the initiating event for saturated fatty acid-induced lipotoxicity
in liver cells. FEBS J 278: 519-530, 2011.
MEI S, NI HM, MANLEY S, BOCKUS A, KASSEL KM, LUYENDYK JP, COPPLE BL,
DING WX: Differential roles of unsaturated and saturated fatty acids on autophagy and
apoptosis in hepatocytes. J Pharmacol Exp Ther 339: 487-498, 2011.
NIKLAS J, BONIN A, MANGIN S, BUCHER J, KOPACZ S, MATZ-SOJA M, THIEL C,
GEBHARDT R, HOFMANN U, MAUCH K: Central energy metabolism remains robust in
acute steatotic hepatocytes challenged by a high free fatty acid load. BMB Rep 45: 396-401,
2012.
PAN Z, WANG J, TANG H, LI L, LV J, XIA L, HAN C, XU F, HE H, XU H, KANG B:
Effects of palmitic acid on lipid metabolism homeostasis and apoptosis in goose primary
hepatocytes. Mol Cell Biochem 350: 39-46, 2011.
RICCHI M, ODOARDI MR, CARULLI L, ANZIVINO C, BALLESTRI S, PINETTI A,
FANTONI LI, MARRA F, BERTOLOTTI M, BANNI S, LONARDO A, CARULLI N,
LORIA P: Differential effect of oleic and palmitic acid on lipid accumulation and apoptosis in
cultured hepatocytes. J Gastroenterol Hepatol 24: 830-840, 2009.

ROGUE A, ANTHERIEU S, VLUGGENS A, UMBDENSTOCK T, CLAUDE N, DE LA
MOUREYRE-SPIRE C, WEAVER RJ, GUILLOUZO A: PPAR agonists reduce steatosis in
oleic acid-overloaded HepaRG cells. Toxicol Appl Pharmacol 276: 73-81, 2014.
SPARAGNA GC, HICKSON-BICK DL, BUJA LM, MCMILLIN JB: Fatty acid-induced
apoptosis in neonatal cardiomyocytes: redox signaling. Antioxid Redox Signal 3: 71-79, 2001.
SWAGELL CD, HENLY DC, MORRIS CP: Expression analysis of a human hepatic cell line
in response to palmitate. Biochem Biophys Res Commun 328: 432-441, 2005.
TANG Y, BIAN Z, ZHAO L, LIU Y, LIANG S, WANG Q, HAN X, PENG Y, CHEN X,
SHEN L, QIU D, LI Z, MA X: Interleukin-17 exacerbates hepatic steatosis and inflammation
in non-alcoholic fatty liver disease. Clin Exp Immunol 166: 281-290, 2011.
TOLMAN KG, DALPIAZ AS: Treatment of non-alcoholic fatty liver disease. Ther Clin Risk
Manag 3: 1153-1163, 2007.
TRAUNER M, ARRESE M, WAGNER M: Fatty liver and lipotoxicity. Biochim Biophys
Acta 1801: 299-310, 2010.
VENDEMIALE G, GRATTAGLIANO I, CARACENI P, CARACCIO G, DOMENICALI M,
DALL'AGATA M, TREVISANI F, GUERRIERI F, BERNARDI M, ALTOMARE E:
Mitochondrial oxidative injury and energy metabolism alteration in rat fatty liver: effect of the
nutritional status. Hepatology 33: 808-815, 2001.
VIDELA LA, RODRIGO R, ARAYA J, PONIACHIK J: Oxidative stress and depletion of
hepatic long-chain polyunsaturated fatty acids may contribute to nonalcoholic fatty liver
disease. Free Radic Biol Med 37: 1499-1507, 2004.
YAMAGUCHI K, YANG L, MCCALL S, HUANG J, YU XX, PANDEY SK, BHANOT S,
MONIA BP, LI YX, DIEHL AM: Inhibiting triglyceride synthesis improves hepatic steatosis
but exacerbates liver damage and fibrosis in obese mice with nonalcoholic steatohepatitis.
Hepatology 45: 1366-1374, 2007.
ZHANG Y, XUE R, ZHANG Z, YANG X, SHI H: Palmitic and linoleic acids induce ER
stress and apoptosis in hepatoma cells. Lipids Health Dis doi: 10.1186/1476-511X-11-1,
2012.
Figure 1. LDH leakage (A), WST-1 test (B) and albumin production (C) in primary cultures
of rat hepatocytes exposed to OA, PA and combinations of OA:PA - 3:1; 2:1 and 1:1 at final
concentrations of 0.125 – 2 mmol/l for 24 h; n ≥ 12 (Fig 1A and 1B) or n ≥ 6 (1C). Results are
standardized to protein level and expressed as % of control. Statistical significance is shown
as *** (p<0.001); * (p<0.05) vs control, +++ (p<0.001); ++ (p<0.01); + (p<0.05) vs PA alone
at the same final concentration and ooo (p<0.001); o (p<0.05) vs combination of OA:PA - 1:1
at the final concentration two times higher than OA alone or PA alone.
Figure 2. Morphology of control hepatocytes and hepatocytes exposed to OA or PA at
concentrations of 0.5, 1 and 2 mmol/l for 24 h. Magnification is 400x (A). TAG accumulation

(B) in primary rat hepatocytes exposed to OA, PA and their combinations OA:PA - 3:1; 2:1
and 1:1 at total concentrations of 0.25 – 1 mmol/l for 24 h. Results are standardized to protein
levels and expressed as % of control (n ≥ 6). Statistical significance is shown as ***
(p<0.001); ** (p<0.01) vs control, +++ (p<0.001); + (p<0.05) vs PA alone at the same final
concentration, $$$ (p<0.001) vs same combination of OA:PA at the final concentration of
0.75 and 1 mmol/l and x (p<0.05) vs same combination of OA:PA at the final concentration
of 0.5 mmol/l.
Figure 3. Caspase 3 activity (A) and ROS production (B) in primary cultures of rat
hepatocytes after treatment with OA, PA and combinations of OA:PA - 3:1; 2:1 and 1:1 at
final concentrations of 0.125 – 2 mmol/l for 24 h. Results are standardized to protein level and
expressed as % of control (n ≥ 6). Statistical significance is shown as *** (p<0.001) vs
control, +++ (p<0.001) vs PA alone at the same final concentration and ooo (p<0.001) vs
combination OA:PA - 1:1 at the final concentration two times higher than OA alone or PA
alone.
Figure 4. Mitochondrial membrane potential was visualized by JC-1 (magnification of photos
is 400 x) (A) and % of cells with high membrane potential was counted (n ≥ 5) (B). Primary
rat hepatocytes were treated with OA, PA and their combinations in the ratio of OA:PA - 3:1;
2:1 and 1:1 at final concentrations of 0.25 – 2 mmol/l for 24 h. Statistical significance is
shown as *** (p<0.001); ** (p<0.01); * (p<0.05) vs control, +++ (p<0.001); + (p<0.05) vs
PA alone at the same final concentration.
Fig 1A

Fig 1B
Fig 1C

Fig 2A
Fig 2B
Fig 3A
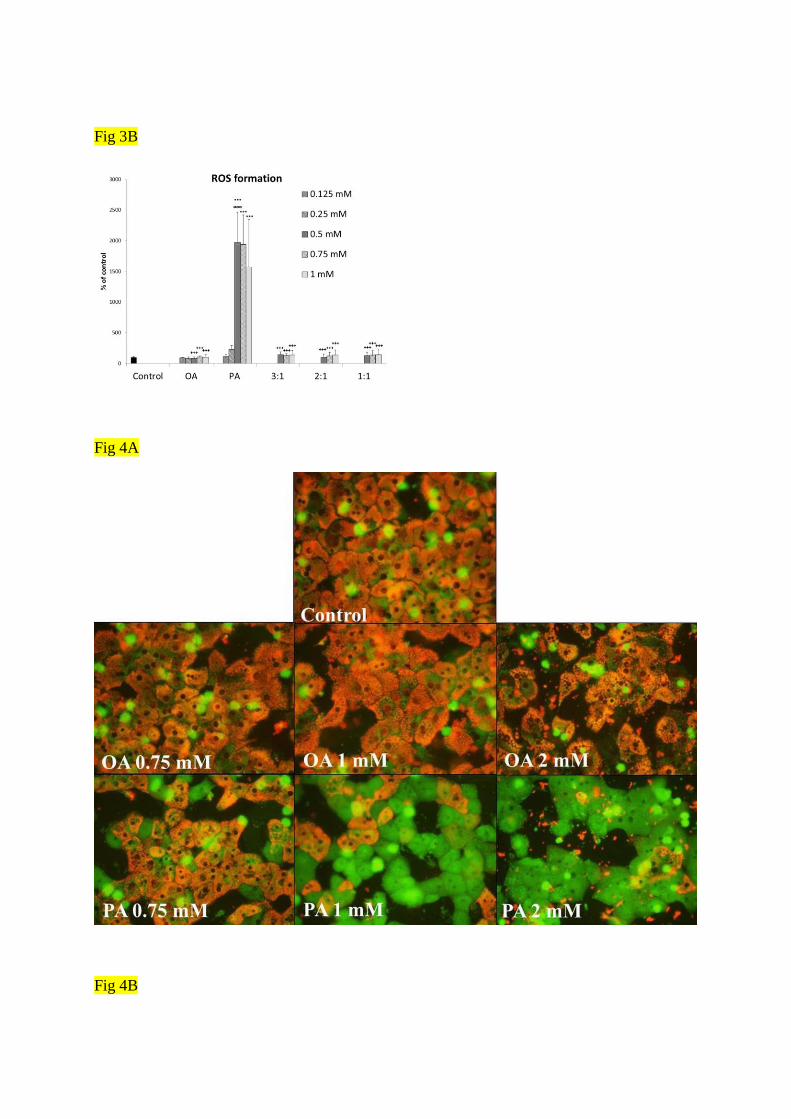
Fig 3B
Fig 4A
Fig 4B
