the economic contributions of the national...
TRANSCRIPT

The Economic Contributions of the National Aquarium 2012 Assessment
SUBMITTED BY: SAGE POLICY GROUP, INC.; OCTOBER 2012

2 THE ECONOMIC CONTRIBUTIONS OF THE NATIONAL AQUARIUM: A 2012 ASSESSMENT
Dear Friends,
Since our exciting beginnings over 30 years ago, the National Aquarium has served as a nonprofit leader in the field of marine conservation and science. We are proud to be an economic engine for the City of Baltimore, the State of Maryland, and the District of Columbia and its surrounding communities—positively impacting employment, visitation, and spending in our region.
In 2012, National Aquarium commissioned Sage Policy Group, Inc. to measure our economic impact on the region. This document is a summary of the study and includes major statistical findings, key analyses, and the following essential economic indicators about the National Aquarium’s effect:
• $319.6millioninannualeconomicimpact
• 3,347jobscreated
• $11.7millionannualtaxrevenuestotheStateof Maryland
• $5.9millionannualtaxrevenuestotheCityof Baltimore
• 1.5millionannualvisitors
We continue to innovate and invest in our communities through expansion and renovation of our exhibits, ongoing conservation initiatives in the region, and our commitment to education and outreach to local schools and students. We are proud to directly employ over 590 people at our locations in Washington, DC and Baltimore, MD, in addition to the 3,347 jobs we create in the region.
Each year, over 1.5 million annual visitors learn about urgent issues affecting the aquatic world and actions they can take to protect our blue planet. Over 60,000 school children visit the National Aquarium each year, and 50,000 of those students receive free admission as part of our Maryland free schools programs. Outside our walls, we are making great strides in our conservation efforts, which are vital to restoring critical habitats in the Chesapeake Bay and along the Atlantic coastline. These efforts are the cornerstone of our education program and our engagement with the community.
We are pleased to share this positive economic impact data and proud of our role in sustaining the economic vitality of the City of Baltimore, the State of Maryland, and the District of Columbia. Our commitment to our mission to inspire conservation of the world’s aquatic treasures has never been greater.
P.S. One of our top priorities is ensuring that all Marylanders have the opportunity to visit the National Aquarium and enjoy the world’s aquatic treasures. In addition to our many programs for Maryland students and schools, we also offer several affordable access programs for Maryland residents including Fridays after Five, Dollar Days, and Maryland Mornings, an exclusive discount for Maryland residents.
John C. Racanelli CHIEF EXECUTIVE OFFICER
THE ECONOMIC CONTRIBUTIONS OF THE NATIONAL AQUARIUM: A 2012 ASSESSMENT 3
4 Preamble
5 Executive Summary
6 Chart E1: Summary of Findings (annual impacts)
6 The Economic Contributions of the National Aquarium: A 2012 Assessment
6 I. Introduction
7 II. Methodology: Quantifying Impacts
10 Chart 1: National Aquarium Expenditures by Location, 2012
11 Chart 2: National Aquarium Revenues by Location, 2012
11 Chart 3: National Aquarium Visitors, 2012
12 Chart 4: Visitor Spending Estimates per Visitor
13 Chart 5: National Aquarium Annual Visitor Spending
13 III. The Economic and Fiscal Impacts of the National Aquarium
14 Chart 6: Annual Economic Impact of National Aquarium Operations and Visitor Spending
15 Chart 7: Annual Fiscal Impact of Aquarium Operations and Visitor Spending
15 Conclusion
16 Appendix
16 Chart A1: National Aquarium, Baltimore Attendance by Type of Visitor, 2007 through 2012
17 Chart A2: National Aquarium, Washington, DC Attendance by Type of Visitor, 2007 through 2012
18 Chart A3: 2011 National Aquarium, Baltimore Visitor Origin
18 Chart A4: Breakdown of Economic Impact of National Aquarium, 2012
Table of Contents

4 THE ECONOMIC CONTRIBUTIONS OF THE NATIONAL AQUARIUM: A 2012 ASSESSMENT
Every successful city, particularly those that emerge as tourist destinations, can boast at least one amenity or neighborhood that other cities simply cannot replicate. In Philadelphia, it’s the Liberty Bell; in Washington, DC, it’s the Smithsonian; in New Orleans, it’s the French Quarter; in San Francisco, it’s the Golden Gate Bridge; and in Baltimore, it’s the National Aquarium.
The National Aquarium often serves as the principal motivation to come to Baltimore. This is made obvi-ous by attendance figures, which indicate that 1.37 million people visited the Aquarium in Baltimore in 2012. These visitors are then able to easily access other Baltimore destinations, whether Oriole Park at Camden Yards, Port Discovery, the Maryland Science Center, Fells Point, or Federal Hill. As visitors jour-ney through the community, they generate economic impact through their spending. This analysis indicates that in the most recent year for which data are avail-able, the National Aquarium directly and indirectly supported more than $314 million in economic impact in Maryland.
But there is more to the Aquarium than economic impacts—there are important educational ones as well. The Aquarium hosts 108,000 Maryland students each year, providing young people with insights into the nature of sensitive ecosystems, their personal en-vironmental impacts, and key ways to mitigate these effects. The Aquarium also provides facilities to sup-port cutting edge research—the type of research that will be of enormous importance as Marylanders and others continue to work to improve the conditions of the Chesapeake Bay.
In the final analysis, it is evident the Aquarium is a treasure trove of economic, fiscal, environmental, and educational impacts. The report that follows will provide readers with an assessment of its measurable contributions to the region. While the study’s findings are based on 2011 and 2012 data, one should expect similar results for years to come.
Preamble

THE ECONOMIC CONTRIBUTIONS OF THE NATIONAL AQUARIUM: A 2012 ASSESSMENT 5
Executive Summary
Quantifying the National Aquarium’s Economic and Fiscal Impacts
This report characterizes and quantifies the economic contributions generated by the National Aquarium, a private, nonprofit organization with a mission to inspire conservation of the world’s aquatic treasures. The National Aquarium has two locations—one in Baltimore’s Inner Harbor and one in Washington, DC.
To quantify economic impacts, Sage Policy Group, Inc. (Sage) utilized Baltimore City, Washington, DC, and Maryland-specific IMPLAN multipliers to generate estimates of employment, income, and output. To conduct the fiscal portion of the analysis, Sage relied heavily upon publicly available information including government-published tax rates and budgetary information. As with economic impacts, fiscal impacts have been calculated for the City of Baltimore, the State of Maryland, and the District of Columbia.
Analytical Findings
❚ In total, the National Aquarium supports substantial employment (3,347 jobs) and economic impacts ($319.6 million) annually for the City of Baltimore, the State of Maryland, and the District of Columbia;
❚ Together, the facilities attract more than 1.5 million visitors each year;
❚ Between the two facilities, operational expenditures have expanded to more than $50 million per annum; and
❚ Collectively, the Aquarium supports $17.9 million in fiscal impact, or tax revenue, for the City of Baltimore, the State of Maryland, and the District of Columbia.
THE CITY OF BALTIMORE AND STATE OF MARYLAND
❚ Statewide, the National Aquarium supports 3,300 jobs, nearly $127 million in annual employee compensa-tion, and has an annual economic impact of $314 million (these figures include Baltimore City impacts);
❚ In Baltimore City alone, the National Aquarium supports more than 2,900 jobs, total employee compensa-tion approaching $118 million, and has an annual economic impact of nearly $272 million;
❚ The study team estimates that visitors to the National Aquarium, Baltimore spend nearly $206 million per year on lodging, transportation, food, shopping, gas, and recreation;
❚ 88.14 percent of visitors to the National Aquarium, Baltimore reported that it was the primary reason for their visit to Baltimore;
❚ The State of Maryland directly and indirectly receives $11.7 million in annual tax revenues from the Aquarium (City and State fiscal impacts are mutually exclusive); and
❚ The City of Baltimore directly and indirectly receives $5.9 million in annual tax revenues from the Aquarium.
THE DISTRICT OF COLUMBIA
❚ The updated facility in Washington, DC helps support 43 jobs associated with annual employee compensation of $2.1 million per annum and local business sales of $5.6 million;
❚ Visitors to the Washington, DC location spend more than $3 million per year; and
❚ The Aquarium supports $0.3 million in fiscal impact in Washington, DC.
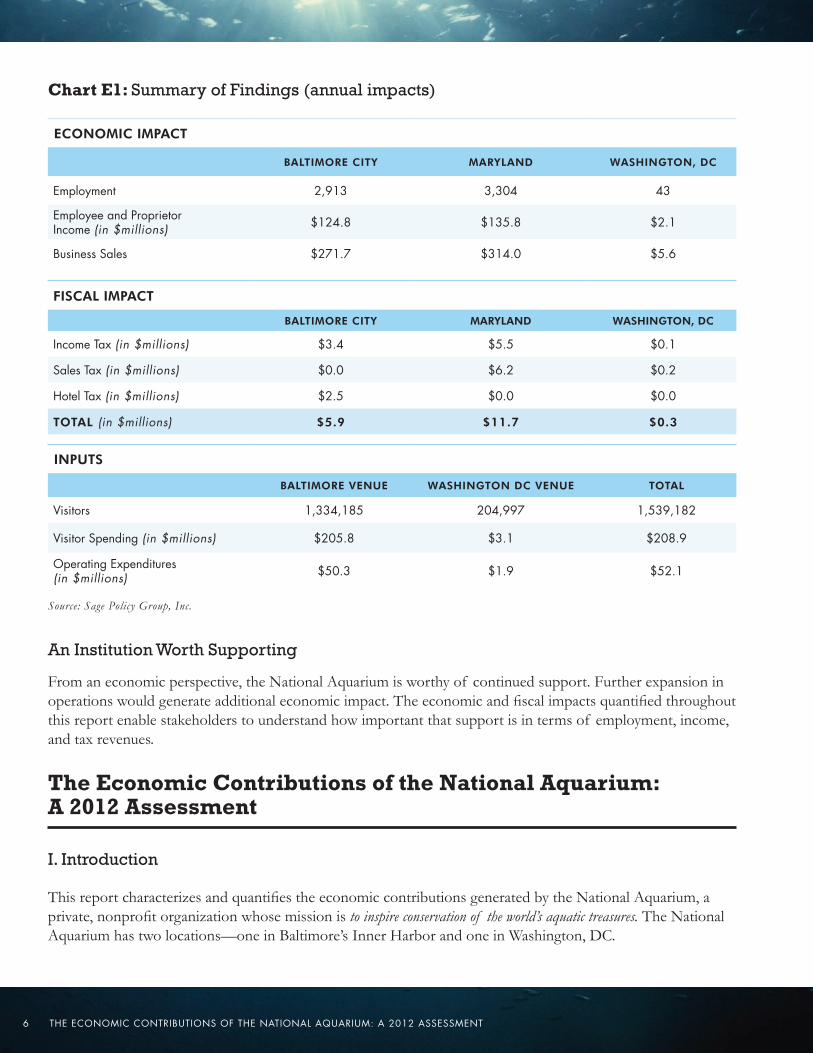
Chart E1 provides summary information.
6 THE ECONOMIC CONTRIBUTIONS OF THE NATIONAL AQUARIUM: A 2012 ASSESSMENT
Chart E1: Summary of Findings (annual impacts)
ECONOMIC IMPACT
BALTIMORE CITY MARYLAND WASHINGTON, DC
Employment 2,913 3,304 43
Employee and Proprietor Income (in $millions) $124.8 $135.8 $2.1
Business Sales $271.7 $314.0 $5.6
FISCAL IMPACT
BALTIMORE CITY MARYLAND WASHINGTON, DC
Income Tax (in $millions) $3.4 $5.5 $0.1
Sales Tax (in $millions) $0.0 $6.2 $0.2
Hotel Tax (in $millions) $2.5 $0.0 $0.0
TOTAL (in $millions) $5.9 $11.7 $0.3
INPUTS
BALTIMORE VENUE WASHINGTON DC VENUE TOTAL
Visitors 1,334,185 204,997 1,539,182
Visitor Spending (in $millions) $205.8 $3.1 $208.9
Operating Expenditures (in $millions) $50.3 $1.9 $52.1
Source: Sage Policy Group, Inc.
An Institution Worth Supporting
From an economic perspective, the National Aquarium is worthy of continued support. Further expansion in operations would generate additional economic impact. The economic and fiscal impacts quantified throughout this report enable stakeholders to understand how important that support is in terms of employment, income, and tax revenues.
The Economic Contributions of the National Aquarium: A 2012 Assessment
I. Introduction
This report characterizes and quantifies the economic contributions generated by the National Aquarium, a private, nonprofit organization whose mission is to inspire conservation of the world’s aquatic treasures. The National Aquarium has two locations—one in Baltimore’s Inner Harbor and one in Washington, DC.

THE ECONOMIC CONTRIBUTIONS OF THE NATIONAL AQUARIUM: A 2012 ASSESSMENT 7
The Baltimore location is the number one paid tourist destination in the city. The National Aquarium, Baltimore is comprised of three architecturally distinct pavilions encompassing 500,000 square feet and more than 2.2 million gallons of water capacity: the original Aquarium building, opened in 1981; the Marine Mammal Pavilion, opened in 1990; and the Glass Pavilion, opened in 2006. The location boasts a “living collection that includes more than 16,000 animals from more than 660 species of fish, birds, amphibians, reptiles, and marine mammals that live in award-winning exhibits.”1 In addition to live animal exhibits, the venue offers behind-the-scenes tours, sleepovers, and hosts special events. The location supports 275 paid staff and more than 600 trained volunteers. The venue attracts more than 1.3 million visitors each year.
It is important to note that while the Aquarium sustains an iconic structure in Baltimore City, it is an amenity for the entire region. Through August 2012, almost 170,000 visitors from other Maryland locales (approximately 15 percent of total visitation) visited the Aquarium. More of these visitors resided in Baltimore County (131,363) than in any other local jurisdiction.2 This means that the Aquarium’s ability to educate and sensitize people to environmental and other issues, including young people, penetrates deep into the suburbs.
The Washington, DC location has been at its current address since 1932 and has worked in collaboration with the signature Baltimore location since 2003. Following a five-year renovation effort, the Washington facility was “re-introduced” to the public in 2008 and now features a “45-minute showcase of more than 250 unique and engaging species including alligators, piranha, shark, eel, gar, and adorable loggerhead turtles.”3 The location hosts more than 200,000 visitors each year. It should be noted that despite its name and location, the Washington, DC site receives no federal operating support.4
Through their operations and ongoing capital investments, the National Aquarium produces significant economic and fiscal impacts in both communities. This study separately assesses the impact of the two locations and uses as its source material operational expenditures and visitor spending data.
Importantly, the study team specifically analyzed the spending of visitors who have stated that their primary reason for visiting Baltimore’s Inner Harbor or Washington, DC was to patronize a National Aquarium facility. As a result, visitor spending that takes place within the walls of the facilities and in the general vicinity can be reasonably attributed to the existence and functioning of these two facilities.
From a geographic perspective, economic and fiscal impacts are separately quantified for the City of Baltimore, the State of Maryland, and the District of Columbia. What is not quantified are some of the spinoff effects that can be fairly attributed to the National Aquarium, including the impact the Aquarium has had in underpin-
1 National Aquarium, Baltimore Venue Fact Sheet. Available at aqua.org/news/fact-sheets/baltimore.2 IMPACTS Research & Development; Tourism Economics3 National Aquarium, Washington DC Venue Fact Sheet. Available at aqua.org/news/fact-sheets/dc.4 Rent for the National Aquarium, Washington, DC is recused in the Commerce Building.
National Aquarium supports a total economic impact of $319.6 million

8 THE ECONOMIC CONTRIBUTIONS OF THE NATIONAL AQUARIUM: A 2012 ASSESSMENT
ning the renaissance of Baltimore’s gleaming waterfront—a waterfront that has attracted global attention and is now viewed by many urban planners as a model for other cities.
II. Methodology: Quantifying Impacts
To quantify economic impacts, Sage utilized Baltimore City, Washington, DC, and Maryland-specific IMPLAN5 multipliers to generate estimates of employment, income, and output. Calculated employment impacts include both full and part-time workers. The study team has also calculated employment contributions in the form of full-time equivalents (FTE). Labor income is defined as encompassing all forms of employment income includ-ing employee compensation (wages and benefits) and proprietor income (earnings of business owners). Output represents the sum total of value-added contributions. This is captured in the form of business sales that take place due to National Aquarium operating expenditures, associated visitor spending, and secondary impacts produced by the businesses and workers that are directly related to Aquarium operations.
To conduct the fiscal portion of the analysis, Sage relied heavily upon publicly available information includ-ing government-published tax rates and budgetary information. As with economic impacts, fiscal impacts have been calculated for the City of Baltimore, the State of Maryland, and the District of Columbia.
A. KEY ANALYTICAL CONCEPTS AND DEFINITIONS
THE NEED TO CONSIDER MULTIPLIER EFFECTS
Economic activity produced by National Aquarium operations generates a multiplier effect that impacts the economies of Baltimore City, Washington, DC, and Maryland and expands the benefits created directly by ongoing activity taking place within the facilities. In the language of economics, these addi-tional economic activities are termed the indirect and induced effects of the jobs, income, and sales generated directly by the facilities.
DEFINING DIRECT, INDIRECT, AND INDUCED EFFECTS
DirectandIndirectEffects—The jobs physically located at the Aquarium or supported directly by Aquarium visitor spending are considered direct effects. Indirect effects oc-cur when, for example, the Aquarium or contractors of the Aquarium purchase goods and services from other firms in Baltimore City (inputs), the State of Maryland, and/or the District of Columbia. These businesses purchase everything from building materials to accounting and advertising services and lease equipment from local firms. In turn, these suppliers purchase office supplies, insurance, and many other items and services from other firms, many of which are local. In its totality, this succession of purchases
5 IMPLAN is the most commonly utilized econometric software for analyses of its type and has emerged as the industry standard for this type of quantification. The model is comprised of economic multipliers that reflect the statistical relationship between various local industries and the likelihood that certain goods and services will be sourced locally as opposed to outside the community. These multipliers are updated each year and Sage purchases model licenses on an annual basis. This study utilizes the most recent multipliers to date.
National Aquarium supports 3347 jobs in Baltimore City, Washington, DC, and Maryland.

THE ECONOMIC CONTRIBUTIONS OF THE NATIONAL AQUARIUM: A 2012 ASSESSMENT 9
by suppliers and suppliers of suppliers produces indirect effects, which are also known as business-to-business purchasing effects.
It should be noted that the model employed for this study attempts to account for every dollar spent, to determine where those dollars were or will be spent and for what purposes. In other words, all of the spending associated with Aquarium operations and visitor spending is integrated into the model, with the multipliers assessing the impact of this spending on the local economy given the relationship between various local industries and the likelihood that money spent on goods and services has been or will be spent within the confines of the community. The greater the level of purchases made within the commu-nity, the greater are the impacts of Aquarium operations on the local/regional economy.
InducedEffects—The wages and income received by the employees of the Aquarium and of the succes-sion of suppliers linked to the Aquarium create additional effects. A portion of these wages is spent in the City of Baltimore, the State of Maryland, and/or the District of Columbia for a broad range of consumer purchases ranging from housing and groceries to entertainment and holiday gifts.
The economic activity associated with these purchases is termed the induced effect. Again, the model attempts to account for each dollar that is absorbed by the local labor force and determine how those dollars are likely to be spent across product and service types. Most importantly, the model’s multipliers reflect the likelihood that purchases by households have been or will be made locally as opposed to out-side of the community. The higher the share of purchases made locally, the greater the induced economic effects. It is for this reason that the larger the scope of geographic inquiry, the greater is the likelihood that secondary economic impacts will be captured in the area under consideration.
Direct, indirect, and induced effects can be measured along three dimensions: employment (measured in full-time and part-time jobs as well as in the form of full-time equivalents), income (measured in dollars), and output or sales of goods and services (also measured in dollars). These effects are estimated using proprietary software and a computer model created specifically for this National Aquarium- centered analysis.6
Economic impacts calculated in this study can be considered ongoing, annual impacts. These impacts are likely to be similar from year to year absent significant shifts in local economic activity and/or changes to the National Aquarium’s scale and scope of offerings. One key aspect of ongoing impacts relates to the retail sales and business services provided to the public directly by the National Aquarium. Visitor spending represents the other significant source of impact. Aquarium visitors spend money on food, transportation, retail items, and lodging in the case of overnight visitors. This spending behavior, in turn, generates jobs, income, and business sales for the local economy.
6 Using IMPLAN data, Sage produced a customized economic and fiscal impact model specific to this analysis. IMPLAN employment multipliers encompass total wage and salary employees as well as self-employed people in the region. Both full-time and part-time workers are measured to create an estimate of annual average jobs. CEW (Covered Employment and Wages) data, Regional Economic Information System (REIS), and County Business Patterns are used in conjunction to create the IMPLAN database because no one data set provides enough information to create a complete set of IMPLAN multipliers. In general, CEW data provide the County level industry structure for IMPLAN, while County Business Pat-terns’ data are used to make non-disclosure adjustments to CEW data, and REIS data are used to control totals (i.e., prevent double-counting). These data are critical to the analysis because the model works to capture the manner in which Aquarium operations interact with the local labor market in terms of demand for human capital and need for skill sets not sufficiently supplied by the local workforce.

10 THE ECONOMIC CONTRIBUTIONS OF THE NATIONAL AQUARIUM: A 2012 ASSESSMENT
Finally, in addition to economic impacts, the operations of the National Aquarium and associated visi-tor spending create fiscal impacts defined as new streams of tax revenue for Baltimore City, the State of Maryland, and the District of Columbia. As with economic impacts, the model works to account for each dollar spent and the manner in which this spending occurs using data characterizing consumer behavior and describing the interaction between various local industries. The model also accounts for nuanced as-pects of the relevant tax codes. For instance, in Maryland, services are generally not subject to retail sales taxes. The model accounts for this. The model cannot, however, predict future changes in the City or State tax code. For instance, if over time the State of Maryland decides to apply the retail sales tax to additional service segments, Sage’s estimates of future fiscal impact will prove understated.
This analysis includes estimates of income tax, sales tax, other taxes, and applicable fees. These taxes are calculated within Sage’s model using published tax rates. Incorporating fiscal impacts directly into a model rather than conducting economic and fiscal impact analyses separately ensures internal consistency be-tween estimated economic and fiscal impacts. However, to ensure that the IMPLAN model is properly calculating tax revenue impacts, Sage separately calculates tax impacts manually. Sage has determined that the Sage-modified IMPLAN model has produced robust estimates of both economic and fiscal impacts associated with the National Aquarium facilities in Baltimore and Washington, DC.
B. ECONOMIC AND FISCAL IMPACTS ARE A PRODUCT OF OPERATING EXPENDITURES AND VISITOR SPENDING
It is worth noting that expenditures are typically viewed as a negative aspect of business life. However, in the world of economic impact modeling, expenditures are to be viewed more positively since the greater the level of expenditures, the greater the level of economic impact upon the community. For instance, larger expenditures on payroll imply larger income gains and enhanced local purchasing power.
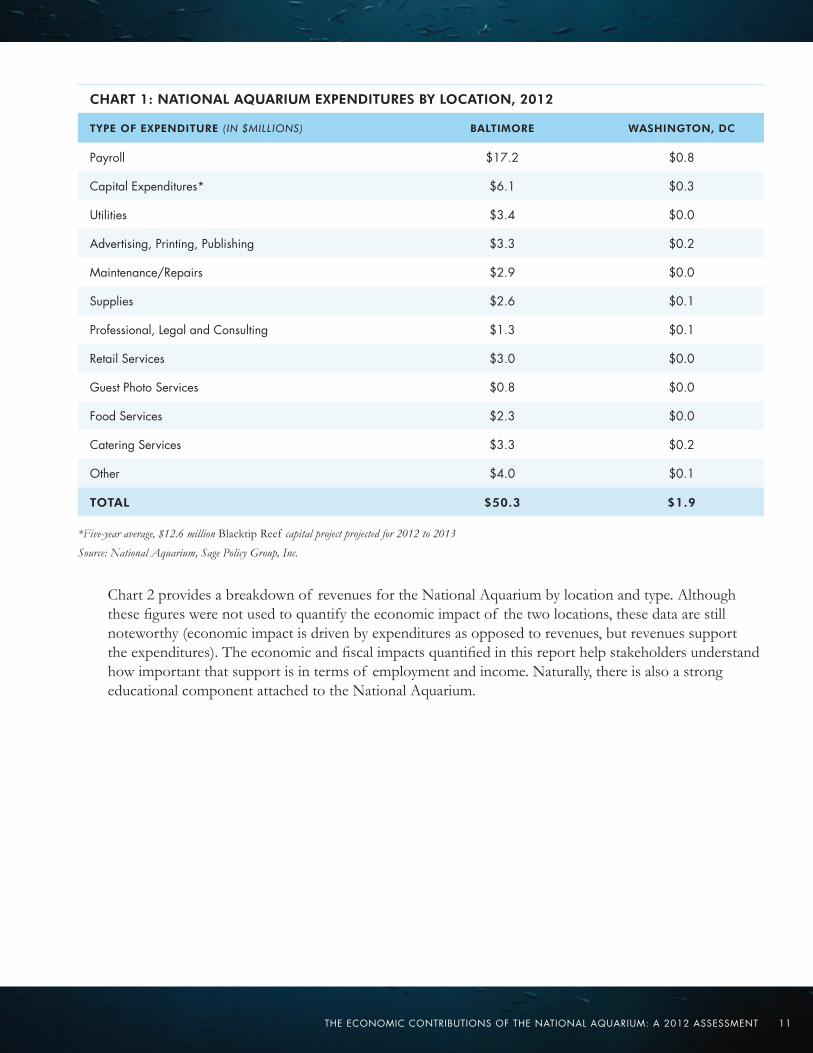
In 2012, the Baltimore location paid more than $17 million in payroll expenses. The Washington, DC location had payroll expenditures of roughly $800,000. The facilities also spent significant sums on capital improvements, utilities, advertising, and other services. In total, the National Aquarium registered $50.3 million in expenditures in 2012 in Baltimore and $1.9 million in expenditures in Washington, DC. Chart 1 details expenditures associated with operations at the facilities in Baltimore and Washington, DC.
THE ECONOMIC CONTRIBUTIONS OF THE NATIONAL AQUARIUM: A 2012 ASSESSMENT 11
CHART 1: NATIONAL AQUARIUM EXPENDITURES BY LOCATION, 2012
TYPE OF EXPENDITURE (IN $MILLIONS) BALTIMORE WASHINGTON, DC
Payroll $17.2 $0.8
Capital Expenditures* $6.1 $0.3
Utilities $3.4 $0.0
Advertising, Printing, Publishing $3.3 $0.2
Maintenance/Repairs $2.9 $0.0
Supplies $2.6 $0.1
Professional, Legal and Consulting $1.3 $0.1
Retail Services $3.0 $0.0
Guest Photo Services $0.8 $0.0
Food Services $2.3 $0.0
Catering Services $3.3 $0.2
Other $4.0 $0.1
TOTAL $50.3 $1.9
*Five-year average, $12.6 million Blacktip Reef capital project projected for 2012 to 2013
Source: National Aquarium, Sage Policy Group, Inc.
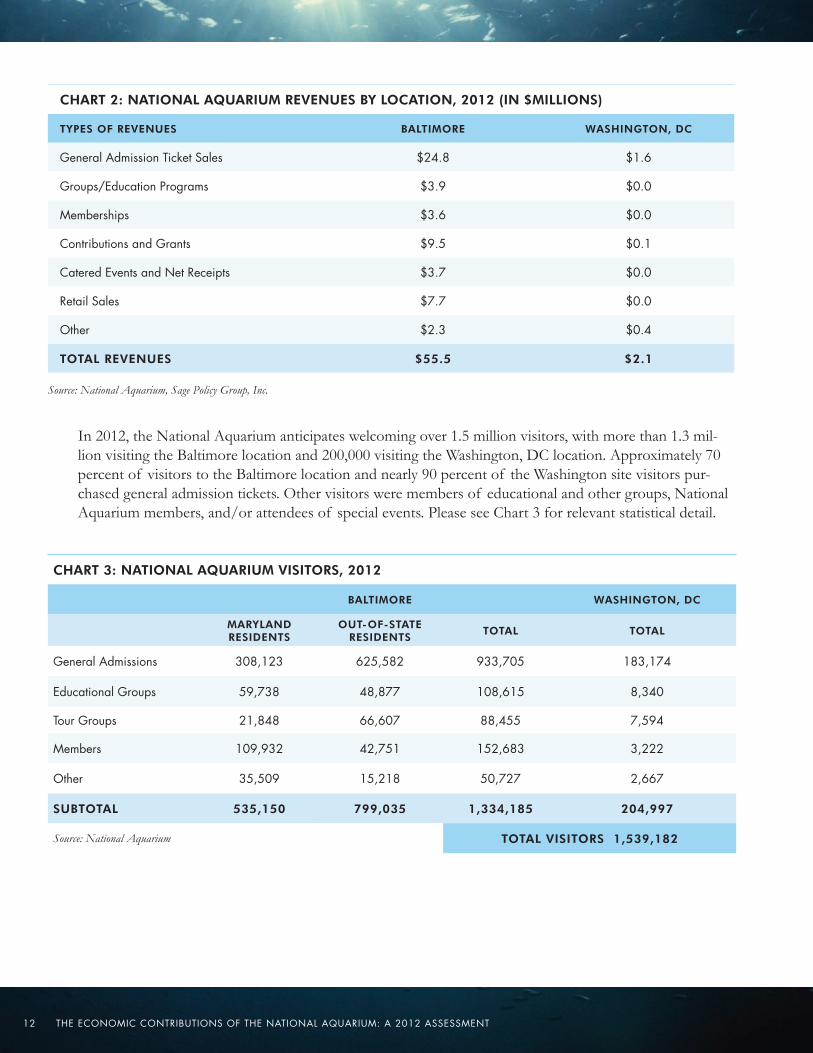
Chart 2 provides a breakdown of revenues for the National Aquarium by location and type. Although these figures were not used to quantify the economic impact of the two locations, these data are still noteworthy (economic impact is driven by expenditures as opposed to revenues, but revenues support the expenditures). The economic and fiscal impacts quantified in this report help stakeholders understand how important that support is in terms of employment and income. Naturally, there is also a strong educational component attached to the National Aquarium.
12 THE ECONOMIC CONTRIBUTIONS OF THE NATIONAL AQUARIUM: A 2012 ASSESSMENT
CHART 2: NATIONAL AQUARIUM REVENUES BY LOCATION, 2012 (IN $MILLIONS)
TYPES OF REVENUES BALTIMORE WASHINGTON, DC
General Admission Ticket Sales $24.8 $1.6
Groups/Education Programs $3.9 $0.0
Memberships $3.6 $0.0
Contributions and Grants $9.5 $0.1
Catered Events and Net Receipts $3.7 $0.0
Retail Sales $7.7 $0.0
Other $2.3 $0.4
TOTAL REVENUES $55.5 $2.1
Source: National Aquarium, Sage Policy Group, Inc.
In 2012, the National Aquarium anticipates welcoming over 1.5 million visitors, with more than 1.3 mil-lion visiting the Baltimore location and 200,000 visiting the Washington, DC location. Approximately 70 percent of visitors to the Baltimore location and nearly 90 percent of the Washington site visitors pur-chased general admission tickets. Other visitors were members of educational and other groups, National Aquarium members, and/or attendees of special events. Please see Chart 3 for relevant statistical detail.
CHART 3: NATIONAL AQUARIUM VISITORS, 2012
BALTIMORE WASHINGTON, DC
MARYLAND RESIDENTS
OUT-OF-STATE RESIDENTS TOTAL TOTAL
General Admissions 308,123 625,582 933,705 183,174
Educational Groups 59,738 48,877 108,615 8,340
Tour Groups 21,848 66,607 88,455 7,594
Members 109,932 42,751 152,683 3,222
Other 35,509 15,218 50,727 2,667
SUBTOTAL 535,150 799,035 1,334,185 204,997
Source: National Aquarium TOTAL VISITORS 1,539,182
THE ECONOMIC CONTRIBUTIONS OF THE NATIONAL AQUARIUM: A 2012 ASSESSMENT 13
7 Economic and fiscal impacts assume that 57.1 percent of visitors stayed in hotels and motels while all remaining visitors stayed in homes of friends and family.
One of the major issues in economic impact modeling is the attribution problem. This is particularly true with respect to tourist destinations. The analytical question revolves around the extent to which visitor spending outside of the facility being studied can be properly attributed to the facility. Fortunately, in the case of the National Aquarium, the attribution problem is not of particular concern. That’s because 88.14 percent of visitors to the Aquarium in Baltimore reported that it was the primary reason for their visit according to the 2012 National Aquarium Annual Summary of Visitor Research by IMPACTS Research & Development (IMPACTS).
Accordingly, for purposes of this impact study, the study team presumed that 88.14 percent of all visitors visited Baltimore with the Aquarium as the main reason for their visit. For the Washington, DC location, the study team assumed that 10 percent of all visitors visited Washington, DC with the Aquarium as the main reason for their visit. Therefore, attributed visitor spending estimates only reflect spending by 88 percent of visitors to the Baltimore location and 10 percent of visitors to the Washington, DC location.
Nearly one out of every three (31.3 percent) visitors to National Aquarium, Baltimore stays overnight in the region. The study team based this estimate on the number of visitors surveyed by IMPACTS who stated they were staying in the area overnight. For the Washington, DC location, the study team assumed no visitors with a primary reason for visiting the Aquarium stayed overnight.
Based on information supplied by IMPACTS and Tourism Economics, the study team estimated the average spending of a visitor to the National Aquarium. According to these sources, the average day trip visitor to the Aquarium spends $109.80 per trip while an overnight visitor spends approximately $372.18 per trip, including $123.78 on lodging.7 The study team assumed similar spending patterns for visitors to both locations.
The study team estimates that visitors to the National Aquarium, Baltimore spend more than $205 million per year while visitors to the Washington, DC location spend more than $3 million per year on lodging, transportation, food, shopping, gas, and recreation. Food and beverage and shopping figures reflect spending on food, concessions, and souvenirs at the Aquarium and recreation figures include ticket sales for the Aquarium. See Chart 5 for related statistical detail.
Visitor spending provides a majority of the impact associated with the National Aquarium facilities, Baltimore and Washington, DC. The section below describes the combined impact of visitor spending and facility operation.
88.14 percent of visitors to the Aquarium in Baltimore reported that it was the primary reason for their visit

14 THE ECONOMIC CONTRIBUTIONS OF THE NATIONAL AQUARIUM: A 2012 ASSESSMENT
CHART 4: VISITOR SPENDING ESTIMATES PER VISITOR
CATEGORY OVERNIGHT (IN MILLIONS) DAY TRIP (IN MILLIONS)
Lodging $123.78 $0.00
Local Transportation $27.38 $11.57
Food and Beverage $98.77 $39.05
Shopping $53.19 $19.52
Gas Stations $9.12 $3.85
Recreation $59.93 $35.81
TOTAL $372.18 $109.80
Sources: IMPACTS Research & Development; Tourism Economics
CHART 5: NATIONAL AQUARIUM ANNUAL VISITOR SPENDING (IN $MILLIONS)
VISITOR SPENDING (IN MILLIONS) BALTIMORE WASHINGTON, DC
OVERNIGHT DAY TRIP DAY TRIP
Lodging $26.0 $0.0 $0.0
Local Transportation $10.1 $9.3 $0.2
Food and Beverage (includes sales in Aquarium) $36.3 $31.5 $0.8
Shopping (includes sales in Aquarium) $19.5 $15.7 $0.4
Fuel $3.4 $3.1 $0.1
Recreation (includes Aquarium admission) $22.0 $28.9 $1.6
NUMBER OF VISITORS WITH AQUARIUM AS MAIN PURPOSE 367,488 806,595 20,500
TOTAL $117.3 $88.6 $3.1
Source: National Aquarium
THE ECONOMIC CONTRIBUTIONS OF THE NATIONAL AQUARIUM: A 2012 ASSESSMENT 15
III. The Economic and Fiscal Impacts of the National Aquarium
A. ECONOMIC IMPACTS
The study team measured the impact of the National Aquarium along four dimensions—output/sales, employment (total and FTE), employee compensation (which includes the value of benefits), and pro-prietor’s income (i.e., business owner income). These impacts are based on 2012 visitor and expenditure statistics with the exception of capital expenditures, for which the study team utilized a five-year average.
Direct job impacts reflect those generated directly by visitor spending, on-site jobs, and those jobs held by contractors that would otherwise be reflected on a corporate or institutional payroll. Sage estimates that the National Aquarium, Baltimore generates 2,257 direct full and part-time jobs (1,894 FTE) annually. An additional 279 jobs are supported citywide annually due to the purchase of a variety of services provided by area businesses to support Aquarium operations (indirect impacts). The Aquarium supports an addi-tional 378 jobs in Baltimore City by enhancing spending in the local economy. These jobs fall within the induced effects category.
Visitor spending and operations support 2,913 jobs (2,483 FTE) in Baltimore City with associated em-ployee compensation of $117.6 million and proprietor income of $7.2 million per year. The National Aquarium, Baltimore also supports $271.7 million in annual sales of goods and services by city businesses once multiplier effects are fully considered.
On a statewide basis, National Aquarium operations and visitor spending support an estimated 3,304 jobs (includes the jobs in Baltimore City) with associated employee compensation of $126.8 million and pro-prietor income of $9.0 million. Businesses statewide benefit from augmented sales of $314 million, with a large fraction of sales taking place in Baltimore City. The impact upon Maryland’s economy is associated with the Baltimore facility. While not reflected in this study, some of the impacts from the Washington, DC facility that do not take place in the District take place in Maryland and Virginia. These include visitor and employee spending and purchases from suppliers that are not located within the District of Columbia.
Visitor spending and the operations of the National Aquarium in Washington, DC support 43 jobs (36 FTE) in the District with associated employee compensation of $2.1 million and proprietor income of $0.1 million. This activity also supports $5.6 million in annual sales of goods and services among Washington, DC businesses.
In total, the National Aquarium generates substantial employment (3,347 jobs) and economic impacts ($319.6 million) annually to the State of Maryland, the City of Baltimore, and Washington, DC. Chart 6 further details the employment and economic impacts of both locations.
16 THE ECONOMIC CONTRIBUTIONS OF THE NATIONAL AQUARIUM: A 2012 ASSESSMENT
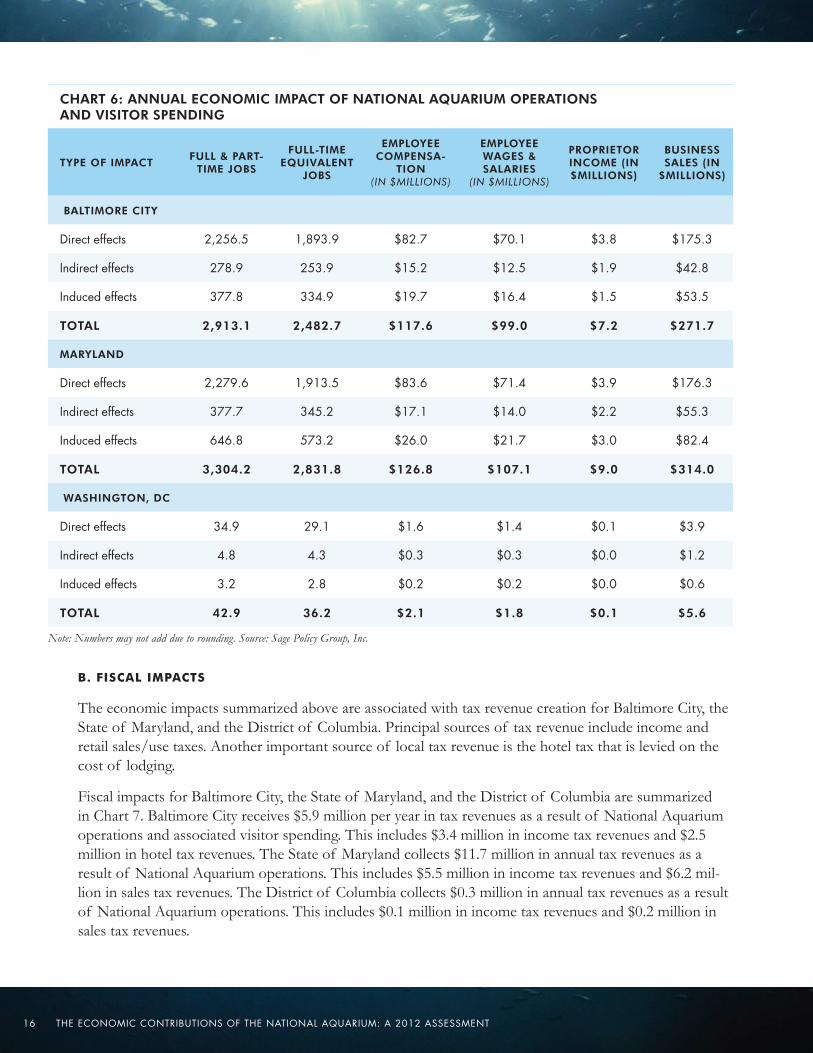
CHART 6: ANNUAL ECONOMIC IMPACT OF NATIONAL AQUARIUM OPERATIONS AND VISITOR SPENDING
TYPE OF IMPACT FULL & PART-TIME JOBS
FULL-TIME EQUIVALENT
JOBS
EMPLOYEE COMPENSA-
TION (IN $MILLIONS)
EMPLOYEE WAGES & SALARIES
(IN $MILLIONS)
PROPRIETOR INCOME (IN $MILLIONS)
BUSINESS SALES (IN
$MILLIONS)
BALTIMORE CITY
Direct effects 2,256.5 1,893.9 $82.7 $70.1 $3.8 $175.3
Indirect effects 278.9 253.9 $15.2 $12.5 $1.9 $42.8
Induced effects 377.8 334.9 $19.7 $16.4 $1.5 $53.5
TOTAL 2,913.1 2,482.7 $117.6 $99.0 $7.2 $271.7
MARYLAND
Direct effects 2,279.6 1,913.5 $83.6 $71.4 $3.9 $176.3
Indirect effects 377.7 345.2 $17.1 $14.0 $2.2 $55.3
Induced effects 646.8 573.2 $26.0 $21.7 $3.0 $82.4
TOTAL 3,304.2 2,831.8 $126.8 $107.1 $9.0 $314.0
WASHINGTON, DC
Direct effects 34.9 29.1 $1.6 $1.4 $0.1 $3.9
Indirect effects 4.8 4.3 $0.3 $0.3 $0.0 $1.2
Induced effects 3.2 2.8 $0.2 $0.2 $0.0 $0.6
TOTAL 42.9 36.2 $2.1 $1.8 $0.1 $5.6
Note: Numbers may not add due to rounding. Source: Sage Policy Group, Inc.
B. FISCAL IMPACTS
The economic impacts summarized above are associated with tax revenue creation for Baltimore City, the State of Maryland, and the District of Columbia. Principal sources of tax revenue include income and retail sales/use taxes. Another important source of local tax revenue is the hotel tax that is levied on the cost of lodging.
Fiscal impacts for Baltimore City, the State of Maryland, and the District of Columbia are summarized in Chart 7. Baltimore City receives $5.9 million per year in tax revenues as a result of National Aquarium operations and associated visitor spending. This includes $3.4 million in income tax revenues and $2.5 million in hotel tax revenues. The State of Maryland collects $11.7 million in annual tax revenues as a result of National Aquarium operations. This includes $5.5 million in income tax revenues and $6.2 mil-lion in sales tax revenues. The District of Columbia collects $0.3 million in annual tax revenues as a result of National Aquarium operations. This includes $0.1 million in income tax revenues and $0.2 million in sales tax revenues.
THE ECONOMIC CONTRIBUTIONS OF THE NATIONAL AQUARIUM: A 2012 ASSESSMENT 17
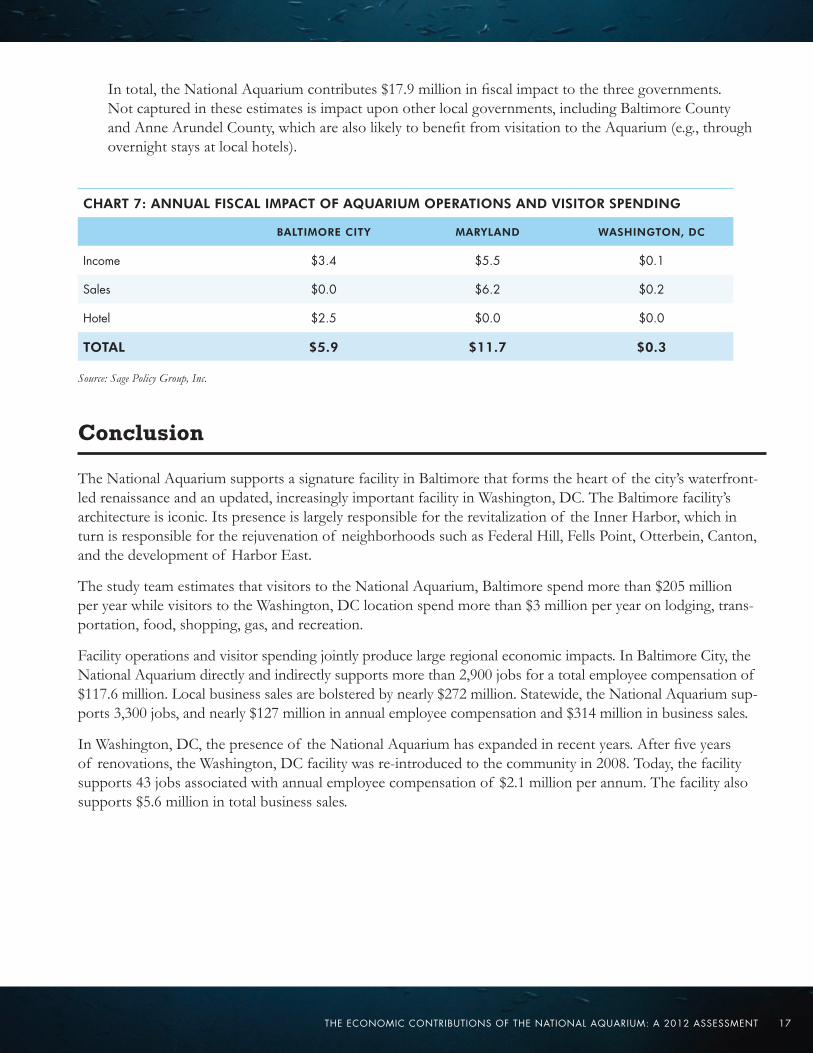
In total, the National Aquarium contributes $17.9 million in fiscal impact to the three governments. Not captured in these estimates is impact upon other local governments, including Baltimore County and Anne Arundel County, which are also likely to benefit from visitation to the Aquarium (e.g., through overnight stays at local hotels).
CHART 7: ANNUAL FISCAL IMPACT OF AQUARIUM OPERATIONS AND VISITOR SPENDING
BALTIMORE CITY MARYLAND WASHINGTON, DC
Income $3.4 $5.5 $0.1
Sales $0.0 $6.2 $0.2
Hotel $2.5 $0.0 $0.0
TOTAL $5.9 $11.7 $0.3
Source: Sage Policy Group, Inc.
Conclusion
The National Aquarium supports a signature facility in Baltimore that forms the heart of the city’s waterfront-led renaissance and an updated, increasingly important facility in Washington, DC. The Baltimore facility’s architecture is iconic. Its presence is largely responsible for the revitalization of the Inner Harbor, which in turn is responsible for the rejuvenation of neighborhoods such as Federal Hill, Fells Point, Otterbein, Canton, and the development of Harbor East.
The study team estimates that visitors to the National Aquarium, Baltimore spend more than $205 million per year while visitors to the Washington, DC location spend more than $3 million per year on lodging, trans-portation, food, shopping, gas, and recreation.
Facility operations and visitor spending jointly produce large regional economic impacts. In Baltimore City, the National Aquarium directly and indirectly supports more than 2,900 jobs for a total employee compensation of $117.6 million. Local business sales are bolstered by nearly $272 million. Statewide, the National Aquarium sup-ports 3,300 jobs, and nearly $127 million in annual employee compensation and $314 million in business sales.
In Washington, DC, the presence of the National Aquarium has expanded in recent years. After five years of renovations, the Washington, DC facility was re-introduced to the community in 2008. Today, the facility supports 43 jobs associated with annual employee compensation of $2.1 million per annum. The facility also supports $5.6 million in total business sales.

18 THE ECONOMIC CONTRIBUTIONS OF THE NATIONAL AQUARIUM: A 2012 ASSESSMENT
These economic contributions produce positive fiscal impacts. In the City of Baltimore, Aquarium operations support nearly $6 million in annual tax revenues. The State of Maryland receives $11.7 million in annual tax revenues from the Aquarium. City and State fiscal impacts are mutually exclusive. The Aquarium supports $0.3 million in fiscal impact in Washington, DC. Collectively, the Aquarium supports $17.9 million in fiscal impact for these three governments.
From an economic and policy perspective, the National Aquarium is worthy of continued support. Further expansion in operations would generate additional economic impact. In order to continue to attract visitors from around the world and remain a vibrant economic engine, the National Aquarium requires the continued support of the broader public, policymakers, and major donors. The economic and fiscal impacts quantified throughout this report enable stakeholders to understand how important that support is in terms of employ-ment, income, and tax revenues.
Appendix
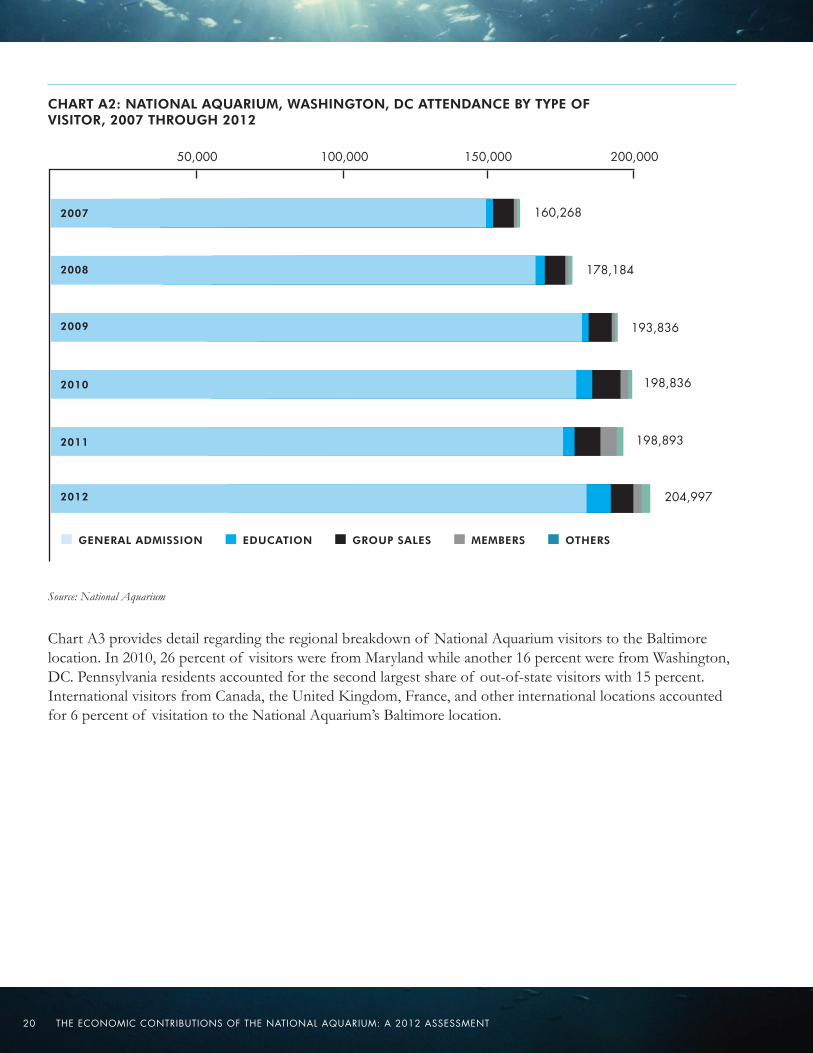
Charts A1 and A2 provide additional detail regarding attendance figures for the two National Aquarium locations for the years 2007-2012. Attendance at the National Aquarium, Baltimore has slipped 9.4 percent since 2007 when attendance stood at 1.46 million visitors, likely a reflection of the economic downturn, but grew 1.4 percent over last year’s total. With the exception of 2011, attendance at the Washington, DC location has been increasing each year with 2012 attendance 27.9 percent higher than in 2007.

THE ECONOMIC CONTRIBUTIONS OF THE NATIONAL AQUARIUM: A 2012 ASSESSMENT 19
CHART A1: NATIONAL AQUARIUM, BALTIMORE ATTENDANCE BY TYPE OF VISITOR, 2007 THROUGH 2012
Source: National Aquarium
30,000 60,000 90,000 120,000 150,000
1,459,726 2007
GENERAL ADMISSION EDUCATION GROUP SALES MEMBERS OTHERS
1,431,0772008
1,448,7182009
1,342,1752010
1,315,3552011
1,334,1852012
20 THE ECONOMIC CONTRIBUTIONS OF THE NATIONAL AQUARIUM: A 2012 ASSESSMENT
CHART A2: NATIONAL AQUARIUM, WASHINGTON, DC ATTENDANCE BY TYPE OF VISITOR, 2007 THROUGH 2012
Source: National Aquarium
Chart A3 provides detail regarding the regional breakdown of National Aquarium visitors to the Baltimore location. In 2010, 26 percent of visitors were from Maryland while another 16 percent were from Washington, DC. Pennsylvania residents accounted for the second largest share of out-of-state visitors with 15 percent. International visitors from Canada, the United Kingdom, France, and other international locations accounted for 6 percent of visitation to the National Aquarium’s Baltimore location.
160,268
178,184
193,836
198,836
198,893
204,997
2007
2008
2009
2010
2011
2012
GENERAL ADMISSION EDUCATION GROUP SALES MEMBERS OTHERS
50,000 100,000 150,000 200,000

THE ECONOMIC CONTRIBUTIONS OF THE NATIONAL AQUARIUM: A 2012 ASSESSMENT 21
CHART A3: 2011 NATIONAL AQUARIUM, BALTIMORE VISITOR ORIGIN
*Baltimore Area refers to Baltimore City and Baltimore metropolitan suburbs Source: National Aquarium
23%Maryland,
Baltimore Area*
15%Pennsylvania
6%International
16%Washington, DC
5%New York
3%Delaware
5%New Jersey
20%Other States
4%Virginia
3%Maryland, Outside
Baltimore Area

22 THE ECONOMIC CONTRIBUTIONS OF THE NATIONAL AQUARIUM: A 2012 ASSESSMENT
The chart below provides additional detail regarding the economic impact of the National Aquarium. Specifically, the chart provides insight into the different economic impacts of operations and visitor spending.
CHART A4: BREAKDOWN OF ECONOMIC IMPACT OF NATIONAL AQUARIUM, 2012
OPERATIONS
TYPE OF IMPACT FULL & PART-TIME JOBS
FULL-TIME EQUIVALENT
JOBS
EMPLOYEE COMPENSATION
(IN $MILLIONS)
EMPLOYEE WAGES & SALARIES
(IN $MILLIONS)
PROPRIETOR INCOME
(IN $MILLIONS)
BUSINESS SALES
(IN $MILLIONS)
BALTIMORE CITY
Direct effects 442.4 377.8 $25.6 $22.0 $1.4 $52.9
Indirect effects 104.0 95.4 $5.6 $4.7 $0.8 $16.4
Induced effects 122.6 108.7 $6.4 $5.3 $0.5 $17.4
TOTAL 668.9 581.8 $37.6 $32.0 $2.7 $86.7
MARYLAND
Direct effects 450.7 384.9 $26.1 $22.4 $1.4 $52.9
Indirect effects 136.8 125.5 $5.8 $4.8 $0.9 $20.0
Induced effects 221.7 196.5 $8.9 $7.4 $1.0 $28.2
TOTAL 809.2 706.9 $40.8 $34.6 $3.3 $101.2
WASHINGTON, DC
Direct effects 16.8 14.0 $1.0 $0.9 $0.0 $2.6
Indirect effects 3.7 3.4 $0.3 $0.2 $0.0 $0.9
Induced effects 2.1 1.8 $0.1 $0.1 $0.0 $0.4
TOTAL 22.5 19.1 $1.4 $1.2 $0.0 $3.9

THE ECONOMIC CONTRIBUTIONS OF THE NATIONAL AQUARIUM: A 2012 ASSESSMENT 23
VISITOR SPENDING
TYPE OF IMPACT FULL & PART-TIME JOBS
FULL-TIME EQUIVALENT
JOBS
EMPLOYEE COMPENSATION
(IN $MILLIONS)
EMPLOYEE WAGES & SALARIES
(IN $MILLIONS)
PROPRIETOR INCOME
(IN $MILLIONS)
BUSINESS SALES
(IN $MILLIONS)
BALTIMORE CITY
Direct effects 1,814.1 1,516.2 $57.1 $48.1 $2.4 $122.4
Indirect effects 174.9 158.6 $9.6 $7.8 $1.1 $26.4
Induced effects 255.2 226.2 $13.3 $11.1 $1.0 $36.2
TOTAL 2,244.2 1,900.9 $80.0 $67.1 $4.5 $185.0
MARYLAND
Direct effects 1,828.8 1,528.5 $57.5 $49.0 $2.4 $123.4
Indirect effects 240.9 219.7 $11.3 $9.2 $1.3 $35.3
Induced effects 425.1 376.7 $17.1 $14.2 $1.9 $54.1
TOTAL 2,494.8 2,124.8 $85.9 $72.4 $5.7 $212.8
WASHINGTON, DC
Direct effects 18.2 15.2 $0.5 $0.5 $0.1 $1.3
Indirect effects 1.1 1.0 $0.1 $0.1 $0.0 $0.3
Induced effects 1.1 1.0 $0.1 $0.1 $0.0 $0.2
TOTAL 20.3 17.1 $0.7 $0.6 $0.1 $1.7
Note: Numbers may not add due to rounding. Source: Sage Policy Group, Inc.
Baltimore, MD501 E. PRATT STREETBALTIMORE, MARYLAND, 21202410-576-3800TTY/TDD: 410-727-3022
Washington, DCCOMMERCE BUILDING, ROOM B-07714TH AND CONSTITUTION AVENUE, NWWASHINGTON, DC 20230 202-482-2825
aqua.org100% Recycled Fiber
We inspire conservation of the world’s aquatic treasures.