economic contributions report 2016
TRANSCRIPT

Barrick Gold Corporation
Economic Contributions Report 2016
Advancing
Together

ii Barrick Gold Corporation 2016 Economic Contributions Report
Sustainability Vision
We partner with host governments and
communities to transform their natural
resources into sustainable benefits and
mutual prosperity.
We aim to be a welcome and trusted
partner of host governments and
communities, the most sought-after
employer, and the natural choice for
long-term investors.

1 2016 Economic Contributions Report Barrick Gold Corporation
About This Report 1
Fast Facts 2
CSO Statement 3
Our Approach to 4
Social and Economic
Development
Taxes and Government 6
Royalties
Local Purchases 10
Local Employment 12
Community 13
Investments
Barrick Around 14
the World
Extractive Sector 28
Transparency Measures
Act Report
In This Report
About This Report
This is Barrick’s inaugural Economic Contributions Report.
Through this and future reports, we aim to show our prog-
ress in generating economic value for our stakeholders.
The report describes in detail how Barrick’s policies and
management systems support the social and economic
development of the countries and communities where we
operate, including our tax strategy, our efforts to prioritize
local employment and local procurement, and our com-
munity investments. We report on these metrics for the
Company as a whole, and for each country where we
operate.
Report Parameters
To ensure consistency and comparability between ourselves
and other mining companies, Barrick uses the World Gold
Council’s Guidance Note on Expenditure Definitions and re-
ports to the Global Reporting Initiative’s (GRI) Sustainability
Reporting Standards, in accordance with the Core option.
Expenditure data is provided on an accrual basis. The data
in this report covers the 2016 calendar year, which corre-
sponds to Barrick’s financial year, and all information in this
report is current as of December 31, 2016, unless otherwise
indicated. This report and accompanying data tables con-
tain information on all of Barrick’s wholly-owned operations
and joint ventures where we are the operator, as well as on
our country and corporate offices, projects, and closure
sites. We report on 100 percent of the data from joint-ven-
ture operations where we are the operator. All currency
amounts in this report are expressed in U.S. dollars, unless
otherwise indicated.

2 Barrick Gold Corporation 2016 Economic Contributions Report
Fast Facts
51% of Barrickemployees came from the local communities near our mines in 2016.
Barrick contributed
$1.1 billion in taxes and royalties to governments in 2016.
Barrick created a local Content Framework to help our sites develop effective local employment and procurement programs.
In 2016, 85% ofthe goods and services Barrick purchased in 2016 (by dollar value) are from local, regional, or national suppliers.
In 2016, Barrick contributed more than
$5.2 billion inpurchases, taxes,
wages, and other expenditures in the countries in
which we operate.
Less than
3%of Barrick employees are foreign nationals.
Barrick invested nearly
$8million in educational initiatives and partnerships in 2016, including providing nearly 1,500 scholarships.
In 2016, Barrick paid almost
$1.4 billion
in wages and related expenditures to employees.
Barrick purchased more than
$220 million ofgoods and services from the local communities near our mines in 2016.

3 2016 Economic Contributions Report Barrick Gold Corporation
In doing so, we are intentionally challenging preconceived
ideas about our industry — that, by definition and by deed,
it can only extract value. We have a fundamentally different
view: our mining activities can and must add value every-
where we operate. And we are in the best position to do
that when we understand our partners’ interests and align
them with our own.
In publishing this inaugural Economic Contributions Report,
our aim is to better communicate the range of economic
contributions we make in the countries and communities
where we operate, and share our progress in generating
significant value for all our partners.
This value comes in many forms, such as the taxes and roy-
alties that we pay, which totaled more than $1.1 billion in
2016. Governments use these funds to invest in important
infrastructure like roads and to improve basic services like
health and education. In many of the countries where we
operate, the taxes and royalties we pay are significant
sourc-es of government revenue. For example, the Pueblo
Viejo mine in the Dominican Republic is now the country’s
largest tax payer, paying close to half of the national
corporate tax.
It also comes in the form of the good-paying jobs for our
11,000-plus employees; in 2016, the wages and benefits
they received were almost $1.4 billion. With 97 percent of
our employees coming from the countries and
communities where we operate, we are creating
meaningful contribu-
tions to local and national economies. Working in part-
nership, our Human Resources and Community Relations
teams are continuing to create even more opportunities for
local people to participate either directly in our operations
or with our contractor partners.
Important value is also derived from the goods and services
we purchase from our more than 20,000 suppliers. In 2016,
these in-country purchases totaled almost $2.7 billion,
including $220 million from suppliers coming from local
communities near our operations, leading to further posi-
tive economic outcomes in local and regional economies.
In addition to these significant direct contributions, our
digital transformation has helped open new opportunities
in the communities where we operate. One example is
the inaugural Barrick-Cisco networking academy that we
launched in Elko, Nevada, in early 2017. This partnership
will bring digital and information technology skills courses,
free of charge to our employees, their families, and other
local Nevadans. And Nevada is just the start. We will create
similar digital skills development partnerships with Cisco in
Argentina, Peru, and everywhere else we work.
I invite you to read our 2016 Economic Contributions
Report. If you have any feedback or suggestions for future
reports, please contact me at [email protected].
Peter Sinclair
Chief Sustainability Officer
Chief Sustainability Officer’s Message
At Barrick, our strategy to be a sustainable, leading 21st century company is clear: we partner with host governments and commu-nities to transform their natural resources into sustainable benefits and mutual prosperity.

4 Barrick Gold Corporation 2016 Economic Contributions Report
Communities and host governments rightly expect to share
in mining’s benefits. When we live up to their expectations,
we are partners with host governments and communities in
their own development, contributing to a more stable and
prosperous society, and a more secure license to operate.
We contribute in a number of ways to the social and
economic development of the communities and countries
where we operate, including through buying and hiring
locally, investing in education and health, helping diversify
livelihoods, and paying our fair share of taxes.
Barrick has established Company-wide systems and stan-
dards to help us live up to our community and government
partners’ expectations.
• Barrick has a Local Procurement and Contracting
Standard which requires our Community Relations and
Supply Chain teams to develop the capacity of local
and regional suppliers and help them improve their
access to mine contracts and supplier opportunities.
• Barrick requires site Community Relations and Human
Resources teams to develop Local Employment Plans
which help create more opportunities for local people
to work at our mines.
• Our Local Content Framework also helps sites use more
local labor and buy more local goods and services. The
framework is a guide, outlining the steps to develop
local employment and local procurement programs and
referencing best international practice. It helps sites be
better partners in community and socio-economic de-
velopment, which ultimately helps build a more secure
license to operate.
• The significant taxes and royalties derived from mining
operations are important sources of government
revenue, used for infrastructure projects, health care,
education, and other important public services. Our Tax
Management Policy sets out global standards and pro-
vides guidance on tax risk management. Everywhere we
operate, we pay our fair share of taxes and royalties to
all levels of government.
By doing this, we add value and create prosperity for our
employees, our government and community partners, and
our shareholders.
Our Approach to Social and Economic Development
Barrick has an opportunity to contribute significantly to social and economic development in the communities and countries where we operate.

5 2016 Economic Contributions Report Barrick Gold Corporation
SPend exPloration ConStruCtion early oPeration oPerationS CloSure
JoBs
Few people employed as most work is automated or highly technical.
Highest number of people employed as there is increased activity around the mine site.
Fewer people required than during construc-tion. Employment stabilizes once produc-tion begins.
Stable number of employees to support successful, efficient production.
Employment slowly declines as production winds down and the mine closes.
Goods And sERviCEs
Goods and services spend is lowest during exploration due to minimal activity.
Goods and services spend is highest to support the mine’s construction.
Goods and services spend fluctuates de-pending on the mine’s needs as production begins.
Goods and services spend stabilizes as the supply chain has been established and normal production continues.
Goods and services spend decreases as mine activity slows and eventually closes.
PAymEnTs To GovERn-mEnTs
Few taxes paid due to lack of produc-tion. Some payments related to exploration licenses and value added taxes.
Few taxes paid due to lack of production. Indirect taxes generat-ed through purchases of goods and services.
Payments related to royalties on produc-tion. Generally lower corporate income tax paid as mine is still paying back capital invested in construc-tion.
Significant taxes paid through production for example, royalties, and corporate income taxes.
Few taxes paid as mine is no longer producing.
AT BARRiCk Our Alturas project has developed a local employment plan. To date, the program at Alturas has seen local hiring increase from 8% to 30%, and is ex-pected to reach 38% in 2017.
At Pueblo Viejo, 11,000 indirect jobs are estimated to have been created as a result of the mine’s construction phase. In 2014, 2.2% of the national GDP growth was attributable to the Pueblo Viejo mine.
The Pueblo Viejo mine has steadily increased the proportion of employees who are Dominican nationals - from 90% in 2012 to 95% in 2016.
In Nevada, Barrick has partnered with Cisco and Great Basin College to bring free digital education to employees and local- Nevadans. This is a critical step in our digital transforma-tion to ensure we are building a sustainable, skilled workforce to support our business in the future.
As part of Pierina’s closure program, 84% of leaders from 19 local companies have been trained in pro-duction, finance, and sales. Moreover, all 19 local companies that the mine works with have been trained in marketing, commercial communications, ten-ders, and commercial tools.
Exploration
Construction
Early operation
operations
Closure
value Chain

6 Barrick Gold Corporation 2016 Economic Contributions Report
Barrick’s sustainability vision is clear: We intend to partner
with host governments and communities to transform
their natural resources into sustainable benefits and mutual
prosperity. Paying a fair and appropriate share of taxes is
essential to putting this into practice. The taxes and royalties
we pay can be a significant source of revenue, helping to
build infrastructure and fund social programs, driving both
their economic growth and social development.
Barrick aspires to be viewed as a compliant taxpayer by the
tax authorities in each and every jurisdiction in which we
operate. Moreover, Barrick believes in proactively building
relationships with the local tax authorities on the basis of
transparency and open communications. Barrick also seeks
to organize its tax affairs in the most tax-effective and
tax-efficient manner possible within the law and in relation
to Barrick’s business operations and commercial objectives.
To put these principles into action, Barrick has in place a
Company-wide tax management policy. The policy sets out
global standards and provides guidance on tax risk manage-
ment. The aim is to ensure that Barrick is a low-risk compa-
ny by having a high expectation of comprehensive techni-
cal tax analysis and factual due diligence on ongoing tax
matters in order to mitigate the risks associated with local
tax rules, as well as political and reputational risks.
Taxes and Government Royalties
Transparency
Barrick believes that revenue transparency can be a powerful tool against corruption and in support of ethical
business conduct. Barrick was the first Canadian mining company to be a signatory to the Extractive Industries
Transparency Initiative (EITI). Since 2006, we have voluntarily reported detailed country-by-country information, in-
cluding environmental and social data, and the taxes and royalties we have paid to governments around the world.
In 2014, Barrick joined with our industry peers, NGOs, and the Canadian government to advocate for and develop
comprehensive legislation in Canada on revenue transparency in the extractive industry. The resulting legislation –
the Extractives Sector Transparency Measures Act (ESTMA) – has entered into force.
In this, Barrick’s inaugural Economic Contributions Report, we report on the value we bring to the communities and
countries where we operate. The Company has also published its inaugural ESTMA report (reproduced in Appendix
A) detailing the payments made in 2016 to governments related to the commercial development of mining.
taxeS and Government royaltieS - 2016
ARGEnTinA $ 108,590,000
CAnAdA $ 10,680,000
ChilE $ 5,380,000
dominiCAn REPuBliC $ 394,390,000
PERu $ 118,450,000
uniTEd sTATEs $ 373,520,000
ZAmBiA $ 89,780,000
barriCk total $ 1,100,790,000

7 2016 Economic Contributions Report Barrick Gold Corporation
Relevant mining Tax Regimes
Country CorPorate tax rate Government royalty other taxeS
ARGEnTinA 35%. 3% of modified net smelter royalty.
Gross revenue tax of 3.6% + 0.4% for mining.
CAnAdA 25% (15% federal + 10% Ontario manufacturing rate (otherwise 11.5%)).
– Ontario mining tax – 8.5% (after application of minimum processing allowance).
ChilE 24% for 2016, 25% for 2017, and 27% for 2019 and subse-quent years (distribution regime).
Combined corporate and share-holder level tax remains at 35%.
Mining Royalty ranges from 5% to 14% based on operating margin (operating results / gross sales); rate applied to operating income.
–
dominiCAn REPuBliC Special Lease Agreement – 25% (27% per general regime).
3.2% net smelter royalty (for gold and silver).
Net profit interest – of 28.75% generally applied on cash flow which includes a deduction for income tax but interest expense is not deductible.
PERu 29.5% for 2017 and subse-quent years, changed from 28% for 2015/16.
As Lagunas Norte is subject to 2.51% NSR royalty, general mining royalty regime is not applicable.
Specific Tax on Mining, marginal rates ranging from 2% to 8.4% applicable on operating margin.
uniTEd sTATEs Higher of 35% regular tax and 20% alternative minimum tax (federal only).
– Nevada net proceeds tax ranges from 2% to 5%. Barrick’s Nevada operations are subject to the maximum 5% rate.
ZAmBiA 30% income tax rate. Mineral royalty rates are 4% for copper below $2.04/lb; 5% at copper prices between $2.04 and $2.72/lb; and 6% at a cop-per price of $2.72/lb and above, of gross metal value which is determined with reference to the monthly average London Metal Exchange cash price.
Export tax of 10% on copper concentrates unless processed by Zambian smelters.

8 Barrick Gold Corporation 2016 Economic Contributions Report
The Pueblo Viejo mine in the Dominican Republic
showcases the significant contributions mining
can make to local and national economies.
The mine is located approximately 100 kilometers
northwest of the capital city of Santo Domingo, on a
site that was previously operated by the Dominican
government from 1979-1999. While mining activ-
ity at the site dates back to the 1500s, mining has
not traditionally been a critical part of the national
economy of the Dominican Republic. In 2003, Placer
Dome acquired the right to build and operate the
Pueblo Viejo mine for a 25-year period and in 2006,
Barrick acquired Placer Dome and is now the operator,
holding a 60% interest, with Goldcorp owning the
remaining 40% interest.
Construction
The initial investment required for the construction of
the mine was $4 billion and represented the largest
foreign investment in the country’s history – and the
largest foreign direct investment ever made in the
Caribbean. This investment, allocated for the 4-year
construction phase (2009-2012), represented around
5% of the country’s GDP and, while under construc-
tion, the mine employed more than 10,000 people.
Construction of the Pueblo Viejo mine created econom-
ic activity which led to direct improvements in the qual-
ity of life in communities near the mine site: between
2008 and 2014 the neighboring provinces of Sanchez
Ramirez and Monseñor experienced the largest reduc-
tion in populations with very low incomes, the greatest
increase in populations in mid- to high-incomes, and the
fastest private income growth in the country.1
local Employment and Procurement
Though while operating the mine requires a signifi-
cantly smaller workforce than while under construc-
tion, the site has worked to make sure that as much of
the workforce as possible is local. For example, Pueblo
1 Source: Analytica (2014)
CaSe Study / PuEBlo viEJo
DOMINICAN REPUBLIC

9 2016 Economic Contributions Report Barrick Gold Corporation
Viejo has put in place an operator technical train-
ing program for potential employees. The program
assesses an individual’s skills and builds customized
technical training which develops the right capabilities
to operate equipment at the mine. Operators are able
to continue accessing the training center throughout
their career, thereby expanding their skill sets and pro-
gressing their training. As part of this program, Pueblo
Viejo opened a new training center with equipment
and simulators to help expedite the training process in
the summer of 2016. Today, through this and other
initiatives, nearly 95% of the 2,000 employees at
Pueblo Viejo are Dominican, with more than 700 of
these people from the local communities near the site.
Pueblo Viejo strives to use goods and services from
Dominican businesses in order to meet the mine’s
needs. While overall purchases have decreased since
construction, the site has increased the percentage of
spending on national suppliers from 36% in 2014 to
50% in 2016. And of the $250 million the site spent
in the Dominican Republic in 2016, more than $19
million was spent on purchases from suppliers in the
local communities near the site. Though a small por-
tion of our total procurement, these local investments
have made a significant impact in the community.
Before Barrick arrived there were approximately 30
companies in the local chamber of commerce. Now
there are over 350.
Indirect benefits of the mine extend across the country.
It has been estimated that for every position created at
the mine, approximately six to eight indirect new jobs
are created in surrounding businesses. In 2014, it was
estimated that the mine generated more than $1.7 bil-
lion to the economy– 57% directly, and 43%
indirectly. Of this, 64% of the value remained in the
Dominican Republic. During the same year, a 2.2%
increase in the national GDP was attributed to the
mine.2
2 Source: Analytica (2014)
Taxes and Royalties
Pueblo Viejo is one of the most significant sources of
government revenue in the Dominican Republic. In
June 2009, the Company signed a special lease agree-
ment (SLA) with the Dominican government, estab-
lishing the tax and royalty structure under which the
mine was to operate. In 2013, the government of the
Dominican Republic expressed a desire to accelerate
and increase the benefits that the Dominican Republic
will derive from the Pueblo Viejo mine. The Company
engaged in dialogue with representatives of the gov-
ernment in an effort to achieve a mutually-acceptable
outcome. In the third quarter of 2013, the Company
and the Dominican government finalized the second
amendment to the SLA, which became effective on
October 5, 2013, and has resulted in additional and
accelerated tax revenues to the Dominican govern-
ment. Since 2013, the Company has contributed more
than $1.3 billion in taxes and royalties to the govern-
ment of the Dominican Republic. Pueblo Viejo is now
the country’s largest tax payer, paying close to half of
the national corporate tax income.
Community investments
Pueblo Viejo has initiated an innovative approach to
supporting community development near the mine
site. We have entered into a multi-party partnership
with the municipal governments surrounding the mine
(Fantino, Cotuí, and Maimón), the Dominican
Federation of Municipalities, the Canadian Embassy,
and a local NGO, to facilitate the development of
Municipal Development Plans (MDPs). MDPs are creat-
ed in a transparent and participatory process whereby
communities set priorities for how to use mining rev-
enue, as well as develop the capacity to manage and
allocate that revenue in a transparent and democratic
way. Since each community approved its respective
MDP in local referendums, more than 600 municipal
projects have been delivered across 48 municipalities
and communities, benefiting an estimated 65,000
community members.
10 Barrick Gold Corporation 2016 Economic Contributions Report
Local Purchases
We believe that responsible economic development can
and should improve the lives of stakeholders in the regions
where we operate. When done responsibly, econom-
ic development is a contributor to a broad spectrum of
positive impacts. Through local procurement, for exam-
ple, the presence of our operations can directly help host
communities and individuals enjoy the rights to work, to
food and property, and to an adequate standard of living.
We developed a Local Procurement Standard in 2013. The
Standard was implemented in 2014 under the direction of
the Community Relations group.
To support these efforts, Barrick has also put in place a
Local Content Framework. The development of the frame-
work was a collaboration with all groups impacted by local
content policies, including Supply Chain leads, Community
Relations, Human Resource leads, mine General Managers,
country Executive Directors, construction managers, and
Project Directors. This framework outlines the steps needed
to develop local employment and local procurement pro-
grams, referencing best international practice and embed-
ding lessons learned from other Barrick sites. An important
emphasis is on engaging with internal end users on the
mine site, and making sure local content programs align
with their needs and concerns.
Along with buying locally when possible, Barrick often
works with regional government economic development
committees, where they exist, to help our suppliers diver-
sify so that the eventual closure of a mine will not impose
undue hardships on local businesses.
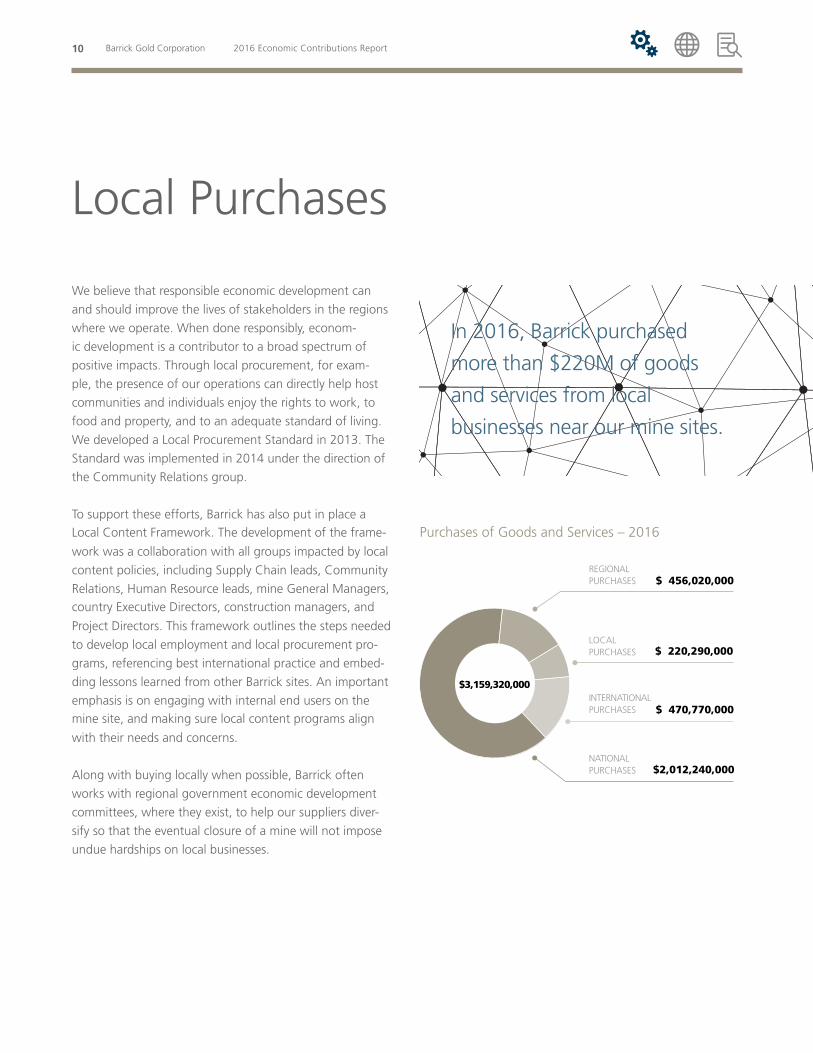
In 2016, Barrick purchased
more than $220M of goods
and services from local
businesses near our mine sites.
$ 220,290,000
$ 470,770,000
$ 456,020,000
$2,012,240,000
Purchases of Goods and Services – 2016
LOCALPURCHASES
INTERNATIONALPURCHASES
NATIONALPURCHASES
REGIONALPURCHASES
$3,159,320,000

11 2016 Economic Contributions Report Barrick Gold Corporation
As a way of promoting and marketing business enterprises in the area, the Lumwana mine
facilitat-ed a local business fair in 2016. The fair brought together local small- and medium-sized
enterprises, smallholder farmers, cooperative societies, micro-finance institutions, private agencies
and government agencies to showcase business opportunities in the area. A total of 175 micro-
and small-scale entrepreneurs participated in the fair, which was officiated by the Commissioner of
Kalumbila District.
SPotliGht / Zambia

12 Barrick Gold Corporation 2016 Economic Contributions Report
A diverse workforce encourages creativity and innovation.
We draw our workforce from many countries around the
world, including each country where we operate, with the
result that our global workforce is extremely diverse in terms
of national and ethnic backgrounds. We are also commit-
ted to the localization of our workforce. To this end, Barrick
requires sites to develop plans to guide local employment
efforts over the life of the mine, and in 2016 the majority of
our workforce was from the local areas near our operations.
Our Human Resources teams develop and lead these local
employment plans, supported by the Community Relations
group. In general, these plans integrate recruitment and re-
tention of local employees into the broader human resourc-
es approach. This includes an assessment of the skills and
capabilities available in the local community, the develop-
ment of recruitment and retention programs targeted spe-
cifically at local communities, guidance on helping address
skills shortages, and the creation of a culturally appropriate
work environment.
In addition to the Local Procurement and Contracting
Standard, we have also developed a Local Content
Framework to further support the efforts of our Supply
Chain and Human Resources teams. The Framework details
the steps that sites can take to develop effective local em-
ployment and local procurement programs, which reflects
international best practice.
By bringing together women and men from diverse back-
grounds and giving each person the opportunity to
contribute his or her skills, experience, and perspectives,
we believe we are able to deliver the best solutions to our
challenges.
Local Employment
Local Employment – 2016
LOCAL 51%
REGIONAL 17%
FOREIGNNATIONAL 3%
NATIONAL 29%
Successful construction and operations are driven by planning for local employment and procurement
as early as possible in the study phase. In the pre-feasibility stage, the site has enough information to
develop a general plan and forecast for local employment and procurement. For example, our Alturas
project – despite being in very early stages – has already developed a local employment plan. Capacity
building and training are an important focus in the study phase in order to take advantage of the sig-
nificant employment and supplier opportunities that come during construction. To date, the program at
Alturas has seen local hiring increase from 8% to 30%, and is expected to reach 38% in 2017.
SPotliGht / Chile

13 2016 Economic Contributions Report Barrick Gold Corporation
Community development programs undertaken in collabo-
ration with – and reflecting the interests of – host commu-
nities, governments, civil society, suppliers, and others, can
help mitigate social risk, improve our ability to sustain a li-
cense to operate, and generate long-term, sustainable value.
Barrick’s community development programs are designed to
fulfill social obligations, mitigate social impacts and social
risks, and support community priorities. Our community de-
velopment activities are also planned with closure in mind.
We take a partnership approach to our community in-
vestments, which relies on knowing what matters to our
partners – including communities, governments, NGOs,
and others – and reflecting those interests in our programs,
partnerships, and initiatives. This means clearly defining
roles, responsibilities and resources, and spelling these out
in Memoranda of Understandings (MoUs).
Community Investments
At the Lumwana mine, the site identified an increase in trespass incidents into the mine site in 2016. Community
members had been caught fishing from the water storage facility and tailings sediment facility. Beyond the signif-
icant safety risks inherent in pedestrians trespassing in an active mine site, the issue was also a source of commu-
nity tension: activities undertaken to prevent trespassing were seen as denying community members a source of
livelihood. In response, the mine site has developed a program to promote community fish farming to address the
need for fish while avoiding the need to trespass. After being trained in fish farming, Barrick supported the con-
struction of 12 demonstration ponds stocked with 3,000 fingerlings. It is expected the pilot will be ready for use
in late 2017, after the fish have grown. If successful, two dams will be constructed to further expand fish farming
in the community. Thus, this project will transform the community’s ability to access fish, and tremendously
reduce the rate of trespassing onto the mine site.
SPotliGht / Zambia
Community Investments – 2016
ECONOMIC DEVELOPMENT $5,030,000
EDUCATION $7,580,000
OTHER ACTIVITIES $2,330,000
COMMUNITY ENGAGEMENT $1,430,000
ARTS, CULTURE & SPORTS $1,120,000
HEALTH $ 900,000
ENVIRONMENT $ 860,000
INFRASTRUCTURE $2,650,000$21,900,000

14 Barrick Gold Corporation 2016 Economic Contributions Report
Barrick in Argentina
2016 At-A-GlanceEmployees 1,375
Contractors 2,609
operations veladero3
Projects Pascua-lama
veladero Gold Production 544,000 oz
Veladero has developed a number of economic development programs in partnership with local agricultural
organizations to help diversify the local economy and support agriculture. Most recently, the Company is
partner-ing with Aramark (a food services contractor), local municipalities, the San Juan Provincial Government,
and the Mining Ministry on a program to develop potato and onion growing in the communities of Jachal and
Iglesia. Barrick is supporting local producers in accessing training and seeds, while Aramark has committed to
purchase the produce the farmers grow.
1 out oF 10families in San Juan Province make their living from the Veladero mine (15,000 direct and indirect jobs).
in the Community / veladero
In 2015, the Veladero mine accounted for
25% of SanJuan Province’s GDP.
3 In April 2017, Barrick announced that it had entered into a strategic cooperation agreement with Shandong Gold Group Co., Ltd., the leading underground mining company in China, based in Jinan, Shandong province. As a first step in the new partnership, on June 30, 2017, Shandong Gold Mining Co., Ltd, the listed company of Shandong Gold Group, acquired 50 percent of Barrick’s Veladero mine in San Juan province, Argentina.

15 2016 Economic Contributions Report Barrick Gold Corporation
eConomiC ContributionS to arGentina 2014 2015 2016
taxeS and Government royaltieS $ 216,800,000 $ 52,930,000 $ 108,590,000
inComE TAxEs 129,940,000 5,320,000 64,100,000
oThER TAxEs 26,770,000 20,510,000 20,450,000
RoyAlTiEs PAid To GovERnmEnTs 34,740,000 27,100,000 22,150,000
sAlEs & vAluE AddEd TAx 25,350,000 – 1,890,000
PaymentS to emPloyeeS $ 91,440,000 $ 109,830,000 $ 93,390,000
EmPloyEE BEnEfiTs 9,510,000 760,000 5,900,000
EmPloymEnT TAxEs – 20,430,000 9,620,000
PAyRoll TAxEs 18,700,000 10,240,000 15,360,000
WAGEs oR sAlARiEs 63,230,000 78,400,000 62,510,000
Community inveStmentS $ 5,460,000 $ 1,920,000 $ 1,420,000
ARTs, CulTuRE & sPoRTs – 50,000 140,000
CommuniTy EnGAGEmEnT – 60,000 50,000
EConomiC dEvEloPmEnT – 1,260,000 450,000
EduCATion 70,000 80,000 370,000
EnviRonmEnT 330,000 10,000 –
hEAlTh 80,000 40,000 20,000
oThER ACTiviTiEs 4,980,000 10,000 180,000
infRAsTRuCTuRE – 410,000 210,000
other PaymentS $ 2,420,000 $ 1,070,000 $ 1,030,000
PurChaSeS oF GoodS and ServiCeS $ 815,990,000 $ 490,300,000 $ 356,630,000
JAChAl And iGlEsiA PuRChAsEs139,390,000 243,420,000
6,080,000
sAn JuAn PRovinCE PuRChAsEs 164,700,000
ARGEnTinE PuRChAsEs 676,590,000 246,880,000 185,850,000
total in-Country exPenditureS $ 1,132,100,000 $ 656,050,000 $ 561,060,000
inTERnATionAl PuRChAsEs 94,730,000 63,810,000 47,630,000
total eConomiC Contribution $ 1,226,830,000 $ 719,860,000 $ 608,690,000
emPloyment in arGentina – 2016 arGentina veladero
(inCludinG San Juan) lama
total emPloyeeS 1,375 1,360 15
JAChAl And iGlEsiA 15% 213 16% 212 7% 1
sAn JuAn PRovinCE 69% 942 69% 936 40% 6
nATionAls 14% 199 14% 193 40% 6
foREiGn nATionAls 2% 21 1% 19 13% 2
Senior Site manaGement – 2016 veladero lama
total Senior manaGement emPloyeeS 11 1
JAChAl And iGlEsiA 36% 4 – –
sAn JuAn PRovinCE 45% 5 – –
nATionAls – – – –
foREiGn nATionAls 18% 2 100% 1

16 Barrick Gold Corporation 2016 Economic Contributions Report
Barrick in Canada
2016 At-A-GlanceEmployees 747
Contractors 200
operations hemlo
offices Toronto head office AuTec (vancouver)
hemlo Gold Production 235,000 oz
Barrick’s Hemlo mine has developed a partnership with the local hospital to provide stress testing for mine rescue
and other personnel. The site provided financing to train a physician on the administration of the program,
which not only aided the site by saving costs (previously site personnel had to travel a long distance to the city of
Thunder Bay), but it has also supported the local health care system since the stress testing is available to all
residents in the nearby community.
Barrick has contributed almost
$2 billionto the Canadian economy since 2014.
in the Community / hemlo
The mining industry accounted for
19% of the value of Canadian goods exports in 2015.

17 2016 Economic Contributions Report Barrick Gold Corporation
eConomiC ContributionS to Canada 2014 2015 2016
taxeS and Government royaltieS $ 2,950,000 $ 8,550,000 $ 10,680,000
inComE TAxEs (140,000) 6,220,000 6,500,000
oThER TAxEs 3,090,000 2,330,000 4,180,000
RoyAlTiEs PAid To GovERnmEnTs – – –
sAlEs & vAluE AddEd TAx – – –
PaymentS to emPloyeeS $ 234,310,000 $ 223,960,000 $ 387,070,000
EmPloyEE BEnEfiTs 27,140,000 20,680,000 33,780,000
EmPloymEnT TAxEs – 3,180,000 5,810,000
PAyRoll TAxEs 57,940,000 55,990,000 52,320,000
WAGEs oR sAlARiEs 149,230,000 144,110,000 295,160,000
Community inveStmentS $ 5,100,000 $ 3,220,000 $ 1,620,000
ARTs, CulTuRE & sPoRTs – 540,000 70,000
CommuniTy EnGAGEmEnT – 250,000 120,000
EConomiC dEvEloPmEnT – 600,000 660,000
EduCATion 440,000 90,000 190,000
EnviRonmEnT 30,000 90,000 10,000
hEAlTh 1,780,000 890,000 90,000
oThER ACTiviTiEs 2,850,000 760,000 480,000
infRAsTRuCTuRE – – –
other PaymentS $ 17,690,000 $ 11,490,000 $ 19,330,000
PurChaSeS oF GoodS and ServiCeS $ 420,800,000 $ 319,180,000 $ 325,700,000
loCAl PuRChAsEs4 386,450,000 285,970,000
38,850,000
onTARio PuRChAsEs 255,850,000
CAnAdiAn PuRChAsEs 34,350,000 33,210,000 31,000,000
total in-Country exPenditureS $ 680,850,000 $ 566,400,000 $ 744,400,000
inTERnATionAl PuRChAsEs 433,300,000 103,440,000 61,930,000
total eConomiC Contribution $ 1,114,150,000 $ 669,840,000 $ 806,330,000
emPloyment in Canada – 2016 Canada hemlo toronto auteC
total emPloyeeS 747 499 204 44
loCAl CommuniTiEs4 64% 476 95% 476 – –
hosT PRovinCE 28% 208 4% 22 73% 149 84% 37
foREiGn nATionAls 8% 63 0.20% 1 27% 55 16% 7
Senior Site manaGement – 2016 hemlo
total Senior manaGement emPloyeeS 12
loCAl CommuniTiEs4 83% 10
onTARio 17% 2
4 White River, Manitouwadge, Marathon, Pic Mobert First Nation, and Biigtigong Nishnaabeg.
– –

18 Barrick Gold Corporation 2016 Economic Contributions Report
Barrick in Chile
2016 At-A-GlanceEmployees 251
Contractors 1,352
Projects Alturas Cerro Casale (75%)5
Pascua-lama
In Chile, near the Cerro Casale project, Barrick is partnering with the Prodemu Foundation to implement a
program to address skills gaps, and improve employment among women in the local communities. The Pres-
idency of Chile created Prodemu to promote and develop the skills of Chilean women. To date, the part-nership
has sup-ported 40 women from the town of Copiapo and the community of Tierra Amarilla. Approximately two-
thirds of the women who participated in the program have reported improved livelihoods and a better quality of
life as a result of a better job or more success as an entrepreneur.
Barrick’s economic contributions to Chile dropped significantly following the suspension of the Pascua-Lama project.
in the Community / Cerro Casale
The mining sector accounts for more than
10%of Chile’s GDP.
5 In June 2017, Barrick complete the sale of 25 percent of the Cerro Casale project in Chile to Goldcorp Inc. (“Goldcorp”). Barrick and Goldcorp have also completed the formation of a new 50/50 joint venture to manage the project.

19 2016 Economic Contributions Report Barrick Gold Corporation
eConomiC ContributionS to Chile 2014 2015 2016
taxeS and Government royaltieS $ 91,800,000 $ 21,900,000 $ 5,380,000
inComE TAxEs 51,640,000 19,680,000 –
oThER TAxEs 3,890,000 880,000 5,380,000
RoyAlTiEs PAid To GovERnmEnTs – – –
sAlEs & vAluE AddEd TAx 36,270,000 1,340,000 –
PaymentS to emPloyeeS $ 166,470,000 $ 49,080,000 $ 40,060,000
EmPloyEE BEnEfiTs 56,180,000 10,370,000 3,650,000
EmPloymEnT TAxEs – – 150,000
PAyRoll TAxEs 19,050,000 5,880,000 5,120,000
WAGEs oR sAlARiEs 91,240,000 32,830,000 31,140,000
Community inveStmentS $ 4,100,000 $ 3,500,000 $ 130,000
ARTs, CulTuRE & sPoRTs – – –
CommuniTy EnGAGEmEnT – 20,000 70,000
EConomiC dEvEloPmEnT – 1,080,000 20,000
EduCATion 2,500,000 150,000 30,000
EnviRonmEnT 160,000 790,000 –
hEAlTh 500,000 270,000 –
oThER ACTiviTiEs 940,000 1,190,000 10,000
infRAsTRuCTuRE – – –
other PaymentS $ 3,360,000 $ 170,000 $ –
PurChaSeS oF GoodS and ServiCeS $ 628,310,000 $ 119,970,000 $ 77,430,000
loCAl PuRChAsEs6 291,190,000 23,610,000
2,280,000
REGionAl PuRChAsEs7 27,140,000
ChilEAn PuRChAsEs 337,120,000 96,360,000 48,010,000
total in-Country exPenditureS $ 894,040,000 $ 194,620,000 $ 123,000,000
inTERnATionAl PuRChAsEs 64,290,000 28,600,000 1,230,000
total eConomiC ContributionS $ 958,330,000 $ 223,220,000 $ 124,230,000
emPloyment in Chile – 2016 Chile PaSCua SantiaGo alturaS Cerro CaSale
ToTAl EmPloyEEs 251 95 82 71 3
loCAl CommuniTiEs6 14% 34 13% 12 – – 28% 20 67% 2
hosT REGion7 14% 35 8% 8 – – 38% 27 – –
nATionAls 63% 159 76% 72 82% 67 27% 19 33% 1
foREiGn nATionAls 9% 23 3% 3 18% 15 7% 5 – –
Senior Site manaGement – 2016 PaSCua alturaS Cerro CaSale
total Senior manaGement emPloyeeS 8 8 3
loCAl CommuniTiEs6 – – 38% 3 67% 2
hosT REGion7 – – – – – –
nATionAls 88% 7 50% 4 33% 1
foREiGn nATionAls 13% 1 13% 1 – –
6 For Pascua, the communities of Alto del Carmen, Vallenar, La Higuera (La Higuera / El Trapiche / Punta Colorada) and the rest of Huasco Province. For Cerro Casale, the communities of Tierra Amarilla, Copiapo and Caldera. For Alturas, the communities of Vallecillo Rio Seco, Huanta, Chapilca, Varillar, Rivadavia, Vicuña, and Paihauno.
7 For Pascua and Cerro Casale, the region of Atacama. For Alturas, the region of Coquimbo.

20 Barrick Gold Corporation 2016 Economic Contributions Report
Barrick in the Dominican Republic
In the Dominican Republic, Barrick is partnering with INFOTEP, a government agency, to develop vocational and
technical courses designed to strengthen the skills of local communities. In 2016, this initiative saw more than
800 people from 14 local communities graduate from 36 different types of training programs.
Pueblo Viejo is one of the DR’s largest exporters and the number one tax contributor, paying close to half of the national corporate tax.
in the Community / Pueblo viejo
Barrick increased its purchases from Dominican suppliers to
50% in 2016, up from 36% in 2014.
2016 At-A-GlanceEmployees 2,083
Contractors 2,108
operations Pueblo viejo (60%)
Pueblo viejo Gold Production
700,000 oz (60%)

21 2016 Economic Contributions Report Barrick Gold Corporation
eConomiC ContributionS to the dominiCan rePubliC 2014 2015 2016
taxeS and Government royaltieS $ 309,720,000 $ 213,050,000 $ 394,390,000
inComE TAxEs 261,480,000 175,260,000 342,410,000
oThER TAxEs – – –
RoyAlTiEs PAid To GovERnmEnTs 48,240,000 37,790,000 48,580,000
sAlEs & vAluE AddEd TAx – – 3,400,000
PaymentS to emPloyeeS $ 129,620,000 $ 117,390,000 $ 96,630,000
EmPloyEE BEnEfiTs 39,600,000 31,300,000 26,410,000
EmPloymEnT TAxEs – – 5,930,000
PAyRoll TAxEs 16,040,000 8,920,000 17,610,000
WAGEs oR sAlARiEs 73,980,000 77,170,000 46,680,000
Community inveStmentS $ 4,590,000 $ 1,540,000 $ 1,230,000
ARTs, CulTuRE & sPoRTs – 10,000 10,000
CommuniTy EnGAGEmEnT – 50,000 80,000
EConomiC dEvEloPmEnT – 1,020,000 150,000
EduCATion 360,000 170,000 190,000
EnviRonmEnT – 180,000 –
hEAlTh 30,000 90,000 80,000
oThER ACTiviTiEs 4,200,000 20,000 10,000
infRAsTRuCTuRE – – 710,000
other PaymentS $ – $ 10,000 $ –
PurChaSeS oF GoodS and ServiCeS $ 248,500,000 $ 257,640,000 $ 250,530,000
loCAl PuRChAsEs8 16,040,000 19,400,000 19,690,000
dominiCAn PuRChAsEs 232,460,000 238,240,000 230,840,000
total in-Country exPenditureS $ 692,430,000 $ 589,630,000 $ 742,780,000
inTERnATionAl PuRChAsEs 449,940,000 271,450,000 250,070,000
total eConomiC ContributionS $ 1,142,370,000 $ 861,080,000 $ 992,850,000
emPloyment in the dominiCan rePubliC – 2016 Pueblo vieJo
total emPloyeeS 2,083
loCAl CommuniTiEs8 37% 764
nATionAls 58% 1,214
foREiGn nATionAls 5% 105
Senior Site manaGement – 2016 Pueblo vieJo
total Senior manaGement emPloyeeS 16
loCAl CommuniTiEs8 19% 3
nATionAls 44% 7
foREiGn nATionAls 38% 6
8 Local communities are defined as communities located within 25km from the center of any Pueblo Viejo components with significant risks or impacts from, or relevance to, the operation. The site has prioritized 39 communities: 25 around the mine and 14 around the power facilities.

22 Barrick Gold Corporation 2016 Economic Contributions Report
Barrick in Peru
In Peru, as the Pierina mine closes, the site continues to work closely with local suppliers to further enhance their
skills. As part of this program, 84% of leaders from 19 local companies have been trained in production, finance,
and sales. Moreover, all 19 local companies that the mine works with have been trained in marketing, commer-
cial communications, tenders, and commercial tools.
Since 2014, in Peru, Barrick has purchased an average of
96%of its goods and services from Peruvian businesses.
in the Community / Pierina
Since 2014, 99%of Barrick employees in Peru have been Peruvian.
2016 At-A-GlanceEmployees 1,295
Contractors 2,147
operations lagunas norte (the Pierina mine is in closure)
lagunas norte Gold Production
435,000 oz

23 2016 Economic Contributions Report Barrick Gold Corporation
eConomiC ContributionS to Peru 2014 2015 2016
taxeS and Government royaltieS $ 202,440,000 $ 125,210,000 $ 118,460,000
inComE TAxEs 179,550,000 107,020,000 102,760,000
oThER TAxEs 130,000 60,000 40,000
RoyAlTiEs PAid To GovERnmEnTs 19,760,000 17,030,000 14,190,000
sAlEs & vAluE AddEd TAx 3,010,000 1,100,000 1,480,000
PaymentS to emPloyeeS $ 94,040,000 $ 74,980,000 $ 79,600,000
EmPloyEE BEnEfiTs 8,990,000 31,070,000 35,920,000
EmPloymEnT TAxEs – 50,000 60,000
PAyRoll TAxEs 13,050,000 3,150,000 3,270,000
WAGEs oR sAlARiEs 42,000,000 40,720,000 40,360,000
Community inveStmentS $ 13,500,000 $ 10,950,000 $ 6,660,000
ARTs, CulTuRE & sPoRTs – – –
CommuniTy EnGAGEmEnT – 770,000 230,000
EConomiC dEvEloPmEnT – 1,500,000 3,110,000
EduCATion 600,000 1,610,000 580,000
EnviRonmEnT – – 50,000
hEAlTh 240,000 470,000 30,000
oThER ACTiviTiEs 12,660,000 4,840,000 1,030,000
infRAsTRuCTuRE – 1,760,000 1,630,000
other PaymentS $ 1,690,000 $ 500,000 $ –
PurChaSeS oF GoodS and ServiCeS $ 345,120,000 $ 286,790,000 $ 296,840,000
loCAl PuRChAsEs11 9,390,000 12,010,000 14,120,000
PERuviAn PuRChAsEs 335,730,000 274,780,000 282,720,000
total in-Country exPenditure $ 656,770,000 $ 498,430,000 $ 501,560,000
inTERnATionAl PuRChAsEs 9,730,000 20,980,000 8,960,000
total eConomiC ContributionS $ 666,500,000 $ 519,410,000 $ 510,520,000
emPloyment in Peru – 2016 Peru laGunaS norte Pierina lima
total emPloyeeS 1,295 768 444 83
loCAl CommuniTiEs11 11% 137 14% 108 7% 29 – –
hosT REGion12 27% 353 31% 237 26% 116 – –
PERuviAns 62% 800 55% 421 67% 298 98% 81
foREiGn nATionAls 0.39% 5 0.26% 2 0.23% 1 2% 2
Senior Site manaGement – 2016 laGunaS norte Pierina
total Senior manaGement emPloyeeS 12 10
loCAl CommuniTiEs11 – – – –
hosT REGion12 8% 1 – –
PERuviAns 83% 10 90% 9
foREiGn nATionAls 8% 1 10% 1
11 For Pierina, includes 11 population centers and rural communities (Huanja, Mataquita; Atupa, Antahurán, San Miguel de Tinyash, Mareniyoc and Chaquecyaco, San Isidro de Pacollón, Ramón Castilla, Miguel Grau de Shecta and Andres Avelino Cáceres de Cuncashc). For Lagunas Norte, includes 14 population centers (El Sauco, Chuyugual, Cushuro, Pampa Verde, Corral Grande, Los Loros, Totoras, San Pedro, Yanivilca, La Victoria, Santos Genoveva, Canibamba Alto, Quesquenda and Quiruvilca).
12 For Pierina, includes the rest of the district of Jangas and Independencia, the Province of Huaraz, and the Region of Ancash. For Lagunas Norte,includes the rest of the districts of Quiruvilca, Sanagorán and Usquil; the Provinces of Santiago de Chuco, Sanchez Carrión and Otuzco; and the Region of La Libertad.

24 Barrick Gold Corporation 2016 Economic Contributions Report
In 2016, Barrick worked with the Western Shoshone Cultural Advisory Group and Tribal Councils to develop
a plan for a Western Shoshone Cultural Center in Elko on the property of the Elko Band of the Te-Moak Tribe.
Agreement on this plan was reached with all eight Western Shoshone partner communities and a Board of
Trustees is now being formed. When this center is complete, Barrick will be able to repatriate cultural artifacts
from its private land to this facility – a priority for our Western Shoshone partners.
Barrick purchases goods and services from more than
500Nevada-based businesses.
in the Community / Elko
Barrick has contributed an average of
$2.6 billion each year to the American economy since 2014.
2016 At-A-GlanceEmployees 3,761
Contractors 675
operations Cortez13 Goldstrike13
Turquoise Ridge Golden sunlight
Projects Goldrush
Gold Production Cortez 1,059,000 oz Goldstrike 1,096,000 oz Turquoise Ridge (75%) 266,000 oz Golden sunlight 34,000 oz
Barrick in the United States
13 In February 2017, Barrick announced a process to unify Goldstrike and Cortez into a single operating business known as Barrick Nevada. The integration will be conducted in phases, and will eventually include the Turquoise Ridge mine.

25 2016 Economic Contributions Report Barrick Gold Corporation
eConomiC ContributionS to the united StateS 2014 2015 2016
taxeS and Government royaltieS $ 115,330,000 $ 174,450,000 $ 373,540,000
inComE TAxEs 56,910,000 115,080,000 229,180,000
oThER TAxEs 12,430,000 23,280,000 102,150,000
RoyAlTiEs PAid To GovERnmEnTs – – –
sAlEs & vAluE AddEd TAx 45,990,000 36,090,000 42,210,000
PaymentS to emPloyeeS $ 784,670,000 $ 829,720,000 $ 616,980,000
EmPloyEE BEnEfiTs 255,110,000 270,690,000 111,900,000
EmPloymEnT TAxEs – 32,970,000 27,650,000
PAyRoll TAxEs 95,340,000 92,090,000 91,540,000
WAGEs oR sAlARiEs 434,220,000 433,970,000 385,890,000
Community inveStmentS $ 14,750,000 $ 12,310,000 $ 9,680,000
ARTs, CulTuRE & sPoRTs – 1,710,000 900,000
CommuniTy EnGAGEmEnT – 1,920,000 660,000
EConomiC dEvEloPmEnT – 670,000 300,000
EduCATion 4,910,000 5,170,000 5,860,000
EnviRonmEnT 670,000 1,360,000 800,000
hEAlTh 1,870,000 860,000 630,000
oThER ACTiviTiEs 7,300,000 620,000 440,000
infRAsTRuCTuRE – – 90,000
other PaymentS $ 68,160,000 $ 56,370,000 $ 56,550,000
PurChaSeS oF GoodS and ServiCeS $ 2,286,440,000 $ 1,635,300,000 $ 1,109,370,000
sTATE PuRChAsEs 690,880,000 410,430,000 134,640,000
nATionAl PuRChAsEs 1,595,560,000 1,224,870,000 974,730,000
total in-Country exPenditureS $ 3,269,350,000 $ 2,708,140,000 $ 2,166,100,000
inTERnATionAl PuRChAsEs 72,040,000 32,520,000 36,780,000
total eConomiC ContributionS $ 3,341,390,000 $ 2,740,660,000 $ 2,202,880,000
emPloyment in the united StateS – 2016 united StateS GoldStrike Cortez turquoiSe ridGe oFFiCeS
Golden SunliGht
total emPloyeeS 3,761 1,641 1,268 517 290 45
sTATE REsidEnTs 91% 3,415 95% 1,555 94% 1,190 98% 505 41% 120 100% 45
nATionAls 8% 302 4% 72 6% 72 2% 11 51% 147 – –
foREiGn nATionAls 1% 44 1% 14 0% 6 0% 1 28% 23 – –
Senior Site manaGement – 2016 GoldStrike Cortez turquoiSe ridGe Golden SunliGht
total Senior manaGement emPloyeeS 10 10 9 8
sTATE REsidEnTs 90% 9 90% 9 100% 9 100% 8
foREiGn nATionAls 10% 1 10% 1

26 Barrick Gold Corporation 2016 Economic Contributions Report
Barrick in Zambia
The Lumwana mine in Zambia entered into a partnership with Musika, an NGO, to fund a project under the
Nsabo Yetu Women Empowerment program. Under the partnership, Musika will provide 51% of the funding
required to develop a packaging and grading center for Mangala beans; Barrick will provide the remaining
49%. Mangala beans are an important crop grown by women in the area, and this center will expand their
ability to generate income and reduce the women’s economic vulnerability.
In 2016, 50% ofsenior management at Lumwana was Zambian, up from 38% in 2015.
in the Community / lumwana
Barrick has spent an average of
$330 million each year at Zambian businesses since 2014.
2016 At-A-GlanceEmployees 1,693
Contractors 2,087
operations lumwana
lumwana Copper Production
271 million pounds

27 2016 Economic Contributions Report Barrick Gold Corporation
eConomiC ContributionS to zambia 2014 2015 2016
taxeS and Government royaltieS $ 40,840,000 $ 140,850,000 $ 89,780,000
inComE TAxEs (170,000) 8,120,000 5,370,000
oThER TAxEs 600,000 850,000 1,210,000
RoyAlTiEs PAid To GovERnmEnTs 38,880,000 97,670,000 49,110,000
sAlEs & vAluE AddEd TAx 1,530,000 34,210,000 34,090,000
PaymentS to emPloyeeS $ 118,110,000 $ 83,220,000 $ 75,250,000
EmPloyEE BEnEfiTs 12,120,000 3,980,000 8,090,000
PAyRoll TAxEs 23,920,000 17,550,000 14,790,000
WAGEs oR sAlARiEs 82,070,000 61,690,000 52,370,000
Community inveStmentS $ 1,360,000 $ 1,080,000 $ 1,160,000
ARTs, CulTuRE & sPoRTs – 70,000 –
CommuniTy EnGAGEmEnT – 10,000 220,000
EConomiC dEvEloPmEnT – 580,000 340,000
EduCATion 420,000 280,000 360,000
EnviRonmEnT – – –
hEAlTh 70,000 20,000 50,000
oThER ACTiviTiEs 870,000 10,000 180,000
infRAsTRuCTuRE – 100,000 10,000
other PaymentS $ – $ 1,610,000 $ 1,060,000
PurChaSeS oF GoodS and ServiCeS $ 388,180,000 $ 329,150,000 $ 272,050,000
loCAl PURCHASES14 6,500,000 52,730,000
4,630,000
noRTh WEsTERn PRovinCE PURCHASES 8,330,000
ZAmBiAn PuRChAsEs 381,680,000 276,420,000 259,090,000
total in-Country exPenditureS $ 548,490,000 $ 555,900,000 $ 439,300,000
inTERnATionAl PuRChAsEs 66,860,000 48,470,000 64,170,000
total eConomiC ContributionS $ 615,350,000 $ 604,370,000 $ 503,470,000
emPloyment in zambia LUMWANA
total emPloyeeS 1,693
loCAl CommuniTiEs14 40% 670
noRTh WEsTERn PRovinCE 22% 370
ZAmBiAns 35% 593
foREiGn nATionAls 4% 60
Senior Site manaGement – 2016 LUMWANA
total Senior manaGement emPloyeeS 10
ZAmBiAns 50% 5
foREiGn nATionAls 50% 5
14 Chiefdoms of Mukumbi, Mumena or Matebo.

28 Barrick Gold Corporation 2016 Economic Contributions Report
Payee name taxeS royaltieS FeeSProduCtion
entitlementS bonuSeS dividendSinFraStruCture
imProvement PaymentStotal amount
Paid to Payee
ARGENTINA
GovERnmEnT of ThE PRovinCE of sAn JuAn 650,000 19,760,000 5,030,000 – – – 9,980,000 35,420,000 total arGentina $ 650,000 $ 19,760,000 $ 5,030,000 – – – $ 9,980,000 $ 35,420,000
AUSTRALIAGovERnmEnT of AusTRAliA 45,150,000 – – – – – – 45,150,000 total auStralia $ 45,150,000 – – – – – – $ 45,150,000
CANADA
CiTy of ThundER BAy 110,000 – – – – – – 110,000 ToWn of mAniTouWAdGE 280,000 – – – – – – 280,000 ToWn of mARAThon 830,000 – – – – – – 830,000 total Canada $ 1,220,000 – – – – – – $ 1,220,000
CHILE
GovERnmEnT of ChilE (56,120,000)2 – 3,430,000 – – – 990,000 (51,700,000)muniCiPAliTy of AnTofAGsTA 250,000 – – – – – – 250,000 muniCiPAliTy of CoquimBo 1,080,000 – – – – – – 1,080,000 muniCiPAliTy of lA sEREnA 250,000 – – – – – – 250,000 muniCiPAliTy of PRovidEnCiA 570,000 – – – – – – 570,000 total Chile $ (53,970,000) – $ 3,430,000 – – – $ 990,000 $ (49,550,000)
DOMINICAN REPUBLIC
CoTui muniCiPAliTy – – – – – – 310,000 310,000 GovERnmEnT of ThE dominiCAn REPuBliC 237,200,000 47,080,000 400,000 – – – – 284,680,000ZAmBRAnA muniCiPAliTy – – – – – – 80,000 80,000 total dominiCan rePubliC $ 237,200,000 $ 47,080,000 $ 400,000 – – – $ 390,000 $ 285,070,000
PERU
GovERnmEnT of PERu 14,570,000 13,770,000 17,290,000 – – – – 45,630,000 lA liBERTAd REGionAl GovERnmEnT – – – – – – 3,320,000 3,320,000 total Peru $ 14,570,000 $ 13,770,000 $ 17,290,000 – – – $ 3,320,000 $ 48,950,000
Appendix A
Extractive Sector Transparency Measures Act Annual Reportfor the year ended december 31, 2016, as filed with Natural Resources Canada on June 30, 2017.
Payments by Payee1

29 2016 Economic Contributions Report Barrick Gold Corporation
Payments by Payee1
Payee name taxeS royaltieS FeeSProduCtion
entitlementS bonuSeS dividendSinFraStruCture
imProvement PaymentStotal amount
Paid to Payee
ARGENTINA
GovERnmEnT of ThE PRovinCE of sAn JuAn 650,000 19,760,000 5,030,000 – – – 9,980,000 35,420,000 total arGentina $ 650,000 $ 19,760,000 $ 5,030,000 – – – $ 9,980,000 $ 35,420,000
AUSTRALIA
GovERnmEnT of AusTRAliA 45,150,000 – – – – – – 45,150,000 total auStralia $ 45,150,000 – – – – – – $ 45,150,000
CANADA
CiTy of ThundER BAy 110,000 – – – – – – 110,000 ToWn of mAniTouWAdGE 280,000 – – – – – – 280,000 ToWn of mARAThon 830,000 – – – – – – 830,000 total Canada $ 1,220,000 – – – – – – $ 1,220,000
CHILE
GovERnmEnT of ChilE (56,120,000)2 – 3,430,000 – – – 990,000 (51,700,000)muniCiPAliTy of AnTofAGsTA 250,000 – – – – – – 250,000 muniCiPAliTy of CoquimBo 1,080,000 – – – – – – 1,080,000 muniCiPAliTy of lA sEREnA 250,000 – – – – – – 250,000 muniCiPAliTy of PRovidEnCiA 570,000 – – – – – – 570,000 total Chile $ (53,970,000) – $ 3,430,000 – – – $ 990,000 $ (49,550,000)
DOMINICAN REPUBLIC
CoTui muniCiPAliTy – – – – – – 310,000 310,000 GovERnmEnT of ThE dominiCAn REPuBliC 237,200,000 47,080,000 400,000 – – – – 284,680,000 ZAmBRAnA muniCiPAliTy – – – – – – 80,000 80,000 total dominiCan rePubliC $ 237,200,000 $ 47,080,000 $ 400,000 – – – $ 390,000 $ 285,070,000
PERU
GovERnmEnT of PERu 14,570,000 13,770,000 17,290,000 – – – – 45,630,000 lA liBERTAd REGionAl GovERnmEnT – – – – – – 3,320,000 3,320,000 total Peru $ 14,570,000 $ 13,770,000 $ 17,290,000 – – – $ 3,320,000 $ 48,950,000
Barrick is required to report in accordance with the Extractive sector Transparency
measures Act (“EsTmA”) issued by the Government of Canada. This report is pre-
pared according to specific parameters established by the Government of Canada.
in particular, reportable payments made to government are presented on a net
cash basis for the year ended december 31, 2016. Barrick’s Economic Contributions
Report is on an accrual basis. As a result, the data included in the EsTmA Report and
Barrick’s Economic Contributions Report are not directly comparable.
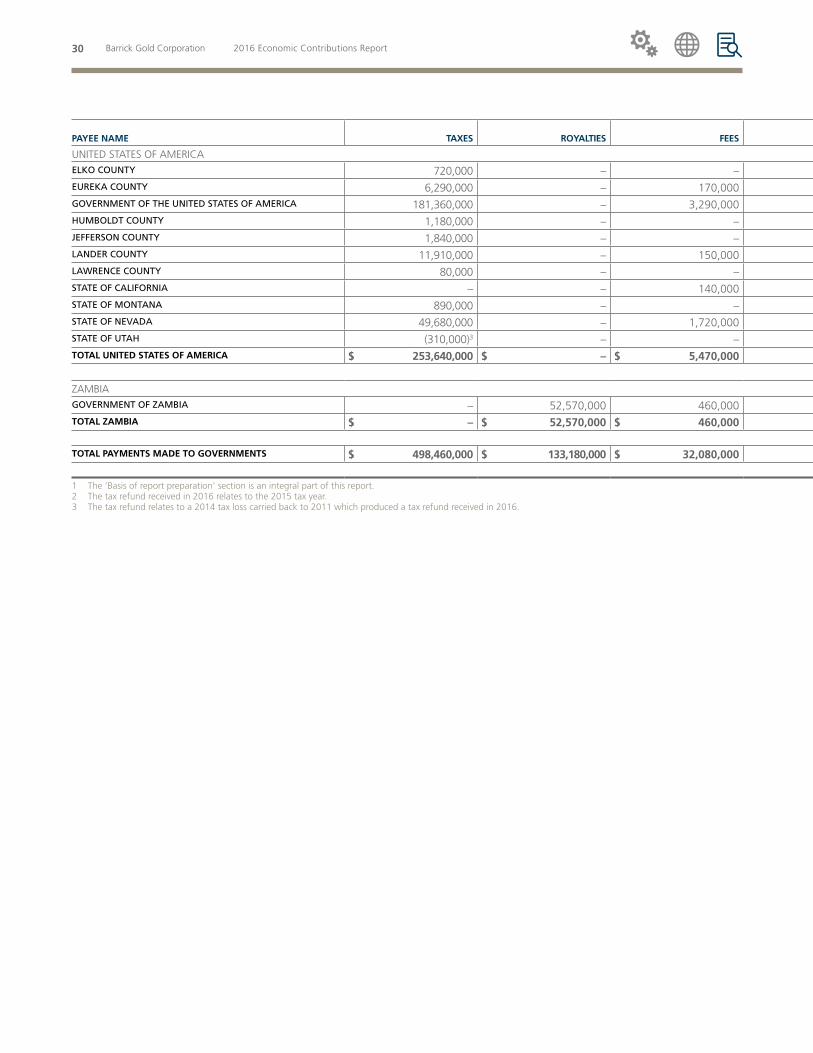
30 Barrick Gold Corporation 2016 Economic Contributions Report
Payee name taxeS royaltieS FeeSProduCtion
entitlementS bonuSeS dividendSinFraStruCture
imProvement PaymentStotal amount
Paid to Payee
UNITED STATES OF AMERICA
Elko CounTy 720,000 – – – – – – 720,000 EuREkA CounTy 6,290,000 – 170,000 – – – – 6,460,000 GovERnmEnT of ThE uniTEd sTATEs of AmERiCA 181,360,000 – 3,290,000 – – – – 184,650,000humBoldT CounTy 1,180,000 – – – – – – 1,180,000 JEffERson CounTy 1,840,000 – – – – – – 1,840,000 lAndER CounTy 11,910,000 – 150,000 – – – – 12,060,000 lAWREnCE CounTy 80,000 – – – – – – 80,000 sTATE of CAlifoRniA – – 140,000 – – – – 140,000 sTATE of monTAnA 890,000 – – – – – – 890,000 sTATE of nEvAdA 49,680,000 – 1,720,000 – – – – 51,400,000 sTATE of uTAh (310,000)3 – – – – – – (310,000)total united StateS oF ameriCa $ 253,640,000 $ – $ 5,470,000 – – – $ – $ 259,110,000
ZAMBIA
GovERnmEnT of ZAmBiA – 52,570,000 460,000 – – – – 53,030,000 total zambia $ – $ 52,570,000 $ 460,000 – – – $ – $ 53,030,000
total PaymentS made to GovernmentS $ 498,460,000 $ 133,180,000 $ 32,080,000 – – – $ 14,680,000 $ 678,400,000
1 The ‘Basis of report preparation’ section is an integral part of this report.2 The tax refund received in 2016 relates to the 2015 tax year.3 The tax refund relates to a 2014 tax loss carried back to 2011 which produced a tax refund received in 2016.

31 2016 Economic Contributions Report Barrick Gold Corporation
Payee name taxeS royaltieS FeeSProduCtion
entitlementS bonuSeS dividendSinFraStruCture
imProvement PaymentStotal amount
Paid to Payee
UNITED STATES OF AMERICA
Elko CounTy 720,000 – – – – – – 720,000 EuREkA CounTy 6,290,000 – 170,000 – – – – 6,460,000 GovERnmEnT of ThE uniTEd sTATEs of AmERiCA 181,360,000 – 3,290,000 – – – – 184,650,000 humBoldT CounTy 1,180,000 – – – – – – 1,180,000 JEffERson CounTy 1,840,000 – – – – – – 1,840,000 lAndER CounTy 11,910,000 – 150,000 – – – – 12,060,000 lAWREnCE CounTy 80,000 – – – – – – 80,000 sTATE of CAlifoRniA – – 140,000 – – – – 140,000 sTATE of monTAnA 890,000 – – – – – – 890,000 sTATE of nEvAdA 49,680,000 – 1,720,000 – – – – 51,400,000 sTATE of uTAh (310,000)3 – – – – – – (310,000)total united StateS oF ameriCa $ 253,640,000 $ – $ 5,470,000 – – – $ – $ 259,110,000
ZAMBIA
GovERnmEnT of ZAmBiA – 52,570,000 460,000 – – – – 53,030,000 total zambia $ – $ 52,570,000 $ 460,000 – – – $ – $ 53,030,000
total PaymentS made to GovernmentS $ 498,460,000 $ 133,180,000 $ 32,080,000 – – – $ 14,680,000 $ 678,400,000
1 The ‘Basis of report preparation’ section is an integral part of this report.2 The tax refund received in 2016 relates to the 2015 tax year.3 The tax refund relates to a 2014 tax loss carried back to 2011 which produced a tax refund received in 2016.
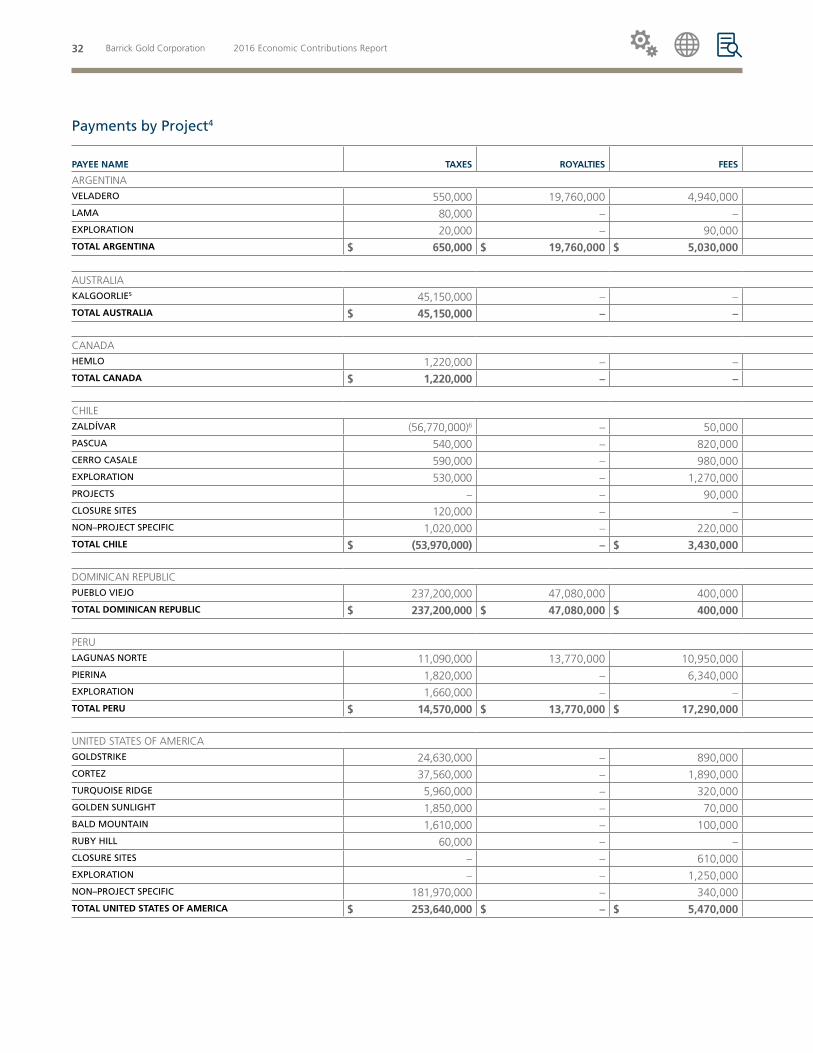
32 Barrick Gold Corporation 2016 Economic Contributions Report
Payments by Project4
Payee name taxeS royaltieS FeeS ProduCtion entitlementS bonuSeS dividendSinFraStruCture
imProvement PaymentStotal amount
Paid by ProJeCt
ARGENTINA
vElAdERo 550,000 19,760,000 4,940,000 – – – 9,980,000 35,230,000 lAmA 80,000 – – – – – – 80,000 ExPloRATion 20,000 – 90,000 – – – – 110,000 total arGentina $ 650,000 $ 19,760,000 $ 5,030,000 – – – $ 9,980,000 $ 35,420,000
AUSTRALIA
kAlGooRliE5 45,150,000 – – – – – – 45,150,000 total auStralia $ 45,150,000 – – – – – $ – $ 45,150,000
CANADA
hEmlo 1,220,000 – – – – – – 1,220,000 total Canada $ 1,220,000 – – – – – $ – $ 1,220,000
CHILE
ZAldívAR (56,770,000)6 – 50,000 – – – – (56,720,000)PAsCuA 540,000 – 820,000 – – – 140,000 1,500,000 CERRo CAsAlE 590,000 – 980,000 – – – 850,000 2,420,000 ExPloRATion 530,000 – 1,270,000 – – – – 1,800,000 PRoJECTs – – 90,000 – – – – 90,000 ClosuRE siTEs 120,000 – – – – – – 120,000 non–PRoJECT sPECifiC 1,020,000 – 220,000 – – – – 1,240,000 total Chile $ (53,970,000) – $ 3,430,000 – – – $ 990,000 $ (49,550,000)
DOMINICAN REPUBLIC
PuEBlo viEJo 237,200,000 47,080,000 400,000 – – – 390,000 285,070,000 total dominiCan rePubliC $ 237,200,000 $ 47,080,000 $ 400,000 – – – $ 390,000 $ 285,070,000
PERU
lAGunAs noRTE 11,090,000 13,770,000 10,950,000 – – – 3,320,000 39,130,000 PiERinA 1,820,000 – 6,340,000 – – – – 8,160,000 ExPloRATion 1,660,000 – – – – – – 1,660,000 total Peru $ 14,570,000 $ 13,770,000 $ 17,290,000 – – – $ 3,320,000 $ 48,950,000
UNITED STATES OF AMERICA
GoldsTRikE 24,630,000 – 890,000 – – – – 25,520,000 CoRTEZ 37,560,000 – 1,890,000 – – – – 39,450,000 TuRquoisE RidGE 5,960,000 – 320,000 – – – – 6,280,000 GoldEn sunliGhT 1,850,000 – 70,000 – – – – 1,920,000 BAld mounTAin 1,610,000 – 100,000 – – – – 1,710,000 RuBy hill 60,000 – – – – – – 60,000 ClosuRE siTEs – – 610,000 – – – – 610,000 ExPloRATion – – 1,250,000 – – – – 1,250,000 non–PRoJECT sPECifiC 181,970,000 – 340,000 – – – – 182,310,000 total united StateS oF ameriCa $ 253,640,000 $ – $ 5,470,000 – – – $ – $ 259,110,000

33 2016 Economic Contributions Report Barrick Gold Corporation
Payments by Project4
Payee name taxeS royaltieS FeeS ProduCtion entitlementS bonuSeS dividendSinFraStruCture
imProvement PaymentStotal amount
Paid by ProJeCt
ARGENTINA
vElAdERo 550,000 19,760,000 4,940,000 – – – 9,980,000 35,230,000 lAmA 80,000 – – – – – – 80,000 ExPloRATion 20,000 – 90,000 – – – – 110,000 total arGentina $ 650,000 $ 19,760,000 $ 5,030,000 – – – $ 9,980,000 $ 35,420,000
AUSTRALIA
kAlGooRliE5 45,150,000 – – – – – – 45,150,000 total auStralia $ 45,150,000 – – – – – $ – $ 45,150,000
CANADA
hEmlo 1,220,000 – – – – – – 1,220,000 total Canada $ 1,220,000 – – – – – $ – $ 1,220,000
CHILE
ZAldívAR (56,770,000)6 – 50,000 – – – – (56,720,000)PAsCuA 540,000 – 820,000 – – – 140,000 1,500,000 CERRo CAsAlE 590,000 – 980,000 – – – 850,000 2,420,000 ExPloRATion 530,000 – 1,270,000 – – – – 1,800,000 PRoJECTs – – 90,000 – – – – 90,000 ClosuRE siTEs 120,000 – – – – – – 120,000 non–PRoJECT sPECifiC 1,020,000 – 220,000 – – – – 1,240,000 total Chile $ (53,970,000) – $ 3,430,000 – – – $ 990,000 $ (49,550,000)
DOMINICAN REPUBLIC
PuEBlo viEJo 237,200,000 47,080,000 400,000 – – – 390,000 285,070,000 total dominiCan rePubliC $ 237,200,000 $ 47,080,000 $ 400,000 – – – $ 390,000 $ 285,070,000
PERU
lAGunAs noRTE 11,090,000 13,770,000 10,950,000 – – – 3,320,000 39,130,000 PiERinA 1,820,000 – 6,340,000 – – – – 8,160,000 ExPloRATion 1,660,000 – – – – – – 1,660,000 total Peru $ 14,570,000 $ 13,770,000 $ 17,290,000 – – – $ 3,320,000 $ 48,950,000
UNITED STATES OF AMERICA
GoldsTRikE 24,630,000 – 890,000 – – – – 25,520,000 CoRTEZ 37,560,000 – 1,890,000 – – – – 39,450,000 TuRquoisE RidGE 5,960,000 – 320,000 – – – – 6,280,000 GoldEn sunliGhT 1,850,000 – 70,000 – – – – 1,920,000 BAld mounTAin 1,610,000 – 100,000 – – – – 1,710,000 RuBy hill 60,000 – – – – – – 60,000 ClosuRE siTEs – – 610,000 – – – – 610,000 ExPloRATion – – 1,250,000 – – – – 1,250,000 non–PRoJECT sPECifiC 181,970,000 – 340,000 – – – – 182,310,000 total united StateS oF ameriCa $ 253,640,000 $ – $ 5,470,000 – – – $ – $ 259,110,000

34 Barrick Gold Corporation 2016 Economic Contributions Report
Payee name taxeS royaltieS FeeS ProduCtion entitlementS bonuSeS dividendSinFraStruCture
imProvement PaymentStotal amount
Paid by ProJeCt
ZAMBIA
lumWAnA – 52,570,000 460,000 – – – – 53,030,000 total zambia $ – $ 52,570,000 $ 460,000 – – – $ – $ 53,030,000
total PaymentS made to GovernmentS $ 498,460,000 $ 133,180,000 $ 32,080,000 – – – $ 14,680,000 $ 678,400,000 4 The ‘Basis of report preparation’ section is an integral part of this report.
5 Kalgoorlie is not controlled by Barrick. The reported payments were made directly by a Barrick controlled subsidiary in relation to the project.
6 The tax refund received in 2016 relates to the 2015 tax year.

35 2016 Economic Contributions Report Barrick Gold Corporation
Payee name taxeS royaltieS FeeS ProduCtion entitlementS bonuSeS dividendSinFraStruCture
imProvement PaymentStotal amount
Paid by ProJeCt
ZAMBIA
lumWAnA – 52,570,000 460,000 – – – – 53,030,000 total zambia $ – $ 52,570,000 $ 460,000 – – – $ – $ 53,030,000
total PaymentS made to GovernmentS $ 498,460,000 $ 133,180,000 $ 32,080,000 – – – $ 14,680,000 $ 678,400,0004 The ‘Basis of report preparation’ section is an integral part of this report.
5 Kalgoorlie is not controlled by Barrick. The reported payments were made directly by a Barrick controlled subsidiary in relation to the project.
6 The tax refund received in 2016 relates to the 2015 tax year.

36 Barrick Gold Corporation 2016 Economic Contributions Report
This report was prepared in accordance with the Extractive
Sector Transparency Measures Act (“ESTMA” or the “Act”)
issued by the Government of Canada. The information
in this report was prepared by Barrick Gold Corporation
(“Barrick”) for the sole purpose of complying with Barrick’s
obligations under the ESTMA. The information contained
in this report is provided solely for the benefit of Natural
Resources Canada (“NRCan”) and in connection with
Barrick’s obligations under the ESTMA. This report may not
be used or relied upon by any other person or for any other
purpose without Barrick’s express prior written consent.
1 Projects
According to the Technical Reporting Specifications issued
by NRCan, a project is the operational activities that are
governed by a single contract, license, lease, concession
or similar legal agreement and form the basis for payment
liabilities with a government. If multiple agreements are
“substantially interconnected”, they are considered a single
project. “Substantially interconnected” means forming a set
of operationally and geographically integrated contracts,
licenses, leases or concessions or related agreements with
substantially similar terms that are signed with a govern-
ment and give rise to payment liabilities.
This report includes payments made that are reportable
under ESTMA for all of Barrick’s controlled projects, re-
gardless of Barrick’s ownership interest. In accordance with
the Act, this report does not include payments made by
projects that Barrick does not control, except if payments
were made by a Barrick controlled entity in relation to the
project. Projects that Barrick has an economic interest in but
are not controlled by Barrick consist of the following:
PlaCe oF buSineSS entity tyPe eConomiC intereSt aCCountinG method
donlin Gold PRoJECT United States Joint Operations 50% Our share
kAlGooRliE minE Australia Joint Operations 50% Our share
PoRGERA minE Papua New Guinea Joint Operations 47.5% Our share
JABAl sAyid Saudi Arabia Joint Venture 50% Equity method
kABAnGA PRoJECT Tanzania Joint Venture 50% Equity method
ZAldívAR21 Chile Joint Venture 50% Equity method
21 Zaldívar is not controlled by Barrick as we ceased to operate or otherwise control the mine after completing the sale of 50% of the mine on December 1, 2015.
Barrick completed the sale of Ruby Hill and Bald Mountain
on December 17, 2015 and January 11, 2016, respectively.
Payments reported relating to these projects relate to costs
incurred prior to the sale but were paid in the year ended
December 31, 2016.
Barrick also holds a 63.9% interest in Acacia Mining Plc
(“Acacia”). Acacia is subject to the reporting requirements
of the EU’s “Accounting and Transparency Directives”, and
will be filing a report under that directive by June 30, 2017.
That report will also be submitted to Natural Resources
Canada in accordance with section 10(2) of the Act and
published at http://www.acaciamining.com.
Basis of Report Preparation

37 2016 Economic Contributions Report Barrick Gold Corporation
Non-significant projects, in which insignificant payments to
governments were made, have been grouped together and
presented as exploration sites, closed sites, or projects.
Non-project specific payments relate to payments made for
the commercial development of minerals that have been
calculated and paid on a consolidated basis and are difficult
to split or disaggregate to a specific project.
2 Governments
Government is defined as:
a. any government in Canada or in a foreign state
b. a body that is established by two or more governments
c. any trust, board, commission, corporation or body or
authority that is established to exercise or perform, or
that exercises or performs, a power, duty or function of
government for a government referred to in paragraph
(a) or a body referred to in paragraph (b).
3 Reporting Currency
Reportable payments to governments have been disclosed
in United States (“US”) dollars, unless otherwise shown.
This is consistent with Barrick’s functional currency for
consolidated accounting purposes. Payments denominated
in currencies other than US dollars were translated using
the exchange rate at the time the payment was made. The
average exchange rates for 2016 are as follows:
Currency Average Exchange Rate
Argentinean peso ARS per $US 14.73
Australian dollar $US per $AUD 0.74
Canadian dollar $CAD per $US 1.32
Chilean peso CLP per $US 676
Dominican peso DOP per $US 46
Peruvian sol PEN per $US 3.37
Zambian kwacha ZMW per $US 10.31
4 Payments
Reportable payments made to governments are presented
on a net cash basis for the year ended December 31, 2016.
Any payment, whether made as a single payment or a se-
ries of payments, below $75,485 (CAD $100,000 threshold
as set out under the Act converted to USD using the full
year average exchange rate) in a given category to a partic-
ular government was not reported.
Reportable payments have been rounded to the nearest
$10,000 but rounding was not to be used for determining
reportable payments.
A TaxesThis category consists of taxes paid to governments based
on income, profit or production in relation to the com-
mercial development of minerals. The following are not
included in total payments to governments:
• Consumption tax, such as value-added tax, excise tax
and custom tax
• Personal income tax
• Withholding tax
• Taxes which were offset by credits
• Other taxes that do not relate to the commercial devel-
opment of minerals, such as payroll tax, stamp tax and
personal asset tax
B RoyaltiesThis category consists of royalties paid to governments
relating to the commercial development of minerals. No
royalties paid in kind have been made to governments for
the year ended December 31, 2016.
C feesThis category consists of fees paid to governments relating
to the commercial development of minerals, such as permit
and license fees. This does not include amounts paid in the
ordinary course of commercial transactions in exchange for
services provided by governments, such as utilities paid at
market rates.

38 Barrick Gold Corporation 2016 Economic Contributions Report
d Production entitlementsThis category includes payments made to governments
relating to a share of production under production sharing
agreements. There were no production entitlements pay-
ments made to governments for the year ended December
31, 2016.
E BonusesThis category includes signing, discovery, production and
any other type of bonuses paid to governments. There were
no bonus payments made to governments for the year
ended December 31, 2016.
f dividendsThis category consists of dividends paid to governments on
shares given in lieu of a bonus, production entitlements,
royalties or other fees. This does not include dividends
paid to governments as an ordinary shareholder. There
were no dividends paid to governments for the year ended
December 31, 2016.
G infrastructure improvement paymentsThis category consists of payments made to governments
for the construction of public infrastructure, such as roads,
schools and hospitals that directly relate to the commercial
development of minerals. This does not include infrastruc-
ture improvement payments that relate primarily to the
operational purposes of Barrick. Payments are reported in
the period in which the payment was made.

39 2016 Economic Contributions Report Barrick Gold Corporation
Cautionary statement on forward looking information
Certain information contained or incorporated by reference in this document, including any information as to our economic contribu-tions, sustainability strategy and vision, projects, plans, or future financial or operating performance, constitutes “forward-looking statements”. All statements, other than statements of historical fact, are forward-looking statements. The words “believes”, “expect”, “target”, “plan”, “objective” “aspires”, “aim”, “project”, “continue”, “estimate”, “potential”, “may”, “will”, “can”, and similar expressions identify forward-looking statements. In particular, this document contains forward-looking statements including, without limitation, with respect to (i) Barrick’s social and economic development contributions; (ii) Barrick’s corporate social responsibility (includ-ing sustainable development, community relations and security matters), and human rights programs, policies and performance; (iii) the estimated timing to achieve environmental, social and energy reduction targets; (iv) projected capital, operating and exploration expen-ditures; (v) joint ventures and partnerships; (vi) the expected time of closing of certain announced transactions; (vii) production rates; and (viii) expectations regarding future performance and other outlook or guidance.
Forward-looking statements are necessarily based upon a number of estimates and assumptions that, while considered reasonable by the Company as at the date of this document in light of management’s experience and perception of current conditions and expected developments, are inherently subject to significant business, economic and competitive uncertainties and contingencies. Known and un-known factors could cause actual results to differ materially from those projected in the forward-looking statements, and undue reliance should not be placed on such statements and information. Such factors include, but are not limited to: changes in national and local gov-ernment legislation, taxation, controls or regulations, and/or changes in the administration of laws, policies, and practices, expropriation or nationalization of property and political or economic developments in Canada, the United States, and other jurisdictions in which the Company does or may carry on business in the future; damage to the Company’s reputation due to the actual or perceived occurrence of any number of events, including negative publicity with respect to the Company’s handling of environmental matters or dealings with community groups, whether true or not; availability and increased costs associated with mining inputs and labor; risk of loss due to acts of war, terrorism, sabotage and civil disturbances; litigation; contests over title to properties, particularly title to undeveloped properties, or over access to water, power and other required infrastructure; risks associated with working with partners in jointly controlled assets; employee relations; the benefits expected from transactions being realized; our ability to successfully integrate acquisitions or complete divestitures; risks associated with the implementation of Barrick’s digital transformation initiative; increased costs and risks related to the potential impact of climate change; fluctuations in the spot and forward price of gold, copper, or certain other commodities (such as silver, diesel fuel, natural gas, and electricity); the speculative nature of mineral exploration and development; changes in mineral production performance, exploitation, and exploration successes; diminishing quantities or grades of reserves; increased costs, delays, suspensions, and technical challenges associated with the construction of capital projects; operating or technical difficulties in connection with mining or development activities, including geotechnical challenges, and disruptions in the maintenance or provision of required infrastructure and information technology systems; failure to comply with environmental and health and safety laws and regulations; timing of receipt of, or failure to comply with, necessary permits and approvals; uncertainty whether some or all of the Best-in-Class ini-tiatives and targeted investments and projects will meet the Company’s capital allocation objectives; and business opportunities that may be presented to, or pursued by, the Company. In addition, there are risks and hazards associated with the business of mineral exploration, development and mining, including environmental hazards, industrial accidents, unusual or unexpected formations, pressures, cave-ins, flooding and gold bullion, copper cathode or gold or copper concentrate losses (and the risk of inadequate insurance, or inability to obtain insurance, to cover these risks).
Many of these uncertainties and contingencies can affect our actual results and could cause actual results to differ materially from those expressed or implied in any forward-looking statements made by, or on behalf of, us. Readers are cautioned that forward-looking statements are not guarantees of future performance. All of the forward-looking statements made in this document are qualified by these cautionary statements. Specific reference is made to the most recent Form 40-F/Annual Information Form on file with the SEC and Canadian provincial securities regulatory authorities for a more detailed discussion of some of the factors underlying forward-looking statements and the risks that may affect Barrick’s ability to achieve the expectations set forth in the forward-looking statements con-tained in this document.
The Company disclaims any intention or obligation to update or revise any forward-looking statements whether as a result of new infor-mation, future events or otherwise, except as required by applicable law.