the economic and employment contributions of...
TRANSCRIPT
The Economic and EmploymentContributions of Unconventional GasDevelopment in State Economies
Prepared for:
AMERICA'S NATURAL GAS ALLIANCE
Submitted by:
IHS Inc.
1150 Connecticut Avenue NW, Suite 401
Washington, DC 20036
June 2012
ii JUNE 2012
THE ECONOMIC AND EMPLOYMENT CONTRIBUTIONS OF UNCONVENTIONAL GAS DEVELOPMENT IN STATE ECONOMIES
About IHS (ihs.com)
IHS Inc. (NYSE: IHS) is a leading source of information and insight in critical areas that shape today's business landscape, in-cluding energy and power; design and supply chain; defense, risk and security; environmental, health and safety, and sus-tainability; country and industry forecasting; and commodities, pricing and cost. IHS has been in business since 1959 andbecame a publicly traded company on the New York Stock Exchange in 2005. Headquartered in Englewood, Colorado,USA, IHS employs more than 5,100 people in more than 30 countries around the world.
About IHS Global Insight
IHS Global Insightis one of the leading economic analysis and forecasting firms in the world. With over 600 economists, stat-isticians, and industry specialists in 25 offices worldwide, IHS Global Insight has an established track record for providing rig-orous, objective forecast analysis and data to governments and businesses around the world. Among our areas of expertise are the economic impact, tax implications, and job-creation dynamics within multiple sectorscore to national, state and local economies. It helps governments and companies at all levels interpret the impact of pro-posed investments, policies, programs, and projects.IHS Global Insight was formed by the merger of DRI and WEFA. Still active in an advisory capacity to the firm is the originalfounder of WEFA, Lawrence R. Klein, the 1980 winner of the Nobel Prize in Economics.
For more information, contact:Richard F. Fullenbaum
Vice President, Public Sector, IHS [email protected]
John W. LarsonVice President, Public Sector, IHS
For press information, contact:Jim Dorsey
Senior Manager Media Relations, [email protected]
IHS1150 Connecticut Avenue NW, Suite 401
Washington, DC 20036
© 2012 IHS. All information contained herein is obtained by IHS Inc. from sources believed by it to be accurate and reliable. All fore-casts and predictions contained herein are believed by IHS, Inc. to be as accurate as the data and methodologies will allow. How-ever, because of the possibilities of human and mechanical error, as well as other factors such as unforeseen and unforeseeablechanges in political and economic circumstances beyond IHS's control, the information herein is provided "as is" without warranty ofany kind and IHS Inc., AND ALL THIRD PARTY PROVIDERS MAKE NO REPRESENTATIONS OR WARRANTIES EXPRESS OR IM-PLIED TO ANY SUBSCRIBER OR ANY OTHER PERSON OR ENTITY AS TO THE ACCURACY, TIMELINESS, COMPLETENESS,MERCHANTABILITY OR FITNESS FOR ANY PARTICULAR PURPOSE OF ANY OF THE INFORMATION OR FORECASTS CON-TAINED HEREIN.

Project Team
Authors
Mohsen Bonakdarpour, Director, Economic Analysis and Planning, IHS Consulting John W. Larson, Vice President, Public Sector, IHS Consulting
Contributors
Tabitha M. Bailey, Project Manager and Senior Associate, Public Sector, IHS ConsultingRichard F. Fullenbaum, Special Advisor and Vice President, Public Sector, IHS Consulting
Acknowledgments
We would like to acknowledge IHS Cambridge Energy Research Associates (IHS CERA) on which we have reliedfor oil and gas expertise and analysis. For the data on oil and gas production, holdings, and reserves, we have usedIHS CERA's extensive oil and gas databases. In particular, we want to thank Dr. Mary Barcella, Director and NorthAmerican Natural Gas and team leader, IHS CERA; Samuel Andrus, Director, North American Natural Gas, IHSCERA; and James Osten, Director, North American Natural Gas, IHS CERA.
We also would also like to thank the additional subject matter experts, technical experts, industry experts and an-alysts who have contributed to this study:
Parker Andrews, John Anton, Rick Chamberlain, Laura Hand, Miguel Goncalves, Samantha Gross, YanniHe, Dewey Johnson, Rafael McDonald, Joe Michael, Michael Montgomery, Walter Moody, John Mother-sole, Shane Norton, Sunaina Ocalan, Rajeevee Panditharatna, Frantz Price, Surya Rajan, Curtis Smith,Tom Runiewicz, Mark Wegenka, and Steve Zinger.
IHS offers an independent assessment of the importance unconventional gas to the overall US economy. Thisresearch was supported by the America's Natural Gas Alliance (ANGA). IHS is exclusively responsible for all ofthe analysis and content contained herein. The analyses and metrics developed during the course of this re-search are intended to contribute to the national dialogue on the role of unconventional gas in terms of produc-tion, employment, economic growth, and energy security.
THE ECONOMIC AND EMPLOYMENT CONTRIBUTIONS OF UNCONVENTIONAL GAS DEVELOPMENT IN STATE ECONOMIES
IHS iii

THE ECONOMIC AND EMPLOYMENT CONTRIBUTIONS OF UNCONVENTIONAL GAS DEVELOPMENT IN STATE ECONOMIES
IHS v
Executive Summary: The Economic and Employment Contributions of UnconventionalGas Development in State Economies
In our 2009 study, "The Contributions of the Natural Gas Industry to the US National and State Economies,"IHS examined the US economic and employment contributions of the natural gas industry's conventionaland unconventional drilling and production activities. Our subsequent study released in December 2011,"The Economic and Employment Contributions of Shale Gas in the United States," furthered this research byfocusing on the economic benefits to the nation of the natural gas industry's unconventional shale activity.
This study, "The Economic and Employment Contributions of Unconventional Gas Development in StateEconomies" examines the natural gas industry's unconventional gas activities—gas production from shaleformations, tight sands and coal bed methane (CBM)—at the state level. The report assesses the economicbenefits of this growth, including the employment contributions for each of the US lower 48 states and theDistrict of Columbia through 2035. These projections are based on the assumption that there are no sig-nificant changes to the current levels of environmental regulations at the federal or state level throughoutthe forecast horizon.
Unconventional gas activity is having a dramatic impact on employment and economic growth across the US lower48 states and the District of Columbia, in terms of jobs and its contribution to gross state product (GSP) and, byextension, US gross domestic product (GDP). This reflects the significant capital intensity required to develop un-conventional gas resources, the ability to source inputs from a coast-to-coast network of suppliers and professionalservices around the United States, and the high quality of the jobs created by this activity.
Unconventional gas is expected to lead future growth in US natural gas productive capacity. By 2015, the share ofUS natural gas produced from unconventional sources will increase to 67% and, by 2035, will reach 79%. In-creased unconventional gas activity will contribute to capital investment, job opportunities, economic growth, gov-ernment revenue, and lower prices across the country including:
• Nearly $3.2 trillion in investments in the development of unconventional gas are expected to fuel the increasein production between 2010 and 2035.
• In 2010, unconventional gas activity supported 1 million jobs; this will grow to nearly 1.5 million jobs in 2015and to over 2.4 million in 2035.
• By 2015, unconventional gas activities will contribute nearly $50 billion in federal, state and local governmenttax and federal royalty revenue; between 2010 and 2035, continued development of unconventional gas willgenerate a cumulative total of nearly $1.5 trillion in federal, state, and local tax and royalty revenue.
This study, which focuses on 58 unconventional gas plays across the lower 48 US states, assesses their economicimpact on each individual state. Three types of gas plays are analyzed in this report: natural gas extracted from shaleformations, tight sands, and CBM. These are referred to collectively throughout this report as "unconventional gas."1
The following are highlights of this study's findings regarding the economic contributions to individual states, in termsof jobs, GSP, and tax revenue paid to federal, state and local governments as a result of unconventional gas activity:
• Over the projection horizon, there are 20 "producing" states for unconventional gas—comprised of 13 states thathave both existing and new well completion and production activities and seven additional states that have pro-duction activity associated with existing unconventional gas wells. Together, unconventional gas activity in theseproducing states contributed more than 826,000 jobs in 2010 and that number will grow to nearly 1.2 millionjobs by 2015.
1 The major distinction between conventional and unconventional natural gas has to do with the permeability (or lack thereof) of the sourcerock in which they are contained. In a conventional natural gas reservoir, natural gas has migrated upward from its source rock through otherpermeable rocks until it has become trapped by an impermeable layer of rock. Unconventional natural gas is contained in source rock of lowpermeability, and hence is unable to move at all out of the source rock. Given the increasingly dominant share of this type of natural gas pro-duction, the term 'unconventional' may no longer be appropriate, though it remains in common use.
vi JUNE 2012
THE ECONOMIC AND EMPLOYMENT CONTRIBUTIONS OF UNCONVENTIONAL GAS DEVELOPMENT IN STATE ECONOMIES
• According to US Bureau of Labor Statistics data, the majority of top-producing states have shown lower unem-ployment than the overall national average. In 2010, the Top 5 producing states' unemployment rates were 6.9-8.9%, compared with the national average of 9.6%.
• Between 2010 and 2015, the Top 10 producing states—as ranked by employment generated by their uncon-ventional gas activity—will experience a compound annual employment growth rate of nearly 8%. Pennsylvaniaand Colorado are expected to lead in employment contribution growth, experiencing compound annual growthrates of roughly 14% and 10% respectively. Total US employment is expected to grow at an average rate of 1.6%during the same time period.
• By 2015, the 20 producing states will contribute just over $41 billion in federal, state and local government taxand federal royalty revenue. By 2035, these receipts will be nearly $72 billion.
• Non-producing states—defined as the 28 states and the District of Columbia that do not include current or pro-jected unconventional gas resource development—still benefit from their roles as suppliers in the unconven-tional gas expansion in the future. Together, in 2010, they contribute 18% of the total US employment generatedby unconventional gas activity and 17% of the resulting tax revenue. By 2035, employment and government rev-enues in these states grow more than two-fold.
The dramatic impact on employment and the economy from unconventional gas activity reflects its significant cap-ital intensity requirements, the ability to source inputs from domestic sources, the coast-to-coast structure of thesupply chain, and the high quality of the jobs created.2 These economic contributions will be largely driven by ac-tivity in the 20 producing states with both new well completion and production or existing production. However, the28 non-producing states that do not include projected unconventional gas development will still contribute nearlyone in every five jobs to the overall economy.
2 For more information, please see "The Economic and Employment Contributions of Shale Gas in the United States:"http://www.ihs.com/info/ecc/a/shale-gas-jobs-report.aspx.

THE ECONOMIC AND EMPLOYMENT CONTRIBUTIONS OF UNCONVENTIONAL GAS DEVELOPMENT IN STATE ECONOMIES
IHS vii
TABLE OF CONTENTS
Overview . . . . . . . . . . . . . . . . . . . . . . . . . . . . . . . . . . . . . . . . . . . . . . . . . . . . . . . . . . . . . . . . . . . . . . . . . .1Jobs: Nearly 1.5 Million US Jobs by 2015—268,000 in Non-Producing States Alone . . . . . . . . . . . . . .3Government Revenue: Nearly $50 Billion Nationwide by 2015—$8 Billion in Non-Producing States . . .5Value Added: Nearly $197 Billion in US GDP by 2015—$22 Billion from Non-Producing States . . . . . .6Structure of the Report . . . . . . . . . . . . . . . . . . . . . . . . . . . . . . . . . . . . . . . . . . . . . . . . . . . . . . . . . . . . .8
1. Background . . . . . . . . . . . . . . . . . . . . . . . . . . . . . . . . . . . . . . . . . . . . . . . . . . . . . . . . . . . . . . . . . . . . . .9
2. Methodology and Approach . . . . . . . . . . . . . . . . . . . . . . . . . . . . . . . . . . . . . . . . . . . . . . . . . . . . . . . . .10Energy . . . . . . . . . . . . . . . . . . . . . . . . . . . . . . . . . . . . . . . . . . . . . . . . . . . . . . . . . . . . . . . . . . . . . . . .10Economic Contribution Assessment . . . . . . . . . . . . . . . . . . . . . . . . . . . . . . . . . . . . . . . . . . . . . . . . . .12
Data Requirements and Assumptions . . . . . . . . . . . . . . . . . . . . . . . . . . . . . . . . . . . . . . . . . . . . . .12Capital Expenditures . . . . . . . . . . . . . . . . . . . . . . . . . . . . . . . . . . . . . . . . . . . . . . . . . . . . . . . . . . .12Modeling the State Economic Contribution . . . . . . . . . . . . . . . . . . . . . . . . . . . . . . . . . . . . . . . . . .15
3. Results . . . . . . . . . . . . . . . . . . . . . . . . . . . . . . . . . . . . . . . . . . . . . . . . . . . . . . . . . . . . . . . . . . . . . . . .16
4. Conclusion . . . . . . . . . . . . . . . . . . . . . . . . . . . . . . . . . . . . . . . . . . . . . . . . . . . . . . . . . . . . . . . . . . . . . .19
Appendix A. Economic Contributions by State and Year . . . . . . . . . . . . . . . . . . . . . . . . . . . . . . . . . . . . .A-1Employment Contribution: Alphabetical by State . . . . . . . . . . . . . . . . . . . . . . . . . . . . . . . . . . . . . . . .A-2Employment Contribution by State: Ranked by Total Contribution . . . . . . . . . . . . . . . . . . . . . . . . . . .A-8Value Added Contribution: Alphabetical by State . . . . . . . . . . . . . . . . . . . . . . . . . . . . . . . . . . . . . . .A-14Value Added Contribution by State: Ranked by Total Contribution . . . . . . . . . . . . . . . . . . . . . . . . . .A-20Labor Income Contribution: Alphabetical by State . . . . . . . . . . . . . . . . . . . . . . . . . . . . . . . . . . . . . .A-26Government Revenue and Private Lease Payments by State . . . . . . . . . . . . . . . . . . . . . . . . . . . . . .A-32
Appendix B. Economic Contributions by State, Industry, and Year . . . . . . . . . . . . . . . . . . . . . . . . . . . . .B-1Employment Contribution by State and Industry . . . . . . . . . . . . . . . . . . . . . . . . . . . . . . . . . . . . . . . .B-2Value Added Contribution by State and Industry . . . . . . . . . . . . . . . . . . . . . . . . . . . . . . . . . . . . . .B-100Labor Income Contribution by State and Industry . . . . . . . . . . . . . . . . . . . . . . . . . . . . . . . . . . . . .B-198
Appendix C. Economic Contributions Excluding Cross-State Contributions by State and Year . . . . . . . .C-1Employment Contribution Excluding Cross-State Contributions: Alphabetical by State . . . . . . . . . . .C-2Value Added Contribution Excluding Cross-State Contributions: Alphabetical by State . . . . . . . . . . .C-8Labor Income Contribution Excluding Cross-State Contributions: Alphabetical by State . . . . . . . . .C-14
Appendix D. The Economic and Employment Contributions of Non-Shale Unconventional Gas inthe United States . . . . . . . . . . . . . . . . . . . . . . . . . . . . . . . . . . . . . . . . . . . . . . . . . . . . . . . . . . . . . . . . . .D-1

THE ECONOMIC AND EMPLOYMENT CONTRIBUTIONS OF UNCONVENTIONAL GAS DEVELOPMENT IN STATE ECONOMIES
IHS 1
OverviewIn our 2009 study “The Contributions of the Natural Gas Industry to the US National and State Economies,” IHSexamined the U.S economic and employment contributions of the entire natural gas industry, which includes bothconventional and unconventional activities. Our subsequent study, “The Economic and Employment Contributionsof Shale Gas in the United States,” furthered this research by focusing on the natural gas industry’s unconven-tional shale activity for the nation. As a companion to that report, this study examines the natural gas industry’s un-conventional activities—namely gas production from shale, tight sands and CBM—at a state level to assess theeconomic and employment contributions in each of the lower 48 states and the District of Columbia through 2035.The projections presented within this report are based on the assumption that there are no significant changes tothe current levels of environmental regulations at the federal or state level throughout the forecast horizon.
To understand the economic and employment contributions at the state level, we begin with a national perspec-tive of the total unconventional gas activity. The economic contributions associated with all unconventional gas ac-tivities are significant. Rapid development of these unconventional resources is projected to fundamentally alterUS sources of natural gas production for decades to come. In fact, in 2010 alone, unconventional gas activity al-ready represented 53% of total US gas production and is projected to rise to 79% by 2035. Fueling this increasein the proportion of natural gas production from unconventional activity is a projected $3.2 trillion in cumulativecapital investments through 2035. These massive capital outlays, along with the promise of stable low natural gasprices, will have profound national economic consequences including:
• By 2015, the employment contributed by unconventional gas activity is projected to reach nearly 1.5 millionUS jobs on a path to more than 2.4 million jobs by 2035.
• By 2015, the annual contribution of unconventional gas activity to GDP is projected to reach nearly $197 bil-lion and, by 2035, is expected to more than double to nearly $332 billion.
• By 2015, government revenue provided by unconventional gas activity is projected to reach nearly $50 billionand will continue to rise to nearly $86 billion by 2035. Over the entire 25-year projected horizon of this study,this activity is expected to generate nearly $1.5 trillion in total government revenue.
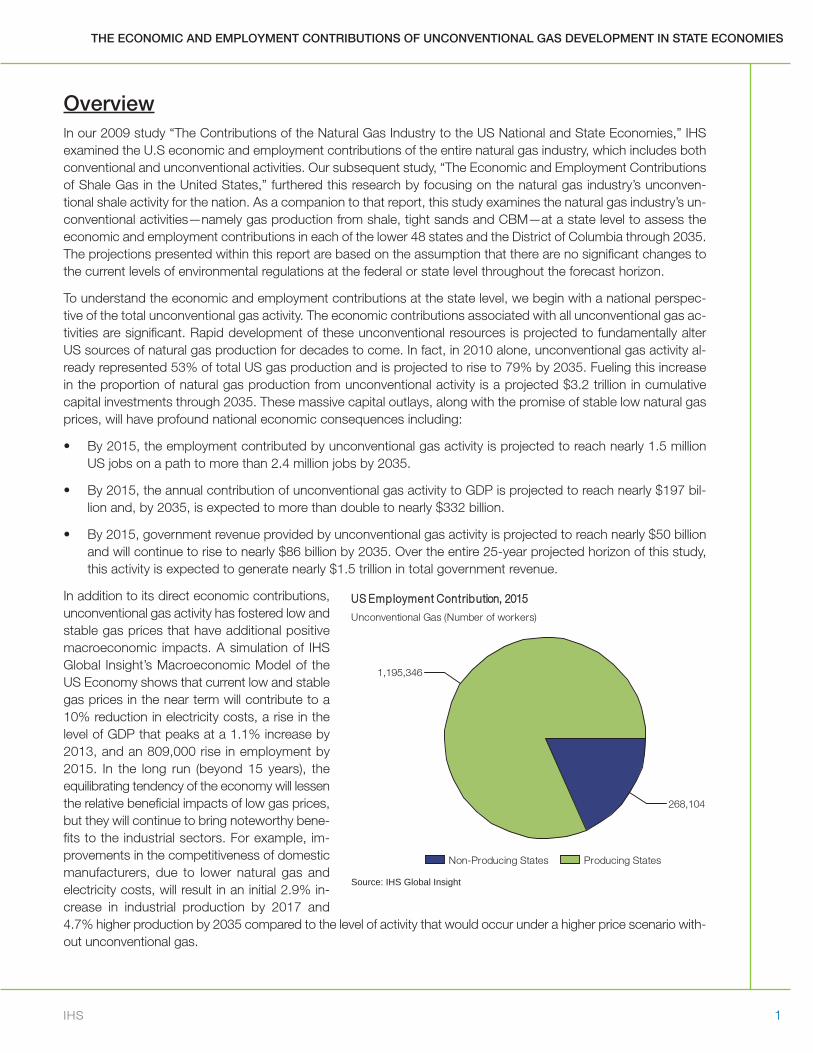
In addition to its direct economic contributions,unconventional gas activity has fostered low andstable gas prices that have additional positivemacroeconomic impacts. A simulation of IHSGlobal Insight’s Macroeconomic Model of theUS Economy shows that current low and stablegas prices in the near term will contribute to a10% reduction in electricity costs, a rise in thelevel of GDP that peaks at a 1.1% increase by2013, and an 809,000 rise in employment by2015. In the long run (beyond 15 years), theequilibrating tendency of the economy will lessenthe relative beneficial impacts of low gas prices,but they will continue to bring noteworthy bene-fits to the industrial sectors. For example, im-provements in the competitiveness of domesticmanufacturers, due to lower natural gas andelectricity costs, will result in an initial 2.9% in-crease in industrial production by 2017 and4.7% higher production by 2035 compared to the level of activity that would occur under a higher price scenario with-out unconventional gas.
268,104
1,195,346
Non-Producing States Producing States
UUSS EEmmppllooyymmeenntt CCoonnttrriibbuuttiioonn,, 22001155
Unconventional Gas (Number of workers)
Source: IHS Global Insight
2 JUNE 2012
THE ECONOMIC AND EMPLOYMENT CONTRIBUTIONS OF UNCONVENTIONAL GAS DEVELOPMENT IN STATE ECONOMIES
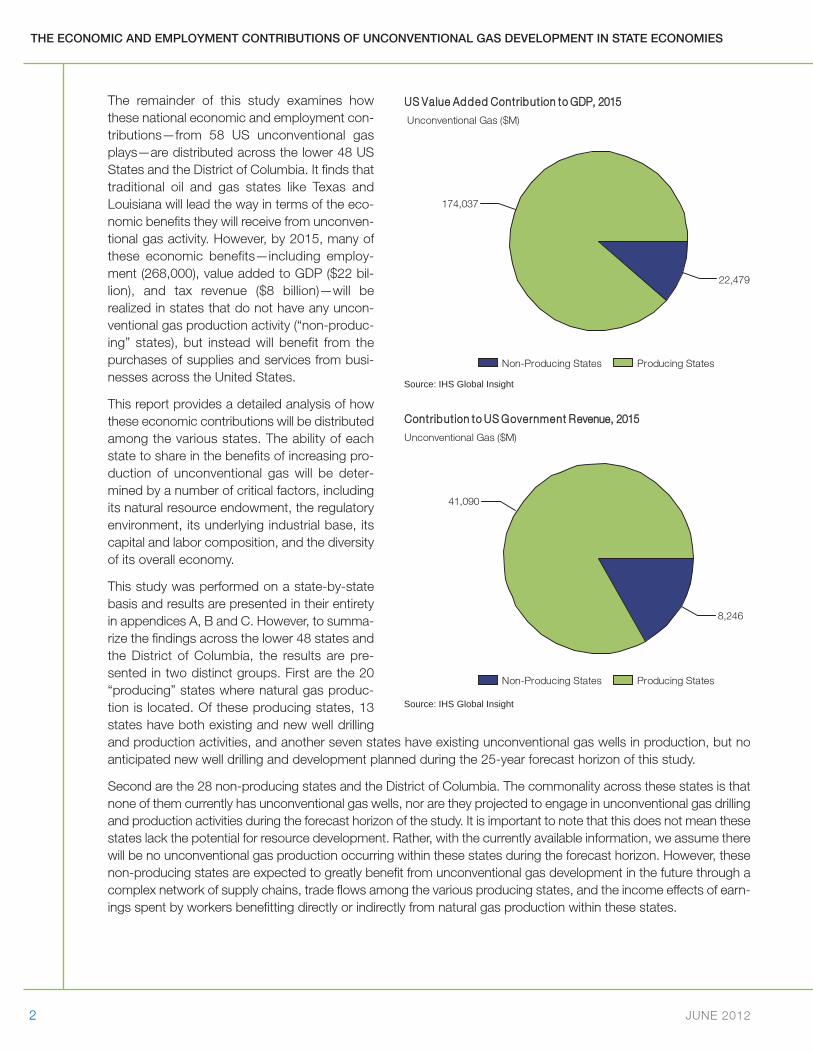
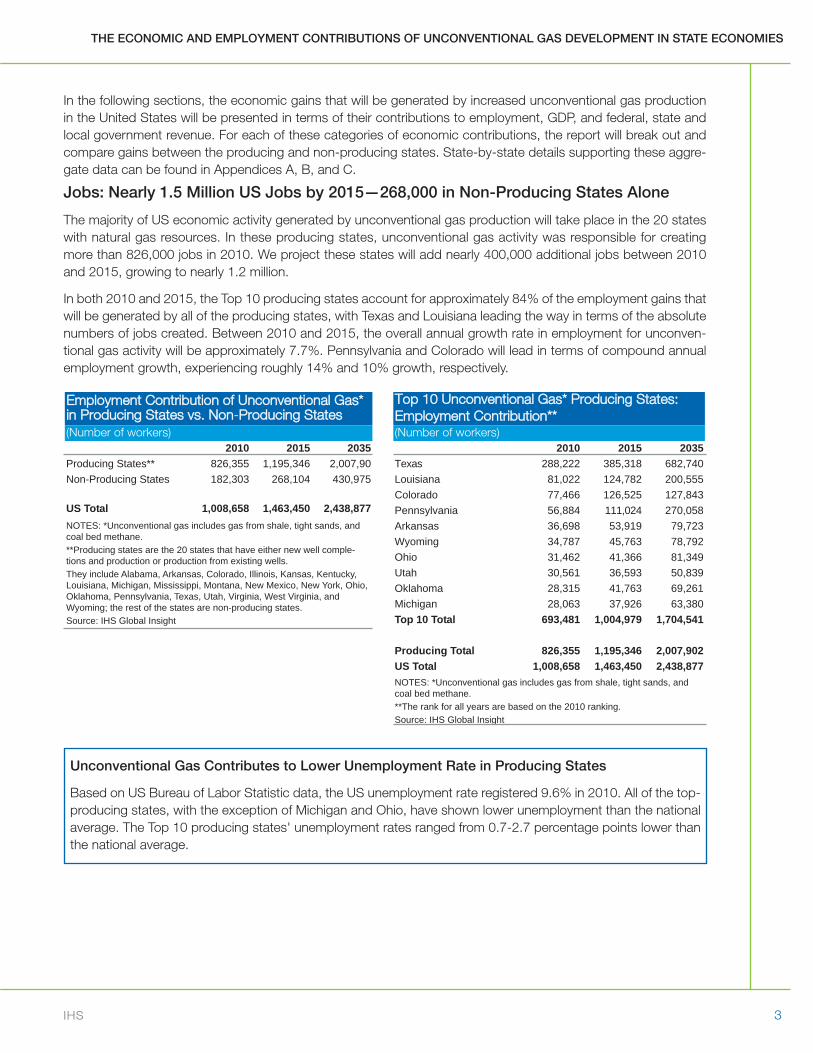
The remainder of this study examines howthese national economic and employment con-tributions—from 58 US unconventional gasplays—are distributed across the lower 48 USStates and the District of Columbia. It finds thattraditional oil and gas states like Texas andLouisiana will lead the way in terms of the eco-nomic benefits they will receive from unconven-tional gas activity. However, by 2015, many ofthese economic benefits—including employ-ment (268,000), value added to GDP ($22 bil-lion), and tax revenue ($8 billion)—will berealized in states that do not have any uncon-ventional gas production activity (“non-produc-ing” states), but instead will benefit from thepurchases of supplies and services from busi-nesses across the United States.
This report provides a detailed analysis of howthese economic contributions will be distributedamong the various states. The ability of eachstate to share in the benefits of increasing pro-duction of unconventional gas will be deter-mined by a number of critical factors, includingits natural resource endowment, the regulatoryenvironment, its underlying industrial base, itscapital and labor composition, and the diversityof its overall economy.
This study was performed on a state-by-statebasis and results are presented in their entiretyin appendices A, B and C. However, to summa-rize the findings across the lower 48 states andthe District of Columbia, the results are pre-sented in two distinct groups. First are the 20“producing” states where natural gas produc-tion is located. Of these producing states, 13states have both existing and new well drillingand production activities, and another seven states have existing unconventional gas wells in production, but noanticipated new well drilling and development planned during the 25-year forecast horizon of this study.
Second are the 28 non-producing states and the District of Columbia. The commonality across these states is thatnone of them currently has unconventional gas wells, nor are they projected to engage in unconventional gas drillingand production activities during the forecast horizon of the study. It is important to note that this does not mean thesestates lack the potential for resource development. Rather, with the currently available information, we assume therewill be no unconventional gas production occurring within these states during the forecast horizon. However, thesenon-producing states are expected to greatly benefit from unconventional gas development in the future through acomplex network of supply chains, trade flows among the various producing states, and the income effects of earn-ings spent by workers benefitting directly or indirectly from natural gas production within these states.
22,479
174,037
Non-Producing States Producing States
UUSS VVaalluuee AAddddeedd CCoonnttrriibbuutt iioonn ttoo GGDDPP,, 22001155
Unconventional Gas ($M)
Source: IHS Global Insight
8,246
41,090
Non-Producing States Producing States
CCoonnttrriibbuutt iioonn ttoo UUSS GGoovveerrnnmmeenntt RReevveennuuee,, 22001155
Unconventional Gas ($M)
Source: IHS Global Insight
THE ECONOMIC AND EMPLOYMENT CONTRIBUTIONS OF UNCONVENTIONAL GAS DEVELOPMENT IN STATE ECONOMIES
IHS 3
In the following sections, the economic gains that will be generated by increased unconventional gas productionin the United States will be presented in terms of their contributions to employment, GDP, and federal, state andlocal government revenue. For each of these categories of economic contributions, the report will break out andcompare gains between the producing and non-producing states. State-by-state details supporting these aggre-gate data can be found in Appendices A, B, and C.
Jobs: Nearly 1.5 Million US Jobs by 2015—268,000 in Non-Producing States Alone
The majority of US economic activity generated by unconventional gas production will take place in the 20 stateswith natural gas resources. In these producing states, unconventional gas activity was responsible for creatingmore than 826,000 jobs in 2010. We project these states will add nearly 400,000 additional jobs between 2010and 2015, growing to nearly 1.2 million.
In both 2010 and 2015, the Top 10 producing states account for approximately 84% of the employment gains thatwill be generated by all of the producing states, with Texas and Louisiana leading the way in terms of the absolutenumbers of jobs created. Between 2010 and 2015, the overall annual growth rate in employment for unconven-tional gas activity will be approximately 7.7%. Pennsylvania and Colorado will lead in terms of compound annualemployment growth, experiencing roughly 14% and 10% growth, respectively.
Unconventional Gas Contributes to Lower Unemployment Rate in Producing States
Based on US Bureau of Labor Statistic data, the US unemployment rate registered 9.6% in 2010. All of the top-producing states, with the exception of Michigan and Ohio, have shown lower unemployment than the nationalaverage. The Top 10 producing states' unemployment rates ranged from 0.7-2.7 percentage points lower thanthe national average.
Employment CContribution oof UUnconventional GGas*in PProducing SStates vvs. NNon-PProducing SStates(Number of workers)
2010 2015 2035Producing States** 826,355 1,195,346 2,007,90Non-Producing States 182,303 268,104 430,975
US Total 1,008,658 1,463,450 2,438,877NOTES: *Unconventional gas includes gas from shale, tight sands, andcoal bed methane. **Producing states are the 20 states that have either new well comple-tions and production or production from existing wells. They include Alabama, Arkansas, Colorado, Illinois, Kansas, Kentucky,Louisiana, Michigan, Mississippi, Montana, New Mexico, New York, Ohio,Oklahoma, Pennsylvania, Texas, Utah, Virginia, West Virginia, andWyoming; the rest of the states are non-producing states.Source: IHS Global Insight
Top 110 UUnconventional GGas* PProducing SStates:Employment CContribution**(Number of workers)
2010 2015 2035Texas 288,222 385,318 682,740Louisiana 81,022 124,782 200,555Colorado 77,466 126,525 127,843Pennsylvania 56,884 111,024 270,058Arkansas 36,698 53,919 79,723Wyoming 34,787 45,763 78,792Ohio 31,462 41,366 81,349Utah 30,561 36,593 50,839Oklahoma 28,315 41,763 69,261Michigan 28,063 37,926 63,380Top 10 Total 693,481 1,004,979 1,704,541
Producing Total 826,355 1,195,346 2,007,902US Total 1,008,658 1,463,450 2,438,877NOTES: *Unconventional gas includes gas from shale, tight sands, andcoal bed methane. **The rank for all years are based on the 2010 ranking.Source: IHS Global Insight
4 JUNE 2012
THE ECONOMIC AND EMPLOYMENT CONTRIBUTIONS OF UNCONVENTIONAL GAS DEVELOPMENT IN STATE ECONOMIES
One of the most important findings from this study is thefact that the economic contributions from unconventionalgas activity are not limited to states endowed with theresources. For example, California does not directly pro-duce unconventional gas, yet the economic activity as-sociated with unconventional gas production supportednearly 23,000 jobs in California in 2010; the state’s un-conventional gas activity-related employment is expectedto increase to more than 33,000 jobs by 2015 and willmore than double to nearly 49,500 by 2035.
Top 110 UUnconventional GGas* NNon-PProducingStates: EEmployment CContribution**(Number of workers)
2010 2015 2035California 22,773 33,265 49,494Florida 15,758 27,402 30,903Georgia 13,294 18,800 29,262Missouri 12,031 17,427 30,105North Carolina 11,377 16,570 28,271Indiana 10,819 15,206 26,837Wisconsin 9,608 14,285 24,871Minnesota 9,271 14,499 22,638Tennessee 8,519 12,323 21,487Maryland 7,008 10,263 16,634Top 10 Total 120,459 180,042 280,503
Non-Producing Total 182,303 268,104 430,975US Total 1,008,658 1,463,450 2,438,877NOTES: *Unconventional gas includes gas from shale, tight sands, andcoal bed methane. **The rank for all years are based on the 2010 ranking.Source: IHS Global Insight
Unconventional Gas Fuels States' Economic Recoveries
As the nation's economic recovery continues, state labor markets are expected to exhibit different growth pat-terns that will be determined by their industrial initiatives. During the next few years, IHS Global Insight's outlookfor state economies shows that four out of the five states with the strongest employment growth will either beunconventional gas producers or will appear on top of the list of non-producing states. The five states are NorthDakota, Utah, Colorado, Florida, and Texas—all of them are expected to have annual employment growth thatexceeds 2% through 2015.
While IHS Global Insight expects economic conditions to improve over the next few years, with average US un-employment falling to 6.8% by 2015, top producing states' unemployment rates will outperform the national av-erage.
Employment Composition Varies in Producing and Non-Producing States
The employment contributions and the types of jobs created by the natural gas industry's unconventional gasactivity vary between the producing and non-producing states. The main reasons for these differences are thescope of direct industrial activity, the location of capital goods that are purchased, the supply chain, and the in-come ramifications throughout the economy.
In the producing states, a greater proportion of the total jobs generated are found in direct production or key sup-port industries of unconventional gas activity. In Arkansas, for example, 30% of all of employment associated withunconventional gas is found in the mining sector, followed by other key industries such as construction, trade,and manufacturing. Alternatively, in non-producing states, more employment is generated in supplier networksthat support the unconventional gas activity. In California, 47% and 30% of employment, respectively, is in theservice sector and in manufacturing.
THE ECONOMIC AND EMPLOYMENT CONTRIBUTIONS OF UNCONVENTIONAL GAS DEVELOPMENT IN STATE ECONOMIES
IHS 5
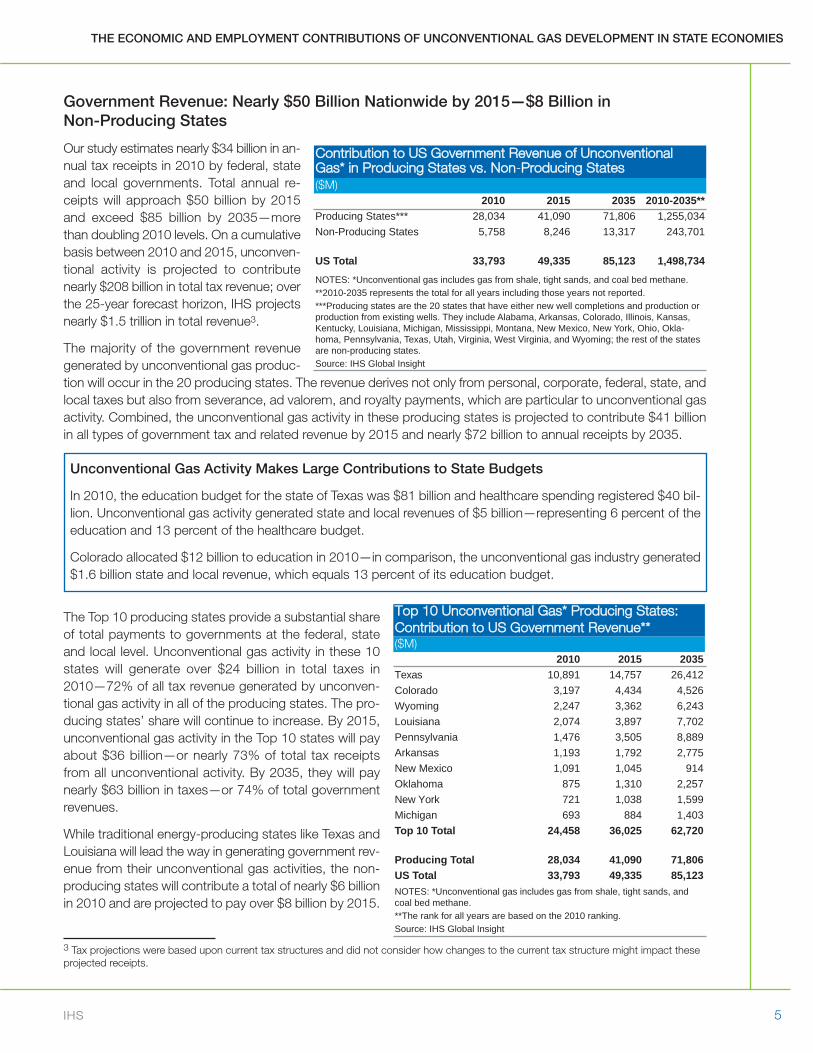
Government Revenue: Nearly $50 Billion Nationwide by 2015—$8 Billion in Non-Producing States
Our study estimates nearly $34 billion in an-nual tax receipts in 2010 by federal, stateand local governments. Total annual re-ceipts will approach $50 billion by 2015and exceed $85 billion by 2035—morethan doubling 2010 levels. On a cumulativebasis between 2010 and 2015, unconven-tional activity is projected to contributenearly $208 billion in total tax revenue; overthe 25-year forecast horizon, IHS projectsnearly $1.5 trillion in total revenue3.
The majority of the government revenuegenerated by unconventional gas produc-tion will occur in the 20 producing states. The revenue derives not only from personal, corporate, federal, state, andlocal taxes but also from severance, ad valorem, and royalty payments, which are particular to unconventional gasactivity. Combined, the unconventional gas activity in these producing states is projected to contribute $41 billionin all types of government tax and related revenue by 2015 and nearly $72 billion to annual receipts by 2035.
The Top 10 producing states provide a substantial shareof total payments to governments at the federal, stateand local level. Unconventional gas activity in these 10states will generate over $24 billion in total taxes in2010—72% of all tax revenue generated by unconven-tional gas activity in all of the producing states. The pro-ducing states’ share will continue to increase. By 2015,unconventional gas activity in the Top 10 states will payabout $36 billion—or nearly 73% of total tax receiptsfrom all unconventional activity. By 2035, they will paynearly $63 billion in taxes—or 74% of total governmentrevenues.
While traditional energy-producing states like Texas andLouisiana will lead the way in generating government rev-enue from their unconventional gas activities, the non-producing states will contribute a total of nearly $6 billionin 2010 and are projected to pay over $8 billion by 2015.
3 Tax projections were based upon current tax structures and did not consider how changes to the current tax structure might impact theseprojected receipts.
Contribution tto UUS GGovernment RRevenue oof UUnconventionalGas* iin PProducing SStates vvs. NNon-PProducing SStates($M)
2010 2015 2035 2010-2035**Producing States*** 28,034 41,090 71,806 1,255,034Non-Producing States 5,758 8,246 13,317 243,701
US Total 33,793 49,335 85,123 1,498,734NOTES: *Unconventional gas includes gas from shale, tight sands, and coal bed methane. **2010-2035 represents the total for all years including those years not reported.***Producing states are the 20 states that have either new well completions and production orproduction from existing wells. They include Alabama, Arkansas, Colorado, Illinois, Kansas,Kentucky, Louisiana, Michigan, Mississippi, Montana, New Mexico, New York, Ohio, Okla-homa, Pennsylvania, Texas, Utah, Virginia, West Virginia, and Wyoming; the rest of the statesare non-producing states.Source: IHS Global Insight
Unconventional Gas Activity Makes Large Contributions to State Budgets
In 2010, the education budget for the state of Texas was $81 billion and healthcare spending registered $40 bil-lion. Unconventional gas activity generated state and local revenues of $5 billion—representing 6 percent of theeducation and 13 percent of the healthcare budget.
Colorado allocated $12 billion to education in 2010—in comparison, the unconventional gas industry generated$1.6 billion state and local revenue, which equals 13 percent of its education budget.
Top 110 UUnconventional GGas* PProducing SStates:Contribution tto UUS GGovernment RRevenue**($M)
2010 2015 2035Texas 10,891 14,757 26,412Colorado 3,197 4,434 4,526Wyoming 2,247 3,362 6,243Louisiana 2,074 3,897 7,702Pennsylvania 1,476 3,505 8,889Arkansas 1,193 1,792 2,775New Mexico 1,091 1,045 914Oklahoma 875 1,310 2,257New York 721 1,038 1,599Michigan 693 884 1,403Top 10 Total 24,458 36,025 62,720
Producing Total 28,034 41,090 71,806US Total 33,793 49,335 85,123NOTES: *Unconventional gas includes gas from shale, tight sands, andcoal bed methane. **The rank for all years are based on the 2010 ranking.Source: IHS Global Insight
6 JUNE 2012
THE ECONOMIC AND EMPLOYMENT CONTRIBUTIONS OF UNCONVENTIONAL GAS DEVELOPMENT IN STATE ECONOMIES
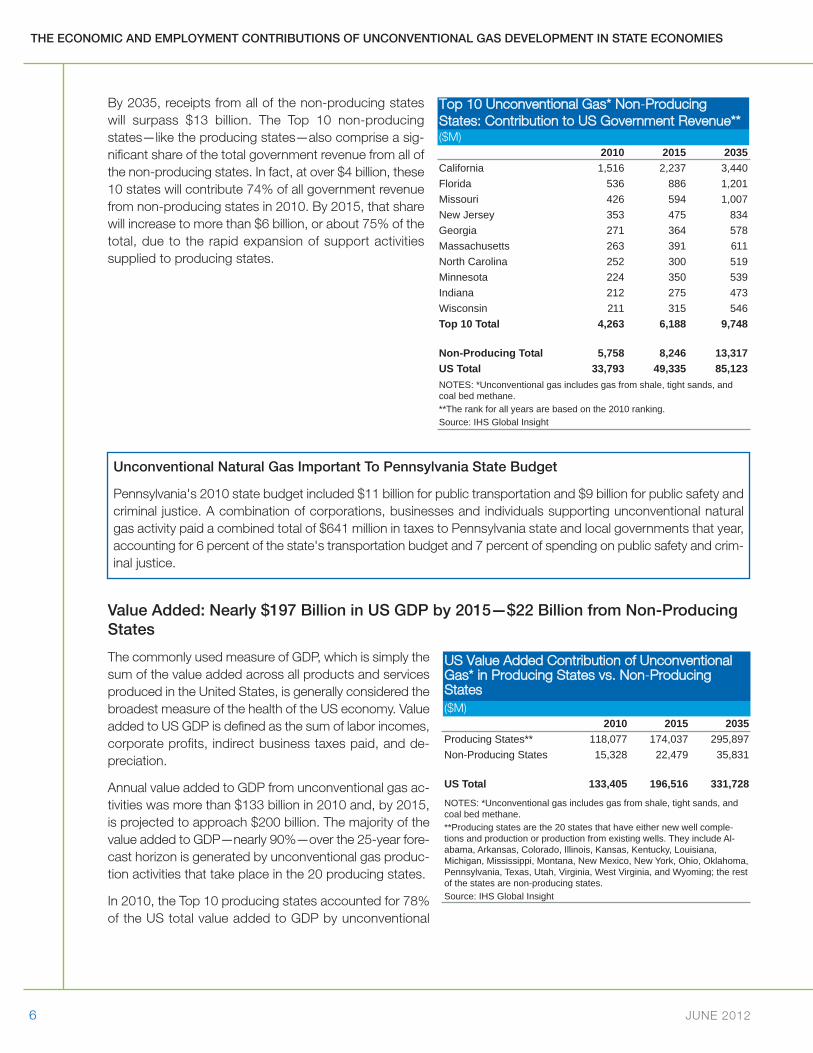
By 2035, receipts from all of the non-producing stateswill surpass $13 billion. The Top 10 non-producingstates—like the producing states—also comprise a sig-nificant share of the total government revenue from all ofthe non-producing states. In fact, at over $4 billion, these10 states will contribute 74% of all government revenuefrom non-producing states in 2010. By 2015, that sharewill increase to more than $6 billion, or about 75% of thetotal, due to the rapid expansion of support activitiessupplied to producing states.
Value Added: Nearly $197 Billion in US GDP by 2015—$22 Billion from Non-ProducingStates
The commonly used measure of GDP, which is simply thesum of the value added across all products and servicesproduced in the United States, is generally considered thebroadest measure of the health of the US economy. Valueadded to US GDP is defined as the sum of labor incomes,corporate profits, indirect business taxes paid, and de-preciation.
Annual value added to GDP from unconventional gas ac-tivities was more than $133 billion in 2010 and, by 2015,is projected to approach $200 billion. The majority of thevalue added to GDP—nearly 90%—over the 25-year fore-cast horizon is generated by unconventional gas produc-tion activities that take place in the 20 producing states.
In 2010, the Top 10 producing states accounted for 78%of the US total value added to GDP by unconventional
Top 110 UUnconventional GGas* NNon-PProducingStates: CContribution tto UUS GGovernment RRevenue**($M)
2010 2015 2035California 1,516 2,237 3,440Florida 536 886 1,201Missouri 426 594 1,007New Jersey 353 475 834Georgia 271 364 578Massachusetts 263 391 611North Carolina 252 300 519Minnesota 224 350 539Indiana 212 275 473Wisconsin 211 315 546Top 10 Total 4,263 6,188 9,748
Non-Producing Total 5,758 8,246 13,317US Total 33,793 49,335 85,123NOTES: *Unconventional gas includes gas from shale, tight sands, andcoal bed methane. **The rank for all years are based on the 2010 ranking.Source: IHS Global Insight
Unconventional Natural Gas Important To Pennsylvania State Budget
Pennsylvania's 2010 state budget included $11 billion for public transportation and $9 billion for public safety andcriminal justice. A combination of corporations, businesses and individuals supporting unconventional naturalgas activity paid a combined total of $641 million in taxes to Pennsylvania state and local governments that year,accounting for 6 percent of the state's transportation budget and 7 percent of spending on public safety and crim-inal justice.
US VValue AAdded CContribution oof UUnconventionalGas* iin PProducing SStates vvs. NNon-PProducingStates($M)
2010 2015 2035Producing States** 118,077 174,037 295,897Non-Producing States 15,328 22,479 35,831
US Total 133,405 196,516 331,728
NOTES: *Unconventional gas includes gas from shale, tight sands, andcoal bed methane. **Producing states are the 20 states that have either new well comple-tions and production or production from existing wells. They include Al-abama, Arkansas, Colorado, Illinois, Kansas, Kentucky, Louisiana,Michigan, Mississippi, Montana, New Mexico, New York, Ohio, Oklahoma,Pennsylvania, Texas, Utah, Virginia, West Virginia, and Wyoming; the restof the states are non-producing states.Source: IHS Global Insight

THE ECONOMIC AND EMPLOYMENT CONTRIBUTIONS OF UNCONVENTIONAL GAS DEVELOPMENT IN STATE ECONOMIES
IHS 7
gas activity. By 2015, we project these Top 10 states willadd another $50 billion to GDP, valued at 78% of the un-conventional gas activity’s total contribution to GDP.Pennsylvania and Louisiana will lead the way with annualgrowth in their contributions to GDP of 18.7% and12.6%, respectively. By 2035, unconventional gas activ-ity will add almost $332 billion to US GDP—with the Top10 producing states accounting for 78% of the relativecontributions.
Overall, the non-producing states account for about11%, on average, of the total value to US GDP through-out the forecast horizon. While the share of labor incomefrom the non-producing states is in line with their em-ployment share, they do not make as large of a relativecontribution to GDP as the producing states. This is at-tributable to the fact that producing states are heavily in-fluenced by the Oil and Gas sector which has high valueadded (mostly dedicated to non-labor income).
Top 110 UUnconventional GGas* PProducing SStates:Value AAdded CContribution**($M)
2010 2015 2035Texas 47,995 64,768 111,089Colorado 12,258 18,162 17,485Louisiana 11,020 20,005 37,759Pennsylvania 7,121 16,806 42,438Wyoming 6,760 8,815 14,735Arkansas 4,910 7,264 10,540Oklahoma 4,008 6,033 9,905New Mexico 3,356 3,160 2,589Utah 3,126 3,866 5,343Ohio 3,045 3,942 7,921Top 10 Total 103,600 152,821 259,805
Producing Total 118,077 174,037 295,897US Total 133,405 196,516 331,728NOTES: *Unconventional gas includes gas from shale, tight sands, andcoal bed methane. **The rank for all years are based on the 2010 ranking.Source: IHS Global Insight
An Economic Growth Engine in ProducingStates
IHS Global Insight's outlook for Texas and Utah showsthat economic growth in these states will outperform allother states. From 2010 to 2015, each state's econ-omy is expected to grow more than 3.5% annually.
In Texas and Utah, the average employee in the un-conventional gas and related industries will contribute$167,000 and $94,000 in "value-added" to their re-spective state's economies in 2010 through 2015; thisoutpaces the state's average employee contributionsof $111,000 and $90,000, respectively.
Top 110 UUnconventional GGas* NNon-PProducingStates: VValue AAdded CContribution**($M)
2010 2015 2035California 2,192 3,197 4,617Florida 1,163 2,034 2,266Georgia 1,147 1,622 2,398Missouri 1,057 1,529 2,616Indiana 957 1,326 2,331North Carolina 909 1,318 2,185Minnesota 796 1,272 1,937Wisconsin 783 1,167 2,044Tennessee 683 986 1,727New Jersey 640 841 1,406Top 10 Total 10,326 15,291 23,527
Non-Producing Total 15,328 22,479 35,831US Total 133,405 196,516 331,728NOTES: *Unconventional gas includes gas from shale, tight sands, andcoal bed methane. **The rank for all years are based on the 2010 ranking.Source: IHS Global Insight
8 JUNE 2012
THE ECONOMIC AND EMPLOYMENT CONTRIBUTIONS OF UNCONVENTIONAL GAS DEVELOPMENT IN STATE ECONOMIES
Structure of the Report
This report is a companion to the previous national level report, “The Economic and Employment Contributions ofShale Gas in the United States,” published by IHS in December 2011. The remainder of this report is divided intothe following four sections:
• Section 1 provides a background and reports our findings.
• Section 2 explains the methodology and approach that was used to develop the estimates economic activitygenerated by each state’s unconventional gas activity. It is divided into two main parts—Energy and EconomicContribution Assessment—each of which describes the inputs required to develop our final estimates.
• Section 3 provides a snapshot of the results by state for 2010, 2015 and 2035 for the following four main con-cepts: employment, government revenue, value added to GDP, and labor income contributions.
• Section 4 wraps up the report with important conclusions from its findings.
Additionally, we provide several appendices to both present more detailed results from our report and to facilitatethe readers’ understanding of the methodologies, research, and data relied upon for the analyses. The appendicesto the report are as follows:
• Appendix A: Economic Contributions by State and Year provides six detailed tables by state for each of thefive-year increments presented. The concepts covered are employment contribution (both alphabetically andranked by total value for that year), value-added contribution (both alphabetically and ranked by total value forthat year), labor income contribution (alphabetical only), and government revenue.
• Appendix B: Economic Contributions by State, Industry and Year breaks down the three main concepts—em-ployment, value added to GDP, and labor income contribution—even further by industry such that the final ta-bles are by state and industry for each of the five-year increments.
• Appendix C: Economic Contributions Excluding Cross-State Contributions by State and Year provides threedetailed tables by state for each of the five-year increments; however, these tables differ in that the resultingnumbers do not include any cross-state contributions (this approach contrasts with Appendix A, which doesinclude these cross-state contributions). The concepts covered are employment, value-added and labor incomecontribution, each of which is displayed alphabetically.
• Appendix D: Find the report, “The Economic and Employment Contributions of Non-Shale UnconventionalGas in the United States,” which presents the results from our analysis of total and non-shale unconventionalgas activity at the national level. It includes its own appendices (A through C) detailing the underlying method-ology and detailed data related to the assumed future production profile and capital expenditure outlook for non-shale unconventional gas; the detailed results of the economic contribution assessment for non-shaleunconventional gas; and the data and modeling approach underlying the economic contribution analysis fornon-shale unconventional gas.
THE ECONOMIC AND EMPLOYMENT CONTRIBUTIONS OF UNCONVENTIONAL GAS DEVELOPMENT IN STATE ECONOMIES
IHS 9
1. BackgroundThe development of unconventional gas resources in the United States is credited with fundamentally changing theoutlook for domestic natural gas supply and price, with significant contributions to employment and the economy.These have been documented in our report, “The Economic and Employment Contributions of Shale Gas in theUnited States.”
This study provides an analysis of the distribution of these national results at the state level. The analysis takes intoaccount the broad distribution of unconventional gas development across a wide range of states. The results re-flect careful analysis of each state’s production potential through 2035, based on IHS CERA’s analyses of each nat-ural gas play and calculates the investment of capital, labor, and other inputs required to produce the gas at eachplay. The economic effects of these investments are then calculated using IHS Global Insight’s proprietary economicimpact assessment and macroeconomic models, generating employment, value added to GDP, labor income, andtax revenue resulting from the growth in the coming years of unconventional gas development.
10 JUNE 2012
THE ECONOMIC AND EMPLOYMENT CONTRIBUTIONS OF UNCONVENTIONAL GAS DEVELOPMENT IN STATE ECONOMIES
2. Methodology and ApproachEnergy
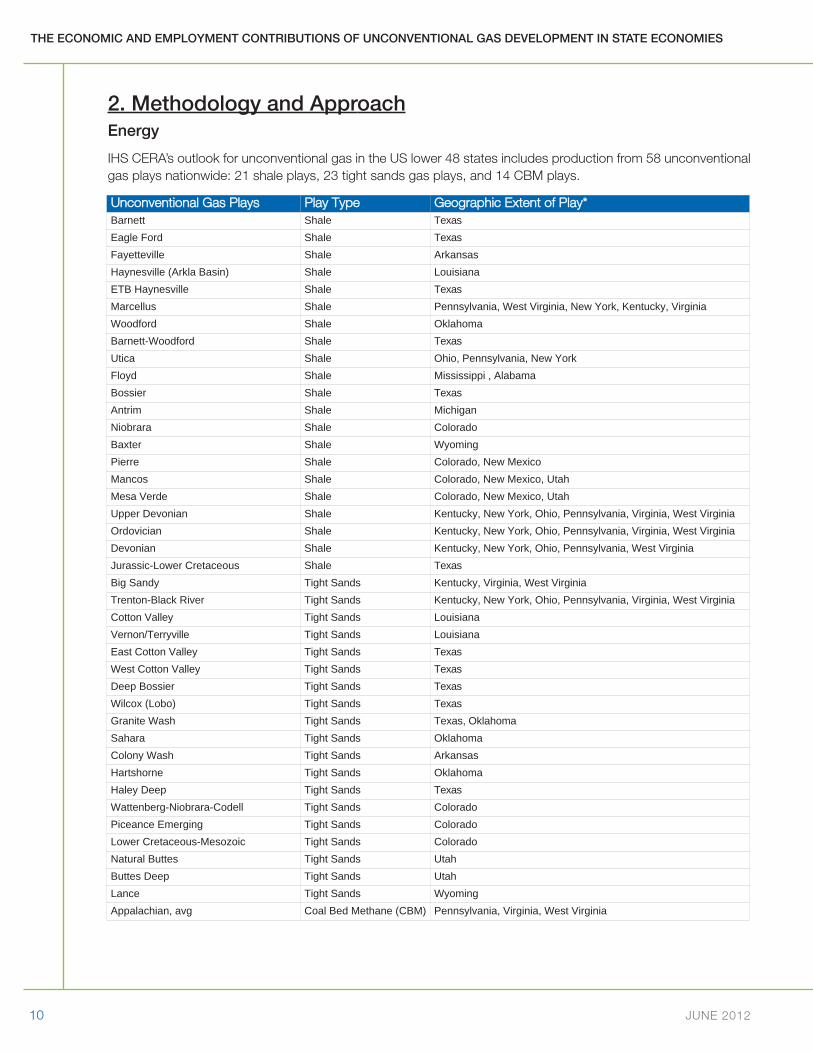
IHS CERA’s outlook for unconventional gas in the US lower 48 states includes production from 58 unconventionalgas plays nationwide: 21 shale plays, 23 tight sands gas plays, and 14 CBM plays.
Unconventional GGas PPlays Play TType Geographic EExtent oof PPlay*Barnett Shale TexasEagle Ford Shale TexasFayetteville Shale ArkansasHaynesville (Arkla Basin) Shale LouisianaETB Haynesville Shale TexasMarcellus Shale Pennsylvania, West Virginia, New York, Kentucky, VirginiaWoodford Shale OklahomaBarnett-Woodford Shale TexasUtica Shale Ohio, Pennsylvania, New YorkFloyd Shale Mississippi , AlabamaBossier Shale TexasAntrim Shale MichiganNiobrara Shale ColoradoBaxter Shale WyomingPierre Shale Colorado, New MexicoMancos Shale Colorado, New Mexico, UtahMesa Verde Shale Colorado, New Mexico, UtahUpper Devonian Shale Kentucky, New York, Ohio, Pennsylvania, Virginia, West VirginiaOrdovician Shale Kentucky, New York, Ohio, Pennsylvania, Virginia, West VirginiaDevonian Shale Kentucky, New York, Ohio, Pennsylvania, West VirginiaJurassic-Lower Cretaceous Shale TexasBig Sandy Tight Sands Kentucky, Virginia, West VirginiaTrenton-Black River Tight Sands Kentucky, New York, Ohio, Pennsylvania, Virginia, West VirginiaCotton Valley Tight Sands LouisianaVernon/Terryville Tight Sands LouisianaEast Cotton Valley Tight Sands TexasWest Cotton Valley Tight Sands TexasDeep Bossier Tight Sands TexasWilcox (Lobo) Tight Sands TexasGranite Wash Tight Sands Texas, Oklahoma Sahara Tight Sands OklahomaColony Wash Tight Sands ArkansasHartshorne Tight Sands OklahomaHaley Deep Tight Sands TexasWattenberg-Niobrara-Codell Tight Sands ColoradoPiceance Emerging Tight Sands ColoradoLower Cretaceous-Mesozoic Tight Sands ColoradoNatural Buttes Tight Sands UtahButtes Deep Tight Sands UtahLance Tight Sands WyomingAppalachian, avg Coal Bed Methane (CBM) Pennsylvania, Virginia, West Virginia
THE ECONOMIC AND EMPLOYMENT CONTRIBUTIONS OF UNCONVENTIONAL GAS DEVELOPMENT IN STATE ECONOMIES
IHS 11
The cost of drilling and constructing a well and putting it into operation is a critical component of the economic vi-ability of developing any unconventional gas play, and costs to the industry vary. An unconventional gas well in ashale or tight sands target may cost anywhere between $3.5 million and $12 million, while a well targeting CBMmay cost between $500,000 and $1.5 million. The cost of the well depends on several factors such as the verti-cal depth of the well bore, its lateral length, reservoir pressure, rock characteristics, and the number of fracturestages, as well as commercial factors such as ease of access to materials and services, such as supplies of water,proppant, drilling and completion services. Capital expenditures are undertaken for land, drilling, completion, facil-ities, gathering, processing, and compression. The development of a major play also requires the addition of pipelinecapacity to get the gas to market.
IHS CERA has estimated the costs associated with the production outlook for unconventional gas, which are basedon IHS databases and proprietary models detailed in our prior report, “The Economic and Employment Contribu-tions of Shale Gas in the United States.” In this report, the production profiles were developed based on detailedanalyses of each unconventional gas play. The production possibilities were constrained to be consistent with IHSCERA’s outlook for natural gas demand, price, and infrastructure, as reported in its “North American Natural GasMarket Briefing” in September 2011. Well counts were estimated for each play consistent with the play-level pro-duction outlook, and capital expenditures associated with the well counts were estimated.
IHS CERA initially allocated the capital expenditures to individual states according to the geographic locations ofeach play. For plays that cross state boundaries, the capital expenditures were prorated to provide allocationsamong the states involved. The initial set of capital expenditures were further distributed to states where purchasesare actually undertaken. This methodology is described in the next section.
Infrastructure capital expenditures include expenditures for gathering lines and processing plants, as well as thepipeline expansions required to connect new supply areas to consumers. Gathering and processing expenditureswere allocated to the states in the same way that well expenditures were allocated. Pipeline expansion costs andallocations were based on the expansion requirements indicated by the Gas Pipeline Competition Model™, whichwas used for the market analysis in the study.
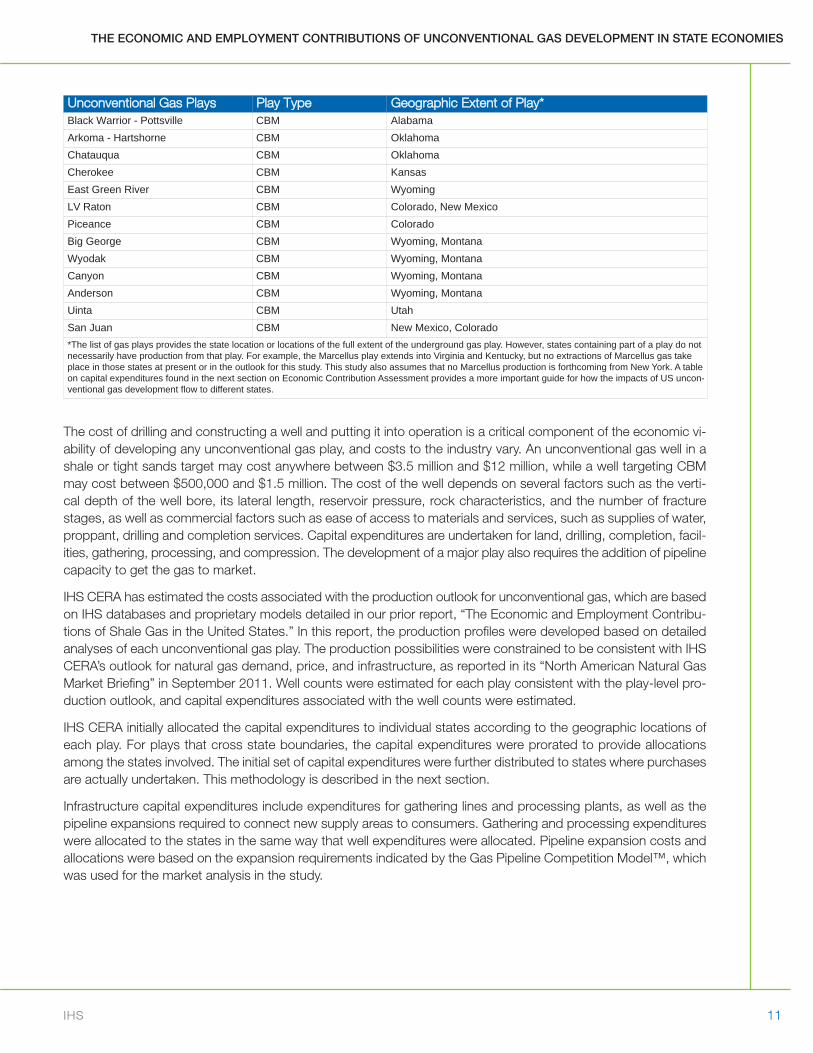
Unconventional GGas PPlays Play TType Geographic EExtent oof PPlay*Black Warrior - Pottsville CBM AlabamaArkoma - Hartshorne CBM OklahomaChatauqua CBM OklahomaCherokee CBM KansasEast Green River CBM WyomingLV Raton CBM Colorado, New MexicoPiceance CBM ColoradoBig George CBM Wyoming, MontanaWyodak CBM Wyoming, MontanaCanyon CBM Wyoming, MontanaAnderson CBM Wyoming, MontanaUinta CBM UtahSan Juan CBM New Mexico, Colorado*The list of gas plays provides the state location or locations of the full extent of the underground gas play. However, states containing part of a play do notnecessarily have production from that play. For example, the Marcellus play extends into Virginia and Kentucky, but no extractions of Marcellus gas takeplace in those states at present or in the outlook for this study. This study also assumes that no Marcellus production is forthcoming from New York. A tableon capital expenditures found in the next section on Economic Contribution Assessment provides a more important guide for how the impacts of US uncon-ventional gas development flow to different states.
12 JUNE 2012
THE ECONOMIC AND EMPLOYMENT CONTRIBUTIONS OF UNCONVENTIONAL GAS DEVELOPMENT IN STATE ECONOMIES
Economic Contribution Assessment
Data Requirements and Assumptions
In this economic contribution assessment, IHS Global Insight, with support from IHS CERA, compiled state-leveldata of unconventional gas activity in the 20 US states (13 of which have current and future development) thatcontain plays that extract natural gas from shale, tight sands, and CBM. Both the value of production and capitalexpenditures were input, by state, into the model to conduct the economic analysis.
The following activities were determined to be major direct contributors:
• Natural gas drilling
• Natural gas extraction
• Support activities and services required for oil and natural gas drilling and extraction
• Construction of facilities, related materials and machinery for hydraulic fracturing and completions, and con-struction of natural gas pipeline
The primary analytical tool for this multi-state study is the same IMPLAN Input-Output model used, with the IHSUS Macroeconomic Model, in the overall US analysis. However, the architecture of the existing IMPLAN modelcould not efficiently handle the computational complexity of a multi-state analysis in which each state is, within IM-PLAN, effectively an independent geographic region. To adjust for this limitation, IHS Global Insight ran multiple, al-ternative versions of the IMPLAN multi-regional model and integrated the output with in-house proprietary databaseto assess the indirect and induced economic contribution by industry and state. This fine-tuned methodology en-sures that inputs that are not locally produced—or do not have a competitive advantage locally—are sourced fromother states creating economic “leakage” from one state to another. In the broader context, economic “leakage”is explained as inter-regional activity in which the production requirements of a commodity (or a service) use inputsproduced in other states thus causing the economic impact to “leak” to other states and introducing a regional rip-ple effect.
The model framework used here was set up as a system of linked state economies. As a result, the sourcing of in-puts for the development of unconventional gas activity will impact those states that do not have an unconventionalgas play within their borders. For example, the development of unconventional gas wells in Arkansas relies onbank, insurance and securities services in New York and professional services primarily located in Texas. Captur-ing these connections highlights the indirect economic contribution even in states that lack unconventional gasplays. The leakages also impact US GDP and employment multipliers, making them more accurate for states thatdo have unconventional gas plays.
The IMPLAN model also produces “own-state” multipliers—that is, the indirect and induced impact that flow fromdirect activity as a result of that state’s unconventional gas development but exclude any impact from the supplierstates providing services or products. Appendix C provides the results of this analysis, when cross-state ramifica-tions are excluded.
In a given year, the volume of natural gas produced in each state is impacted by both the wells drilled during thecourse of the year and by wells drilled in previous years that remained in operation. The monetary value of gas pro-duction volumes was calculated using the Henry Hub price. These values served as inputs to the oil and gas ex-traction industry in the corresponding states in the IMPLAN model.
Capital Expenditures
While the value of gas production is attributed only to states with unconventional gas plays, the allocation of cap-ital expenditures among the 48 producing and non-producing states is more involved. Capital expenditures act asdirect impacts at both the state and industry levels. The complexity lies in the fact that a portion of that spending
THE ECONOMIC AND EMPLOYMENT CONTRIBUTIONS OF UNCONVENTIONAL GAS DEVELOPMENT IN STATE ECONOMIES
IHS 13
may be allocated to states that do not have unconventional gas plays. This spending will trigger indirect and inducedimpacts in these states as they provide goods and services. To ensure that these effects are included in the eco-nomic analysis, IHS Global Insight used industry input, IHS Global Insight’s in-house expertise and proprietary data-bases, and extensive additional research to arrive at the best possible methodology for allocating capitalexpenditures among different states.
The first step, as in the national study, was to map the capital expenditure breakdown for the categories specifiedby the IMPLAN model. Capital expenditure and support services for natural gas drilling correspond to industry sec-tors within the IMPLAN model. However, the breakdowns for drilling, completion, facilities, gathering, processing,pipeline construction, and liquid natural gas exports were mapped to many other categories of the model.
The research, expertise and input from industry sources were integrated with an interstate trade-flow database todetermine the sources of various products and services by state. For example, it is evident that unconventional gasextraction requires special sand for hydraulic fracturing that is produced primarily in Wisconsin, Minnesota, Ohio,and Arkansas. Since not all states with unconventional gas plays produce these unusual sands, they must importthem from other states and are assumed to do so in the model. IHS’s trade-flow database was one of many sourcesused to determine the origin and destination of the various materials and equipment on a state level basis.
This process was undertaken for all the products in the 13 states with current and future drilling in unconventionalgas plays. The final set of capital expenditures, by various products and services, and, if applicable the value of pro-duction, was input into 44 IMPLAN state models to assess the contribution on each individual state’s economy.
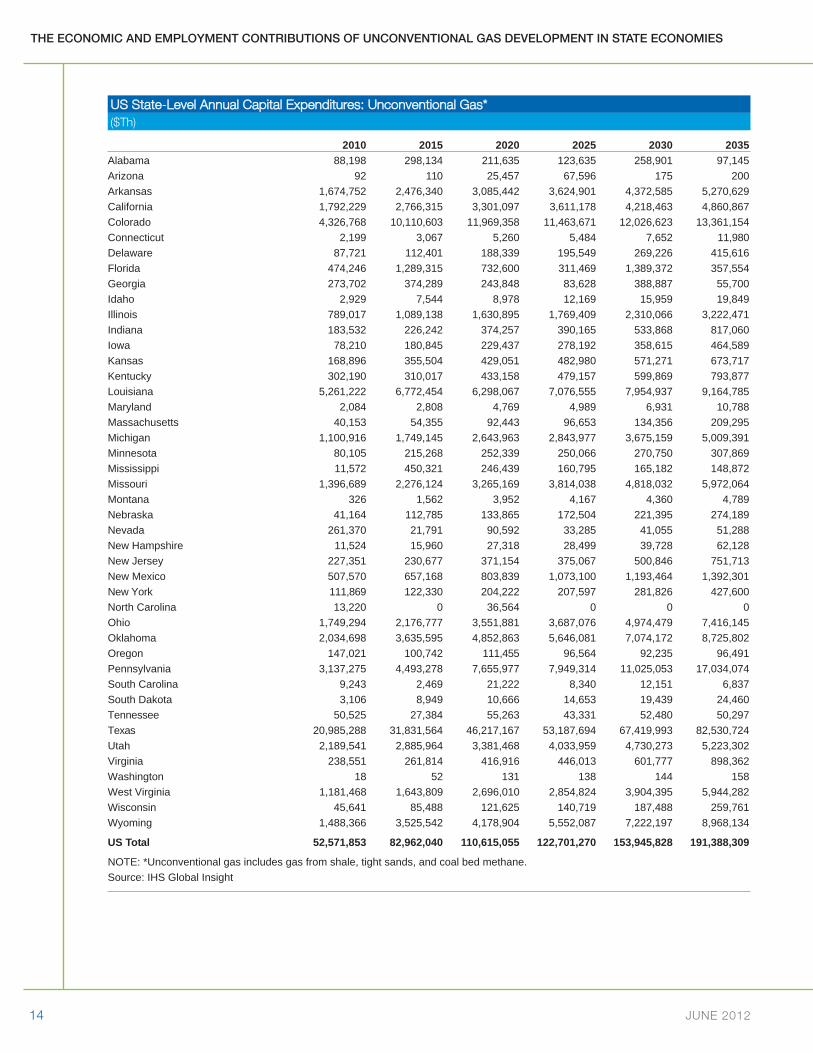
The following table presents the distribution of capital expenditures, by state, for all unconventional gas.
14 JUNE 2012
THE ECONOMIC AND EMPLOYMENT CONTRIBUTIONS OF UNCONVENTIONAL GAS DEVELOPMENT IN STATE ECONOMIES
2010 2015 2020 2025 2030 2035Alabama 88,198 298,134 211,635 123,635 258,901 97,145Arizona 92 110 25,457 67,596 175 200Arkansas 1,674,752 2,476,340 3,085,442 3,624,901 4,372,585 5,270,629California 1,792,229 2,766,315 3,301,097 3,611,178 4,218,463 4,860,867Colorado 4,326,768 10,110,603 11,969,358 11,463,671 12,026,623 13,361,154Connecticut 2,199 3,067 5,260 5,484 7,652 11,980Delaware 87,721 112,401 188,339 195,549 269,226 415,616Florida 474,246 1,289,315 732,600 311,469 1,389,372 357,554Georgia 273,702 374,289 243,848 83,628 388,887 55,700Idaho 2,929 7,544 8,978 12,169 15,959 19,849Illinois 789,017 1,089,138 1,630,895 1,769,409 2,310,066 3,222,471Indiana 183,532 226,242 374,257 390,165 533,868 817,060Iowa 78,210 180,845 229,437 278,192 358,615 464,589Kansas 168,896 355,504 429,051 482,980 571,271 673,717Kentucky 302,190 310,017 433,158 479,157 599,869 793,877Louisiana 5,261,222 6,772,454 6,298,067 7,076,555 7,954,937 9,164,785Maryland 2,084 2,808 4,769 4,989 6,931 10,788Massachusetts 40,153 54,355 92,443 96,653 134,356 209,295Michigan 1,100,916 1,749,145 2,643,963 2,843,977 3,675,159 5,009,391Minnesota 80,105 215,268 252,339 250,066 270,750 307,869Mississippi 11,572 450,321 246,439 160,795 165,182 148,872Missouri 1,396,689 2,276,124 3,265,169 3,814,038 4,818,032 5,972,064Montana 326 1,562 3,952 4,167 4,360 4,789Nebraska 41,164 112,785 133,865 172,504 221,395 274,189Nevada 261,370 21,791 90,592 33,285 41,055 51,288New Hampshire 11,524 15,960 27,318 28,499 39,728 62,128New Jersey 227,351 230,677 371,154 375,067 500,846 751,713New Mexico 507,570 657,168 803,839 1,073,100 1,193,464 1,392,301New York 111,869 122,330 204,222 207,597 281,826 427,600North Carolina 13,220 0 36,564 0 0 0Ohio 1,749,294 2,176,777 3,551,881 3,687,076 4,974,479 7,416,145Oklahoma 2,034,698 3,635,595 4,852,863 5,646,081 7,074,172 8,725,802Oregon 147,021 100,742 111,455 96,564 92,235 96,491Pennsylvania 3,137,275 4,493,278 7,655,977 7,949,314 11,025,053 17,034,074South Carolina 9,243 2,469 21,222 8,340 12,151 6,837South Dakota 3,106 8,949 10,666 14,653 19,439 24,460Tennessee 50,525 27,384 55,263 43,331 52,480 50,297Texas 20,985,288 31,831,564 46,217,167 53,187,694 67,419,993 82,530,724Utah 2,189,541 2,885,964 3,381,468 4,033,959 4,730,273 5,223,302Virginia 238,551 261,814 416,916 446,013 601,777 898,362Washington 18 52 131 138 144 158West Virginia 1,181,468 1,643,809 2,696,010 2,854,824 3,904,395 5,944,282Wisconsin 45,641 85,488 121,625 140,719 187,488 259,761Wyoming 1,488,366 3,525,542 4,178,904 5,552,087 7,222,197 8,968,134
US Total 52,571,853 82,962,040 110,615,055 122,701,270 153,945,828 191,388,309
NOTE: *Unconventional gas includes gas from shale, tight sands, and coal bed methane.Source: IHS Global Insight
US SState-LLevel AAnnual CCapital EExpenditures: UUnconventional GGas*($Th)
THE ECONOMIC AND EMPLOYMENT CONTRIBUTIONS OF UNCONVENTIONAL GAS DEVELOPMENT IN STATE ECONOMIES
IHS 15
Modeling the State Economic Contribution
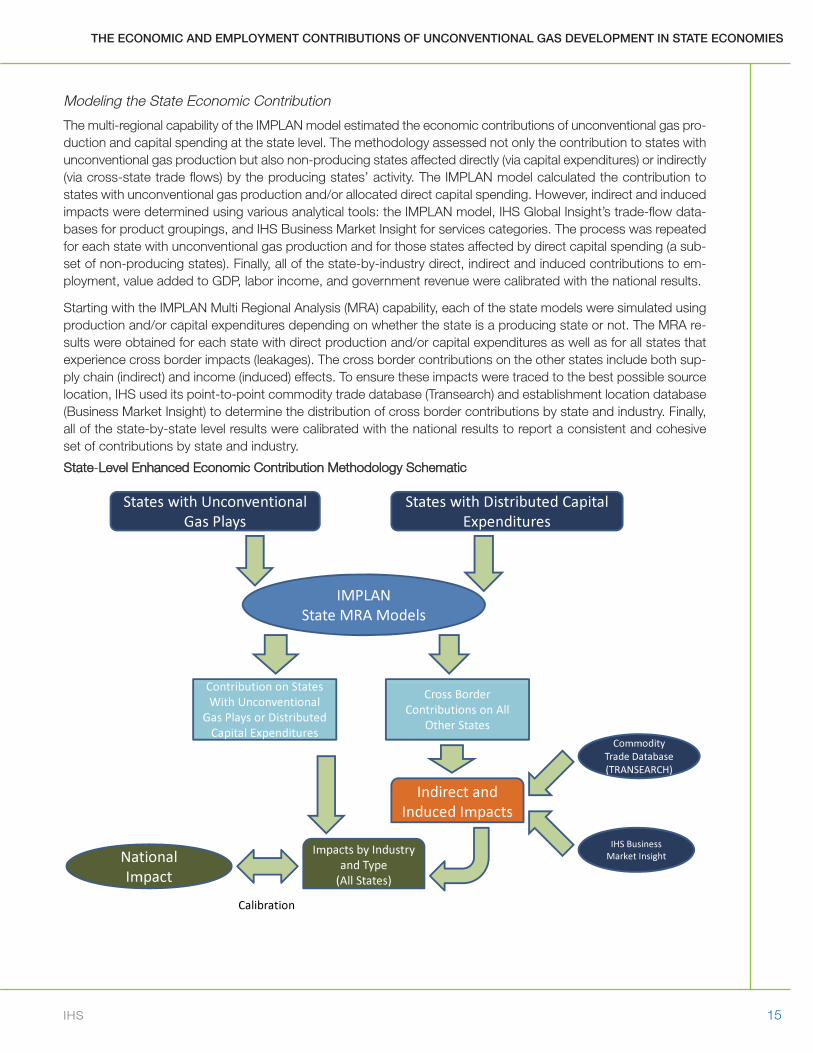
The multi-regional capability of the IMPLAN model estimated the economic contributions of unconventional gas pro-duction and capital spending at the state level. The methodology assessed not only the contribution to states withunconventional gas production but also non-producing states affected directly (via capital expenditures) or indirectly(via cross-state trade flows) by the producing states’ activity. The IMPLAN model calculated the contribution tostates with unconventional gas production and/or allocated direct capital spending. However, indirect and inducedimpacts were determined using various analytical tools: the IMPLAN model, IHS Global Insight’s trade-flow data-bases for product groupings, and IHS Business Market Insight for services categories. The process was repeatedfor each state with unconventional gas production and for those states affected by direct capital spending (a sub-set of non-producing states). Finally, all of the state-by-industry direct, indirect and induced contributions to em-ployment, value added to GDP, labor income, and government revenue were calibrated with the national results.
Starting with the IMPLAN Multi Regional Analysis (MRA) capability, each of the state models were simulated usingproduction and/or capital expenditures depending on whether the state is a producing state or not. The MRA re-sults were obtained for each state with direct production and/or capital expenditures as well as for all states thatexperience cross border impacts (leakages). The cross border contributions on the other states include both sup-ply chain (indirect) and income (induced) effects. To ensure these impacts were traced to the best possible sourcelocation, IHS used its point-to-point commodity trade database (Transearch) and establishment location database(Business Market Insight) to determine the distribution of cross border contributions by state and industry. Finally,all of the state-by-state level results were calibrated with the national results to report a consistent and cohesiveset of contributions by state and industry.
State-LLevel EEnhanced EEconomic CContribution MMethodology SSchematic
States with Unconventional Gas Plays
States with Distributed Capital Expenditures
IMPLANSt t MRA M d lState MRA Models
bContribution on StatesWith Unconventional
Gas Plays or DistributedCapital Expenditures
Cross Border Contributions on All
Other StatesCommodity
d b
Indirect and Induced Impacts
Trade Database (TRANSEARCH)
Impacts by Industry and Type
(All States)
National Impact
IHS Business Market Insight
Calibration
16 JUNE 2012
THE ECONOMIC AND EMPLOYMENT CONTRIBUTIONS OF UNCONVENTIONAL GAS DEVELOPMENT IN STATE ECONOMIES
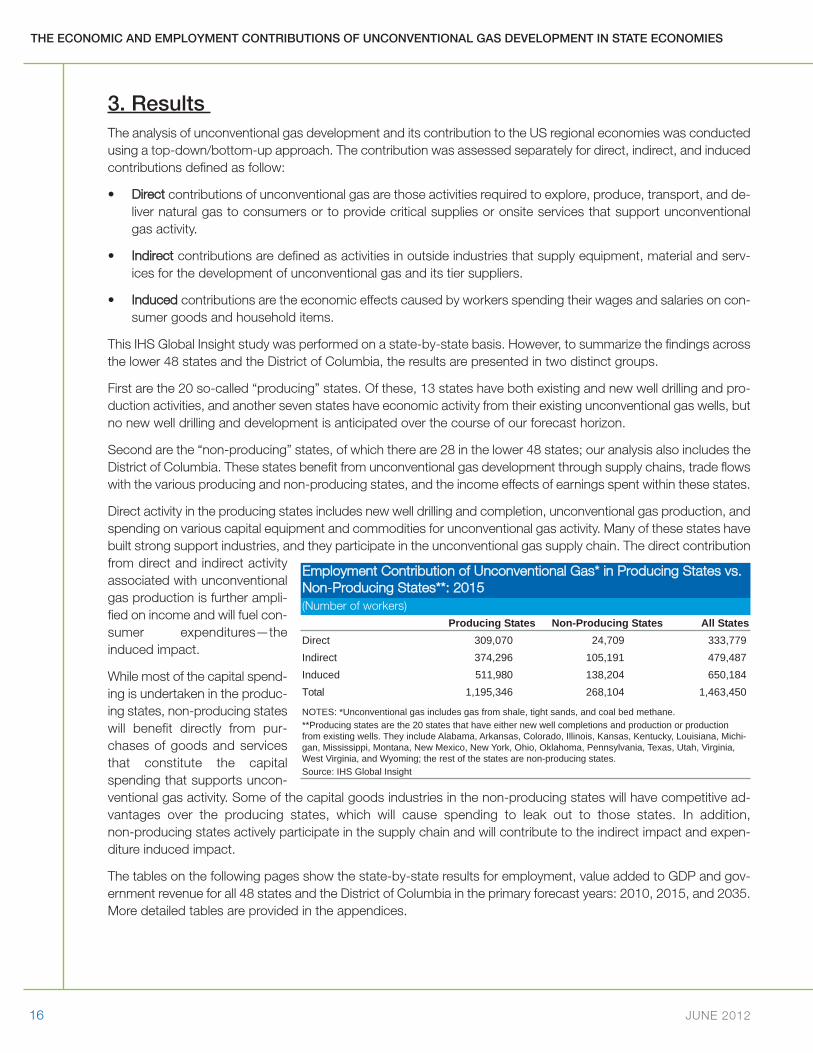
3. Results The analysis of unconventional gas development and its contribution to the US regional economies was conductedusing a top-down/bottom-up approach. The contribution was assessed separately for direct, indirect, and inducedcontributions defined as follow:
• Direct contributions of unconventional gas are those activities required to explore, produce, transport, and de-liver natural gas to consumers or to provide critical supplies or onsite services that support unconventionalgas activity.
• Indirect contributions are defined as activities in outside industries that supply equipment, material and serv-ices for the development of unconventional gas and its tier suppliers.
• Induced contributions are the economic effects caused by workers spending their wages and salaries on con-sumer goods and household items.
This IHS Global Insight study was performed on a state-by-state basis. However, to summarize the findings acrossthe lower 48 states and the District of Columbia, the results are presented in two distinct groups.
First are the 20 so-called “producing” states. Of these, 13 states have both existing and new well drilling and pro-duction activities, and another seven states have economic activity from their existing unconventional gas wells, butno new well drilling and development is anticipated over the course of our forecast horizon.
Second are the “non-producing” states, of which there are 28 in the lower 48 states; our analysis also includes theDistrict of Columbia. These states benefit from unconventional gas development through supply chains, trade flowswith the various producing and non-producing states, and the income effects of earnings spent within these states.
Direct activity in the producing states includes new well drilling and completion, unconventional gas production, andspending on various capital equipment and commodities for unconventional gas activity. Many of these states havebuilt strong support industries, and they participate in the unconventional gas supply chain. The direct contributionfrom direct and indirect activityassociated with unconventionalgas production is further ampli-fied on income and will fuel con-sumer expenditures—theinduced impact.
While most of the capital spend-ing is undertaken in the produc-ing states, non-producing stateswill benefit directly from pur-chases of goods and servicesthat constitute the capitalspending that supports uncon-ventional gas activity. Some of the capital goods industries in the non-producing states will have competitive ad-vantages over the producing states, which will cause spending to leak out to those states. In addition,non-producing states actively participate in the supply chain and will contribute to the indirect impact and expen-diture induced impact.
The tables on the following pages show the state-by-state results for employment, value added to GDP and gov-ernment revenue for all 48 states and the District of Columbia in the primary forecast years: 2010, 2015, and 2035.More detailed tables are provided in the appendices.
Employment CContribution oof UUnconventional GGas* iin PProducing SStates vvs. Non-PProducing SStates**: 22015(Number of workers)
Producing States Non-Producing States All StatesDirect 309,070 24,709 333,779Indirect 374,296 105,191 479,487Induced 511,980 138,204 650,184Total 1,195,346 268,104 1,463,450
NOTES: *Unconventional gas includes gas from shale, tight sands, and coal bed methane.**Producing states are the 20 states that have either new well completions and production or productionfrom existing wells. They include Alabama, Arkansas, Colorado, Illinois, Kansas, Kentucky, Louisiana, Michi-gan, Mississippi, Montana, New Mexico, New York, Ohio, Oklahoma, Pennsylvania, Texas, Utah, Virginia,West Virginia, and Wyoming; the rest of the states are non-producing states.Source: IHS Global Insight

THE ECONOMIC AND EMPLOYMENT CONTRIBUTIONS OF UNCONVENTIONAL GAS DEVELOPMENT IN STATE ECONOMIES
IHS 17
2010 2015 2035Alabama 8,675 12,673 15,866Arizona 6,918 10,364 19,737Arkansas 36,698 53,919 79,723California 22,773 33,265 49,494Colorado 77,466 126,525 127,843Connecticut 5,017 7,015 10,380Delaware 1,681 2,362 4,770District of Columbia 905 1,348 2,294Florida 15,758 27,402 30,903Georgia 13,294 18,800 29,262Idaho 1,841 2,766 4,818Illinois 25,773 36,387 61,657Indiana 10,819 15,206 26,837Iowa 5,183 8,095 14,526Kansas 5,353 7,594 12,470Kentucky 10,870 14,252 21,825Louisiana 81,022 124,782 200,555Maine 1,666 2,390 3,774Maryland 7,008 10,263 16,634Massachusetts 4,968 7,220 11,356Michigan 28,063 37,926 63,380Minnesota 9,271 14,499 22,638Mississippi 3,259 9,428 8,768Missouri 12,031 17,427 30,105Montana 1,591 2,236 3,582Nebraska 3,199 5,142 9,216Nevada 2,153 1,743 3,278New Hampshire 647 938 1,576New Jersey 6,865 9,271 15,064New Mexico 20,417 19,617 18,462New York 26,887 39,047 58,377North Carolina 11,377 16,570 28,271North Dakota 1,141 1,867 3,645Ohio 31,462 41,366 81,349Oklahoma 28,315 41,763 69,261Oregon 6,756 8,516 14,107Pennsylvania 56,884 111,024 270,058Rhode Island 1,368 1,968 2,904South Carolina 5,607 8,227 14,368South Dakota 1,176 1,770 2,959Tennessee 8,519 12,323 21,487Texas 288,222 385,318 682,740Utah 30,561 36,593 50,839Vermont 848 1,261 1,922Virginia 13,162 17,753 30,732Washington 3,904 5,797 9,777West Virginia 16,888 31,380 71,620Wisconsin 9,608 14,285 24,871Wyoming 34,787 45,763 78,792
US Total 1,008,658 1,463,450 2,438,877NOTE: *Unconventional gas includes gas from shale, tight sands,and coal bed methane. Source: IHS Global Insight
2010 2015 2035Alabama 240 263 295Arizona 136 203 385Arkansas 1,193 1,792 2,775California 1,516 2,237 3,440Colorado 3,197 4,434 4,526Connecticut 116 163 237Delaware 39 54 110District of Columbia 15 23 40Florida 536 886 1,201Georgia 271 364 578Idaho 31 48 87Illinois 630 865 1,467Indiana 212 275 473Iowa 97 153 278Kansas 120 155 251Kentucky 291 356 473Louisiana 2,074 3,897 7,702Maine 26 38 60Maryland 152 226 357Massachusetts 263 391 611Michigan 693 884 1,403Minnesota 224 350 539Mississippi 67 153 172Missouri 426 594 1,007Montana 44 58 85Nebraska 61 99 185Nevada 139 94 173New Hampshire 46 68 118New Jersey 353 475 834New Mexico 1,091 1,045 914New York 721 1,038 1,599North Carolina 252 300 519North Dakota 22 41 85Ohio 688 885 1,719Oklahoma 875 1,310 2,257Oregon 143 192 319Pennsylvania 1,476 3,505 8,889Rhode Island 23 33 48South Carolina 114 136 240South Dakota 18 27 46Tennessee 140 196 348Texas 10,891 14,757 26,412Utah 662 818 1,190Vermont 14 22 33Virginia 321 401 685Washington 161 242 421West Virginia 514 1,111 2,749Wisconsin 211 315 546Wyoming 2,247 3,362 6,243
US Total 33,793 49,335 85,123
NOTE: *Unconventional gas includes gas from shale, tight sands,and coal bed methane. Source: IHS Global Insight
US SState-LLevel EEmployment CContribution oof Unconventional GGas* SSummary(Number of workers)
US SState-LLevel GGovernment RRevenue CContribution oofUnconventional GGas* SSummary($M)
18 JUNE 2012
THE ECONOMIC AND EMPLOYMENT CONTRIBUTIONS OF UNCONVENTIONAL GAS DEVELOPMENT IN STATE ECONOMIES
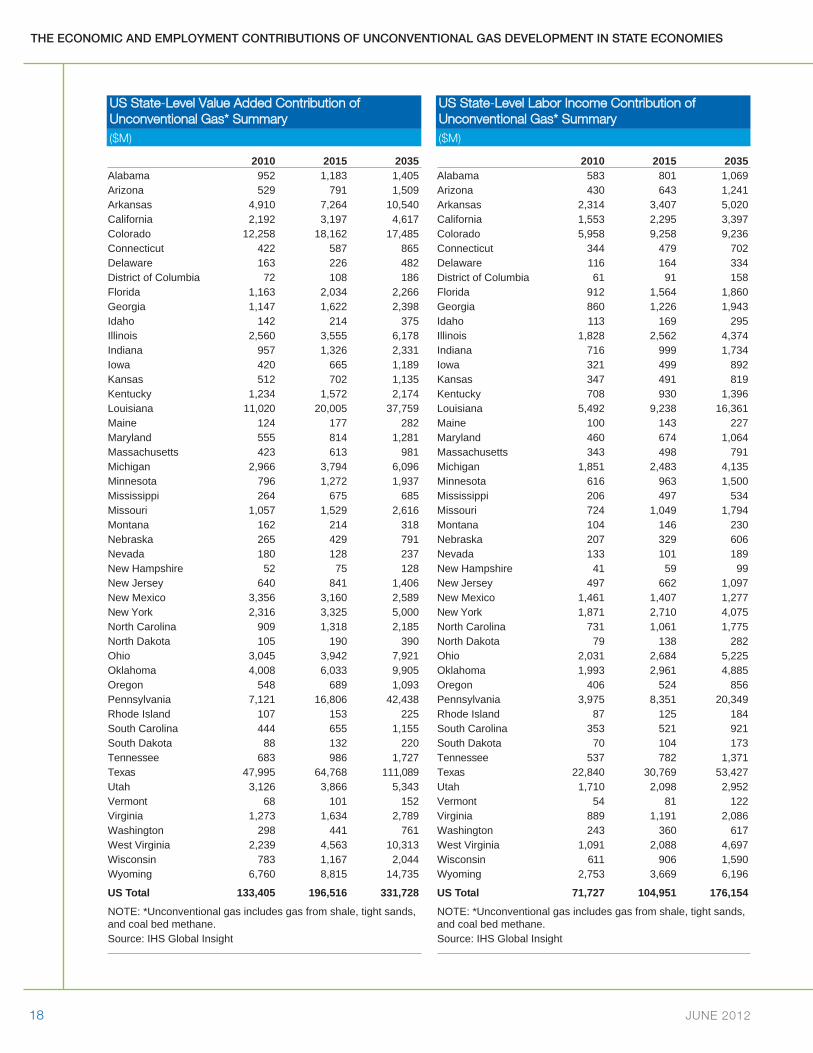
2010 2015 2035Alabama 952 1,183 1,405Arizona 529 791 1,509Arkansas 4,910 7,264 10,540California 2,192 3,197 4,617Colorado 12,258 18,162 17,485Connecticut 422 587 865Delaware 163 226 482District of Columbia 72 108 186Florida 1,163 2,034 2,266Georgia 1,147 1,622 2,398Idaho 142 214 375Illinois 2,560 3,555 6,178Indiana 957 1,326 2,331Iowa 420 665 1,189Kansas 512 702 1,135Kentucky 1,234 1,572 2,174Louisiana 11,020 20,005 37,759Maine 124 177 282Maryland 555 814 1,281Massachusetts 423 613 981Michigan 2,966 3,794 6,096Minnesota 796 1,272 1,937Mississippi 264 675 685Missouri 1,057 1,529 2,616Montana 162 214 318Nebraska 265 429 791Nevada 180 128 237New Hampshire 52 75 128New Jersey 640 841 1,406New Mexico 3,356 3,160 2,589New York 2,316 3,325 5,000North Carolina 909 1,318 2,185North Dakota 105 190 390Ohio 3,045 3,942 7,921Oklahoma 4,008 6,033 9,905Oregon 548 689 1,093Pennsylvania 7,121 16,806 42,438Rhode Island 107 153 225South Carolina 444 655 1,155South Dakota 88 132 220Tennessee 683 986 1,727Texas 47,995 64,768 111,089Utah 3,126 3,866 5,343Vermont 68 101 152Virginia 1,273 1,634 2,789Washington 298 441 761West Virginia 2,239 4,563 10,313Wisconsin 783 1,167 2,044Wyoming 6,760 8,815 14,735
US Total 133,405 196,516 331,728
NOTE: *Unconventional gas includes gas from shale, tight sands,and coal bed methane. Source: IHS Global Insight
2010 2015 2035Alabama 583 801 1,069Arizona 430 643 1,241Arkansas 2,314 3,407 5,020California 1,553 2,295 3,397Colorado 5,958 9,258 9,236Connecticut 344 479 702Delaware 116 164 334District of Columbia 61 91 158Florida 912 1,564 1,860Georgia 860 1,226 1,943Idaho 113 169 295Illinois 1,828 2,562 4,374Indiana 716 999 1,734Iowa 321 499 892Kansas 347 491 819Kentucky 708 930 1,396Louisiana 5,492 9,238 16,361Maine 100 143 227Maryland 460 674 1,064Massachusetts 343 498 791Michigan 1,851 2,483 4,135Minnesota 616 963 1,500Mississippi 206 497 534Missouri 724 1,049 1,794Montana 104 146 230Nebraska 207 329 606Nevada 133 101 189New Hampshire 41 59 99New Jersey 497 662 1,097New Mexico 1,461 1,407 1,277New York 1,871 2,710 4,075North Carolina 731 1,061 1,775North Dakota 79 138 282Ohio 2,031 2,684 5,225Oklahoma 1,993 2,961 4,885Oregon 406 524 856Pennsylvania 3,975 8,351 20,349Rhode Island 87 125 184South Carolina 353 521 921South Dakota 70 104 173Tennessee 537 782 1,371Texas 22,840 30,769 53,427Utah 1,710 2,098 2,952Vermont 54 81 122Virginia 889 1,191 2,086Washington 243 360 617West Virginia 1,091 2,088 4,697Wisconsin 611 906 1,590Wyoming 2,753 3,669 6,196
US Total 71,727 104,951 176,154
NOTE: *Unconventional gas includes gas from shale, tight sands,and coal bed methane. Source: IHS Global Insight
US SState-LLevel VValue AAdded CContribution oof Unconventional GGas* SSummary($M)
US SState-LLevel LLabor IIncome CContribution oof Unconventional GGas* SSummary($M)

THE ECONOMIC AND EMPLOYMENT CONTRIBUTIONS OF UNCONVENTIONAL GAS DEVELOPMENT IN STATE ECONOMIES
IHS 19
4. ConclusionUnconventional gas activity is expected to make a significant contribution to all of the economies of the lower 48states over the next 25 years. Traditional oil and gas producing states like Texas and Louisiana will continue to leadthe way in terms of their absolute contributions to the US economy. But many new and emerging energy stateswill drive much of the growth in the coming years, and the economic activity generated by this increase in uncon-ventional gas activity will also reach well beyond the traditional unconventional producing states.