the development of patientsʼ perceptions of pharmacy ... · *corresponding author. e-mail:...
TRANSCRIPT

CMU. Journal (2006) Vol. 5(1) 61
The Development of Patients ̓Perceptions of Pharmacy Service Quality of Highly-Active Antiretroviral Therapy Program (PSQ-HAART)
Questionnaire in Chiang Rai Community Hospitals, Thailand
Wacharin Chaita1*, Chupen Viboonsunti2, Tanattha Kittisopee3, Unchalee Permsuwan2 and Ratanaporn Awipan2
1 Chiang Saen Hospital, Ministry of Public Health, Chiang Saen, Chiang Rai 57150, Thailand2 Department of Pharmaceutical Care, Faculty of Pharmacy, Chiang Mai University, Chiang Mai 50200, Thailand3 Department of Pharmacy Administration, Faculty of Pharmaceutical Sciences, Chulalongkorn University, Bangkok 10330, Thailand
*Corresponding author. E-mail: [email protected]
ABSTRACT The purpose of this study was to: 1) develop a self-administered written survey for assessing PSQ-HAART in Chiang Rai community hospitals 2) identify distinct constructs of the evaluation items and 3) examine the instruments ̓psychometric properties. Three- hundred-and-fifty-four service quality items include 22 from the original 22-item SERVQUAL, added to 319 items from patients ̓ expectations taken from in-depth interviews and 13 items on the pharmacists ̓ role in HIV/AIDS care from literature reviews. These 354 items were first reduced to a 49-item scale, and then two psychometric tests were performed. Psychometric test I was conducted among 320 patients from antiret-roviral (ARV) clinics in four Chiang Rai community hospitals. The first 49-item scale identified underlying dimensions and purified items. Results produced a six-dimensional 36-item scale (tangibles-reliability, assurance-empathy, empathy, responsiveness I, respon-siveness-assurance and responsiveness II) instead of the five dimensions of SERVQUAL (tangibles, reliability, responsiveness, assurance and empathy). Factor loadings ranged from 0.38 to 0.73. The 36-item scale was split into two sections: desired service level and perception of actual service level. This instrument was for Psychometric test II which was conducted a month later among 216 patients from ARV clinics in the other four community hospitals. Final results produced a 33-item scale in six dimensions and exhibited high internal consistency (0.94) of both expectation and perception items. The findings identified several aspects of pharmacy service quality in Thai community hospitals needing improvement. The questionnaire needs to be adapted for use in PSQ-HAART programs in community hospitals throughout the country.
Key words: Pharmacy service, Pharmacy service quality, Highly-active antiretroviral therapy, PS-HAART, PSQ-HAART, Construct validity, SERVQUAL, Chiang Rai com- munity hospitals

CMU. Journal (2006) Vol. 5(1)62 CMU. Journal (2006) Vol. 5(1) 63
INTRODUCTION The issue of service quality is very critcal in health care sectors. Recent focus of the Thai health care sector on patients ̓perceptions of service quality as an essential element in accreditation has seen generic service quality models being applied within the health care sector. Currently, Thailandʼs Institute of Hospital Quality Improvement and Accreditation has paid much attention to patients ̓ feedback as a condition of accreditation. The Thai government demands high quality care from managed care plans and health care providers and also attempts to stimulate health professionals to create a culture of quality within their health care organizations. At this time of rapid scaling up of antiretroviral therapy (ART), service quality is important for highly-active antiretroviral therapy (HAART) programs to succeed, especially in Thailand, as the availability of ART becomes widespread. In the upper north of Thailand where there is a lack of professional counselors (Horizon Program, 2004), pharmacists are often considered the most accessible health professionals, frequently at the frontline in helping HAART patients deal with barriers to medication access, side effects and drug interactions, and adhere to their medication regimens, especially for antiretroviral drugs, because these are so vital to successful HIV/AIDS treatment. There are several ways to collect feedback from patients regarding their evaluation of care. For this study, the survey method was selected because it requires a moderate amount of time and resources to conduct, and it allows patients to remain anonymous which may result in more open and honest feedback. According to Parasuraman et al., (1985), service quality can be defined as the difference between customers ̓expectations for service performance prior to the service encounter and their perceptions of the service received. They developed the Gap Analysis Model for measuring consumers ̓ perceptions of service quality and developed a service quality assessment tool called “SERVQUAL” which has been cited as a useful technique to system-atically assess public preferences for health care systems (Ryan et al., 2001). Although SERVQUAL has been successfully applied within a variety of private and public sector settings (Reidenbach and Sandler-Sallwood, 1990; Teas, 1993), very little evidence exists of its use in a PS-HAART setting. Therefore, it was necessary to conduct a study of whether this Gap Analysis Model could be applied in the PS-HAART context. Much knowledge has been gained from research related to health care providers ̓perceptions of service quality, however, current research is limited to the field of medical care and pertains only to western organizations. We cannot assume that they have equal applicability to PS-HAART in Thailand. If we can recognize its ̓benefits, it may, consequently, be of great interest to the occupational health community if it proves to be a valuable measure of quality in PS-HAART. The purpose of the study were to 1) develop a self-administered survey for assessing quality of PS-HAART in Chiang Rai community hospitals 2) identify distinct constructs of the evaluation items and 3) examine the instruments ̓psychometric properties. Results of the study can then be used to improve service quality for HAART patients in Thai community hospitals.

CMU. Journal (2006) Vol. 5(1)62 CMU. Journal (2006) Vol. 5(1) 63
MATERIALS AND METHODSThe First Step of Survey Development The Thai version of SERVQUAL (Kaewpan and Worapongsathorn, 2002), which retained 22 items of the original SERVQUAL, was reworded to suit the PS-HAART setting. The three-hundred-and-fifty-four service quality items include 22 items from the original SERVQUAL added with 319 items from patients ̓ expectations taken from in-depth interviews and 13 items on the pharmacists ̓role in HIV/AIDS care from a literature review. Then content validity was checked twice through a panel discussion with four professional pharmacists from Chiang Rai regional hospitals and three experts from the Faculty of Pharmacy, Chiang Mai University, as advisors. The next step, setting face validity was done with a panel discussion among six HAART patients and three people who had lived with HIV/AIDS (PLWHA) and had not yet enrolled in HAART program. Respondents identified difficulties with the formal wording of some items and their input was used to further refine and modify the questionnaire. As a result, a final 49-service quality scale was established for carrying out Psychometric test I.
Description of the First Version of the PSQ-HAART Questionnaire The first version of the questionnaire measuring patients ̓perceptions of PSQ-HAART included a 49 service-quality item scale which retained 22 items from SERVQUAL that were reworded for the PS-HAART setting. The other 17 items were drawn from patients ̓expec-tations, and 10 items from literature reviews (Table 1). These 49-item scale were grouped into five components. The first component, tangibles (7 items), reflects the medical facilities, equipment and appearance of personnel. The second component, reliability (16 items), reflects the ability to perform a promised service dependably and accurately. The third component, responsiveness (6 items), reflects the willingness to help customers and provide prompt service. The fourth component, assurance (10 items), reflects the knowledge and courtesy of employees and their ability to inspire trust and confidence. The last component, empathy (10 items), reflects the caring, individualized attention a firm provides its customers. The answers were given using a 5-point Likert scale, with 1 indicating “strongly disagree” to 5 indicating “strongly agree”.
Table 1. The PSQ-HAART measurement variable.
LatentVariable
ItemNo.
Measurement VariableThe first version PSQ-HAARTa
Item AdaptedFrom
The secondversionPSQ-
HAARTb
The revisedversionPSQ-
HAARTe
TAN1 1 The pharmacist has suitable guideline, SERVQUAL1 Dropped out textbook and/or document in caring me. TAN2 2 The service area at the pharmacy service SERVQUAL2 Dropped out is suitable. TAN3 3 The pharmacist is neat and professional- SERVQUAL3 Dropped out appearing.
Tangibles

CMU. Journal (2006) Vol. 5(1)64 CMU. Journal (2006) Vol. 5(1) 65
LatentVariable
ItemNo.
Measurement VariableThe first version PSQ-HAARTa
Item AdaptedFrom
The secondversionPSQ-
HAARTb
The revisedversionPSQ-
HAARTe
TAN4 4 Materials associated with PS-HAART are SERVQUAL4 suitable-appealing; for example, antiretroviral or anti-opportunistic infection pamphlets TAN5 5 The pharmacist creates a pleasure service A Dropped out environment. TAN6 6 I received antiretroviral drugs completely A Dropped out every time of drug filled. TAN7 7 The pharmacist provides memory table for A my antiretroviral self-administration. Reliability REL1 8 The pharmacist does service by a certain time SERVQUAL5 of ARV clinic. REL2 9 When I have a problem, the pharmacist SERVQUAL6 shows a sincere interest in solving it. REL3 10 The pharmacist performs the service right. SERVQUAL7 Dropped out REL4 11 The pharmacist provides his/her service at the SERVQUAL8 Dropped out time he/she promises do so. REL5 12 The pharmacist insists on my health care SERVQUAL9 record. REL6 13 I receive antiretroviral information A completely before starting the drugs. REL7 14 The pharmacist helps me manage my A antiretroviral schedule that accommodates for my life style. REL8 15 The pharmacist helps me care my health. A REL9 16 The pharmacist usually enhances my A Dropped out antiretroviral adherence. REL10 17 The pharmacist usually monitors my B antiretroviral program. REL11 18 The pharmacist establishes and maintains B rapport with me to ensure my adherence to antiretroviral. REL12 19 The pharmacist helps physicians in caring me. B REL13 20 The pharmacist provides me continuous care B with physicians and other healthcare providers. REL14 21 The pharmacist refers me to the physicians B Dropped out or other health care providers appropriately if necessary. REL15 22 The pharmacist works collaboratively with B Dropped out pharmacy staff, systemically in service me. REL16 23 The pharmacist sets system to contact me if B I missed the appointment.

CMU. Journal (2006) Vol. 5(1)64 CMU. Journal (2006) Vol. 5(1) 65
LatentVariable
ItemNo.
Measurement VariableThe first version PSQ-HAARTa
Item AdaptedFrom
The secondversionPSQ-
HAARTb
The revisedversionPSQ-
HAARTe
Responsiveness RES1 24 The pharmacist tells me exactly when service SERVQUAL10 will be performed. RES2 25 The pharmacist gives prompt service SERVQUAL11 to help me. RES3 26 The pharmacist is always willing to help me. SERVQUAL12 RES4 27 The pharmacist spends as much time as SERVQUAL13 Dropped out necessary with me at ARV clinic. RES5 28 The pharmacist is always available at the A Dropped out time of ARV clinic. RES6 29 I can consult the pharmacist by phone if I need. A Assurance ASS1 30 The behavior of the pharmacist instills SERVQUAL14 confidence in me. ASS2 31 I feel safe in the transaction of the pharmacist. SERVQUAL15 ASS3 32 The pharmacist is consistently courteous SERVQUAL16 Dropped out with me. ASS4 33 The pharmacist has the knowledge to answer SERVQUAL17 my questions. ASS5 34 The pharmacist has appropriate interpersonal A communication and counseling. ASS6 35 I can consult the pharmacist about B socioeconomic issues. ASS7 36 The pharmacist services me suitably B according to professional role. ASS8 37 I receive service from the pharmacist equity A to other patients. ASS9 38 The pharmacist respects my right to make B my own choice. ASS10 39 The pharmacist holds my information A provided secure. Empathy EMP1 40 The pharmacist gives me individual attention. SERVQUAL18 EMP2 41 The pharmacist has ARV clinic operating SERVQUAL19 Dropped out hour convenient to me. EMP3 42 The pharmacist gives me personal attention. SERVQUAL20 EMP4 43 The pharmacist has me best interest at heart. SERVQUAL21 EMP5 44 The pharmacist understands my specific needs. SERVQUAL22 EMP6 45 The pharmacist calls my name correctly. A Dropped out EMP7 46 The pharmacist responses to my feeling A appropriately.

CMU. Journal (2006) Vol. 5(1)66 CMU. Journal (2006) Vol. 5(1) 67
LatentVariable
ItemNo.
Measurement VariableThe first version PSQ-HAARTa
Item AdaptedFrom
The secondversionPSQ-
HAARTb
The revisedversionPSQ-
HAARTe
EMP8 47 The pharmacist responses to my needs. A EMP9 48 The pharmacist empowers me. A EMP10 49 The pharmacist has never blamed me. A Dropped out
Note : The statistic criterion cut-off point for item analysis are items with corrected item-total correlation less than 0.50 and inter-item correlation less than 0.30 were excluded from further analysis. a Scale are 1 = strongly disagree, 2 = disagree, 3 = uncertain, 4 = agree, 5 = strongly agree b Scale are 1 = lowest, 2 = low, 3 = uncertain, 4 = high, 5 = highest c Scale are 1 = lowest, 2 = low, 3 = uncertain, 4 = high, 5 = highest A : Item adapted from patients ̓expectations B : Item adapted from literature review
Data Collection Psychometric test I was conducted during November 2004 among 320 HAART patients from four Chiang Rai community hospitals, viz., Mae Sai, Mae Chan, Chiang Saen and Mae Suai Hospital with 80 patients randomly sampled from the access to care (ATC) number in each hospital. Psychometric test II was conducted during December 2004. Two-hundred-and-sixteen patients were recruited from four Chiang Rai community hospitals, viz., Phan, Somdej-prayarnsongworn, Mae Lao and Wiang Pa Pao Hospital with 54 patients randomly sampled from the ATC number in each hospital. Study procedures and the survey were pre-tested among ten HAART patients in Chiang Saen Hospital. Psychometric test I was conducted after adjusting data collection procedures based on their comments. A holistic care center nurse from each hospital acted as research assistant and two PLWHA volunteers from each hospital acted as fieldworkers and underwent intensive training to administer the survey to patients. Participants were asked to sign a consent form beforehand. The questionnaire took ap-proximately 20 minutes to complete. The method of responding to the survey depended on the ability of each respondent to answer. In the case of child respondents who could not write or answer by themselves, a parent or guardian responded on their behalf. For illiterate respondents and those with poor eyesight or any other limitation that prevented them from completing the survey alone, the fieldworker read out the question and wrote down their answers. Each manner of administration was noted. The fieldworkers ensured that patients filled out the survey in private which protected confidentiality and ensured a more honest response. Patient recruitment followed ethical standards of the Thailand National Research Council, Ethics Committee Guidelines of Organizations (World Health Organization), Council for International Organizations of Medical Science (CIOMS) and Ethical Conduct for Research Involving Humans (ICH Steering Committee, 2000; FERCIT, 2002) while the protocol was approved by the Ethical Review Committee of the Faculty of Pharmacy, Chiang Mai University.

CMU. Journal (2006) Vol. 5(1)66 CMU. Journal (2006) Vol. 5(1) 67
Data Analysis All statistical analysis was carried out using SPSS for Windows version 11.0 (SPSS Inc., Chicago, ILL., USA.). Descriptive statistics were used to describe the respondents ̓characteristics. Psychometric test I: Exploratory factor analysis was used to investigate the distinct constructs. A principle component analysis was used as the extraction method and varimax with Kaiser normalization was used as the rotation method. The criteria for retaining the factors were Eigenvalues greater than one and the ability to describe and label each factor. Factor loadings greater than 0.30 were considered to meet the minimal level, loadings of 0.40 were considered more important, and if the loadings were 0.50 or greater, they were consi-dered practically-significant (Hair et al., 1998). Coefficient alphas greater than 0.70 were considered acceptable. Items with corrected item-total correlation of less than 0.50 and inter-item correlation of less than 0.30 were excluded from further analysis. From these results, the second version of the questionnaire on patients ̓perceptions of PSQ-HAART was derived, which was used in Psychometric test II Psychometric test II: Reliability of the expectation and perception items were evaluated again with the same criterion cut-off point as Psychometric test I. The results of Psychometric test II led to a further revision of the questionnaire.
RESULTSPsychometric Test I Results Of 320 distributed questionnaires, a total of 319 were returned. Ten of the returned questionnaires were unusable due to responding with a 5 or 4 on all the values of items for each questionnaire. Three-hundred-and-nine useable questionnaires (96.6 percent) were used for data analysis. The average age of the respondents from the study sample was 33 years (range of 1–64). Their average income per month was 1,481.4 Baht (range of 0–50,000 Baht). The respondents reported that they had been patronizing the current PS-HAART program for an average of 14.4 months (range of 1–91 months). Respondents reported taking an average of 1.8 prescription medications per day (excluding ARV) (range of 0–8 prescription medi-cations). The majority of respondents, 56.3 percent, were female. Among the respondents, 55.3 percent completed high school, 37.2 percent did primary school, 2.6 percent went to college, 2.6 percent had a bachelorʼs degree and 3.2 percent had never attended school. Their occu-pations by percentage were: 37.5 percent doing agriculture, 33.7 percent were laborers, 9.1 percent were in trade, 4.6 percent were private business workers, 0.6 percent were government officers and 13.2 percent had no career. When answering the question of whether or not they had health insurance, the majority of respondents (89.3 percent) indicated that they had a government health coverage insurance card. The respondents reported their health status as either good (53.7 percent), fair (29.8 percent), very good (13.6 percent), poor (1.6 percent) or very poor (0.3 percent). The majority of respondents, or 76 percent, receive the GPO vir antiretroviral (ARV) formula (three drugs fixed-dose combination tablets). The remaining 21.4 percent received three drugs in separate formulations. A total of 87.2 percent completed the questionnaire by themselves. For the remaining 12.8 percent, fieldworkers read out the questionnaire to them (9.8 percent were hindered by poor eyesight and 3.1 percent were
CMU. Journal (2006) Vol. 5(1)68 CMU. Journal (2006) Vol. 5(1) 69
illiterate in Thai).
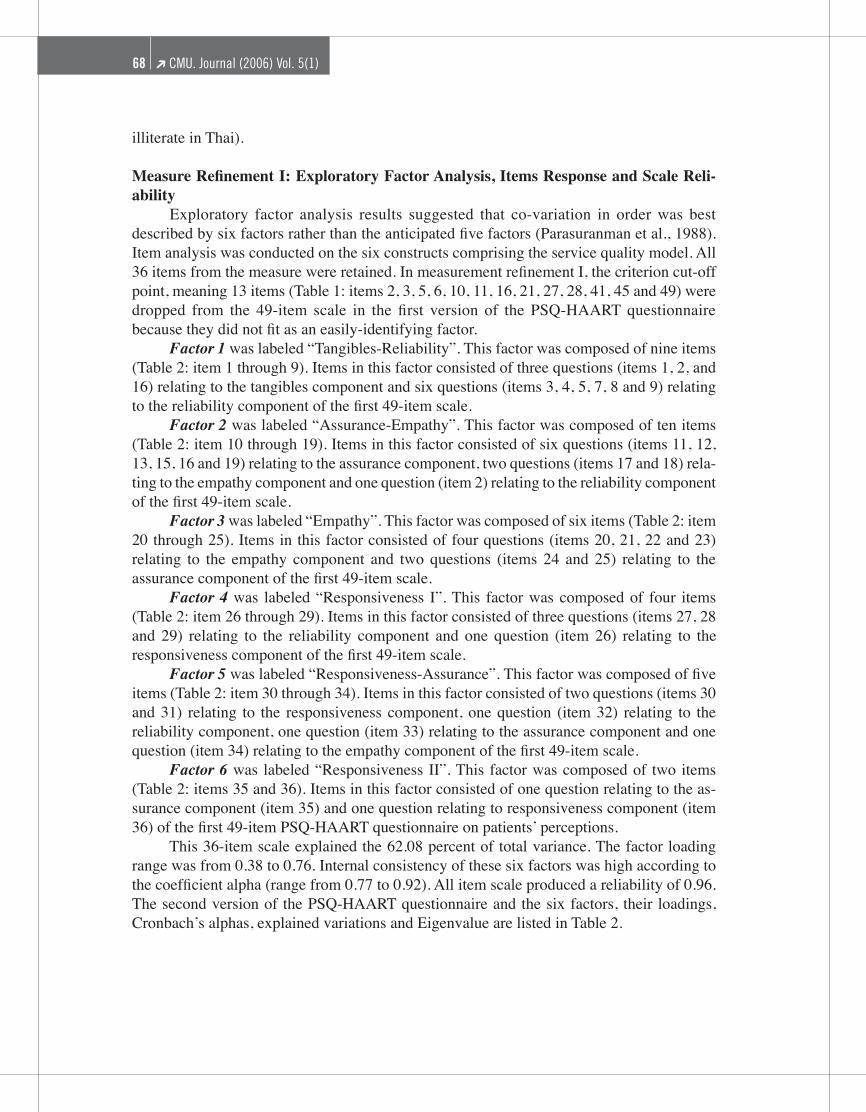
Measure Refinement I: Exploratory Factor Analysis, Items Response and Scale Reli-ability Exploratory factor analysis results suggested that co-variation in order was best described by six factors rather than the anticipated five factors (Parasuranman et al., 1988). Item analysis was conducted on the six constructs comprising the service quality model. All 36 items from the measure were retained. In measurement refinement I, the criterion cut-off point, meaning 13 items (Table 1: items 2, 3, 5, 6, 10, 11, 16, 21, 27, 28, 41, 45 and 49) were dropped from the 49-item scale in the first version of the PSQ-HAART questionnaire because they did not fit as an easily-identifying factor. Factor 1 was labeled “Tangibles-Reliability”. This factor was composed of nine items (Table 2: item 1 through 9). Items in this factor consisted of three questions (items 1, 2, and 16) relating to the tangibles component and six questions (items 3, 4, 5, 7, 8 and 9) relating to the reliability component of the first 49-item scale. Factor 2 was labeled “Assurance-Empathy”. This factor was composed of ten items (Table 2: item 10 through 19). Items in this factor consisted of six questions (items 11, 12, 13, 15, 16 and 19) relating to the assurance component, two questions (items 17 and 18) rela-ting to the empathy component and one question (item 2) relating to the reliability component of the first 49-item scale. Factor 3 was labeled “Empathy”. This factor was composed of six items (Table 2: item 20 through 25). Items in this factor consisted of four questions (items 20, 21, 22 and 23) relating to the empathy component and two questions (items 24 and 25) relating to the assurance component of the first 49-item scale. Factor 4 was labeled “Responsiveness I”. This factor was composed of four items (Table 2: item 26 through 29). Items in this factor consisted of three questions (items 27, 28 and 29) relating to the reliability component and one question (item 26) relating to the responsiveness component of the first 49-item scale. Factor 5 was labeled “Responsiveness-Assurance”. This factor was composed of five items (Table 2: item 30 through 34). Items in this factor consisted of two questions (items 30 and 31) relating to the responsiveness component, one question (item 32) relating to the reliability component, one question (item 33) relating to the assurance component and one question (item 34) relating to the empathy component of the first 49-item scale. Factor 6 was labeled “Responsiveness II”. This factor was composed of two items (Table 2: items 35 and 36). Items in this factor consisted of one question relating to the as-surance component (item 35) and one question relating to responsiveness component (item 36) of the first 49-item PSQ-HAART questionnaire on patients ̓perceptions. This 36-item scale explained the 62.08 percent of total variance. The factor loading range was from 0.38 to 0.76. Internal consistency of these six factors was high according to the coefficient alpha (range from 0.77 to 0.92). All item scale produced a reliability of 0.96. The second version of the PSQ-HAART questionnaire and the six factors, their loadings, Cronbachʼs alphas, explained variations and Eigenvalue are listed in Table 2.

CMU. Journal (2006) Vol. 5(1)68 CMU. Journal (2006) Vol. 5(1) 69
ItemNo.
Variable Mean SD FactorLoading
Communality
Factor 1 Tangibles-reliability, Percent variance explained = 15.57, Cronbachʼs alpha = 0.92, Eigenvalue = 6.01
1 TAN1 3.88 0.93 0.63 0.69 2 TAN4 4.07 1.06 0.69 0.66 3 REL6 4.33 0.89 0.57 0.67 4 REL5 4.03 1.08 0.73 0.75 5 REL7 4.09 0.91 0.53 0.62 6 TAN7 4.10 1.06 0.57 0.73 7 REL10 4.10 1.04 0.67 0.75 8 REL8 3.86 0.96 0.58 0.58 9 REL2 4.11 0.85 0.54 0.55
Factor 2 Assurance-empathy, Percent variance explained = 13.62, Cronbachʼs alpha = 0.89, Eigenvalue = 2.17
10 REL1 4.26 0.76 0.59 0.54 11 ASS4 4.22 0.75 0.51 0.53 12 ASS5 4.31 0.76 0.62 0.60 13 ASS7 4.26 0.64 0.64 0.55 14 REL15 4.36 0.63 0.54 0.39 15 ASS2 4.28 0.68 0.49 0.67 16 ASS8 4.47 0.67 0.76 0.64 17 EMP1 4.24 0.89 0.46 0.65 18 EMP4 4.22 0.80 0.48 0.57 19 ASS3 4.50 0.62 0.62 0.60
Factor 3 Empathy, Percent variance explained = 10.11, Cronbachʼs alpha = 0.83, Eigenvalue = 1.43 20 EMP5 3.84 0.97 0.64 0.5721 EMP8 3.79 0.83 0.70 0.6622 EMP7 3.93 0.85 0.60 0.5823 EMP3 3.60 1.15 0.51 0.5424 ASS9 3.80 0.84 0.67 0.6325 ASS10 4.07 0.89 0.55 0.56
Factor 4 ResponsivenessI, Percent variance explained = 8.89, Cronbachʼs alpha = 0.80, Eigenvalue = 1.23 26 RES1 4.15 0.94 0.56 0.64 27 REL12 3.90 0.92 0.49 0.58 28 REL13 4.16 0.86 0.53 0.60 29 REL16 3.78 1.09 0.71 0.70
Factor 5 Responsiveness-assurance, Percent variance explained = 8.01, Cronbachʼs alpha = 0.81,Eigenvalue = 1.09
Table 2. Mean and Standard Deviation of Measurement Variable, Factor Loading and Com- munity of the Second Version of PSQ-HAART Questionnaire (n = 309).

CMU. Journal (2006) Vol. 5(1)70 CMU. Journal (2006) Vol. 5(1) 71
ItemNo.
Variable Mean SD FactorLoading
Communality
30 RES2 4.14 0.77 0.38 0.55 31 RES3 4.23 0.78 0.47 0.63 32 REL11 4.18 0.79 0.51 0.62 33 ASS1 4.23 0.79 0.58 0.68 34 EMP9 4.39 0.72 0.48 0.56
Factor 6 ResponsivenessII, Percent variance explained = 5.83, Cronbachʼs alpha = 0.77, Eigenvalue = 1.08
35 ASS6 3.26 1.09 0.58 0.71 36 RES6 3.61 1.04 0.70 0.74
Total ModelPercent variance explained = 62.08Cronbachʼs alpha = 0.96
Note: Scale are 1 = lowest, 2 = low, 3 = uncertain, 4 = high, 5 = highestCoefficient alphas greater than 0.70 were considered acceptable.The criterion for retaining the factors were Eigenvalues greater than one and the ability to describe and label each factor. Factor loadings greater than 0.30 are considered to meet the minimal level, loadings of 0.40 are con-sidered more important, and if the loadings are 0.50 or greater, they are considered practically significant (Hair et al., 1998).
Description of the Second Version of the PSQ-HAART Questionnaire The second version of the PSQ-HAART questionnaire was organized in six components with a total of 36 items. It retained 16 reworded items from SERVQUAL. Of the remaining twenty items, eleven were derived from patients ̓expectations and nine items were derived from a literature review (Table 1). These are tangibles-reliability (9 items), assurance-empathy (10 items), empathy (6 items), responsiveness I (4 items), respon-siveness-assurance (5 items) and responsiveness II (2 items). After the refinement of Psychometric test I, the remaining 36-item scale was split into two sections. Respondents were asked to rate each attribute of service quality two times in two columns: desired service level and perception of actual service level. The first column had 36 items with a five-point Likert scale (1 = lowest to 5 = highest), asking HAART patients to indicate the level of service they would expect from PSQ-HAART. The second column also had 36 similarly-worded items, with a five-point Likert scale (1 = lowest to 5 = highest), asking HAART patients to evaluate the service performed by their PS-HAART program. Each paired item derived a difference score, with Q representing perceived quality, based on the difference between the ratings on the corresponding perception (P) and expec-tation (E) statements. Hence: Perceived Service Quality (Q) = Perception (P) ñ Expectation (E). This shows that the gap discrepancy between desired service expectation and perception of actual service is the key concept of service quality. The result was derived from the 36-item PSQ-HAART questionnaire and this was the instrument used for Psychometric test II.
Psychometric Test II Results Of 216 distributed questionnaires, a total of 214 were returned. Twenty-three of the questionnaires were not useable due to giving all of the item responses a value of 5 or 4.
CMU. Journal (2006) Vol. 5(1)70 CMU. Journal (2006) Vol. 5(1) 71
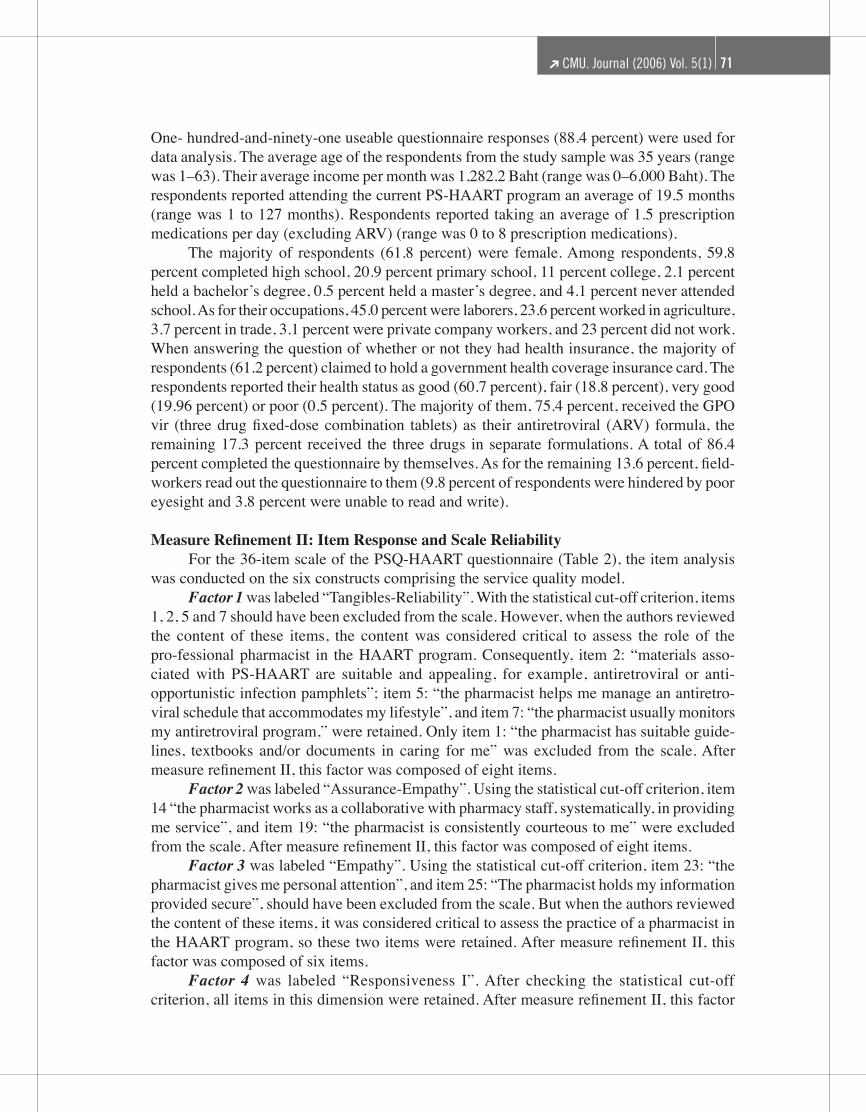
One- hundred-and-ninety-one useable questionnaire responses (88.4 percent) were used for data analysis. The average age of the respondents from the study sample was 35 years (range was 1–63). Their average income per month was 1,282.2 Baht (range was 0–6,000 Baht). The respondents reported attending the current PS-HAART program an average of 19.5 months (range was 1 to 127 months). Respondents reported taking an average of 1.5 prescription medications per day (excluding ARV) (range was 0 to 8 prescription medications). The majority of respondents (61.8 percent) were female. Among respondents, 59.8 percent completed high school, 20.9 percent primary school, 11 percent college, 2.1 percent held a bachelorʼs degree, 0.5 percent held a masterʼs degree, and 4.1 percent never attended school. As for their occupations, 45.0 percent were laborers, 23.6 percent worked in agriculture, 3.7 percent in trade, 3.1 percent were private company workers, and 23 percent did not work. When answering the question of whether or not they had health insurance, the majority of respondents (61.2 percent) claimed to hold a government health coverage insurance card. The respondents reported their health status as good (60.7 percent), fair (18.8 percent), very good (19.96 percent) or poor (0.5 percent). The majority of them, 75.4 percent, received the GPO vir (three drug fixed-dose combination tablets) as their antiretroviral (ARV) formula, the remaining 17.3 percent received the three drugs in separate formulations. A total of 86.4 percent completed the questionnaire by themselves. As for the remaining 13.6 percent, field-workers read out the questionnaire to them (9.8 percent of respondents were hindered by poor eyesight and 3.8 percent were unable to read and write).
Measure Refinement II: Item Response and Scale Reliability For the 36-item scale of the PSQ-HAART questionnaire (Table 2), the item analysis was conducted on the six constructs comprising the service quality model. Factor 1 was labeled “Tangibles-Reliability”. With the statistical cut-off criterion, items 1, 2, 5 and 7 should have been excluded from the scale. However, when the authors reviewed the content of these items, the content was considered critical to assess the role of the pro-fessional pharmacist in the HAART program. Consequently, item 2: “materials asso-ciated with PS-HAART are suitable and appealing, for example, antiretroviral or anti-opportunistic infection pamphlets”; item 5: “the pharmacist helps me manage an antiretro-viral schedule that accommodates my lifestyle”, and item 7: “the pharmacist usually monitors my antiretroviral program,” were retained. Only item 1: “the pharmacist has suitable guide-lines, textbooks and/or documents in caring for me” was excluded from the scale. After measure refinement II, this factor was composed of eight items. Factor 2 was labeled “Assurance-Empathy”. Using the statistical cut-off criterion, item 14 “the pharmacist works as a collaborative with pharmacy staff, systematically, in providing me service”, and item 19: “the pharmacist is consistently courteous to me” were excluded from the scale. After measure refinement II, this factor was composed of eight items. Factor 3 was labeled “Empathy”. Using the statistical cut-off criterion, item 23: “the pharmacist gives me personal attention”, and item 25: “The pharmacist holds my information provided secure”, should have been excluded from the scale. But when the authors reviewed the content of these items, it was considered critical to assess the practice of a pharmacist in the HAART program, so these two items were retained. After measure refinement II, this factor was composed of six items. Factor 4 was labeled “Responsiveness I”. After checking the statistical cut-off criterion, all items in this dimension were retained. After measure refinement II, this factor

CMU. Journal (2006) Vol. 5(1)72 CMU. Journal (2006) Vol. 5(1) 73
remained composed of four items. Factor 5 was labeled “Responsiveness-Assurance”. With the statistical cut-off criterion, all items in this dimension were retained. After measure refinement II, this factor remained composed of five items. Factor 6 was labeled “Responsiveness II”. This factor was composed of two items (items 35 and 36) on availability of socioeconomic counseling and counseling by telephone. After checking the statistical cut-off criterion, all items in this dimension were retained. Af-ter measure refinement II, this factor remained composed of eight items. After measure refinement II, three items were dropped from the 36-item scale : item 1, “the pharmacist has suitable guidelines, textbooks and/or documents in caring for me”; item 14, “the pharmacist works as a collaborative with pharmacy staff, systematically, in providing me service”; and item 19, “the pharmacist is consistently courteous with me”. After the items were dropped, 33 items from the measure were retained and produced a reliability of 0.94 for both the expectation and perception parts. The revised scale retained 14 items from SERVQUAL but was reworded. Of the remaining 19 items, 11 were derived from patients ̓expectations and 8 were derived from a literature review. The coefficient alpha for this revised part of the 33-item scale of expectation and perception is shown in Table 3.
Table 3. Comparison Reliability Coefficients of PSQ-HAART Between the Second and the Revised Version of the PSQ-HAART Questionnaire.
DISCUSSION AND CONCLUSION A comparison of dimensions and item numbers between SERVQUAL (Parasuraman et al., 1988) and the first, second and final versions of the PSQ-HAART Questionnaire is shown in Table 4. SERVQUAL has a total of 5 dimensions (tangibles, reliability, responsiveness, assurance and empathy) and 22 items. The first version of PSQ-HAART questionnaire used the same 5 dimensions but started with 49 items, that is, with more focus on reliability, assurance and empathy. The second version was reduced to a 36-item scale and had combined tangibles-reliability, assurance-empathy and responsiveness-assurance dimensions, and also divided responsiveness into 2 dimensions, with a total of 6 dimensions. The third, final ver-sion of the PSQ-HAART questionnaire, contained the same number of dimensions but was reduced to a 33-item scale and exhibited a high internal consistency (0.94) of both
Dimension
The Second Version PSQ-HAART The Third Version PSQ-HAARTNo. ofItems
Expec-tation Alpha
Percep-tion
Alpha
ServiceQualityAlpha
No. ofItems
Expec-tation Alpha
Percep-tion
Alpha
ServiceQualityAlpha
Tangibles-reliability 9 0.87 0.81 0.82 8 0.85 0.79 0.80 Assurance-empathy 10 0.82 0.86 0.78 8 0.90 0.85 0.85 Empathy 6 0.84 0.76 0.76 6 0.84 0.76 0.76 Responsiveness I 4 0.81 0.77 0.77 4 0.81 0.77 0.77 Responsiveness-Assurance 5 0.85 0.84 0.84 2 0.85 0.84 0.84 Responsiveness II 2 0.73 0.71 0.71 5 0.73 0.71 0.71 Total 36 0.95 0.96 0.93 33 0.95 0.94 0.94

CMU. Journal (2006) Vol. 5(1)72 CMU. Journal (2006) Vol. 5(1) 73
expectation and perception items.
Table 4. Comparison of dimension and items numbers of SERVQUAL(a), the first, second and revised version of PSQ-HAART Questionnaire.
Results from two psychometric tests show the adaptation of the instrument and its inherent reliability, validity and applicability to measure the quality of PS-HAART services. However, an analysis of the construct validity of the PSQ-HAART questionnaire suggested that they were not always in accordance with those of the SERVQUAL questionnaire and had more components than the standard five components of SERVQUAL (Parasuraman et al., 1988), possibly due to these factors: First, the SERVQUAL survey is a tool used overseas to measure service quality of general business services, such as those provided by post offices, hotels and accident insurance companies. When the same questions are applied to health services in Thailand, they have a different context. Using a questionnaire developed overseas to do research within Thai society can cause problems with construct validity of the questionnaire, as it may differ from the original. This result is similar to that of Wiwatwongkasaem et al., (1999); and Kaewpan et al., (2000), because the structure of society and organizations in Thailand differ from those in western countries in many ways, in terms of values, beliefs and way of life, including the work and service culture of organizations. The results of this study reflect the necessity of adjusting research tools to form an appropriate structure in accordance with the context of Thai society. Also, since hospital services are different from other service provi-ders, measuring service quality of the PS-HAART program in Chiang Rai community hospi-tals should be conducted with an adjusted questionnaire. This will ensure construct validity to be more in accordance with the type of service, making the questionnaire more relevant
SERVQUAL(a) PSQ-HAART PSQ-HAART PSQ-HAART (first version) of (second version) of (revised version) Tangibles/ Tangibles/ Tangibles-reliability/ Tangibles-reliability/ 4 items 7 items 9 items 8 items Reliability/ Reliability/ - - 5 items 16 items Responsiveness/ Responsiveness/ Responsiveness1/ Responsiveness1/ 4 items 6 items 4 items 4 items Responsiveness- Responsiveness- assurance/ assurance/ 2items 2items Responsiveness2/ Responsiveness2/ 5 items 5 items Assurance/ Assurance/ Assurance-empathy/ Assurance-empathy/ 4 items 10 items 10 items 8 items Empathy/ Empathy/ Empathy/ Empathy/ 5 items 10 items 6 items 6 items Total/ Total/ Total/ Total/ 5 dimensions 5 dimensions 6 dimensions 6 dimensions 22 items 49 items 36 items 33 items
(a) Parasuraman et al., (1988).

CMU. Journal (2006) Vol. 5(1)74 CMU. Journal (2006) Vol. 5(1) 75
and appropriate for use in health services in Thailand in the future. Second, it is difficult for patients to evaluate the technical quality of services received (such as professionalism and skills), so the language or phrasing of questions in the question-naire should be adjusted appropriately. As the questions in each component are very similar in meaning, some patients may not be able to clearly differentiate between them. Also, items that were deleted after an analysis of the components should be reconsidered, as the language of the questions could be adjusted for easier understanding by the patients. In this way, responses from HAART patients serviced by hospitals may result in a somewhat different questionnaire structure. Third, the questionnaire in this study had been adjusted the levels of response to each question from 7 levels to just 5 levels, to make it easier for patients to decide on a response to gauge their evaluation or their feelings on the service received. Researchers suggested that a mixture of negatively- and positively-worded items should usually be used, as in the Likert response format, ranging from ʻstrongly disagree ̓to ʻstrongly agreeʼ. The large number of items in the final questionnaire could lead to unreliable answers, so adjustments need to be made in order to prevent distortion of the responses by acquiescence, bias or ʻyes-saying or nay-saying ̓tendencies (Pedhazur et al., 1982; Belson, 1984; Schmitt and Stults, 1985; Bagozzi, 1994; Herch and Engelland, 1996). But after measure refinement I, the five-point Likert response format was revised from ʻ1 = strongly disagree to 5 = strongly agree ̓to ʻ1 = lowest to 5 = highestʼ. A mixture of negatively- and positively-worded items was not appropriate, thus all the items were positively-worded.
LIMITATION OF THE STUDY The results should be viewed in light of the studyʼs limitations. We studied PS-HAART which was carried out in one type of hospital (a community hospital) in only one province of Thailand. Generalization of the study results to other types of hospitals or with other illnesses may not be applicable. The results of this study, while intuitively-suggesting HAART patients might benefit from it, do not specifically support that claim. More research is needed to explore if other patient populations would value a service of this nature. Although the scope of this study is limited to PS-HAART in Chiang Rai community hospitals, the find-ings may also be beneficial to PS-HAART programs in community hospitals elsewhere in Thailand. However, further research is needed to develop better measures of the constructs and the revision should be repeatedly tested with a sample group from hospitals in other provinces in order to guarantee its clarity and the appropriateness of the structure for measuring PSQ-HAART in community hospitals throughout the country.
ACKNOWLEDGEMENTS Thank for the supporting of the University Income of 2005, Faculty of Pharmacy, Chiang Mai University; the Graduate School and the Norwegian Church AID. Thanks also due to the collaboration of the Chiang Rai regional hospital, all community hospitals in Chiang Rai province and all participants in the study. Special thanks go to Suparet Wongputh, statistic consultant, and Sara J. Whitehead who assisted with editing this paper.

CMU. Journal (2006) Vol. 5(1)74 CMU. Journal (2006) Vol. 5(1) 75
REFERENCESBagozzi, R.P. 1994. Measurement in marketing research: Basic principles of questionnaire
design. p. 1–49. In R.P. Bagozzi (ed) Principles of marketing research. London: Black-well Publishers.
Belson, W. A. 1984. The design and understanding of survey questions. Aldershot: Gower Publishing Co. Ltd.
FERCIT. (Forum for Ethical Review Committee in Thailand). 2002. Ethical Guideline for National Human Research.
Hair, J. F., R. E. Andreson, R. L. Tatham , and W. C. Black. 1998. Multivariate data analysis. 5th ed, p. 98-99, Unites States of America : Prentice - Hall Inc.
Horizon Program. 2004. (Community Medicine Department, Chiang Mai University; Office of Disease Prevention and Control Region 10, Chiang Mai, AIDS Section, Ministry of Public Health) A rapid situation analysis of the access to care project in Northern Thailand. The Population Council Inc., Bangkok, Thailand.
Herch, J., and B. Engelland. 1996 Reversed-polarity items and scale unidimensionality. J Academy Marketing Science 4:366–374.
ICH Steering Committee. 2000. ICH: Harmonised Tripartile Guideline for Good Clinical Practice. ICH Secretarial.
Kaewpan, W., S. Treamchaisri, and T. Worapongsathorn. 2000. The assessment of construct validity of health belief questionnaire in breast cancer and breast cancer self-assessment of women in Bangkok. Bulletin of the Public Health Nursing 14: 33–45.
Kaewpan, W., and S. Worapongsathorn. 2002. Construct validity of clientʼs perception on service quality questionnaire at Out-Patient Department in regional and general hos-pitals Ministry of Public Health, Central Region, Thailand. Bulletin of the Department of Medical Service 27(11): 503–513.
Leuseree, T. 2003. A follow-up study of 819 PLWHA in the first cohort of the ATC project. Paper presented at CDC Region 10 annual meeting, February 25, Chiang Mai, Thailand.
Parasuraman, A., V. A. Zeithaml, and L. L. Berry. 1985. A conceptual model of service quality and its implications for future research. Journal of Marketing 49(Fall): 41–50.
Parasuraman, A., V. A. Zeithaml, and L.L Berry. 1988. SERVQUAL: A multiple-item scale for measuring consumer perceptions of service quality. Journal of Retailing 64: 12–40.
Pedhazur, E. J. 1982. Multiple regression in behavioral research. NewYork: Holt, Rinehart and Winston.
Reidenbach, R. E., and B. Sandifer-Smallwood. 1990. Exploring perceptions of hospital operations by a modified SERVQUAL approach. Journal of Health Care Marketing 10(4): 47–55.
Ryan, M., D. A. Scott, and C. Reeves. 2001. Eliciting public preferences for healthcare: A systematic review of techniques. Health Technology Assessment 5(5): 1–186.
Schmitt, N., and D.M., Stults. 1985. Factors defined by negatively keyed items: the result of careless respondents. Applied Psychological Measurement. 9: 367-373.
Teas, R. K. 1993. Expectations, performance evaluation and consumerʼs perception of quality. Journal of Marketing 57(4): 18–34.
Wiwatwongkasam, C. 1999. The validity of internal and external power health belief ques-tionnaire. Health Journal 26: 40–45.

Page 76 none