relationships of service quality, patient satisfaction and...
TRANSCRIPT

CM
U. Journal (2007) Vol. 1(1)
177
C H I A N G M A I U N I V E R S I T Y J O U R N A L
Wacharin Chaitha1*, Chupen Viboonsunti2, Tanattha Kittisopee3, Unchalee Permsuwan2, Ratanaporn Awipan2 and Penkarn Karnjanarat2
Relationships of Service Quality, Patient Satisfactionand Patient Behavioral Intention of Pharmacy Service
of Highly-Active Antiretroviral erapy in Community Hospitals in Chiang Rai Province, ailand
1Chiang Saen Hospital, Ministry of Public Health, Chiang Saen, Chiang Rai 57150, ailand2Department of Pharmaceutical Care, Faculty of Pharmacy, Chiang Mai University, Chiang Mai 50200, ailand3Department of Pharmacy Administration, Faculty of Pharmaceutical Science, Chulalong-korn University, Bangkok 10330, ailand*Corresponding author. E-mail:[email protected]
ABSTRACT
The study examined the construct validity of the pharmacist model of pharmacy service quality of highly-active antiretroviral therapy
(PSQ-HAART) program. e proposed model was tested by identifying the relationships among pharmacy service quality, patient satisfaction and behavioral intention using path analysis. It simultaneously considered the direct effects of service quality and patient satisfaction on patient behavioral intention. It also considered the indirect effect of service quality on patient behavioral intention. Data collection was conducted during April 2005 among a random sample of 613 patients from ‘Access to Care’ clinics at 16 community hospitals in Chiang Rai province. A total of 607 questionnaires were returned (99.0 % response rate). Of these, 594 questionnaires were used for data analysis. e results suggest that service quality and patient satisfaction were directly correlated patient behavioral intention considered all the variables collectively (β = 0.218 and 0.617 respectively, p < 0.001). Service quality was also directly correlated pa-tient satisfaction (β = 0.431, p < 0.001). e impact of service quality on patient behavioral intention was enhanced by the indirect correlation (β = 0.266, p < 0.001). Based on these results, the PSQ-HAART model was confirmed. is model may be of benefit to the pharmacy service of highly-active antiretroviral therapy (HAART) programs. It implied that patients’ perception of service quality must be developed before satisfying the patient. If patients were satisfied with pharmacy service, they would have positive behavioral intention towards the service.

CM
U. Journal (2007) Vol. 1(1)
178
2007Cmu. Journal of Soc. Sci. and Hum.
INTRODUCTION
Chiang Rai province was one of the top five prevalent numbers of HIV/AIDS patients, with 19,144 cases during September 1984 to
October 2005 (Bureau of Epidemiology Department of Disease Control, 2005). All government community hospitals in Chiang Rai province they established separate Access to Care (ATC) clinics to provide highly-active antiretroviral therapy (HAART) (Horizon Program, 2004). Pharmacy service in these hospitals support the various components of the medica-tion-use process (ordering, dispensing, administering, monitoring, and education) with people living with HIV/AIDS (PLWHA), as part of the HAART program. In March 2005, there were 2,285 patients enrolled in the program in Chiang Rai province (data from the AIDS section, Chiang Rai Provincial Health Office; March, 2005). With rapid scaling up of access to ART in Chiang Rai province, patient adherence to their antiretroviral regimen is an extremely impor-tant behavior to ensure patient outcome and the success of the HAART program. However, studies on actual adherence of HAART patients are difficult to carry out and expensive. As patient behavioral intention is a predisposition to the patient’s future behavior (John, 1991), service quality and patient satisfaction are typically studies linked to behavioral intention. Better quality is related to the higher level of patient satisfaction and posi-tive behavioral intention to use the service. Patients with higher satisfaction levels often make important behavioral changes, including maintaining more stable relationships with providers (Crosby et al., 1990), changing or returning to the same hospital service provider (Woodside et al., 1989), adhering to medical regimen and treatment (Bartlett et al., 1984; Ley, 1988; Scott-Lennox et al., 1998; Peck, 2002), keeping appointments and recommending companies or service providers to others (Woodside et al., 1989). However, a review of the literature indicates that there is a general confusion over the causal ordering of service quality and satisfaction (Bitner and Hubbert, 1994; Rust and Oliver, 1994; Dabholkar, 1995) and as to which construct is a better predictor of behavioral intention (Bolton and Drew, 1991; Cronin and Taylor, 1992; Bitner and Hubbert, 1994). From the service providers’ perspective, clarity of these fundamental issues is necessary before practitioners can determine which construct best captures their customers’ evaluations of the service(s) provided and whether it is both constructs, or one opposed to the other. ey are needed to provide relevant evaluations that can be used for decision-making to improve pa-tient health behaviors.

CM
U. Journal (2007) Vol. 1(1)
179
C H I A N G M A I U N I V E R S I T Y J O U R N A L
Causality of Global Constructs A review of the service marketing literature reveals several aspects which support the conceptual framework this study which is composed of three constructs. e first perspective suggests that satisfaction is antecedent to per-ceived service quality. e basis of this perspective is that service quality (similar to an attitude) (Parasuraman et al., 1988), is an overall evaluation and accumulation of satisfaction judgments, resulting in a global perception of service quality. Although this perspective has been supported theoreti-cally within the literature (Bolton and Drew, 1991), there is little empirical research to support this conceptual (Anderson and Sullivan, 1993). e second perspective suggests that service quality is antecedent to satisfaction. e basis of this perspective is that service quality, as a cogni-tive evaluation (according to its attitudinal conceptualization) precedes the more emotive satisfaction evaluation. Simply stated, positive service quality perceptions will lead to a more satisfied consumer. As such, satisfaction is considered superordinate to service quality. A number of studies offers empirical evidence and theoretical support for this conceptual (Cronin and Taylor, 1992; Anderson and Sullivan, 1993; Gotlieb et al., 1994). e foundation of this relationship is the appraisal, emotional response, coping framework suggested by Lazarus (1991) and Bagozzi (1992). is conceptualization posits service quality as antecedent to satisfaction based on its cognitive evaluation and satisfaction, due to its emotive nature (Dabholkar, 1995), as directly influencing behavioral intention (Brady and Robertson, 2001). Empirical research found that satisfaction has a direct effect on behavioral intention (Gotlieb et al., 1994). Service quality has an indirect effect on behavioral intention. Service quality is antecedent to satisfaction (Cronin and Taylor, 1992; Rust and Oliver, 1994). e final perspective suggests that neither satisfaction nor perceived service quality is considered superordinate (Cronin and Taylor, 1994; Dab-holkar, 1995). Given these three perspectives, it is not surprising that Rust and Oliver (1994) consider the causal ordering of the relationship between satisfaction and service quality as “perhaps the most intriguing issue” facing the discipline (Cronin et al., 2000). ere is ample evidence of relationships between both service quality and satisfaction with behavioral intention. Although it is clear that service quality is an important determinant of behavioral intention, the exact nature of this relationship remains unresolved. It is evident that few studies have investigated multiple direct links between service quality, satisfaction, and behavioral intention. Further, there is few reported investigation of whether

CM
U. Journal (2007) Vol. 1(1)
180
2007Cmu. Journal of Soc. Sci. and Hum.
either or both service quality and satisfaction directly influence behavioral intention when the effects of both two are simultaneously considered. Another belief is that partial examination of the simple links between any of the constructs and behavioral intention may mask or overstate their true relationship due to omitted variable bias.
Conceptual Framework of the Study In order to understand the underlying relationships that exist among these variables, the PSQ-HAART model was tested (Figure 1). e model presented within this study attempts to aggregate the divergent views expressed in the literature addressing a multi-dimensional conceptualiza-tion of service quality. Moreover, the application of this model within the context of pharmacy service of HAART programs represents a first attempt at integrating the diverse models from the service marketing literature with models of quality assurance and health status from health care literature. is study tested whether service quality and patient satisfaction directly lead to a favorable behavioral intention simultaneously.
Figure 1: Proposed Path Model of Perceived PSQ-HAART.
e researchers hypothesized the PSQ-HAART model based on the second perspective, which was mentioned previously. at is, that service quality has a direct effect on satisfaction (Cronin and Taylor, 1992; Gotlieb et al., 1994; Dabholkar, 1995; Lazarus, 1991; Bagozzi, 1992;). Addition-ally, satisfaction has a direct effect on behavioral intention (Goltieb et al., 1994, Brady and Robertson, 2001) and service quality has direct effect on behavioral intention (Cronin et al., 2000). Furthermore, service quality also has an indirect effect to behavioral intention through satisfaction (Cro-nin and Taylor, 1992; Rust and Oliver, 1994). is extension is offered: (1) to further our understanding of how service quality and satisfaction influence behavioral intentions, (2) to add to the growing body of litera-ture that specifies the interrelationships between these variables and (3) because these effects have yet to be considered. Specifically, the question is whether service quality perceptions have a significant indirect influence on behavioral intention through patient satisfaction.
Satisfaction
Service quality Behavioral intention

CM
U. Journal (2007) Vol. 1(1)
181
C H I A N G M A I U N I V E R S I T Y J O U R N A L
Objectives of the Study To identify the relationships between service quality, patient satisfac-tion and behavioral intention in relation to a provision of pharmacy service of HAART program in community hospitals in Chiang Rai province.
Definitions of the Study Constructs Service quality Service quality in this study was defined based on the Parasuraman, et al. (1985) as a set of key discrepancies or existing gaps regarding execu-tive perceptions of service quality and tasks associated with service delivery to patients.
Patient satisfaction Patient satisfaction in this study was defined based on Hunt, et al. (1977) as an evaluation of an emotion of patients on how much they satisfy with the pharmacy service in the HAART program.
Patient behavioral intention Patient adherence to antiretroviral regimens is an extremely impor-tant behavior to ensure success of a pharmacy service of HAART program. However, studies on actual behavior of HAART patients are difficult to carry out and expensive. As patient behavioral intention was identified the as a predisposition to the patient’s future behavior in a study by John, et al.(1991) the researcher chose to study patient behavioral intention as an indicator of patients’ actual behavior. Patient behavioral intention in this study included continuing antiretroviral drugs adherence, complying with pharmacist’s advices, keeping pharmacist’s appointments and com-municating positive things about the pharmacy service to others.
Pharmacy service Pharmacy service is a service provided by pharmacists for the HAART program.
MATERIALS AND METHODS
Study Design: is study applied a descriptive cross-sectional design to identify the relationships among the study variables.
Population: e population in this study included all patients who enrolled in the HAART program at 16 community hospitals in Chiang Rai province. Selection of the subjects Forty subjects were randomly selected from the HAART program of each community hospital. e ‘Access to Care’ (ATC) number list of

CM
U. Journal (2007) Vol. 1(1)
182
2007Cmu. Journal of Soc. Sci. and Hum.
Chiang Rai province was used as the sampling frame. e HAART patients who had participated in the development of the questionnaire (Chaitha et al., 2005) were excluded from this study. Sample size calculation: A minimum sample size calculated by Daniel’s (1995) formula was 506 people. By allowing 20% non-respond-ing, incomplete questionnaires, or invalid answer of questionnaire items a total number of 608 people was required. A decision was made that problematic items were: (1) those which had ten percent or more of all response items either missing or had multiple answers, or (2) those which the values of all items response of each questionnaire are the same number as ‘4’ or ‘5’. In this study, 640 questionnaires were distributed to patients in 16 community hospitals in Chiang Rai province.
Study Measures is study simultaneously measured the direct effects of service quality and patient satisfaction on patient behavioral intention. It also measured the direct effects of patient service quality on patient behavioral intention. In addition, it measured the indirect effect of service quality on patient behavioral intention through patient satisfaction.
Instrument for Data Collection e study instrument was a questionnaire contained four parts with a total of 63 questions (Appendix). It took approximately 20 minutes to complete. Part I: Service quality A 33-item in six dimensions of service quality scale (Chaitha et al., 2005) was developed using the Gap Analysis Model (Parasuraman et al., 1985) as a theoretical base. e dimensions are: tangibles-reliability (8 items), assurance-empathy (8 items), empathy (6 items), responsiveness I (4 items), responsiveness-assurance (5 items), and responsiveness II (2 items). Respondents were asked to rate their desired service level (E), and the perception of actual service level (P) for each item regarding the pharmacy service using a 5-point Likert scale. Perceived service quality (Q) was then calculated. A score of Q = P - E indicated the gap discrepancy between desired service expectation and perception of actual service. e construct reliabilities of expectation and perception were 0.95 and 0.94, respectively (Chaitha et al., 2005). Part II: Patient satisfaction is part contained a 15-item scale. Re-spondents were asked to rate their perception using a 5-point Likert scale (1 = lowest to 5 = highest). e mean score of the 15 items was used as an index of patient satisfaction. All items produced a reliability of 0.90 (Chaitha et al., 2005).

CM
U. Journal (2007) Vol. 1(1)
183
C H I A N G M A I U N I V E R S I T Y J O U R N A L
Part III: Patient behavioral intention is part contained four items. e items adapted from several studies included: continuing antiretroviral drugs adherence (Bartlett et al., 1984; Peck, 2002; Ley, 1988); comply-ing closely with pharmacist’s advices; keeping pharmacist’s appointments, and communicating positive things about the pharmacy service to others (Woodside et al., 1989). Respondents were asked to rate their perception on behavioral intention using a 5-point Likert scale (1 = strongly disagree to 5 = strongly agree). e mean score of the four items were used as an index of patient behavior intention. All items scale produced a reliability of 0.66 (Chaitha et al., 2005). Part IV: Patient characteristics is part included 11 questions about their gender, age, career, education, status, income, length of time they have been receiving pharmacy service, whether or not prescription insurance was covered, health status, numbers of prescription medication taken on a daily basis (excluding antiretroviral regimens), their antiretroviral formula, and the duration enrolled in the HAART program. Duration of the Study is study was conducted during May 2003 to June 2005. Data Collection Data collection was conducted in April, 2005. A holistic care center nurse from each hospital acted as research assistant and two PLWHA volunteers from each hospital were the fieldworkers, and underwent intensive training to administer the survey to the patients. Participants had to sign an informed consent form to be included in the study. e method of responding to the survey depended on the ability of each respondent to answer. In the case that the respondent was a child who could not write or answer the questionnaire by themselves, a parent or a guardian would respond on their behalf. For illiterate respondents and those with poor eyesight, or any other limitations that prevented them from completing the survey alone, the fieldworkers read out the questions and wrote down their answers. Each manner of survey administration was noted. e fieldworkers ensured that patients filled out the survey in private, which protected patient confidentiality. e protocol of this study was approved by the Ethical Review Committee of the Faculty of Pharmacy, Chiang Mai University.
Data Analysis All statistical analyses were carried out using SPSS for Windows Version 11.0 (Nurosis, 1990a; 1990b). Descriptive statistics were used to describe the respondents’ characteristics. To test the path correlation between the variables in the PSQ-HAART model, including service quality, patient satisfaction and behavioral intention (Figure 1), simple regres-
CM
U. Journal (2007) Vol. 1(1)
184
2007Cmu. Journal of Soc. Sci. and Hum.
sion was analyzed to predict patient satisfaction from their perception of service quality. en, multiple regression was analyzed to predict patient behavioral intention from patient perception of service quality at statistical significant level of 0.05.
RESULTSDescription of the Study Samples
The 640 questionnaires were distributed to patients receiving phar-macy service at 16 community hospitals in Chiang Rai province (40
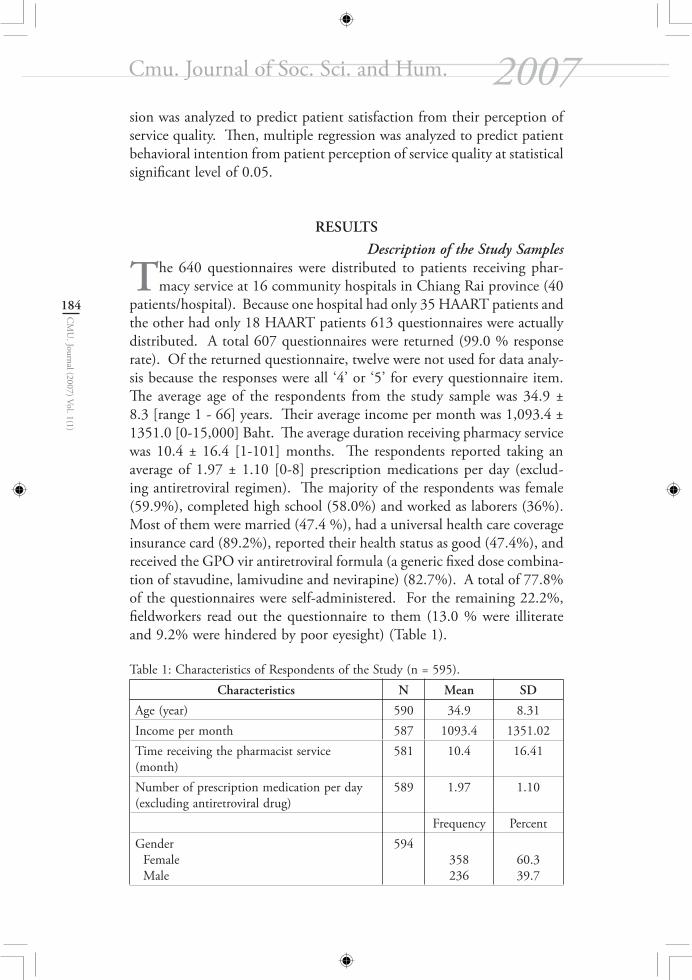
patients/hospital). Because one hospital had only 35 HAART patients and the other had only 18 HAART patients 613 questionnaires were actually distributed. A total 607 questionnaires were returned (99.0 % response rate). Of the returned questionnaire, twelve were not used for data analy-sis because the responses were all ‘4’ or ‘5’ for every questionnaire item. e average age of the respondents from the study sample was 34.9 ± 8.3 [range 1 - 66] years. eir average income per month was 1,093.4 ± 1351.0 [0-15,000] Baht. e average duration receiving pharmacy service was 10.4 ± 16.4 [1-101] months. e respondents reported taking an average of 1.97 ± 1.10 [0-8] prescription medications per day (exclud-ing antiretroviral regimen). e majority of the respondents was female (59.9%), completed high school (58.0%) and worked as laborers (36%). Most of them were married (47.4 %), had a universal health care coverage insurance card (89.2%), reported their health status as good (47.4%), and received the GPO vir antiretroviral formula (a generic fixed dose combina-tion of stavudine, lamivudine and nevirapine) (82.7%). A total of 77.8% of the questionnaires were self-administered. For the remaining 22.2%, fieldworkers read out the questionnaire to them (13.0 % were illiterate and 9.2% were hindered by poor eyesight) (Table 1). Table 1: Characteristics of Respondents of the Study (n = 595).
Characteristics N Mean SD
Age (year) 590 34.9 8.31Income per month 587 1093.4 1351.02Time receiving the pharmacist service (month)
581 10.4 16.41
Number of prescription medication per day (excluding antiretroviral drug)
589 1.97 1.10
Frequency PercentGender Female Male
594358236
60.339.7

CM
U. Journal (2007) Vol. 1(1)
185
C H I A N G M A I U N I V E R S I T Y J O U R N A L
Education High school Primary school Never study College Bachelor degree
589345161393311
58.627.36.65.61.9
Occupation Laborer Private business worker No career Agriculture Laborer Trade Government officer
56321414011270104234
38.024.919.912.434.84.10.7
Marital Married Widow Single Divorce
5932821858343
47.631.014.07.2
Health insurance Universal health care coverage insurance Pay from own pocket Charity fund hospital Social security insurance Government insurance
5875311817174
90.43.12.92.90.7
Health status Good Fair Very good Poor Very poor
591282162134112
47.727.422.71.90.3
Antiretroviral formula GPO vir* ree single drugs regimen
587486101
78.417.2
Level of Service Quality, Patient Satisfactionand Behavioral Intention
Service quality scores ranged between -3.12 to 1.79, with a mean of -0.026 ± 0.649 and the score skewed to the left (skewness = -1.120). is meant that the sample had high perception of service quality in pharmacy service. Patient satisfaction scores ranged between 1 to 5, with a mean of 4.115 ± 0.650 and the score distributed to the left (skewness = -0.901). is meant that the sample had high satisfaction with pharmacy service. Patient behavioral intention score ranged between 1 to 5, mean 4.623 ±
Table 1: (Continued).

CM
U. Journal (2007) Vol. 1(1)
186
2007Cmu. Journal of Soc. Sci. and Hum.
0.517 and the score distributed to the left (skewness = -1.858). is meant that the sample had high behavioral intention to pharmacy service.
Correlation of the Study Variables As shown in Table 2, the study variables had low to moderate cor-relation, while patient satisfaction and behavioral intention yielded the highest significant correlation (r = 0.523, p < 0.001). Service quality and patient satisfaction had significant correlation (r = 0.430, p < 0.001). However, service quality had marginally significant correlation with patient behavioral intention (r = 0.047, p < 0.001).
Table 2: Correlation Coefficient Between Variables in the Study Model (n = 595).
Variable Service quality Patient satisfaction
Patient behavioral intention
Service quality 1.00Patient satisfaction 0.430* 1.00Patient behavioral intention 0.047* 0.523* 1.00
*p < 0.001
Relationship among Service Quality,Patient Satisfaction and Behavioral Intention
As shown in Table 3, service quality had a direct effect on patient satisfaction as service quality could predict patient satisfaction by 18.5 %. β = 0.431, t = 11.635, p < 0.001. Table 4 showed service quality predicted patient behavioral intention by 68.8 %, F (2, 592) = 134.46. When all variables were entered into the structural equation, service quality could predict patient behavioral intention by 31.2 %, and β = 0.218, t = 5.787, p < 0.001; patient satisfaction could predict patient behavioral intention by 27.3%. β = 0.617, t = 16.342, p < 0.001. Table 3: Simple Regression Equation and Path coefficient of the Study (n = 595).
Variable R-square Unstandardized coefficient, B
(SE)
Standardized coefficient,
Beta
t p-value
Patient satisfaction Service quality 0.185 0.431 (0.037) 0.431 11.635 0.000

CM
U. Journal (2007) Vol. 1(1)
187
C H I A N G M A I U N I V E R S I T Y J O U R N A L
Table 4: Multiple Regression Equation and Path Coefficient of Hypothesis 2 (n = 595).Variable R-square Unstandardized
coefficient, B (SE)
Standardized coefficient,
Beta
t p-value
Patient behavioral intention Service quality Patient satisfaction
0.3120.273
0.174 (0.030)0.490 (0.030)
0.2180.617
5.78716.342
0.0000.000
e path correlations between service quality and patient satisfaction, between patient satisfaction and patient behavioral intention, and between service quality and patient behavioral intention were positive (β = 0.431, 0.617 and 0.218 respectively, P < 0.001) (Figure 2).
Figure 2. Path Model of PSQ-HAART *p < 0.001
e indirect effects of service quality on patient behavioral intention were examined on an exploratory basis. Table 5 showed a decomposition of the standardized effects into direct, indirect, spurious and total effects categories, the latter of which was the sum of the former three. While service quality had a significant direct effect on the patient behavioral intention score (β = 0.218, p < 0.001) it had a significant indirect effect on patient behavioral intention scores via patient satisfaction (β = 0.266, p < 0.001).
Indirect PathService quality Satisfaction Behavioral intention = 0.266*
Satisfaction
Service quality Behavioral intention
0.431* 0.317*
0.218*

CM
U. Journal (2007) Vol. 1(1)
188
2007Cmu. Journal of Soc. Sci. and Hum.
Table 5: Decomposition of Standardized Effects for Path Model Predicting Patient Satisfaction and Behavioral Intention Scores (n = 595).
Predictor VariableVariable
Patient satisfaction
Patient behavioral intention
Service quality Direct effectIndirect effect via patient satisfactionSpurious effect
0.431*-
0.218*0.266*0.09
Total effect 0.431* 0.574*Patient satisfaction Direct effect - 0.617*
*p < 0.001
DISCUSSIONPrediction of Patient satisfaction
To test the pharmacist model of PSQ-HAART, prediction of patient satisfaction by the service quality was examined. e service quality
component of the model was found to have a significant positive, direct effect on patient satisfaction. A higher level of patient satisfaction with the service was more likely when patients indicated they had a higher service quality score (β= 0.431, P < 0.001). is was in accordance with Cronin and Taylor’s (1994) conclusion that health service customers might not distinguish service quality from satisfaction when they responded to patient satisfaction or service quality surveys. In addition, the result from this study correspond to the others that perceptions of service quality were positively associated with overall patient satisfaction (Lazarus, 1991; Bagozzi, 1992; Cronin and Taylor, 1992; Gotlieb et al., 1994; Sudibyo, 2002).
Prediction of Behavioral Intention is study used the PSQ-HAART model to confirm whether patient satisfaction would predict behavioral intention. Patients who reported higher levels of satisfaction with pharmacy service tended to report higher levels of behavioral intention (β = 0.617, P < 0.001). is finding suggests the strong positive association of patient satisfaction and patient behavioral intention, corresponding with previous studies. (Goltieb et al., 1994; Brady and Robertson, 2001; Sudibyo, 2002) In addition to the prediction of patient behavioral intention by patient satisfaction, patients who indicated higher perception of service quality tended to report higher levels of behavioral intention (? = 0.218, P < 0.001). Our result suggests that service quality positively affected pa-tient behavioral intention through the association with patient satisfaction

CM
U. Journal (2007) Vol. 1(1)
189
C H I A N G M A I U N I V E R S I T Y J O U R N A L
(β = 0.266, P < 0.001). is indirect association between service quality and behavioral intention via patient satisfaction as a mediator variable correspond with the studies by Cronin and Taylor (1992) and Rust and Oliver (1994). e influence of perceptions of service quality on behav-ioral intentions was considerably more integrated than was reported in the literature. e result suggests that patients’ perception of service quality was the important predictor of patient satisfaction. Patient satisfaction was important in establishing patient behavioral intention as a mediator between service quality and behavioral intention. is implied that from the patients’ perception, a high level of service quality must be developed before satisfying the patient. If patients are satisfied with pharmacy service of the HAART program, they would behave in a way that reflects posi-tively towards the program, that is, continuing antiretroviral drugs adher-ence, complying closely with pharmacist’s advices, keeping pharmacist’s appointments, and communicating positive things about the pharmacy service to others. Patients’ decision-making, relative to their behavioral intention of service quality, is a complex and comprehensive process. at is, the use indirect path analysis suggests that consider only individual variables or direct effects are likely to yield incomplete assessments of the relation-ships among them. Establishing plans to improve only service quality or patient satisfaction might not be sufficient without improving the other. Pharmacy administrators may consider strategies in proving both service quality and patient satisfaction of the HAART program to achieve the desired behavioral intention of the patients. e study had some limitations that should be considered. First, this study was the analysis of causal model based on cross-sectional data; strong evidence of causal effects cannot be inferred. Second, the study model was designed to include only two variables related to the behavioral intention other factors that might also be influenced to the behavior intention were not studied and could not be explained. ird, the model chose behavioral intention to represent behavior. Although, it has been proved a good indicator of actual behavior the outcomes in from the HAART program on actual behaviors were not studied. Lastly, since the model was built from HAART program for HIV/AIDS patients and carried out in only community hospitals in Chiang Rai province in ailand generalizability may be limited to other disease models or types of hospitals. There is the need for further consideration of similar models. Although our results were rather consistent across the pharmacy service of the HAART program provided by community hospitals in Chiang Rai

CM
U. Journal (2007) Vol. 1(1)
190
2007Cmu. Journal of Soc. Sci. and Hum.
province, there were some variations worth attention. For future research, the study design should include the various decision-making variables which might effect the patients’ perception on service quality, their satisfaction and behavioral intention. ese included the quality of service environ-ment, individual patients and service characteristics such as experience or expertise. Finally, this study also shows the need for additional research that considers the influence of service quality and patient satisfaction on value and trust, and the influence of these variables on patient behavioral intention and health care outcome. Further research is needed to develop better measures of the con-structs and the revision should be repeatedly tested with a sample group from hospitals in other provinces in order to guarantee its clarity and the appropriateness of this model in community hospitals throughout the country.
CONCLUSION
The objective for this study was to clarify the relationships between service quality, satisfaction, and behavioral intention in pharmacy
service of HAART program. It suggested that the patient decision-making process for service quality was a complex model that incorporates both direct and indirect effects of service quality on behavioral intention. Service quality has direct effect on patient satisfaction and patient satisfaction has direct effect on patient behavioral intention. Specifically, there is evidence that service quality and satisfaction directly influenced behavioral intentions, even when the effects of all two constructs were considered simultaneously. Service quality does not only have indirect effect on patient behavioral intention by increasing the satisfaction associated with pharmacy services, it also influences patient behavioral intention directly.
ACKNOWLEDGEMENTS
Thank you for the supporting of the University Income of 2005, Faculty of Pharmacy, Chiang Mai University; the Graduate School and
the Norwegian Church AID. anks for collaboration go to the Chiang Rai regional hospital, all community hospitals in Chiang Rai province and all participants in the study. Special thanks go to Suparet Wongputh, statistic consultant.

CM
U. Journal (2007) Vol. 1(1)
191
C H I A N G M A I U N I V E R S I T Y J O U R N A L
REFERENCESAnderson, E. W., and M. Sullivan. 1993. e antecedents and conse-
quences of customer satisfaction for firms. Marketing Science. 12: 125-143.
Bagozzi, R. P. 1992. The self regulation of attitudes, intentions and behavior. Social Psychology Quarterly. 55: 178-204.
Bartlett, E., M. Grayson., and R. Barker. 1984. e effects of physician communication skills on patient satisfaction, recall and adherence. Journal of Chronic Disease. 37: 755-64.
Bitner, M. J., and A.R. Hubbert. 1994. Encounter satisfaction versus overall satisfaction versus Quality: e customer’s voice. P. 72-94. In RT. Rust and R.L., Oliver. (eds.). Service Quality: New Directions in eory and Practice. CA: Sage, ousand Oaks.
Bolton, R.N., and J.H. Drew. 1991. A longitudinal analysis of the impact of service changes on customer attitudes. Journal of Marketing. 55: 1-9.
Brady, M.K., and C.J. Robertson. 2001. Searching for a consensus on the antecedent role of service quality and satisfaction: An exploratory cross-national study. Journal of Business Research. 41: 53-60.
Bureau of Epidemiology Department of Disease Control, Ministry of Public Health. 2005. e number of HIV/AIDS patients classified by the region and province during September, 1984 to October 31, 2005. [Online] Available http://epid.moph.go.th. [2005, November 2]
Chaitha, W., C. Viboonsunti, T. Kittisopee, and R. Awipan. 2005. e development of patients’ perceptions of pharmacy service quality of highly-active antiretroviral therapy program questionnaire in Chiang Rai community hospitals, ailand. Unpublished paper.
Cronin, J.J., and S.A.Taylor. 1992. Measuring service quality: A reexami-nation and extension. Journal of Marketing. 56: 55-68.
Cronin, J.J., and S.A. Taylor. 1994. SERVPERF vs SERVQUAL: Recon-ciling performances based perception - minus - expectations measure-ment of service quality. Journal of Marketing. 58: 125-131.
Cronin, J.J., M.K. Brady, and G.T.H. Hult. 2000. Assessing the effects of quality, value, and customer satisfaction on customer behavioral intention in service environments. Journal of Retailing. 76(2) : 193-218.
Crosby, L., K. Evan, and D. Cowles. 1990. Relationship quality in services selling: An interpersonal influence perspective. Journal of Mar-keting. 54: 68-81.
Dabholkar, P. 1995. e convergence of customer satisfaction and service quality evaluations with increasing customer patronage. Journal of Consumer Satisfaction, Dissatisfaction and Complaining Behavior. 8: 31-43.

CM
U. Journal (2007) Vol. 1(1)
192
2007Cmu. Journal of Soc. Sci. and Hum.
Daniel, W.W. (1995). Biostatistics : A foundation for analysis in the health sciences. (6th ed.). New York : John - Wiley & Sons.
Gotlieb, J.B., D. Grewal, and S.W. Brown. 1994. Consumer satisfaction and perceived quality: Complementary or divergent constructs? Journal of Applied Psychology. 79 (6): 875-885.
Horizon Program. 2004. (Community Medicine Department, Chiang Mai University; Office of Disease Prevention and Control Region 10, Chiang Mai, AIDS Section, Ministry of Public Health). A rapid situation analysis of the access to care project in Northern ailand. e Population Council Inc., Bangkok, ailand.
Hunt, H.K. 1977. Conceptualization and measurement of consumer satisfaction and dissatisfaction, (Report No. 77-103). Cambridge, MA: MSI.
John, J. 1991. Research in brief, Patient satisfaction: e impact of past experience. Journal of Health Care Marketing. 12(3): 56-64.
Lazarus, R.S. 1991. Emotion and adaptation. Oxford University Press, New York.
Ley, P. 1988. Communication with patients: Improving communication, satisfaction and compliance. Croom Helm, New York.
Norusis, M.J. 1990a. SPSS advance statistics student guide. SPSS Inc., Chicago. ILL.
Norusis, M.J. 1990b. SPSS base system user’s guide. SPSS Inc., Chicago. ILL.
Parasuraman, A., V.A. Zeithaml, and L.L Berry. 1985. A conceptual model of service quality and its implications for future research. Journal of Marketing. 49(Fall): 41-50.
Parasuraman, A., V.A. Zeithaml, and L.L Berry. 1988. SERVQUAL: A multiple-item scale for measuring consumer perceptions of service quality. Journal of Retailing. 64: 12-40.
Peck, B.M. 2002. Doctors and patients : Expectations, control and health care satisfaction. [Online] Available http://wwwlib.umi.com/dissertations /preview_all/306870 [2003, November 23].
Rust, R.T., and R. Oliver. 1994. Service quality: Insights and managerial implications. In R.T. Rust and R.L. Oliver (eds.). Service Quality: New Directions in eory and Practice. CA: Sage Publications. Tierney, ousand Oaks.
Scott-Lennox, J., J.F. Braun, and J.E. Morrow. 1998. Development of the HIV treatment
satisfaction survey (HTSS) to improve adherence and quality of out patient care. Int. Conf AIDS. 12: 102. [Online] Available http// www.aegis.com/pubs/aissline/1998/dec/m98c5916.htm [2003, September24].

CM
U. Journal (2007) Vol. 1(1)
193
C H I A N G M A I U N I V E R S I T Y J O U R N A L
Sudibyo, Y.A. 2002. e relationship of business process capabilities and internal service quality to health service quality patient satisfaction, and business performance. Ph.D. Dissertation. University of Nova Southeastern, Wayne Huzenga of Business and Enterpreneurship.
e AIDS Section, Chiang Rai Provincial Health Officer. 2005. Chiang Rai, ailand.
Woodside, A.G., L.L. Frey., and R.T. Daly. 1989. Linking quality service, customer satisfaction and behavioral intention. Journal of Health Care Marketing. 9 (4): 5-17.

CM
U. Journal (2007) Vol. 1(1)
194
2007Cmu. Journal of Soc. Sci. and Hum.
AP
PEN
DIX
e
PSQ
-HA
AR
T Q
uest
ionn
aire
Serv
ice
Qua
lity
Whe
n I
rece
ived
the
phar
mac
y se
rvic
e....
......
Expe
ctat
ion
Perc
eptio
nLo
w
Hig
hLo
wH
igh
1. M
ater
ials
asso
ciat
ed w
ith p
harm
acy
serv
ice
are
suita
ble-
appe
alin
g; fo
r ex
ampl
e, a
ntire
trovi
ral o
r ant
i- op
port
unist
ic
infe
ctio
n pa
mph
lets.
12
34
51
23
45
2. I
rece
ive
antir
etro
vira
l inf
orm
atio
n co
mpl
etel
y be
fore
star
t th
e dr
ugs.
12
34
51
23
45
3.
e ph
arm
acist
insis
ts on
my
heal
th c
are
reco
rd.
12
34
51
23
45
4.
e ph
arm
acist
hel
ps m
e m
anag
e m
y an
tiret
rovi
ral s
ched
ule
that
acc
omm
odat
es fo
r my
life
style
.1
23
45
12
34
5
5.
e ph
arm
acist
pro
vide
s mem
ory
tabl
e fo
r my
antir
etro
vira
l se
lf-ad
min
istra
tion.
12
34
51
23
45
6.
e ph
arm
acist
usu
ally
mon
itors
my
antir
etro
vira
l the
rapy
ou
tcom
e.1
23
45
12
34
5
7.
e ph
arm
acist
hel
ps m
e ca
re m
y he
alth
.1
23
45
12
34
58.
Whe
n I
have
a p
robl
em, t
he p
harm
acist
show
s a si
ncer
e in
tere
st in
solv
ing
it.1
23
45
12
34
5
9.
e ph
arm
acist
doe
s ser
vice
by
a ce
rtai
n tim
e of
AT
C c
linic
.1
23
45
12
34
510
. e
phar
mac
ist h
as th
e kn
owle
dge
to e
nsur
e m
y qu
estio
ns.
12
34
51
23
45

CM
U. Journal (2007) Vol. 1(1)
195
C H I A N G M A I U N I V E R S I T Y J O U R N A L
Whe
n I
rece
ived
the
phar
mac
y se
rvic
e....
......
Expe
ctat
ion
Perc
eptio
nLo
w
Hig
hLo
wH
igh
11.
e ph
arm
acist
has
app
ropr
iate
inte
rper
sona
l co
mm
unic
atio
n an
d co
unse
ling.
12
34
51
23
45
12.
e ph
arm
acist
serv
ices
me
suita
bly
acco
rdin
g to
pr
ofes
siona
l rol
e.1
23
45
12
34
5
13. I
feel
safe
in th
e tr
ansa
ctio
n of
the
phar
mac
ist.
12
34
51
23
45
14. I
rece
ive
serv
ice
from
the
phar
mac
ist e
quity
to o
ther
pa
tient
s.1
23
45
12
34
5
15.
e ph
arm
acist
giv
es m
e in
divi
dual
atte
ntio
n.1
23
45
12
34
516
. e
phar
mac
ist h
as m
e be
st in
tere
st at
hea
rt.
12
34
51
23
45
17.
e ph
arm
acist
und
ersta
nds m
y sp
ecifi
c ne
eds.
12
34
51
23
45
18.
e ph
arm
acist
resp
onse
s to
my
need
s.1
23
45
12
34
519
. e
phar
mac
ist re
spon
ses t
o m
y fe
elin
g ap
prop
riate
ly.1
23
45
12
34
520
. e
phar
mac
ist g
ives
me
pers
onal
atte
ntio
n.1
23
45
12
34
521
. e
phar
mac
ist re
spec
ts m
y rig
ht to
mak
e m
y ow
n ch
oice
.1
23
45
12
34
522
. e
phar
mac
ist h
olds
my
info
rmat
ion
prov
ided
secu
re.
12
34
51
23
45
23.
e ph
arm
acist
tells
me
exac
tly w
hen
serv
ice
will
be
perfo
rmed
.1
23
45
12
34
5
24.
e ph
arm
acist
hel
ps p
hysic
ians
in c
arin
g m
e.1
23
45
12
34
525
. e
phar
mac
ist p
rovi
des m
e co
ntin
uous
car
e w
ith
phys
icia
ns a
nd o
ther
hea
lth c
are
prov
ider
s.1
23
45
12
34
5

CM
U. Journal (2007) Vol. 1(1)
196
2007Cmu. Journal of Soc. Sci. and Hum.
Whe
n I
rece
ived
the
phar
mac
y se
rvic
e....
......
Expe
ctat
ion
Perc
eptio
nLo
w
Hig
hLo
wH
igh
26.
e ph
arm
acist
sets
syste
m to
con
tact
me
if I
miss
ed th
e ap
poin
tmen
t.1
23
45
12
34
5
27.
e ph
arm
acist
giv
es p
rom
pt se
rvic
e fo
r me.
12
34
51
23
45
28.
e ph
arm
acist
is a
lway
s will
ing
to h
elp
me.
12
34
51
23
45
29.
e ph
arm
acist
esta
blish
es a
nd m
aint
ains
rapp
ort w
ith m
e to
ens
ure
my
adhe
renc
e to
ant
iretro
vira
l the
rapy
.1
23
45
12
34
5
30.
e be
havi
or o
f the
pha
rmac
ist in
still
confi
denc
e in
me.
12
34
51
23
45
31.
e ph
arm
acist
em
pow
ers m
e.1
23
45
12
34
532
. I c
an c
onsu
lt th
e ph
arm
acist
abo
ut so
cioe
cono
mic
issu
es.
12
34
51
23
45
33. I
can
con
sult
the
phar
mac
ist b
y ph
one
if I
need
.1
23
45
12
34
5R
emar
k: ta
ngib
les-
relia
bilit
y (it
ems 1
thro
ugh
8) a
ssur
ance
-em
path
y (it
ems 9
thro
ugh
16);
empa
thy
(item
s 17
thro
ugh
22);
resp
onsiv
enes
s I (i
tem
s 23
thro
ugh
26);
resp
onsiv
enes
s-as
sura
nce
(item
s 27
thro
ugh
31);
resp
onsiv
enes
s II
(item
s 32
thro
ugh
33).