the determinants of corporate leverage and …neumann.hec.ca/~p124/620078/bsw.pdf · that...
TRANSCRIPT

1
1 THE DETERMINANTS OF CORPORATE LEVERAGE AND DIVIDENDPOLICIES
Michael J. BARCLAY, Clifford W. SMITH and Ross L. WATTS, «The determinants ofcorporate leverage and dividend policies», The Journal of Applied Corporate Finance,Vol.7, No.5, Winter 1995, pp. 4-19.
There exist different theories
Only taxes are important : corporate and personal income taxes are the only factorsthat systematically affect capital structure and dividend policies - and even that effectmay be small.
Static Tradeoff Theory : corporate financing choices reflect an attempt by managers tobalance the tax shields of greater leverage against the increased probability and costs offinancial distress (known as "bankruptcy costs").
In cases where such costs are low, high leverage and dividends can even have importantbenefits in controlling a natural corporate tendency to overinvest (called the "free cashflow" problem).

2
Pecking Order Theory : financing and dividend decisions are concerned primarily with"signalling" effects of such decisions. Examples: the tendency of stock prices to fallsignificantly in response to dividend cuts and common stock offerings.
The actual corporate structures are the cumulative result of a series of individualdecisions in which managers follow a pecking order.
Competing theories subject to empirical testing : 6780 companies over the 1963-1993period; 84 689 observations (6780*30=203 400 observations and 84 689/203 400 =41.6%).
1.1 Some historical evidence
Mean StandardDeviation
25th
PercentileMedian 75th
percentileLeverage 25 % 18 % 10 % 23 % 37 %Dividend yield 2.4 % 3.4 % 0 % 1 % 3.9 %
Table I, p.5 : Both market leverage ratios and dividends yields appear to be remarkablystable, even if volatility in 1973-1975.

3
1.2 The M&M irrelevance propositions
Neither a company’s financing policy nor its dividend policy should be expected to affectits market value.
That value is determined solely by managerial decisions affecting the left-hand side ofthe balance sheet - the investment policy.
Set of restrictive conditions:- no corporate or personal taxes- no contracting costs : reorganization costs- corporate investment policy is fixed. Investment decisions are not influenced by
financing or dividend choices- no information costs, no informational asymmetries
Analogy with the pizza: «no information cost means that everyone sees the same pizza;no taxes means the IRS gets none of the pie; and no contracting costs means nothingsticks to the knife.»

4
Practical value of MM irrelevance propositions : if the assumptions of their model arerelaxed, the financing and dividend decisions
- affect taxes paid by issuers or investors
- affect the probability - and associated costs - of getting into financial difficulty
- affect management incentives to follow the value-maximizing rule in investing in allpositive NPV projects and perhaps rejecting all others
- they provide a credible signal to investors of management's confidence (or lackthereof) about the firm's future earnings.

5
1.3 Taxes
1.3.1 Taxes and Capital Structure
MM, 1961 (no taxes) : VE = VNE = EBIT/kNE
MM, 1963 (corporate tax rate only) : VE = VNE + tcB = EBIT(1-tc)/kNE + tcB
Miller, 1977 (corporate tax rate plus personal tax rates)
BGVt
ttBVV NE
b
scNEE +=
−−−
−+= ]1
)1)(1(1[
Where s: shares (dividends and capital gains); b : bonds
If ts > tb, then tc < G
If ts < tb, then tc > G
If ts = tb, then tc = G

6
Ex: dividend = 100, tm = 40%, tc = 30%
Gross up of dividend = 100$*1.25 = 125$
Tax = 40%*125$ - 25$ = 25$
Tax/Dividend = 25/ 100 = 25%
tdiv = (5/4)*tm - 1/4 < tm and tdiv = 1.25*40% - 25% = 25%;
tint = tm
tdiv = 25% < tint = tm = 40%
G=1 - [(1 - tc)(1 - ts)/(1 - tb)] = 1 - [(1- 30%)(1 - 25%)/(1 - 40%)] = 1- 87.5% = 12.5% < tc
⇒ Compensation for these increased taxes in the form of higher yields on corporate debt.
The firm bears the tax consequences directly (corporate income tax) and indirectly
(higher required rates of return on securities it sells)
7
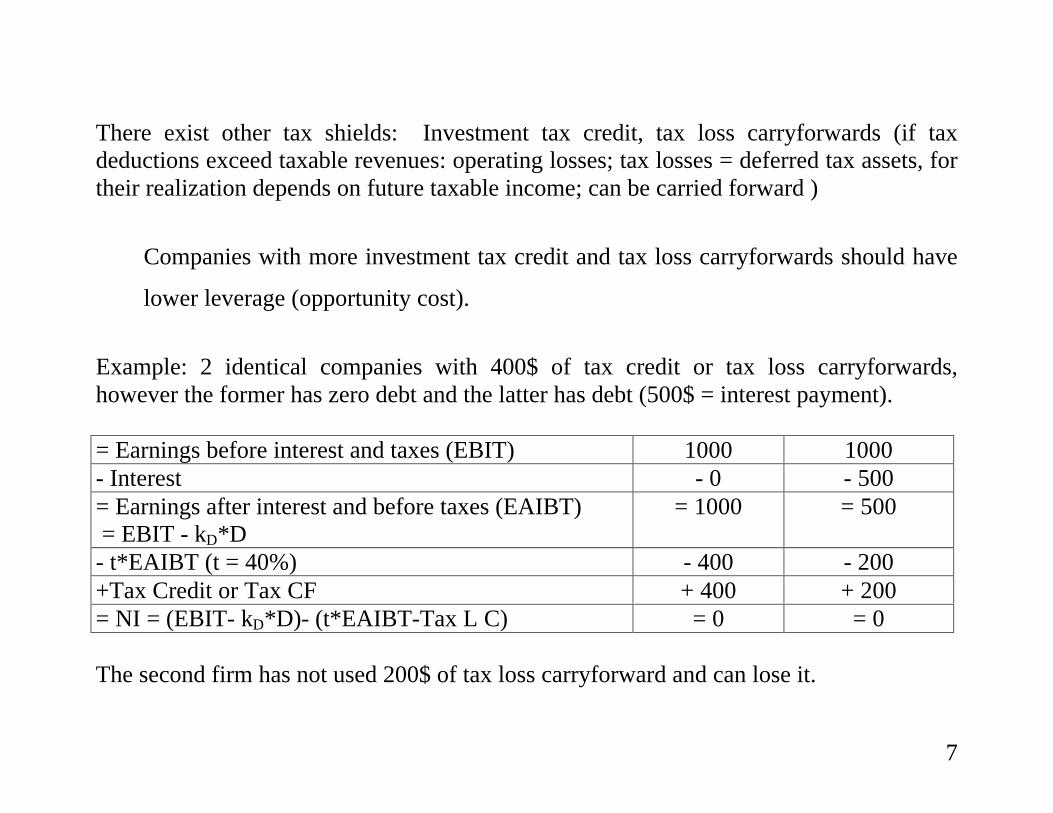
There exist other tax shields: Investment tax credit, tax loss carryforwards (if taxdeductions exceed taxable revenues: operating losses; tax losses = deferred tax assets, fortheir realization depends on future taxable income; can be carried forward )
Companies with more investment tax credit and tax loss carryforwards should have
lower leverage (opportunity cost).
Example: 2 identical companies with 400$ of tax credit or tax loss carryforwards,however the former has zero debt and the latter has debt (500$ = interest payment).
= Earnings before interest and taxes (EBIT) 1000 1000- Interest - 0 - 500= Earnings after interest and before taxes (EAIBT) = EBIT - kD*D
= 1000 = 500
- t*EAIBT (t = 40%) - 400 - 200+Tax Credit or Tax CF + 400 + 200= NI = (EBIT- kD*D)- (t*EAIBT-Tax L C) = 0 = 0
The second firm has not used 200$ of tax loss carryforward and can lose it.

8
1.3.2 Taxes and Dividend Policy
- Dividends are taxed at the personal level
- Undistributed profits that result in capital gains are not taxed at the personallevel until the shares are sold and the capital gains realized
Consequence: increasing the tax liabilities of individual investors increases therequired rate of return on the firm’s equity
All firms have access to the same pool of investors and so face the same potentialtax penalty
Therefore, we would expect differences in dividend policy - at least for large,publicly traded companies - to be driven by factors other than taxes
9
1.4 Bankruptcy costs and corporate investment policy
The optimal capital structure is the one where the next dollar of debt is expected toprovide an incremental tax subsidy that just offsets the resulting increase in expectedbankruptcy costs
1.4.1 Direct Bankruptcy Costs
Small relative to market values of the companies. Higher for small companies, but toolow to be an important factor in corporate financing decisions
1.4.2 Indirect Bankruptcy Costs
Reduction in firm value, for in financial difficulty, financing and dividend decisionsaffect investment policy.
If bankruptcy, veto on risk shift (riskier projects) : interests of the court-appointedjudge or trustee in bankruptcy do not line up with shareholders' interests.

10
If financial difficulties, highly leveraged companies are more likely than their low-debt counterparts to pass up valuable investment opportunities (shortsightedcutbacks in R&D, maintenance, advertising, or training that end up reducing thevalue of the firm).
Why ? In high-growth technology firms, if sales do not materialize
< Creditors can write down the value of their loans. But reluctant to do this !
< New shareholders: infusion of new equity will go toward shoring up the creditors=position ⇒ lower stock price and excessive dilution of ownership !
⇒ Underinvestment problem

11
Underinvestment problem
"Growth options" companies as opposed to "assets in place" companies are likely to finddebt financing very costly.
"Growth options" companies : lack of collateral ⇒ debt very difficult and expensive toobtain.
"Assets in place" companies : more collateral, indirect costs of financial distress (or evenbankruptcy) are likely to prove quite low ⇒ higher leverage ratios.
Rating agencies: leveraged ratios are expressed in terms of book values rather than inmarket values for book values reflect tangible assets, i.e. better collateral for lenders.

12
1.5 The benefits of debt in controlling corporate overinvestment
Free Cash Flow problem: inclination of many corporate managers to use FCF to sustaingrowth at the expense of profitability, either through misguided efforts to gain marketshare in mature businesses or - perhaps worse - through diversifying acquisitions ⇒ 2ways of distributing excess capital.
1.5.1 Disciplinary role of debt
Substitutions of debt for equity: leveraged stock repurchases.Contractually obligated payments of interest and principal are more effective thandiscretionary dividend payments in squeezing out excess capital.
Debt financing can have a beneficial effect by causing managers otherwise inclined tooverinvest to be more critical in evaluating spending plans.
Reduction of the agency costs of equity (separation of ownership from control in largepublic companies). In "growth options" firms, risk-sharing benefits outweigh theseagency costs. In "Assets in place" companies, debt allows the concentration of ownership⇒ more effective monitoring of corporate managers by active investors.

13
1.5.2 Disciplinary role of dividends
Paying higher dividends is one way of distributing excess capital.
In "Assets in place" companies, potential overinvestment problem ⇒ higher dividends
In "growth options" firms, potential overinvestment problem, higher flotation costs ofnew securities, particularly equity ⇒ lower dividends
Table 2, p. 10 : Investment opportunities, contracting costs, and leverage and dividendchoices
Investment Opportunity SpectrumAssets in place Growth options
Cost of debt (Underinvestment) Low HighBenefits of debt (↓ FCF : Solution tothe overinvestment problem)
High Low
Predicted leverage High LowCosts of dividends (flotation costs) Low HighBenefits of dividends (↓ FCF) High LowPredicted Dividend Yield High Low

14
1.6 Information costs and signaling effects
There exists asymmetric information: insider trading, market reactions to major corporatedecisions' announcements
Managers need a credible mechanism to signal their information to the market.
Credible means the costs of communicating falsely are large enough to induce managersto reveal the truth ⇒ capital structure or dividend policy.

15
1.6.1 Signaling and Capital Structure
Adding more debt to the firm's capital structure can serve as a credible signal of highfuture cash flows.
Differences between debt and equity
< By committing the firm to make future interest payments to bondholders,managers communicate their confidence that the firm will have sufficient cash flowsto meet these obligations (see disciplinary role of debt).
< Debt claims are less sensitive than equity claims to changes in firm value. Ifundervalued, the firm will prefer to issue debt (less undervalued security); ifovervalued, the firm will prefer to issue equity (most overvalued security).
Predictions : companies that feel they are undervalued (high-quality firms) should usemore debt in their capital structures than overvalued firms (low-quality firms).

16
Consistently with this thinking:
Announcements of leverage-increasing transactions
In reaction to large debt-for-stock exchanges, stock prices go up by 14% onaverage
In reaction to debt-for-preferred exchanges and preferred-for-commonexchanges, prices move up by 2.2% and 8.3% respectively.
Announcements of leverage-reducing transactions
In reaction to common-for-debt exchanges and preferred-for-debt exchanges,stock prices go down by 9.9% and 7.7% respectively.
Market reaction to new securities offerings is negative in general:
Less negative to new debt offerings (the average response is trivially negative)than to new common stock offerings (down 3%).

17
1.6.2 A Note on the Pecking Order Theory of Capital Structure
Capital structures reflect the accumulation of their past financing requirements and debtratios change in response to imbalances between internally-generated cash flows andinvestment opportunities.
POT : financing of new investments with the cheapest available source of fundsInternally generated funds > outside fundingDebt > Equity
Predictions :
"assets in place" companies with few investment opportunities and substantial FCFwill have low debt ratios.
"growth options" companies with investment opportunities and lower operating CFwill have high debt ratios.
A set of predictions that are precisely the opposite of those offered by contracting costand tax arguments.

18
1.6.3 Signaling and Dividend Policy
Capital structure considered a coarse instrument for communicating with the market
More cost-effective signaling mechanism than capital structure
As in the case of capital-structure signaling models, provides little guidance as to whatlevel of payout will prove optimal.
1.7 Evidence on determinants of leverage and dividend policies
Estimation : (6 780 companies over 30 years (1963-1993) ⇒ 71 384 observations)
OLS for the determinants of corporate leverage policyCensored Tobit regressions for the determinants of dividend policy1) One-step procedure, i.e. a pooled OLS regression (71 384); 2) One-stepprocedure, i.e. a cross-sectional regression on averages (≠ from two-step andproblems with % and $); 3) Fixed effects regression : a dummy variable for eachfirm (71 384 - 70 695 = 689 ?)
19
For the determinants of corporate leverage policy :
R2 : 27% (pooled OLS regression and cross-sectional regressions) and 18% (Fixedeffects regression) ⇒ explain both the time-series and cross-sectional variation incorporate leverage decisions.
For the determinants of dividend policy:
R2 : 23% (pooled OLS regression); 30% (cross-sectional regressions) and 2%(Fixed effects regression) ⇒ explain the cross-sectional variation in corporateleverage decisions, but not the changes in yields over time.

20
1.7.1 Investment Opportunities : ME/BE
First measure : Market-to-book ratio
Predictions :< Underinvestment hypothesisHigh ME/BE should have lower leverage and lower dividend yields< Tax and contracting hypothesisIdem, lower ME/BE that face low financial distress and high FCF problems shouldhave higher leverage and higher dividend yields< POT hypothesisOn the contrary, lower ME/BE should have lower leverage
Result : Strongly negative significant statistical relation and economic relation
Economic relation : implied change in leverage from moving from the bottom decile tothe top decile = -14.3% (Test : -14.3% / 25.17% = 56.87%; 25.17% stands for the mean).ME/BE of the bottom decile ⇒ (y1 , 0.77) and ME/BE of the top decile = 2.59 ⇒ (y2 ,2.59) in (leverage, ME/BE). Estimated slope = -7.85Slope = (y2-y1) / (x2-x1) and -7.85 = ∆y / (2.59 - 0.77) = ∆y /1.82 ⇒ ∆y = -14.3%

21
Second measure : Regulation
Regulation reduces the problem of underinvestment by transferring much of themanagement’s discretion over investment decisions to regulatory authorities.Besides, stability of cash flows.
Prediction :< Underinvestment hypothesisRegulated companies should have higher leverage and higher dividend yields thanunregulated companies.
Example of the telecommunications industry which was deregulated in 1982Leverage ratios have fallen from almost 45% prior to 1980 to under 25% after 1985Dividend yields have fallen from over 5% prior to 1980 to less than 2% after 1985
Results : Dummy variable = increase leverage ratios by 14.66 percentage points anddividend yields by 4.20 percentage points.
22
1.7.2 Signaling
Definitions:Martingale or random walk : E(earningst+1) = earningst
Martingale with drift : E(earningst+1) = earningst + dMean reverting : E(earningst+1) = E(earningst) = average earningsMean reverting with drift : E(earningst+1) = E(earningst) + d = average earnings + d
Measure of low-quality and high-quality firms : current year’s earnings - past earnings :If > 0 (< 0), then a high-quality (low-quality) firm.If earnings follow a random walk ⇒ problem of growth ? link with profitability ?
Prediction :< Signaling hypothesisHigh-quality (or undervalued) firms should have higher leverage and higherdividend yields than low-quality (or overvalued) firms.
Result : positive and significant relation with leverage and negative and insignificantrelation with dividends (inconsistent with the signaling hypothesis). But low economicimpact.

23
1.7.3 Corporate Taxes
Measure : dummy variable for tax-loss carryforwards and investment tax credits
Prediction :< Tax hypothesisCompanies with low effective marginal tax rates (large tax loss carryforwards) andhigh non-interest tax shields (investment tax credits) should have less debt in theircapital structure. Negative relation with leverage.The theory says nothing about dividends and taxes
Results :
Negative for the dummy representing investment tax credits, but marginallysignificantPositive and significant for the dummy representing tax loss carryforwards :«reverse causality» ⇒ losses ⇒ ↓ value ⇒ ↑ leverage
⇒ Differences in contracting costs between debt and equity are more important thantaxes in explaining corporate leverage ratios
24
1.7.4 Firm Size
Measure : log of total sales
Prediction :< Bankruptcy hypothesisLarger firms should have higher leverage ratios for they have lower directbankruptcy costs. Positive relationDividends ?
Results :
Mixed for leverage ratiosClearcut for dividend yields : larger firms have higher dividends yields (70 % to250% higher than the average 2.4%).

25
1.8 Conclusions
The most important systematic determinant of a company's leverage ratio and dividendyield : the extent of its investment opportunities.
For high-growth firms : underinvestment problem if debt and flotation costs of highdividends make both policies potentially very costly
For mature firms : high leverage and high dividend yields have substantial benefits incontrolling the FCF problem.
R2 = 30% ⇒ regressions explain a third of the differences among companies in leverageand dividend policies.
Limits : debt is not the same; it can differ in several respects : maturity, covenantsrestrictions, convertibility and call provisions, security, and whether the debt is privatelyplaced or held by widely-dispersed public investors.
Junk bonds + warrants + call provisions for high-growth firms + private: more flexible;Junk bonds and LBO or MBO : "Assets in place" companies.

26
Tableau synthèse des résultats de BSW sur l’influence des politiques de financement etde dividendes sur la valeur de la firme
Dette - théorie Résultat Dividendes -théorie
Résultat
ME/BE - - - -Réglementation + + + +Bénéfices anormaux + + + - *Pertes d’impôt reportées - +Crédits d’impôts - - *Taille (Ventes) + / - Mixte + -*marginalement significatif

27
ALBOUY ET DUMONTIER
DIVIDENDES
Seule l'amélioration de la capacité bénéficiaire, dont le dividende n'est qu'unemanifestation, est à l'origine de la création de valeur.
Pour une structure financière et pour un montant d'investissement donnés, peut-onmodifier la valeur de l'entreprise en manipulant les dividendes ?
NON, si émission d'actions pour financer les dividendes, c'est une "opération blanche".
Les conclusions de MM en matière de dividendes et d'endettement sont fortementsemblables : si les politiques de financement et de distribution sont susceptibles d'affecterla valeur de l'entreprise, ce n'est qu'à cause de règles fiscales discriminantes.

28
FINANCE D'ENTREPRISE APRES MILLER
Caractère exclusivement économique. La firme n'est qu'une boîte noire dans laquelleentrent et sortent des flux de fonds. Il faut les répartir entre 2 sortes de bailleurs de fonds:les actionnaires et les créanciers.
Pas de question sur l'influence du mode d'organisation et de contrôle interne (structure dela propriété du capital) de l'entreprise sur le mécanisme de création de richesse.
Pas de conflits d'intérêt entre créanciers et actionnaires, ni entre actionnaires minoritaireset actionnaires majoritaires. Donc, pas de question sur leur mode de résolution

29
THÉORIE DE L'AGENCE (JENSEN ET MECKLING)
Coûts de contrôle ou de surveillance: coûts engagés par le mandant (principal) pours'assurer que le mandataire (l'agent) agisse dans le sens de ses intérêts.
Coûts d'obligation ou de dédouanement : coûts engagés par le mandataire (l'agent) pourconvaincre le mandant (principal) qu'il agit bien dans son intérêt.
Coûts résiduels : coûts liés au fait que les deux parties vont accepter, dans leur intérêtréciproque, de ne pas aller jusqu'au bout de leur logique. Sinon, coût marginal supérieurau bénéfice marginal.
Lien entre théorie des organisations et la théorie financière. Conflits d'intérêt potentiels etdonc se pose la question de la résolution de ces conflits.
Effet disciplinaire de la dette: décisions d'investissement et de financement nonindépendantes.

30
ASYMÉTRIE DE L'INFORMATION
Entre offreurs (investisseurs) et demandeurs (entreprises) de capitaux.
Dividende : plus seulement un flux de fonds, mais un signal envoyé au marché.Structure financière : La valeur augmente quand la part des actionnaires - dirigeantsaugmente (Leland et Pyle). La valeur augmente quand endettement supérieur (Ross).
Selon MM, le management financier n'a pas d'impact sur le processus de création devaleur. Pourtant, opérations de prise de contrôle, restructurations financières, rachatsd'entreprise avec effets de levier montrent le contraire: effets des changementsorganisationnels, de la structure de la propriété et du surendettement sur la valeur.

31
1 THE DETERMINANTS OF CORPORATE LEVERAGE AND DIVIDENDPOLICIES ......................................................................................................................... 1
1.1 Some historical evidence ................................................................................... 21.2 The M&M irrelevance propositions................................................................... 31.3 Taxes.................................................................................................................. 5
1.3.1 Taxes and Capital Structure ....................................................................... 51.3.2 Taxes and Dividend Policy ........................................................................ 8
1.4 Bankruptcy costs and corporate investment policy............................................ 91.4.1 Direct Bankruptcy Costs ............................................................................ 91.4.2 Indirect Bankruptcy Costs.......................................................................... 9
1.5 The benefits of debt in controlling corporate overinvestment.......................... 121.5.1 Disciplinary role of debt .......................................................................... 121.5.2 Disciplinary role of dividends.................................................................. 13
1.6 Information costs and signaling effects............................................................ 141.6.1 Signaling and Capital Structure ............................................................... 151.6.2 A Note on the Pecking Order Theory of Capital Structure ...................... 171.6.3 Signaling and Dividend Policy ................................................................ 18
1.7 Evidence on determinants of leverage and dividend policies........................... 181.7.1 Investment Opportunities : ME/BE.......................................................... 20

32
1.7.2 Signaling.................................................................................................. 221.7.3 Corporate Taxes....................................................................................... 231.7.4 Firm Size.................................................................................................. 24
1.8 Conclusions ..................................................................................................... 25