the design of multi-element airfoils through multi
TRANSCRIPT
Copyright © 2012 Tech Science Press CMES, vol.88, no.2, pp.107-138, 2012
The Design of Multi-Element Airfoils ThroughMulti-Objective Optimization Techniques
G. Trapani1, T. Kipouros1 and A. M. Savill1
Abstract: This paper presents the development and the application of a multi-objective optimization framework for the design of two-dimensional multi-elementhigh-lift airfoils. An innovative and efficient optimization algorithm, namely Multi-Objective Tabu Search (MOTS), has been selected as core of the framework. Theflow-field around the multi-element configuration is simulated using the commer-cial computational fluid dynamics (cfd) suite Ansys cfx. Elements shape and de-ployment settings have been considered as design variables in the optimization ofthe Garteur A310 airfoil, as presented here. A validation and verification process ofthe cfd simulation for the Garteur airfoil is performed using available wind tunneldata. Two design examples are presented in this study: a single-point optimizationaiming at concurrently increasing the lift and drag performance of the test case at afixed angle of attack and a multi-point optimization. The latter aims at introducingoperational robustness and off-design performance into the design process. Finally,the performance of the MOTS algorithm is assessed by comparison with the lead-ing NSGA-II (Non-dominated Sorting Genetic Algorithm) optimization strategy.An equivalent framework developed by the authors within the industrial sponsorenvironment is used for the comparison. To eliminate cfd solver dependenciesthree optimum solutions from the Pareto optimal set have been cross-validated. Asa result of this study MOTS has been demonstrated to be an efficient and effectivealgorithm for aerodynamic optimizations.
Keywords: multi-objective optimization; tabu search; NSGA-II; high-lift airfoildesign; robust optimization
1 Department of Power and Propulsion - Cranfield University, Cranfield MK43 0AL, United King-dom.
108 Copyright © 2012 Tech Science Press CMES, vol.88, no.2, pp.107-138, 2012
Nomenclature
δx = element deployment along the x-axis [m]δy = element deployment along the y-axis [m]θ = element deflection angle [◦]x,y = Cartesian coordinatesRe = Reynolds numberM∞ = freestream Mach numbercl = lift coefficientcd = drag coefficientclmax = maximum lift coefficientα = angle of attack [◦]αclmax = stall angle of attack [◦]cp = pressure coefficientc = stowed airfoil chordL/D = lift to drag ratioy+ = dimensionless wall distanceCoP = free form deformation control point
1 Introduction
The design of high-lift devices for civil aircraft has become increasingly importantwithin the aerospace industry. Efficient high-lift configurations are, nowadays, fun-damental to fulfill the increasing requirements in terms of aerodynamic efficiencyand noise levels in near airport regions imposed by ICAO (Chapter 4 of Annex16) [Greener by Design Science and Technology Sub-Group (2005)]. Althoughdeployed only for short segments of an aircraft typical mission profile, relativelysmall changes in the aerodynamic performance of the high lift systems can pro-duce large pay-off in airplane weight and performance [van Dam (2002)]. More-over, these systems have a significant impact on the cost of a typical jet transport:they are time consuming and expensive to design and test; their flows, geometry,and actuation and support systems are complex; they are heavy and maintenanceintensive [van Dam (2002)].
A broad range of different high-lift types has been developed over the years [Rudolph(1996)], although the most widely used in civil aircraft is the multi-element wing.This configuration is typically composed of a leading-edge device that increasesthe stall angle of attack, and a trailing-edge device that produces an upward shiftin the lift curve. The positive effects of slotted flaps in increasing airfoil aerody-namic performance have been known for almost a century, but it was not until the1970s that a theoretical basis for high-lift aerodynamics was made. This was a

High Lift MOTS Optimization 109
result of the insight into the underlying physics of the highly complex flows in-volved provided by A.M.O. Smith [Smith (1975)]. The aerodynamic performanceof multi-element wings is very sensitive to small variations in the gap size and theoverlap between the various elements. Furthermore, the design of such system ismade even more challenging by the requirement of retaining good performancelevel for a wide range of flap settings [van Dam (2002)].
The design of multi-element wings implies not only the design of the shape ofleading and trailing edge devices but also the optimization of their relative posi-tions. Wind tunnel tests are widely used during this phase to evaluate the aerody-namic performance of the configuration. However, the cost of such tests and theReynolds number scaling problem (from wind tunnel to flight conditions) has leadto the development of alternative cfd tools to be integrated within the design pro-cess. In particular, RANS (Reynolds Averaged Navier-Stokes) tools, although stilla subject of research, have been found to be reasonably reliable in predicting theaerodynamic performance of high-lift configurations. The use of RANS solvers insimulating the complex flow field around multi-element airfoils has been validatedin the past [Lindblad and de Cock (1999); Rudnik, Eliasson, and Perraud (2005);Rumsey and Ying (2002); Fejtek (1997); Murayama and Yamamoto (2005)]. Thisvalidation process has enabled the application of numerical optimization methodsto the design of high-lift configurations, making it an active area of research.
The European project EUROLIFT II [Amoignon, Quest, Moens, Quagliarella, Wild,and Brezillion (2007)] has promoted the assessment and comparison of several op-timization strategies (gradient based, gradient-free and stochastic methods) com-bined with different RANS solvers. A common design problem was defined for atwo-dimensional test case in landing configuration. All the involved partners ap-proached the multi-objective problem using a single objective weighted functionformulation. The only exception was CIRA, which used a multi-objective geneticalgorithm (MOGA) combined with an Euler-boundary layer coupling code. Al-though widely used within the research community [Wild (1998); Wild (2008);Nemec, Zingg, and Pulliam (2004); Kim, Alonso, and Jameson (2002); Kroll,Gauger, Brezillon, Dwight, Fazzolari, Vollmer, Becker, Barnewitz, Schulz, andHazra (2007); Besnard, Schmitz, Boscher, Garcia, and Cebeci (1998); Eyi, Lee,Rogers, and Kwak (1996)], the single objective weighted function formulationintroduces designer biases into the optimization process: the value given to theweights of the different performance criteria considered. Besides, the use of truemulti-objective algorithm has been limited to surrogate models based optimiza-tion. In particular, kriging models have been used in conjunction with a multi-objective preference based Particle Swarm algorithm by Carrese [Carrese, Winarto,Li, Sóbester, and Ebenezer (2012)] and in conjunction with MOGA by Kanazaki
110 Copyright © 2012 Tech Science Press CMES, vol.88, no.2, pp.107-138, 2012
[Kanazaki, Tanaka, Jeong, and Yamamoto (2007)].
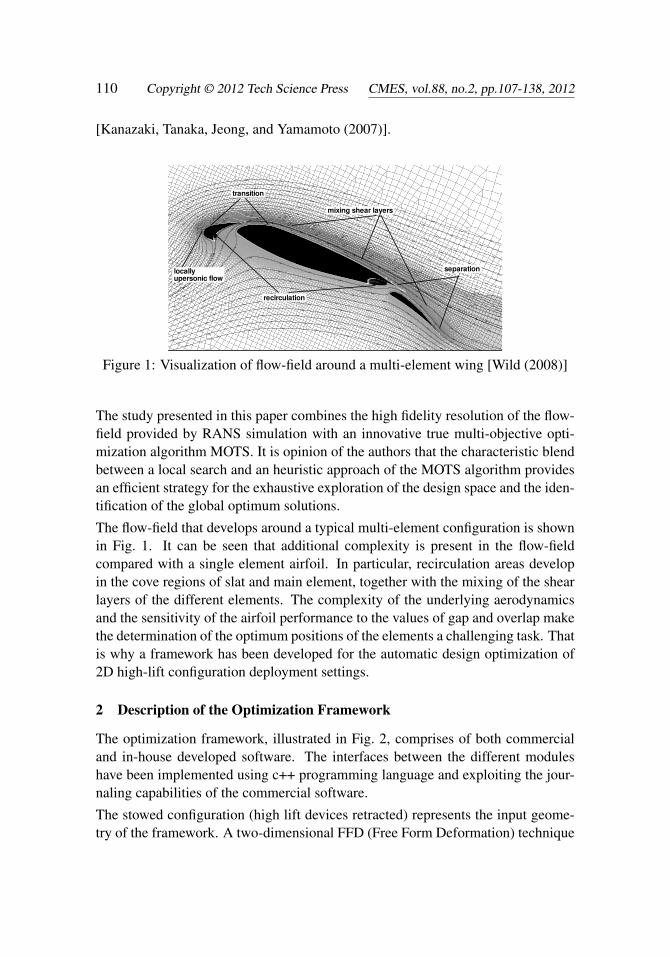
recirculation
separationlocallyupersonic flow
mixing shear layers
transition
Figure 1: Visualization of flow-field around a multi-element wing [Wild (2008)]
The study presented in this paper combines the high fidelity resolution of the flow-field provided by RANS simulation with an innovative true multi-objective opti-mization algorithm MOTS. It is opinion of the authors that the characteristic blendbetween a local search and an heuristic approach of the MOTS algorithm providesan efficient strategy for the exhaustive exploration of the design space and the iden-tification of the global optimum solutions.
The flow-field that develops around a typical multi-element configuration is shownin Fig. 1. It can be seen that additional complexity is present in the flow-fieldcompared with a single element airfoil. In particular, recirculation areas developin the cove regions of slat and main element, together with the mixing of the shearlayers of the different elements. The complexity of the underlying aerodynamicsand the sensitivity of the airfoil performance to the values of gap and overlap makethe determination of the optimum positions of the elements a challenging task. Thatis why a framework has been developed for the automatic design optimization of2D high-lift configuration deployment settings.
2 Description of the Optimization Framework
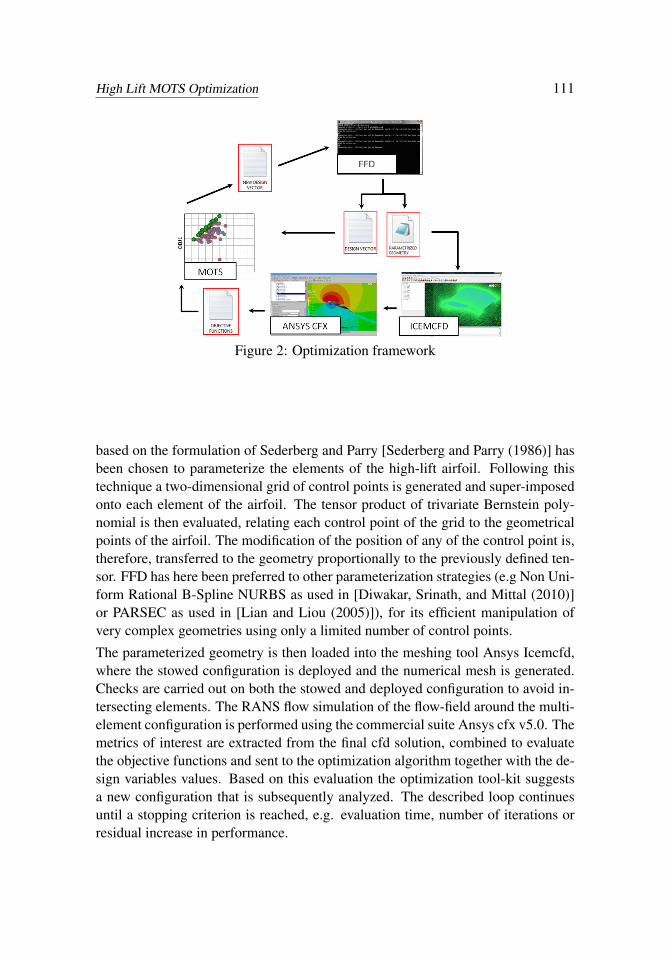
The optimization framework, illustrated in Fig. 2, comprises of both commercialand in-house developed software. The interfaces between the different moduleshave been implemented using c++ programming language and exploiting the jour-naling capabilities of the commercial software.
The stowed configuration (high lift devices retracted) represents the input geome-try of the framework. A two-dimensional FFD (Free Form Deformation) technique
High Lift MOTS Optimization 111
Figure 2: Optimization framework
based on the formulation of Sederberg and Parry [Sederberg and Parry (1986)] hasbeen chosen to parameterize the elements of the high-lift airfoil. Following thistechnique a two-dimensional grid of control points is generated and super-imposedonto each element of the airfoil. The tensor product of trivariate Bernstein poly-nomial is then evaluated, relating each control point of the grid to the geometricalpoints of the airfoil. The modification of the position of any of the control point is,therefore, transferred to the geometry proportionally to the previously defined ten-sor. FFD has here been preferred to other parameterization strategies (e.g Non Uni-form Rational B-Spline NURBS as used in [Diwakar, Srinath, and Mittal (2010)]or PARSEC as used in [Lian and Liou (2005)]), for its efficient manipulation ofvery complex geometries using only a limited number of control points.
The parameterized geometry is then loaded into the meshing tool Ansys Icemcfd,where the stowed configuration is deployed and the numerical mesh is generated.Checks are carried out on both the stowed and deployed configuration to avoid in-tersecting elements. The RANS flow simulation of the flow-field around the multi-element configuration is performed using the commercial suite Ansys cfx v5.0. Themetrics of interest are extracted from the final cfd solution, combined to evaluatethe objective functions and sent to the optimization algorithm together with the de-sign variables values. Based on this evaluation the optimization tool-kit suggestsa new configuration that is subsequently analyzed. The described loop continuesuntil a stopping criterion is reached, e.g. evaluation time, number of iterations orresidual increase in performance.

112 Copyright © 2012 Tech Science Press CMES, vol.88, no.2, pp.107-138, 2012
Table 1: Design variables range of variation.
Parameter Description Step RangeDeployment Control∆xS Slat Translation along x, δx/c 0.02 [−0.06;0.14]∆yS Slat Translation along y, δy/c 0.01 [−0.05;0.09]ΘS Slat rotation, θ −θ0 1◦ [−10.0◦;10.0◦]∆xF Flap Translation along x, δx/c 0.02 [−0.17;0.09]∆yF Flap Translation along y, δy/c 0.01 [−0.06;0.00]ΘF Flap rotation, θ −θ0 1◦ [−10.0◦;10.0◦]Shape ControlCoP FFD selected control points, ∆/c 0.05 [−0.2;0.2]
2.1 Design Variables
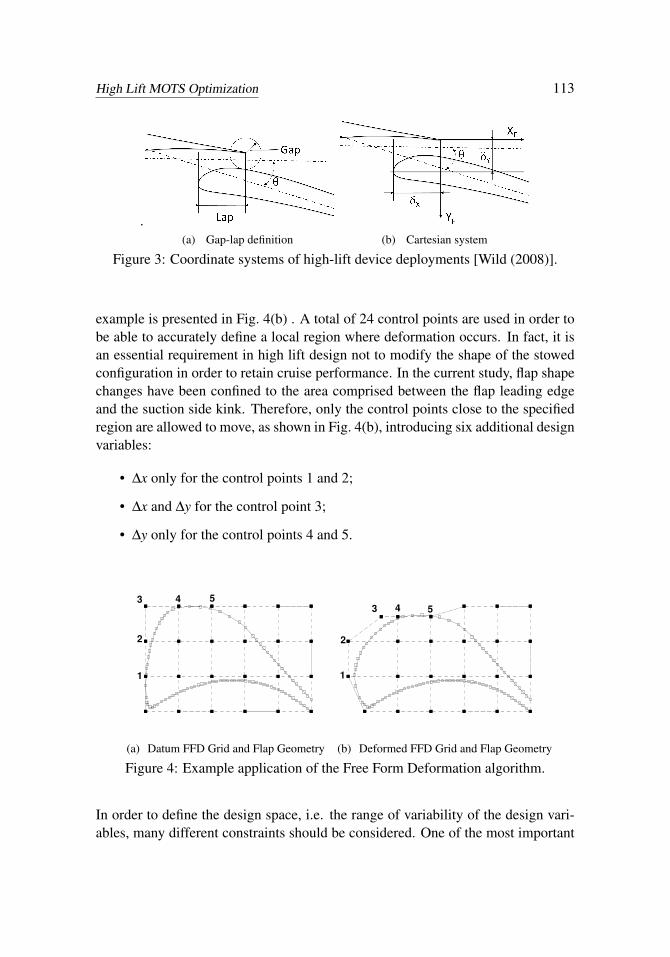
The deployment of multi-element wings is controlled by the so-called positioningparameters. Different coordinate systems can be used for the deflections of thedevices, although the Cartesian system and the gap-overlap definition are the onesusually applied (see Fig. 3). Even though the latter notation is more related to theflow physics, the Cartesian system is more convenient for mathematical modelingand has been chosen in the presented study. Three variables are used to define thedeployment settings of each element:
• δx: the distance along the x-axis between the trailing edge of an element andthe leading edge of the following;
• δy: the distance along the y-axis between the trailing edge of an element andthe leading edge of the following;
• θ : the angle within the chords of two consecutive elements.
In the practical parametrization process the first two parameters have been directlyused as design variables. Instead, a new variable was used to express the deflectionangle, defined as Θ = θ −θ0, where θ0 is the deflection angle of the datum config-uration. Hence, three design variables are needed to define the deployment of eachelement.
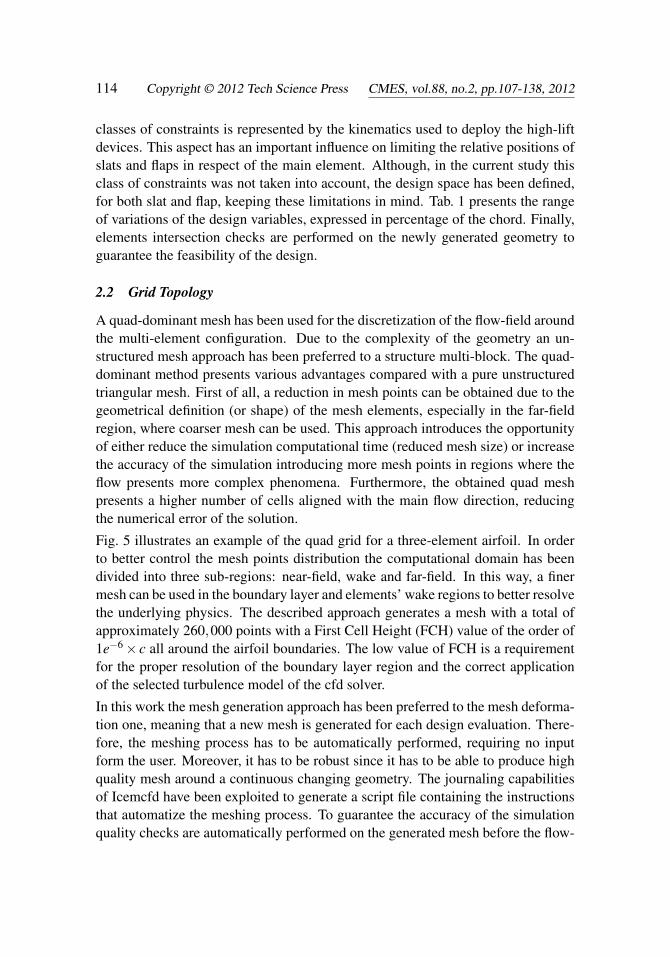
The free form deformation technique described in the previous chapter has beenused to parameterize the shape of the flap element. Fig. 4(a) shows the generatedcontrol grid around the datum flap of the selected test case, while a deformation
High Lift MOTS Optimization 113
.(a) Gap-lap definition (b) Cartesian system
Figure 3: Coordinate systems of high-lift device deployments [Wild (2008)].
example is presented in Fig. 4(b) . A total of 24 control points are used in order tobe able to accurately define a local region where deformation occurs. In fact, it isan essential requirement in high lift design not to modify the shape of the stowedconfiguration in order to retain cruise performance. In the current study, flap shapechanges have been confined to the area comprised between the flap leading edgeand the suction side kink. Therefore, only the control points close to the specifiedregion are allowed to move, as shown in Fig. 4(b), introducing six additional designvariables:
• ∆x only for the control points 1 and 2;
• ∆x and ∆y for the control point 3;
• ∆y only for the control points 4 and 5.
1
2
3 4 5
(a) Datum FFD Grid and Flap Geometry
1
2
3 4 5
(b) Deformed FFD Grid and Flap Geometry
Figure 4: Example application of the Free Form Deformation algorithm.
In order to define the design space, i.e. the range of variability of the design vari-ables, many different constraints should be considered. One of the most important
114 Copyright © 2012 Tech Science Press CMES, vol.88, no.2, pp.107-138, 2012
classes of constraints is represented by the kinematics used to deploy the high-liftdevices. This aspect has an important influence on limiting the relative positions ofslats and flaps in respect of the main element. Although, in the current study thisclass of constraints was not taken into account, the design space has been defined,for both slat and flap, keeping these limitations in mind. Tab. 1 presents the rangeof variations of the design variables, expressed in percentage of the chord. Finally,elements intersection checks are performed on the newly generated geometry toguarantee the feasibility of the design.
2.2 Grid Topology
A quad-dominant mesh has been used for the discretization of the flow-field aroundthe multi-element configuration. Due to the complexity of the geometry an un-structured mesh approach has been preferred to a structure multi-block. The quad-dominant method presents various advantages compared with a pure unstructuredtriangular mesh. First of all, a reduction in mesh points can be obtained due to thegeometrical definition (or shape) of the mesh elements, especially in the far-fieldregion, where coarser mesh can be used. This approach introduces the opportunityof either reduce the simulation computational time (reduced mesh size) or increasethe accuracy of the simulation introducing more mesh points in regions where theflow presents more complex phenomena. Furthermore, the obtained quad meshpresents a higher number of cells aligned with the main flow direction, reducingthe numerical error of the solution.
Fig. 5 illustrates an example of the quad grid for a three-element airfoil. In orderto better control the mesh points distribution the computational domain has beendivided into three sub-regions: near-field, wake and far-field. In this way, a finermesh can be used in the boundary layer and elements’ wake regions to better resolvethe underlying physics. The described approach generates a mesh with a total ofapproximately 260,000 points with a First Cell Height (FCH) value of the order of1e−6× c all around the airfoil boundaries. The low value of FCH is a requirementfor the proper resolution of the boundary layer region and the correct applicationof the selected turbulence model of the cfd solver.
In this work the mesh generation approach has been preferred to the mesh deforma-tion one, meaning that a new mesh is generated for each design evaluation. There-fore, the meshing process has to be automatically performed, requiring no inputform the user. Moreover, it has to be robust since it has to be able to produce highquality mesh around a continuous changing geometry. The journaling capabilitiesof Icemcfd have been exploited to generate a script file containing the instructionsthat automatize the meshing process. To guarantee the accuracy of the simulationquality checks are automatically performed on the generated mesh before the flow-
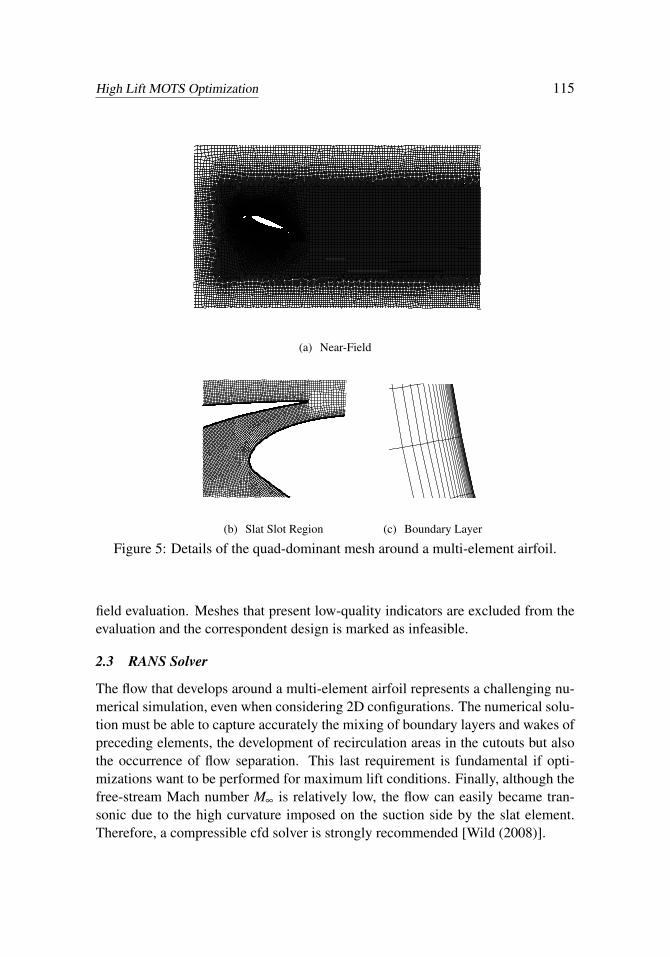
High Lift MOTS Optimization 115
(a) Near-Field
(b) Slat Slot Region (c) Boundary Layer
Figure 5: Details of the quad-dominant mesh around a multi-element airfoil.
field evaluation. Meshes that present low-quality indicators are excluded from theevaluation and the correspondent design is marked as infeasible.
2.3 RANS Solver
The flow that develops around a multi-element airfoil represents a challenging nu-merical simulation, even when considering 2D configurations. The numerical solu-tion must be able to capture accurately the mixing of boundary layers and wakes ofpreceding elements, the development of recirculation areas in the cutouts but alsothe occurrence of flow separation. This last requirement is fundamental if opti-mizations want to be performed for maximum lift conditions. Finally, although thefree-stream Mach number M∞ is relatively low, the flow can easily became tran-sonic due to the high curvature imposed on the suction side by the slat element.Therefore, a compressible cfd solver is strongly recommended [Wild (2008)].

116 Copyright © 2012 Tech Science Press CMES, vol.88, no.2, pp.107-138, 2012
The commercial software selected in this work integrates the compressible un-steady RANS equations using a time-marching Second-Order Backward Euler schemeuntil a steady state solution is reached. The so called High Resolution Scheme isused for the discretization of the governing equations, resulting in both high ac-curacy and stability of the solution. The turbulence equations are, instead, solvedusing a first order method. The Mender Shear Stress Transport (SST) k-omega tur-bulence model has been chosen due to its superiority in capturing the occurrence offlow separation [Bardina, Huang, and Coakley (1997)]. To benefit from this modelthe boundary layer has to be well resolved, dictating the requirement for the dimen-sionless wall distance y+ value to be lower than unit on the airfoil’s walls. Finally,the flow is considered to be fully turbulent on both lower and upper surfaces of theairfoil.
The final result of the simulation is achieved through the solution of the unsteadyequations using a fictitious time-step. In order to avoid divergence behaviors and,hence, increase the robustness of the simulation, an increasing step function for thetime-step has been used. Computational time has been reduced exploiting the built-in parallelization capability of Ansys cfx, executing each flow simulation on a four-processor node. Convergence checks are carried out at the end of each simulationin order to exclude any solution that presents oscillating or not converged behavior.
2.4 Optimization Algorithm
The selection of the optimization algorithm to implement within the framework hasbeen driven by two main factors: the computational time of a flow evaluation andthe nature of the design space. On the one hand, the first criteria implies that effi-cient algorithms that minimize the number of objective functions evaluations haveto be used for time-consuming simulations. On the other, the presence of multiplelocal minima in a design space drives the need of an optimization algorithm thatcan widely search the design space and identify the so called global optimum. It isobvious the contrasting nature of such requirements.
Local search algorithms (e.g. gradient based) represent highly efficient optimiza-tion strategies but tend to be trapped in local minima. On the contrary, stochasticalgorithms (e.g. Genetic Algorithm, Simulated Annealing, Tabu Search) are able toidentify global optima but represent a heavier and less efficient optimization strat-egy. The Tabu Search algorithm has been chosen in this work due to its “intelligent”approach to the optimization process. The specific MOTS software has been devel-oped by Jaeggi et al. [Jaeggi, Parks, Kipouros, and Clarkson (2008)] adapting thesingle-objective TS software implemented by Connor and Tilley [Connor and Tilley(1998)]. The TS algorithm can be seen as a further development and enhancementof a local search method. The Hooke and Jeeves local search algorithm is the core

High Lift MOTS Optimization 117
Figure 6: Point selection for the Hooke & Jeeves move and Tabu Search memories.Source: [Jaeggi, Parks, Kipouros, and Clarkson (2008)].
of the local search method used by TS. At each iteration 2nvar new points are cre-ated by the optimizer using a given step to increase xi +δi and decrease xi−δi thevariable value. The objective functions are then evaluated for each new point andthe best allowed (i.e. non-tabu and non-constraint violating) point is chosen as thenext base point in the search.
Three main stages characterize the algorithm, each of which is associated with aparticular memory allocation. Recently visited points are recorded in the ShortTerm Memory (STM), creating in such a way a Tabu list of points that will not berevisited. A Medium Term Memory (MTM) is used to store the optimal or near-optimal points which are used to perform the Search Intensification (SI) strategy.This consists in returning to a region that seems attractive and perform a more in-tense search but without revisiting the same solutions found. Search intensificationoccurs if there have been no successful moves for a defined number of local searchiterations. While the SI intensifies the search of the optimum in one zone of thedesign space, the Search Diversification (SD) strategy moves the search to unvis-ited regions. A Long Term Memory (LTM) is used for this purpose, storing theareas which have been extensively searched by the optimizer. In order to performsuch a move the design domain is divided in N sub-domain and the number ofpoints visited in each sub-domain represent its visited index. When SD occurs thesearch is moved to a random sub-domain with a low visited index. Fig. 6 illus-trates in a simple example the different memory categories of TS. The final stageof the algorithm is the Step Size Reduction (SSR) and occurs after a continued lack
118 Copyright © 2012 Tech Science Press CMES, vol.88, no.2, pp.107-138, 2012
of successful moves. This strategy is performed to ensure an intensive search inthe neighborhood of the current optimal solutions. The step sizes of each designvariable are reduced and the search returns to a randomly selected point from theMTM.
MOTS has been developed and proved to be particularly effective on aerodynamicproblems [Harvey (2002)]. In [Connor and Tilley (1998)] the MOTS algorithm hasbeen compared with a leading multi-objective genetic algorithm, NSGA-II [Deb,Pratap, Agarwal, and Meyarivan (2002)], showing that the two algorithms performcomparably. Moreover, the tool has successfully been used by Kipouros and Ghisu[Kipouros (2006); Jaeggi, Parks, Kipouros, and Clarkson (2008); Kipouros, Jaeggi,Dawes, Parks, Savill, and Clarkson (2008a); Kipouros, Jaeggi, Dawes, Parks, Sav-ill, and Clarkson (2008b); Ghisu, Parks, Jarrett, and Clarkson (2011)] in the multi-objective optimization of axial compressors.
The algorithm has been coded using mpi (message passing interface) standards, sothat the 2nvar generated designs can be evaluated in parallel. This feature, togetherwith the parallel execution of the cfd analysis, allows a multi-level parallelization ofthe optimization process, resulting in a drastic reduction of the time to completion.
3 Validation and Verification of Cfd modeling
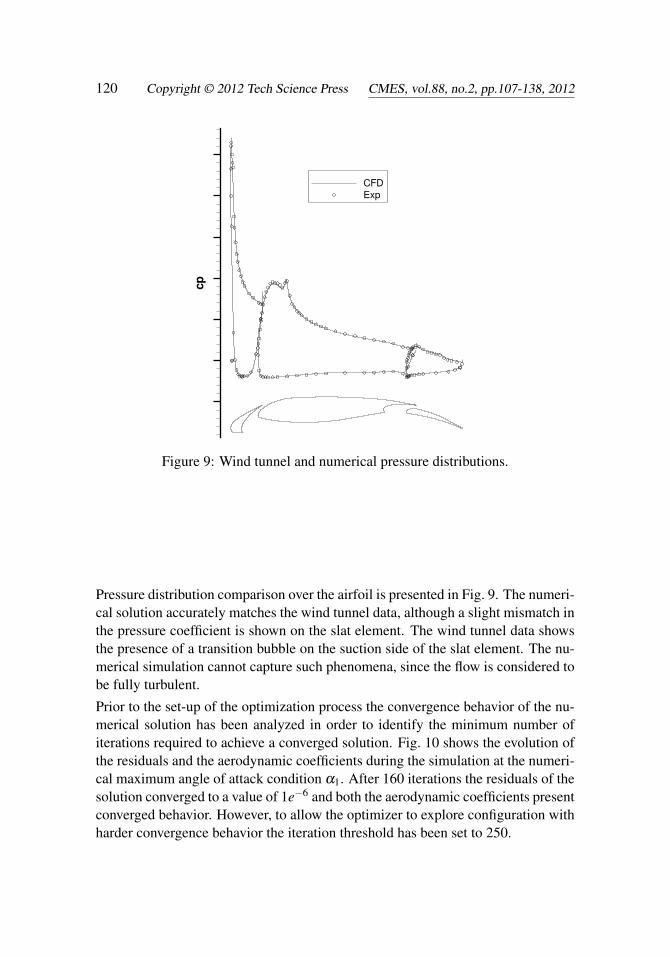
The high-lift configuration used throughout this work is the Garteur A310 airfoil[Flaig and Hilbig (1993)]. Reference wind tunnel tests carried out in the ONERAF1 wind tunnel are available [Manie, Piccini, and Ray (1989)] at a Reynolds num-ber of Re = 4.106 and M∞ = 0.2. The configuration comprises of a slat, a mainairfoil, and a single-slotted flap as shown in Fig. 9. The moderate deploymentsettings are characteristic of a take-off configuration.
A validation and verification study of the cfd simulation has been performed com-paring the available experimental data and the numerical solutions. Due to theconfidentiality of the data the absolute values cannot be presented here. Three dif-ferent meshes with increasing cell numbers have been generated and used to obtainthe lift and drag coefficients at a fixed angle of attack. The obtained data has beencompared with wind tunnel tests for the same flow settings. The results are shownin Fig. 7, where it can be seen that the numerical error reduces with increasingmesh size. Moreover, a comparison of numerical evaluated and experimental po-lars is shown in Fig. 8. The cfd simulation satisfactorily predicts the aerodynamicperformance of the airfoil for the whole range of angle of attacks. In the near-stall region the numerical solution slightly under-predicts both the clmax and theαclmax values. A direct comparison of the drag coefficient cannot be made due tothe inconsistency of the experimental data (pressure tabs measurement versus wake
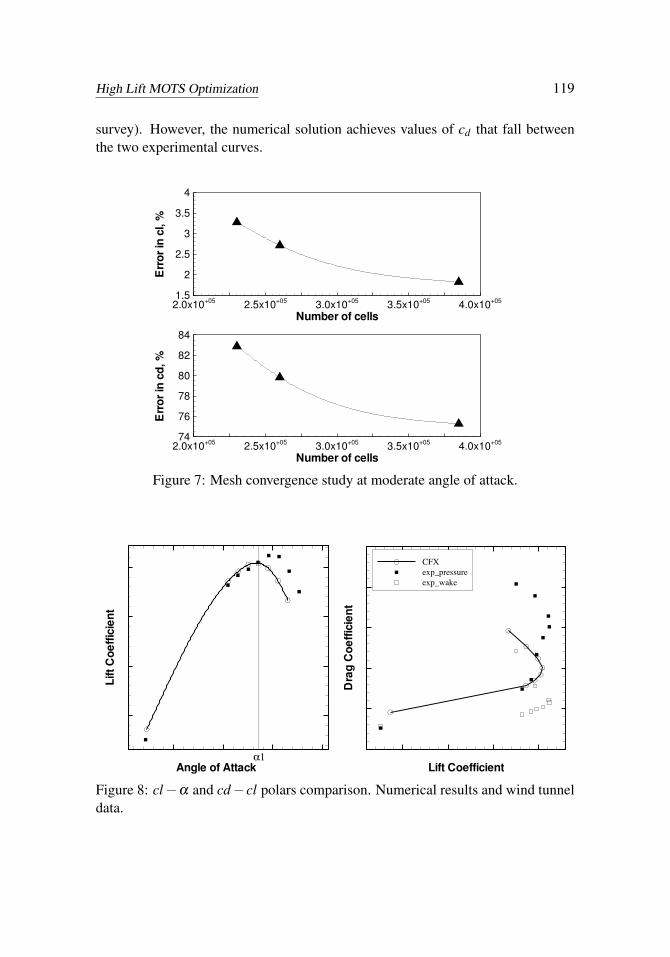
High Lift MOTS Optimization 119
survey). However, the numerical solution achieves values of cd that fall betweenthe two experimental curves.
Number of cells
Errorin
cd,%
2.0x10+05
2.5x10+05
3.0x10+05
3.5x10+05
4.0x10+05
74
76
78
80
82
84
Number of cells
Errorin
cl,%
2.0x10+05
2.5x10+05
3.0x10+05
3.5x10+05
4.0x10+05
1.5
2
2.5
3
3.5
4
Figure 7: Mesh convergence study at moderate angle of attack.
Angle of Attack
LiftCoefficient
α1
Lift Coefficient
DragCoefficient
CFX
exp_pressure
exp_wake
Figure 8: cl−α and cd−cl polars comparison. Numerical results and wind tunneldata.
120 Copyright © 2012 Tech Science Press CMES, vol.88, no.2, pp.107-138, 2012
cp
CFD
Exp
Figure 9: Wind tunnel and numerical pressure distributions.
Pressure distribution comparison over the airfoil is presented in Fig. 9. The numeri-cal solution accurately matches the wind tunnel data, although a slight mismatch inthe pressure coefficient is shown on the slat element. The wind tunnel data showsthe presence of a transition bubble on the suction side of the slat element. The nu-merical simulation cannot capture such phenomena, since the flow is considered tobe fully turbulent.
Prior to the set-up of the optimization process the convergence behavior of the nu-merical solution has been analyzed in order to identify the minimum number ofiterations required to achieve a converged solution. Fig. 10 shows the evolution ofthe residuals and the aerodynamic coefficients during the simulation at the numeri-cal maximum angle of attack condition α1. After 160 iterations the residuals of thesolution converged to a value of 1e−6 and both the aerodynamic coefficients presentconverged behavior. However, to allow the optimizer to explore configuration withharder convergence behavior the iteration threshold has been set to 250.

High Lift MOTS Optimization 121
108
107
106
105
104
103
102
101
Accumulated Timestep
Aero
dyn
am
icco
eff
icie
nts
0 25 50 75 100 125 150
cd
cl
Accumulated Timestep
Resid
uals
0 25 50 75 100 125 150
PMass
UMom
VMom
Figure 10: Datum design convergence monitor for the numerical solution at αclmax
4 Problem formulation
The design of high-lift configuration is a complex and challenging task requiringthe simultaneous satisfaction of several conflicting requirements. It is indeed amulti-objective problem. For this reasons any numerical optimization strategy thataims at supporting the design process needs to take this characteristic into account.In general mathematical terms a multi-objective optimization problem can be ex-pressed as:
minimize f (x) = { f1(x), ..., fn(x)}, x ∈ Rn
subject to{
ci = 0, i = 1,2, ...,m′
ci ≥ 0, i = m′+1, ...,m
(1)
122 Copyright © 2012 Tech Science Press CMES, vol.88, no.2, pp.107-138, 2012
where f (x) are defined as the objective functions, x is the vector containing the de-sign variables and ci is the set of constraints to which f (x) are subjected. Finding asolution to this problem means to determine a set of design variables that minimizethe value of the objective functions satisfying, at the same time, the constraints.Unlike single optimization problems where a unique optimum solution is clearlydefined, this problem is characterized by a family of alternative solutions and theconcept of Pareto-optimality must be introduced. Originally postulated by YsidroEdgeworth in 1881 [Edgeworth (1881)] and generalized afterwards by VilfredoPareto [Pareto (1896)] it states that a solution is Pareto optimal if no other feasiblesolution exists which would simultaneously improve all of the objective functions.The set of all the solutions that satisfy this requirement is defined as Pareto optimalset and consists of all the non-dominated solutions. The corresponding objectivefunctions representation is instead defined Pareto Front. Those two concepts arefundamental when dealing with multi-objective optimization and will recur in thisstudy when analyzing the numerical results obtained.
The formulation of the design optimizations performed by the authors in this studyis here presented. The single-point design problem aims at concurrently minimizethe two objective functions given by the following equations:
obj1 =− clcl0
; obj2 =cdcd0
(2)
where the subscript 0 indicates datum design values. The value of the aerody-namic coefficients in Eq. 2 are evaluated at the angle of attack at which the datumconfiguration achieves its numerical maximum lift. The optimization is, therefore,performed at a fixed angle of attack, indicated as α1 (see Fig. 8). The deploymentsettings of the slat and flap elements are considered as design variables, addingup to a total of six. Hard constraints have been applied on the design variables toexclude zero gap configurations from the optimization process.
The use of numerical optimization techniques in aerodynamic design can providenotable increase in performance for the specified design conditions. However, theidentified optima are often very sensitive to small variations in manufacturing tol-erances and/or operating conditions [Huyse, Padula, Lewis, and Wu (2002)]. As aresult, the optimized design could present inferior performance under actual oper-ating conditions, limiting its application in real-world problems [Li, Li, Sun, Luo,and Zhang (2010)]. Uncertainty quantification is, therefore, becoming an increas-ingly important aspect of the numerical optimization assisted design. Walters andHuyse [Walters and Huyse (2002)] present a comprehensive review of the many ap-proaches developed to quantify uncertainty in simulations, among which the Monte
High Lift MOTS Optimization 123
Carlo Simulation (MCS) is recognized to be the most accurate. The high num-ber of deterministic solutions required to obtain the uncertainty statistics, however,makes its application prohibitive for computationally expensive cfd [Dodson andParks (2009)]. For such problems more efficient and less computational demand-ing methods have to be used [Dodson and Parks (2009)].
The second optimization set-up here presented, namely multi-point, uses the inter-val analysis method to account for changes in operating conditions. In particular,the input angle of attack value of the cfd simulation is varied within a specificrange to evaluate the variation of the airfoil aerodynamic performance. A similarapproach has been used by Srinath in [Srinath, Mittal, and Manek (2009)] for theoptimization of a single element airfoil. Three values of α have been chosen withinthe range [α1−1◦;α1 +1◦] to define the two objective functions expressed in Eq. 3.The first objective function relates to the overall performance of the configurationin the range of angle of attack considered, leading the optimizer to explore designsthat increase the cl value of the three operating points α1−1◦, α1, and α1 +1◦. Thesecond objective function, instead, introduces the concept of robust design, tryingto minimize the variation of the lift coefficient with angle of attack. It is evident theinherent multi-objective nature of any robust optimization problem. A constrainton the drag coefficient is applied through the penalty function P. Such a penaltyis active only when the sum of the drag coefficient at the three operating points ishigher than the datum value.
obj1 =− cl|α1−1 + cl|α1 + cl|α1+1
(cl|α1−1 + cl|α1 + cl|α1+1)|0+P
obj2 =‖cl|α1− cl|α1−1‖+‖cl|α1+1− cl|α1‖
(‖cl|α1− cl|α1−1‖+‖cl|α1+1− cl|α1‖)|0+P
P = max[
0,12
(cd|α1−1 + cd|α1 + cd|α1+1
(cd|α1−1 + cd|α1 + cd|α1+1)|0−1
)] (3)
Indeed, this optimization setup represents a much more challenging task comparedwith the single-point. First of all, in order to achieve the desired performance im-provements, the stall characteristic of the airfoil has to be modified. Elements de-ployment settings can only partially influence the behavior of the airfoil near themaximum lift region. As a consequence, flap shape modification has been includedwithin the optimization process using the free form deformation parameterizationtechnique described earlier. Finally, the increase of both the number of design pointevaluations and design variables leads to a considerable rise in computational cost.
124 Copyright © 2012 Tech Science Press CMES, vol.88, no.2, pp.107-138, 2012
5 Results
5.1 Single-Point Optimization
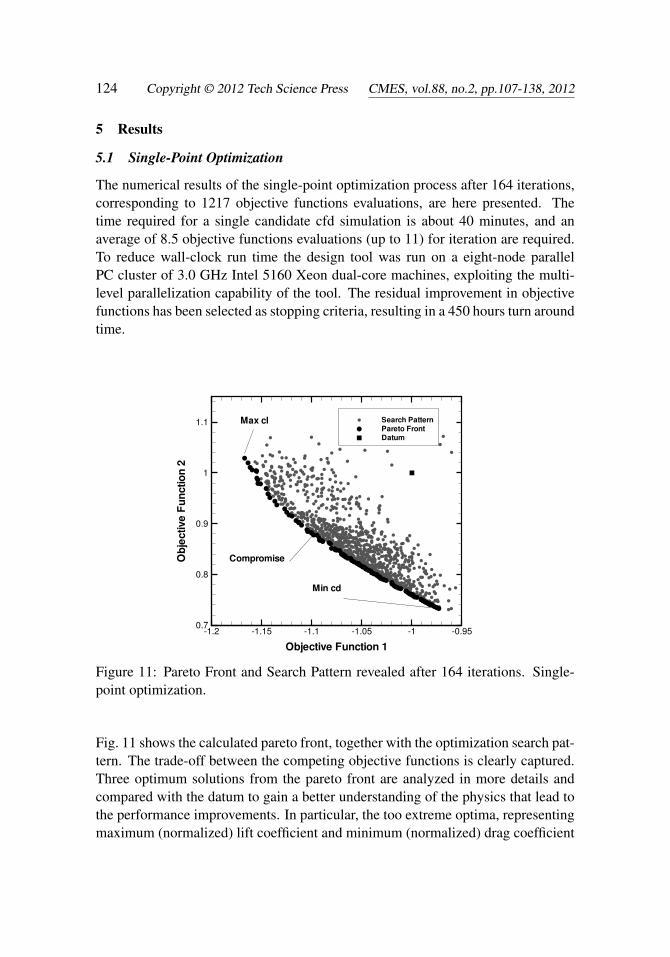
The numerical results of the single-point optimization process after 164 iterations,corresponding to 1217 objective functions evaluations, are here presented. Thetime required for a single candidate cfd simulation is about 40 minutes, and anaverage of 8.5 objective functions evaluations (up to 11) for iteration are required.To reduce wall-clock run time the design tool was run on a eight-node parallelPC cluster of 3.0 GHz Intel 5160 Xeon dual-core machines, exploiting the multi-level parallelization capability of the tool. The residual improvement in objectivefunctions has been selected as stopping criteria, resulting in a 450 hours turn aroundtime.
Objective Function 1
ObjectiveFunction2
1.2 1.15 1.1 1.05 1 0.950.7
0.8
0.9
1
1.1 Search Pattern
Pareto Front
Datum
Max cl
Compromise
Min cd
Figure 11: Pareto Front and Search Pattern revealed after 164 iterations. Single-point optimization.
Fig. 11 shows the calculated pareto front, together with the optimization search pat-tern. The trade-off between the competing objective functions is clearly captured.Three optimum solutions from the pareto front are analyzed in more details andcompared with the datum to gain a better understanding of the physics that lead tothe performance improvements. In particular, the too extreme optima, representingmaximum (normalized) lift coefficient and minimum (normalized) drag coefficient
High Lift MOTS Optimization 125
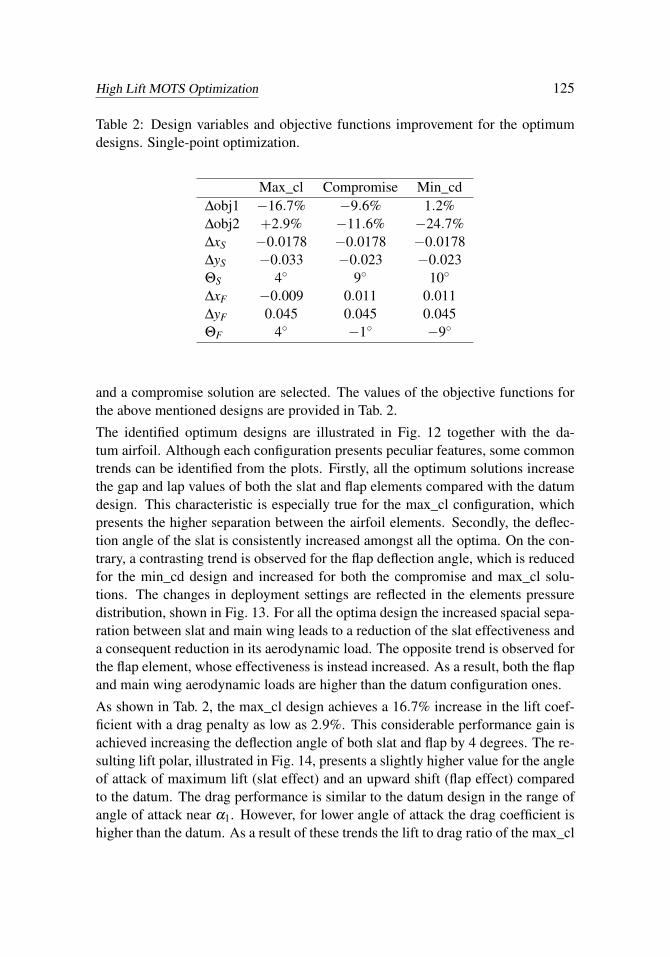
Table 2: Design variables and objective functions improvement for the optimumdesigns. Single-point optimization.
Max_cl Compromise Min_cd∆obj1 −16.7% −9.6% 1.2%∆obj2 +2.9% −11.6% −24.7%∆xS −0.0178 −0.0178 −0.0178∆yS −0.033 −0.023 −0.023ΘS 4◦ 9◦ 10◦
∆xF −0.009 0.011 0.011∆yF 0.045 0.045 0.045ΘF 4◦ −1◦ −9◦
and a compromise solution are selected. The values of the objective functions forthe above mentioned designs are provided in Tab. 2.
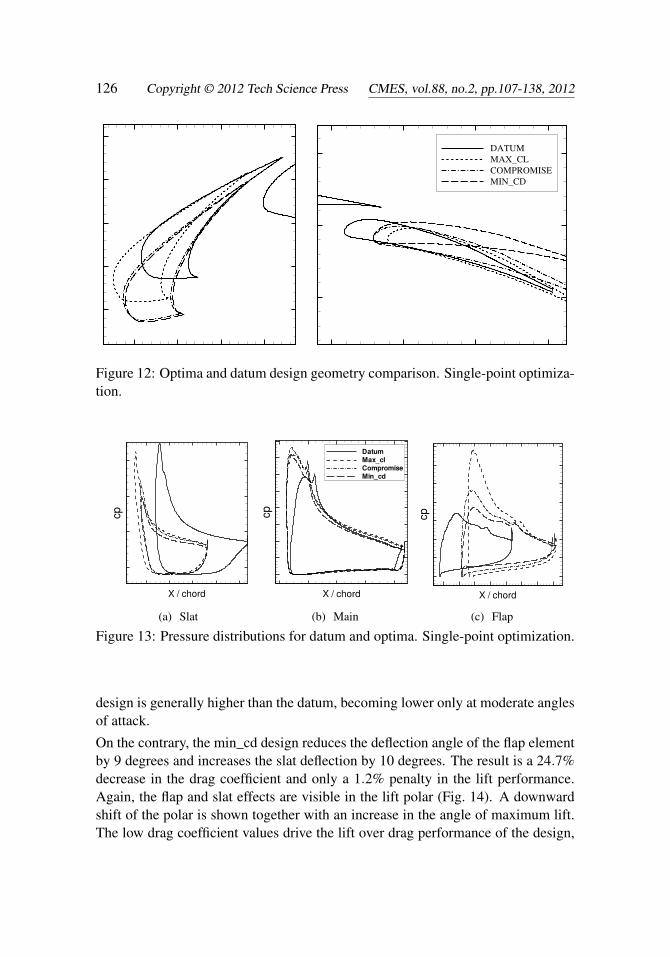
The identified optimum designs are illustrated in Fig. 12 together with the da-tum airfoil. Although each configuration presents peculiar features, some commontrends can be identified from the plots. Firstly, all the optimum solutions increasethe gap and lap values of both the slat and flap elements compared with the datumdesign. This characteristic is especially true for the max_cl configuration, whichpresents the higher separation between the airfoil elements. Secondly, the deflec-tion angle of the slat is consistently increased amongst all the optima. On the con-trary, a contrasting trend is observed for the flap deflection angle, which is reducedfor the min_cd design and increased for both the compromise and max_cl solu-tions. The changes in deployment settings are reflected in the elements pressuredistribution, shown in Fig. 13. For all the optima design the increased spacial sepa-ration between slat and main wing leads to a reduction of the slat effectiveness anda consequent reduction in its aerodynamic load. The opposite trend is observed forthe flap element, whose effectiveness is instead increased. As a result, both the flapand main wing aerodynamic loads are higher than the datum configuration ones.
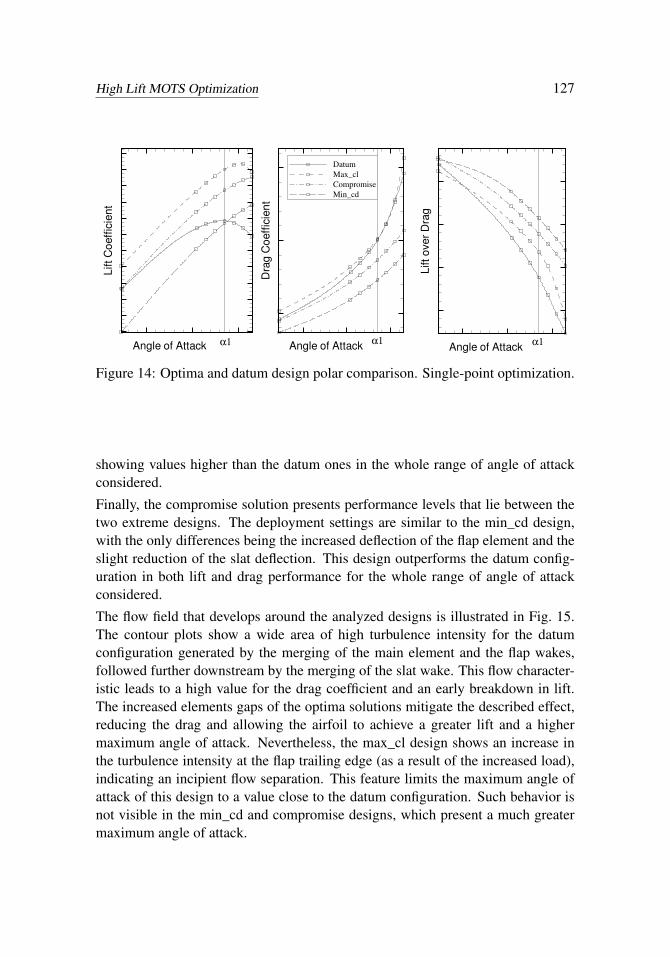
As shown in Tab. 2, the max_cl design achieves a 16.7% increase in the lift coef-ficient with a drag penalty as low as 2.9%. This considerable performance gain isachieved increasing the deflection angle of both slat and flap by 4 degrees. The re-sulting lift polar, illustrated in Fig. 14, presents a slightly higher value for the angleof attack of maximum lift (slat effect) and an upward shift (flap effect) comparedto the datum. The drag performance is similar to the datum design in the range ofangle of attack near α1. However, for lower angle of attack the drag coefficient ishigher than the datum. As a result of these trends the lift to drag ratio of the max_cl
126 Copyright © 2012 Tech Science Press CMES, vol.88, no.2, pp.107-138, 2012
DATUM
MAX_CL
COMPROMISE
MIN_CD
Figure 12: Optima and datum design geometry comparison. Single-point optimiza-tion.
X / chord
cp
(a) Slat
X / chord
cp
Datum
Max_cl
Compromise
Min_cd
(b) Main
X / chord
cp
(c) Flap
Figure 13: Pressure distributions for datum and optima. Single-point optimization.
design is generally higher than the datum, becoming lower only at moderate anglesof attack.
On the contrary, the min_cd design reduces the deflection angle of the flap elementby 9 degrees and increases the slat deflection by 10 degrees. The result is a 24.7%decrease in the drag coefficient and only a 1.2% penalty in the lift performance.Again, the flap and slat effects are visible in the lift polar (Fig. 14). A downwardshift of the polar is shown together with an increase in the angle of maximum lift.The low drag coefficient values drive the lift over drag performance of the design,
High Lift MOTS Optimization 127
Angle of Attack
LiftC
oeff
icie
nt
α1 Angle of Attack
Dra
gC
oeff
icie
nt
Datum
Max_cl
Compromise
Min_cd
α1Angle of Attack
Lifto
ver
Dra
g
α1
Figure 14: Optima and datum design polar comparison. Single-point optimization.
showing values higher than the datum ones in the whole range of angle of attackconsidered.
Finally, the compromise solution presents performance levels that lie between thetwo extreme designs. The deployment settings are similar to the min_cd design,with the only differences being the increased deflection of the flap element and theslight reduction of the slat deflection. This design outperforms the datum config-uration in both lift and drag performance for the whole range of angle of attackconsidered.
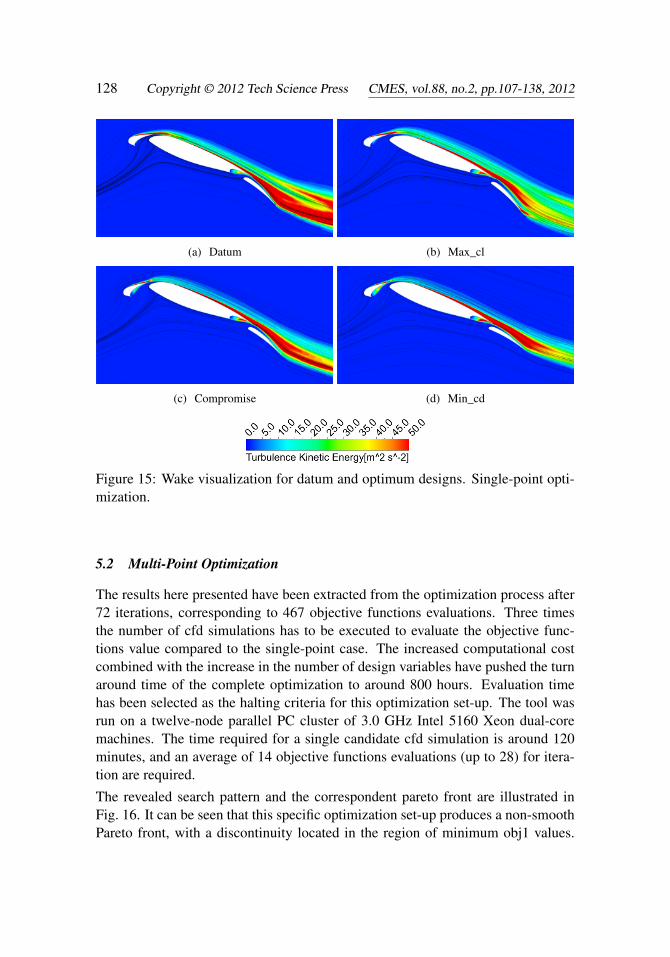
The flow field that develops around the analyzed designs is illustrated in Fig. 15.The contour plots show a wide area of high turbulence intensity for the datumconfiguration generated by the merging of the main element and the flap wakes,followed further downstream by the merging of the slat wake. This flow character-istic leads to a high value for the drag coefficient and an early breakdown in lift.The increased elements gaps of the optima solutions mitigate the described effect,reducing the drag and allowing the airfoil to achieve a greater lift and a highermaximum angle of attack. Nevertheless, the max_cl design shows an increase inthe turbulence intensity at the flap trailing edge (as a result of the increased load),indicating an incipient flow separation. This feature limits the maximum angle ofattack of this design to a value close to the datum configuration. Such behavior isnot visible in the min_cd and compromise designs, which present a much greatermaximum angle of attack.
128 Copyright © 2012 Tech Science Press CMES, vol.88, no.2, pp.107-138, 2012
(a) Datum (b) Max_cl
(c) Compromise (d) Min_cd
Figure 15: Wake visualization for datum and optimum designs. Single-point opti-mization.
5.2 Multi-Point Optimization
The results here presented have been extracted from the optimization process after72 iterations, corresponding to 467 objective functions evaluations. Three timesthe number of cfd simulations has to be executed to evaluate the objective func-tions value compared to the single-point case. The increased computational costcombined with the increase in the number of design variables have pushed the turnaround time of the complete optimization to around 800 hours. Evaluation timehas been selected as the halting criteria for this optimization set-up. The tool wasrun on a twelve-node parallel PC cluster of 3.0 GHz Intel 5160 Xeon dual-coremachines. The time required for a single candidate cfd simulation is around 120minutes, and an average of 14 objective functions evaluations (up to 28) for itera-tion are required.
The revealed search pattern and the correspondent pareto front are illustrated inFig. 16. It can be seen that this specific optimization set-up produces a non-smoothPareto front, with a discontinuity located in the region of minimum obj1 values.

High Lift MOTS Optimization 129
Objective Function 1
ObjectiveFunction2
1.1 1
1
2
3
Search Pattern
Pareto front
Datum
Min obj1
Min obj2
Figure 16: Pareto front and Search Pattern revealed after 72 iterations. Multi-pointoptimization.
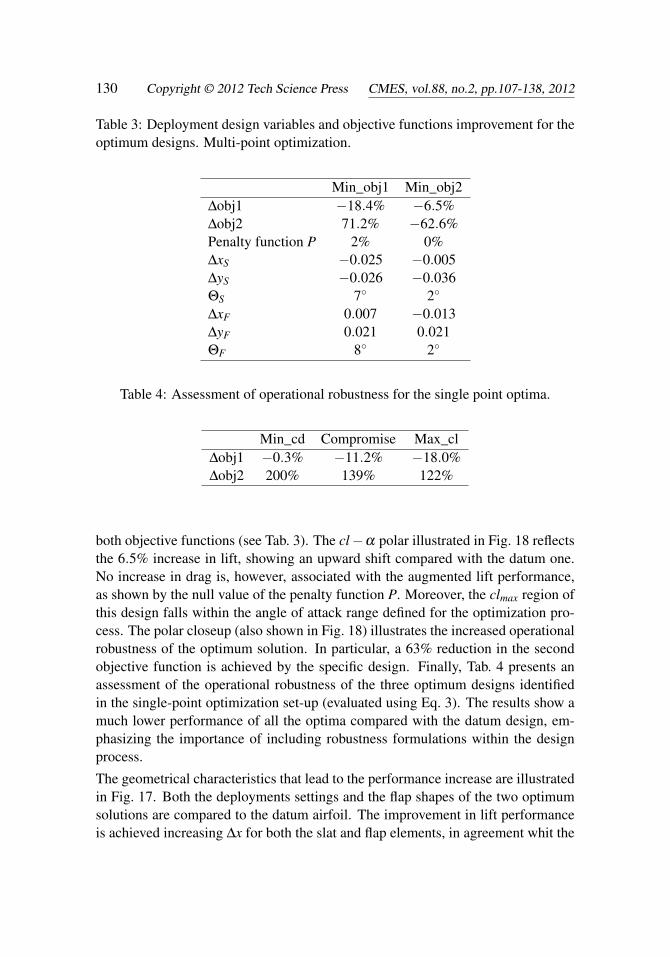
Furthermore, a much higher scatter is found in the Pareto front in comparison withthe single-point results. These characteristics reflect the increased complexity in-troduced in both the design space and objective functions definition. Nonetheless,the MOTS optimization algorithm has been able to identify several optimum de-signs that improve both objective functions values.
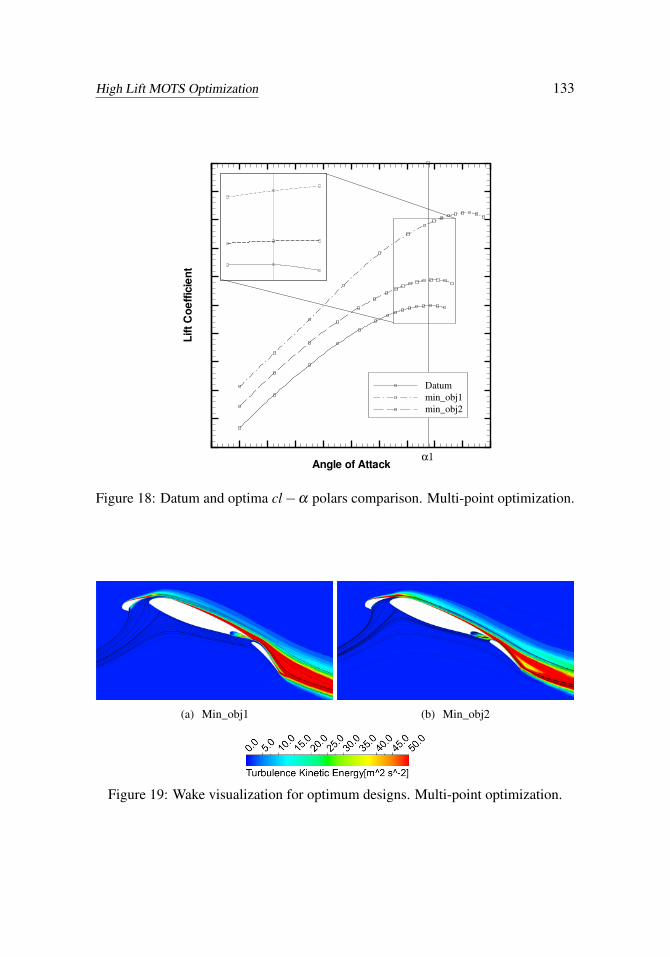
The two extreme optimum solutions from the revealed Pareto front, indicated asmin_obj1 and min_obj2, are analyzed in details. The values of the deployment set-tings for the two optima are reported in Tab. 3, together with the percentage increasein the objective functions. An 18% increase in lift performance is achieved by themin_obj1 design, with a negligible increase in aerodynamic drag (only a 2% valuefor the penalty function P). However, for the same design, the value of the secondobjective function is 80% higher than the datum configuration. This behavior canbe explained considering the evaluated cl−α polars illustrated in Fig. 18. As it canbe seen from the plot, the min_obj1 design presents a higher αclmax, which falls be-yond the angle of attack range defined for the optimization process. Therefore, themonotonically increasing segment of the lift curve is used for the evaluation of theobjective functions, leading to very different values for the three lift coefficients atα1−1◦, α1, and α1 +1◦. The min_obj2 design, instead, shows an improvement in
130 Copyright © 2012 Tech Science Press CMES, vol.88, no.2, pp.107-138, 2012
Table 3: Deployment design variables and objective functions improvement for theoptimum designs. Multi-point optimization.
Min_obj1 Min_obj2∆obj1 −18.4% −6.5%∆obj2 71.2% −62.6%Penalty function P 2% 0%∆xS −0.025 −0.005∆yS −0.026 −0.036ΘS 7◦ 2◦
∆xF 0.007 −0.013∆yF 0.021 0.021ΘF 8◦ 2◦
Table 4: Assessment of operational robustness for the single point optima.
Min_cd Compromise Max_cl∆obj1 −0.3% −11.2% −18.0%∆obj2 200% 139% 122%
both objective functions (see Tab. 3). The cl−α polar illustrated in Fig. 18 reflectsthe 6.5% increase in lift, showing an upward shift compared with the datum one.No increase in drag is, however, associated with the augmented lift performance,as shown by the null value of the penalty function P. Moreover, the clmax region ofthis design falls within the angle of attack range defined for the optimization pro-cess. The polar closeup (also shown in Fig. 18) illustrates the increased operationalrobustness of the optimum solution. In particular, a 63% reduction in the secondobjective function is achieved by the specific design. Finally, Tab. 4 presents anassessment of the operational robustness of the three optimum designs identifiedin the single-point optimization set-up (evaluated using Eq. 3). The results show amuch lower performance of all the optima compared with the datum design, em-phasizing the importance of including robustness formulations within the designprocess.
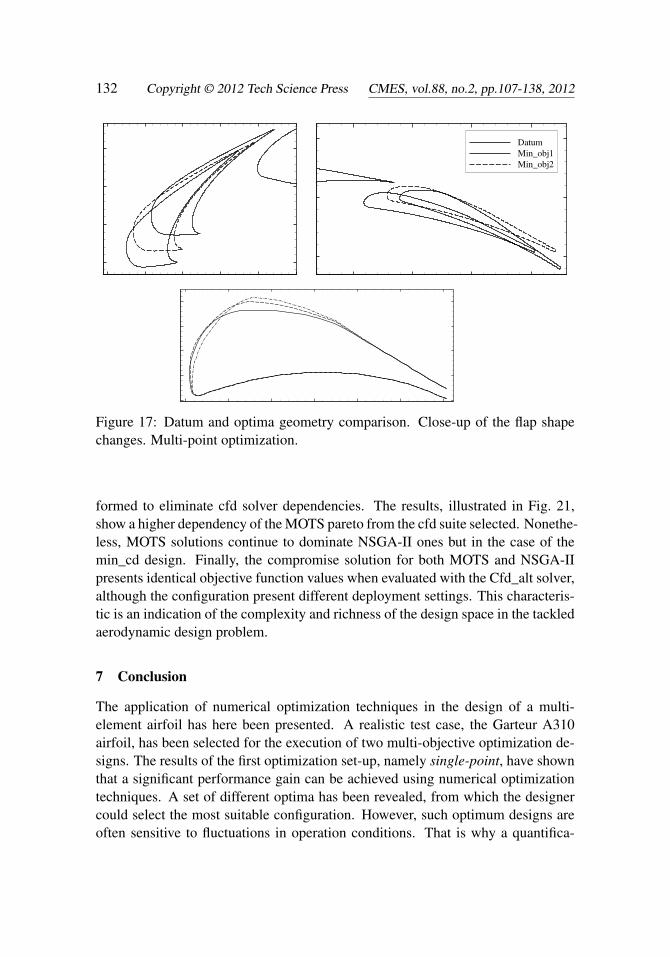
The geometrical characteristics that lead to the performance increase are illustratedin Fig. 17. Both the deployments settings and the flap shapes of the two optimumsolutions are compared to the datum airfoil. The improvement in lift performanceis achieved increasing ∆x for both the slat and flap elements, in agreement whit the
High Lift MOTS Optimization 131
results obtained in the single-point optimization. On the contrary, a reduction ofthe variable ∆yF is observed for both the optima. This translates, for the min_obj2design, to the positioning of the flap near the trailing edge of the main element.Furthermore, the flap geometries of the two optima show common features: anincrease in the element thickness at around 25% chord location and a reduction inthe leading edge radius. It is important to point out that these shape changes do notaffect the stowed configuration of the airfoil, which retains its cruise shape.
Fig. 19 illustrates the flow-field that develops around the two optimum configura-tions revealed, at the angle of attack α1. For both the designs, the reduction inthe flap lap reflects in a higher interaction of the main element wake with the flapupper surface. The airflow leaving the main element trailing edge presents a muchhigher curvature compared to the datum configuration (see Fig. 15 (a)). Such char-acteristic is emphasized by the shape of the flap element, which promotes the airto flow from the main element pressure side to the flap suction side. However, as aresult of this, the main element recirculation bubble is also increased. It is evidentthat the stall behavior of the configuration is dependent on the interaction betweenthe main element wake and the flap walls. In particular, reduced flap gap settings,characteristic of the min_obj2 design, minimize the variation of lift with angle ofattack in the near-stall region. With regard to the changes in slat settings, the samefigure shows a much greater influence on the flow-field of the min_obj1 design.The stagnation point in the main wing is shifted aft, and the recirculation bubble inthe slat cove region increases. This characteristics are reflected in the lift polar ofthe specific design, that presents a higher αclmax value.
6 MOTS algorithm performance analysis
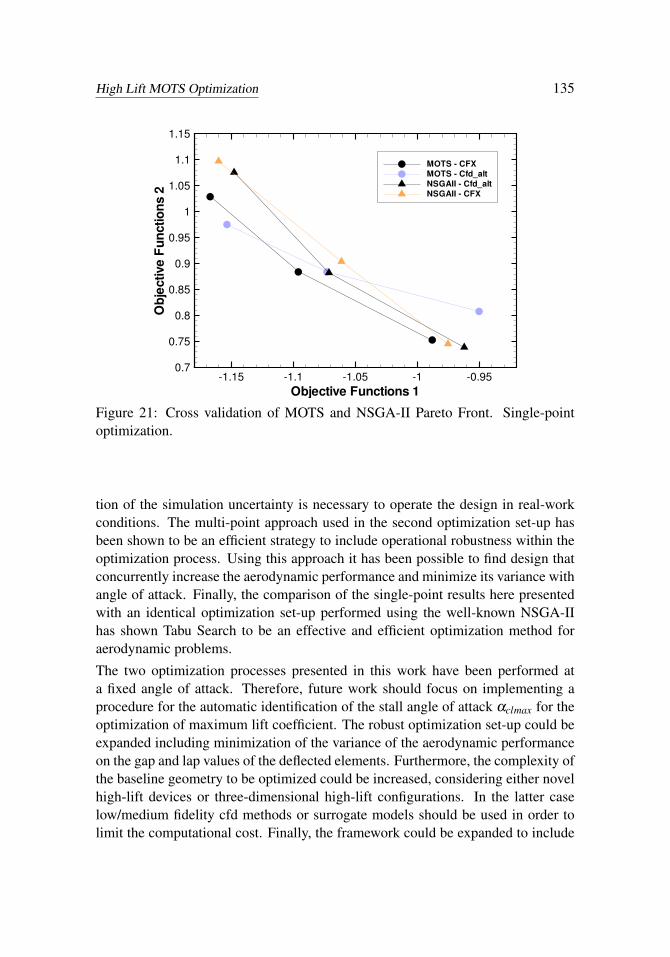
The results of the single-point optimization presented earlier have been comparedwith an identical optimization set-up performed by the authors using the well-known NSGA-II algorithm and a different cfd suite, here indicated as Cfd_alt.Tab. 5 summarizes the settings for the two optimization algorithms. The data ana-lyzed has been extracted from the two optimization frameworks at a similar stage ofthe optimization process (equal number of objective functions evaluations). Fig. 20illustrates an overlay of the two search patterns and pareto fronts revealed. It is ev-ident that the optimum solutions identified by MOTS fully dominate the NSGA-IIones, apart from a small region located at the extreme minimum obj2. Moreover,the MOTS revealed Pareto front presents a much better spread of the solutions andis more populated. This richness of the Pareto front is one of the limitation of evo-lution based algorithm, since a maximum size is implicitly set once the number ofindividuals is fixed [Kipouros, Peachey, Abramson, and Savill (2012)].
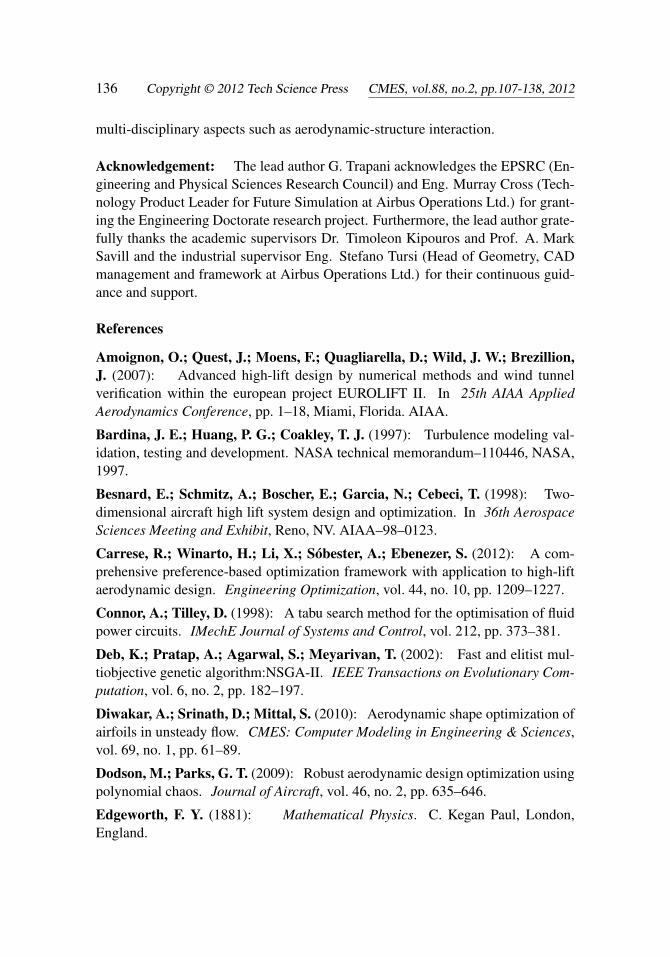
A cross validation of three optima from the respective Pareto fronts has been per-
132 Copyright © 2012 Tech Science Press CMES, vol.88, no.2, pp.107-138, 2012
Datum
Min_obj1
Min_obj2
Figure 17: Datum and optima geometry comparison. Close-up of the flap shapechanges. Multi-point optimization.
formed to eliminate cfd solver dependencies. The results, illustrated in Fig. 21,show a higher dependency of the MOTS pareto from the cfd suite selected. Nonethe-less, MOTS solutions continue to dominate NSGA-II ones but in the case of themin_cd design. Finally, the compromise solution for both MOTS and NSGA-IIpresents identical objective function values when evaluated with the Cfd_alt solver,although the configuration present different deployment settings. This characteris-tic is an indication of the complexity and richness of the design space in the tackledaerodynamic design problem.
7 Conclusion
The application of numerical optimization techniques in the design of a multi-element airfoil has here been presented. A realistic test case, the Garteur A310airfoil, has been selected for the execution of two multi-objective optimization de-signs. The results of the first optimization set-up, namely single-point, have shownthat a significant performance gain can be achieved using numerical optimizationtechniques. A set of different optima has been revealed, from which the designercould select the most suitable configuration. However, such optimum designs areoften sensitive to fluctuations in operation conditions. That is why a quantifica-
High Lift MOTS Optimization 133
Angle of Attack
LiftCoefficient
Datum
min_obj1
min_obj2
α1
Figure 18: Datum and optima cl−α polars comparison. Multi-point optimization.
(a) Min_obj1 (b) Min_obj2
Figure 19: Wake visualization for optimum designs. Multi-point optimization.
134 Copyright © 2012 Tech Science Press CMES, vol.88, no.2, pp.107-138, 2012
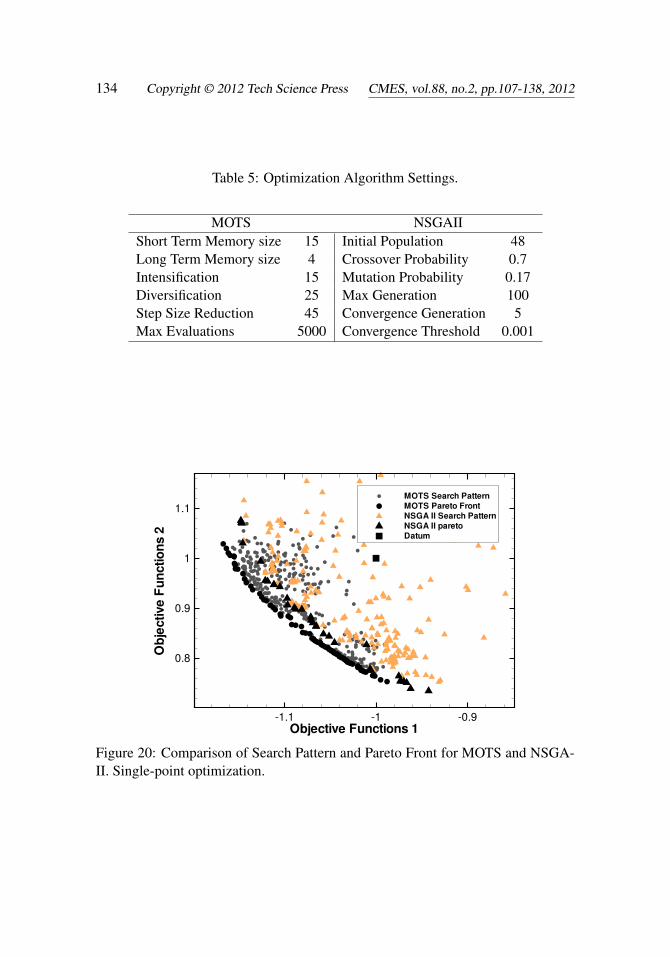
Table 5: Optimization Algorithm Settings.
MOTS NSGAIIShort Term Memory size 15 Initial Population 48Long Term Memory size 4 Crossover Probability 0.7Intensification 15 Mutation Probability 0.17Diversification 25 Max Generation 100Step Size Reduction 45 Convergence Generation 5Max Evaluations 5000 Convergence Threshold 0.001
Objective Functions 1
ObjectiveFunctions2
1.1 1 0.9
0.8
0.9
1
1.1
MOTS Search Pattern
MOTS Pareto FrontNSGA II Search Pattern
NSGA II pareto
Datum
Figure 20: Comparison of Search Pattern and Pareto Front for MOTS and NSGA-II. Single-point optimization.
High Lift MOTS Optimization 135
Objective Functions 1
ObjectiveFunctions2
1.15 1.1 1.05 1 0.950.7
0.75
0.8
0.85
0.9
0.95
1
1.05
1.1
1.15
MOTS CFX
MOTS Cfd_alt
NSGAII Cfd_altNSGAII CFX
Figure 21: Cross validation of MOTS and NSGA-II Pareto Front. Single-pointoptimization.
tion of the simulation uncertainty is necessary to operate the design in real-workconditions. The multi-point approach used in the second optimization set-up hasbeen shown to be an efficient strategy to include operational robustness within theoptimization process. Using this approach it has been possible to find design thatconcurrently increase the aerodynamic performance and minimize its variance withangle of attack. Finally, the comparison of the single-point results here presentedwith an identical optimization set-up performed using the well-known NSGA-IIhas shown Tabu Search to be an effective and efficient optimization method foraerodynamic problems.
The two optimization processes presented in this work have been performed ata fixed angle of attack. Therefore, future work should focus on implementing aprocedure for the automatic identification of the stall angle of attack αclmax for theoptimization of maximum lift coefficient. The robust optimization set-up could beexpanded including minimization of the variance of the aerodynamic performanceon the gap and lap values of the deflected elements. Furthermore, the complexity ofthe baseline geometry to be optimized could be increased, considering either novelhigh-lift devices or three-dimensional high-lift configurations. In the latter caselow/medium fidelity cfd methods or surrogate models should be used in order tolimit the computational cost. Finally, the framework could be expanded to include
136 Copyright © 2012 Tech Science Press CMES, vol.88, no.2, pp.107-138, 2012
multi-disciplinary aspects such as aerodynamic-structure interaction.
Acknowledgement: The lead author G. Trapani acknowledges the EPSRC (En-gineering and Physical Sciences Research Council) and Eng. Murray Cross (Tech-nology Product Leader for Future Simulation at Airbus Operations Ltd.) for grant-ing the Engineering Doctorate research project. Furthermore, the lead author grate-fully thanks the academic supervisors Dr. Timoleon Kipouros and Prof. A. MarkSavill and the industrial supervisor Eng. Stefano Tursi (Head of Geometry, CADmanagement and framework at Airbus Operations Ltd.) for their continuous guid-ance and support.
References
Amoignon, O.; Quest, J.; Moens, F.; Quagliarella, D.; Wild, J. W.; Brezillion,J. (2007): Advanced high-lift design by numerical methods and wind tunnelverification within the european project EUROLIFT II. In 25th AIAA AppliedAerodynamics Conference, pp. 1–18, Miami, Florida. AIAA.
Bardina, J. E.; Huang, P. G.; Coakley, T. J. (1997): Turbulence modeling val-idation, testing and development. NASA technical memorandum–110446, NASA,1997.
Besnard, E.; Schmitz, A.; Boscher, E.; Garcia, N.; Cebeci, T. (1998): Two-dimensional aircraft high lift system design and optimization. In 36th AerospaceSciences Meeting and Exhibit, Reno, NV. AIAA–98–0123.
Carrese, R.; Winarto, H.; Li, X.; Sóbester, A.; Ebenezer, S. (2012): A com-prehensive preference-based optimization framework with application to high-liftaerodynamic design. Engineering Optimization, vol. 44, no. 10, pp. 1209–1227.
Connor, A.; Tilley, D. (1998): A tabu search method for the optimisation of fluidpower circuits. IMechE Journal of Systems and Control, vol. 212, pp. 373–381.
Deb, K.; Pratap, A.; Agarwal, S.; Meyarivan, T. (2002): Fast and elitist mul-tiobjective genetic algorithm:NSGA-II. IEEE Transactions on Evolutionary Com-putation, vol. 6, no. 2, pp. 182–197.
Diwakar, A.; Srinath, D.; Mittal, S. (2010): Aerodynamic shape optimization ofairfoils in unsteady flow. CMES: Computer Modeling in Engineering & Sciences,vol. 69, no. 1, pp. 61–89.
Dodson, M.; Parks, G. T. (2009): Robust aerodynamic design optimization usingpolynomial chaos. Journal of Aircraft, vol. 46, no. 2, pp. 635–646.
Edgeworth, F. Y. (1881): Mathematical Physics. C. Kegan Paul, London,England.
High Lift MOTS Optimization 137
Eyi, S.; Lee, K. D.; Rogers, S. E.; Kwak, D. (1996): High-lift design opti-mization using navier-stokes equations. Journal of Aircraft, vol. 33, no. 3, pp.499–504.
Fejtek, I. (1997): Summary of code validation results for a multiple elementairfoil test case. In Proceedings of the 28th AIAA Fluid Dynamics Conference, pp.1–15, Snowmass Village, CO. AIAA–97–1932.
Flaig, A.; Hilbig, R. (1993): High-lift design for large civil aircraft. AGARD CP515, 1993.
Ghisu, T.; Parks, G. T.; Jarrett, J. P.; Clarkson, P. J. (2011): An integratedsystem for the aerodynamic design of compression systems: part II: Application.Journal of Turbomachinery, vol. 133, no. 1, pp. 011012.
Greener by Design Science and Technology Sub-Group (2005): Mitigating theenvironmental impact of aviation: Opportunities and priorities. Technical report,Royal Aeronautical Society, 2005.
Harvey, S. A. (2002): The design optimisation of turbomachinery blade rows.PhD thesis, Cambridge University, 2002.
Huyse, L.; Padula, S. L.; Lewis, M. R.; Wu, L. (2002): Probabilistic approachto free-form airfoil shape optimization under uncertainty. AIAA Journal, vol. 40,no. 9, pp. 1764–1772.
Jaeggi, D. M.; Parks, G. T.; Kipouros, T.; Clarkson, P. J. (2008): The de-velopment of a multi-objective tabu search algorithm for continuous optimizationproblems. European Journal of Operational Research, vol. 185, pp. 1192–1212.
Kanazaki, M.; Tanaka, K.; Jeong, S.; Yamamoto, K. (2007): Multi-objectiveaerodynamic optimization of elements’ setting for high-lift airfoil using krigingmodel. Journal of Aircraft, vol. 44, no. 4, pp. 854–867.
Kim, S.; Alonso, J. J.; Jameson, A. (2002): Design optimization of high-lift con-figurations using a viscous continuous adjoint method. AIAA–2002-0844, AIAA,2002.
Kipouros, T. (2006): Multi-Objective Aerodynamic Design Optimization. PhDthesis, Cambridge University, 2006.
Kipouros, T.; Jaeggi, D. M.; Dawes, W. N.; Parks, G. T.; Savill, A. M.; Clark-son, P. J. (2008): Biobjective design optimization for axial compressors usingtabu search. AIAA Journal, vol. 46 (3), pp. 701–711.
Kipouros, T.; Jaeggi, D. M.; Dawes, W. N.; Parks, G. T.; Savill, A. M.; Clark-son, P. J. (2008): Insight into high-quality aerodynamic design spaces through
138 Copyright © 2012 Tech Science Press CMES, vol.88, no.2, pp.107-138, 2012
multi-objective optimization. CMES: Computer Modeling in Engineering and Sci-ences, vol. 37, no. 1, pp. 1–44.
Kipouros, T.; Peachey, T.; Abramson, D.; Savill, A. M. (2012): Enhancingand developing the practical optimisation capabilities and intelligence of automaticdesign software. In 8th AIAA Multi-Disciplinary Design Optimization SpecialistConference, Honolulu, Hawaii. AIAA–2012–1677.
Kroll, N.; Gauger, N. R.; Brezillon, J.; Dwight, R.; Fazzolari, A.; Vollmer,D.; Becker, K.; Barnewitz, H.; Schulz, V.; Hazra, S. (2007): Flow simulationand shape optimization for aircraft design. Journal of Computational and appliedmathematics, vol. 203, pp. 397–411.
Li, F.; Li, G.; Sun, G.; Luo, Z.; Zhang, Z. (2010): Multi-disciplinary optimiza-tion for multi-objective uncertainty design of thin walled beams. CMES: ComputerModeling in Engineering & Sciences, vol. 19, no. 1, pp. 37–56.
Lian, Y. S.; Liou, M. S. (2005): Mining of data from evolutionary algorithmsfor improving design optimization. CMES: Computer Modeling in Engineering &Sciences, vol. 8, no. 1, pp. 61–67.
Lindblad, I. A. A.; de Cock, K. M. J. (1999): Cfd prediction of maximum lift of a2d high lift configuration. In Proceedings of the 17th AIAA Applied AerodynamicsConference, pp. 1–13, Norfolk, VA. AIAA–99-3180.
Manie, F.; Piccini, O.; Ray, J. P. (1989): Test report of the 2d model m1 inthe onera f1 wind tunnel. GARTEUR high lift Action Group AD (AG-08) TP041,GARTEUR, 1989.
Murayama, M.; Yamamoto, K. (2005): Validation of flows on high-lift config-urations by structured and unstructured mesh method. In 43rd AIAA AerospaceScience Meeting and Exhibit, pp. 1–15, Reno, Nevada. AIAA 2005-1226.
Nemec, M.; Zingg, D. W.; Pulliam, T. H. (2004): Multipoint and multiobjectiveaerodynamic shape optimization. AIAA Journal 6, AIAA, 2004.
Pareto, V. (1896): Cours D’Economie Politique, volume I and II. F. Rouge,Lasusanne.
Rudnik, K.; Eliasson, P.; Perraud, J. (2005): Evaluation of cfd methods fortransport aircraft high lift systems. The Aeronautical Journal, vol. 109, pp. 53–64.
Rudolph, P. K. C. (1996): High-lift systems on commercial subsonic airliners.NASA cr–4746, NASA, 1996.
Rumsey, C. L.; Ying, S. X. (2002): Prediction of high lift: review of present cfdcapability. Progress in Aerospace Sciences, vol. 38, pp. 145–180.

High Lift MOTS Optimization 139
Sederberg, T. W.; Parry, S. R. (1986): Free-form deformation of solid geometricmodels. SIGGRAPH, vol. 20, no. 4.
Smith, A. M. O. (1975): High-lift aerodynamics. Journal of Aircraft, vol. 12, no.6, pp. 501–530.
Srinath, D. N.; Mittal, S.; Manek, V. (2009): Multi-point shape optimization ofairfoils at low reynolds numbers. CMES: Computer Modeling in Engineering &Sciences, vol. 51, no. 2, pp. 169–188.
van Dam, C. P. (2002): The aerodynamic design of multi-element high-lift sys-tems for transport airplanes. Progress in Aerospace Sciences, vol. 38, pp. 101–144.
Walters, R. W.; Huyse, L. (2002): Uncertainty analysis for fluid mechanics withapplications. NASA CR–2002–211449, NASA, 2002.
Wild, J. W. (1998): Direct optimization of multi-element-airfoil for high-liftusing navier-stokes equations. In 4th European Computational Fluid DynamicsConference Part1, pp. 383–390, Athens, Greece. John Wiley and Sons Ltd.
Wild, J. W. (2008): Multi-objective constrained optimization in aerodynamic de-sign of high-lift system. International Journal of Computational Fluid Dynamics,vol. 22, no. 3, pp. 153–168.
