the demography of inequality in the united states november 2014 vol. 69, no. 2 population reference...
TRANSCRIPT

www.prb.org
NOVEMBER 2014
VOL. 69, NO. 2
POPULATION REFERENCE BUREAU
THE DEMOGRAPHY OF INEQUALITY IN THE UNITED STATES
BY MARK MATHER AND BETH JAROSZ
Po
pulatio
n B
ulletin

ABOUT THE AUTHORS
MARK MATHER is associate vice president in U.S. Programs at the Population Reference Bureau. BETH JAROSZ is a research associate in U.S. Programs at PRB.
POPULATION REFERENCE BUREAU
The Population Reference Bureau INFORMS people around the world about population, health, and the environment, and EMPOWERS them to use that information to ADVANCE the well-being of current and future generations.
OFFICERS
Margaret Neuse, Chair of the Board Independent Consultant, Washington, D.C.
Stanley Smith, Vice Chair of the Board Professor of Economics (emeritus) and Director, Population Program, Bureau of Economic and Business Research, University of Florida, Gainesville
Elizabeth Chacko, Secretary of the Board Associate Professor of Geography and International Affairs, The George Washington University, Washington, D.C.
Richard F. Hokenson, Treasurer of the Board Partner and Managing Director, Global Demographics, International Strategy & Investment, New York.
Jeffrey Jordan, President and Chief Executive Officer Population Reference Bureau, Washington, D.C.
TRUSTEES
Christine A. Bachrach, Research Professor, Department of Sociology and Maryland Population Research Center, University of Maryland, College Park
Bert T. Edwards, Retired Partner, Arthur Andersen LLP, and former CFO, U.S. State Department, Washington, D.C.
Parfait M. Eloundou-Enyegue, Professor of Development Sociology and Demography, Cornell University, and Associate Director, Cornell Population Program, Ithaca, New York
Robert M. Groves, Provost, Georgetown University, and Gerard Campbell Professor in the Department of Mathematics and Statistics and the Department of Sociology, Washington, D.C.
Susan E. McGregor, Assistant Professor of Journalism, Columbia University, and Assistant Director, Tow Center of Digital Journalism, New York
Linda J. Waite, Lucy Flower Professor in Urban Sociology, University of Chicago
Carolyn L. West, Senior Vice President, Public Finance, PNC Bank N.A., Washington, D.C.
Michael Wright, Former Senior Fellow and Managing Director, Coastal East Africa Program, World Wildlife Fund, Washington, D.C.
ACKNOWLEDGMENTS
The authors would like to acknowledge the valuable contributions of Linda Jacobsen who reviewed this report and produced the poverty projections, and Rena Linden who provided research assistance. We also acknowledge the helpful comments of Timothy Smeeding and David Johnson on an earlier draft of this report.
The Population Bulletin is published twice a year and distributed to members of the Population Reference Bureau. Population Bulletins are also available for $7 each (discounts for bulk orders). To become a PRB member or to order PRB materials, contact PRB, 1875 Connecticut Ave., NW, Suite 520, Washington, DC 20009-5728; Tel.: 800-877-9881; Fax: 202-328-3937; E-mail: [email protected]; Website: www.prb.org.
The suggested citation, if you quote from this publication, is: Mark Mather and Beth Jarosz, “The Demography of Inequality in the United States,” Population Bulletin 69, no. 2 (2014). For permission to reproduce portions from the Population Bulletin, write to PRB: Attn: Permissions; or email: [email protected].
Cover photo: polygraphus/Pond5
© 2014 Population Reference Bureau. All rights reserved.

www.prb.org POPULATION BULLETIN 69.2 2014 1
NOVEMBER 2014
VOL. 69, NO. 2
THE DEMOGR APHY OF INEQUALIT Y IN THE UNITED STATES
POPULATION REFERENCE BUREAU
Population Bulletin
INTRODUCTION ..........................................................................................2
Box 1. Measuring Inequality ...........................................................3
THE BACKDROP: RISING INEQUALITY ....................................................3
Figure 1. Inequality Has Increased Steadily While the Poverty Rate Has Fluctuated .......................................................................3Table. Income Inequality Is High in the U.S. Compared With Other Developed Countries ............................................................4
WHERE POVERTY AND INEQUALITY INTERSECT ....................................4
Figure 2. Poverty and Inequality Have Increased in Areas of Rapid Population Growth, Especially in the South ........................... 5Figure 3. Poverty and Inequality Intersect in a Growing Number of U.S. Counties .............................................................................6
THE GENERATIONAL DIVIDE .......................................................................7
Figure 4. There Is a Persistent Poverty Gap Between Children and Older Americans ......................................................................6Box 2. The Growing Owner/Renter Gap .........................................7Figure 5. Income Among Older Americans Is Increasing, Narrowing the Gap Between Generations .......................................8
PERSISTENT RACIAL/ETHNIC GAPS .........................................................8
Box 3. Projecting U.S. Poverty .......................................................9Figure 6. There Is a Persistent Racial/Ethnic Gap in U.S. Poverty Rates .................................................................................9Figure 7. Wealth Is Nearly 18 Times Higher Among White Households, Compared With Black Households ........................... 10
WOMEN MAKING PROGRESS, BUT GAPS REMAIN ...............................10
Figure 8. More Than Half of Young Single Women With Children Are Poor ......................................................................... 11
EDUCATION: THE GREAT EQUALIZER? ...................................................12
Figure 9. Just 5% of College Graduates Are Poor, Compared With 28% of Those Without a High School Diploma ...................... 12
LOOKING AHEAD ......................................................................................13
REFERENCES ...........................................................................................14
TABLE OF CONTENTS
BY MARK MATHER AND BETH JAROSZ

POPULATION BULLETIN 69.2 20142 www.prb.org
THE DEMOGRAPHY OF INEQUALITY
IN THE UNITED STATES
Investments in
EDUCATION
are key to reducing disparities between population groups.
The share of people living in counties
with high levels of poverty and inequality.
Eliminating racial/ethnic poverty gaps would reduce the number
of children in poverty by 45% in 2050.
SINCE
1967,poverty rates
have fluctuated but income inequality has increased steadily.
Population aging, growing racial/ethnic diversity, changing family structure, and regional population shifts are changing the U.S. demographic landscape and exacerbating differences between the haves and the have-nots.
The United States is undergoing rapid demographic change. Baby boomers, who are mostly non-Hispanic white, have started to reach retirement age, exit the labor force, and collect Social Security benefits. But young adults, who are just starting to enter the workforce, look very different than their parents’ and grandparents’ generations. Historical trends in immigration and fertility have contributed to growing racial/ethnic diversity among young adults and their children. Families are changing, with fewer married couples and more single-parent families and cohabiting unions. And the U.S. population is shifting away from parts of the Northeast and Midwest to new areas of job growth in the South and West.
These demographic trends are occurring against a backdrop of rising inequality in the United States. Since the Great Recession, public discourse has focused primarily on the earnings of chief executives in comparison with low-wage workers. But broader measures of income inequality also show a growing gap between those at the top and those at the bottom. The Gini Index, which measures inequality across households, recently registered its first significant year-to-
year increase since 1993; and since 1967, household income inequality has increased by 20 percent.1
From a demographic perspective, these gaps matter because as groups at the bottom of the income distribution make up a growing share of the population, income inequality and poverty levels are projected to increase—even if the gaps between groups remain unchanged. If current trends continue, the U.S. income distribution will become increasingly “bimodal,” characterized by a shrinking middle class and a growing number of people at the top and bottom.
Why should we care if income inequality increases? Before the most recent recession, there was little public discussion about the gap between the rich and poor. While some argue that inequality creates economic and political instability, others point to the positive role of inequality in fostering innovation and economic growth. But the level of inequality in the United States may be reaching a tipping point.
High levels of inequality have been linked to a greater likelihood of economic boom and bust cycles, deeper recessions, and a slowdown in overall economic growth.2 Evidence from the current economic slowdown suggests that the United States is approaching, and may already have reached, a tipping point where inequality is limiting social mobility, consumer spending,
43%
A convergence of demographic trends and disparities is contributing
to a new economic reality for the U.S. population, characterized by
higher levels of poverty and inequality.

www.prb.org POPULATION BULLETIN 69.2 2014 3
U.S. economy during the past 50 years. Poverty rates have fluctuated over time, increasing during periods of job loss and decreasing when the economy recovers (see Figure 1). But since 1967, there has been a slow and steady increase in income inequality in the United States. In 2013, the national Gini Index—the most widely used measure of inequality—stood at .476, up from .463 in 2007 and .397 in 1967. A Gini value of zero means that all households have equal income, while a value of 1 means that only one household has all of the
educational attainment, and the ability of the United States to compete in the global economy.3 Unemployment peaked at 10 percent in October 2009 and still exceeds prerecession levels. Many discouraged workers have left the labor force, and young adults—especially those without college degrees—have a hard time finding secure, full-time work. Today, about 45 percent of adults are dissatisfied with “Americans’ opportunities to get ahead by working hard,” compared with just 22 percent in 2001.4
Rising poverty levels have reduced opportunities for millions of children compared with previous generations. Today, children who are born to families in the bottom fifth of the income distribution have a 36 percent chance of remaining stuck in that same income quintile when they reach adulthood. For African American children born in the bottom income quintile, the figure is 51 percent.5
In this Population Bulletin, we investigate the intersection between demography and inequality in the United States, with a focus on regional patterns and differences by age, race/ethnicity, gender, and family structure. We stress the importance of closing gaps in education to put the next generation of workers and their children on a path to succeed in the labor force and advance the U.S. economy.
The Backdrop: Rising InequalityThe poverty rate is one of the most widely reported measures of economic well-being in the United States, but rising income inequality has been a defining characteristic of the
BOX 1
Measuring InequalityInequality can be measured in many different ways, based on differences in poverty and income, wealth and assets, consumption patterns, health, and other measures of well-being. Regardless of the measure, the data generally point to rising levels of inequality in the United States. However, the choice of measures can affect conclusions about the magnitude of the increase as well as the size of the gaps between different population groups.
In this report we focus primarily on income inequality, as measured through gaps in poverty and income in the U.S. Census Bureau’s Current Population Survey and American Community Survey. The most common measures of inequality are the Gini Index and the share of aggregate income received by different subgroups of the population, often broken down by income quintile. The Census Bureau’s Gini Index—a measure of income inequality across households—is useful because it provides a long, consistent time series. However, it is limited to pretax income and does not include noncash benefits, government transfers, and tax benefits or payments that can
affect a household’s disposable income. Many researchers are looking at alternative measures of inequality that can provide a slightly different picture of disparities and change over time.
For example, inequality based on consumption patterns— spending on goods and services—is lower than inequality based on income and wealth, and while most measures of inequality showed an increase in disparities during the Great Recession, consumption inequality declined during that period.1 Levels and trends in inequality also vary depending on whether researchers have controlled for government taxes and transfers, household size, and—in the case of geographic comparisons—differences in the cost of living. Several different data sources have been used to measure trends in income inequality in the United States, including the Current Population Survey, Survey of Consumer Finance, Internal Revenue Service tax records, and the American Community Survey.2
References
1 Jonathan D. Fisher, David S. Johnson, and Timothy M. Smeeding, “Measuring the Trends in Inequality of Individuals and Families: Income and Consumption,” American Economic Review, 103, no. 3 (2013): 184-88.
2 For a comprehensive review of measures of inequality, see David S. Johnson and Timothy M. Smeeding, “Inequality Measurement,” in International Encyclopedia of the Social and Behavioral Sciences, 2d ed., ed. James D. Wright (London: Elsevier, forthcoming).
0.00
0.10
0.20
0.30
0.40
0.50
0.60
0
2
4
6
8
10
12
14
16
1967 1973 1979 1985 1991 1997 2003 2009 2013
Note: A Gini value of zero means that all households have equal income, while a value of 1 means that only one household has all of the income, so higher values are equated with greater levels of inequality.Source: U.S. Census Bureau, Current Population Survey.
Gini Index
Gini Index
Poverty Rate (%)
Poverty Rate
FIGURE 1
Inequality Has Increased Steadily While the Poverty Rate Has Fluctuated.

www.prb.org POPULATION BULLETIN 69.2 20144
income, so higher values are equated with greater levels of inequality. In 2012, the Gini Index value matched the highest level ever recorded in the United States. Another measure of inequality, based on the share of income received by the top 20 percent of households, shows a similar increase. In 2013, the top 20 percent of households controlled over half (51 percent) of all household income.
The Occupy Movement drew attention to rising income inequality in the United States with their slogan, “We are the 99%.” During the recession, income among the top 1 percent of families fell with the stock market crash and declines in earnings from capital gains. However, this decline was only temporary. By 2012, the top 1 percent of families—those with annual incomes over $394,000— controlled 22 percent of U.S. income, up from 18 percent in 2009.6
The increase in income inequality is not unique to the United States. Many other countries have seen growing income gaps—especially Estonia, France, Greece, Ireland, Japan, Slovenia, and Spain.7 But today the United States has one of the highest levels of income inequality among developed nations (see table). With an adjusted Gini Index of .38, the United States ranks just slightly below Turkey and is tied with Israel. Levels of income inequality are substantially lower in Canada (.32), France (.30), and Germany (.29).8
THE GROWING WEALTH GAP
Gaps in household net worth, or wealth, are not reported as widely as differences in income, but in some respects, wealth is a better marker of family well-being. Among more-affluent households, wealth is mainly tied up in the stock market, but for most Americans, and especially those living in lower-income families, a home is the most valuable asset they will ever own. Homeownership provides a basic source of economic security and can shield families against material hardship by providing a cushion in the case of sudden loss of income. Owning a home also contributes to residential stability, civic engagement, psychological well-being, and children’s educational success.9
In the United States, the wealth gap is larger than the income gap, sharply dividing those at the top and bottom of the economic ladder. The Great Recession led to broad, across-the-board declines in wealth, but those at the top experienced smaller declines, in relative terms, compared with those at the bottom. As a result, the level of wealth inequality in the United States increased in the aftermath of the recession. Between 2007 and 2013, average wealth among the top 5 percent of households fell by 16 percent, compared with a 43 percent decline among middle-class households at the 50th percentile. By 2013, the top 5 percent of households had an average net worth 24 times that of households at the 50th percentile ($1.36 million compared with $56,000).10
How did this wealth gap come about? During the late 1990s, median household wealth sharply increased as the stock market boomed. Stock prices declined during the early 2000s, but wealth continued to grow with the increase in home values, benefitting the middle class as well as those in more-affluent households. But in 2007, home prices dropped sharply, wiping out trillions of dollars of assets. The middle class, which had more of their wealth tied up in their homes, was hit harder by the drop in housing prices compared with wealthier households. Foreclosures hit record levels, with 3 million homes receiving foreclosure notices in 2010.11 Between 2007 and 2013, home equity fell 61 percent among homeowners in the bottom half of the wealth distribution, compared with only a 20 percent decline among the top 5 percent of households.12 In the meantime, the stock market recovered most of its losses, fueling a rapid increase in assets among the wealthiest households.
Where Poverty and Inequality IntersectLevels of income inequality depend on where you live—higher in California and parts of the Northeast and South, and lower in states in the Midwest and Mountain West. Many of the states with high levels of income inequality also have large, diverse populations and high levels of residential segregation. In 2013, only eight states had Gini indices higher than the national average—California, Connecticut, Florida, Georgia, Illinois, Louisiana, Massachusetts, and New York—but over one-third of the U.S. population (36 percent) lived in these eight states.
Note: Adjusted for taxes and government transfers.Source: Organisation for Economic Co-operation and Development (OECD), Factbook 2014 (Paris: OECD, 2014), accessed at www.oecd-ilibrary.org/economics/oecd-factbook_18147364, on Aug. 20, 2014.
Income Inequality Is High in the U.S. Compared With Other Developed Countries.
OECD COUNTRIES WITH HIGHEST GINI COEFFICIENTS GINI INDEX
Chile 0.50
Mexico 0.47
Turkey 0.41
United States 0.38
Israel 0.38
Portugal 0.34
United Kingdom 0.34
Spain 0.34
Greece 0.34
Japan 0.34

www.prb.org POPULATION BULLETIN 69.2 2014 5
Income inequality was highest in New York, where the top 20 percent of households controlled 54 percent of household income. States with the lowest levels of inequality included Alaska, Hawaii, Idaho, New Hampshire, Utah, and Wyoming.13
Since 1979, income inequality has increased in all 50 states and the District of Columbia. From 1979 to 1999, the increase in inequality was largest in California and several states in the Northeast, including Connecticut, Massachusetts, New Jersey, and New York. But since 1999, Illinois, Indiana, Montana, North Dakota, Vermont, and Wisconsin experienced the largest increases in inequality. The rise in Montana and North Dakota may be linked to the recent oil rush in those states, which boosted incomes but also led to a growing gap between higher-income workers in the oil industry and those in lower-paying jobs. The decline in unions, especially in Rust-Belt states, has also played a role in the rise in inequality. Up to three-fourths of the increase in inequality between white-collar and blue-collar men from 1978 to 2011 has been linked to the decrease in collective bargaining.14
Like inequality, poverty has increased in recent years, but at 14.5 percent, the rate is well below levels recorded 50 years ago when President Lyndon Johnson declared a war on poverty. Poverty rates have fluctuated over time, increasing during recessions and decreasing during periods of economic growth.
However, in many areas, poverty and inequality have increased in tandem in recent years. In the 1980s and 1990s, income inequality and poverty intersected primarily in Appalachia, the Deep South, and parts of California and the Southwest (see counties shaded orange in Figure 2). But during the past decade, poverty and inequality spread to new areas in Alabama, the Carolinas, Georgia, Michigan, and Tennessee. By 2008-2012, the majority of counties in the South (59 percent) had high levels of inequality combined with high poverty. In this analysis, counties are classified as “high poverty” if they have poverty rates greater than 15.4 percent—the average poverty rate across all of the counties and years. “High-inequality” counties are those with Gini indices greater than 0.43 (the average Gini Index across all counties and years). Nationwide, 37 percent of counties fell into this high-inequality/high-poverty category in 2008-2012, up from 31 percent in 1999 and 29 percent in 1989. In 2013, 136 million people (43 percent of the total U.S. population) lived in high inequality/high-poverty counties, more than twice the number of people who lived in high-inequality/high-poverty counties in 2000 (63 million).
In recent years, population growth has been fastest in areas with high inequality but low poverty, especially parts of the upper Midwest. Between 2010 and 2013, North Dakota was the fastest-growing state in the country, with a 7.6 percent increase in population. Among all high-inequality/low-poverty counties, the population increased by 2.7 percent from 2010 to 2013, compared with 2.2 percent growth in low-inequality/low-poverty counties, 2.0 percent growth in high-inequality/high-poverty counties, and just 0.5 percent growth in low-inequality/high-poverty areas.
FIGURE 2
Poverty and Inequality Have Increased in Areas of Rapid Population Growth, Especially in the South.
Source: PRB analysis of data from the U.S. Census Bureau, Decennial Census and American Community Survey; and Arizona State University, GeoDa Center for Geospatial Analysis and Computation.
No dataHigh-Inequality/High-Poverty Low-Inequality/High-Poverty
High-Inequality/Low-Poverty Low-Inequality/Low-Poverty
No data High-Inequality/High-Poverty
Low-Inequality/High-Poverty
High-Inequality/Low-Poverty
Low-Inequality/Low-Poverty

www.prb.org POPULATION BULLETIN 69.2 20146
These regional patterns also have a racial/ethnic component. African Americans and Latinos made up 29 percent of the U.S. population in 2013, but accounted for 41 percent of the population living in high-poverty/high-inequality counties, which are disproportionately located in the South and southwestern United States (see Figure 2, page 5). Many counties in the South are characterized by high poverty rates, high levels of residential segregation, and low levels of intergenerational mobility (economic outcomes for children relative to those of their parents). For example, in the Atlanta Metro area, only 4.5 percent of children growing up in the bottom income quintile reach the top income quintile as adults.15
The share of low-inequality/low-poverty counties has dropped steadily over time, from 50 percent of counties in 1989 to 44 percent of counties in 1999, to just 34 percent of counties in 2008-2012 (see Figure 3). Today, most of the remaining low-inequality/low-poverty counties are located in the upper Midwest, Mountain, Mid-Atlantic, and northeastern states.
Inequality is most often discussed in the context of lower-income families but income disparities also exist in affluent communities, dividing middle-class and high-income families. The number of high-inequality/low-poverty counties peaked in 1999 during a period of rapid economic expansion and relative economic prosperity. About 21 percent of counties were classified as high-inequality/low-poverty in 1999. By 2008-2012, the share of high-inequality/low-poverty counties had dropped to 16 percent. Many of these counties are located in high-cost metropolitan areas on the East and West coasts, but there has also been a sharp increase in inequality in oil-rich North Dakota, where poverty rates remain relatively low.16
Finally, some counties have widespread poverty but a fairly narrow gap between higher-income and lower-income families. These low-inequality/high-poverty areas, almost nonexistent in 1999, made up 13 percent of counties in 2008-2012, due to
Low-Inequality/Low-Poverty
Low-Inequality/High-Poverty
High-Inequality/Low-Poverty
High-Inequality/High-Poverty
Percent Distribution of Counties by Poverty and Inequality
50%
11%
10%
29%
44%
3%
31%
21%
34%
13%
16%
37%
1989 1999 2008-2012
FIGURE 3
Poverty and Inequality Intersect in a Growing Number of U.S. Counties.
Percent in Poverty by Age
1966 1970 1975 1980 1985 1990 1995 2000 2005 2010 2013
Ages 65 and Older
Ages 18–64
Under Age 18
10
10
14
2018
29
Source: U.S. Census Bureau, Current Population Survey.
0
5
10
15
20
25
30
Source: PRB analysis of data from the U.S. Census Bureau, Decennial Census and American Community Survey; and Arizona State University, GeoDa Center for Geospatial Analysis and Computation.
FIGURE 4
There Is a Persistent Poverty Gap Between Children and Older Americans.
www.prb.org POPULATION BULLETIN 69.2 2014 7
job losses associated with the Great Recession, especially in parts of Maine, Michigan, Missouri, and Oregon. Also included in this group are many American Indian areas, such as Buffalo County, South Dakota, which has one of the highest poverty rates in the nation (33 percent).17
The Generational DivideThe recession affected people of all ages. However, in terms of job losses and poverty, young adults and their families were disproportionately affected. Poverty among those ages 65 and older has been in a long-term decline with the expansion of Social Security and private pension systems while those in younger age groups lack the same financial protections (see Figure 4, page 6). Among children and working-age adults, poverty rates are close to all-time highs. In contrast, the poverty rate for those ages 65 and older has dropped fairly steadily over time, from 29 percent in 1966 to just 10 percent in
2013. The poverty rate for older Americans fell below the rate for children in 1974 and has remained lower since. In 2013, the child poverty rate (20 percent) was double the rate for older Americans (10 percent).18
Since the recession, young adults have had higher unemployment rates relative to those in older age groups. In September 2014, the unemployment rate for those ages 16 to 24 was 14 percent, more than three times the rate for those ages 55 to 64 (4 percent). Young adults are also more likely than those in older age groups to have been unemployed for six months or more during the recession. The result is a persistent poverty gap between younger workers and their children compared with older workers who are closer to retirement age.
Although poverty rates increased sharply during the recession, government transfers and tax credits have helped reduce the economic burden on poor and low-income families. An
BOX 2
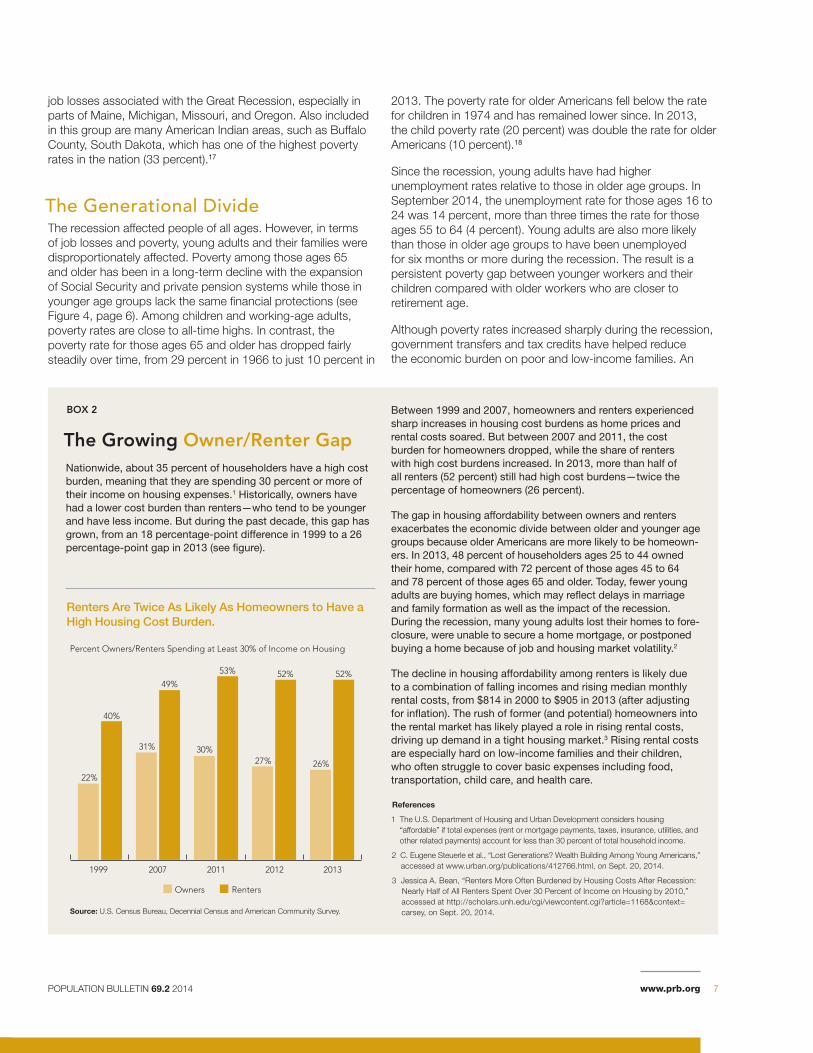
The Growing Owner/Renter GapNationwide, about 35 percent of householders have a high cost burden, meaning that they are spending 30 percent or more of their income on housing expenses.1 Historically, owners have had a lower cost burden than renters—who tend to be younger and have less income. But during the past decade, this gap has grown, from an 18 percentage-point difference in 1999 to a 26 percentage-point gap in 2013 (see figure).
Renters Are Twice As Likely As Homeowners to Have a High Housing Cost Burden.
Between 1999 and 2007, homeowners and renters experienced sharp increases in housing cost burdens as home prices and rental costs soared. But between 2007 and 2011, the cost burden for homeowners dropped, while the share of renters with high cost burdens increased. In 2013, more than half of all renters (52 percent) still had high cost burdens—twice the percentage of homeowners (26 percent).
The gap in housing affordability between owners and renters exacerbates the economic divide between older and younger age groups because older Americans are more likely to be homeown-ers. In 2013, 48 percent of householders ages 25 to 44 owned their home, compared with 72 percent of those ages 45 to 64 and 78 percent of those ages 65 and older. Today, fewer young adults are buying homes, which may reflect delays in marriage and family formation as well as the impact of the recession. During the recession, many young adults lost their homes to fore-closure, were unable to secure a home mortgage, or postponed buying a home because of job and housing market volatility.2
The decline in housing affordability among renters is likely due to a combination of falling incomes and rising median monthly rental costs, from $814 in 2000 to $905 in 2013 (after adjusting for inflation). The rush of former (and potential) homeowners into the rental market has likely played a role in rising rental costs, driving up demand in a tight housing market.3 Rising rental costs are especially hard on low-income families and their children, who often struggle to cover basic expenses including food, transportation, child care, and health care.
References
1 The U.S. Department of Housing and Urban Development considers housing “affordable” if total expenses (rent or mortgage payments, taxes, insurance, utilities, and other related payments) account for less than 30 percent of total household income.
2 C. Eugene Steuerle et al., “Lost Generations? Wealth Building Among Young Americans,” accessed at www.urban.org/publications/412766.html, on Sept. 20, 2014.
3 Jessica A. Bean, “Renters More Often Burdened by Housing Costs After Recession: Nearly Half of All Renters Spent Over 30 Percent of Income on Housing by 2010,” accessed at http://scholars.unh.edu/cgi/viewcontent.cgi?article=1168&context= carsey, on Sept. 20, 2014.
Percent Owners/Renters Spending at Least 30% of Income on Housing
Owners Renters
Source: U.S. Census Bureau, Decennial Census and American Community Survey.
31%
22%
40%
49%
30%
53%
27%
52%
26%
52%
1999 2007 2011 2012 2013

www.prb.org POPULATION BULLETIN 69.2 20148
alternative poverty measure that accounts for additional household expenses and benefits—including programs such as the Earned Income Tax Credit and SNAP/food stamps—shows that antipoverty programs are cutting poverty by nearly 50 percent, from 29 percent to 16 percent.19
Under the alternative poverty measure, the gap between age groups is much smaller—but not eliminated entirely. The Supplemental Poverty Measure (SPM) showed that, in 2013, 16.4 percent of children under age 18 were poor, compared with 15.4 percent of those 18 to 64 and 14.6 percent of those ages 65 and older.20 High out-of-pocket health care expenses, such as payments for prescription drugs, help explain the relatively high poverty rate for older Americans under this alternative measure.
Income trends are similar to poverty trends, with the biggest gains among older Americans. Since 1974, median personal income has increased fairly steadily among those ages 65 and older, while income has fluctuated for those in younger age groups (see Figure 5). These diverging trends have resulted in a crossover in income among baby boomers ages 55 to 64 compared with people ages 25 to 34. Income among the older population has increased with the expansion of Social Security benefits and—since the mid-1990s—the rising share of older Americans in the labor force.21 Many older workers have delayed retirement, partly as a response to the recent economic downturn.22
Among younger workers, income has dropped since reaching its 2000 peak. Part of this decline may reflect young adults staying in school, but there has also been a sharp increase in
young adults who are “idle”—neither employed nor in school. Among young men ages 25 to 34, 17 percent were idle in 2013, up from 14 percent in 2007, and the recent increase has been driven primarily by a decline in employment among African Americans and Latinos.23
Persistent Racial/Ethnic GapsThe U.S. population is undergoing significant racial/ethnic change, with rapidly growing Latino, Asian American, and multiracial populations. Immigration has played a key role in these racial/ethnic changes, putting the United States on a path to become “majority minority” by 2043. But the population under age 18 is projected to reach this milestone much sooner—by 2018 or 2019, depending on future levels of immigration.
Some of the fastest-growing groups—especially Latinos—are also the most vulnerable, lagging behind other groups on many measures of social and economic well-being.
The good news is that, over the long term, the economic divide between different racial/ethnic groups has narrowed. In 2013, there was a 13 percentage-point gap between the poverty rate of non-Hispanic whites (10 percent) and racial and ethnic minorities (23 percent). This represents a 7-percentage point decrease in the poverty gap since 1987, when the poverty rate for minorities was much higher, at 29 percent. While the poverty rate for whites increased slightly during this 25-year period, from 9 percent to 10 percent, the poverty rates for blacks, Latinos, and Asians declined (see Figure 6, page 9).
FIGURE 5
Income Among Older Americans Is Increasing, Narrowing the Gap Between Generations.
Median Income (2013 dollars), by Age Group
1974 1980 1985 1990 1995 2000 2005 2010 2013
35-44
25-34
45-54
55-64
65+
Source: U.S. Census Bureau, Current Population Survey.
$0
$10,000
$20,000
$30,000
$40,000
$50,000

www.prb.org POPULATION BULLETIN 69.2 2014 9
BOX 3
Projecting U.S. PovertyReducing poverty will be difficult unless the economic circumstances of blacks, Latinos, and American Indians improve. Between 1980 and 2013, the proportion of racial/ethnic minorities in the U.S. population increased from roughly 20 percent to 37 percent. By 2030, minorities are expected to make up 45 percent of the population. Based on this projection and assuming current poverty levels persist in the future, the number of people in poverty could increase to 68 million by 2050, up from 45 million in 2013 (see figure). However, if the poverty gaps
were eliminated, so that poverty rates for all racial/ethnic groups were no higher than those for non-Hispanic whites in 2013, the number of people in poverty in 2050 would drop below the level in 2013, to 44 million.
Closing poverty gaps across different racial/ethnic groups would benefit children more than working-age adults or the elderly, because of the changing racial/ethnic composition of the population under age 18. Eliminating racial/ethnic poverty gaps would reduce the number of children in poverty by 45 percent in 2050, compared with the projected number of poor children if current disparities persist until 2050. For the population ages 18 to 64, the number of poor people would be 30 percent lower in 2050 if poverty gaps were eliminated, while the number of poor people ages 65 and older would be 35 percent lower, compared with the projected number if current racial/ethnic gaps persist until 2050.
These numbers are important because of the high individual and social costs of poverty in the United States, especially among children. It is estimated that each year, nearly 4 percent of the U.S. gross domestic product ($500 billion) is spent on crime and health issues associated with childhood poverty in the United States.1
Visit PRB’s website at www.prb.org/Publications/Reports/2014/united-states-inequality.aspx to view a series of interactive “What-If” scenarios that project the number of people in poverty by age under different scenarios.
Reference
1 Harry J. Holzer et al., “The Economic Costs of Poverty in the United States: Subsequent Effects of Children Growing Up Poor,” accessed at www.irp.wisc.edu/publications/dps/pdfs/dp132707.pdf, on Aug. 5, 2014.
Ages 65+Ages 18-64<Age 18Total
Number of People in Poverty (in millions) by Age and Projection Series
Note: The “constant rates” series assume 2013 levels of poverty by race/ethnicity and age will persist through 2050. The “no inequality” series assumes that poverty rates by age for all groups will be no higher than those for non-Hispanic whites in 2013. Projections are based on the U.S. Census Bureau’s middle-series population projections.Source: PRB analysis of data from the U.S. Census Bureau.
15
45
68
44
21
12
38
26 26
4 610
2013 2050 (Constant Rates) 2050 (No Inequality)
Eliminating Poverty Gaps Would Reduce the Number of People in Poverty by 24 Million in 2050.
FIGURE 6
There Is a Persistent Racial/Ethnic Gap in U.S. Poverty Rates.
0
5
10
15
20
25
30
32
27
24
10
10
28
16
9
35
1987 1990 1995 2000 2005 2010 2013
Note: Data for American Indians are not shown because of sampling error, but the poverty rate for American Indians/Alaska Natives was estimated to be 27 percent in 2013.Source: U.S. Census Bureau, Current Population Survey. Starting in 2000, racial categories reflect those who selected only one race.
Black
Asian
White, non-Hispanic
Latino
Poverty Rates by Race/Ethnicity

www.prb.org POPULATION BULLETIN 69.2 201410
potential for growth in assets.25 Finally, although buying a home remains an important first step toward economic security, homeownership became a liability for many lower-income families during the recent recession. High interest rates, falling home prices, and the rise in foreclosures wiped out trillions of dollars of accumulated wealth.
Women Making Progress but Gaps Remain The rise in female labor force participation has transformed gender relations, changed patterns of marriage and childbearing, and is often viewed as a key indicator of women’s progress toward gender equality at home and in the workforce. Since 1970, women’s labor force participation rate has increased from 43 percent to 57 percent, while the proportion of men in the labor force declined from 80 percent to 70 percent.26 Women’s participation in the labor force has declined slightly in recent years—in part because of population aging— but the gender gap continues to shrink as more women enter the labor force relative to men.
However, there is more to gender equality than closing the labor force gap. Among those working full-time and year-round, there is still a sizeable gap between the median earnings of men ($50,033) and women ($39,157). A higher proportion of women work in lower-paid service and retail jobs, but even for the same job, women earn significantly less than men. Women make up about 46 percent of those working full-time in management, business, and finance jobs but their median earnings in those positions are only about 74 percent of men’s earnings.27 Women are also underrepresented in high-paying jobs in the natural and physical sciences, mathematics, and
The bad news is that, in the short term, the recession contributed to a growing poverty gap between Asians and whites versus blacks and Latinos, who were disproportionately affected by job losses during the economic downturn. But the gap also reflects longer-term demographic changes in the U.S. population. Baby boomers, who are mostly white, are reaching retirement age and can receive Social Security income, while young children and their families are more likely to be racial/ethnic minorities and are at a higher risk of being poor. The racial/ethnic divide between generations may contribute to a growing economic gap across different racial/ethnic groups—with an aging white population eligible for benefits that help keep them above the official poverty line, and a younger and racially diverse population entering the workforce during a period of economic instability. If current disparities persist, the number of people living in poverty is projected to increase with the rising share of lower-income racial/ethnic minorities (see Box 3, page 9).
White households are also wealthier, on average, compared with black and Latino households. Data from the Survey of Income and Program Participation show that median net worth of whites was over $110,000 in 2011, compared with just $6,300 for black households and $7,700 for Latino households (see Figure 7).
The wealth gap can be explained largely by differences in homeownership and home values between groups, as well as higher levels of private transfers of wealth (for example, through large gifts or inheritances) among whites compared with blacks and Latinos.24 With higher incomes, white families are able to purchase homes eight years earlier, on average, compared with black families, generating more equity and
FIGURE 7
Wealth Is Nearly 18 Times Higher Among White Households Compared With Black Households.
Median Net Worth, by Race/Ethnicity, 2011
Net Worth Net Worth (excluding equity in own home)
Note: Households headed by Other Races had a net worth of $19,023 (or $7,113 excluding home equity).Source: U.S. Census Bureau, Survey of Income and Program Participation, 2008 Panel, Wave 10.
$89,339
$110,500
$33,408$29,339
$6,314 $2,124
$7,683 $4,010
White, not Hispanic Asian Black Hispanic/Latino

www.prb.org POPULATION BULLETIN 69.2 2014 11
contributed to the increase in income inequality during the past several decades, but this effect was largely offset by an increase in female labor force participation, especially among single mothers.30
The gender wage gap is closing, partly because of the increase in women’s education relative to men. The proportion of women ages 25 to 29 with at least a bachelor’s degree has exceeded that of young men since 1991.31 A growing share of married women earn more money than their husbands—now 38 percent, up from 24 percent in 1987.32 The gender wage gap could improve with further reductions in gender discrimination at work and policies to help parents balance work and family responsibilities.
Government safety nets have reduced the burden of poverty for millions of lower-income families. From 1975 to 2007, aid through programs such as Food Stamps, Medicaid, and the Earned Income Tax Credit increased by 74 percent. However, married couples, older Americans, and lower middle-class families benefited disproportionately from this increase, while average benefits declined for the poorest families, especially single mothers and their children.33
In recent years, the proportion of people who are married has remained fairly stable for college graduates, but has sharply declined among those without college degrees.34 Some have argued that marriage is becoming a luxury good, reserved for men and women with better economic prospects.35 This trend is significant because marriage is associated with many benefits for families and individuals, including higher income, better health, and longer life expectancy. People with higher potential earnings and better health may be “selected” into
engineering. Women currently account for nearly half of the total U.S. labor force but only about one-fourth of scientists and engineers.
A woman’s risk of living in poverty is closely linked to her marital and family status (see Figure 8). In 2013, about 31 percent of young, unmarried women were poor, more than three times the poverty rate for young married women (9 percent). Among women with children, the poverty gap between married and single women is even larger. Over half (54 percent) of unmarried women with young children were poor in 2013—more than five times the rate for married women with young children (10 percent).
Many people assume that single mothers are poor because they are not working. But in fact, three-fourths of all single mothers are in the labor force, and single mothers have slightly higher labor force participation rates than women in married-couple families. However, not all of these single mothers in the labor force are currently employed; single mothers are more than twice as likely to be unemployed (12 percent) compared with mothers in married-couple families (5 percent); and the majority of employed single mothers—59 percent—are working in retail, service, and administrative jobs that typically provide low wages and few benefits.28
Changes in family structure have often been implicated in the overall increase in poverty and inequality in the United States during the past several decades. While the increase in single-parent households has accounted for much of the increase in child poverty in the 1970s and 1980s, changes in parents’ access to good jobs account for most of the increase in child poverty since 1993.29 The rise in single-mother families also
Women With Children Under Age 6
Women With ChildrenWomenMenTotal
Poverty Rate of Young Adults Ages 25-34 by Gender, Marital Status, and Presence of Children, 2013
Married Not Married
Source: U.S. Census Bureau, Current Population Survey.
9%9%
22%
12%9%
31%
11%
47%
10%
54%
FIGURE 8
More Than Half of Young Single Women With Children Are Poor.

www.prb.org POPULATION BULLETIN 69.2 201412
marriage, resulting in better outcomes for married couples; but most researchers agree that marriage also has an independent and positive effect on well-being.36
Education: the Great Equalizer?Changes in racial/ethnic composition, immigration, family composition, and age structure are linked to rising income inequality but they are not the primary or root causes. Increasingly, education separates those at the top from those at the bottom.
During the past several decades, incomes have risen rapidly at the top of the income distribution, driven by technological changes combined with a slowdown in the supply of highly educated workers that has increased the returns to education.37 At the same time, structural changes in the U.S. economy have reduced real income for those with less education and fewer skills. Higher-paid manufacturing jobs have been replaced by lower-paid service jobs, resulting in stagnant or declining wages for those without college degrees.38 The recession exacerbated this trend by disproportionately affecting less-educated workers.39
A persistent economic gap exists between college graduates and those without college degrees (see Figure 9). The poverty rate for adults ages 25 and older without a high school diploma fell slightly in 2013, but at 28 percent, is still double the poverty rate among high school graduates (14 percent). Just 5 percent of college graduates were poor in 2013.
In the United States, more than six out of every 10 jobs require some postsecondary education and training.40 Although there are many jobs that do not require college degrees, with
increasing globalization in a knowledge-based economy, the demand for highly educated and skilled workers in the United States will only continue to grow. For most young people, going to college is one of the most important steps they can take to become financially independent adults. College graduates have significantly higher lifetime earnings ($2.3 million) compared with those who have no education beyond high school ($1.3 million).41 College graduates are also much less likely to be unemployed and they enjoy a wide range of other social, economic, and health benefits.42 Parents who have completed college are also much more likely to have children who go to college, so the benefits of education are transferred from one generation to the next. Increasing college completion rates also boosts potential innovation, economic output, and productivity.43
In recent years, college enrollment and “persistence” rates have declined, and some policymakers and others are concerned that future generations of young adults may have less education than their parents and grandparents—a trend that could undermine economic growth and exacerbate levels of income inequality in the United States.
Recent estimates suggest that demand for college-educated workers has outstripped supply since the early 1990s, and some experts warn that educational progress could stall in the coming decades. Slower gains in college enrollment and completion are projected with the changing racial/ethnic composition of the U.S. population. A growing share of young adults are Latino, including many first- and second-generation immigrants who are less likely to graduate from high school or college compared with those in U.S.-born families. Among young adults ages 25 to 29, Latinos are the least likely to finish four years of college (16 percent), while college completion
FIGURE 9
Just 5% of College Graduates Are Poor, Compared With 28% of Those Without a High School Diploma.
Percent in Poverty Ages 25+, by Level of Education
1991 1994 1997 2000 2003 2006 2009 2013
25 28
14
11
5
10
6
3
Less Than High School
High School
Some College
Bachelor’s Degree or Higher
Source: IPUMS-CPS, University of Minnesota, www.ipums.org.
0
5
10
15
20
25
30

www.prb.org POPULATION BULLETIN 69.2 2014 13
rates are highest among Asian Americans (59 percent) and whites (40 percent).44 With the Latino population projected to continue its rapid growth, the deficit in college-educated workers may increase unless these gaps are reduced.
Lower-income families often struggle to cover the costs of education for their children, especially at the college level. Students in low-income families are more likely to be enrolled in community colleges, with fewer resources and less institutional support than students from more-affluent families. One study showed that the college completion rate for students starting at community colleges is only 18 percent, compared with a 90-percent completion rate among students at selective private colleges and universities.45
INVESTING IN EDUCATION
Investments in education are key to reducing disparities between population groups. From preschool through college, education provides necessary stepping stones for success later in life. For young children, attending preschool prior to kindergarten leads to better cognitive outcomes, social skills, and school achievement.46 Finishing high school puts children on the path to becoming productive adults. Many teen dropouts are disconnected from both school and the workforce, and they are twice as likely to be poor as their peers who are in school or working. A college degree generally leads to a good job, higher earnings, and upward mobility.
Education is also a key predictor of health and longevity. People with higher levels of education have higher earnings; live in better neighborhoods; and can afford to buy better medical care, health insurance, and healthier foods.47
In the coming decades, college completion rates will most likely continue to increase, although at a slower pace than policymakers and education advocates would like. The White House has set an ambitious goal of increasing the share of U.S. adults ages 25 to 34 with college degrees from roughly 40 percent today to 60 percent by 2020.48 However, the National Center for Education Statistics projects that the United States will fall well short of this goal.49
Policymakers can take steps to boost educational attainment by increasing tuition assistance to lower-income families, so that children growing up in these families have the same access to college as those in higher-income families; reaching out to potential college students living in remote or underserved communities, especially those in high-poverty urban and rural areas; providing child care, housing, and transportation assistance to lower-income families, so that parents can reach their own educational and occupational goals—and then pass those same aspirations and expectations on to their children; and ensuring that children in middle and high school are academically prepared for college, to create a stronger education pipeline.
Looking AheadCountries around the world are paying more attention to inequality as an indicator of social and economic well-being. According to the United Nations, it will not be possible to achieve the Millennium Development Goals unless nations first address the “widening gap between skilled and unskilled workers.” The European Union has set a goal to reduce the number of people at risk of poverty by 20 million by 2020. And U.S. mayors of 36 cities, including New York, Philadelphia, and Chicago, recently pledged to address income inequality.50
Major demographic challenges loom for U.S. policymakers. Racial/ethnic minorities are projected to account for 99 percent of U.S. population growth between 2015 and 2030, and minority youth and young adults will make up a rapidly growing share of students and workers. At the other end of the age distribution is a population of mostly white baby boomers. By 2030, all of the baby boomers will have reached retirement age and will put significant demands on Social Security and Medicare.
Racial/ethnic minorities will play an important role in keeping elderly entitlement programs afloat in the coming decades. If current levels of inequality persist, younger workers and their families will struggle to earn the middle-class wages needed to replace baby boomers in the workforce and fewer funds will flow into Social Security. Reducing disparities—especially by reducing gaps in education—will not only improve economic conditions for millions of lower-income parents and their children, but will also fuel economic growth by creating a well-qualified workforce.

www.prb.org POPULATION BULLETIN 69.2 201414
21 Michael V. Leonesio et al., “The Increasing Labor Force Participation of Older Workers and its Effect on the Income of the Aged,” Social Security Bulletin 72, no. 1 (2012).
22 Richard W. Johnson, Mauricio Soto, and Sheila R. Zedlewski, How Is the Economic Turmoil Affecting Older Americans? (Washington, DC: The Urban Institute, 2008).
23 Linda A. Jacobsen and Mark Mather, “A Post-Recession Update on U.S. Social and Economic Trends” (December 2011), accessed at www.prb.org/Publications/Reports/2011/us-economicsocialtrends-update1.aspx, on Aug. 20, 2014.
24 Signe McKernan et al., “Do Racial Disparities in Private Transfers Help Explain the Racial Wealth Gap? New Evidence From Longitudinal Data,” Demography 51, no 3 (2014): 949-74.
25 Thomas Shapiro, Tatjana Meschede, and Sam Osoro, The Roots of the Widening Racial Wealth Gap: Explaining the Black-White Economic Divide (Waltham, MA: Institute on Assets and Social Policy, Brandeis University, 2013).
26 U.S. Bureau of Labor Statistics, “Labor Force Statistics From the Current Population Survey,” accessed at http://data.bls.gov/pdq/querytool.jsp?survey=ln, on Aug. 26, 2014.
27 U.S. Bureau of Labor Statistics, “Median Weekly Earnings of Full-time Wage and Salary Workers by Detailed Occupation and Sex,” accessed at www.bls.gov/cps/cpsaat39.pdf, on Oct. 24, 2014.
28 U.S. Bureau of Labor Statistics, “Table 5. Employment Status of the Population by Sex, Marital Status, and Presence and Age of Own Children Under 18, 2012-2013 Annual Averages,” accessed at www.bls.gov/news.release/famee.t05.htm, on Aug. 5, 2014; and PRB analysis of data from the U.S. Census Bureau, 2014 Current Population Survey.
29 John Iceland, Poverty in America: A Handbook (Oakland, CA: University of California Press, 2003).
30 Bruce Western, Deirdre Bloome, and Christine Percheski, “Inequality Among American Families With Children, 1975 to 2005,” American Sociological Review 73, no 6 (2008): 903-20.
31 Kelvin Pollard, “The Gender Gap in College Enrollment and Graduation” (April 2011), accessed at www.prb.org/Publications/Articles/2011/gender-gap-in-education.aspx, on Aug. 5, 2014.
32 U.S. Bureau of Labor Statistics, “Wives Who Earn More Than Their Husbands, 1987-2012,” accessed at www.bls.gov/cps/wives_earn_more.htm, on Aug. 5, 2014.
33 Robert Moffitt, “The Deserving Poor, the Family, and the U.S. Welfare System,” Population Association of America Presidential Address, May 2, 2014.
34 Mark Mather and Diana Lavery, “In U.S., Proportion Married at Lowest Recorded Levels” (September 2010), accessed at www.prb.org/Publications/Articles/2010/usmarriagedecline.aspx, on Oct. 17, 2014.
35 Jason DeParle, “Two Classes, Divided by ‘I Do’,” New York Times, July 15, 2015.
36 U.S. Department of Health and Human Services, Office of the Assistant Secretary for Planning and Evaluation, Office of Human Services Policy, "The Effects of Marriage on Health: A Synthesis of Recent Research Evidence," accessed at http://aspe.hhs.gov/hsp/07/marriageonhealth/rb.htm, on Sept. 26, 2010.
37 Claudia Goldin and Lawrence F. Katz, The Race Between Education and Technology (Cambridge, MA: Harvard University Press, 2009).
38 Pew Research Center, “The Rising Cost of Not Going to College,” accessed at www.pewsocialtrends.org/2014/02/11/the-rising-cost-of-not-going-to-college/, on Aug. 5, 2014.
39 Kristie Engemann and Howard Wall, “The Effects of Recessions Across Demographic Groups,” Federal Reserve Bank of St. Louis Working Paper 2009-052A (2009).
40 Anthony P. Carnevale, Nicole Smith, and Jeff Strohl, Recovery: Job Growth and Education Requirements Through 2020 (Washington, DC: Georgetown University Center on Education and the Workforce, 2013).
41 Anthony P. Carnevale, Stephen J. Rose, and Ban Cheah, The College Payoff: Education, Occupations, Lifetime Earnings (Washington, DC: Georgetown University Center on Education and the Workforce, 2011).
References1 U.S. Census Bureau, “Table H-4. Gini Ratios for Households, by Race and
Hispanic Origin of Householder: 1967 to 2013,” accessed at www.census.gov/hhes/www/income/data/historical/inequality/, on Aug. 5, 2014.
2 Andrew G. Berg and Jonathan D. Ostry, “Inequality and Unsustainable Growth: Two Sides of the Same Coin?” accessed at www.imf.org/external/pubs/ft/sdn/2011/sdn1108.pdf, on Sept. 2, 2014.
3 Standard & Poor’s Financial Services LLC, “How Increasing Income Inequality Is Dampening U.S. Economic Growth, And Possible Ways To Change The Tide,” accessed at www.globalcreditportal.com, on Sept. 2, 2014.
4 Rebecca Riffkin, “In U.S., 67% Dissatisfied With Income, Wealth Distribution,” accessed at www.gallup.com/poll/166904/dissatisfied-income-wealth-distribution.aspx, on Aug. 5, 2014.
5 Richard Reeves, “Saving Horatio Alger: Equality, Opportunity, and the American Dream,” accessed at www.brookings.edu/research/essays/2014/saving-horatio-alger#, on Oct. 21, 2014.
6 Includes income from capital gains. Data are from the World Top Incomes Database, accessed at http://topincomes.g-mond.parisschoolofeconomics.eu, on Aug. 5, 2014.
7 The Organisation for Economic Co-operation and Development (OECD), “Crisis Squeezes Income and Puts Pressure on Inequality and Poverty,” accessed at www.oecd.org/els/soc/OECD2013-Inequality-and-Poverty-8p.pdf, on Oct. 24, 2014.
8 The OECD Gini coefficients include income from earnings, self-employment, and capital income, public cash transfers, income taxes, as well as deductions for social security contributions. Data are from OECD, Factbook 2014 (Paris: OECD, 2014), accessed at www.oecd-ilibrary.org/economics/oecd-factbook_18147364, on Aug. 20, 2014.
9 Robert Lerman and Signe-Mary McKernan “Benefits and Consequences of Holding Assets,” in Asset Building and Low-Income Families, ed. Signe-Mary McKernan and Michael Sherraden (Washington, DC: Urban Institute Press, 2008).
10 Fabian Pfeffer, Sheldon Danziger, and Robert Schoeni, “Wealth Levels, Wealth Inequality, and the Great Recession,” Research Summary, Russell Sage Foundation (June 2014), accessed at http://web.stanford.edu/group/scspi/_media/working_papers/pfeffer-danziger-schoeni_wealth-levels.pdf, on Oct. 21, 2014.
11 Realty Trac, “Record 2.9 Million U.S. Properties Receive Foreclosure Filings in 2010 Despite 30-Month Low in December” (Jan. 31, 2011), accessed at www.realtytrac.com, on Aug. 18, 2014.
12 Janet L. Yellen, “Perspectives on Inequality and Opportunity From the Survey of Consumer Finances,” remarks at the Conference on Economic Opportunity and Inequality, Federal Reserve Bank of Boston, Oct. 17, 2014.
13 U.S. Census Bureau, 2013 American Community Survey.
14 Lawrence Mishel, “Unions, Inequality, and Faltering Middle-class Wages,” in Growing Apart: A Political History of American Inequality, accessed at http://scalar.usc.edu/works/growing-apart-a-political-history-of-american-inequality/what-unions-did-labor-policy-and-american-inequality, on Aug. 30, 2014.
15 Raj Chetty et al., Where Is the Land of Opportunity? The Geography of Intergenerational Mobility in the United States, accessed at http://obs.rc.fas.harvard.edu/chetty/mobility_geo.pdf), on Aug. 5, 2014.
16 Mark Mather and Beth Jarosz, “U.S. Energy Boom Fuels Population Growth in Many Rural Counties” (March 2014), accessed at www.prb.org/Publications/Articles/2014/us-oil-rich-counties.aspx, on Aug. 5, 2014.
17 U.S. Census Bureau, American Community Survey.
18 Although relatively few older Americans live below poverty, about 15 percent were below 125 percent of the poverty threshold in 2013.
19 Christopher Wimer et al., Trends in Poverty With an Anchored Supplemental Poverty Measure (2013), accessed at http://socialwork.columbia.edu/sites/default/files/file_manager/pdfs/News/Anchored%20SPM.December7.pdf, on Oct. 21, 2014.
20 Kathleen Short, “The Supplemental Poverty Measure: 2013,” Current Population Reports P60-251 (2014).

www.prb.org POPULATION BULLETIN 69.2 2014 15
42 Sandy Baum, Jennifer Ma, and Kathleen Payea, Education Pays 2013: The Benefits of Higher Education for Individuals and Society (New York: College Board, 2013).
43 National Center for Education Statistics, Education and the Economy: An Indicators Report (Washington, DC: National Center for Education Statistics, 1997).
44 U.S. Census Bureau, “CPS Historical Time Series Tables,” accessed at www.census.gov/hhes/socdemo/education/data/cps/historical/index.html, on Oct. 20, 2014.
45 John Bound and Sarah Turner, “Collegiate Attainment: Understanding Degree Completion,” NBER Reporter 2010, Number 4: Research Summary.
46 Gregory Camilli et al., “Meta-Analysis of the Effects of Early Education Interventions on Cognitive and Social Development,” Teachers College Record 112, no. 3 (2010): 579-620.
47 Robert A. Hummer and Elaine M. Hernandez, “The Effect of Educational Attainment on Adult Mortality in the United States,” Population Bulletin 68, no. 1 (2013).
48 U.S. Department of Education, “Meeting the Nation’s 2020 Goal: State Targets for Increasing the Number and Percentage of College Graduates With Degrees” (March 18, 2011), accessed at www.whitehouse.gov/sites/default/files/completion_state_by_state.pdf, on Oct. 24, 2014
49 National Center for Education Statistics, “Projections of Education Statistics to 2021,” accessed at http://nces.ed.gov/programs/projections/projections2021/, on Oct. 28, 2014.
50 Erin Carlyle “American Mayors Pledge to Fight Income Inequality, Low Wages,” Forbes, Aug. 11, 2014.
www.prb.org POPULATION BULLETIN 69.2 201416
Recent Population BulletinsVOLUME 69 (2014)
No. 1 Migration and the Environment by Jason Bremner and Lori M. Hunter
No. 2 The Demography of Inequality in the United States by Mark Mather and Beth Jarosz
VOLUME 68 (2013)
No. 1 The Effect of Educational Attainment on Adult Mortality in the United States by Robert A. Hummer and Elaine M. Hernandez
No. 2 The Global Challenge of Managing Migration by Philip Martin
VOLUME 67 (2012)
No. 1 Household Change in the United States by Linda A. Jacobsen, Mark Mather, and Genevieve Dupuis
No. 2 Achieving a Demographic Dividend by James A. Gribble and Jason Bremner
@PRBData
VOLUME 66 (2011)
No. 1 America’s Aging Population by Linda A. Jacobsen, Mary Kent, Marlene Lee, and Mark Mather
No. 2 The World at 7 Billion by Carl Haub and James Gribble
VOLUME 65 (2010)
No. 1 U.S. Economic and Social Trends Since 2000 by Linda A. Jacobsen and Mark Mather
No. 2 World Population Highlights: Key Findings From PRB’s 2010 World Population Data Sheet by Jason Bremner, Ashley Frost, Carl Haub, Mark Mather, Karin Ringheim, and Eric Zuehlke
VISIT WWW.PRB.ORG TO FIND:
ARTICLES AND REPORTS. New data and analysis on topics as diverse as gender, reproductive health, environment, and race/ethnicity.
MULTIMEDIA. PRB has more than 150 videos with leading experts on topics as wide-ranging as climate change, immigration, HIV/AIDS, and nutrition. Many videos include PowerPoint presentations shown during seminars and press briefings. ENGAGE presentations feature the Trendalyzer software created by Hans Rosling. The Distilled Demographic series of short videos on population dynamics can help students learn demography’s real-world application and impact.
WEBUPDATE. Sign up to receive e-mail announcements about new web content and PRB-sponsored seminars and briefings.
DATAFINDER. DataFinder is a searchable database of hundreds of indicators for thousands of places in the U.S. and around the world. In addition to data from PRB’s World Population Data Sheet and other PRB data sheets, also included are data from the 2010 U.S. Census and the U.S. Census Bureau’s American Community Survey. The redesigned site lets you easily create custom reports—rankings, trend graphs, bar charts, and maps to print, download, and share.
FOR EDUCATORS. Online lesson plans, and PRB’s updated Population Handbook.
PRB NEWS AND EVENTS. Announcements of fellowship applications, workshops, and news about PRB’s programs.
BECOME A MEMBER OF PRB
With new perspectives shaping public policies every day, you need to be well informed. As a member of the Population Reference Bureau, you will receive reliable information on United States and world population trends—properly analyzed and clearly presented in readable language. Each year you will receive two Population Bulletins, the annual World Population Data Sheet, and complimentary copies of special publications. We welcome you to join PRB today.
INDIVIDUAL $50
LIBRARY $75
CORPORATION $300
LIFETIME MEMBERSHIP $5,000
POPULATION REFERENCE BUREAU 1875 Connecticut Ave., NW, Suite 520 Washington, DC 20009-5728
For faster service, call 800-877-9881 Or visit www.prb.org Or e-mail [email protected] Or fax 202-328-3937

INTERACTIVE WHAT-IF SCENARIOS ON POVERTYThe U.S. population is undergoing significant racial/ethnic change, with some of the fastest-growing groups lagging behind other groups on important measures of well-being, such as poverty. Reducing poverty will be difficult unless the economic circumstances of blacks, Latinos, and American Indians improve. Poverty also varies by age, with current rates close to all-time highs among children and working-age adults. Using the Census Bureau’s three series of population projections, you can explore the potential impact of maintaining or eliminating racial and ethnic gaps on the number of people in poverty across three key age groups: children, working-age adults, and the elderly.
INTERACTIVE STATE-LEVEL GRAPHICSIn many states and local areas, poverty and inequality have increased in tandem in recent years. Use PRB’s interactive Tableau graphics to compare patterns of poverty and inequality in each state, and how these patterns have changed over time.
WEBINARAuthors Mark Mather and Beth Jarosz conducted a webinar on Nov. 18 to highlight the key findings from the Population Bulletin “The Demography of Inequality in the United States.” Listen to their presentation and the answers to questions submitted by webinar participants.
SEND TWEETS TO AUTHORSContinue the conversation about the demography of inequality in the United States.
Follow Mark Mather at @MarkSMather Follow Beth Jarosz at @DataGeekB
THE DEMOGRAPHY OF INEQUALITY
IN THE UNITED STATES
SPECIAL ONLINE FEATURESwww.prb.org/Publications/Reports/2014/united-states-inequality.aspx

1875 Connecticut Avenue., NW Suite 520 Washington, DC 20009
202 483 1100 PHONE 202 328 3937 FAX
[email protected] EMAIL
POPULATION REFERENCE BUREAU
www.prb.org
THE DEMOGRAPHY OF INEQUALITY IN THE UNITED STATES
A convergence of demographic trends and disparities is contributing to a
new economic reality for the U.S. population, characterized by higher levels
of poverty and inequality. Population aging, growing racial/ethnic diversity,
changing family structure, and regional population shifts are changing the U.S.
demographic landscape and exacerbating differences between the haves and
the have-nots.
These demographic trends are occurring against a backdrop of rising inequality
in the United States. Since the Great Recession, public discourse has focused
primarily on the earnings of chief executives in comparison with low-wage
workers. But broader measures of income inequality also show a growing gap
between those at the top and those at the bottom.
In this Population Bulletin, we investigate the intersection between demography
and inequality in the United States, with a focus on regional patterns and
differences by age, race/ethnicity, gender, and family structure. We stress
the importance of closing gaps in education to put the next generation of
workers and their children on a path to succeed in the labor force and advance
the U.S. economy.