a century of educational inequality in the united states
TRANSCRIPT

A century of educational inequality in theUnited StatesMichelle Jacksona,1 and Brian Holzmanb
aDepartment of Sociology, Stanford University, Stanford, CA 94305; and bHouston Education Research Consortium, Rice University, Houston, TX 77005
Edited by Eric Grodsky, University of Wisconsin-Madison, Madison, WI, and accepted by Editorial Board Member Mary C. Waters June 3, 2020 (received forreview April 27, 2019)
The “income inequality hypothesis” holds that rising incomeinequality affects the distribution of a wide range of socialand economic outcomes. Although it is often alleged that ris-ing income inequality will increase the advantages of the well-off in the competition for college, some researchers have pro-vided descriptive evidence at odds with the income inequalityhypothesis. In this paper, we track long-term trends in familyincome inequalities in college enrollment and completion (“col-legiate inequalities”) using all available nationally representativedatasets for cohorts born between 1908 and 1995. We showthat the trends in collegiate inequalities moved in lockstep withthe trend in income inequality over the past century. There isone exception to this general finding: For cohorts at risk forserving in the Vietnam War, collegiate inequalities were high,while income inequality was low. During this period, inequal-ity in college enrollment and completion was significantly higherfor men than for women, suggesting a bona fide “Vietnam War”effect. Aside from this singular confounding event, a century ofevidence establishes a strong association between income andcollegiate inequality, providing support for the view that risingincome inequality is fundamentally changing the distribution oflife chances.
educational inequality | income inequality | long-term trend
I t has long been suspected that the takeoff in income inequal-ity has made the good luck of an advantaged birth ever more
consequential for accessing opportunities and getting ahead. The“income inequality” hypothesis proposes that intergenerationalinequality—with respect to educational attainment, social mobil-ity, and other socioeconomic outcomes—will increase as incomeinequality grows. Because this hypothesis shot to public atten-tion with Krueger’s (1) discussion of the Great Gatsby curve, theproposition that high levels of income inequality have generatedcorrespondingly high levels of intergenerational reproductionis now a staple of public and political discourse. Despite theprominence of this argument, the evidence in its favor is lessoverwhelming than might be assumed (2), and is largely limitedto the empirical result that intergenerational income inheritancehas increased in recent decades, at least in some analyses (3,4). Even this result has been contested and is far from widelyaccepted (5).
In this paper, we assess the plausibility of the income inequal-ity hypothesis by examining changes over the past century in theincome-based gaps in college enrollment and completion. This isa field in which descriptive evidence is key: Designs that wouldallow for convincing causal inference are in short supply, andwhere designs are available, the data are not. And yet most of thedescriptive evidence in regard to the college level pertains onlyto recent decades, when both income inequality and collegiateinequalities have increased (refs. 6–8).
The trends through earlier decades of the century, withinwhich the great U-turn in income inequality occurred, remainlargely undocumented. To overcome this evidence deficit, wemight be inclined to draw on evidence on other educational out-comes, such as test scores and years of schooling. Reardon’sanalysis of family income test score gaps, for example, shows
steadily rising gaps between cohorts born in the 1940s and thoseborn in the present day (ref. 9; cf. ref. 10). But test scores arequite imperfectly correlated with educational attainment, andevidence from studies of inequalities in years of schooling wouldsupport different conclusions on trend. Hilger’s (11) analysisof long-term trends using Census data shows that there wasa decline in the effects of parental income on child’s educa-tion between the 1940s and 1970s, while Mare (12) shows anincreasing effect of family income on higher-level educationaltransitions for midcentury cohorts as compared to early-centurycohorts. Taking these studies together, it is difficult to reachany firm conclusion about the income inequality hypothesis, asone might infer an increase, a decrease, or stability in collegiateinequalities during the midcentury, depending on which study isconsidered.
Extending the time series over the whole of the past cen-tury allows for a fuller assessment of the income inequalityhypothesis, as the long-run historical series on income inequal-ity exhibits a relatively complicated pattern, as opposed to thesimple increase in the recent period. In much the same way asthe magnitude of changes in income inequality could only beappreciated when considered in the long run, current levels ofeducational inequality must be evaluated and understood in fullhistorical context (13). In a comprehensive extension of previousresearch on collegiate inequalities, we thus use all nationally
Significance
There has been widespread concern that the takeoff in incomeinequality in recent decades has had harmful social conse-quences. We provide evidence on this concern by assem-bling all available nationally representative datasets on col-lege enrollment and completion. This approach, which allowsus to examine the relationship between income inequalityand collegiate inequalities over the full century, reveals thatthe long-standing worry about income inequality is war-ranted. Inequalities in college enrollment and completionwere low for cohorts born in the late 1950s and 1960s,when income inequality was low, and high for cohortsborn in the late 1980s, when income inequality peaked.This grand U-turn means that contemporary birth cohortsare experiencing levels of collegiate inequality not seen forgenerations.
Author contributions: M.J. and B.H. designed research; M.J. and B.H. analyzed data; andM.J. wrote the paper.y
The authors declare no competing interest.y
This article is a PNAS Direct Submission. E.G. is a guest editor invited by the EditorialBoard.y
This open access article is distributed under Creative Commons Attribution-NonCommercial-NoDerivatives License 4.0 (CC BY-NC-ND).y
Data deposition: Code for data analysis is archived on Open Science Framework (https://osf.io/jxne5).y1 To whom correspondence may be addressed. Email: [email protected]
This article contains supporting information online at https://www.pnas.org/lookup/suppl/doi:10.1073/pnas.1907258117/-/DCSupplemental.y
First published July 27, 2020.
19108–19115 | PNAS | August 11, 2020 | vol. 117 | no. 32 www.pnas.org/cgi/doi/10.1073/pnas.1907258117
Dow
nloa
ded
by g
uest
on
Janu
ary
15, 2
022

SOCI
AL
SCIE
NCE
S
representative data sources that we were able to locate andaccess. This strengthens the descriptive evidence that can bebrought to bear upon the income inequality hypothesis.
In the following sections, we discuss the available data andthe methods of analysis, and present our results on long-termtrends in collegiate inequalities. We will focus on inequalities incompletion of 4-year college, enrollment in 4-year college, andenrollment in any college (2- or 4-year). We will demonstrate anessential similarity in inequality trends across the range of colle-giate outcomes. Although we will show that income inequality isstrongly associated with inequalities at the college level, we willalso highlight that it is not the only force at work.
College Enrollment and Completion in the Twentieth CenturyThe twentieth century was the first century in which educationsystems were widely diffused and, at least in principle, accessibleto all social groups. The century witnessed substantial expansionat the college level: The college enrollment rate for 20- to 21-y-olds increased from around 15% for the mid-1920s birth cohortsto almost 60% for cohorts born toward the end of the century.*As Fig. 1 shows, rates of enrollment rose rapidly for cohortsborn in the early century to midcentury, and flattened out andeven declined for the midcentury birth cohorts, before resum-ing a steady increase for cohorts born in the later decades ofthe century.
We see in Fig. 1 a stark reversal of the gender gap in collegeenrollment; for birth cohorts from the mid-1950s to mid-1990s,the proportion of women enrolled in college grew by around30 percentage points, while the corresponding increase for menwas just under 20 percentage points (16, 17). The reversaloccurred immediately after the rapid increase in enrollment ratesobserved for male birth cohorts at risk for service in the VietnamWar (16). A literature in economics has demonstrated that menborn in the 1940s and 1950s were unusually likely to attendand graduate from college, although there is disagreement withrespect to whether the observed increase in men’s college par-ticipation rates should be attributed to draft avoidance or topostservice GI Bill enrollments (ref. 18; cf. ref. 19).
Alongside trends in college enrollment, Fig. 1 presents ratesof college completion by type of degree. While rates of comple-tion of 2-year college are rather flat for cohorts born from the1950s onward, rates of 4-year college completion have increasedconsiderably. As the figure suggests, rates of 4-year collegecompletion are highly correlated with rates of enrollment, butresearch shows that, over the past half-century, rates of col-lege completion increased less sharply than rates of enrollment,because the college dropout rate increased (6, 20).
Materials and MethodAlthough it is relatively straightforward to examine changes in rates of col-lege enrollment and completion over time, it is rather less straightforwardto examine income inequalities in collegiate outcomes across the span ofthe twentieth century, because data on parental income, college enroll-ment, and college completion are not routinely collected in governmentsurveys. We must therefore piece together the trends in collegiate inequal-ities through the analysis of available sources of nationally representativedata. We include results from the analysis of both cross-sectional surveys ofadults and longitudinal surveys beginning with school-aged children, and,for a number of recent cohorts, we calculate estimates from tax data resultsin the public domain. Although this approach presents obvious challenges asregards comparability of data sources and measures, for much of the periodthat we cover, we have multiple estimates of collegiate inequalities for anygiven period of time. The datasets and their key characteristics are listed inTable 1; detailed descriptions of each dataset are included in SI Appendix.
*Throughout this paper, we use the term “college” as a shorthand for “2- or 4-yearcollege.”
0.1
.2.3
.4.5
.6P
ropo
rtion
1930 1940 1950 1960 1970 1980 1990
Birth year
Completed 4−year degree (ages 25−29): All Men WomenCompleted 2−year degree (ages 25−29): All Men WomenCurrently enrolled (ages 20−21): All Men Women
Fig. 1. Proportion of birth cohort enrolled in college ages 20 y to 21 y(14), and proportions completing 2- and 4-year college degrees, CurrentPopulation Survey March, Annual Social and Economic Supplement (15).
The datasets cover cohorts born between 1908 and 1995, and it is onlyat the beginning and the end of the data series that our birth cohortsare represented by no more than one dataset. Although we aim to definecohorts according to year of birth, for some of the datasets we must con-struct quasi-cohorts based on age or grade, because year of birth was notrecorded.
The biggest constraint that we face in analyzing income inequalities incollegiate attainment relates to gender. Data on the earlier birth cohortscome from the Occupational Changes in a Generation (OCG 1973) survey,which was administered in conjunction with the Current Population Survey(21). This survey was completed by men only, so we lack information on theeducational attainment of women in the earliest birth cohorts. By present-ing all results separately for men and women, patterns over time can becompared by gender.
The datasets were prepared to provide consistent measures of familyincome, college enrollment, and college completion. We produce simplebinary variables that capture whether an individual completed a 4-yeardegree, whether an individual enrolled in (without necessarily completing) a4-year degree program, and whether an individual enrolled in (without nec-essarily completing) a college program. Unfortunately, the tax data resultspertain only to college enrollment per se, so we have fewer available datapoints for the analyses of 4-year completion and enrollment than for theanalyses of enrollment in any college program. All samples are restricted toindividuals who enrolled in high school, in order to maximize consistencyacross samples. In SI Appendix, we also include results for a smaller samplerestricted to high school graduates (SI Appendix, Fig. S6).
A more difficult variable to harmonize over time is family income.Although in some datasets family income is measured directly (e.g., annualnet family income in dollars), in many of the available datasets familyincome is measured only as an ordinal variable. For these datasets, weemploy the method used by Reardon (9) to calculate test score gaps fromcoarsened family income data; the method uses the proportions in eachincome category to assign an income rank to all of those in a given cate-gory, and income rank is then the explanatory variable in the analysis (SIAppendix, SI Methods).
We estimate logits predicting college enrollment and completion asa function of family income or income rank. Following Reardon (9),we fit squared and cubed terms to capture the nonlinear effects ofincome rank. Using the model, we estimate the enrollment and comple-tion rates of those at the 90th percentile of family income and thoseat the 10th percentile. We choose the 90 vs. 10 comparison over otherways of defining inequality because it accords with past assessments andwith the main source of trend in income inequality (9).† From theserates, we calculate log-odds ratios capturing, for example, the log-oddsof completing a 4-year college degree for the 90 vs. 10 family incomecomparison.
†We also include results based on comparing income quartiles in SI Appendix, Fig. S5.
Jackson and Holzman PNAS | August 11, 2020 | vol. 117 | no. 32 | 19109
Dow
nloa
ded
by g
uest
on
Janu
ary
15, 2
022
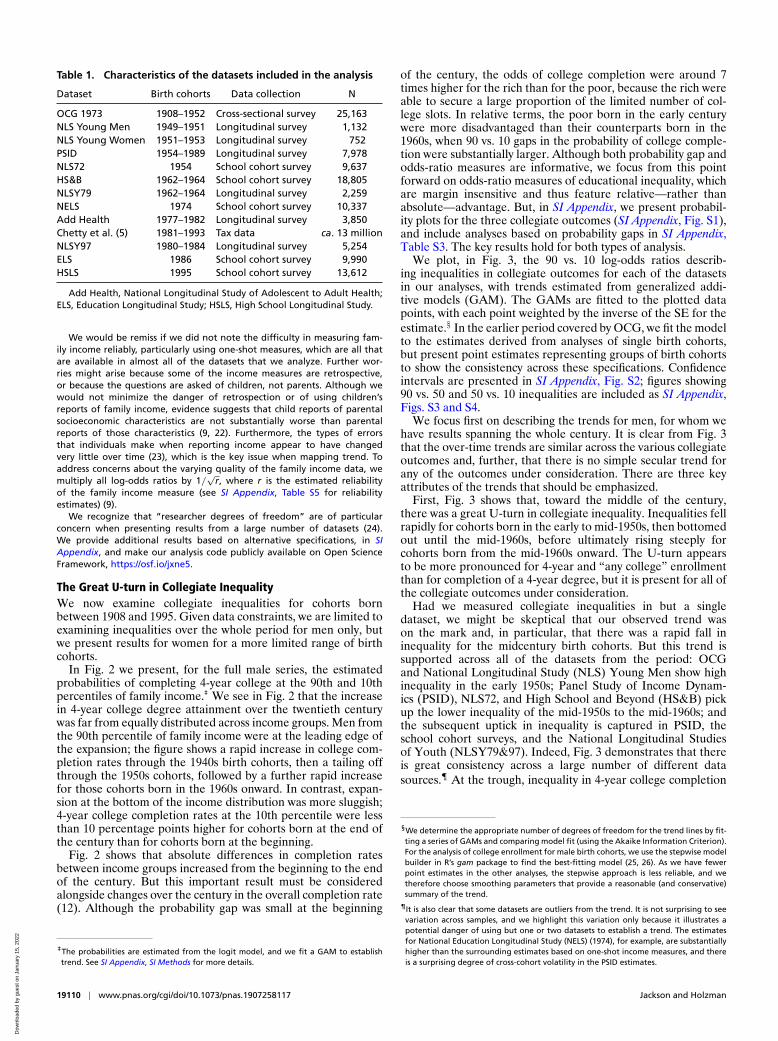
Table 1. Characteristics of the datasets included in the analysis
Dataset Birth cohorts Data collection N
OCG 1973 1908–1952 Cross-sectional survey 25,163NLS Young Men 1949–1951 Longitudinal survey 1,132NLS Young Women 1951–1953 Longitudinal survey 752PSID 1954–1989 Longitudinal survey 7,978NLS72 1954 School cohort survey 9,637HS&B 1962–1964 School cohort survey 18,805NLSY79 1962–1964 Longitudinal survey 2,259NELS 1974 School cohort survey 10,337Add Health 1977–1982 Longitudinal survey 3,850Chetty et al. (5) 1981–1993 Tax data ca. 13 millionNLSY97 1980–1984 Longitudinal survey 5,254ELS 1986 School cohort survey 9,990HSLS 1995 School cohort survey 13,612
Add Health, National Longitudinal Study of Adolescent to Adult Health;ELS, Education Longitudinal Study; HSLS, High School Longitudinal Study.
We would be remiss if we did not note the difficulty in measuring fam-ily income reliably, particularly using one-shot measures, which are all thatare available in almost all of the datasets that we analyze. Further wor-ries might arise because some of the income measures are retrospective,or because the questions are asked of children, not parents. Although wewould not minimize the danger of retrospection or of using children’sreports of family income, evidence suggests that child reports of parentalsocioeconomic characteristics are not substantially worse than parentalreports of those characteristics (9, 22). Furthermore, the types of errorsthat individuals make when reporting income appear to have changedvery little over time (23), which is the key issue when mapping trend. Toaddress concerns about the varying quality of the family income data, wemultiply all log-odds ratios by 1/
√r, where r is the estimated reliability
of the family income measure (see SI Appendix, Table S5 for reliabilityestimates) (9).
We recognize that “researcher degrees of freedom” are of particularconcern when presenting results from a large number of datasets (24).We provide additional results based on alternative specifications, in SIAppendix, and make our analysis code publicly available on Open ScienceFramework, https://osf.io/jxne5.
The Great U-turn in Collegiate InequalityWe now examine collegiate inequalities for cohorts bornbetween 1908 and 1995. Given data constraints, we are limited toexamining inequalities over the whole period for men only, butwe present results for women for a more limited range of birthcohorts.
In Fig. 2 we present, for the full male series, the estimatedprobabilities of completing 4-year college at the 90th and 10thpercentiles of family income.‡ We see in Fig. 2 that the increasein 4-year college degree attainment over the twentieth centurywas far from equally distributed across income groups. Men fromthe 90th percentile of family income were at the leading edge ofthe expansion; the figure shows a rapid increase in college com-pletion rates through the 1940s birth cohorts, then a tailing offthrough the 1950s cohorts, followed by a further rapid increasefor those cohorts born in the 1960s onward. In contrast, expan-sion at the bottom of the income distribution was more sluggish;4-year college completion rates at the 10th percentile were lessthan 10 percentage points higher for cohorts born at the end ofthe century than for cohorts born at the beginning.
Fig. 2 shows that absolute differences in completion ratesbetween income groups increased from the beginning to the endof the century. But this important result must be consideredalongside changes over the century in the overall completion rate(12). Although the probability gap was small at the beginning
‡The probabilities are estimated from the logit model, and we fit a GAM to establishtrend. See SI Appendix, SI Methods for more details.
of the century, the odds of college completion were around 7times higher for the rich than for the poor, because the rich wereable to secure a large proportion of the limited number of col-lege slots. In relative terms, the poor born in the early centurywere more disadvantaged than their counterparts born in the1960s, when 90 vs. 10 gaps in the probability of college comple-tion were substantially larger. Although both probability gap andodds-ratio measures are informative, we focus from this pointforward on odds-ratio measures of educational inequality, whichare margin insensitive and thus feature relative—rather thanabsolute—advantage. But, in SI Appendix, we present probabil-ity plots for the three collegiate outcomes (SI Appendix, Fig. S1),and include analyses based on probability gaps in SI Appendix,Table S3. The key results hold for both types of analysis.
We plot, in Fig. 3, the 90 vs. 10 log-odds ratios describ-ing inequalities in collegiate outcomes for each of the datasetsin our analyses, with trends estimated from generalized addi-tive models (GAM). The GAMs are fitted to the plotted datapoints, with each point weighted by the inverse of the SE for theestimate.§ In the earlier period covered by OCG, we fit the modelto the estimates derived from analyses of single birth cohorts,but present point estimates representing groups of birth cohortsto show the consistency across these specifications. Confidenceintervals are presented in SI Appendix, Fig. S2; figures showing90 vs. 50 and 50 vs. 10 inequalities are included as SI Appendix,Figs. S3 and S4.
We focus first on describing the trends for men, for whom wehave results spanning the whole century. It is clear from Fig. 3that the over-time trends are similar across the various collegiateoutcomes and, further, that there is no simple secular trend forany of the outcomes under consideration. There are three keyattributes of the trends that should be emphasized.
First, Fig. 3 shows that, toward the middle of the century,there was a great U-turn in collegiate inequality. Inequalities fellrapidly for cohorts born in the early to mid-1950s, then bottomedout until the mid-1960s, before ultimately rising steeply forcohorts born from the mid-1960s onward. The U-turn appearsto be more pronounced for 4-year and “any college” enrollmentthan for completion of a 4-year degree, but it is present for all ofthe collegiate outcomes under consideration.
Had we measured collegiate inequalities in but a singledataset, we might be skeptical that our observed trend wason the mark and, in particular, that there was a rapid fall ininequality for the midcentury birth cohorts. But this trend issupported across all of the datasets from the period: OCGand National Longitudinal Study (NLS) Young Men show highinequality in the early 1950s; Panel Study of Income Dynam-ics (PSID), NLS72, and High School and Beyond (HS&B) pickup the lower inequality of the mid-1950s to the mid-1960s; andthe subsequent uptick in inequality is captured in PSID, theschool cohort surveys, and the National Longitudinal Studiesof Youth (NLSY79&97). Indeed, Fig. 3 demonstrates that thereis great consistency across a large number of different datasources.¶ At the trough, inequality in 4-year college completion
§We determine the appropriate number of degrees of freedom for the trend lines by fit-ting a series of GAMs and comparing model fit (using the Akaike Information Criterion).For the analysis of college enrollment for male birth cohorts, we use the stepwise modelbuilder in R’s gam package to find the best-fitting model (25, 26). As we have fewerpoint estimates in the other analyses, the stepwise approach is less reliable, and wetherefore choose smoothing parameters that provide a reasonable (and conservative)summary of the trend.
¶It is also clear that some datasets are outliers from the trend. It is not surprising to seevariation across samples, and we highlight this variation only because it illustrates apotential danger of using but one or two datasets to establish a trend. The estimatesfor National Education Longitudinal Study (NELS) (1974), for example, are substantiallyhigher than the surrounding estimates based on one-shot income measures, and thereis a surprising degree of cross-cohort volatility in the PSID estimates.
19110 | www.pnas.org/cgi/doi/10.1073/pnas.1907258117 Jackson and Holzman
Dow
nloa
ded
by g
uest
on
Janu
ary
15, 2
022

SOCI
AL
SCIE
NCE
S
0.1
.2.3
.4.5
.6.7
.8
Prop
ortio
n
1910 1920 1930 1940 1950 1960 1970 1980
Male birth cohort
90th percentile 10th percentile
Fig. 2. Probabilities of 4-year college completion at the 90th and 10thpercentiles of family income, male birth cohorts, 1908–1986.
was reduced to a log-odds ratio of around 1.5, indicating that,even in this low-inequality period, the odds of those at the90th income percentile completing a 4-year college degree werealmost 4.5 times greater than the equivalent odds for those atthe 10th percentile. Inspection of SI Appendix, Fig. S3 suggeststhat the U-turn observed in Fig. 3 is largely driven by changes inthe top half of the income distribution: the U-turn is rather morepronounced for the 90 vs. 50 comparison than for the 50 vs. 10comparison.
Second, if skepticism about a midcentury fall in collegiateinequality were to be sustained, suspicion would also have tofall upon all currently accepted results on over-time trends,which demonstrate a substantial increase in inequalities in col-lege enrollment and completion between cohorts born in themidcentury and late century. If we were to impose a simple linearsmooth on the century-long data series, this would indicate rela-tively modest increases in collegiate inequalities over the periodtaken as a whole (see dashed lines, Fig. 3).# Again, because thetrends are mapped using multiple datasets, we are confident thatthe pattern of a U-turn in collegiate inequality is supported.
Third, any evidence of a U-turn must bring to mind the patternof income inequality over the past century. As Piketty and Saez(27) described, toward the middle of the twentieth century, theshare of income going to the top 10% rapidly declined, beforerising again over the later decades of the century. The U-turnin collegiate inequality mimics this trend, although it is notablethat, insofar as we see similarity in patterns of income inequalityand collegiate inequalities, it is income inequality around year ofbirth that appears to matter most. But, despite the obvious sim-ilarities, there is at least one clear divergence in the pattern ofcollegiate inequality and income inequality: The U-turn in col-legiate inequality comes very late. Income inequality begins tofall in the early 1940s, but inequalities in enrollment and com-pletion begin to decline only for cohorts born in the mid-1950s.Men born in the mid-1940s onward were not just born into aperiod of low inequality, but they spent most of their forma-tive years in a low-inequality society. Despite this, the evidenceshows that collegiate inequality increased substantially for thecohorts born in the 1940s and early 1950s; the log-odds ratiosdescribing inequality are increased by around a third over thisshort period.
#The linear trend is strongest for 4-year completion, and weakest for enrollment in4-year college. For all collegiate outcomes, the GAM offers a significant improvementin fit over the simple linear model.
Some of the same key features are visible in the results forwomen, shown in Fig. 3, Right, although we only have access todata for women born after 1950. We see a basic similarity withthe men’s analyses from the mid-1950s birth cohorts onward:Collegiate inequalities are relatively flat for the 1950s to 1960sbirth cohorts, and increase for women born in the 1970s andonward. Just as with men, toward the end of the period we seeflat and even declining inequalities in enrollment and comple-tion. There are perhaps some subtle differences in the pattern bygender—the upturn in collegiate inequality begins, for example,several years later for women than for men—but we have littleevidence here to support a conclusion of substantial differencein inequality for men and women over this period.
There is one notable difference between the men’s andwomen’s results, relating to the period when trends in male col-legiate inequality substantially diverged from trends in incomeinequality. This exceptional period appears to be exceptional formen, but not for women. Although we cannot track collegiateinequalities for women across the whole midcentury period, thefirst data points in the female data series (NLS Young Women:1951–1953 birth cohorts) are lower than the nearby estimatesfor men (NLS Young Men: 1949–1951 birth cohorts).∗∗ Thisperiod of divergence between collegiate inequality and incomeinequality coincides with the period that we identified above asholding special consequences for men’s educational attainment:Men born in the 1940s and early 1950s were subject to the threatof military service in the Vietnam War.
There are no cohort studies of women that would allow usto compare male and female inequalities in college enrollmentand completion throughout this period. We do, however, haveaccess to data on men who fathered children who were at riskfor service during the Vietnam War: The NLS Older Men sur-vey can be used to track collegiate inequalities for the childrenof men who were aged 45 y to 59 y in 1966. The structureof this dataset is somewhat different from the datasets under-lying our time series, but we nevertheless find confirmation,in Fig. 4, that male and female inequalities diverged in theVietnam years.
In the pre-Vietnam period, male and female collegiateinequalities were of similar magnitude. The log-odds ratio for4-year enrollment, for example, was 2.3 for men (95% CI: 1.5,3.1), as compared to 2.4 for women (1.7, 3.2). But, for the birthcohorts at risk for serving in Vietnam, the male log-odds ratioincreased slightly, to 2.5 (1.8, 3.2), while inequality fell substan-tially for women, to 1.4 (0.8, 2.0) (see SI Appendix, Fig. S8 fora figure with CIs). These results provide support for the claimthat men’s collegiate inequality was substantially and artificiallyraised relative to expected levels during this period because ofthe Vietnam War. Unfortunately, our data are not well-suitedto evaluating why male and female collegiate inequality differedin the Vietnam period. But some evidence can be brought tobear on this question by comparing preservice and postserviceinequalities in college participation for the men in OCG (SIAppendix, Fig. S9). These data are more consistent with a draft-induced increase in male collegiate inequality than with a GIBill-induced increase.††
Bringing the results in Fig. 4 together with what is knownabout college enrollment and completion patterns during the
** It would be possible to track male and female educational inequality with respect toparental education or socioeconomic index scores (SEI) (28), but the sample sizes are,unfortunately, too small for a detailed analysis of gender differences in educationalattainment by birth cohort. This approach is also unattractive given that parentaleducation, parental income, and SEI were only weakly correlated in this period (29).
††Note that, while previous research has suggested that high-socioeconomic status (SES)individuals might have taken advantage of the GI Bill to a greater extent than low-SESindividuals (30), SI Appendix, Fig. S9 provides little evidence that collegiate inequalitywas substantially affected. See SI Appendix for further discussion of this point.
Jackson and Holzman PNAS | August 11, 2020 | vol. 117 | no. 32 | 19111
Dow
nloa
ded
by g
uest
on
Janu
ary
15, 2
022

01
23
90 v
s. 10
log-
odds
ratio
1910 1920 1930 1940 1950 1960 1970 1980 1990
Male birth cohort
90 v
s. 10
log
odds
ratio
1910 1920 1930 1940 1950 1960 1970 1980 1990
Female birth cohort
01
23
90 v
s. 10
log-
odds
ratio
1910 1920 1930 1940 1950 1960 1970 1980 1990
Male birth cohort
90 v
s. 10
log
odds
ratio
1910 1920 1930 1940 1950 1960 1970 1980 1990
Female birth cohort
01
23
90 v
s. 10
log-
odds
ratio
1910 1920 1930 1940 1950 1960 1970 1980 1990
Male birth cohort
90 v
s. 10
log
odds
ratio
1910 1920 1930 1940 1950 1960 1970 1980 1990
Female birth cohort
OCG73 NLS YM&W NLSY79 NLSY97 Tax data
Add Health NLS72 HS&B NELS ELS HSLSFig. 3. The 90 vs. 10 log-odds ratios expressing inequality in 4-year completion, 4-year enrollment, and any college enrollment. (Left) Male birth cohorts,1908–1995; (Right) female birth cohorts, 1951–1995.
Vietnam War period, it seems likely that the disproportion-ate increase in men’s college participation rates observed inFig. 1 was achieved, at least in part, through a gender-specificchange in the effect of family income on college enrollment andcompletion.
The Association between Income Inequality and CollegiateInequality.We now present a formal statistical test of the strength of theassociation between income inequality and collegiate inequal-ity. We regress the log-odds for collegiate inequalities on income
19112 | www.pnas.org/cgi/doi/10.1073/pnas.1907258117 Jackson and Holzman
Dow
nloa
ded
by g
uest
on
Janu
ary
15, 2
022

SOCI
AL
SCIE
NCE
S
12
3
90 v
s. 1
0 lo
g−od
ds ra
tio
1935−43 birth cohort 1944−52 birth cohort
Men: 4−year compl. 4−year enroll Any enrollWomen: 4−year compl. 4−year enroll Any enroll
Fig. 4. The 90 vs.10 log-odds ratios expressing inequality in 4-year col-lege completion, 4-year enrollment, and any college enrollment, men andwomen born 1935–1943 and 1944–1952, NLS-Older Men data.
inequality, as measured through the share of wages going to thetop 10% (27).‡‡ In addition to the income inequality variable, forthe full male series (1908–1995), we fit a “Vietnam effect,” witha dummy variable that isolates the cohorts at risk from the draftlotteries (i.e., 1944–1952 birth cohorts). We fit models to thefull male series (1908–1995 birth cohorts), a compressed maleseries (1952–1995 birth cohorts), and the female series (1951–1995 birth cohorts). A full regression table with coefficients andstandard errors is included as SI Appendix, Table S4.§§ In Fig. 5,we present estimates of the predicted increase in the log-oddsratios for an eight percentage point increase in the share of wagesgoing to the top 10%; this increase is equivalent to the “takeoff”in income inequality that occurred between the midcentury andthe 1990s.¶¶
The regression coefficients describing the associationsbetween income inequality and 90 vs. 10 collegiate inequalitiescan be straightforwardly decomposed into two parts: an associa-tion between income inequality and the 90 vs. 50 log-odds ratio,and an association between income inequality and the 50 vs. 10log-odds ratio. In Fig. 5, the total height of each bar representsthe predicted increase in the 90 vs. 10 log-odds ratio for an eightpercentage point increase in income inequality, while the darkand light gray bars show the predicted increases in the 90 vs. 50and 50 vs. 10 log-odds ratios, respectively.
Examining first the results for the 90 vs. 10 comparison, we seeconfirmation of a relatively strong association between incomeinequality and collegiate inequality over the full sweep of the
‡‡We choose the wages measure because, for the bottom of the income distribu-tion, wages are a more important component of income than the types of incomeincluded in the alternative measures (e.g., capital gains). We measure wage inequal-ity in year of birth. Surprisingly, given the prominence of the income inequalityhypothesis, there is not yet adequate guidance in the literature as to the age atwhich income inequality most influences outcomes, although in the “money matters”literature there has been particular emphasis on the prenatal period, the postna-tal period, and early childhood as the lifecourse moments when money mattersmost (31, 32).
§§In the 4-year analyses, we weight the data by the inverse of the standard errors under-lying the estimates. In the analysis of any college enrollment, we do not weight thedata, as this data series includes the tax data estimates. Given the size of the sam-ples underlying these estimates, weighting would allow the relationship that pertainsin the tax data for cohorts born in the 1980s and 1990s to have a disproportionateinfluence on the estimated century-long relationship between income inequality andinequality in college enrollment.
¶¶The estimates in Fig. 5 are obtained by multiplying the income inequality coefficientsin SI Appendix, Table S4 by 0.08.
twentieth century. For women, for example, the model predictsthat an increase in income inequality equivalent to that observedin the takeoff period would increase the 90 vs. 10 log-odds ratioby around 1 for 4-year enrollment and completion, and by around1.3 for enrollment in any college. Although there is variation inthe strength of the association for the different outcome mea-sures, the income inequality effects are large and positive in allof the analyses, indicating substantial support for the incomeinequality hypothesis.
Given that the takeoff in income inequality was largely charac-terized by the top of the income distribution moving away fromthe middle and bottom of the distribution, the income inequalityhypothesis would predict larger effect sizes for the 90 vs. 50 com-parison than for the 50 vs. 10 comparison. When we decomposethe 90 vs. 10 results into 90 vs. 50 and 50 vs. 10 components,we see precisely this result. The income inequality effects forthe 90 vs. 50 comparisons in all cases outweigh those for the 50vs. 10 comparisons, particularly in the analyses of 4-year collegeenrollment and completion.
But the results also provide grounds for exercising cautionwhen interpreting differences in effect sizes across the mod-els, as the effect sizes in the full and compressed male seriesare more similar for the “any college” analyses than for the 4-year analyses, where the sample sizes are smaller. Even whenanalyzing all available datasets and exploiting the full range ofvariation in income inequality over the century, our statisticalpower is limited. This is even more clear when we extend themodels summarized in Fig. 5 to include additional macro-levelregressors that social scientists have previously used to pre-dict inequalities at the college level. These additional variablesinclude the economic returns to schooling, which are assumedto influence individual decisions about whether or not to investin college education (33), and the high school graduation rate,which has been shown to influence educational expansion atthe college level (34). As shown in SI Appendix, Table S1,estimates from these models are more volatile, particularlyfor women.
The volatility arises because some of our analyses are, likepast analyses, limited to more recent cohorts in which the take-off assumes a monotonically increasing form. This makes itdifficult to adjudicate between the large number of monoton-ically increasing potential causes. An important advantage ofour full-century approach is that it reaches back to a time inwhich these competing causes did not always move together.
-.50
.51
1.5
Pred
icte
d in
crea
se in
log-
odds
ratio
4-year completion 4-year enrollment Any enrollment
M08-95
M52-95
F51-95
M08-95
M52-95
F51-95
M08-95
M52-95
F51-95
90 vs. 50 50 vs. 10
Fig. 5. Predicted increase in collegiate inequality log-odds ratios associatedwith the top 10%’s share of wages increasing by 0.08 (equivalent to thetakeoff in income inequality); 90 vs. 50 (dark gray), 50 vs. 10 (light gray),and 90 vs. 10 (total) comparisons.
Jackson and Holzman PNAS | August 11, 2020 | vol. 117 | no. 32 | 19113
Dow
nloa
ded
by g
uest
on
Janu
ary
15, 2
022

-3-2
-10
12
1 2 3 4 5 1 2 3 4 5Model Model
Full (1908-1995) Compressed (1952-1995)In
equa
lity
para
met
er e
stim
ate
× 0
.08
Fig. 6. Predicted income inequality effects (coefficients×0.08) from 1,000regressions of 90 vs. 10 inequality in “any college” enrollment on incomeinequality and random number variables, for various model specifica-tions, for full and compressed series, men only. Models: 1, Inequality; 2,Inequality+year; 3, Inequality+controls; 4, Inequality+controls+year; and 5,Inequality+controls+decade.
In Fig. 6, we present the results of a simulation exercise, inwhich we run 1,000 regressions for a range of different modelspecifications on the full and compressed male series, with eachregression including a new variable containing random numbersdrawn from a normal distribution (µ = 0; σ = 1). We exam-ine the stability of the income inequality effects with respect toinequality in college enrollment, for which we have the largestnumber of data points. We add to the basic model in Fig. 5controls for time, either in the form of 1) a linear effect ofyear or 2) dummies for decades, and measures of the returnsto schooling (33, 35, 36) and the high-school graduation rate(34, 37).
As Fig. 6 shows, the income inequality effects estimated for thefull male series are robust to the inclusion of other potential con-founding variables. But Fig. 6 also highlights the extent to whicha proper evaluation of the income inequality hypothesis requiresresearchers to exploit all of the available data. Although thebivariate analysis shows a similar effect of the income inequal-ity variable in both the full and compressed series, the effectsare a good deal more volatile in the more highly parameterizedmodels in the compressed relative to the full series.∗∗∗ The sub-stantive implication of this analysis is clear: It is only with the fulldata series that we obtain relatively precise and reliable estimatesof the association between inequality in collegiate outcomes andincome inequality.
DiscussionWe have examined descriptive evidence on the associationbetween inequality in collegiate attainment and income inequal-ity over the past century. Although there has been much recentinterest in the income inequality hypothesis, it has been difficultto make headway because commonly used datasets pertain onlyto recent decades, when income inequality was increasing. Wehave thus proceeded by reaching back to the very beginning ofthe twentieth century, assembling all of the available datasets,and harmonizing the variables in these datasets.
The results show that collegiate inequalities and incomeinequality are, in fact, rather strongly associated over the twen-tieth century. Just as with income inequality, we see evidenceof a U-turn in 90 vs. 10 collegiate inequality, and evidence of
***See SI Appendix, Fig. S10 for similar figures for 4-year enrollment and completion.
a substantial takeoff in collegiate inequalities in recent decades.When we examine trends in 90 vs. 50 and 50 vs.10 inequalities,we find that the 90 vs. 50 trends mirror the 90 vs. 10 results.Taken together, our results offer solid descriptive support for theincome inequality hypothesis.
Inequalities in collegiate attainment increased hand in handwith the expansion of college education in the United States.Rates of college enrollment and completion were higher at theend of the century than they had been at any time in the pre-ceding hundred years, and yet, for these birth cohorts, we seesubstantial inequalities, as captured in both percentage point gapand odds ratio measures. In point of fact, the only time duringthe twentieth century for which we observe a reduction in edu-cational inequality is during the period when expansion at thecollege level had paused. Although the counterfactual is obvi-ously not observable, these results emphasize the importance ofattending to the distribution of college opportunities in additionto overall levels of attainment. These distributional questions willtake on even greater significance in the context of the economicand social crisis engendered by coronavirus disease 2019, a crisisthat is likely to have enduring effects on both the distribution ofincome and access to the higher education sector.
Our analyses are not well suited to evaluating the mecha-nisms generating the association between income inequality andcollegiate inequalities. However, given the pattern of collegiateinequality across the century, we suspect that a mechanical effectis likely to be responsible. If money matters, as we know itdoes, and growing income inequality delivers more money tothe top, then, all else being equal, these additional dollars wouldin themselves produce growing inequality in college enrollmentand completion. The mechanical effect is therefore a parsi-monious account of the trend that we see here (8). That theover-time associations are substantially stronger for the 90 vs. 50comparison as compared to the 50 vs. 10 comparison providesfurther suggestive evidence in this regard. Nevertheless, there isa period for which we undoubtedly hypothesize an increase inthe relational effect of income: the Vietnam War. For the warto lead to increased collegiate inequality, the effect of incomeon educational attainment would have to increase, particularlygiven that income inequality was low and stable for these birthcohorts.
Whatever the mechanisms may be, the key descriptive resultis that, over the course of the twentieth century, a grand U-turnin collegiate inequality occurred. Cohorts born in the middle ofthe century witnessed the lowest levels of inequality in collegeenrollment and completion seen over the past hundred years.Contemporary birth cohorts, in contrast, are experiencing levelsof collegiate inequality not seen for generations.
Data Availability. The analysis code and auxiliary data requiredto produce the figures and tables in this paper can be accessedat https://osf.io/jxne5. Code to produce estimates for each ofthe individual datasets (see Table 1) is also provided. Detailson how to access these datasets are provided in SI Appendix(most datasets are available for download upon registrationwith the data provider, while others are accessible only with arestricted use license from the National Center for EducationStatistics).
ACKNOWLEDGMENTS. We thank David Cox, David Grusky, and FlorenciaTorche for their detailed comments on earlier versions of this paper, andalso Raj Chetty, Maximilian Hell, Robb Willer, the Cornell Mobility Confer-ence, the Stanford Inequality Workshop, the Stanford Sociology ColloquiumSeries, and University of California, Los Angeles’s California Center for Pop-ulation Research seminar for useful suggestions. Additionally, we thankStanford’s Center for Poverty and Inequality, Russell Sage Foundation andStanford’s United Parcel Service (UPS) Fund for research funding, Stanford’sInstitute for Research in the Social Sciences for secure data room access, andthe American Institutes for Research for data access. We are grateful to theeditor and reviewers for their helpful and productive suggestions.
19114 | www.pnas.org/cgi/doi/10.1073/pnas.1907258117 Jackson and Holzman
Dow
nloa
ded
by g
uest
on
Janu
ary
15, 2
022

SOCI
AL
SCIE
NCE
S
1. A. B. Krueger, The Rise and Consequences of Inequality in the United States. Speechat the Center for American Progress (Washington, DC, 12 January 2012). https://cdn.americanprogress.org/wp-content/uploads/events/2012/01/pdf/krueger.pdf. Accessed8 July 2020.
2. K. M. Neckerman, F. Torche, Inequality: Causes and consequences. Annu. Rev. Sociol.33, 335–357 (2007).
3. J. Davis, B. Mazumder, The decline in intergenerational mobility after 1980. FRB ofChicago Working Paper, WP-2017-5 (2017). https://www.chicagofed.org/publications/working-papers/2017/wp2017-05. Accessed 8 July 2020.
4. P. A. Mitnik, E. Cumberworth, D. B. Grusky, Social mobility in a high-inequalityregime. Ann. Am. Acad. Polit. Soc. Sci. 663, 140–184 (2016).
5. R. Chetty, N. Hendren, P. Kline, E. Saez, N. Turner, Is the United States still a land ofopportunity? Recent trends in intergenerational mobility. Am. Econ. Rev. 104, 141–147 (2014).
6. M. J. Bailey, S. M. Dynarski, “Inequality in postsecondary education” in WhitherOpportunity, G. J. Duncan, R. J. Murnane, Eds. (Russell Sage Foundation, 2011), pp.117–132.
7. K. M. Ziol-Guest, K. T. H. Lee. Parent income–based gaps in schooling: Cross-cohorttrends in the NLSYs and the PSID. AERA Open 2, 1–10 (2016).
8. G. J. Duncan, A. Kalil, K. M. Ziol-Guest, Increasing inequality in parent incomes andchildren’s schooling. Demography 54, 1603–1626 (2017).
9. S. F. Reardon, “The widening academic achievement gap between the rich andthe poor: New evidence and possible explanations” in Whither Opportunity,G. J. Duncan, R. J. Murnane, Eds. (Russell Sage Foundation, 2011), pp. 91–116.
10. E. A. Hanushek, P. E. Peterson, L. M. Talpey, L. Woessmann, The unwavering SESachievement gap: Trends in US student performance (Rep. W25648, National Bureauof Economic Research, 2019).
11. N. G. Hilger, The great escape: Intergenerational mobility in the United States since1940 (Rep. W21217, National Bureau of Economic Research, 2015).
12. R. D. Mare, Change and stability in educational stratification. Am. Socio. Rev. 2, 72–87(1981).
13. D. Hirschman, Rediscovering the 1%: Economic expertise and inequality knowledge.SocArXiv:10.31235/osf.io/4dws8 (13 July 2016).
14. Census Bureau, CPS historical time series tables on school enrollment (2018). https://www.census.gov/content/census/en/data/tables/time-series/demo/school-enrollment/cps-historical-time-series.html. Accessed 8 July 2020.
15. S. Flood, M. King, R. Rodgers, S. Ruggles, J. R. Warren, Integrated Public UseMicrodata Series (IPUMS), Current Population Survey: Version 6.0. IPUMS, 2018.https://cps.ipums.org/cps/. Accessed 8 July 2020.
16. C. Goldin, L. F. Katz, I. Kuziemko, The homecoming of American college women: Thereversal of the college gender gap. J. Econ. Perspect. 20, 133–156 (2006).
17. T. A. DiPrete, C. Buchmann, The Rise of Women: The Growing Gender Gap inEducation and What It Means for American Schools (Russell Sage Foundation,2013).
18. D. Card, T. Lemieux, Going to college to avoid the draft: The unintended legacy ofthe Vietnam War. Am. Econ. Rev. 91, 97–102 (2001).
19. J. D Angrist, S. H. Chen, Schooling and the Vietnam-era GI Bill: Evidence from thedraft lottery. Am. Econ. J. Appl. Econ. 3, 96–118 (2011).
20. J. Bound, M. F. Lovenheim, S. Turner, Why have college completion rates declined?An analysis of changing student preparation and collegiate resources. Am. Econ. J.Appl. Econ. 2, 129–57 (2010).
21. D. L. Featherman, R. M. Hauser, Opportunity and Change (Academic, 1978).22. R. M. Hauser, M. Andrew, Reliability of student and parent reports of socio-
economic status in NELS-88. University of Wisconsin-Madison working paper, (2007).https://pdfs.semanticscholar.org/34da/152939d0497e7809c50b7d99d117fb427960.pdf.Accessed 8 July 2020.
23. J. C. Moore, L. L. Stinson, E. J. Welniak, Income measurement error in surveys: Areview. J. Off. Stat. 16, 331–362 (2000).
24. J. P. Simmons, L. D. Nelson, U. Simonsohn, False-positive psychology: Undisclosed flexi-bility in data collection and analysis allows presenting anything as significant. Psychol.Sci. 22, 1359–1366 (2011).
25. T. J. Hastie, “Generalized additive models” in Statistical Models in S, J. M. Chambers,T. J. Hastie, Eds. (Taylor and Francis Group, 2017), pp. 249–307.
26. T. J. Hastie, GAM: Generalized additive models, R package version 1.16, https://cran.r-project.org/web/packages/gam/index.html. Accessed 8 July 2020.
27. T. Piketty, E. Saez, Income inequality in the United States, 1913–1998. Q. J. Econ. 118,1–39 (2003).
28. M. Hout, A. Janus, “Educational mobility in the United States since the 1930s” inWhither Opportunity, G. J. Duncan, R. J. Murnane, Eds. (Russell Sage Foundation,2011), pp. 165–186.
29. O. D. Duncan, D. L. Featherman, B. Duncan, Socioeconomic Background andAchievement (Seminar, 1972).
30. M. Stanley, College education and the midcentury GI Bills. Q. J. Econ. 118, 671–708(2003).
31. G. J. Duncan, K. Magnuson, E. Votruba-Drzal, Boosting family income to promotechild development. Future Child. 24, 99–120 (2014).
32. H. Hoynes, D. Whitmore Schanzenbach, D. Almond, Long-run impacts of childhoodaccess to the safety net. Am. Econ. Rev. 106, 903–934 (2016).
33. C. Goldin, L. F. Katz, The Race between Education and Technology: The Evolu-tion of US Educational Wage Differentials, 1890 to 2005 (Harvard University Press,2009).
34. J. J. Heckman, P. A. LaFontaine, The American high school graduation rate: Trendsand levels. Rev. Econ. Stat. 92, 244–262 (2010).
35. D. Acemoglu, D. Autor, “Skills, tasks and technologies: Implications for employ-ment and earnings” in Handbook of Labor Economics, O. C. Ashenfelter, Ed. (Elsevier,2011), vol. 4, pp. 1043–1171.
36. R. G. Valletta, “Recent flattening in the higher education wage premium: Polar-ization, skill downgrading, or both?” in Education, Skills, and Technical Change:Implications for Future US GDP Growth, C. R. Hulten, V. A. Ramey, Eds. (Universityof Chicago Press, 2018), pp. 313–342.
37. T. D. Snyder, C. de Brey, S. A. Dillow, Digest of Education Statistics 2015 (Pub. 2016-014, National Center for Education Statistics, 2016).
Jackson and Holzman PNAS | August 11, 2020 | vol. 117 | no. 32 | 19115
Dow
nloa
ded
by g
uest
on
Janu
ary
15, 2
022