the current sugarcane pricing policy & its critical analysis · sugarcane pricing policy ¥!...
TRANSCRIPT

The Current Sugarcane Pricing Policy & its Critical Analysis
Mr. Tarun Sawhney
President - ISMA

Current Sugarcane Pricing Mechanism
Recommendations of Various Committees
Sugarcane Price Impact wrt various factors
Demand – Supply Scenario
Way Forward
2

Current Sugarcane Pricing Mechanism
3

Sugarcane Pricing Policy
• Sugar industry is an important agro – based industry
• About 50 million Sugarcane farmers
• Around 5 lakh workers directly employed in sugar mills
• Indian sugar industry’s annual output is approximately Rs.80,000 crore
Key Objectives of all Sugarcane policies
a fair price to cane growers
adequate returns to industry
supply of sugar to consumers at reasonable prices
4
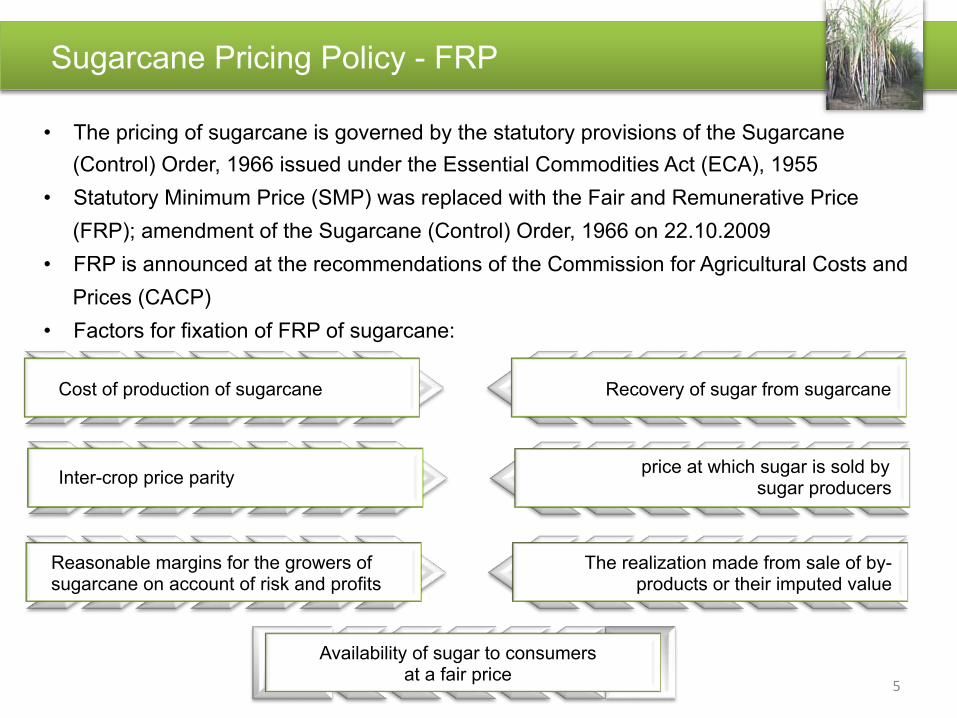
Sugarcane Pricing Policy - FRP
• The pricing of sugarcane is governed by the statutory provisions of the Sugarcane
(Control) Order, 1966 issued under the Essential Commodities Act (ECA), 1955
• Statutory Minimum Price (SMP) was replaced with the Fair and Remunerative Price
(FRP); amendment of the Sugarcane (Control) Order, 1966 on 22.10.2009
• FRP is announced at the recommendations of the Commission for Agricultural Costs and
Prices (CACP)
• Factors for fixation of FRP of sugarcane:
Cost of production of sugarcane
Inter-crop price parity
Reasonable margins for the growers of sugarcane on account of risk and profits
Recovery of sugar from sugarcane
price at which sugar is sold by sugar producers
The realization made from sale of by-products or their imputed value
Availability of sugar to consumers at a fair price
5
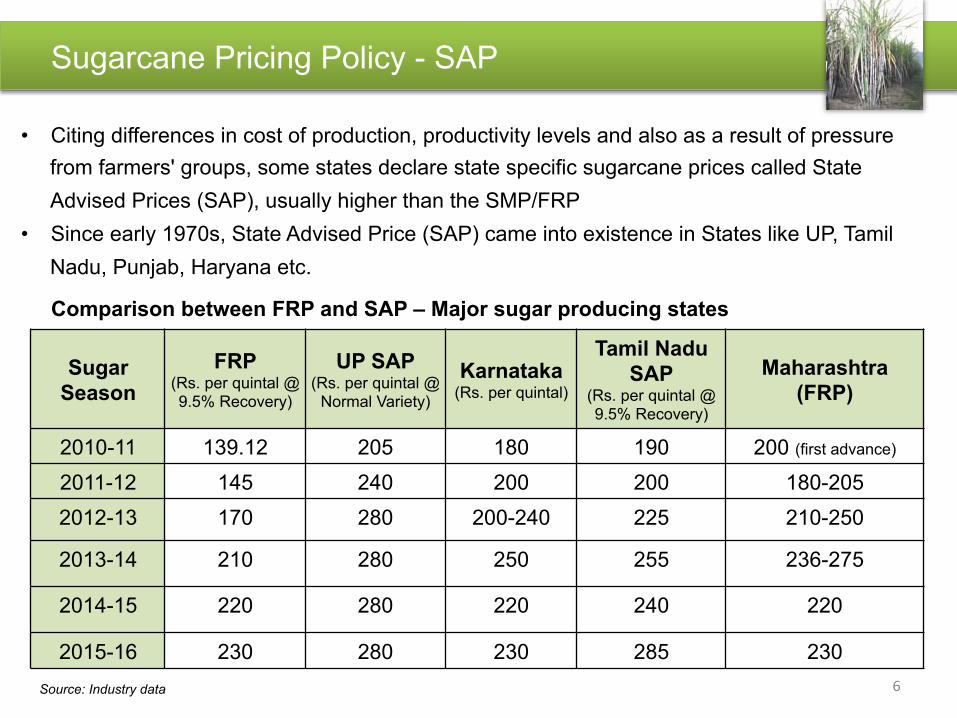
Sugarcane Pricing Policy - SAP
• Citing differences in cost of production, productivity levels and also as a result of pressure
from farmers' groups, some states declare state specific sugarcane prices called State
Advised Prices (SAP), usually higher than the SMP/FRP
• Since early 1970s, State Advised Price (SAP) came into existence in States like UP, Tamil
Nadu, Punjab, Haryana etc.
Sugar
Season
FRP (Rs. per quintal @ 9.5% Recovery)
UP SAP (Rs. per quintal @
Normal Variety)
Karnataka (Rs. per quintal)
Tamil Nadu
SAP (Rs. per quintal @ 9.5% Recovery)
Maharashtra
(FRP)
2010-11 139.12 205 180 190 200 (first advance)
2011-12 145 240 200 200 180-205
2012-13 170 280 200-240 225 210-250
2013-14 210 280 250 255 236-275
2014-15 220 280 220 240 220
2015-16 230 280 230 285 230
Source: Industry data
Comparison between FRP and SAP – Major sugar producing states
6

Sugarcane Pricing Policy - FRP v/s SAP
• Dual sugarcane pricing distorts sugarcane and sugar economy and leads to cane price
arrears
• UP declare SAP for rejected variety at just Rs.5/qtl price differential with common variety
due to which farmers are not motivated to grow better varieties
• CACP in 2015-16 report recommended that SAP of rejected variety, if any, be kept at a
Rs.20/qtl lower than that of the common variety to help improve recovery rate and
overall efficiency
• High SAPs without any linkage with the output price is unviable
• Higher SAP than FRP led to year on year rise in cane price arrears
• Industry association recommends to remove the system of SAP; in case states
announce SAP, such price differential should be borne by the state governments
Dual Sugarcane Pricing Policy Mechanism is Unsustainable
7

Recommendations of Various Committees
8

Recommendations of Various Committees on Sugarcane Price Policy
• Tuteja Committee (2004)
Payment of SMP along with price sharing benefits as per Clause 5A to continue
• Thorat Committee (2009)
Government should withdraw from fixing price of sugarcane
Mills and farmers should settle prices and terms of raw material supply
• Nanda kumar Committee (2010)
Recommends for a fixed % of sugar, bagasse & Molasses realisation
Guarantees share to farmers of hike in sugar prices in off-season
Ensures a fair return/ savings to sugar mills too
• Dr. C. Rangarajan Committee (2012)
Linkage of sugarcane price with realisation of sugar and its first level of by-products
A minimum price fixed for sugarcane (FRP)
The actual payment for cane dues would happen in two steps. The first would be payment
of FRP at floor price as per extant mechanism
Balance payment of cane dues will be done subsequent to publication of half-yearly ex-mill
prices and values of the by-products
Source: Information based on public documents 9
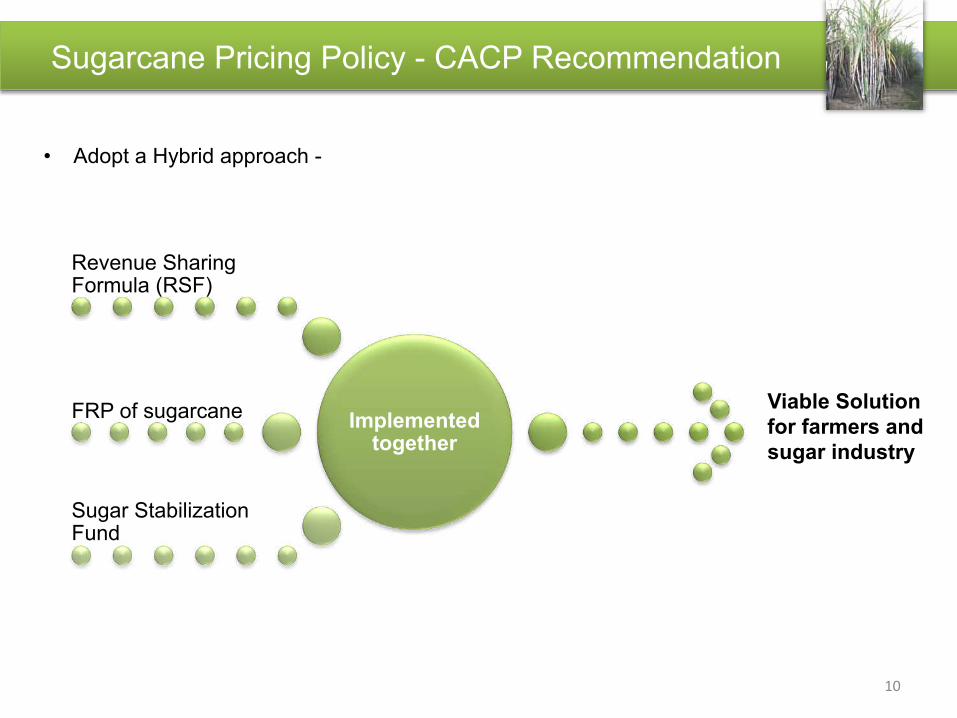
Sugarcane Pricing Policy - CACP Recommendation
• Adopt a Hybrid approach -
Implemented together
Revenue Sharing Formula (RSF)
FRP of sugarcane
Sugar Stabilization Fund
Viable Solution
for farmers and
sugar industry
10

Sugarcane Price Impact wrt various factors
11

Sugarcane Price /Kg of Sugar State Wise Comparative
• Impact of sugarcane price on cost of production:
Recovery
%
Cane Required For 1 tonne
of Sugar (in tonnes)
Cane Rate
(PMT)
Cane Price per
Tonne of Sugar
2015-16(*)
UP 10.60% 9.434 2800 26,415.09
Maharashtra 11.30% 8.850 2733 24,187.05
Karnataka 10.80% 9.259 2615 24,212.85
2014-15
UP 9.54% 10.482 2800 29,350.10
Maharashtra 11.29% 8.857 2640 23389.00
Karnataka 11.06% 9.046 2561 23166.81
2013-14
UP 9.26% 10.799 2800 30,237.58
Maharashtra 11.40% 8.772 2522 22124.00
Karnataka 10.95% 9.132 2500 22831.05
(*)Estimates 12
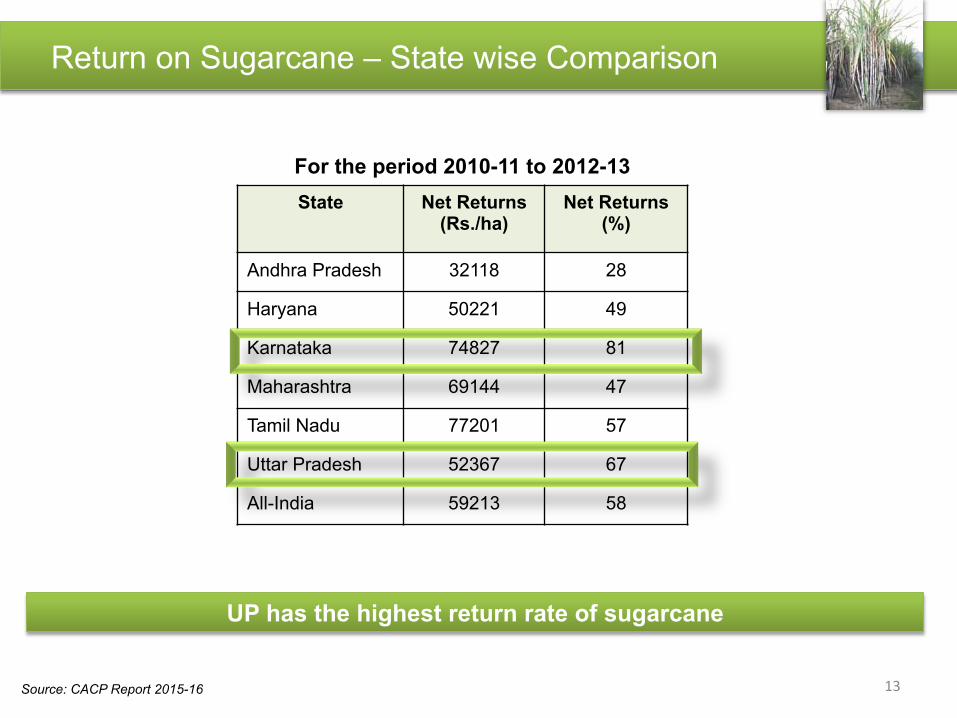
Return on Sugarcane – State wise Comparison
State Net Returns (Rs./ha)
Net Returns (%)
Andhra Pradesh 32118 28
Haryana 50221 49
Karnataka 74827 81
Maharashtra 69144 47
Tamil Nadu 77201 57
Uttar Pradesh 52367 67
All-India 59213 58
For the period 2010-11 to 2012-13
Source: CACP Report 2015-16
UP has the highest return rate of sugarcane
13
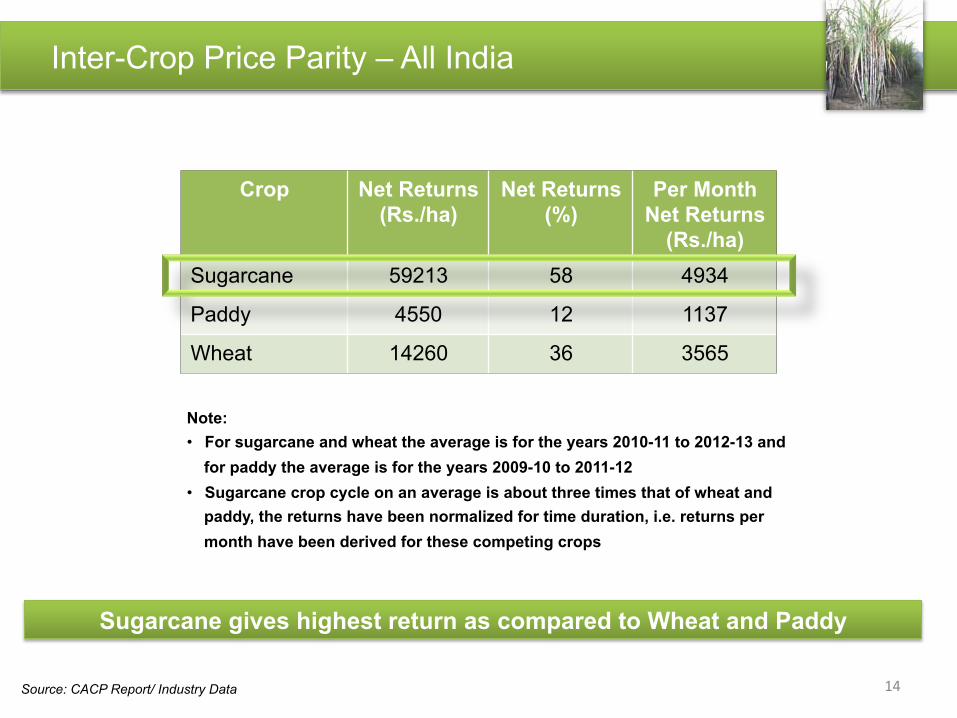
Inter-Crop Price Parity – All India
Crop Net Returns
(Rs./ha)
Net Returns
(%)
Per Month
Net Returns
(Rs./ha)
Sugarcane 59213 58 4934
Paddy 4550 12 1137
Wheat 14260 36 3565
Note:
• For sugarcane and wheat the average is for the years 2010-11 to 2012-13 and
for paddy the average is for the years 2009-10 to 2011-12
• Sugarcane crop cycle on an average is about three times that of wheat and
paddy, the returns have been normalized for time duration, i.e. returns per
month have been derived for these competing crops
Source: CACP Report/ Industry Data
Sugarcane gives highest return as compared to Wheat and Paddy
14

Sugarcane Price /Kg Of Sugar Country Wise Comparative
Recovery
%
Cane Required For
1 tonne of Sugar
(in tonnes)
Cane Rate
(PMT) Currency
Cane Price per
Tonne of
Sugar (USD)
Cane Price per
Tonne of Sugar
(INR @ 67/USD)
India 10.37% 9.64 2511 INR 361.3 24206
Thailand 10.20% 9.80 900 BAHT 342.4 22940
Brazil 13.5% 7.41 26 USD 192.7 12911
India has the highest sugarcane price in comparison to Thailand & Brazil
Source: Public domain information 15

Demand – Supply Scenario
16

Demand – Supply Scenario
• Two demand sources of sugar – Bulk Buyers & Direct Household
• Supply is linked to domestic sugar production, imports and exports
Bulk Consumers
60%
Direct Household
40%
Sugar Demand
Source: Industry data
Since the bulk of sugar is consumed indirectly, any impact of the sugar price increase will not have major impact in the overall household budget
17
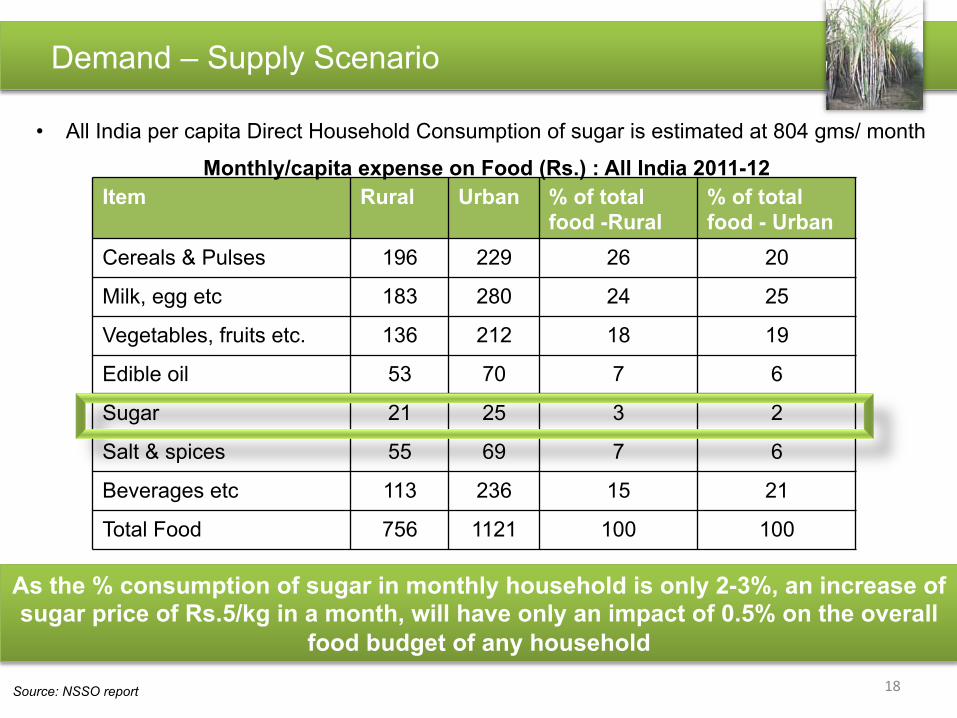
Demand – Supply Scenario
• All India per capita Direct Household Consumption of sugar is estimated at 804 gms/ month
Source: NSSO report
As the % consumption of sugar in monthly household is only 2-3%, an increase of sugar price of Rs.5/kg in a month, will have only an impact of 0.5% on the overall
food budget of any household
Item Rural Urban % of total
food -Rural
% of total
food - Urban
Cereals & Pulses 196 229 26 20
Milk, egg etc 183 280 24 25
Vegetables, fruits etc. 136 212 18 19
Edible oil 53 70 7 6
Sugar 21 25 3 2
Salt & spices 55 69 7 6
Beverages etc 113 236 15 21
Total Food 756 1121 100 100
Monthly/capita expense on Food (Rs.) : All India 2011-12
18

Way Forward
19
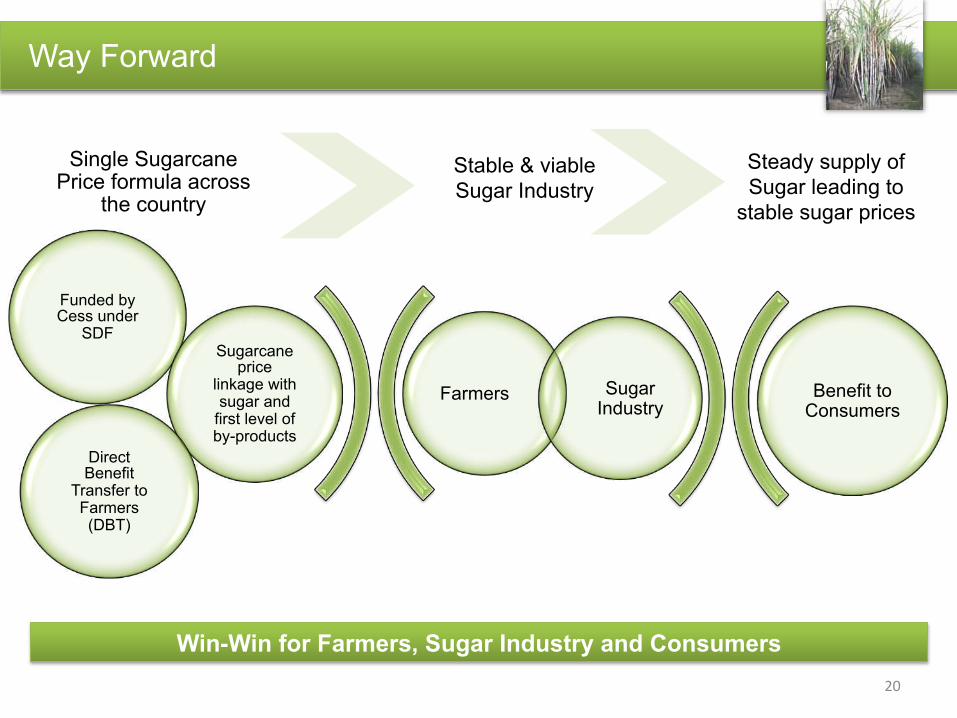
Way Forward
Win-Win for Farmers, Sugar Industry and Consumers
Farmers Sugar Industry
Funded by Cess under
SDF Sugarcane
price linkage with sugar and
first level of by-products
Direct Benefit
Transfer to Farmers (DBT)
Benefit to Consumers
Stable & viable
Sugar Industry
Single Sugarcane Price formula across
the country
Steady supply of
Sugar leading to
stable sugar prices
20

Way Forward
Single Sugarcane Price formula across the country
• In 2015-16 report, CACP recommended that under the Revenue Sharing Formula (RSF),
the Total Revenue Pot (TRP) generated from the cane-sugar value chain, which is the
value of sugar and its first stage by-products, be shared between the farmers and the
millers in the ratio of their relative costs in producing cane at farm level and converting
that cane into sugar and its by-products at factory level.
• Based on the Commission’s in-depth study undertaken earlier, this ratio works out to
75:25 at 10.31 recovery rate.
• However, arrangement under RSF needs to be aligned with FRP to protect the farmers in
the event of any downward movement in prices of sugarcane. The FRP would serve as
the floor price which the farmers would receive even when sugar prices fall to a level
which leads to prices lower than FRP.
• In-line with the recent Sugarcane Acts of Karnataka & Maharashtra
21

Way Forward
Single Sugarcane Price across the country
• It is recommended that if price determined on a revenue sharing formula is less than FRP, the
difference be financed by the Cess Fund under SDF
• The Central government has already passed the Sugar Cess (Amendment) Bill to allow
enhancement in the ceiling of the sugar cess from the current Rs 0.25 to Rs 2/kg
• The proceeds from which will be used to facilitate liquidation of cane payment dues to farmers
• This will help in creating a Sugar Reserve (SR) which can be used for making cane payments
to farmers when sugar realisation is lower than FRP
• The funds from SR to the farmers can be transferred directly through Direct Benefit Transfer
route (DBT)
• The DBT route has been successfully implemented during 2014-15 season by UP
Government for distribution of cane arrears to millions of farmers’ accounts directly and
Central Government subsidy of Rs. 45/ tonne would also be transferred through this route
• The cess can be levied in a graded manner depending on sugar prices so that it will not have
any impact on the consumer
• A cess of Rs. 4/ kg can create a SR of Rs. 10,000 crore without impacting consumers
22
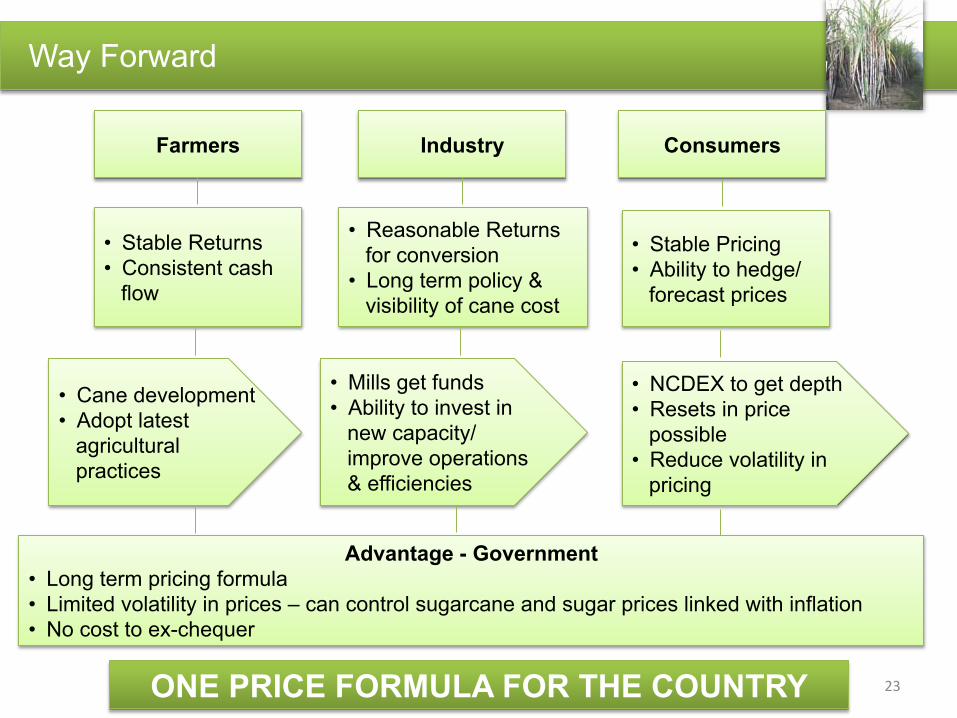
Way Forward
Farmers Industry Consumers
• Stable Returns
• Consistent cash
flow
• Reasonable Returns
for conversion
• Long term policy &
visibility of cane cost
• Stable Pricing
• Ability to hedge/
forecast prices
• Cane development
• Adopt latest
agricultural
practices
• Mills get funds
• Ability to invest in
new capacity/
improve operations
& efficiencies
• NCDEX to get depth
• Resets in price
possible
• Reduce volatility in
pricing
Advantage - Government
• Long term pricing formula
• Limited volatility in prices – can control sugarcane and sugar prices linked with inflation
• No cost to ex-chequer
ONE PRICE FORMULA FOR THE COUNTRY 23
Thank You
24