brazilian sugarcane industry association uniÃo … · 1 joel velasco chief representative –...
TRANSCRIPT
1
Joel Velasco
Chief Representative – North America [email protected] www.unica.com.br
BRAZILIAN SUGARCANE INDUSTRY ASSOCIATION UNIÃO DA INDÚSTRIA DE CANA-DE-AÇÚCAR

2
OUTLINE
①! Introduction •! Brazil’s diversified sugarcane industry
②! Building Blocks of Energy Security •! Feedstock + Infrastructure + Price
③! Sugarcane & Climate Change •! Replacing fossils fuels with something better
④! Sugarcane & Sustainability •! Improving on sustainable practices
⑤! Global Biofuels Market •! Still a small, highly protected market
⑥! Sugarcane in the United States •! Meeting mandates sustainably

3 3
①!
4
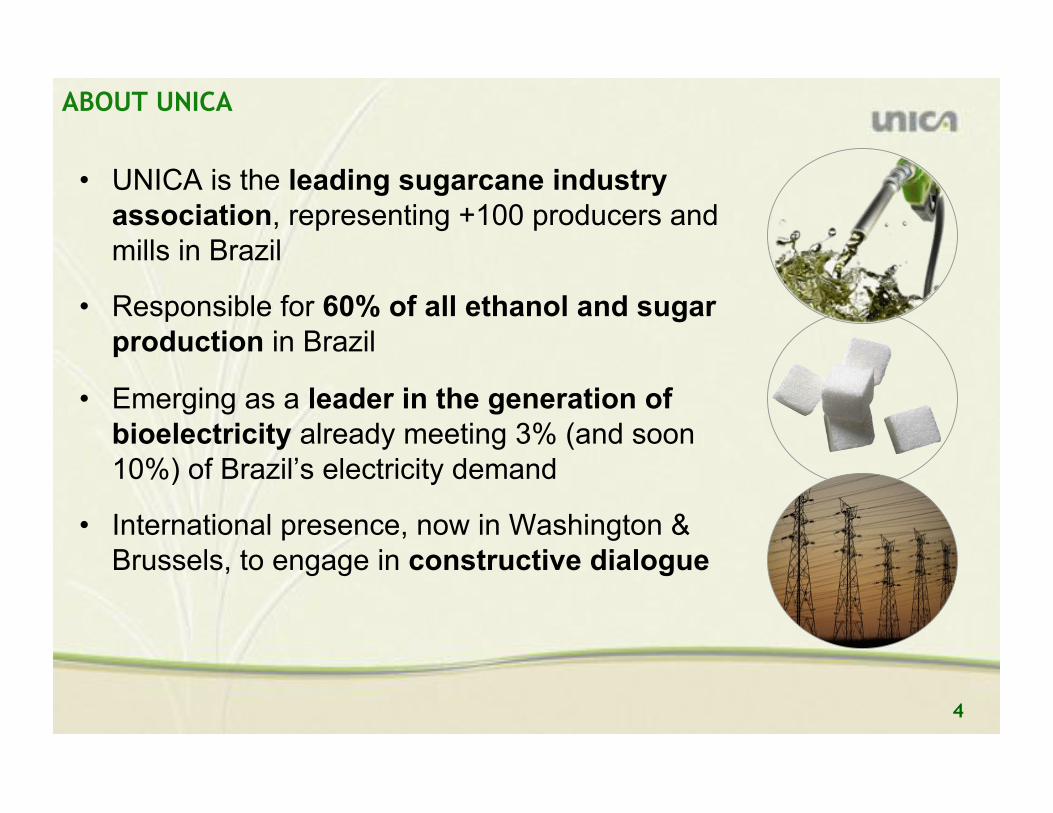
ABOUT UNICA
•! UNICA is the leading sugarcane industry association, representing +100 producers and mills in Brazil
•! Responsible for 60% of all ethanol and sugar production in Brazil
•! Emerging as a leader in the generation of bioelectricity already meeting 3% (and soon 10%) of Brazil’s electricity demand
•! International presence, now in Washington & Brussels, to engage in constructive dialogue

5 Source: Ministry of Mines and Energy BEN (2008).
Other renewables 3.0%
Petroleum 36.7%
Natural Gas 9.6%
Coal 6.0% Uranium
1.6%
Hydroelectricity 14.7%
Other biomass 12.4%
SUGARCANE IS #1 RENEWABLE ENERGY SOURCE
6
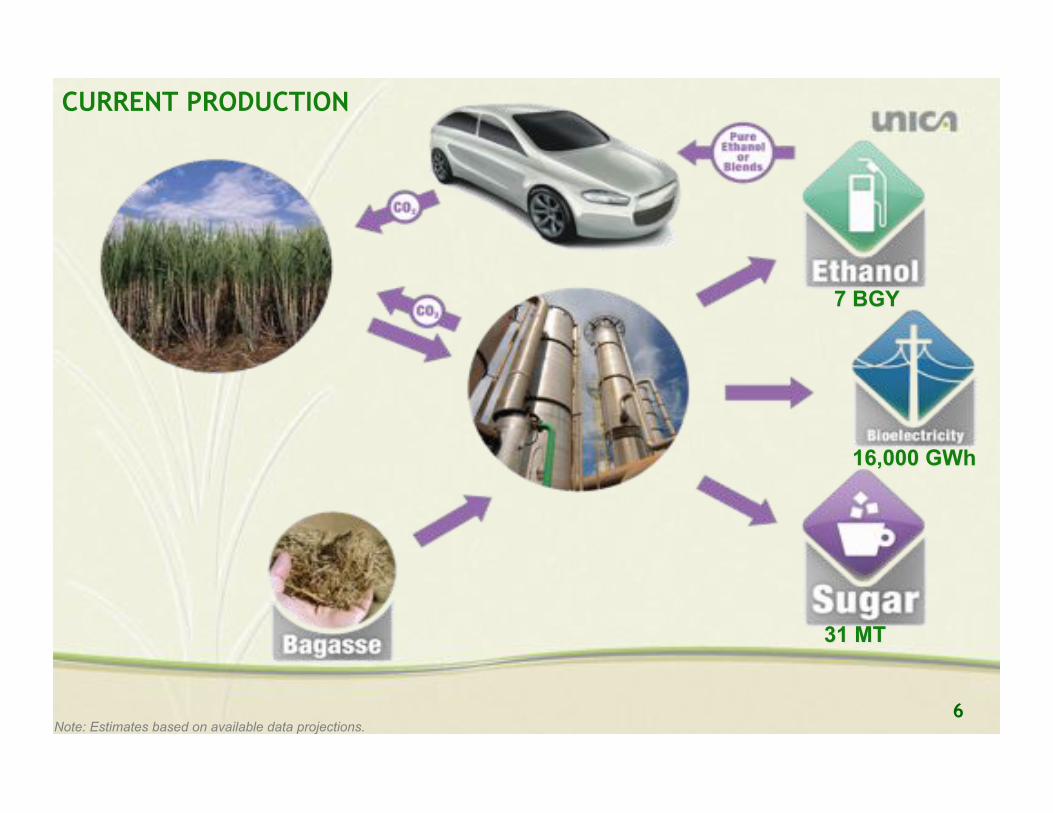
CURRENT PRODUCTION
Note: Estimates based on available data projections.
7
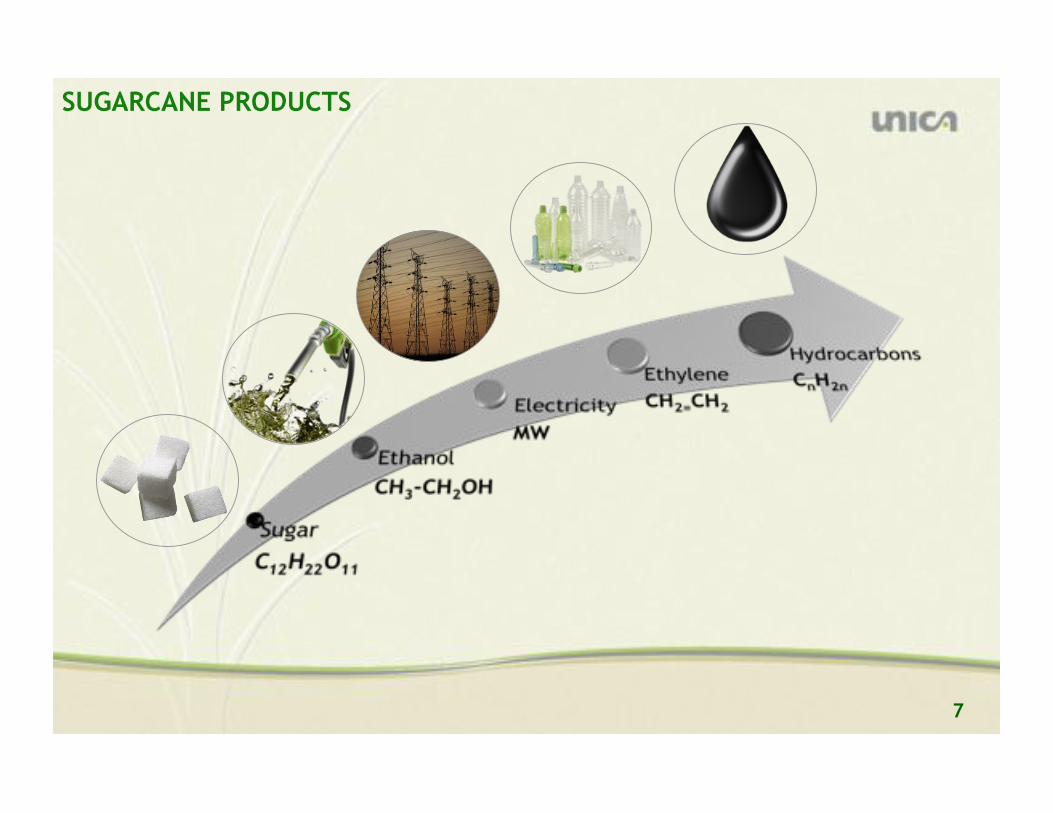
SUGARCANE PRODUCTS

8
BRAZILIAN PRODUCTION & ESTIMATES
Note: e = estimated data due to Northeast harvest; potential generation of surplus electricity has been calculated based on the utilization of 75% of the available bagasse and 50% of the available straw, and considering the sugarcane production during most recent harvest, Sources UNICA.
2008/09e 2015/16 2020/21
Sugarcane production (million tons) 569 829 1,038
Sugar (million tons) 31 41.3 45.0
Domestic Market and Stocks 10.2 11.4 12.1
Export 20.8 29.9 32.9
Ethanol (billion gallons) 7.2 12.4 17.2
Domestic Market and Stocks 6 9.2 13.1
Export 1.2 3.2 4.1
Bioelectricity (MW average) 1,800 8,158 13,158
Share of electricity demand (%) 3% 11% 14%
9 9
②!

10
FEEDSTOCK: WHERE SUGARCANE IS GROWN
Sources: NIPE-Unicamp, IBGE and CTC
South-Central region
represents about 90% of sugarcane harvest
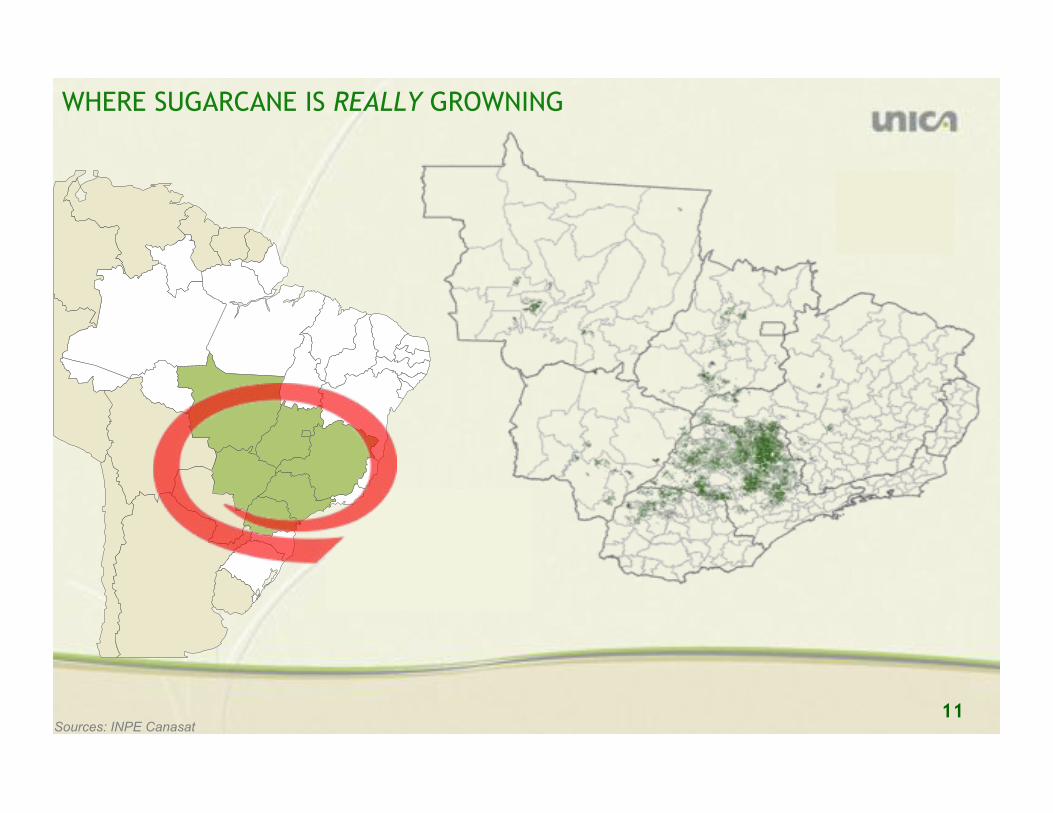
11 Sources: INPE Canasat
WHERE SUGARCANE IS REALLY GROWNING
12
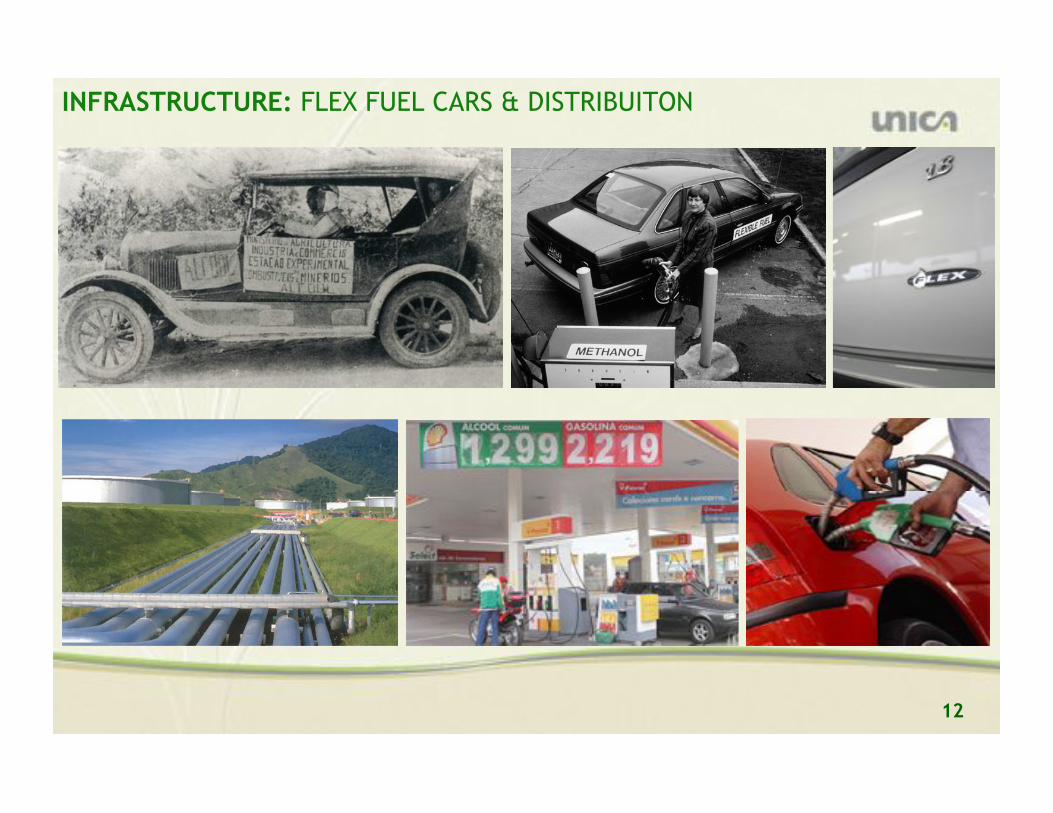
INFRASTRUCTURE: FLEX FUEL CARS & DISTRIBUITON
13
0
1
2
3
4
5
6
7
8
0
200
400
600
800
1,000
1,200
1,400
Mill
ion
Ve
hic
les
Mill
ion
Lite
rs
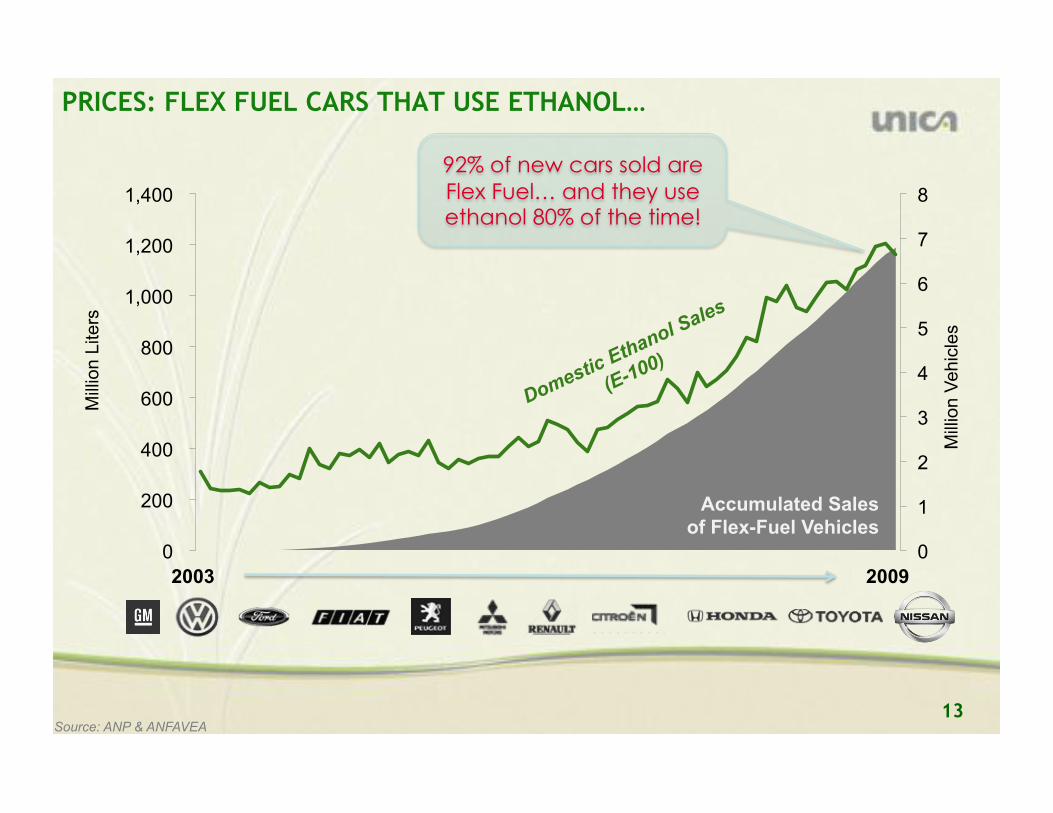
PRICES: FLEX FUEL CARS THAT USE ETHANOL…
Accumulated Sales of Flex-Fuel Vehicles
Source: ANP & ANFAVEA
92% of new cars sold are
Flex Fuel… and they use ethanol 80% of the time!
2009 2003
14
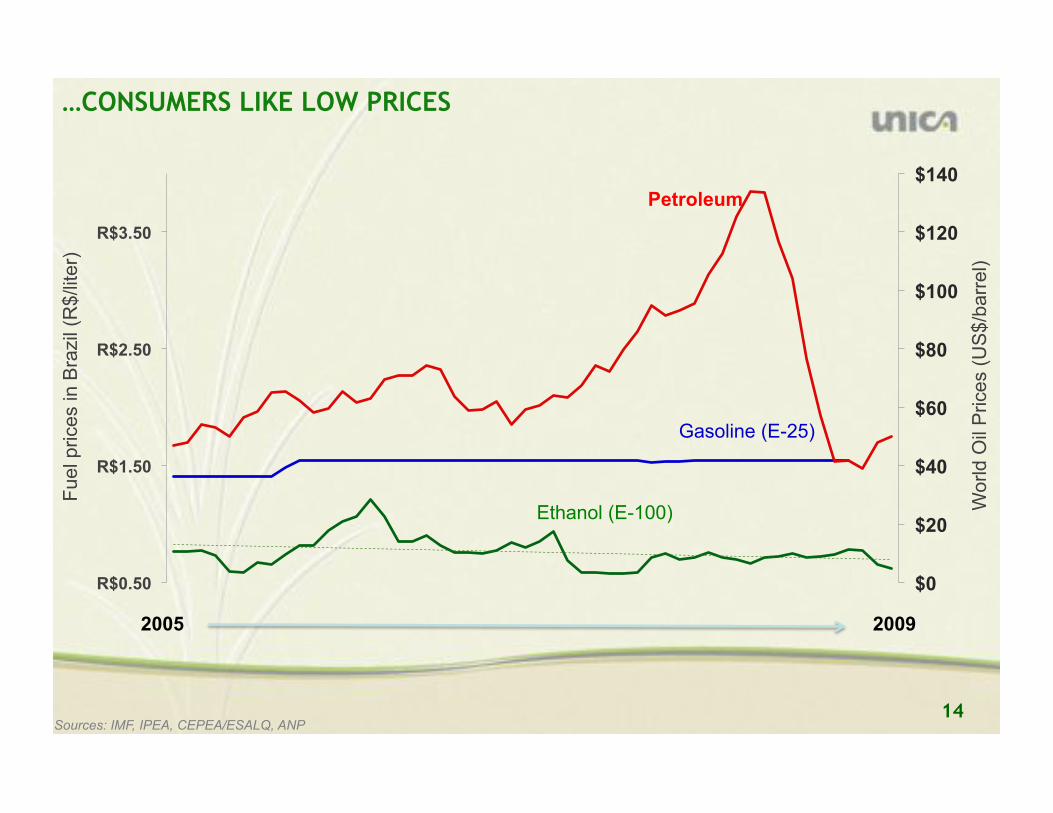
$0
$20
$40
$60
$80
$100
$120
$140
R$0.50
R$1.50
R$2.50
R$3.50
Petroleum
Gasoline (E-25)
Ethanol (E-100)
Sources: IMF, IPEA, CEPEA/ESALQ, ANP
2005 2009
…CONSUMERS LIKE LOW PRICES
World O
il P
rices (
US
$/b
arr
el)
Fuel prices in B
razil
(R$/liter)
15
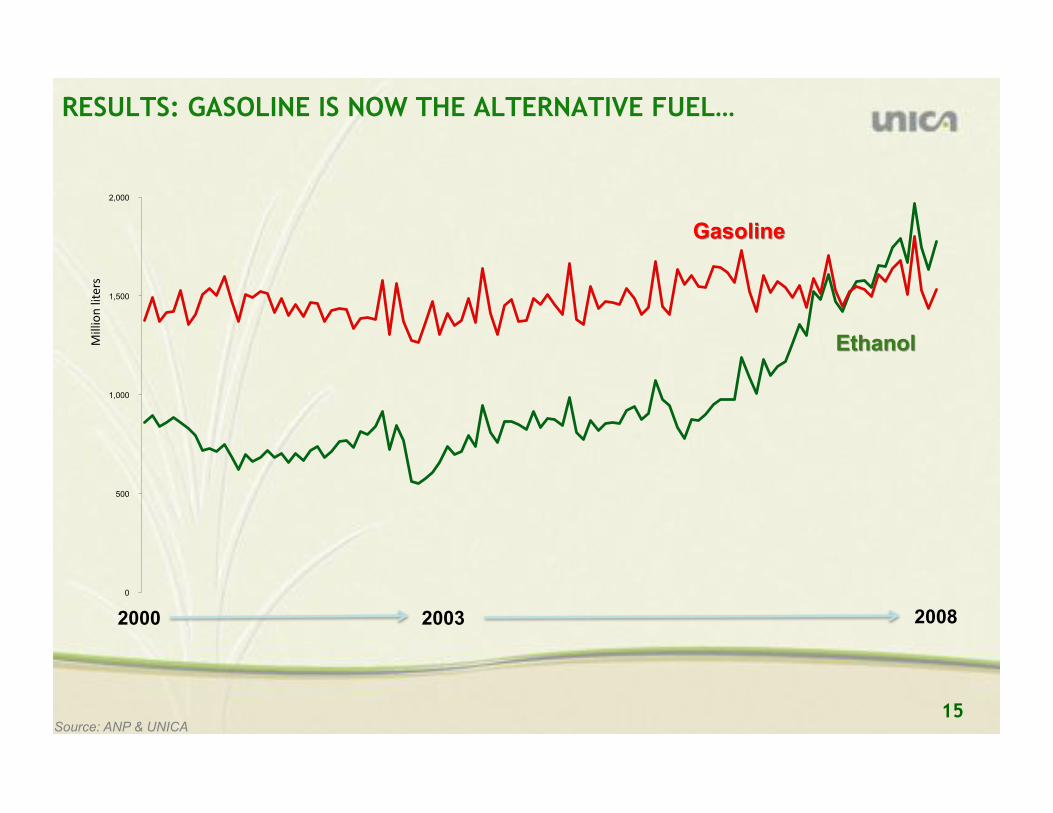
0
500
1,000
1,500
2,000
!"##"$%&#"'()*&
RESULTS: GASOLINE IS NOW THE ALTERNATIVE FUEL…
Source: ANP & UNICA
2000 2008 2003

16
Millions of Hectares (2007) %
total land
%
arable land
BRAZIL 851
TOTAL ARABLE LAND 354.8
1. Total Crop Land 76.7 9.0% 21.6%
Soybean 20.6 2.4% 5.8%
Corn 14.0 1.6% 3.9%
Sugarcane 7.8 0.9% 2.2%
Sugarcane for ethanol 3.4 0.4% 1.0%
Orange 0.9 0.1% 0.3%
2. Pastures 172.3 20% 49%
3. Available area Total arable land – (crop land + pastures)
105.8 12% 30%
…1% OF ARABLE LAND DISPLACES 50% GASOLINE
Sources: IBGE, UNICA
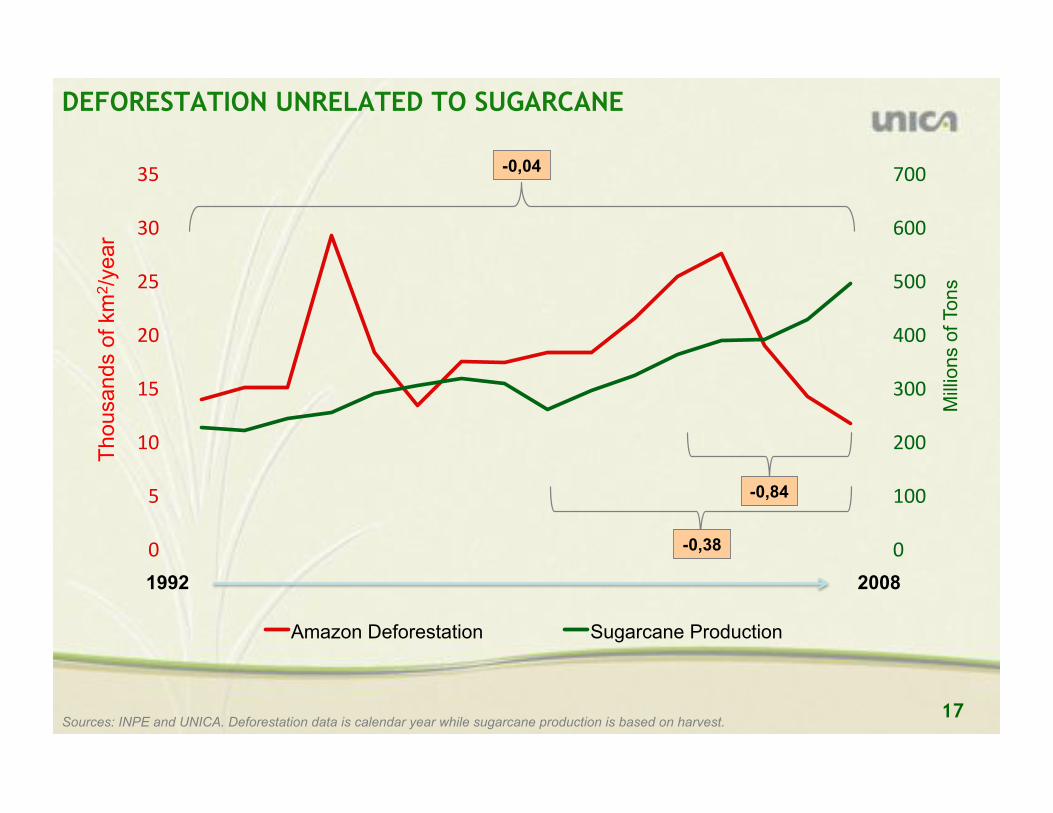
17 Sources: INPE and UNICA. Deforestation data is calendar year while sugarcane production is based on harvest.
+&
,++&
-++&
.++&
/++&
0++&
1++&
2++&
+&
0&
,+&
,0&
-+&
-0&
.+&
.0&
Mill
ions o
f Ton
s
Thousands o
f km
2/y
ear
Amazon Deforestation Sugarcane Production
-0,84
-0,38
-0,04
1992 2008
DEFORESTATION UNRELATED TO SUGARCANE

18 18
③!
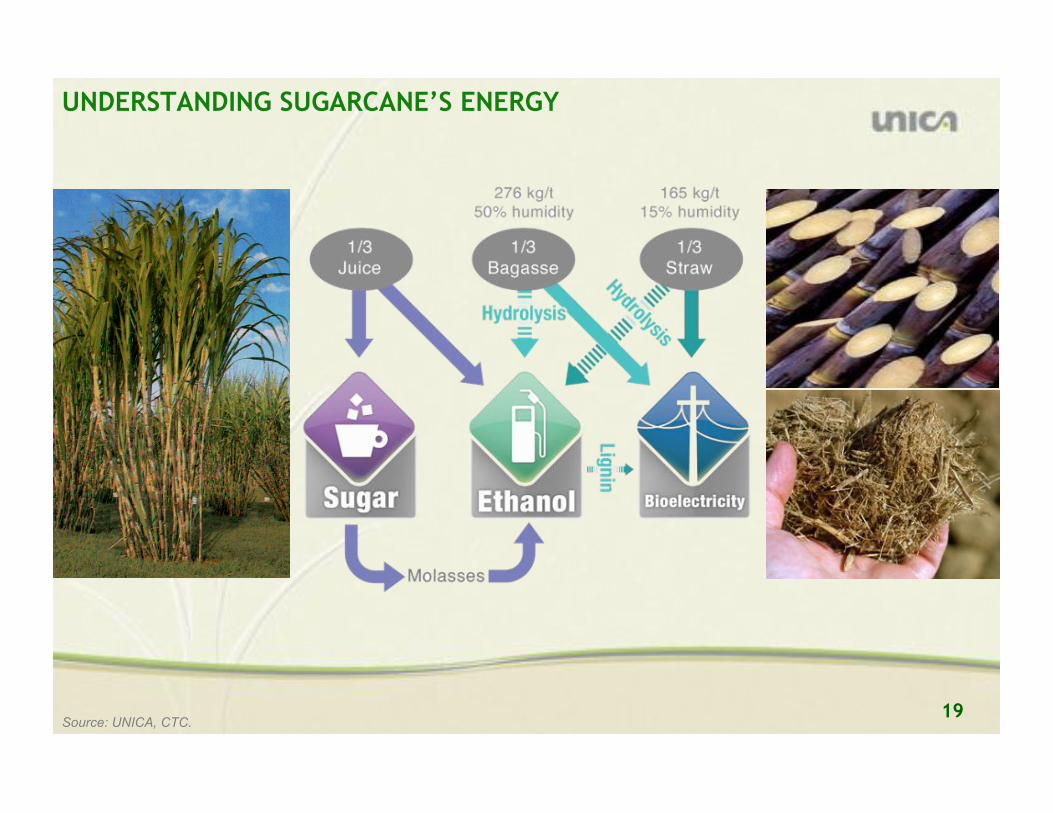
19 Source: UNICA, CTC.
UNDERSTANDING SUGARCANE’S ENERGY
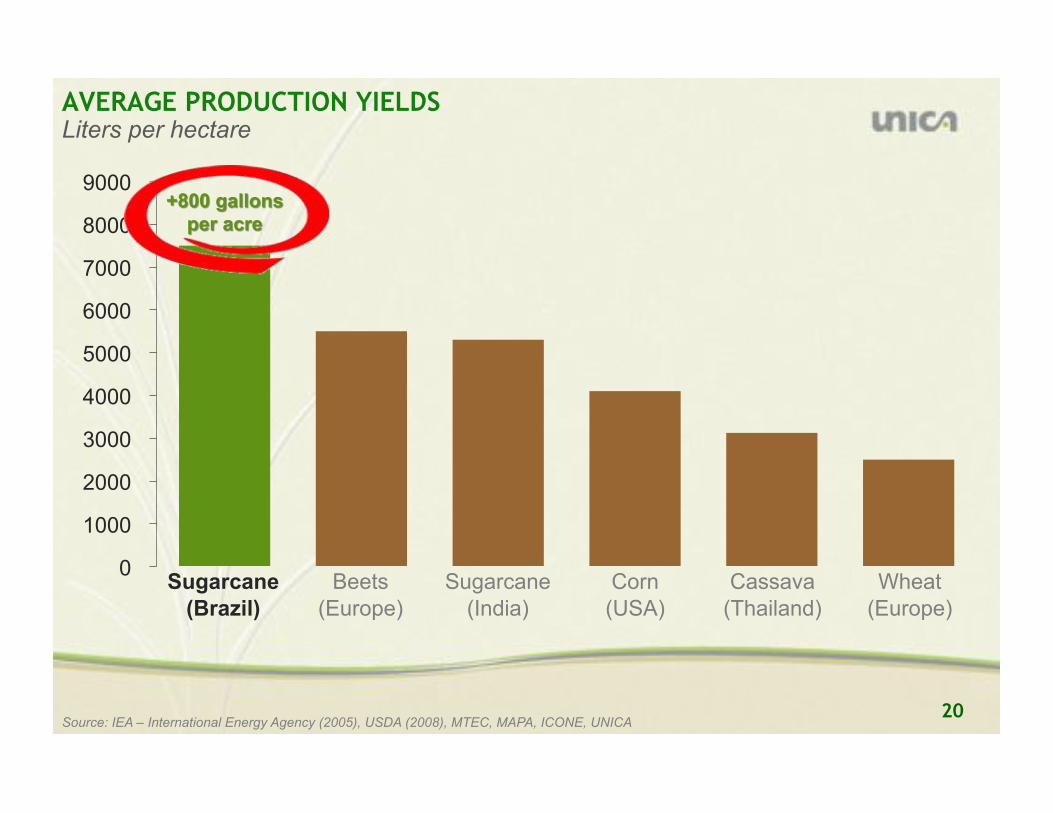
20
0
1000
2000
3000
4000
5000
6000
7000
8000
9000
Liters per hectare AVERAGE PRODUCTION YIELDS
Source: IEA – International Energy Agency (2005), USDA (2008), MTEC, MAPA, ICONE, UNICA
Sugarcane (Brazil)
Beets (Europe)
Sugarcane (India)
Corn (USA)
Cassava (Thailand)
Wheat (Europe)

21
NET ENERGY BALANCE
0
1
2
3
4
5
6
7
8
9
10
Source: World Watch Institute, compilation of various sources.
Sugarcane (Brazil)
Beets (Europe)
Corn (USA)
Wheat (Europe)
Resulting energy for every unit of fossil fuel input

22
Note: Reductions represent well-to-wheel CO2-equivalent GHG emissions avoided from unit of ethanol compared to gasoline, calculated on a life-cycle basis.
-100%
-80%
-60%
-40%
-20%
0%
Ethanol from Grains (US/EU)
Ethanol from Sugar Beet (EU)
Ethanol from Sugar Cane (Brazil)
AVOIDED GREENHOUSE GAS EMISSIONS
Source: IEA – International Energy Agency (May, 2004), based on a review of recent articles.
Compared with “yesterday’s” gasoline baseline

23
2 METERS
3 METERS
2 METERS
3 METERS
1 METER
1 METER
4 METERS
22-36
tons C/ha
3-5
tons C/ha
5-7 years
Source: Polo de Biocombustivel (Weber Amaral) from various sources.
ABOVE & BELOW GROUND CARBON UPTAKE

24
Annual tons carbon per hectare
3-8 t C/ha 22-36 t C/ha
CANE VS. PASTURES: CARBON UPTAKE
Source: Polo de Biocombustivel (Weber Amaral) from various sources.
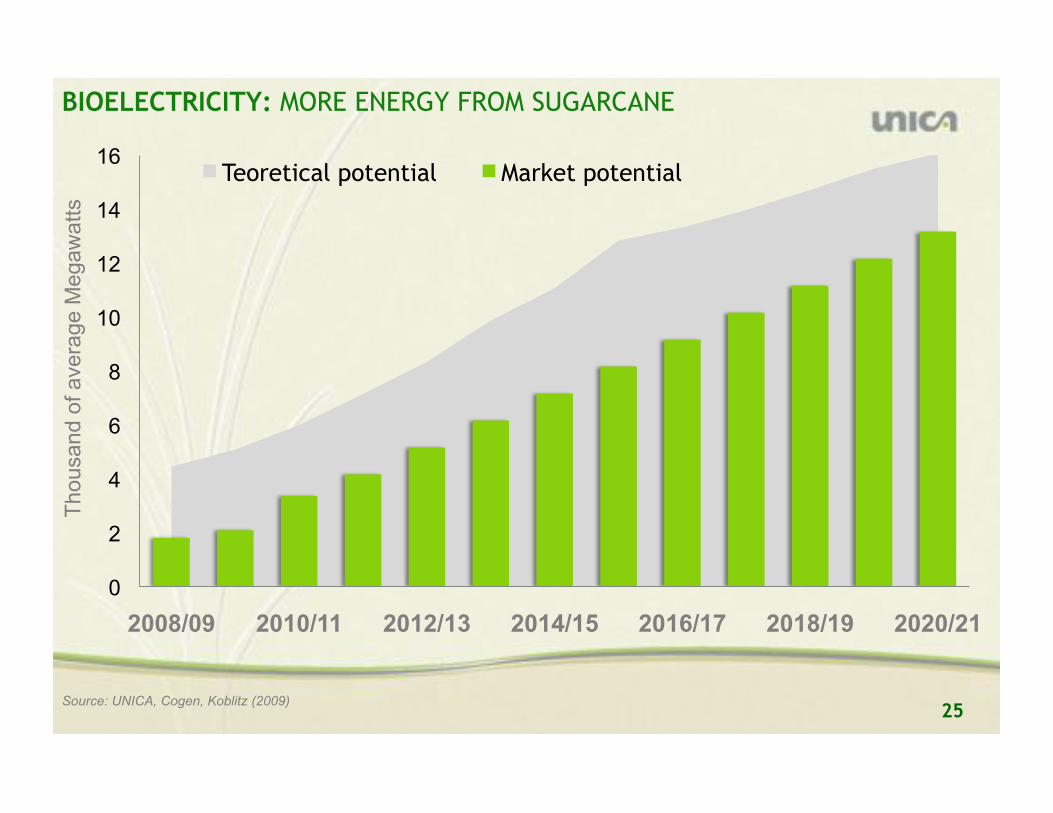
25 Source: UNICA, Cogen, Koblitz (2009)
BIOELECTRICITY: MORE ENERGY FROM SUGARCANE
0
2
4
6
8
10
12
14
16
2008/09 2010/11 2012/13 2014/15 2016/17 2018/19 2020/21
Thousand o
f avera
ge M
egaw
atts
Teoretical potential Market potential

26 26
④!

27 Source: UNICA staff
BIOFUEL SUSTAINABILITY FORUMS Multiple efforts at various levels
Sustainable Biofuels
International Forums
OECD
IEA
FAO
UNEP
G8+5
IDB
Multi-stakeholder Initiatives
Global Bioenergy Partnership (GBEP)
Roundtable on Sustainable Biofuels
(RSB)
Better Sugarcane Initiative (BSI)
Task 39 – Liquid Biofuels from
Biomass
Sugarcane Discussion Group with NGOs (SDG)
Government Policies
Brazil (PBCD & Immetro)
United States (EPA/RFS)
California LCFS
European Union (EC Directive)
UK (RTFO & Low CVP Fuels)
Germany (Meo-Consulting)
Sweden (SEI)
Verified Sustainable Ethanol
Netherlands (Cramer Commission)
28
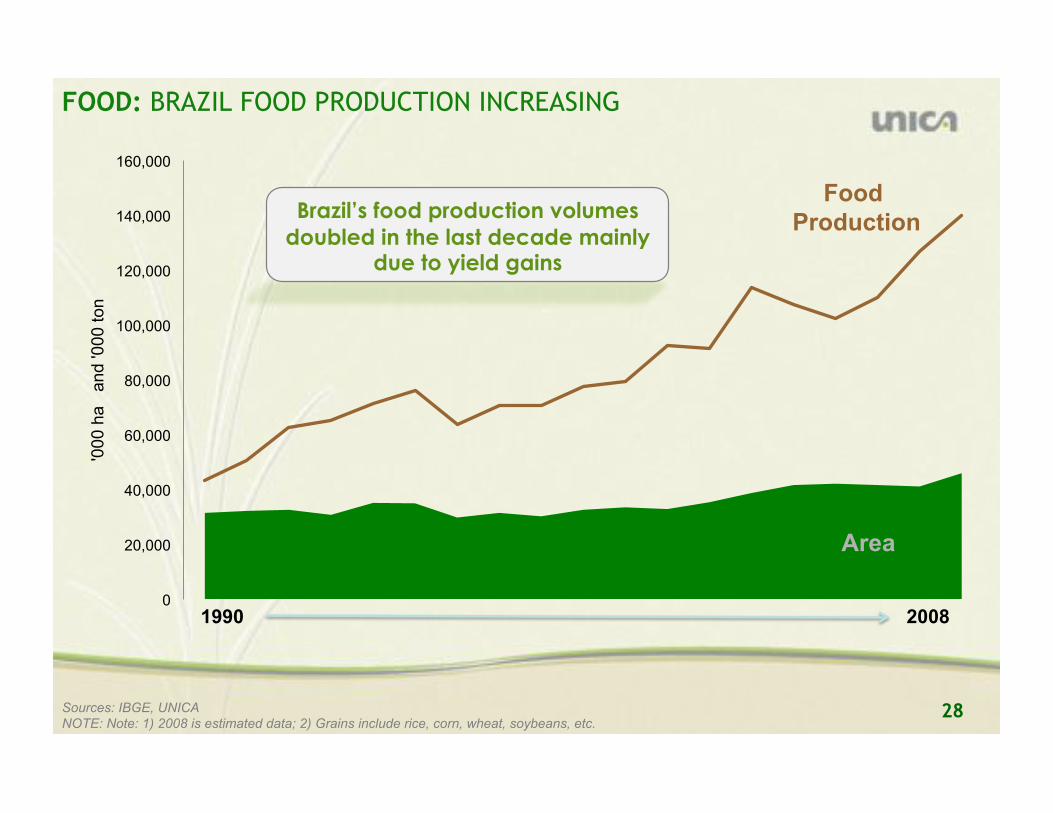
0
20,000
40,000
60,000
80,000
100,000
120,000
140,000
160,000
'00
0 h
a
an
d '0
00
to
n
Food Production
Area
Sources: IBGE, UNICA NOTE: Note: 1) 2008 is estimated data; 2) Grains include rice, corn, wheat, soybeans, etc.
Brazil’s food production volumes
doubled in the last decade mainly due to yield gains
1990 2008
FOOD: BRAZIL FOOD PRODUCTION INCREASING

29
0
5,000
10,000
15,000
20,000
25,000
30,000
35,000
40,000
Are
a (
'000 h
a)
Eth
anol (m
m liters
) S
ugar
('000 t
on
)
Ethanol
Sugar
Area
FOOD: SUGAR & ETHANOL PRODUCTION INCREASING
Sources: IBGE, UNICA
Brazil’s sugarcane ethanol volumes
have increased 130% and sugar more than 350%
1990 2008 2003

30 Source: HOFFMANN, R & OLIVEIRA, F. C. R. Evolução da remuneração das pessoas empregadas na cana-de-açúcar e em outras lavouras, no Brasil e em São Paulo. Piracicaba: ESALQ. 2008. Note: Amounts in Brazilian currency (August 2007, INPC Deflator)
JOBS: AVERAGE INCOME IN AGRICULTURE Sugarcane worker second highest income
0
100
200
300
400
500
600
700
800
Soybean Sugarcane Orange Coffee Corn
34()56(&!
$%'7#8&9%:$;(&
&<=&>3?6&-++2@&
BRAZIL SAO PAULO

31 Source: PNAD (1992, 2003, 2004 and 2005); MORAES, Márcia A.F. de. Número e qualidade dos empregos na agroindústria da cana-de-açúcar. In: A energia da cana-de-açúcar, 2007.
42.3%
66.0%
80.4%
60.8%
85.8%
93.8%
0%
20%
40%
60%
80%
100%
NORTHEAST CENTER-SOUTH SAO PAULO (UNICA)
1992 2005
JOBS: IMPROVING FORMAL EMPLOYMENT Industry workers receive full benefits

32 Source: UNICA’s GRI Report (2008)
GRI: SOCIAL-ENVIRONMENTAL INVESTMENTS First trade association to undertake this effort

33 Source: UNICA’s GRI Report (2008)
US$75 million (R$160 million) invested
0 10 20 30 40 50 60 70 80 90
Capacity
Health
Quality of Life
Environment
Athletics
Education
Culture
Amounts in Millions of Brazilian Real (R$)
GRI: SOCIAL-ENVIRONMENTAL INVESTMENTS
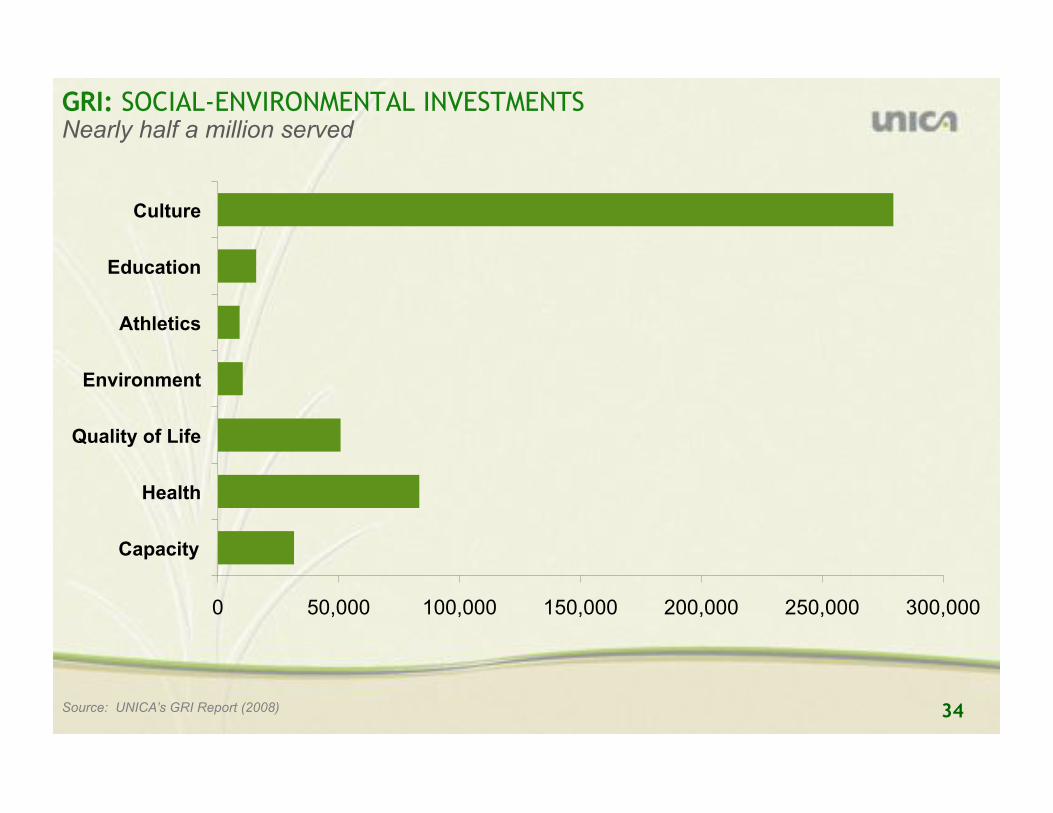
34 Source: UNICA’s GRI Report (2008)
Nearly half a million served
0 50,000 100,000 150,000 200,000 250,000 300,000
Capacity
Health
Quality of Life
Environment
Athletics
Education
Culture
GRI: SOCIAL-ENVIRONMENTAL INVESTMENTS
35 35
⑤!

36
Petroleum
4,252 MT
(184.9 BGJ)
Ethanol 36 MT
(0.96 BGJ)
Sunflower 31 MT
Biodiesel 3.2 MT
(0.12 BGJ)
Castor Seed 1.4 MT
Soy 214 MT
Notes: Million tons, 2005. Data for palm, gasoline, diesel, LPG and Kerosene is from 2003. BGJ = Billions of Giga Joules Sources: FAO, Oil World, F.O. Licht, LCM, EIA. Elaboration: Icone and UNICA.
Rapeseed 47 MT
Gaso-line
1237 MT (53.8 BGJ)
Diesel 1077 MT (46.1 BGJ)
Total (Energy Equiv.) = 115.7 BGJ 1.1 BGJ
Palm 8 MT
LPG 391 MT
(11.9 BGJ)
Kerosene 92 MT (3.9 BGJ)
Sugar Cane 1,292 MT
Corn 702 MT
Wheat 628 MT
WORLD FUELS PRODUCTION
Renewable energy represent less than 1%
FOSSIL RENEWABLE
SOURCE FUEL FUEL SOURCE

37 Source: UNICA
ETHANOL: VALUES & GROWTH DRIVERS
!!Renewable source of energy
!!Octane booster
!! Fuel extender
!! Fuel substitute
!! Low pollution fuel (reduce GHG emissions)
!! Social development inducer in rural areas
!! In line with Kyoto & Sustainable Development
!! Environmental concerns (climate change)
!! Energy security ! high oil prices
!! Support to farm incomes
Valu
es
Drivers

38 Source: FOLicht, Secex, USITC, European Comission, LMC. As prepared by UNICA
ETHANOL TRADE VS. PRODUCTION
Only about 10% of total production
0
10
20
30
40
50
60
70
2000 2001 2002 2003 2004 2005 2006 2007
Billio
ns o
f L
iters
10%

39 Source: Brazilian Ministry of Trade & Development (SECEX)
BRAZILIAN ETHANOL EXPORTS BY DESTINATION
2006 2007 2008
Others 600 742 810
European Union 582 1,008 1,473
Caribbean (CBI) 486 931 1,316
United States 1,749 850 1,519
-
1,000
2,000
3,000
4,000
5,000
Mil
lio
n L
ite
rs
3.4 bi liters $ 1.6 bi
3.5 bi liters $ 1.5 bi
5.1 bi liters $ 2.4 bi
40
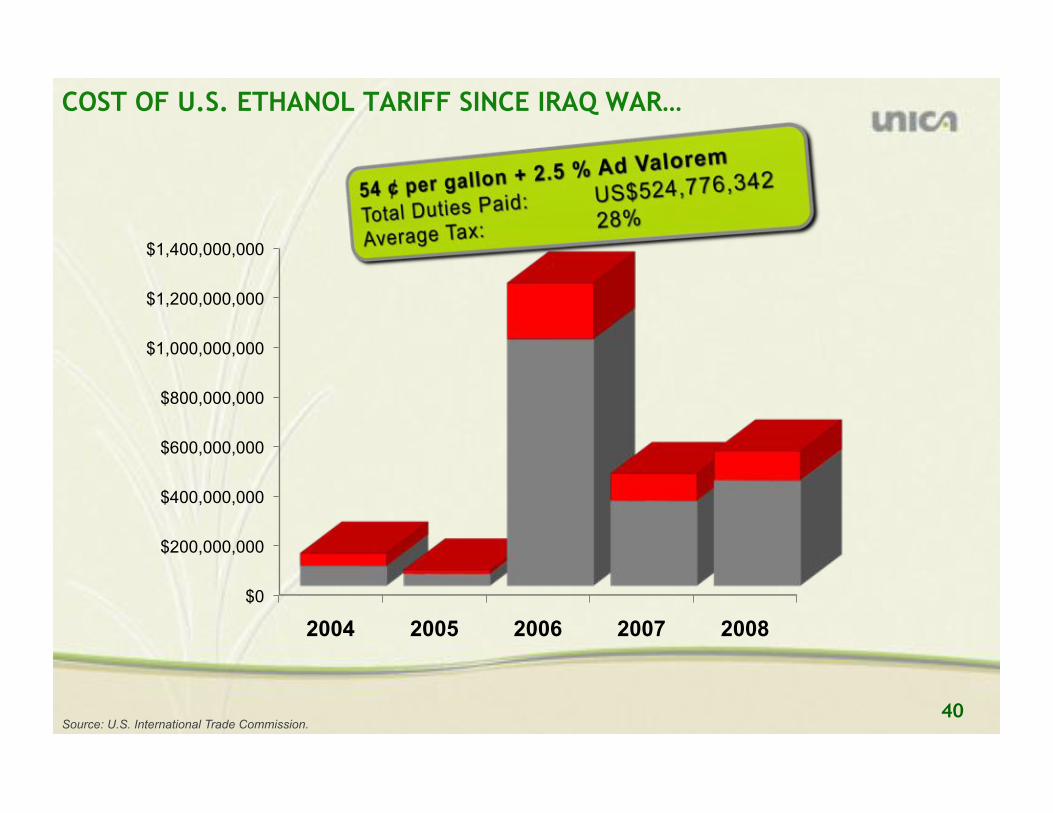
$0
$200,000,000
$400,000,000
$600,000,000
$800,000,000
$1,000,000,000
$1,200,000,000
$1,400,000,000
2004 2005 2006 2007 2008
Source: U.S. International Trade Commission.
COST OF U.S. ETHANOL TARIFF SINCE IRAQ WAR…

41
80.9
59.1
43.3
12.4
2.4 0.9 0
10
20
30
40
50
60
70
80
90
USA Japan EU Brazil China India
Auto
s p
er
100 p
eople
Fonte: ANFAVEA, ONU, JAMA, ACEA. Developed by UNICA. Data from 2005 except for India (2004).
USE OF AUTOMOBILES
What fuel will emerging economies use?
42
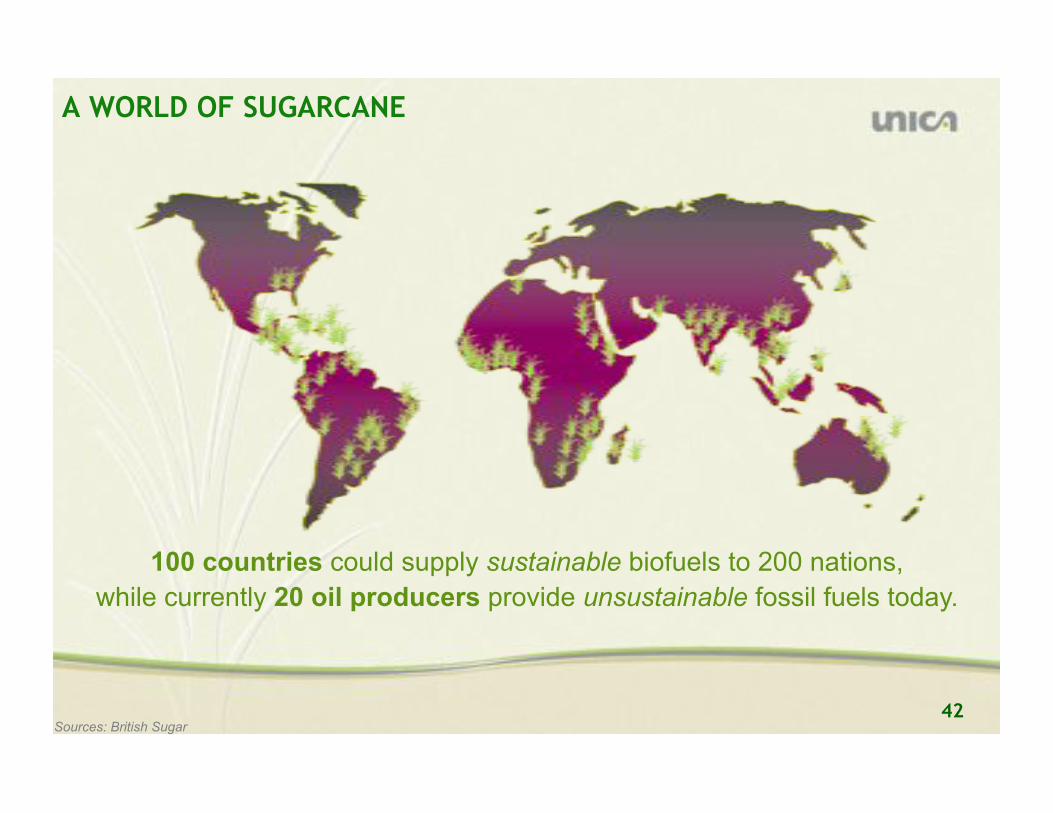
100 countries could supply sustainable biofuels to 200 nations,
while currently 20 oil producers provide unsustainable fossil fuels today.
A WORLD OF SUGARCANE
Sources: British Sugar

43 43
⑥!
44
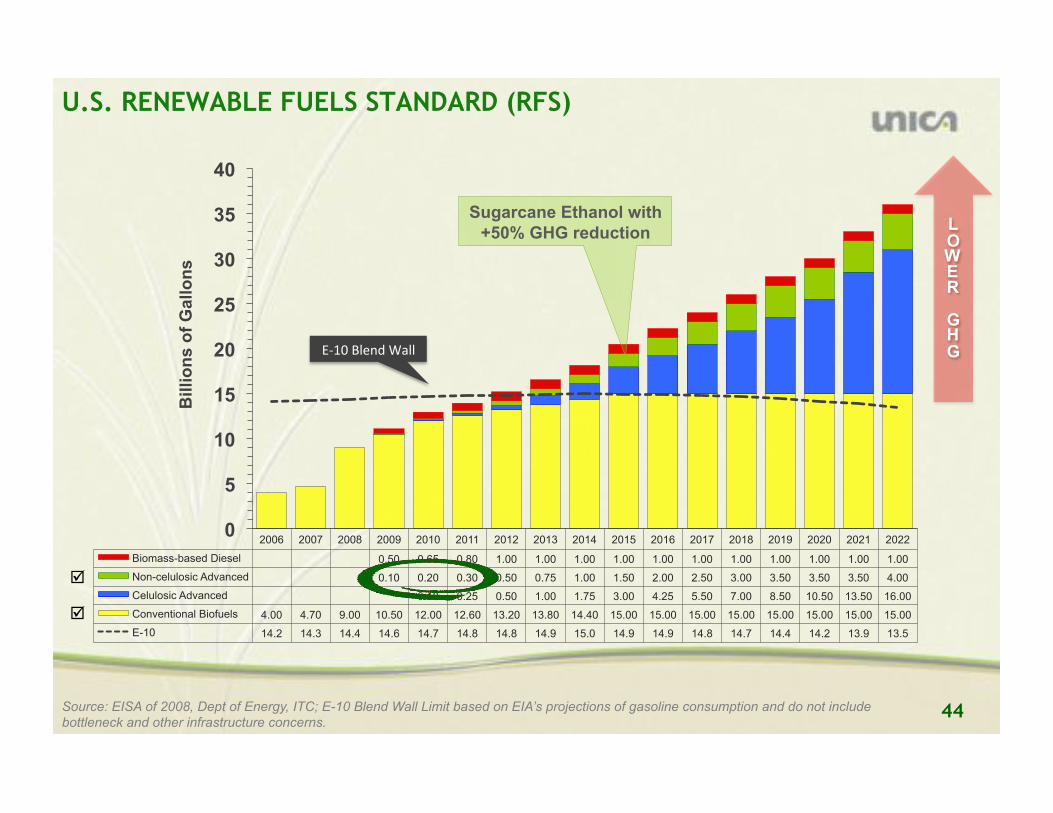
2006 2007 2008 2009 2010 2011 2012 2013 2014 2015 2016 2017 2018 2019 2020 2021 2022
Biomass-based Diesel 0.50 0.65 0.80 1.00 1.00 1.00 1.00 1.00 1.00 1.00 1.00 1.00 1.00 1.00
Non-celulosic Advanced 0.10 0.20 0.30 0.50 0.75 1.00 1.50 2.00 2.50 3.00 3.50 3.50 3.50 4.00
Celulosic Advanced 0.10 0.25 0.50 1.00 1.75 3.00 4.25 5.50 7.00 8.50 10.50 13.50 16.00
Conventional Biofuels 4.00 4.70 9.00 10.50 12.00 12.60 13.20 13.80 14.40 15.00 15.00 15.00 15.00 15.00 15.00 15.00 15.00
E-10 14.2 14.3 14.4 14.6 14.7 14.8 14.8 14.9 15.0 14.9 14.9 14.8 14.7 14.4 14.2 13.9 13.5
0
5
10
15
20
25
30
35
40 B
illi
on
s o
f G
all
on
s
AB,+&C#(%D&E5##&
"
"
L
OWER
GH
G
U.S. RENEWABLE FUELS STANDARD (RFS)
Source: EISA of 2008, Dept of Energy, ITC; E-10 Blend Wall Limit based on EIA’s projections of gasoline consumption and do not include bottleneck and other infrastructure concerns.
Sugarcane Ethanol with +50% GHG reduction

45
EPA’S LAND USE MODEL
Source: Environmental Protection Agency (EPA), May 2009.

46
EPA: “INDIRECT LAND USE” EFFECT
Source: See Figure 2.1-4. “Regional Crop Expansion by Renewable Fuel, 2022 (acres per thousand ethanol equivalent gallons of biofuel production) in page 284 of Discussion Draft of Environmental Protection Agency (EPA) Regulatory Impact Analysis, May 2009.
Ac
res
pe
r T
ho
us
an
d G
all
on
s E
tha
no
l P
rod
uc
ed
47
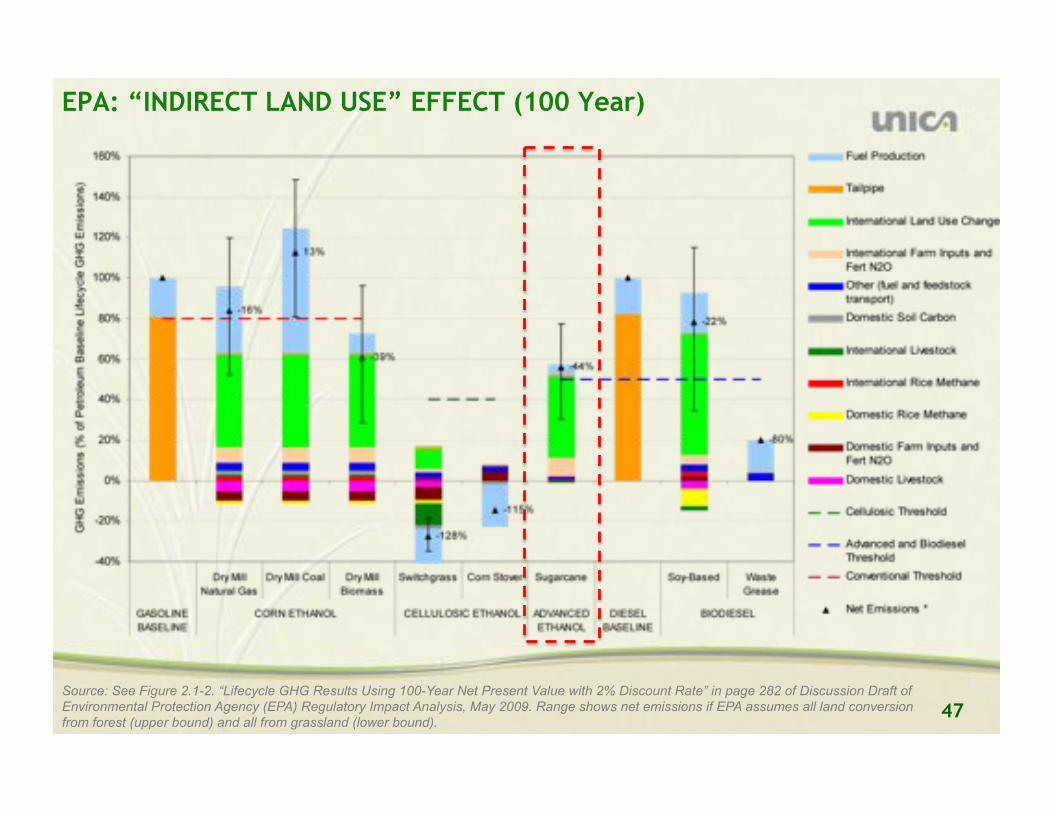
EPA: “INDIRECT LAND USE” EFFECT (100 Year)
Source: See Figure 2.1-2. “Lifecycle GHG Results Using 100-Year Net Present Value with 2% Discount Rate” in page 282 of Discussion Draft of Environmental Protection Agency (EPA) Regulatory Impact Analysis, May 2009. Range shows net emissions if EPA assumes all land conversion from forest (upper bound) and all from grassland (lower bound).
48
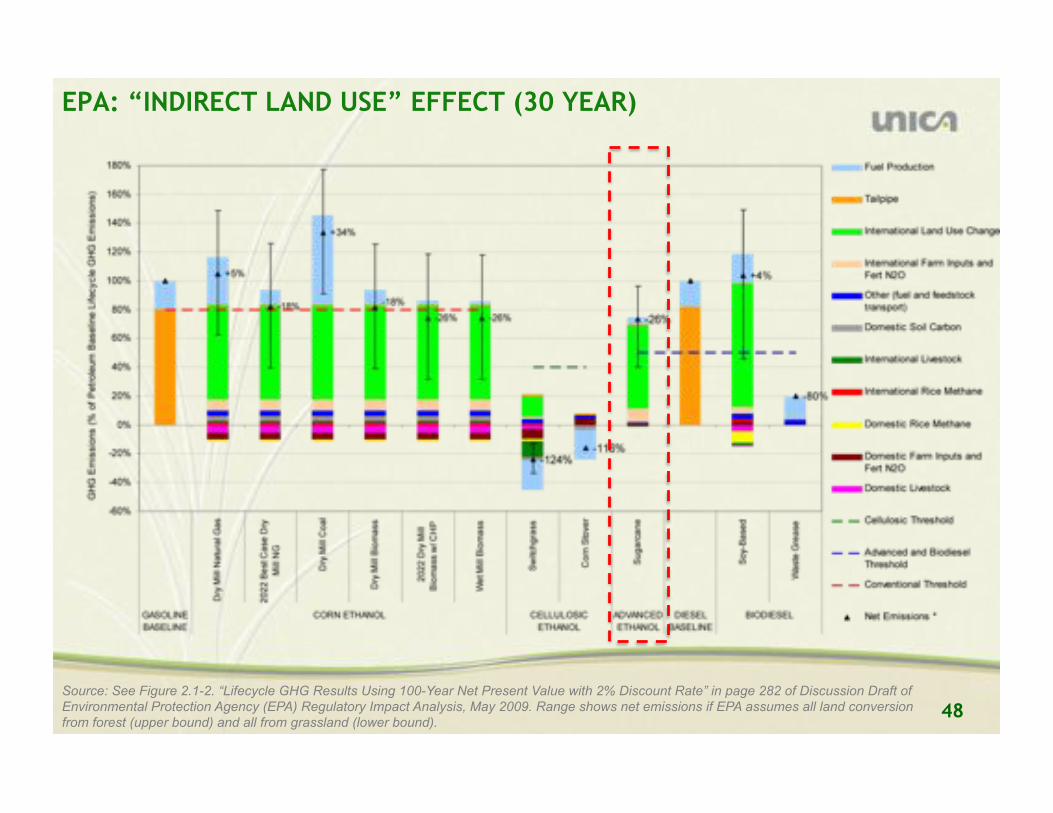
EPA: “INDIRECT LAND USE” EFFECT (30 YEAR)
Source: See Figure 2.1-2. “Lifecycle GHG Results Using 100-Year Net Present Value with 2% Discount Rate” in page 282 of Discussion Draft of Environmental Protection Agency (EPA) Regulatory Impact Analysis, May 2009. Range shows net emissions if EPA assumes all land conversion from forest (upper bound) and all from grassland (lower bound).

49
96 86
69
27
0
20
40
60
80
100
120
Gasoline LCFS in 2020 Corn Ethanol Sugarcane Ethanol
Gra
ms o
f C
O2 p
er
meg
ajo
ule
CALIFORNIA’S LOW CARBON FUELS STANDARD (LCFS)
Source: California Air Resources Board’s Low Carbon Fuel Standard, March 2009.

50
96 86
69
27
0
20
40
60
80
100
120
Gasoline LCFS in 2020 Corn Ethanol Sugarcane Ethanol
Gra
ms o
f C
O2 p
er
meg
ajo
ule
LCFS WITH “INDIRECT LAND USE” PENALTY
Source: California Air Resources Board’s Low Carbon Fuel Standard, March 2009.
ILU
C u
sin
g
GTA
P

51
87
88
89
90
91
92
93
94
95
96
97
2010 2011 2012 2013 2014 2015 2016 2017 2018 2019 2020
LCFS & SUGARCANE SIMULATION
Source: California Air Resources Board’s Low Carbon Fuel Standard, March 2009.
Gra
ms o
f C
O2 p
or
me
ga
jou
le
RE
PO
RT
ING
ON
LY

52
SUGARCANE “INDIRECT LAND USE” EFFECT
Source: UNICA, California Air Resources Board’s Low Carbon Fuel Standard, March 2009.

53 53