the critical role of phase transfer catalysts in aprotic...
TRANSCRIPT

NATURE CHEMISTRY | www.nature.com/naturechemistry 1
SUPPLEMENTARY INFORMATIONDOI: 10.1038/NCHEM.2260
1
Supplementary Information
The critical role of phase-transfer catalysts in aprotic sodium oxygen batteries
Chun Xia, Robert Black,‡ Russel Fernandes,‡ Brian Adams and Linda F. Nazar*
Department of Chemistry and the Waterloo Institute for Nanotechnology, University of
Waterloo, Waterloo Ontario Canada N2L 3G1
*Corresponding Author: [email protected]
This PDF file includes: Methods and Supplementary Figures 1 to 9.
Table of Contents
Supplementary Figure 1. Observed, calculated and difference powder X-ray diffraction profiles of synthesized NaOTf at room temperature. ··································· 7 Supplementary Figure 2. Morphology of carbon fiber cathode after discharge to 1.8 V using synthesized NaOTf and the elemental composition of the discharged products analyzed by EDS. ········································································································································· 9 Supplementary Figure 3. Infrared spectra of commercial NaOTf salt and pure NaOTf. ·· 10 Supplementary Figure 4. Effect of water content on the discharge performance of Na-O2 cells using pure NaOTf and morphology of NaO2 cubes formed using the electrolytes containing 8 ppm and 14 ppm water respectively. ···································· 11 Supplementary Figure 5. Effect of water content in the NaOTf/diglyme electrolyte on the discharge performances of Na-O2 cells. ··························································· 12 Supplementary Figure 6. First discharge curves of Na-O2 cells using pure NaOTf salt with 10 ppm anhydrous acetic acid or 10 ppm anhydrous benzoic acid and XRD patterns of the corresponding discharged cathodes. ························································· 13 Supplementary Figure 7. Growth of NaO2 cubes on the glass fiber separator in a cell employing NaOTf salt/~10 ppm water diglyme electrolyte after full discharge to 1.8 V. ······ 14 Supplementary Figure 8. RRDE analysis of dry 0.1 M NaOTf electrolyte (< 1 ppm H2O) and wet 0.1 M NaOTf electrolyte (500 ppm H2O). ············································ 15 Supplementary Figure 9. Cycling performance of Na-O2 cells with a cut-off capacity at 0.5 mAh cm-2 using the electrolyte with 0 ppm water (black triangles) or 10 ppm water (red circles). ································································································ 17
1
Supplementary Information
The critical role of phase transfer catalysts in aprotic sodium oxygen batteries
Chun Xia, Robert Black,‡ Russel Fernandes,‡ Brian Adams and Linda F. Nazar*
Department of Chemistry and the Waterloo Institute for Nanotechnology, University of
Waterloo, Waterloo Ontario Canada N2L 3G1
*Corresponding Author: [email protected]
This PDF file includes: Methods and Supplementary Figures 1 to 9. Table of Contents Supplementary Figure 1. Observed, calculated and difference powder X-ray diffraction profiles of synthesized NaOTf at room temperature. ··································· 7 Supplementary Figure 2. Morphology of carbon fiber cathode after discharge to 1.8 V using synthesized NaOTf and the elemental composition of the discharged products analyzed by EDS. ········································································································································· 9 Supplementary Figure 3. Infrared spectra of commercial NaOTf salt and pure NaOTf. ·· 10 Supplementary Figure 4. Effect of water content on the discharge performance of Na-O2 cells using pure NaOTf and morphology of NaO2 cubes formed using the electrolytes containing 8 ppm and 14 ppm water respectively. ···································· 11 Supplementary Figure 5. Effect of water content in the NaOTf/diglyme electrolyte on the discharge performances of Na-O2 cells. ··························································· 12 Supplementary Figure 6. First discharge curves of Na-O2 cells using pure NaOTf salt with 10 ppm anhydrous acetic acid or 10 ppm anhydrous benzoic acid and XRD patterns of the corresponding discharged cathodes. ························································· 13 Supplementary Figure 7. Growth of NaO2 cubes on the glass fiber separator in a cell employing NaOTf salt/~10 ppm water diglyme electrolyte after full discharge to 1.8 V. ······ 14 Supplementary Figure 8. RRDE analysis of dry 0.1 M NaOTf electrolyte (< 1 ppm H2O) and wet 0.1 M NaOTf electrolyte (500 ppm H2O). ············································ 15 Supplementary Figure 9. Cycling performance of Na-O2 cells with a cut-off capacity at 0.5 mAh cm-2 using the electrolyte with 0 ppm water (black triangles) or 10 ppm water (red circles). ································································································ 17
© 2015 Macmillan Publishers Limited. All rights reserved
NATURE CHEMISTRY | www.nature.com/naturechemistry 2
SUPPLEMENTARY INFORMATIONDOI: 10.1038/NCHEM.2260
2
Supporting Information: Methods
Synthesis of sodium trifluoromethanesulfonate (sodium triflate) To prepare the
sodium triflate (NaOTf), a solution of 3.32 g of sodium carbonate (BioXtra ≥99.0 %,
Sigma-Aldrich) in 20 mL of distilled water was added drop wise over 40 min to a
solution of 10.30 g of copper (II) trifluoromethanesulfonate (98 %, Sigma-Aldrich) in 80
mL of distilled water under a N2 atmosphere. The solution was stirred for 12 h at room
temperature and then filtered three times by gravity using glass microfiber filters (GF/A
70 mm, Whatman) to remove the copper (II) carbonate, which is an insoluble turquoise
precipitate in water. Water was evaporated under vacuum and heat until dry white
precipitate was obtained. The precipitate was then dissolved in 300 mL of acetone
(CHROMASOLV Plus, for HPLC, ≥99.9%, Sigma-Aldrich). The solution was filtered
three times by gravity using glass microfiber filters to remove the sodium carbonate,
which is insoluble in acetone. The acetone was then evaporated under vacuum and heat
until dry white NaOTf powder was obtained. The NaOTf powder was then finally dried
in a vacuum oven at 150 ᵒC overnight before using. Commercial NaOTf (98% purity,
Aldrich) was also purchased for comparison.
Purification of Solvent and Additives: Diethylene glycol dimethyl ether (diglyme)
(Anhydrous, 99.5%, Sigma-Aldrich) was distilled over calcium hydride (Reagent Grade,
95 %, Sigma-Aldrich) under a N2 atmosphere and stored over molecular sieves (4 Å,
beads 8-12 mesh, Sigma Aldrich) for one week prior to being used as the electrolyte
solvent. The electrolyte solution of 0.5 M sodium triflate in diglyme was prepared in an
© 2015 Macmillan Publishers Limited. All rights reserved
NATURE CHEMISTRY | www.nature.com/naturechemistry 3
SUPPLEMENTARY INFORMATIONDOI: 10.1038/NCHEM.2260
3
argon-filled glove box (<0.5 ppm H2O and <1.0 ppm O2). The water contents of the
diglyme and the electrolyte solutions were determined to be less than 1 ppm with a
Mettler Toledo C30 Karl Fischer Titrator. When needed, different amounts of distilled
water were added into the electrolyte and the precise water content was determined by
Karl Fischer Titration before use. Benzoic acid (ACS reagent, ≥99.5 %, Sigma-Aldrich)
was dried in a vacuum oven at 100oC for 24 h and glacial acetic acid (ACS reagent,
≥99.7 %, Sigma Aldrich) was dried over molecular sieves for 1 week. These acids were
then individually added into the electrolyte to give an acid content of 10 ppm. The water
contents in both acid-containing electrolytes were below 2 ppm.
Galvanostatic Cycling: Electrochemical measurements were carried out using
commercially ECC-DEMS cells (EL-cell GmbH, Germany) possessing both an inlet and
outlet for O2 purging. The cells were assembled in a glovebox using a porous gas
diffusion layer cathode (Freudenberg) with a glass fiber separator (0.7mm, Whatman)
and a sodium anode (ACS Reagent, Sigma-Aldrich). Both the cathodes and separators
were dried at 300 oC under vacuum before use. After purging with pure O2 (5.0
Research) for 10 seconds, the cells and their oxygen reservoirs were sealed with 1.5 atm
oxygen. A constant current of 50 µA cm-2 was applied in both discharge and charge with
cut-off voltages of 1.8 V and 4.5 V, respectively.
Rotating Ring Disk Electrode Studies (RRDE): In these experiments, mechanical
rotation of the RRDE tip (ω = 200 rpm) creates a vortex flow in the bulk electrolyte that
brings dissolved oxygen to the center and outward across the disk electrode by
© 2015 Macmillan Publishers Limited. All rights reserved

NATURE CHEMISTRY | www.nature.com/naturechemistry 4
SUPPLEMENTARY INFORMATIONDOI: 10.1038/NCHEM.2260
4
convection. The O2 is reduced at the disk electrode by applying a cathodic potential
sweep (O2 + e- → O2-), and the reduced soluble species is swept outward to the ring. It is
detected by oxidation (O2- → O2 + e-) by holding the ring potential at 3 V vs. Na/Na+. A
glassy carbon disk and platinum ring RRDE tip was used for these experiments (E7R9
RRDE tip, Pine Instruments, Co.). They were performed in an argon-filled glovebox with
a four-electrode cell gas-flow enabled setup consisting of the RRDE as the two working
electrodes.
The experiments were controlled on two separate channels with a VMP3 potentiostat and
EC-Lab® software (Bio-Logic Science Instruments).The electrolyte used was
argon-purged or oxygen-saturated 0.1 M NaOTf in diglyme, with and without 500 ppm
distilled H2O added. In both cases, the pure NaOTf salt was used as the electrolyte. For
the dry electrolyte, the H2O content was < 1 ppm before and after all electrochemical
experiments were performed. In this case, metallic sodium strips were used as both the
counter and reference electrodes. For the experiments with electrolyte containing 500
ppm H2O, the counter electrode was a Pt wire and the reference electrode was a Na strip
in dry 0.1 M NaOTf in diglyme separated from the bulk electrolyte with a porous
Vycor™ glass frit. The experimental collection efficiency (N = Iring/Idisk) of the RRDE tip
was calculated to be 42.4% using the ferrocene/ferrocenium (Fc/Fc+) redox couple in
acetonitrile (3 mM Fc + 0.1 M tetrabutylammoniumhexafluorophosphate). The ring
currents in Figures 4 were normalized to this value.
We note that Johnson et al. have also used the measure of ring:disk current in RRDE
© 2015 Macmillan Publishers Limited. All rights reserved
NATURE CHEMISTRY | www.nature.com/naturechemistry 5
SUPPLEMENTARY INFORMATIONDOI: 10.1038/NCHEM.2260
5
experiments to probe solubility of LiO2 in various LiClO4/electrolytes on a gold disk
electrode.1 While the experiment is not strictly comparable due to differences in the
electrode composition, they measure a partial solubility of LiO2 in monoglyme very
similar to what we observe for NaO2 in anhydrous diglyme. They also show that DMSO
solvates LiO2 better due to its higher donor number. In our studies, the difference in ring
and disk current is not as effective a measure because superoxide transportation
significantly relies on the PTC (present in minute amounts) under dynamic flow,
compared to a solvent bath. Therefore, the increase in capacity and difference in
morphology due to the PTC are more evident in static full cells.
Characterization: Powder X-ray diffraction (XRD) patterns were collected using a
Bruker D8-Advance (Cu-Kα1 radiation; λ = 1.5405 Å). The XRD patterns were performed
in air using a gastight sample holder with a Kapton film window. Morphology of
discharge products were investigated using a LEO 1530 field-emission scanning electron
microscope (SEM) equipped with an energy-dispersive X-ray spectroscope (EDX)
attachment (Zeiss). Infrared spectra were collected using a Bruker Vertex 70 FT-IR
Spectrometer with a wavenumber range of 400-4000 cm-1.
Quantitative comparison of superoxide ion and PPTC content on discharge.
On discharge, oxygen is initially reduced to O!!: O! + 𝑒𝑒 → O!!
The rate of production, J, of O!! is calculated according to Faraday’s law: 𝐽𝐽 = 𝐼𝐼/𝑛𝑛𝑛𝑛
At the applied current of 0.1 mA which was used for all cells:
𝐽𝐽 = 0.1 ∗ 10!! 𝐴𝐴 ÷ 1×96485 𝐶𝐶 𝑚𝑚𝑚𝑚𝑚𝑚!! = 1.04 ∗ 10!! 𝑚𝑚𝑚𝑚𝑚𝑚 ∗ 𝑠𝑠!!
© 2015 Macmillan Publishers Limited. All rights reserved
NATURE CHEMISTRY | www.nature.com/naturechemistry 6
SUPPLEMENTARY INFORMATIONDOI: 10.1038/NCHEM.2260
6
Thus, after just a minute of discharge, 62 * 10-9 mol of superoxide would be generated.
This can be compared with the quantity of PPTC available. A total of 20 µl
NaOTf/diglyme electrolyte with 10 ppm phase transfer catalyst (e.g., H2O, or HA) were
added to the cathode during assembly. The density of electrolyte is ~ 1 g /ml. The total
number of moles of phase transfer catalyst in the electrolyte, N, can be calculated:
𝑁𝑁!"# =20 𝜇𝜇𝜇𝜇 ∗ 10!!×1 𝑔𝑔 𝑚𝑚𝑚𝑚!! ×10 ∗ 10!!
18 𝑔𝑔 𝑚𝑚𝑚𝑚𝑚𝑚!! = 11.11 ∗ 10!! 𝑚𝑚𝑚𝑚𝑚𝑚
𝑁𝑁!"#$%&' !"#$ =20 𝜇𝜇𝜇𝜇 ∗ 10!!×1 𝑔𝑔 𝑚𝑚𝑚𝑚!! ×10 ∗ 10!!
60 𝑔𝑔 𝑚𝑚𝑚𝑚𝑚𝑚!! = 3.33 ∗ 10!! 𝑚𝑚𝑚𝑚𝑚𝑚
𝑁𝑁!"#$%" !"#$ =20 𝜇𝜇𝜇𝜇 ∗ 10!!×1 𝑔𝑔 𝑚𝑚𝑚𝑚!! ×10 ∗ 10!!
122 𝑔𝑔 𝑚𝑚𝑚𝑚𝑚𝑚!! = 1.64 ∗ 10!! 𝑚𝑚𝑚𝑚𝑚𝑚
Therefore, the amount of superoxide produced within the first minute of cell operation
exceeds the total amount of phase transfer catalyst added to the cathode by a factor
between 5 - 40 fold. None of the PPTC’s are capable of solvating the NaO2 with a
coordination sphere (even at 100 ppm), given this ratio.
© 2015 Macmillan Publishers Limited. All rights reserved

NATURE CHEMISTRY | www.nature.com/naturechemistry 7
SUPPLEMENTARY INFORMATIONDOI: 10.1038/NCHEM.2260
7
Supporting Figures and Details
Supplementary Figure 1. Powder X-ray diffraction profile of synthesized sodium
triflate (NaOTf) at room temperature, and Rietveld refinement. Shown are the
observed data (black dots), calculated data (red line) and the difference map (blue line),
with reflection positions indicated by the black markers. Discussion of Figure 1: Powder X-ray diffraction (XRD) data was collected on a
Bruker D8-Advance powder diffractometer equipped with a Våntec-1 detector utilizing
Cu-Kα radiation (λ = 1.5405 Å) in the range of 10-70o 2θ at a step size of 0.025o in a
Bragg-Brentano geometry. The sample was covered by a Kapton film and the duration of
the scan was only 30 min due to sample’s extreme sensitivity to moisture. Rietveld
refinement was carried out in DIFFRACplus TOPAS 4.2 software using the fundamental
parameters approach.2,3 The structural model for Rietveld refinement was adapted from
© 2015 Macmillan Publishers Limited. All rights reserved
NATURE CHEMISTRY | www.nature.com/naturechemistry 8
SUPPLEMENTARY INFORMATIONDOI: 10.1038/NCHEM.2260
8
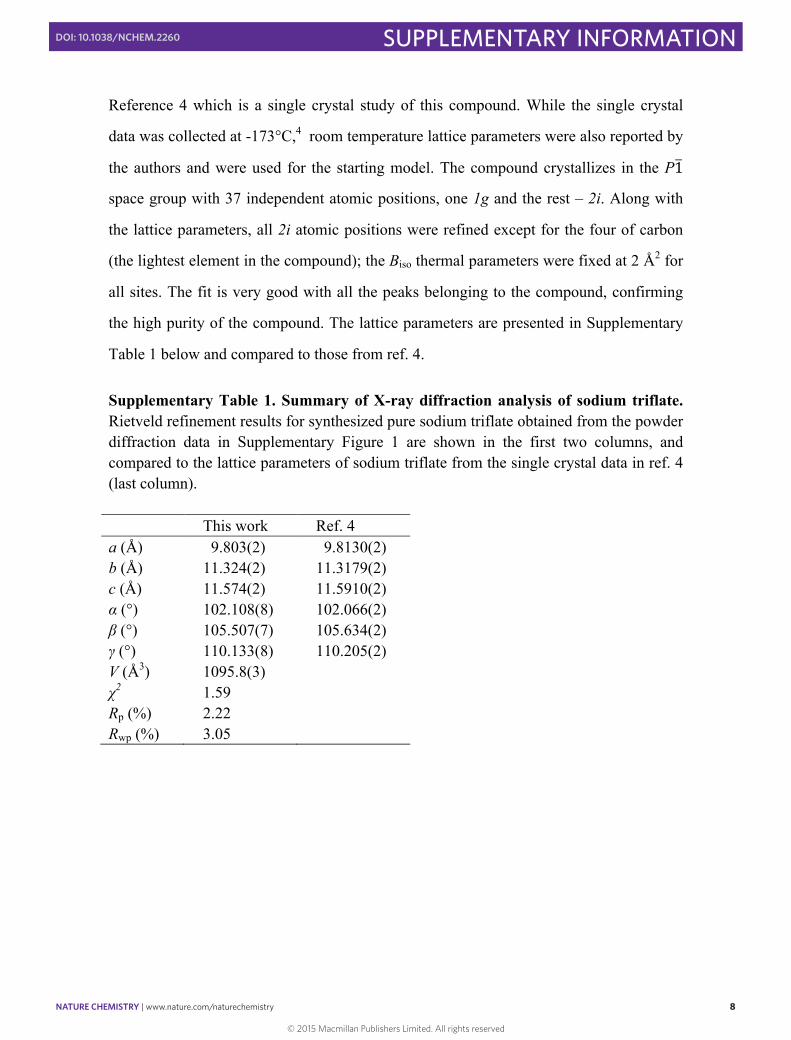
Reference 4 which is a single crystal study of this compound. While the single crystal
data was collected at -173°C,4 room temperature lattice parameters were also reported by
the authors and were used for the starting model. The compound crystallizes in the P1
space group with 37 independent atomic positions, one 1g and the rest – 2i. Along with
the lattice parameters, all 2i atomic positions were refined except for the four of carbon
(the lightest element in the compound); the Biso thermal parameters were fixed at 2 Å2 for
all sites. The fit is very good with all the peaks belonging to the compound, confirming
the high purity of the compound. The lattice parameters are presented in Supplementary
Table 1 below and compared to those from ref. 4. Supplementary Table 1. Summary of X-ray diffraction analysis of sodium triflate. Rietveld refinement results for synthesized pure sodium triflate obtained from the powder diffraction data in Supplementary Figure 1 are shown in the first two columns, and compared to the lattice parameters of sodium triflate from the single crystal data in ref. 4 (last column). This work Ref. 4 a (Å) 9.803(2) 9.8130(2) b (Å) 11.324(2) 11.3179(2) c (Å) 11.574(2) 11.5910(2) α (°) 102.108(8) 102.066(2) β (°) 105.507(7) 105.634(2) γ (°) 110.133(8) 110.205(2) V (Å3) 1095.8(3) χ2 1.59 Rp (%) 2.22 Rwp (%) 3.05
© 2015 Macmillan Publishers Limited. All rights reserved
NATURE CHEMISTRY | www.nature.com/naturechemistry 9
SUPPLEMENTARY INFORMATIONDOI: 10.1038/NCHEM.2260
9
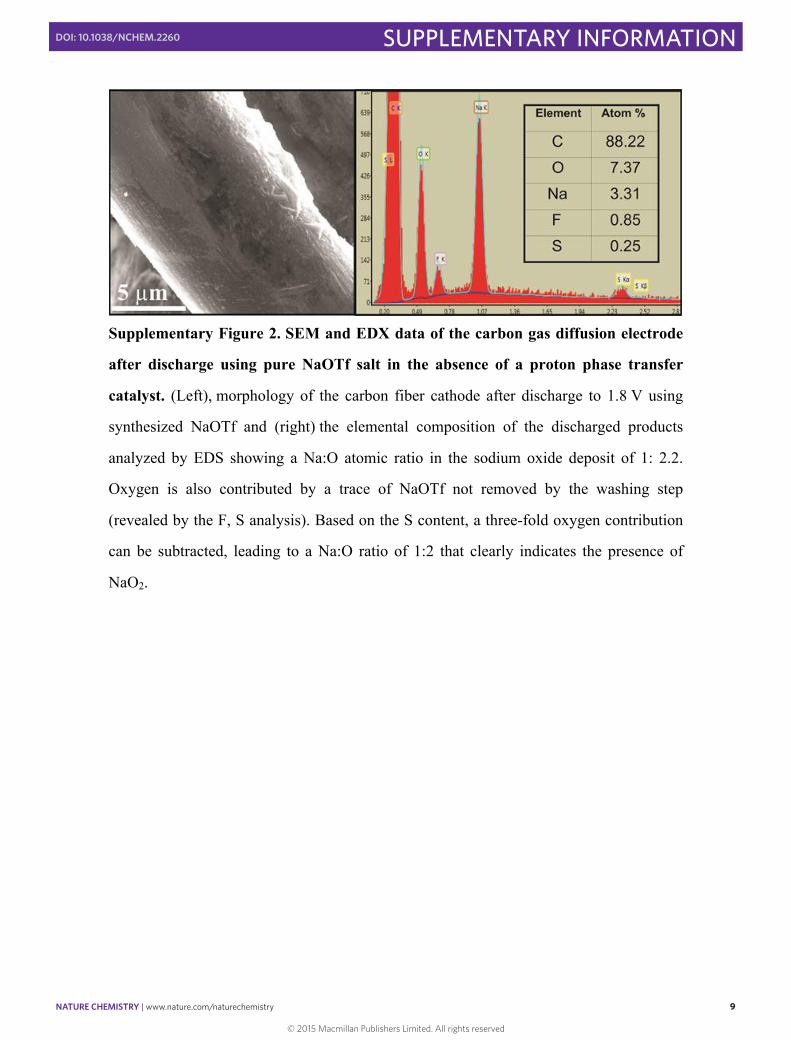
Supplementary Figure 2. SEM and EDX data of the carbon gas diffusion electrode
after discharge using pure NaOTf salt in the absence of a proton phase transfer
catalyst. (Left), morphology of the carbon fiber cathode after discharge to 1.8 V using
synthesized NaOTf and (right) the elemental composition of the discharged products
analyzed by EDS showing a Na:O atomic ratio in the sodium oxide deposit of 1: 2.2.
Oxygen is also contributed by a trace of NaOTf not removed by the washing step
(revealed by the F, S analysis). Based on the S content, a three-fold oxygen contribution
can be subtracted, leading to a Na:O ratio of 1:2 that clearly indicates the presence of
NaO2.
© 2015 Macmillan Publishers Limited. All rights reserved
NATURE CHEMISTRY | www.nature.com/naturechemistry 10
SUPPLEMENTARY INFORMATIONDOI: 10.1038/NCHEM.2260
10
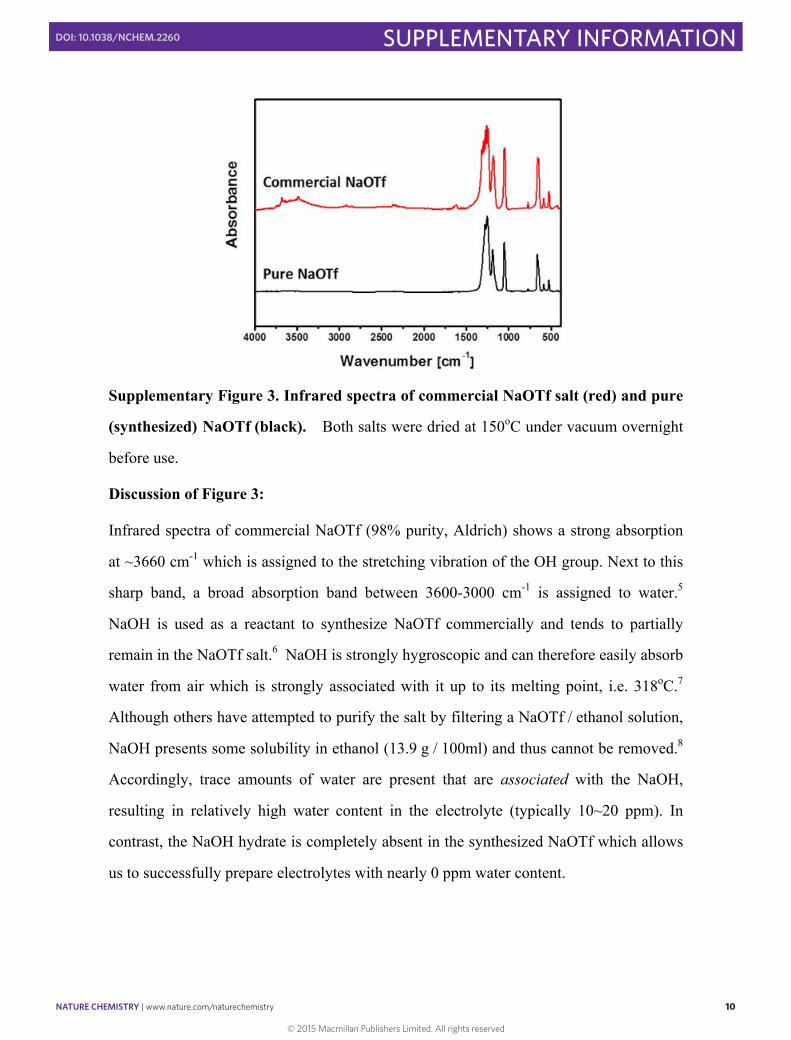
Supplementary Figure 3. Infrared spectra of commercial NaOTf salt (red) and pure
(synthesized) NaOTf (black). Both salts were dried at 150oC under vacuum overnight
before use.
Discussion of Figure 3:
Infrared spectra of commercial NaOTf (98% purity, Aldrich) shows a strong absorption
at ~3660 cm-1 which is assigned to the stretching vibration of the OH group. Next to this
sharp band, a broad absorption band between 3600-3000 cm-1 is assigned to water.5
NaOH is used as a reactant to synthesize NaOTf commercially and tends to partially
remain in the NaOTf salt.6 NaOH is strongly hygroscopic and can therefore easily absorb
water from air which is strongly associated with it up to its melting point, i.e. 318oC.7
Although others have attempted to purify the salt by filtering a NaOTf / ethanol solution,
NaOH presents some solubility in ethanol (13.9 g / 100ml) and thus cannot be removed.8
Accordingly, trace amounts of water are present that are associated with the NaOH,
resulting in relatively high water content in the electrolyte (typically 10~20 ppm). In
contrast, the NaOH hydrate is completely absent in the synthesized NaOTf which allows
us to successfully prepare electrolytes with nearly 0 ppm water content.
© 2015 Macmillan Publishers Limited. All rights reserved
NATURE CHEMISTRY | www.nature.com/naturechemistry 11
SUPPLEMENTARY INFORMATIONDOI: 10.1038/NCHEM.2260
11
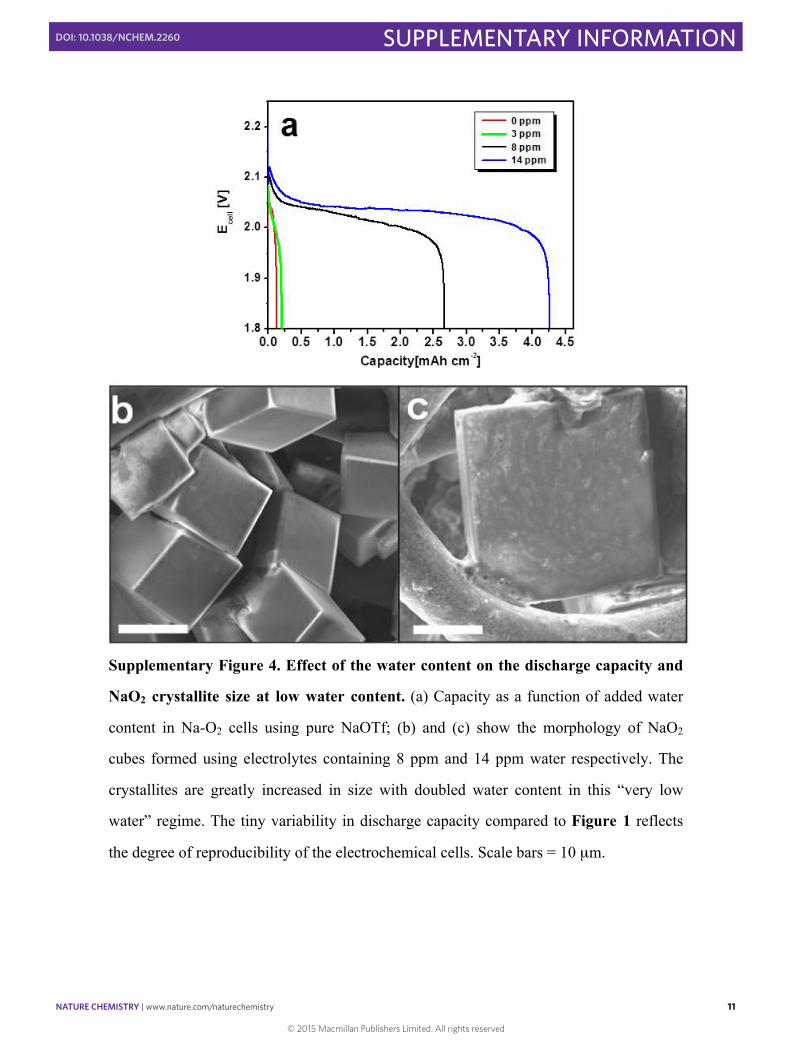
Supplementary Figure 4. Effect of the water content on the discharge capacity and
NaO2 crystallite size at low water content. (a) Capacity as a function of added water
content in Na-O2 cells using pure NaOTf; (b) and (c) show the morphology of NaO2
cubes formed using electrolytes containing 8 ppm and 14 ppm water respectively. The
crystallites are greatly increased in size with doubled water content in this “very low
water” regime. The tiny variability in discharge capacity compared to Figure 1 reflects
the degree of reproducibility of the electrochemical cells. Scale bars = 10 µm.
© 2015 Macmillan Publishers Limited. All rights reserved
NATURE CHEMISTRY | www.nature.com/naturechemistry 12
SUPPLEMENTARY INFORMATIONDOI: 10.1038/NCHEM.2260
12
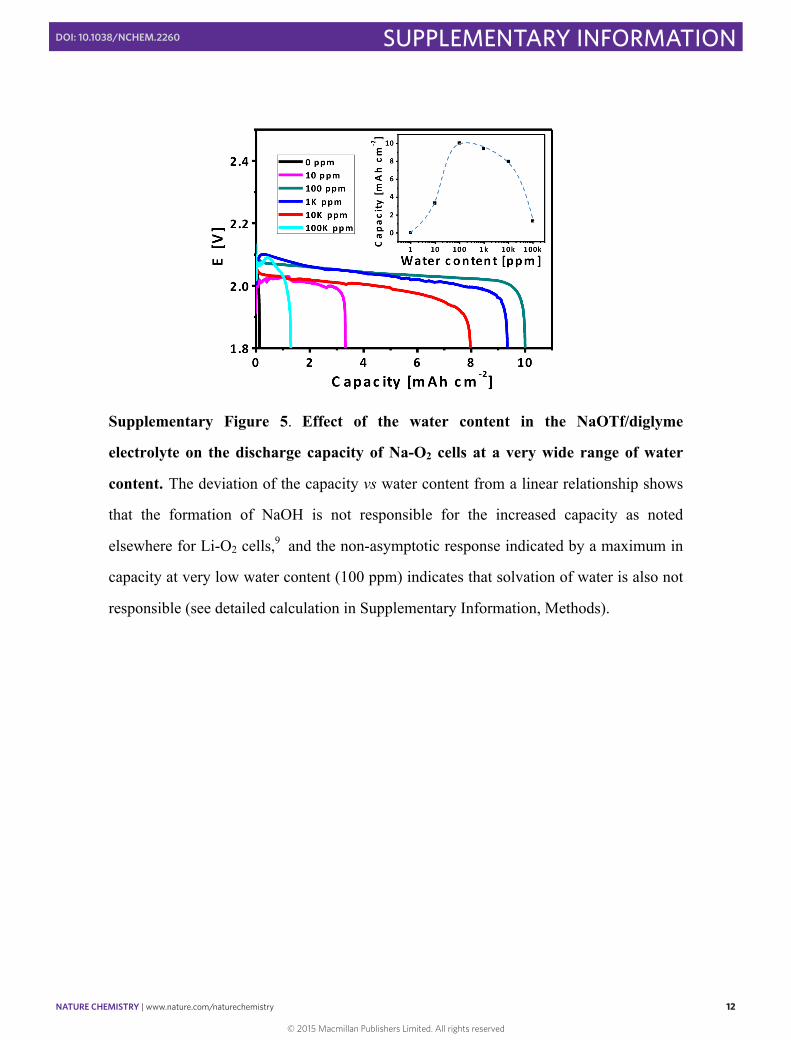
Supplementary Figure 5. Effect of the water content in the NaOTf/diglyme
electrolyte on the discharge capacity of Na-O2 cells at a very wide range of water
content. The deviation of the capacity vs water content from a linear relationship shows
that the formation of NaOH is not responsible for the increased capacity as noted
elsewhere for Li-O2 cells,9 and the non-asymptotic response indicated by a maximum in
capacity at very low water content (100 ppm) indicates that solvation of water is also not
responsible (see detailed calculation in Supplementary Information, Methods).
© 2015 Macmillan Publishers Limited. All rights reserved
NATURE CHEMISTRY | www.nature.com/naturechemistry 13
SUPPLEMENTARY INFORMATIONDOI: 10.1038/NCHEM.2260
13
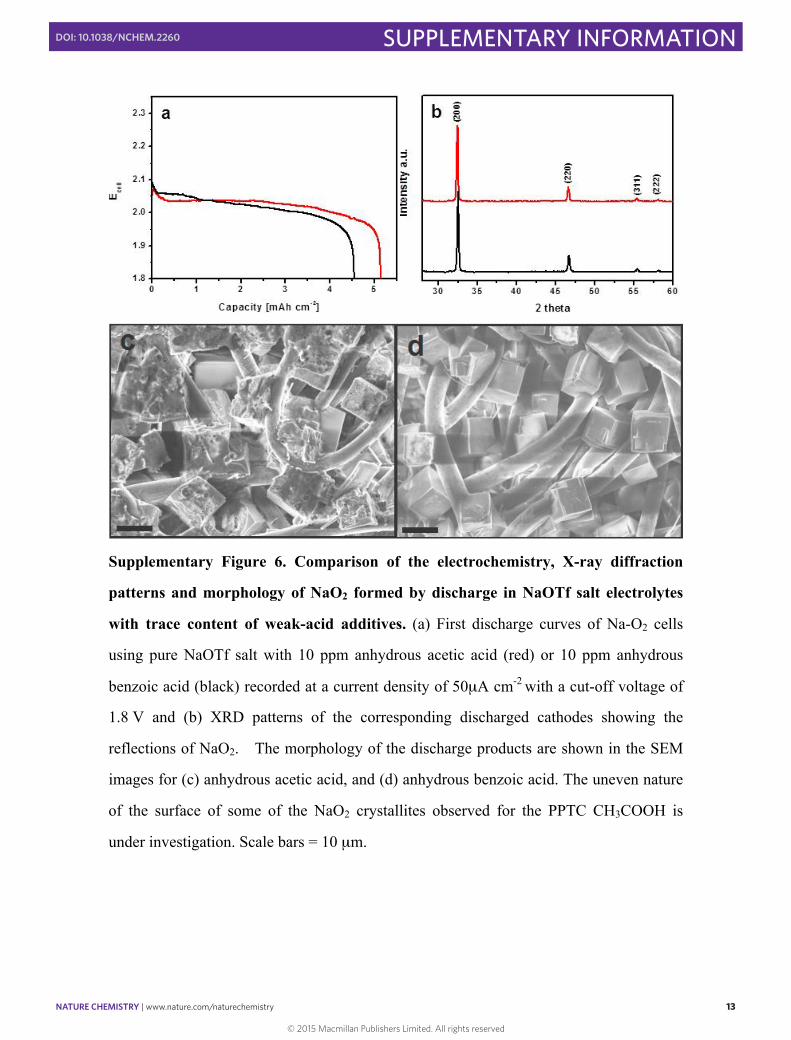
Supplementary Figure 6. Comparison of the electrochemistry, X-ray diffraction
patterns and morphology of NaO2 formed by discharge in NaOTf salt electrolytes
with trace content of weak-acid additives. (a) First discharge curves of Na-O2 cells
using pure NaOTf salt with 10 ppm anhydrous acetic acid (red) or 10 ppm anhydrous
benzoic acid (black) recorded at a current density of 50µA cm-2 with a cut-off voltage of
1.8 V and (b) XRD patterns of the corresponding discharged cathodes showing the
reflections of NaO2. The morphology of the discharge products are shown in the SEM
images for (c) anhydrous acetic acid, and (d) anhydrous benzoic acid. The uneven nature
of the surface of some of the NaO2 crystallites observed for the PPTC CH3COOH is
under investigation. Scale bars = 10 µm.
© 2015 Macmillan Publishers Limited. All rights reserved
NATURE CHEMISTRY | www.nature.com/naturechemistry 14
SUPPLEMENTARY INFORMATIONDOI: 10.1038/NCHEM.2260
14
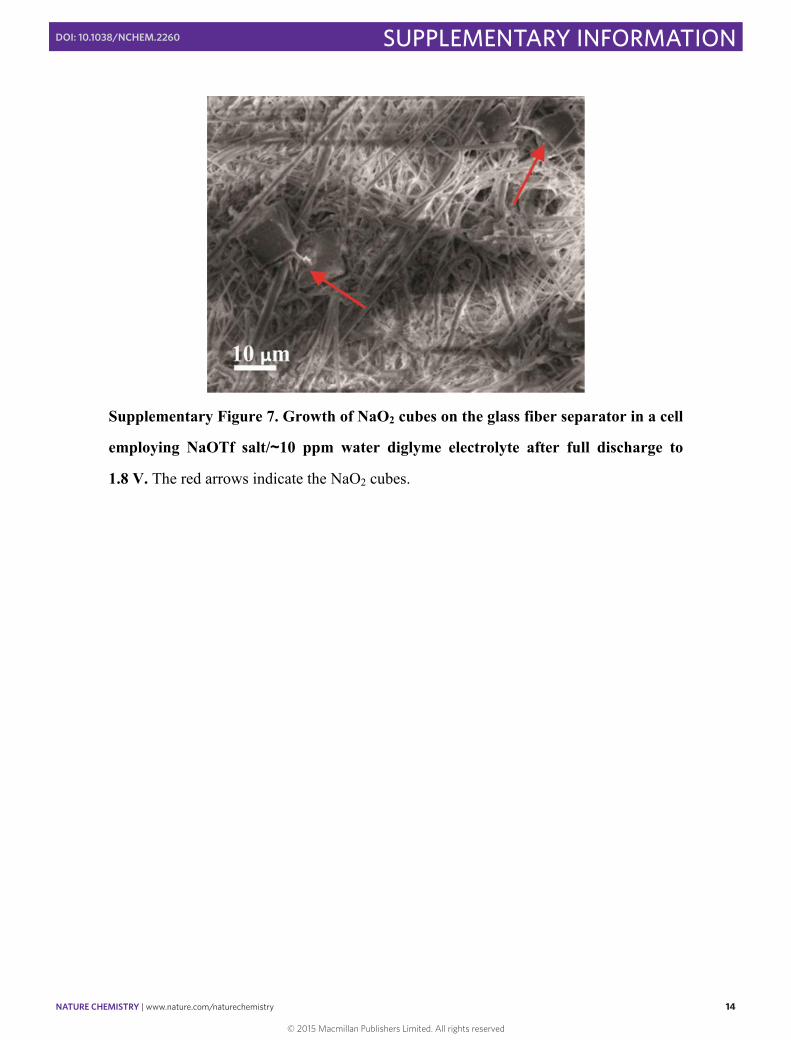
Supplementary Figure 7. Growth of NaO2 cubes on the glass fiber separator in a cell
employing NaOTf salt/~10 ppm water diglyme electrolyte after full discharge to
1.8 V. The red arrows indicate the NaO2 cubes.
© 2015 Macmillan Publishers Limited. All rights reserved
NATURE CHEMISTRY | www.nature.com/naturechemistry 15
SUPPLEMENTARY INFORMATIONDOI: 10.1038/NCHEM.2260
15
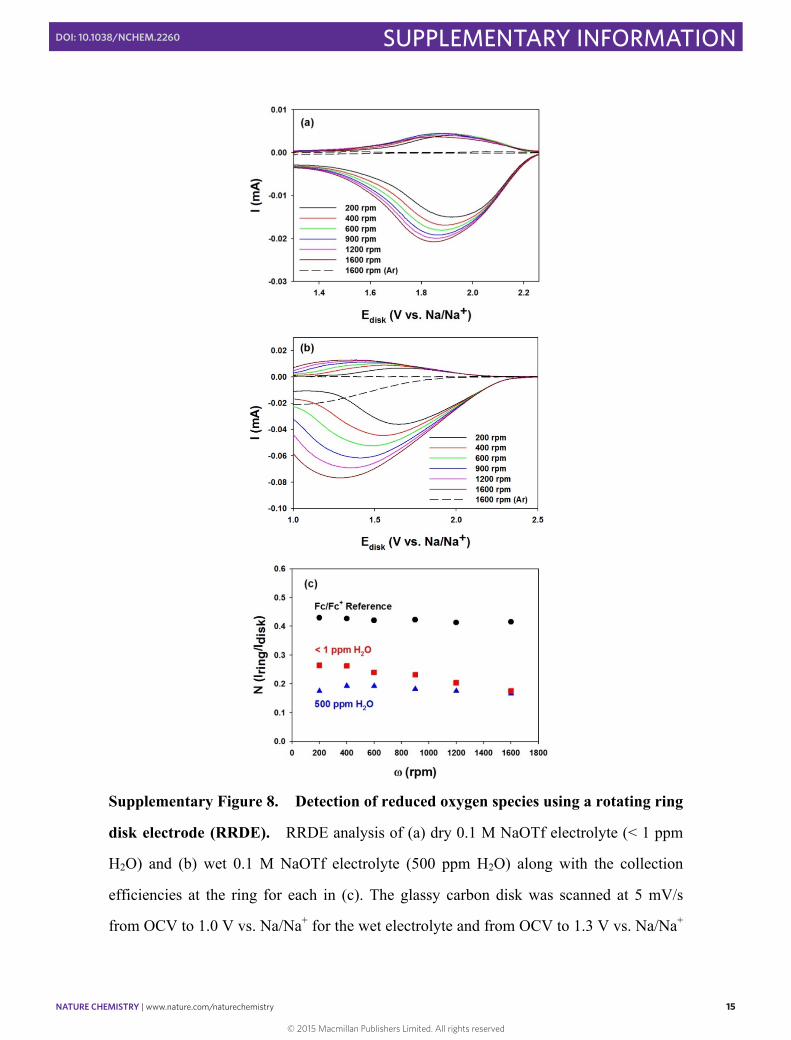
Supplementary Figure 8. Detection of reduced oxygen species using a rotating ring
disk electrode (RRDE). RRDE analysis of (a) dry 0.1 M NaOTf electrolyte (< 1 ppm
H2O) and (b) wet 0.1 M NaOTf electrolyte (500 ppm H2O) along with the collection
efficiencies at the ring for each in (c). The glassy carbon disk was scanned at 5 mV/s
from OCV to 1.0 V vs. Na/Na+ for the wet electrolyte and from OCV to 1.3 V vs. Na/Na+
© 2015 Macmillan Publishers Limited. All rights reserved
NATURE CHEMISTRY | www.nature.com/naturechemistry 16
SUPPLEMENTARY INFORMATIONDOI: 10.1038/NCHEM.2260
16
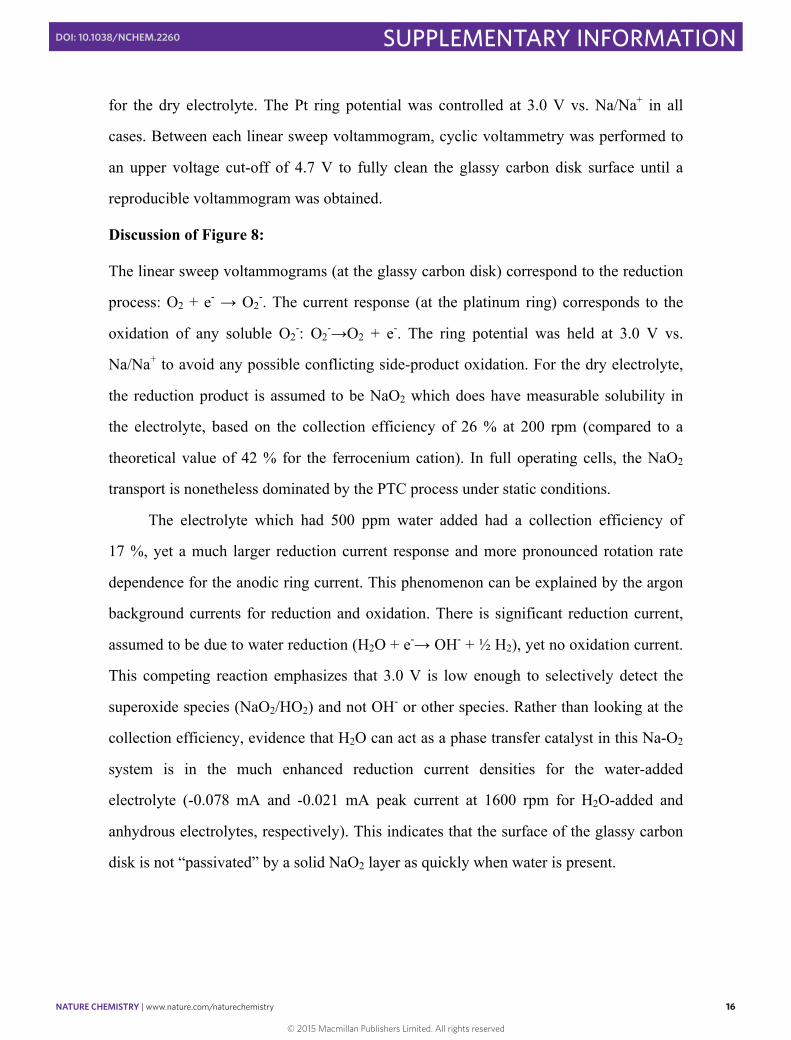
for the dry electrolyte. The Pt ring potential was controlled at 3.0 V vs. Na/Na+ in all
cases. Between each linear sweep voltammogram, cyclic voltammetry was performed to
an upper voltage cut-off of 4.7 V to fully clean the glassy carbon disk surface until a
reproducible voltammogram was obtained.
Discussion of Figure 8:
The linear sweep voltammograms (at the glassy carbon disk) correspond to the reduction
process: O2 + e- → O2-. The current response (at the platinum ring) corresponds to the
oxidation of any soluble O2-: O2
-→O2 + e-. The ring potential was held at 3.0 V vs.
Na/Na+ to avoid any possible conflicting side-product oxidation. For the dry electrolyte,
the reduction product is assumed to be NaO2 which does have measurable solubility in
the electrolyte, based on the collection efficiency of 26 % at 200 rpm (compared to a
theoretical value of 42 % for the ferrocenium cation). In full operating cells, the NaO2
transport is nonetheless dominated by the PTC process under static conditions.
The electrolyte which had 500 ppm water added had a collection efficiency of
17 %, yet a much larger reduction current response and more pronounced rotation rate
dependence for the anodic ring current. This phenomenon can be explained by the argon
background currents for reduction and oxidation. There is significant reduction current,
assumed to be due to water reduction (H2O + e-→ OH- + ½ H2), yet no oxidation current.
This competing reaction emphasizes that 3.0 V is low enough to selectively detect the
superoxide species (NaO2/HO2) and not OH- or other species. Rather than looking at the
collection efficiency, evidence that H2O can act as a phase transfer catalyst in this Na-O2
system is in the much enhanced reduction current densities for the water-added
electrolyte (-0.078 mA and -0.021 mA peak current at 1600 rpm for H2O-added and
anhydrous electrolytes, respectively). This indicates that the surface of the glassy carbon
disk is not “passivated” by a solid NaO2 layer as quickly when water is present.
© 2015 Macmillan Publishers Limited. All rights reserved
NATURE CHEMISTRY | www.nature.com/naturechemistry 17
SUPPLEMENTARY INFORMATIONDOI: 10.1038/NCHEM.2260
17
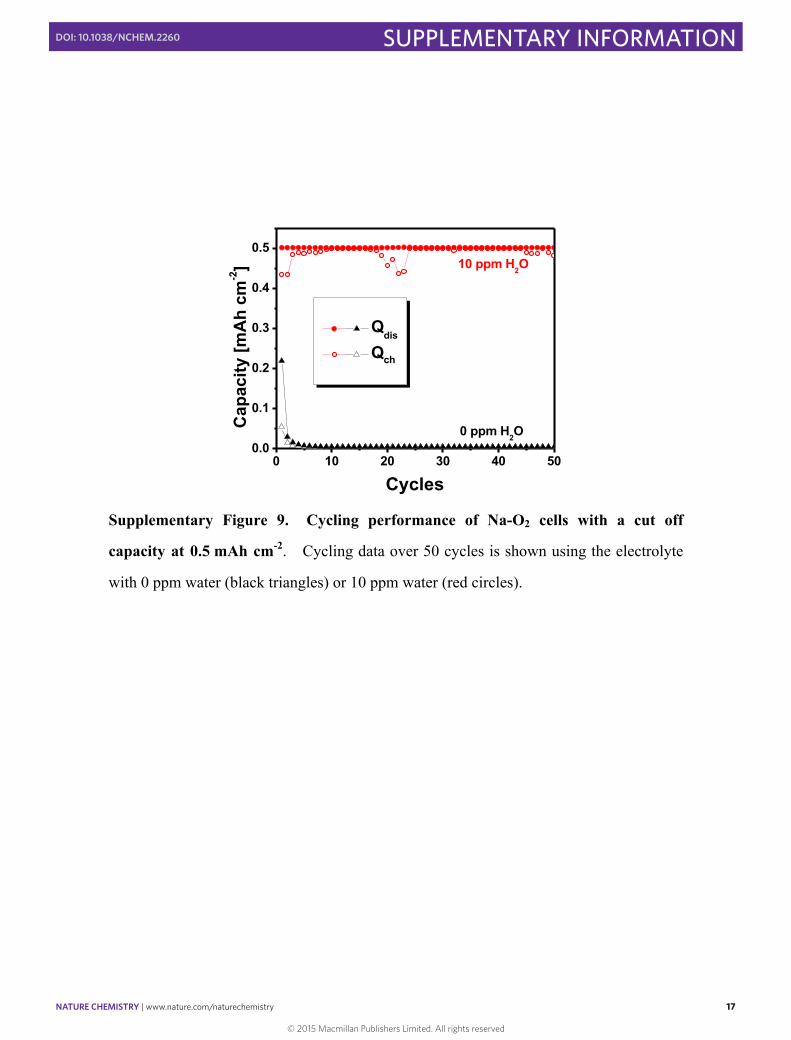
Supplementary Figure 9. Cycling performance of Na-O2 cells with a cut off
capacity at 0.5 mAh cm-2. Cycling data over 50 cycles is shown using the electrolyte
with 0 ppm water (black triangles) or 10 ppm water (red circles).
0 10 20 30 40 500.0
0.1
0.2
0.3
0.4
0.5
0 ppm H2O
Qdis
Qch
Cycles
Cap
acity
[mA
h cm
-2] 10 ppm H2O
© 2015 Macmillan Publishers Limited. All rights reserved
NATURE CHEMISTRY | www.nature.com/naturechemistry 18
SUPPLEMENTARY INFORMATIONDOI: 10.1038/NCHEM.2260
18
References
1. Johnson, Lee, Li, Chunmei, Liu, Z., Chen, Y., Freunberger, S.A., Ashok, P.C.,
Praveen, B.B., Dholakia, K., Tarascon, J.-M,, Bruce, P.G. The role of LiO2
solubility in O2 reduction in aprotic solvents and its consequences for Li-O2 batteries.
Nature Chem., 6, 1091-1099 (2014).
2. A. Coelho, Bruker AXS GmbH, Karlsruhe, Germany 2008. 3. Cheary, R., Coelho & W. A. A fundamental parameters approach to X-ray
line-profile fitting. J. Appl. Cryst. 25, 109-121, (1992).
4. Sofina, N., Peters, E.-M. & Jansen, M. Crystal Structure and Sodium Ion
Conductivity of Anhydrous Sodium Trifluoromethylsulfonate. Z. anorg. allg. Chem.
629, 1431–1436, (2003).
5. Maiti, G.C. & Baerns, M. Dehydration of sodium hydroxide and lithium hydroxide
dispersed over calcium oxide catalysts for the oxidative coupling of methane. Appl.
Catal. 127, 219-232, (1995)
6. Howells, R. D. & Mc COWN, J. D. Trifluoromethanesulfonic Acid and Derivatives.
Chemical Reviews. 77, 69-92, (1977).
7. Williams, D. D. & Miller, R. R. The Reactions of Molten Sodium Hydroxide with
Various Metals. J. Am. Chem. Soc. 78, 5150-5155, (1956).
8. McCloskey, B. D., Garcia, J. M. & Luntz, A. C. Chemical and electrochemical
differences in nonaqueous Li-O2 and Na-O2 batteries. J. Phys. Chem. Lett. 5,
1230-1235, (2014).
9. Aetukuri, N.B., McCloskey, B.D., Garcia, J.M., Krupp, L.E., Viswanathan, V., Luntz,
A.C. Solvating additives drive solution-mediated electrochemistry and enhance
toroid growth in non-aqueous Li-O2 batteries. Nature Chem., 7, 50 – 56 (2015).
© 2015 Macmillan Publishers Limited. All rights reserved