ars.els-cdn.com€¦ · web viewsupplementary material for. electrochemical behavior of ru...
TRANSCRIPT
Supplementary material for
Electrochemical behavior of Ru nanoparticles as catalysts in
aprotic Li–O2 batteries
Xing Xin, Kimihiko Ito, Yoshimi Kubo*
GREEN, National Institute for Materials Science, 1-1 Namiki, Tsukuba 305-0044, Japan
* Corresponding author:
Dr. Yoshimi Kubo
Tel.: +81-029-8604773
Email: [email protected]
Present Addresses: GREEN, National Institute for Materials Science, 1-1 Namiki, Tsukuba 305-
0044, Japan
1

Fig. S1. TEM images of RGO nanosheets.
Fig. S2. TGA curves of RGO/Ru and KB/Ru composites.
2
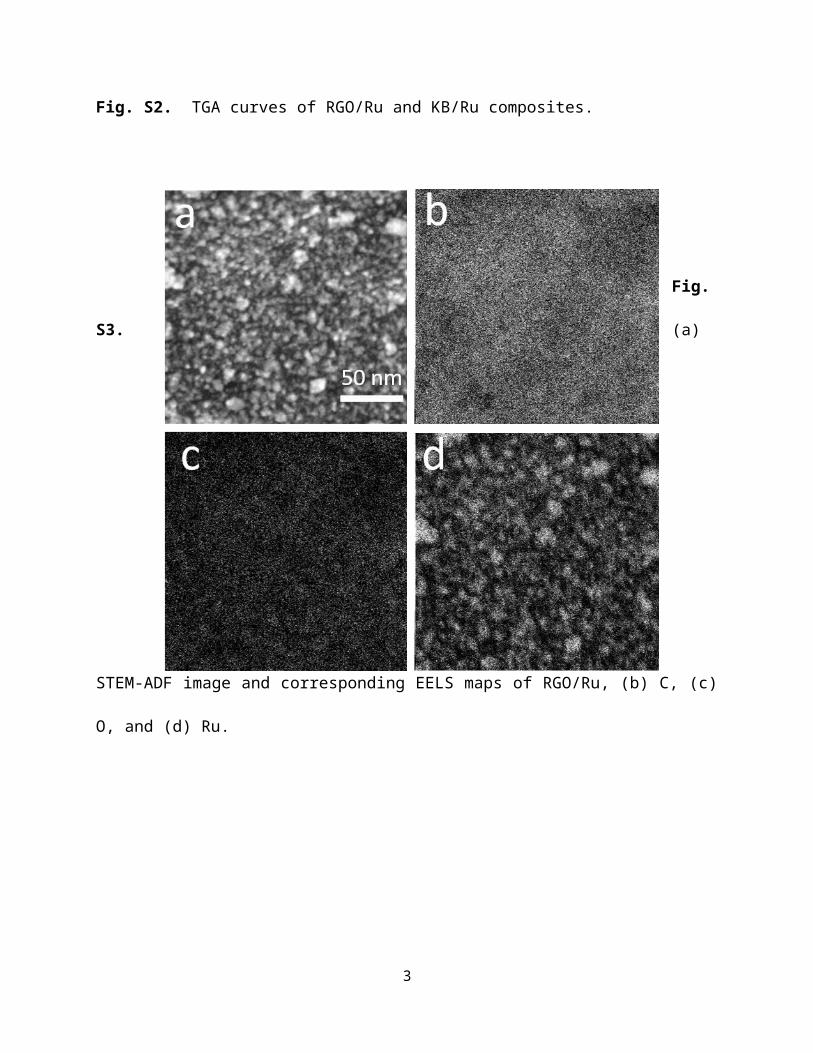
Fig. S3. (a) STEM-ADF image and corresponding EELS maps of RGO/Ru, (b) C, (c) O, and (d)
Ru.
3

Fig. S4. (a) SEM image of KB particles. (b) SEM image of the KB/Ru composite. (c) STEM-
ADF image and corresponding EELS map of the KB/Ru composite. (d) XRD pattern of the
KB/Ru composite.
4
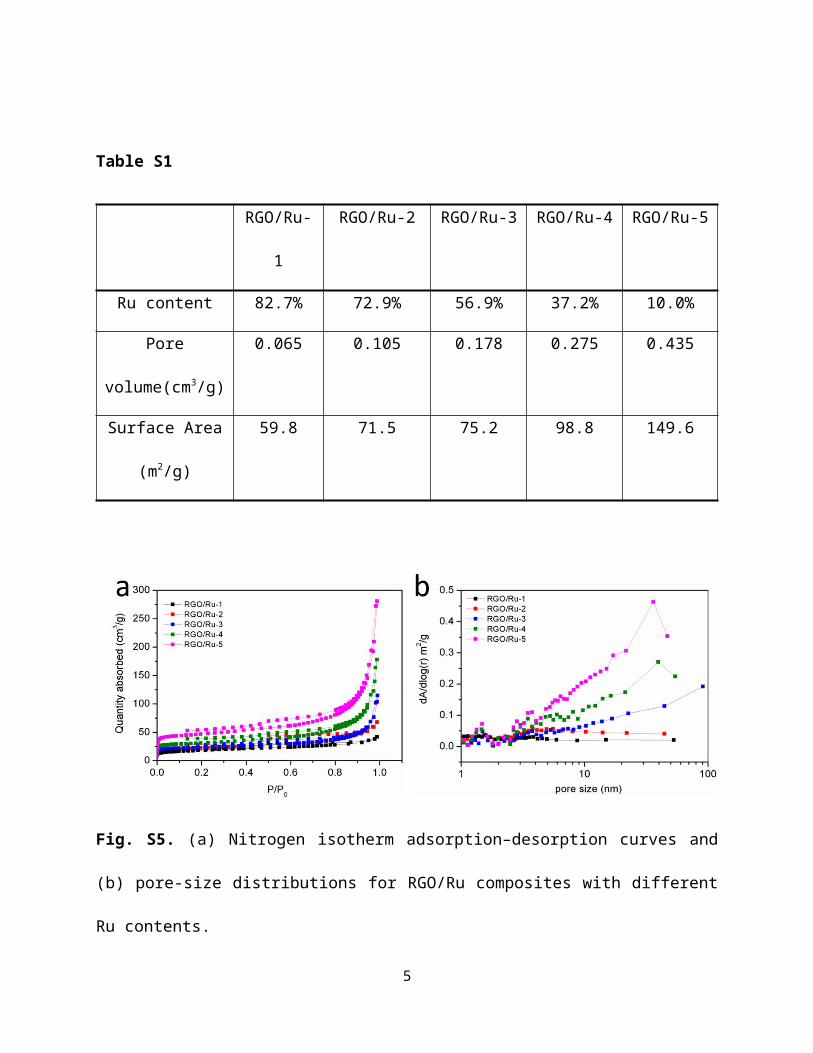
Table S1
RGO/Ru-1 RGO/Ru-2 RGO/Ru-3 RGO/Ru-4 RGO/Ru-5
Ru content 82.7% 72.9% 56.9% 37.2% 10.0%
Pore
volume(cm3/g)
0.065 0.105 0.178 0.275 0.435
Surface Area
(m2/g)
59.8 71.5 75.2 98.8 149.6
Fig. S5. (a) Nitrogen isotherm adsorption–desorption curves and (b) pore-size distributions for
RGO/Ru composites with different Ru contents.
5

Fig. S6. SEM images of RGO/Ru nanocomposites with different Ru contents: (a) RGO/Ru-1, (b)
RGO/Ru-2, (c) RGO/Ru-3, (d) RGO/Ru-4, and (e) RGO/Ru-5. (f) TGA curves of RGO/Ru with
different Ru contents.
Nitrogen isotherm adsorption–desorption curves and pore-size distributions (Fig. S5) for
RGO/Ru show that the surface area and pore volume decrease with increasing Ru content. The
pore-size distributions clearly show that pores of several tens of nanometers are dominant and
markedly reduced with increasing Ru content. It is found in Fig. S6 that, at a high Ru content of
82.7% (RGO/Ru-1, Figure S6a), Ru particles attached to the surface of graphene are obviously
aggregated. When the Ru content is decreased, the density of Ru on the graphene sheets
gradually decreases, and the extent of aggregation also declines. When the weight ratio of Ru is
lower than 10%, the sheet thickness is obviously thinner and is similar to bare graphene.
6
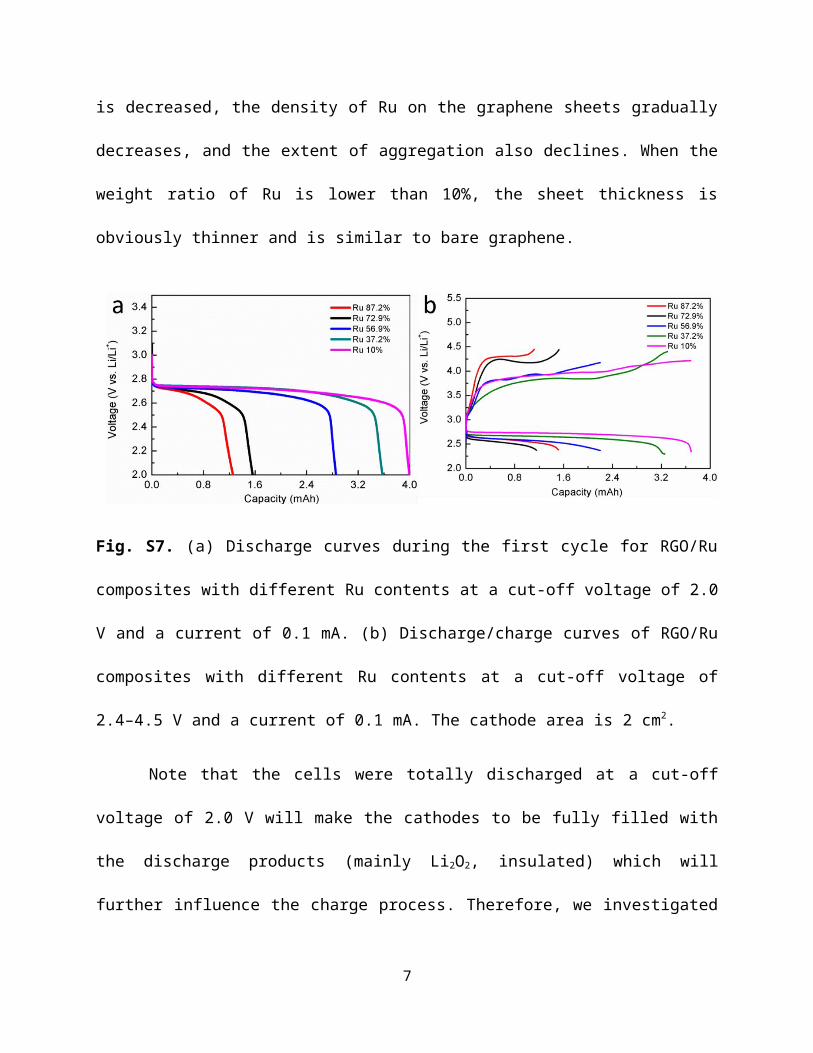
Fig. S7. (a) Discharge curves during the first cycle for RGO/Ru composites with different Ru
contents at a cut-off voltage of 2.0 V and a current of 0.1 mA. (b) Discharge/charge curves of
RGO/Ru composites with different Ru contents at a cut-off voltage of 2.4–4.5 V and a current of
0.1 mA. The cathode area is 2 cm2.
Note that the cells were totally discharged at a cut-off voltage of 2.0 V will make the cathodes
to be fully filled with the discharge products (mainly Li2O2, insulated) which will further
influence the charge process. Therefore, we investigated the charge process by adopting the
discharge cut-off voltage at 2.4 V (as shown in Figure S7b).
7

Fig. S8. SEM images of (a) RGO, (b) KB, (c) RGO/Ru, and (d) KB/Ru after discharge of 2 mAh
at a current of 0.1 mA. The cathode area is 2 cm2.
8
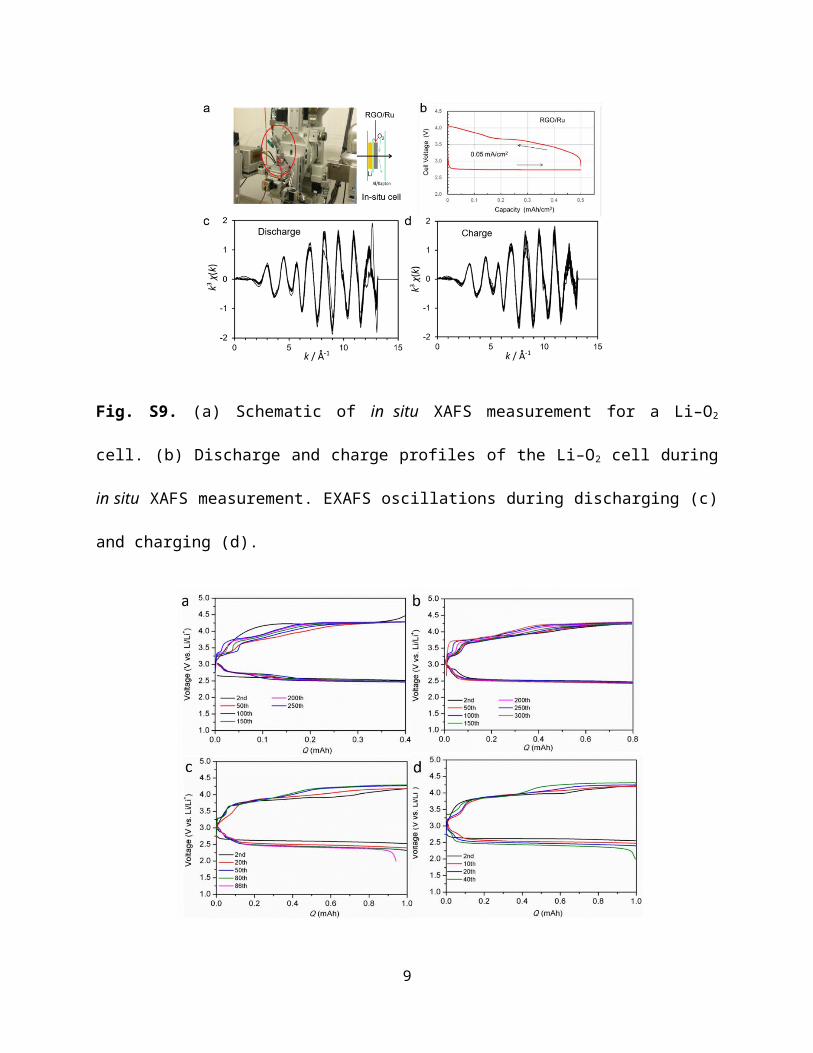
Fig. S9. (a) Schematic of in situ XAFS measurement for a Li–O2 cell. (b) Discharge and charge
profiles of the Li–O2 cell during in situ XAFS measurement. EXAFS oscillations during
discharging (c) and charging (d).
9
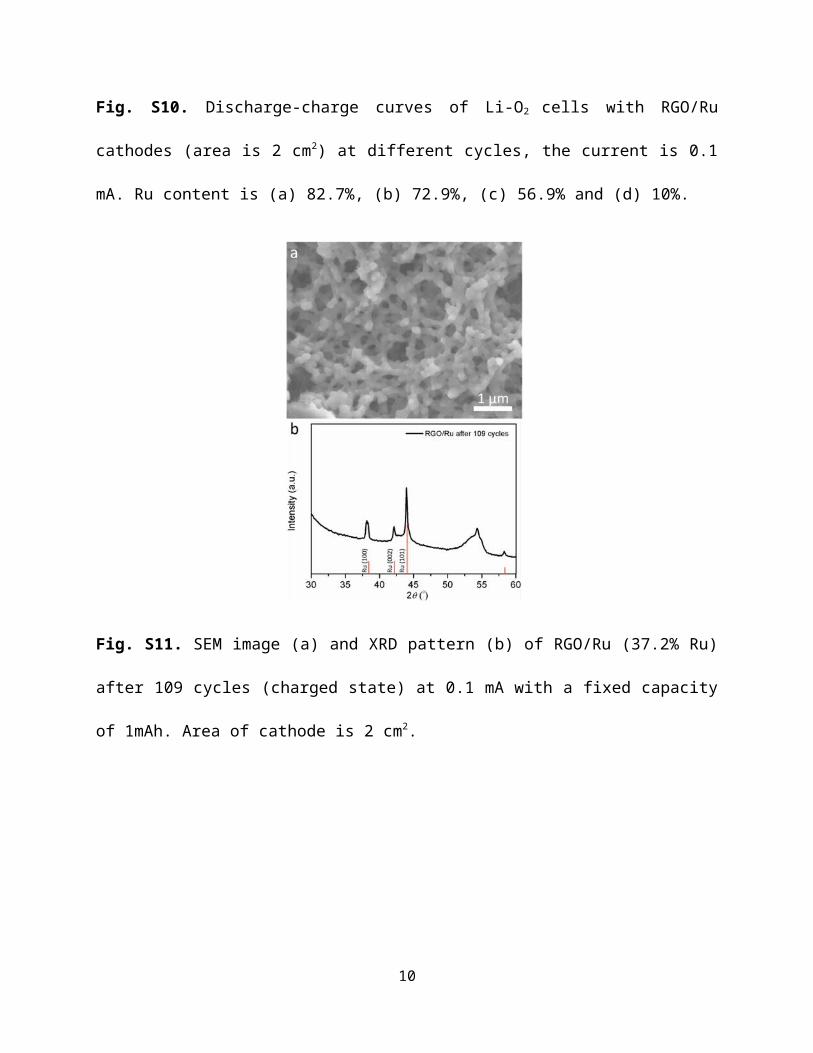
Fig. S10. Discharge-charge curves of Li-O2 cells with RGO/Ru cathodes (area is 2 cm2) at
different cycles, the current is 0.1 mA. Ru content is (a) 82.7%, (b) 72.9%, (c) 56.9% and (d)
10%.
Fig. S11. SEM image (a) and XRD pattern (b) of RGO/Ru (37.2% Ru) after 109 cycles (charged
state) at 0.1 mA with a fixed capacity of 1mAh. Area of cathode is 2 cm2.
10

11