the corine land cover 2000 project - earsel ... eproceedings 3, 3/2004 331 the corine land cover...
TRANSCRIPT

EARSeL eProceedings 3, 3/2004 331
THE CORINE LAND COVER 2000 PROJECT
George Büttner1, Jan Feranec2, Gabriel Jaffrain3,,László Mari4, Gergely Maucha1 and Tomas Soukup5
1. FÖMI, Budapest, Hungary, and ETC-TE #; {buttner/g.maucha}(at)rsc.fomi.hu 2. IG SAS, Bratislava, Slovakia, ETC-TE #; geogfera(at)savba.savba.sk 3. IGN FI, Paris, France, and ETC-TE #; gjaffrain(at)ignfi.fr 4. Eötvös University, Budapest, Hungary, and ETC-TE #; maril(at)ludens.elte.hu 5. GISAT, Prague, Czech Republic, and ETC-TE #; tomas.soukup(at)gisat.cz # European Topic Centre on Terrestrial Environment, Universitat Autonoma de
Barcelona; http://terrestrial.eionet.eu.int
ABSTRACT The objective of the European Environment Agency (EEA) is to provide policy makers with timely and relevant environmental information. Regarding land cover (LC), EEA aims at providing those responsible for and interested in European policy on the environment with qualitative and quantita-tive LC data, which is consistent and comparable across the continent. As part of the EEA man-date, the CORINE Land Cover (CLC) database initiated by the Commission in 1985 should be further maintained and updated regularly. Consistent geo-referenced LC information has been identified by different national and European policies as a key database for integrated environ-mental assessment. In order to reach this goal EEA and the Joint Research Centre (JRC) launched the IMAGE2000 and CLC2000 Project (I&CLC2000), which includes the updating of the CLC database. The satel-lite image 'snap shot' of Europe (IMAGE2000) is the principal material to undertake the updating of CLC database for the year 2000 (CLC2000) and to identify the main LC changes that occurred in Europe within the period 1990-2000. Presently 29 European countries are participating in the pro-ject. The database, which will be finished by the end of 2004, covers about 4.5 million km2 with 25 ha spatial resolution. The CLC-changes database has a 5 ha spatial resolution. The paper introduces the methodology of deriving the CLC2000 databases. Some preliminary re-sults are presented with emphasis on major land cover changes in some countries.
Keywords: CORINE, land cover updating, land cover change mapping in Europe
INTRODUCTION From 1985 to 1990, the European Commission implemented the CORINE Programme (Co-ordination of Information on the Environment) (1). During this period, an information system on the state of the European environment was created and nomenclatures and methodologies were de-veloped and agreed at EU level. The CORINE Land Cover (CLC) project has been implemented in most of the EU countries as well as in the 13 Phare partner countries in Central and Eastern Europe (2). Following the setting up the European Environment Agency (EEA) and the establishment of the European Environment Information and Observation Network (EIONET), the responsibilities of the CORINE databases, including their up-dates now rely on the EEA. CLC is the largest of CORINE databases, providing information on the physical characteristics of the earth surface. Images ac-quired by earth observation satellites are used to derive land cover information. As the CLC inventory was completed and came to use, several users at national and European level expressed their need for an updated CLC database. The I&CLC2000 project is based upon a number of key elements: lessons learnt form earlier CLC projects, a current list of user needs, the options available for satellite images, and the processing and management requirements for the

EARSeL eProceedings 3, 3/2004 332
vast amount of data. The overall aim of updating is to produce the CLC2000 database and the database of CLC-Changes between the first CLC inventory and 2000. To guarantee full coverage and to maximise consistency with the previous inventory, the I&CLC2000 project calls upon exist-ing local expertise and requires access to both the ancillary data and the satellite data used for the first CLC inventory. The I&CLC2000 project consists of two main components, which are intercon-nected (3):
• IMAGE2000: covering all activities related to satellite image acquisition, ortho-rectification and production of European and national mosaics, and
• CLC2000: covering all activities related to updating of the first CLC inventory (called CLC90) based on IMAGE2000 and detection and interpretation of CLC-Changes using CLC90 and IMAGE90.
The project will be finished at the end of 2004. The objective of the paper is to introduce the ap-plied methodology and to present some of the first results.
THE CLC2000 PROJECT I&CLC2000 is a joint EEA / JRC project in which the JRC has the responsibility for the IMAGE2000 and EEA is responsible for CLC2000. EEA is the overall coordinator of the project (Figure 1). The European Topic Centre on Terrestrial Environment (ETC-TE) has the responsibility to coordinate and supervise national CLC2000 activities as well as to contribute to the promotion of the use of the data. The dissemination and use of the I&CLC2000 products is defined in an agreement between the EEA, the European Commission, and the participating countries. Figure 1. Organisational set-up of the project
The CLC2000 Technical Team (TT) assists both the national teams and the EEA. It consists of experts of ETC-TE. Main tasks of the CLC2000 Technical Team are as follows:
• Compiling the CLC update Technical Guidelines (3). • Implementing training / technical discussion sessions for national teams according to their
specific needs.
European Environment
Agency (EEA)
Joint Re-search Centre (JRC)
European Steering
Committee
CLC2000 Technical
Team
IMAGE2000 Technical
Team
National CLC2000 teams
National Steering
Committee

EARSeL eProceedings 3, 3/2004 333
• Providing and introducing InterChange software, developed by FÖMI (4) for interested na-tional teams.
• Coordinating the work with national teams on CLC data production. • Supporting the national teams upon request during CLC2000 national project development. • Assisting and controlling the national teams in performing the database verification mis-
sions (usually two country visits, about 8 % of total area is checked in details). • Providing final technical control of deliverables (5). • Merging the national land cover data into a consistent European database. Each national
Coordinate Reference System (CRS) definition must be known precisely together with its geometric relationship to a standard European system in order to accurately transfer all na-tional data into the ETRS89 Ellipsoidal Coordinate Reference System (ETRS89).
• Produces a set of derived products for web-based dissemination. Presently 29 countries of Europe are participating in the project: EU25, Bulgaria, Croatia, Liech-tenstein and Romania (Appendix 2). The respective National Authority decides on the project im-plementation, provides a commitment on the minimum 50% co-financing of the project and ap-points (or selects by tender) the implementing organisation(s). EU institutions provide the rest of the funding.
From CLC90 to CLC2000 The approach of computer-assisted visual interpretation of satellite images has been chosen as the CLC mapping methodology. The choice of scale (1:100,000), minimum mapping unit (MMU) (25 hectares) and minimum width of linear elements (100 metres) represents a trade-off between cost and detail of land cover information (1). These two basic parameters are the same for CLC90 and CLC2000. In CLC90 some of the countries had not kept the 25 ha limit, which made compari-sons among countries difficult. The standard CLC nomenclature includes 44 land cover classes (Appendix 1). These are grouped in a three-level hierarchy. The five level-one categories are: 1) artificial surfaces, 2) agricultural areas 3) forests and semi-natural areas, 4) wetlands, 5) water bodies. All national teams had to adapt this standard nomenclature according to their landscape conditions. Although the 44 catego-ries have not changed since the implementation of the first CLC inventory (1986-1998), the defini-tion of each nomenclature element was significantly improved (6). Raw satellite images first have to be pre-processed and enhanced to yield a geometrically correct document in national projection. For CLC2000, ortho-correction of Landsat-7 ETM satellite images was provided by the IMAGE2000 component, with an RMS error below 25 meter. Detailed topog-raphic maps and in some cases orthophotos were used to achieve this accuracy. In IMAGE90 usually only a polynomial correction was applied, and GCPs were usually selected from 1:100,000 scale maps. The accuracy of IMAGE90 products is usually significantly poorer than that of IMAGE2000. During the first CLC inventory a "traditional" photointerpretation method was used: an overlay was fixed on top of a satellite image hardcopy and the photointerpreter drew polygons on it with a CLC code. Later on the overlay was digitised, topology was created and the CLC code entered (1). This procedure often resulted in several types of errors in geometry as well as in thematic content. When comparing CLC90 with IMAGE2000 (as a basic geometric reference), geometric errors sometimes larger than 200 meters were observed. In some of the countries thematic accuracy of CLC90 hardly achieved the target 85% value (Table 1). In CLC2000 the method of drawing on transparencies was discarded, and the use of computer-assisted photointerpretation (CAPI) was required (7).
Land Cover changes One of the most important novelties of CLC2000 is the database of Land Cover Changes (LCC). It was a policy requirement to map LCC less than the 25 ha MMU size of CLC. The MMU of the LCC database was set to 5 ha (Table 1). The 100 meter minimum width is also valid for the LCC poly-

EARSeL eProceedings 3, 3/2004 334
gons for practical reasons. Changes should refer to real evolution processes and not to different interpretations of the same subject. Therefore, amendments of CLC90 and real changes have to be clearly distinguished (3).
Table 1. Novelties of CLC2000 (3)
User requirement CLC90 specification
CLC2000 Specification
More time consistency 1986-1998 2000 +/- 1 year
Improved geometric accuracy: - satellite images:
- CLC data:
50 m 100 m
25 m
better than 100 m Thematic accuracy ≥ 85% ≥ 85%
Changes smaller than the minimum mapping unit shall be
identified
¯
boundary displacement should be minimum 100 m;
change area should be minimum 5 ha Faster turnaround time 10 years 4 years
Lower production costs 6 €/km2 3 €/km2
Improved documentation incomplete metadata standard metadata
Easier access to the data unclear dissemination policy
dissemination policy agreed from the start
Products of the CLC2000 project The CLC2000 project creates a number of defined standard output products. All vector products should have ArcInfo format. National Teams deliver CLC2000, CLC-changes and the revised CLC90 (optional), together with metadata. ETC-TE produces the following products: European CLC2000 and CLC-changes, raster CLC data with 100 m and 250 m grid size, and statistics refer-ring to 1km2 cells. National products are created in national projection, while European vector data are provided in geographical coordinates (ETRS89 system). European raster products are deliv-ered in Lambert Azimuthal Equal Area projection (3).
REALISATION OF CLC2000 The change detection process and the mapping of the CLC-Changes are carried out by means of image comparison using computer-assisted visual image interpretation tools. The CLC90 is used as reference data set. The methodology was developed by the JRC in collaboration with the ETC Land Cover (7).
Geometric adaptation of IMAGE90 IMAGE90 data (Landsat TM images used to derive CLC90 database) had to be made available for the project. Without IMAGE90 data, it would not have been possible to correct thematic errors of CLC90, and consequently false changes might have been identified. Geometry of IMAGE90 data and IMAGE2000 data was compared. If a systematic deviation larger than 50 m was observed, the IMAGE90 data had to be corrected (3).
Systematic geometric correction of CLC90 CLC90 data might have had several different types of errors: systematic or non-systematic geo-metric shifts, topology problems, holes (not interpreted areas), etc. The severity of these errors varied from country to country. CLC90 data and the geometrically correct IMAGE90 data were compared. If a systematic deviation larger than 50 m was observed between CLC90 data and IMAGE90 data, CLC90 had to be corrected (3). A rubber-sheeting technology proved to be supe-rior to linear transformation, as distortions were usually only locally systematic.
EARSeL eProceedings 3, 3/2004 335
The topology of the coverage had to be checked and topological errors (dangles, more than one labels, unnecessary boundaries, etc.) had to be corrected.
Polygon level corrections of CLC90 These corrections include removing residual geometrical errors and thematic errors. The polygons of CLC90 had to be examined concerning validity of CLC code and polygon area (and width). It was necessary to generalise all polygons smaller than 25 ha. This was a heavy task in some coun-tries, where MMU < 25 ha was applied in CLC90 (e.g. 10 ha in Belgium). Any random geometric errors had to be corrected, if the inaccuracy of the delineation (as seen on the IMAGE2000 data or on the corrected IMAGE90 data) was larger than 100 m. If a thematic er-ror was discovered, the CLC code of a polygon had to be corrected. In some countries correcting CLC90 needed significantly more efforts than the subsequent updat-ing.
Methodology of updating According to Technical Guidelines (3) a change has to be interpreted, if a polygon in CLC90 in-creased or decreased by at least 5 ha (a contiguous area), and the change polygon has a width of at least 100 m. This means that in order to produce results for Europe within the available time and budget not all detected (visible) changes have to be interpreted. As an additional requirement, changes should be valid, reflecting real land cover evolutions (e.g. increase of settlements, forest clear-cutting, etc.), and not just a subjective difference between the two interpretations or a mistake in one of them.
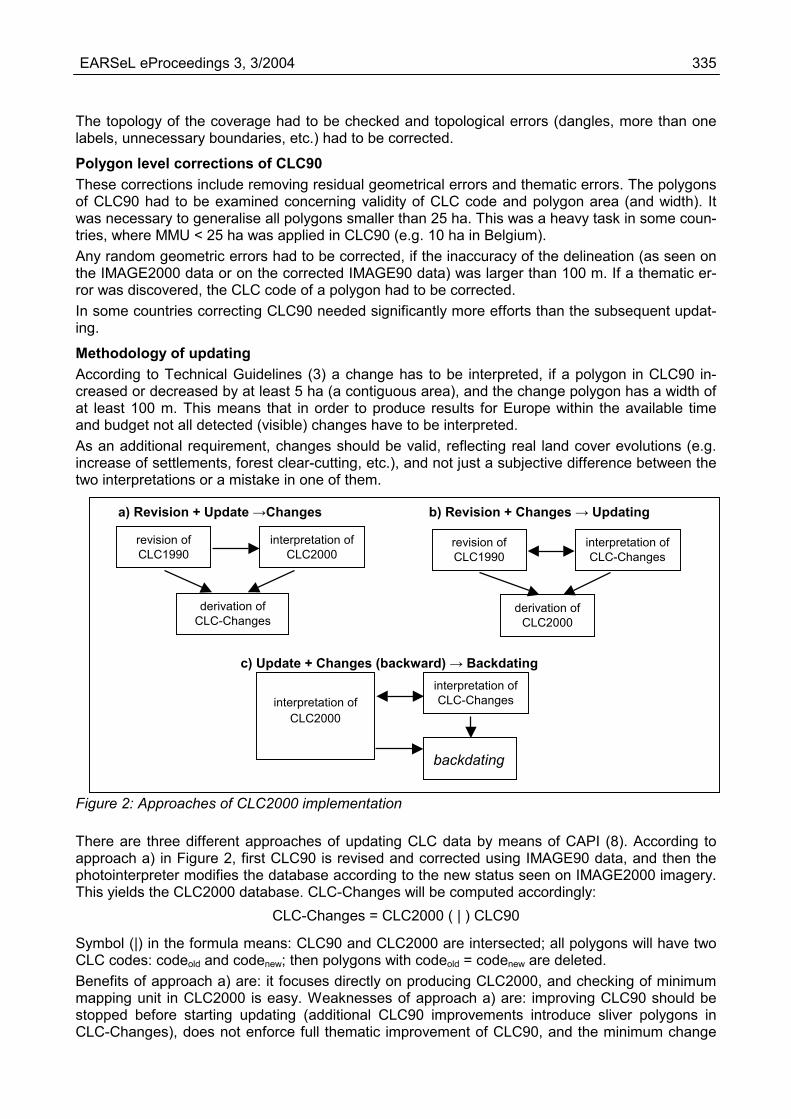
Figure 2: Approaches of CLC2000 implementation There are three different approaches of updating CLC data by means of CAPI (8). According to approach a) in Figure 2, first CLC90 is revised and corrected using IMAGE90 data, and then the photointerpreter modifies the database according to the new status seen on IMAGE2000 imagery. This yields the CLC2000 database. CLC-Changes will be computed accordingly:
CLC-Changes = CLC2000 ( | ) CLC90
Symbol (|) in the formula means: CLC90 and CLC2000 are intersected; all polygons will have two CLC codes: codeold and codenew; then polygons with codeold = codenew are deleted. Benefits of approach a) are: it focuses directly on producing CLC2000, and checking of minimum mapping unit in CLC2000 is easy. Weaknesses of approach a) are: improving CLC90 should be stopped before starting updating (additional CLC90 improvements introduce sliver polygons in CLC-Changes), does not enforce full thematic improvement of CLC90, and the minimum change
a) Revision + Update →Changes b) Revision + Changes → Updating
c) Update + Changes (backward) → Backdating
revision of CLC1990
interpretation of CLC2000
derivation of CLC-Changes
revision of CLC1990
interpretation of CLC-Changes
derivation of CLC2000
interpretation of
CLC2000
interpretation of CLC-Changes
backdating

EARSeL eProceedings 3, 3/2004 336
area (5 ha) is difficult to control. After computing CLC-changes, elimination of small and false changes is advised. According to approach b) in Figure 2: after some basic revision of CLC90, CLC-Changes are first delineated on IMAGE2000. This means that revision and correction of CLC90 can be accom-plished in parallel, not necessarily in sequential order. This method is implemented in the Inter-Change software, developed by FÖMI (4) and offered free for any interested CLC2000 national teams. The CLC2000 database is computed accordingly:
CLC2000 = CLC1990 ( + ) CLC-Changes
Symbol (+) in the formula means: CLC90 and CLC-Changes are intersected; in polygons of the CLC-Changes codeold is replaced by codenew; then neighbours with the same code are unified. Benefits of approach b) are: focuses on directly producing CLC-Changes, requires the full the-matic improvement of CLC90, modification of CLC90 is possible at any time and checking of pa-rameters of change polygon is easy. Weaknesses of approach b) are: changes composed of more than a single part are interpreted in parts and after derivation of CLC2000 additional editing is needed (for polygons shrunk below 25 ha). CLC2000 will include max. 5 ha inaccuracies (because changes below 5 ha are not considered). According to approach c) in Figure 2, first the CLC2000 database is interpreted (e.g. because of no CLC90 is available (like in Croatia), or due to the existence of a recent higher resolution CLC compatible database, which is generalised to yield CLC2000 (e.g. Luxembourg, Hungary)). CLC-Changes are then interpreted using CLC2000 and IMAGE90 data. This means a reverse process compared to approach b). The revised CLC90 database will be computed. Although approach b) and c) are similar concerning benefits and weaknesses, an important difference is, that in ap-proach c) both primary deliverables (CLC2000 and CLC-change) are produced directly under hu-man control.
Consequences of the two different MMUs The MMU in CLC90 and CLC2000 is 25 ha. The similar parameter for CLC-Changes is 5 ha. Un-derstandably, decision makers are interested in changes smaller than the 25 ha limit of CLC. However, the change mapping instruction saying: "a change inside a polygon of an area between 5 and 25 ha will not be recorded as change" (3) will result in a biased change database in the size range of 5-25 ha. Changes between 5 and 25 ha will be mapped only if they are increments or decrements of an existing polygon (8). Isolated changes will be mapped only if larger than 25 ha. E.g. a new industry of 20 ha will be mapped as a change if it is an increment of an existing indus-try polygon in CLC90, but will not be mapped as a change if it is built isolated inside an arable land polygon. The severity of this bias depends on the typical size and distribution of changes in the country. Another consequence is that the "trivial" relation between the three databases (see above) is not entirely fulfilled considering the final databases. The reasons are as follows:
• In countries applying approach a), the result of intersecting the revised CLC90 and CLC2000 databases have to be considered a "difference" database. The "difference" data-base has to be checked and non-real changes should be deleted from the CLC-Changes database based on photo-interpretation and logics (by considering what changes are not possible in a country or region).
• In countries applying approach b) the result of adding together CLC-Changes and revised CLC90 is to be considered a "raw" CLC2000 database. The "raw" CLC2000 database has to be checked and polygons smaller than 25 ha have to be "intelligently" generalised to yield a final CLC2000.
• The same situation exists when applying approach c), when the backdated CLC90 needs generalisation.

EARSeL eProceedings 3, 3/2004 337
Realisation by countries The Technical Guidelines (3) describe a photointerpretation approach (more specifically approach a) in Figure 2). Other solutions were also allowed if discussed and agreed on with the CLC2000 Technical Team. Three countries of the 29 participants (Finland, Sweden and UK) apply a digital image processing (DIP) based technology. It starts with an automated classification of the Landsat ETM imagery, which is further processed by various GIS procedures using several existing na-tional databases to yield a high resolution (2 ha, 5 ha) national LC database. The last and most critical step is to produce CLC2000 by means of generalisation. These methodologies are rather country specific (9, 10, 11). In Table 2 CAPI-A, -B and -C refers to the variant of a computer-assisted photointerpretation methodology shown in Figure 2.
Table 2: Approaches and tools used to realise CLC2000
Country Approach Base sw Application sw Remark Austria and
Liechtenstein CAPI-B ArcView InterChange
Belgium CAPI-B Arc Map Bulgaria CAPI-B ArcView InterChange Croatia CAPI-C ArcView InterChange Cyprus CAPI na na only CLC2000 is produced
Czech Republic CAPI-A Topol (self development)
Denmark CAPI-B ArcView Self-customized
Estonia CAPI-B ArcView InterChange
Finland DIP/GIS na na only CLC2000 is produced France CAPI-A ArcView Self-customized
Germany CAPI ERDAS ArcView
IMAGINE Self-customized
Greece CAPI-B CAPI-B
Intergraph ArcView
Geomedia InterChange
Hungary CAPI-C ArcView InterChange Ireland CAPI-B ArcView InterChange
Italy CAPI-A ArcView Latvia CAPI-A ArcGIS Self-customised
Lithuania CAPI-B ArcView InterChange Luxembourg CAPI-C ArcInfo ArcEdit
Malta CAPI na na only CLC2000 is produced Netherlands CAPI-B ArcInfo ArcEdit
Poland CAPI-B ArcView InterChange Portugal CAPI-B ArcView InterChange Romania CAPI-B ArcView InterChange
Slovak Republic CAPI-A ArcView Slovenia CAPI-B ArcView InterChange
Spain CAPI-A ArcGIS Sweden DIP/GIS na na only CLC2000 is produced
UK DIP/GIS na na
EARSeL eProceedings 3, 3/2004 338
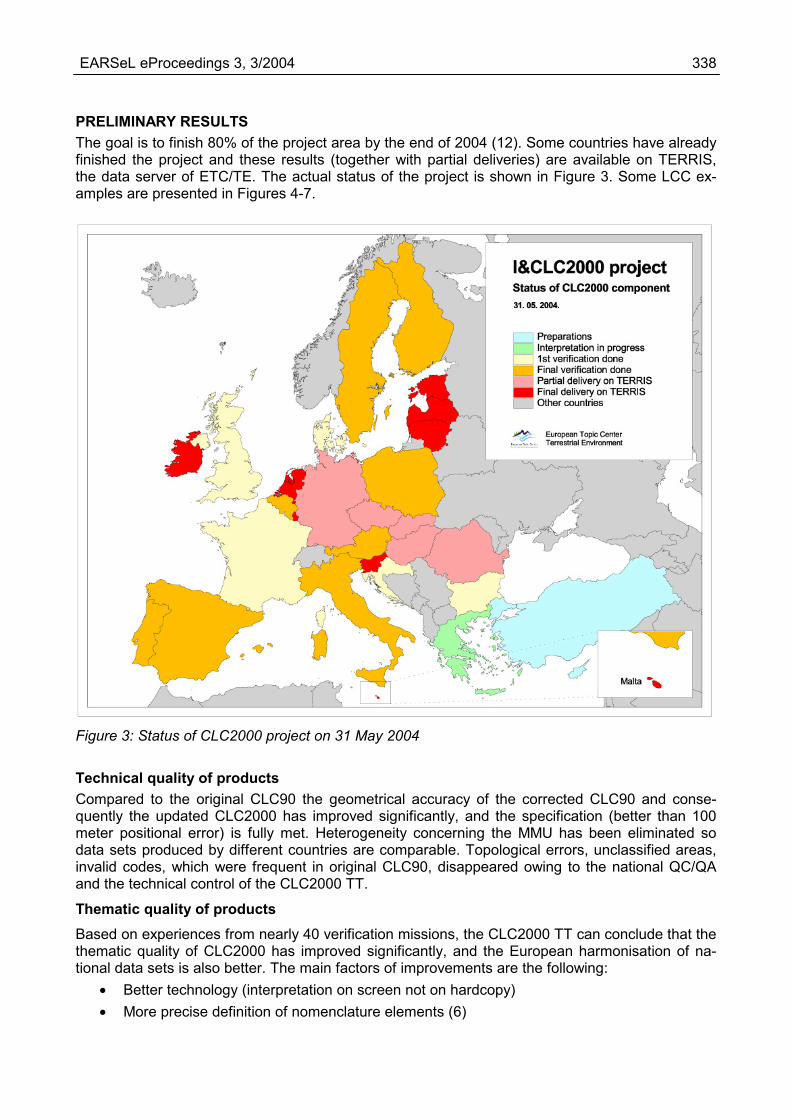
PRELIMINARY RESULTS The goal is to finish 80% of the project area by the end of 2004 (12). Some countries have already finished the project and these results (together with partial deliveries) are available on TERRIS, the data server of ETC/TE. The actual status of the project is shown in Figure 3. Some LCC ex-amples are presented in Figures 4-7.
Figure 3: Status of CLC2000 project on 31 May 2004
Technical quality of products Compared to the original CLC90 the geometrical accuracy of the corrected CLC90 and conse-quently the updated CLC2000 has improved significantly, and the specification (better than 100 meter positional error) is fully met. Heterogeneity concerning the MMU has been eliminated so data sets produced by different countries are comparable. Topological errors, unclassified areas, invalid codes, which were frequent in original CLC90, disappeared owing to the national QC/QA and the technical control of the CLC2000 TT.
Thematic quality of products Based on experiences from nearly 40 verification missions, the CLC2000 TT can conclude that the thematic quality of CLC2000 has improved significantly, and the European harmonisation of na-tional data sets is also better. The main factors of improvements are the following:
• Better technology (interpretation on screen not on hardcopy) • More precise definition of nomenclature elements (6)
EARSeL eProceedings 3, 3/2004 339
• Easier and frequent use of ancillary data (digitized topographic maps, orthophotos, other thematic data)
• Properly organised support by the CLC2000 TT. CLC90 data have not been improved in the same way in all countries because of the lack of ap-propriate ancillary data or the reluctance of interpreters to change a code given by the former in-terpreter during the first inventory. Intersection of a good quality CLC2000 and a CLC90 with the-matic errors yielded many false changes in some countries. Comparing IMAGE90 and IMAGE2000 and logic could help to solve these problems and keep only real changes. The most remarkable thematic improvements are:
• Interpretation of ‘discontinuous urban fabric’ (112) has improved; several rural settlements omitted in CLC90 were interpreted (due to the better image quality and a change in gener-alisation rules). However, the class ‘continuous urban fabric’ (111) is still often overesti-mated.
• All green areas (not only formal parks but forests also) inside urban fabric have been inter-preted as 141.
• Separation of class 211 (annual crops or fallow land) from the class 231 (pastures) is diffi-cult, because their spectral characteristics are often very similar. There are evident im-provements in this field as well because of the use of aerial photographs and/or multitem-poral satellite imagery.
• There were many discussions on distinguishing ‘pastures’ (231) from ‘natural grassland’ (321). This issue has also improved, by understanding that grass communities free from (or under very limited) human impact are classified under ‘natural grassland’. If they are under human impact, which mostly supports the increased biomass production (e.g. fertilis-ing, mowing, etc.), grass communities are classified as ‘pastures’ under class 231. Areas of class 321 mostly occur in high mountains, on steep slopes with difficult access, in territo-ries under nature conservation, or in military areas.
• Identification of natural vegetation in heterogeneous agricultural areas has also improved. Presence of small enclaves (< 25 ha) of trees and shrub vegetation, swamps, etc. is typical of the class 243. It has been applied in areas that were previously interpreted as homoge-neous class (e.g. arable land) in CLC90.
• Separation of bushy vegetation – ‘moors and heathlands’ (322) in Atlantic and Alpine ar-eas, and ‘sclerophyllous vegetation’ (323) in Mediterranean areas from ‘transitional wood-land/shrubs’ (324) has improved also by using maps of natural vegetation and by better understanding of the meaning of these classes. However, there are still some problems in transitory areas (e.g. Iberian Peninsula), where all shrub types occur together.
• There is a definite improvement and harmonised understanding of the class ‘transitional woodland/shrub’ (324). All clear-cut areas and young plantations are classified here (it was not the case in CLC90 in all countries) together with woodland degradation, forest dam-ages of any causes, and natural recolonisation.
• There has been an improvement in interpreting processes with a short life time or periodic-ity (hours, days, seasonal), such as tidal effects, seasonal changes in water surface of riv-ers, fish ponds, reservoirs or karstic lakes, flood events, seasonal changes of natural vege-tation, etc. These are not land cover changes in terms of CLC and were not to be consid-ered in mapping changes.
Comparison of change databases CLC-changes are compared and analysed for seven countries that have already finished the pro-ject (databases on TERRIS): Estonia, Ireland, Latvia, Lithuania, Luxembourg, Netherlands, and Slovenia. Table 3 shows that there is a very large difference between these countries concerning CLC-change magnitude: most dynamic countries are Ireland and Latvia, while the most stable ones are Luxembourg and Slovenia.

EARSeL eProceedings 3, 3/2004 340
Table 3: Comparison of CLC-Changes in seven countries
Country Area (km2)
Time span (year)
Total changes (km2)
Relative change (%)
Yearly relative change (%)
Ireland 70283 10 5645 8,03 0,80 Latvia 63700 5 2552 4,01 0,80
Lithuania 65200 5 1656 2,54 0,51 Estonia 45226 6 1214 2,68 0,45
Netherlands 35398 14 1716 4,16 0,35 Luxembourg 2590 11 41 1,60 0,15
Slovenia 20273 5 24 0,12 0,02
By analysing the CLC-change matrix, one can get an insight into the dominant processes in each country. The following analysis considered those changes that together provided at least 75% of the total area of changes in a country. Dominant changes in each country are listed below in de-scending importance. Ireland (13):
• Changing ‘pasture’ (231) to ‘arable land’ (211) and ‘arable land’ to ‘pasture’, as a traditional practice in Ireland with a net increase of arable land
• ‘Peat bogs’ are afforested (412-324) • ‘Coniferous forests’ are clear-felled (312-324) • ‘Coniferous plantations’ mature (324-312)
Latvia (14): • Felling of ‘mixed forest’ (313-324) • Changing ‘pasture’ (231) to ‘arable land’ (211) and ‘arable land’ to ‘pasture’, almost bal-
anced. Lithuania (15):
• Intensification in agriculture (231-211) • Felling of forests (31x-324) • Diversification of agriculture (211-242)
Estonia (16): • Changing ‘pasture’ (231) to ‘arable land’ (211) and ‘arable land to pasture’, with a net in-
crease of arable land • Felling of forests (31x-324) • Diversification of agriculture (231-242)
The Netherlands (17): Dominant changes include several processes: • Urbanisation (urban growth, new sport and leisure areas) on former agricultural land • Internal changes in agriculture (e.g. new greenhouse areas) • Industrialisation (loss of agricultural land) • Agricultural areas converted to seminatural areas (211-311, 211-321) • New ‘wetlands’ on former ‘pasture’ (231-411) • New ‘water bodies’ on former ‘pasture’ (231-512)
Luxembourg: • Forest degradation by storm damage (31x-324) (18) • Urbanisation, loss of agricultural land (2xx-112) • Converting ‘pastures’ (231) to ‘arable land’ (211)

EARSeL eProceedings 3, 3/2004 341
Slovenia: • Forest degradation, clear-cut (311-324) • Forest regeneration after fire (334-324) • Highway construction (133-122, 311-122) • Conversion of natural areas into agriculture (311-243, 411-231) • A lake has changed into wetland (512-411)
If we compare processes described above we can conclude: • Internal changes in "Forests and seminatural" classes are important in all countries, except
the Netherlands. • Internal changes in "Agriculture" classes are important in all countries, except Slovenia. • "Artificial surfaces" classes increase most significantly in the Netherlands and Luxembourg
(urban expansion, industrialisation) and in Slovenia (highway construction). • Felling of forests is significant in all three Baltic countries (driving force is the commerce). • In Estonia and Lithuania agriculture has become more intensive (an evidence of improving
economy). • In Ireland afforestation of peat bogs is an exceptionally important process. It has the pur-
pose of increasing the low percent of forests in the country. • The Netherlands is the only country where conversion of a "Agricultural areas" into "Forest
and seminatural areas", "Wetlands" and "Water bodies" is significant.
CONCLUSIONS In the frames of the I&CLC2000 project managed jointly by EEA and JRC, a harmonised Land Cover database is produced in 29 countries, covering an area of 4,5 million km2. CLC2000 is based on IMAGE2000 data, a high precision (<25 m RMSE) orthocorrected Landsat-7 ETM im-agery. In most of the participating countries CLC2000 is an update of a former CLC90 database. As a by-product, national CLC90 databases, which had been derived with a simpler technology, were significantly improved concerning geometry as well as thematic content. The spatial resolu-tion of CLC90 and CLC2000 is 25 ha. The CLC-change database has also been derived with 5 ha resolution. The CLC-change database indicates dominant land cover change processes in the participating countries, as shown by the examples under 4.3. As described under 3.5, the consequence of two different MMUs and the proposed methodology (3) is, that not all changes between 5 and 25 ha will be mapped. To de-lineate all changes exceeding 5 ha would require more efforts. The dissemination and use of the I&CLC2000 products is defined in an agreement between the EEA, the European Commission, and the participating countries. Several applications are foreseen within the European Commission Services, such as DG-Regional Policy, DG-Environment and DG-Agriculture, as well as in EEA and its European Topic Centres (ETCs). The 2004 work plan of the ETC/TE includes European-wide computation of agri-environmental indicators (IRENA pro-ject), assessment of fragmentation by urban and transport infrastructures, mapping urban sprawl, mapping forests within 1, 25, and 50 km from major urban agglomerations, and coastal zone as-sessment (12).
ACKNOWLEDGEMENTS The CLC2000 project is part of the work programme of the European Topic Centre on Terrestrial Environment (ETC-TE) working under contract with the European Environment Agency between 2001-2004. The authors express their gratitude to Chris Steenmans EEA project manager, Adri-ana Gheorge EEA-EIONET coordinator and Stefan Kleeschulte ETC-TE manager for continuous cooperation and support. Thanks also to Vanda Lima (JRC) for managing the IMAGE2000 com-ponent of the project. Susan Christensen (JRC) has contributed to the activities of the CLC2000 Technical Team until January 2003. Linguistic corrections were provided by Barbara Kosztra.

EARSeL eProceedings 3, 3/2004 342
Figure 4: Land Cover change: industrialisation, loss of agricultural land - Dublin area (left: 1990, right: 2000)
Figure 5: Land Cover change: arable land to forest, Netherlands (left: 1986, right: 2000)
EARSeL eProceedings 3, 3/2004 343
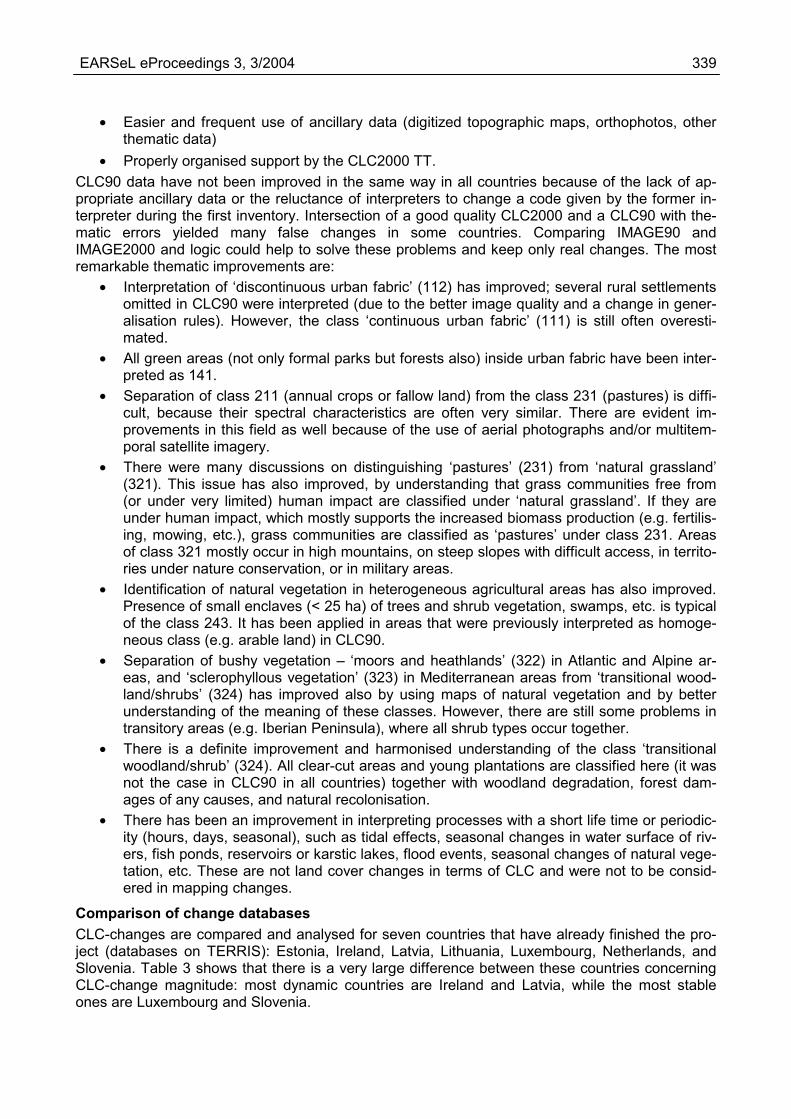
Figure 6: Land Cover change: forest clear-cutting, Slovak Republic (left: 1990, right: 2000)
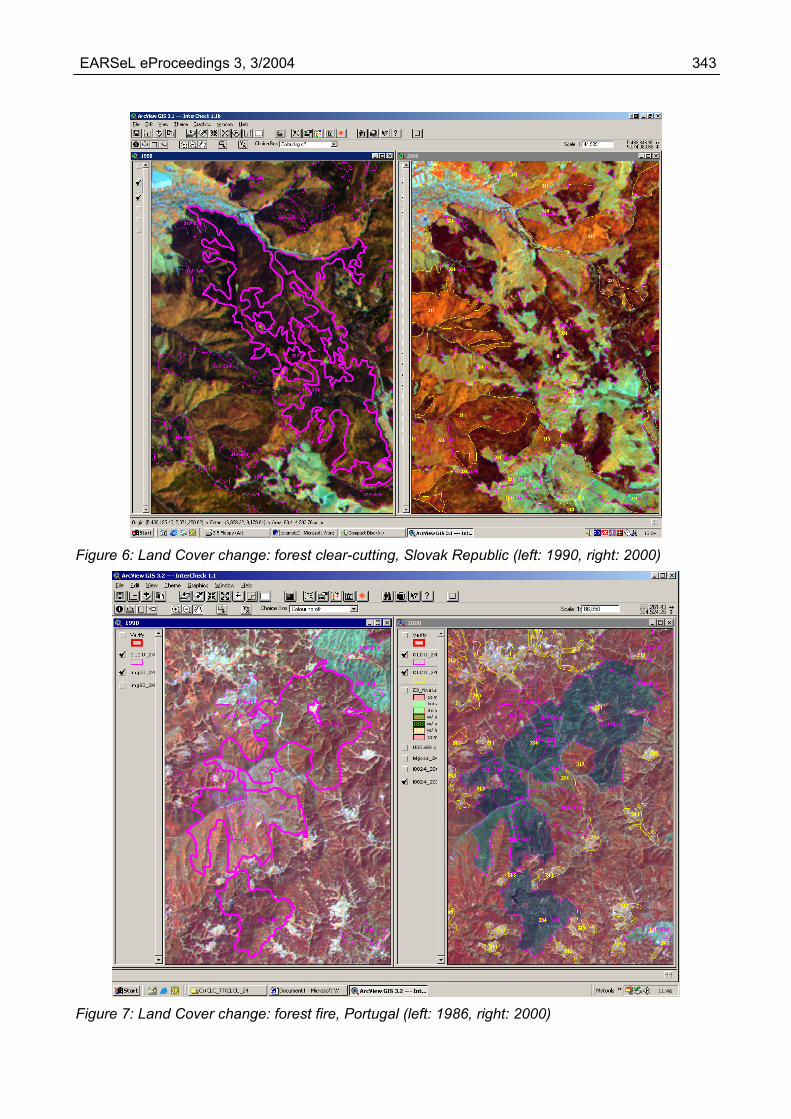
Figure 7: Land Cover change: forest fire, Portugal (left: 1986, right: 2000)

EARSeL eProceedings 3, 3/2004 344
APPENDIX 1: CORINE Land Cover nomenclature (1) LEVEL 1 LEVEL 2 LEVEL 3
1. ARTIFICIAL SURFACES
1.1. Urban fabric 1.2. Industrial, commercial
and transport units 1.3. Mine, dump and
construction sites 1.4. Artificial, non-agricul-
tural vegetated areas
1.1.1. Continuous urban fabric 1.1.2. Discontinuous urban fabric 1.2.1. Industrial or commercial units 1.2.2. Road and rail networks and associated land 1.2.3. Port areas 1.2.4. Airports 1.3.1. Mineral extraction sites 1.3.2. Dump sites 1.3.3. Construction sites 1.4.1. Green urban areas 1.4.2. Port and leisure facilities
2. AGRICULTURAL AREAS
2.1. Arable land 2.2. Permanent crops 2.3. Pastures 2.4. Heterogeneous agricul-
tural areas
2.1.1. Non-irrigated arable land 2.1.2. Permanently irrigated land 2.1.3. Rice fields 2.2.1. Vineyards 2.2.2. Fruit trees and berry plantations 2.2.3. Olive groves 2.3.1. Pastures 2.4.1. Annual crops associated with permanent crops 2.4.2. Complex cultivation patterns 2.4.3. Land principally occupied by agriculture, with
significant areas of natural vegetation 2.4.4. Agro-forestry areas
3. FOREST AND SEMI-NATURAL AREAS
3.1. Forests 3.2. Scrub and/or herba-
ceous associations 3.3. Open spaces with little
or no vegetation
3.1.1. Broad-leaved forest 3.1.2. Coniferous forest 3.1.3. Mixed forest 3.2.1. Natural grassland 3.2.2. Moors and heathland 3.2.3. Sclerophyllous vegetation 3.2.4. Transitional woodland-scrub 3.3.1. Beaches, dunes, sands 3.3.2. Bare rocks 3.3.3. Sparsely vegetated areas 3.3.4. Burnt areas 3.3.5. Glaciers and perpetual snow
4. WETLANDS 4.1. Inland wetlands 4.2. Marine wetlands
4.1.1. Inland marshes 4.1.2. Peat bogs 4.2.1. Salt marshes 4.2.2. Salines 4.2.3. Intertidal flats
5. WATER BODIES 5.1. Inland waters 5.2. Marine waters
5.1.1. Water courses 5.1.2. Water bodies 5.2.1. Coastal lagoons 5.2.2. Estuaries 5.2.3. Sea and ocean

EARSeL eProceedings 3, 3/2004 345
APPENDIX 2: Participants of the CLC2000 project
Country National Authority Implementing organisation(s) Austria Federal Environment Agency (UBA) Federal Environment Agency (UBA)
Belgium Institut Géographique National (IGN) Institut Géographique National (IGN)
Bulgaria Environmental Executive Agency within the Ministry of Environment and Water Space Research Institute and DATECS
Croatia Ministry of Environment Protection and Physical Planning OIKON and GISDATA
Czech Republic Czech Environmental Institute Help Service Ltd
Cyprus Ministry of Agriculture, Natural Resources and Environment (MANRE)
Ministry of Agriculture, Natural Resources and Environment (MANRE)
Denmark National Environmental Research Institute (NERI)
National Environmental Research Institute (NERI)
Estonia Estonian Environment Information Centre (EEIC) Estonian Mapping Centre
Finland Ministry of Environment Finnish Environment Institute (SYKE) France French Environmental Institute (IFEN) GEOSYS, SCOT and SIRS
Germany Federal Environmental Agency (UBA) DLR – based on contract with private companies
Greece Hellenic Mapping and Cadastral Organisation (HEMCO)
Eratosthenes S.A. and Geoapikonosis Ltd.
Hungary Ministry of Environment and Water Institute of Geodesy, Cartography and Remote Sensing (FÖMI)
Ireland Environmental Protection Agency (EPA) ERA MAPTEC Italy Environmental Protection Agency (APAT) Univerity of Roma ‘La Sapienza’
Latvia Latvian Environment Agency (LEA) Envirotech
Liechtenstein Ministry of Environment Federal Environment Agency (UBA, Austria)
Lithuania Ministry of Environment University of Vilnius
Luxembourg Ministère de l'Environnement Geographic Information Management sa (G.I.M.)
Malta Malta Environment and Planning Authority (MEPA)
Malta Environment and Planning Au-thority (MEPA)
Poland Head Inspectorate for Environmental Protection Institute of Geodesy and Cartography (IGIK)
Portugal Portuguese Environmental Institute (IA) Instituto Superior de Estatística e
Gestão da Informação (ISEGI) and Instituto Geográfico Portugués (IGP)
Romania Ministry of Water and Environmental Protection Danube Delta National Institute (DDNI) Slovak Republic Slovak Environmental Agency (SEA) Slovak Environmental Agency (SEA)
Slovenia Ministry of the Environment and Spatial Plan-ning, Geoinformation Centre GISDATA
Spain National Centre for Geographic Information (CNIG) – National Geographic Institute (IGN)
National Geographic Institute (IGN) with regional teams
Sweden National Land Survey of Sweden (Lantmäteriet) METRIA The Netherlands Alterra Centre for Geo-Information Alterra Centre for Geo-Information
United Kingdom Centre for Ecology and Hydrology (CEH) Centre for Ecology and Hydrology (CEH)

EARSeL eProceedings 3, 3/2004 346
REFERENCES 1 Heymann Y, Ch Steenmans, G Croissille & M Bossard, 1994. CORINE Land Cover. Technical
Guide. EUR12585, Office for Official Publications of the European Communities (Luxem-bourg)
2 Büttner G, et al., 1998. The European CORINE Land Cover Database, ISPRS Commission VII Symposium, Budapest, September 1-4, 1998. Proceedings, 633-638
3 EEA-ETC/TE, 2002. CORINE Land Cover update. I&CLC2000 project, Technical Guidelines, http://terrestrial.eionet.eu.int
4 Büttner G, G Maucha & G Taracsák, 2003. Inter-Change: A software support for interpreting land cover changes. In: Geoinformation for European-wide Integration, edited by T Benes. Proceedings of the 22nd EARSeL Symposium, Prague, 4-6 June 2002 (Millpress, Rotterdam) 93-98
5 ETC/TE, 2003: Guidelines for CLC2000 deliveries, http://terrestrial.eionet.eu.int 6 Bossard M, J Feranec J & J Otahel J, 2000. CORINE Land Cover Technical Guide – Adden-
dum 2000. Technical report No 40. Copenhagen (EEA). http://terrestrial.eionet.eu.int 7 Perdigão V & A Annoni, 1997. Technical and methodological guide for updating CORINE
Land Cover Database. JRC/EEA 8 Maucha G, G Taracsák & G Büttner, 2003. Methodological questions of CORINE Land Cover
change mapping. Second International Workshop on the Analysis of Multi-temporal Remote Sensing Images: MultiTemp-2003 Workshop, 16-18 July 2003, Joint Research Centre (Ispra, Italy)
9 Finnish Environment Institute, 2003. CORINE Land Cover 2000 and Image 2000 in Finland, Interim Report (Helsinki, Finland)
10 Swedish Space Corporation, 1994. CORINE landtackning – ett pilotprojekt i Sverige (in Swed-ish, with English summary)
11 Smith G M, N J Brown, N J & A G Thomson, 2002. CORINE Land Cover 2000: semiauto-mated updating of CORINE Land Cover in UK. Phase I: Interim Report, Centre for Ecology and Hydrology (Monks Wood, UK)
12 Kleeschulte S, 2004. ETC/TE, 2004: Implementation Plan. ETC/TE, Universitat Antonoma de Barcelona
13 EPA, 2003. CORINE Land Cover 2000 update (Ireland), Final Report, Environment Protection Agency (Ireland)
14 Baranovs H, 2003. National CORINE Land Cover 2000 in Latvia - project I&CLC2000, Final Report, Latvian Environment Agency (Latvia)
15 Vaitkus G, 2003. CORINE Land Cover 2000 in Lithuania - project I&CLC200-LT, Final Report, Institute of Ecology, Vilnius University (Lithuania)
16 EEIC, 2003. CORINE Land Cover 2000 in Estonia - project I&CLC200-EE, Estonian Environ-ment Information Centre, Tallinn (Estonia)
17 Hazeau G W, 2003. CLC2000. Land Cover database of the Netherlands, Alterra Rapport (Wageningen) 775 ISSN 1566-7197
18 Kleeschulte S, 2004. Personal communication